Embed Size (px)
Citation preview

3M 2020 RESULTSPeriodical Financial Information
2
Slides used during analyst call 2
Segment information 15
Equity / Solvency 50
Investment portfolio 62
Legal Settlement 67
General Information 70
Content
Periodical financial information I 3M 20 results I 13 May 2020

Main messagesResilient operational performance in Covid-19 era
Ageas
3Periodical financial information I 3M 20 results I 13 May 2020
First quarter Group net result strongly supported by exceptional non-cash one-off
Overall solid underlying operational performance mitigating lower investment result
due to Covid-19 pandemic
Strong solvency and cash position
Finalization of Fresh Tender offer
Additional tranche acquired early April
Intention to pay full announced dividend with adjusted distribution after guidance
by Insurance regulator
Impact on economy and financial markets likely to continue to affect Ageas’s
performance and results. As a consequence, Ageas cannot confirm its profit
guidance for 2020.
Capital management
Covid-19
Results
Dividend
Sovereign bonds47%
Corporate bonds24%
Loans14%Equities
5%
Real Estate
7%Cash3%
Investment portfolio
4Periodical financial information I 3M 20 results I 13 May 2020
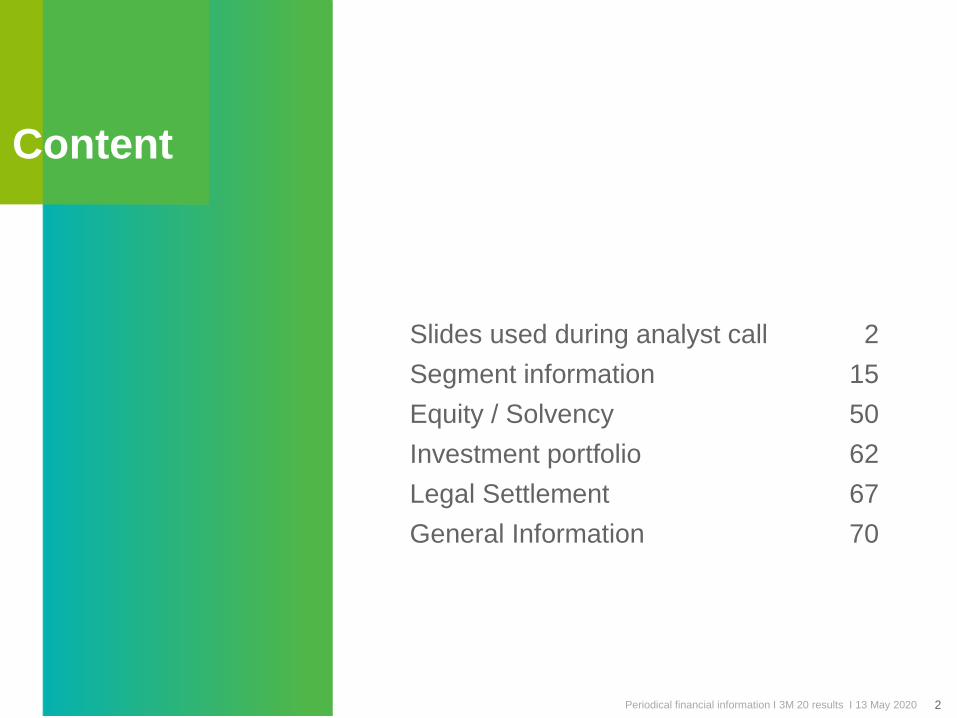
Limited investments in corporate bonds
* All assets at fair value except the ‘Held to Maturity’ assets & loans which are valued at amortized costs ; consolidated @100%
Limited exposure to Oil & Gas (86% rated A
or higher), Airlines (all BBB) & Transportation
(77% rated A or higher)
In EUR bn
BBB exposure only 9% of total investment
portfolio / only 1% BBB-
Impact Solvency IIageas of all Corporate bonds
1 notch down <5pp
Banking14%
Other financials
12%
Oil & Gas3%
Transportation4%
Airlines1%
Non Financials51%
Government related15%
AAA12%
AA
16%
A25%
BBB+16%
BBB16%
BBB-
5%
BB or lower1%
Not rated
9%

In EUR mio In EUR bnIn EUR bn
Ageas
5Periodical financial information I 3M 20 results I 13 May 2020
Group net result up on Fresh cap gain – Resilientunderlying insurance performance
Headlines
In bps avg technical liabilitiesIn bps avg technical liabilities
* incl. non-consolidated partnerships @ 100%
In % NEP
Net result: Lower cap gains, weather & Fresh tender
Combined ratio impacted by bad weather in both periods (8pp in ‘20 vs. 6pp in ‘19)
Inflows*: Lower Life – continued growth in Non-Life
Life Technical liabilities* increasing in non-conso
Guaranteed Margin: lower investment result
Operating margin Unit-Linked: Up in Belgium & Portugal – Down in France
(7)
339
223
89
35
24
251
452
3M 19 3M 20
GA Life Non-Life
11.110.0
1.71.9
12.812.0
3M 19 3M 20
Life Non-Life
98.3 99.7
3M 19 3M 20
88
56
3M 19 3M 20
1828
3M 19 3M 20
73.6 72.1
3.9 3.4
82.2 87.5
159.6 163.0
FY 19 3M 20
conso shadow non-conso

In bps avg technical liabilities In bps avg technical liabilitiesIn % NEP
Belgium
6
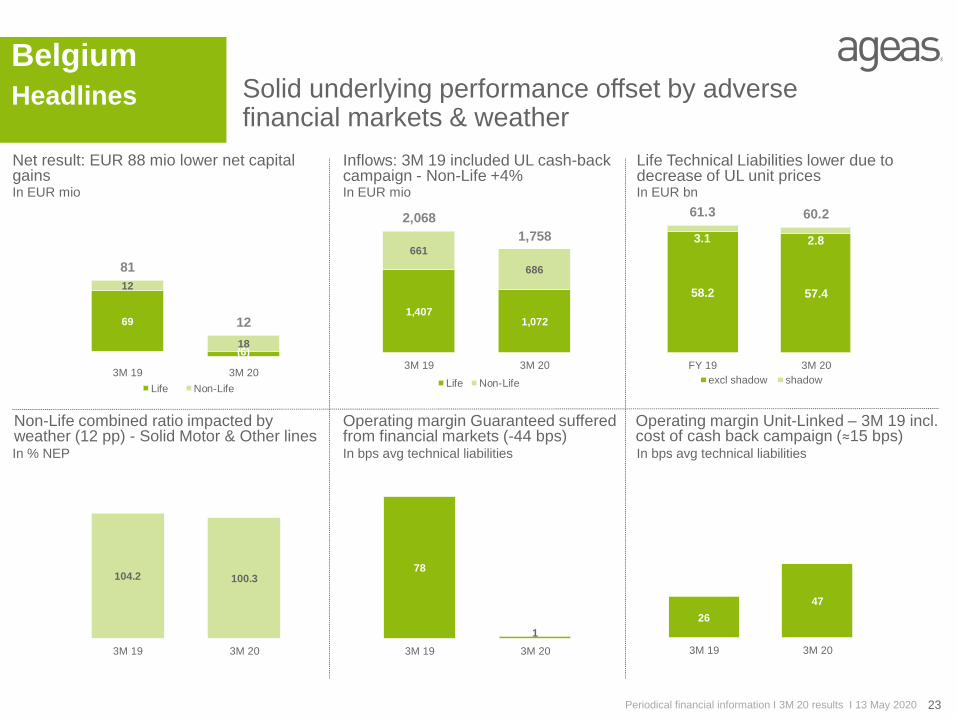
Solid underlying performance offset by adverse financial markets & weather
Headlines
In EUR mio In EUR mio In EUR bn
69
(6)
12
18
81
12
3M 19 3M 20
Life Non-Life
1,4071,072
661
686
2,068
1,758
3M 19 3M 20
Life Non-Life
58.2 57.4
3.1 2.8
61.3 60.2
FY 19 3M 20
excl shadow shadow
104.2 100.3
3M 19 3M 20
78
1
3M 19 3M 20
26
47
3M 19 3M 20
Net result: EUR 88 mio lower net capital gains
Inflows: 3M 19 included UL cash-back campaign - Non-Life +4%
Life Technical Liabilities lower due to decrease of UL unit prices
Non-Life combined ratio impacted by weather (12 pp) - Solid Motor & Other lines
Operating margin Guaranteed suffered from financial markets (-44 bps)
Operating margin Unit-Linked – 3M 19 incl. cost of cash back campaign (≈15 bps)
Periodical financial information I 3M 20 results I 13 May 2020
In EUR mio
UK
7
Weather events heavily impacting net resultHeadlines
In % of NEP
In EUR mio
* incl. non-consolidated partnerships @ 100%
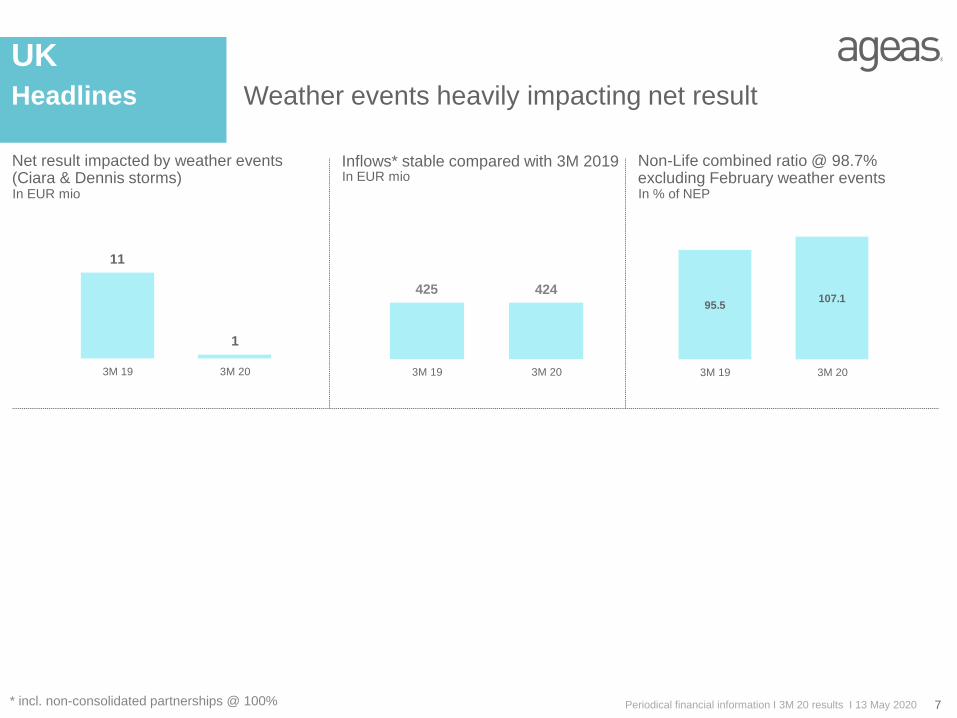
Net result impacted by weather events (Ciara & Dennis storms)
Inflows* stable compared with 3M 2019 Non-Life combined ratio @ 98.7% excluding February weather events
11
1
3M 19 3M 20
425 424
3M 19 3M 20
95.5107.1
3M 19 3M 20
Periodical financial information I 3M 20 results I 13 May 2020
CEU
8
Headlines
In EUR mio In EUR mio In EUR bn
In bps avg technical liabilities In bps avg technical liabilities
In % NEP
12
26
19
2032
46
3M 19 3M 20
Life Non-Life
562374
372
399
934
773
3M 19 3M 20
Life Non-Life
15.4 14.7
0.80.5
16.2 15.3
FY 19 3M 20
excl shadow shadow
91.7 87.3
3M 19 3M 20
140
356
3M 19 3M 20
8
03M 19 3M 20
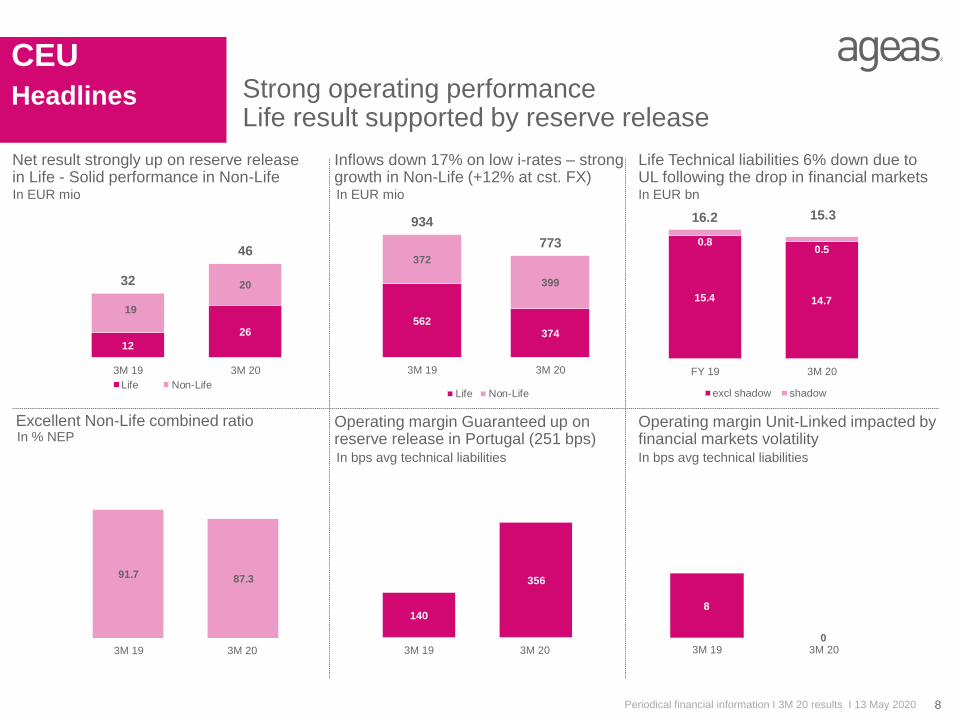
Strong operating performanceLife result supported by reserve release
Net result strongly up on reserve release in Life - Solid performance in Non-Life
Inflows down 17% on low i-rates – strong growth in Non-Life (+12% at cst. FX)
Life Technical liabilities 6% down due to UL following the drop in financial markets
Operating margin Guaranteed up on reserve release in Portugal (251 bps)
Operating margin Unit-Linked impacted by financial markets volatility
Periodical financial information I 3M 20 results I 13 May 2020
Excellent Non-Life combined ratio

8,515 7,873
575711
9,090 8,584
3M 19 3M 20
regular single
9,090 8,583
292424
9,382 9,007
3M 19 3M 20
Life Non-Life
In EUR mio In EUR mio In EUR bn
Asia
9
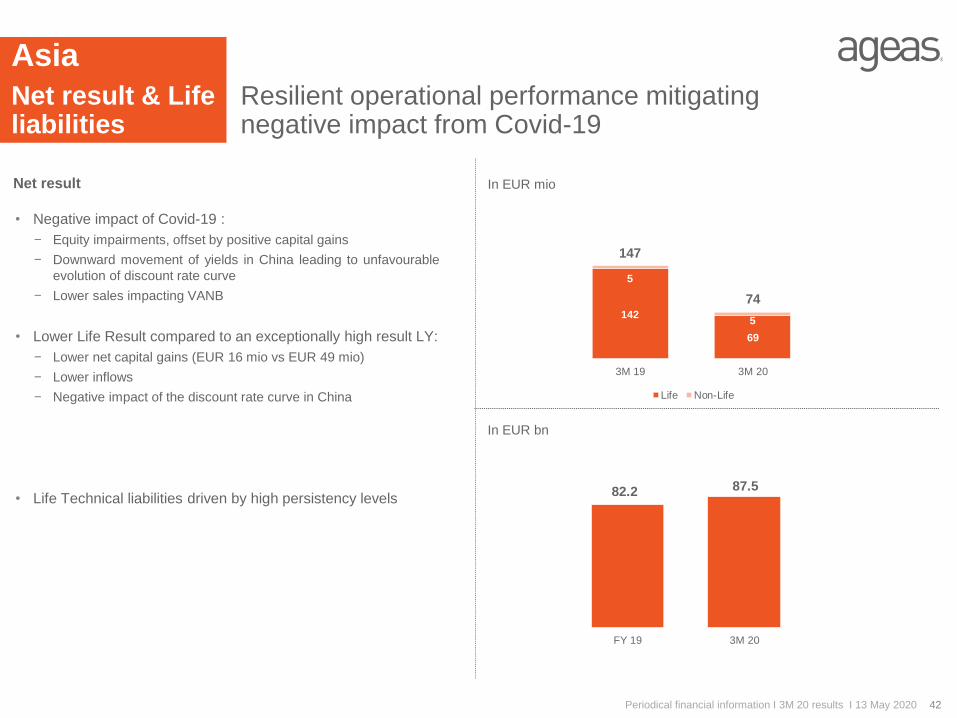
Resilient operational performance mitigating negative impact from Covid-19
Headlines
In % NEP
* incl. non-consolidated partnerships @ 100%
Higher Non-Life combined ratio following the acquisition in India (only partly integrated in Q1 2019)
Inflows* -4% @ constant FX due to Covid-19, cushioned by renewals
Life Technical liabilities up 7% fromrenewals
In EUR mio
Regular premium: remaining above 90% of Life inflows
142
69
5
5
147
74
3M 19 3M 20
Life Non-Life
94.2% 95.7%
3M 19 3M 20
82.2 87.5
FY 19 3M 20
Resilient net result compared to an exceptionally high result LY
Periodical financial information I 3M 20 results I 13 May 2020
Additional information on Ageas
non-consolidated partnerships in
Asia is available on the excel
spreadsheet published on Ageas’
website under quarterly results
(www.ageas.com/investors/quarterly-results)
In EUR mio
Reinsurance
10
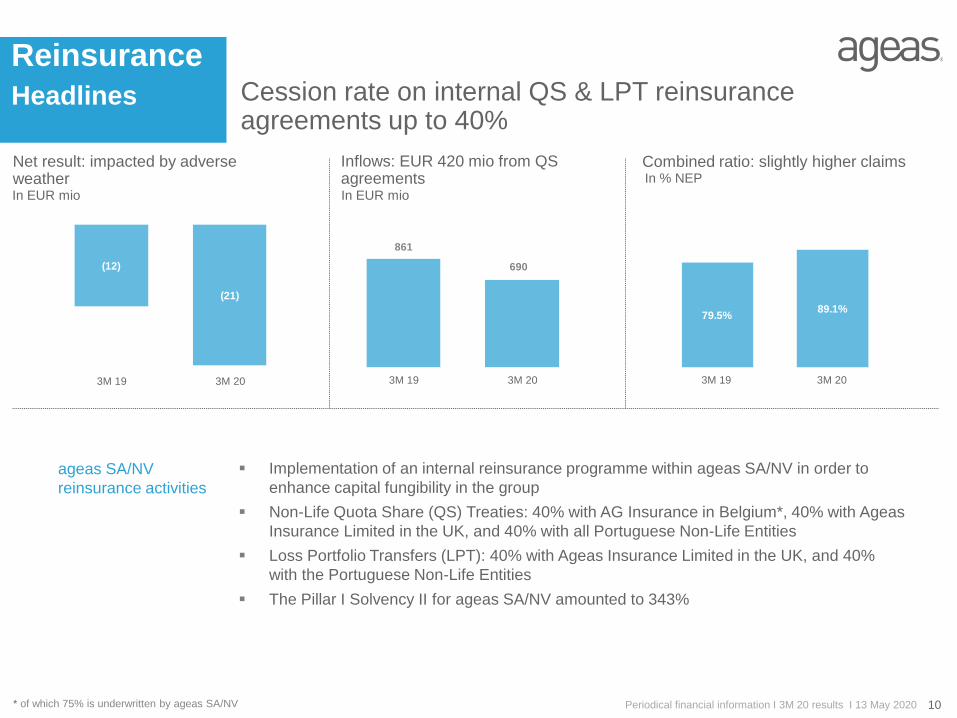
Cession rate on internal QS & LPT reinsurance agreements up to 40%
Headlines
In % NEP
In EUR mio
Net result: impacted by adverse weather
Inflows: EUR 420 mio from QSagreements
Combined ratio: slightly higher claims
Implementation of an internal reinsurance programme within ageas SA/NV in order to
enhance capital fungibility in the group
Non-Life Quota Share (QS) Treaties: 40% with AG Insurance in Belgium*, 40% with Ageas
Insurance Limited in the UK, and 40% with all Portuguese Non-Life Entities
Loss Portfolio Transfers (LPT): 40% with Ageas Insurance Limited in the UK, and 40%
with the Portuguese Non-Life Entities
The Pillar I Solvency II for ageas SA/NV amounted to 343%
ageas SA/NV
reinsurance activities
(12)
(21)
3M 19 3M 20
861
690
3M 19 3M 20
79.5%89.1%
3M 19 3M 20
Periodical financial information I 3M 20 results I 13 May 2020* of which 75% is underwritten by ageas SA/NV
Value legacies
GA
11Periodical financial information I 3M 20 results I 13 May 2020
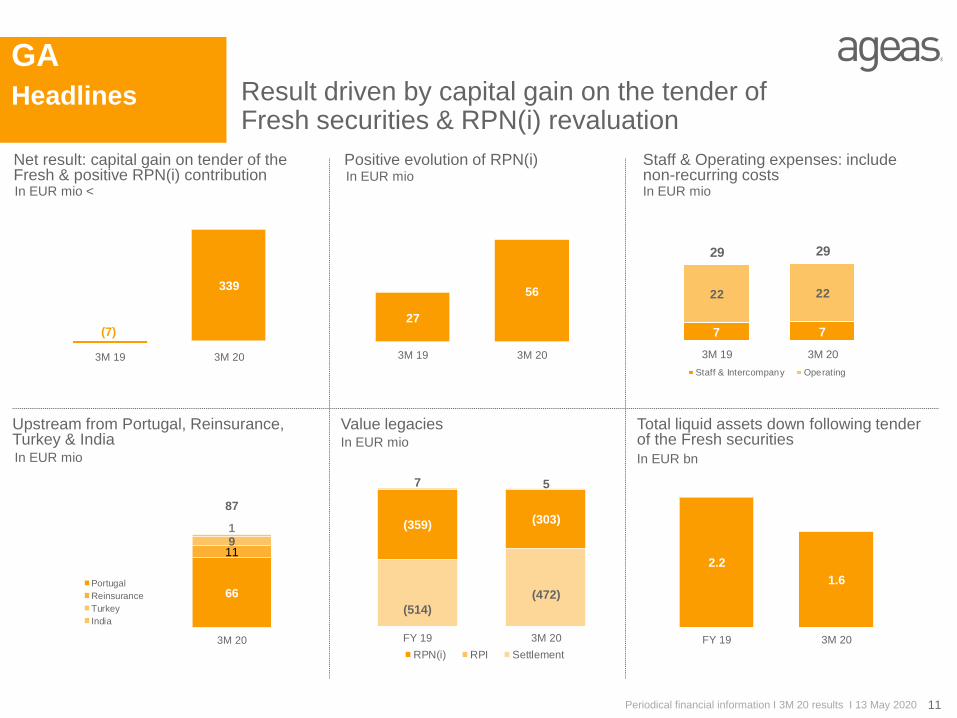
Result driven by capital gain on the tender of Fresh securities & RPN(i) revaluation
Headlines
Total liquid assets down following tender of the Fresh securities
Positive evolution of RPN(i) Staff & Operating expenses: include non-recurring costs
In EUR mio In EUR bn
In EUR mio
In EUR mio
Upstream from Portugal, Reinsurance, Turkey & India
(7)
339
3M 19 3M 20
(359) (303)
7 5
(514)
(472)
FY 19 3M 20
RPN(i) RPI Settlement
2.2
1.6
FY 19 3M 20
7 7
22 22
29 29
3M 19 3M 20
Staff & Intercompany Operating
27
56
3M 19 3M 20
Net result: capital gain on tender of the Fresh & positive RPN(i) contributionIn EUR mio <
In EUR mio
66
1191
87
3M 20
Portugal
Reinsurance
Turkey
India

Solvency
12Periodical financial information I 3M 20 results I 13 May 2020
Solvency still comfortably exceeding target level after Fresh transaction & market impact
Solvency IIageas
Solvency IIageas
in %
Own Funds
SCR
Non EU
Non-controlled
participations*
Belgium UK CEU Reinsurance GA eliminations Group
2.7 2.8 2.7
0.5 0.5 0.5 0.6 0.6 0.6
0.1 0.40.4 0.1 0.2
0.2 (0.3)(0.6) (0.6)
3.7 4.0 3.7
2.43.2 3.3
6.4 6.3
5.5
0.8 0.9 0.8 1.0 1.1 0.9
0.10.7 0.7
1.3 1.50.9
(1.7)(1.8)
(1.5)
8.08.6
7.3
5.8
7.7 7.7
FY18
FY19
3M20
FY18
FY19
3M20
FY18
FY19
3M20
FY18
FY19
3M20
FY18
FY19
3M20
FY18
FY19
3M20
FY18
FY19
3M20
FY18
FY19
3M20
235% 221% 205% 167% 179% 181% 178% 170% 160% 196% 173% 166% 215% 217% 196% 241% 243% 236%
* Based on local solvency requirements

Free CapitalGeneration
13Periodical financial information I 3M 20 results I 13 May 2020
Operational FCG affected by February storms
expected
dividend
Operational impact – includes EUR 10 mio dividend upstream Non-European NCP’s
Market: Covid-19 impact
Fresh tender: pre-compensated by EUR 750mio T1 in 2019
Capital transactions = SBB & injection in Asia
Based on 175% SCR
Solvency IIageas
Solvency IIageas
In EUR mio*
* FCG Non-European NCP’s over
FY 2019 at EUR 806 mio -
Operational FCG at EUR 369 mio
- outside of Solvency II scope
2,438
1,979
1,474
491
491
529
726 26
85
(459)
(517)
(72)
2,929
2,470
2,0041095
Tier 1instrument
FY 19 Fresh tender FY 19restated
Model changes Market impact Operationalimpact
Capitaltransactions
3M 20

14Periodical financial information I 3M 20 results I 13 May 2020
Conclusions
1. Insurance activities have proven resilient
2. Both capital & cash positions remain strong
3. Confident in the solid fundamentals of the Group
15Periodical financial information I 3M 20 results I 13 May 2020
Content
Slides used during analyst call 2
Segment information 15
Equity / Solvency 50
Investment portfolio 62
Legal Settlement 67
General Information 70

Net result
16Periodical financial information I 3M 20 results I 13 May 2020
Resilient operating performance offset by Covid-19 and weather
Belgium UK CEU Asia Reins. GA ageas
339
(7)
339
69
(6)12 26
142
69
223
89
12
1819
20
5
5
35
24
81
12 11 1
32 46
147
74
(12) (21)(7)
251
452
3M 19 3M 20 3M 19 3M 20 3M 19 3M 20 3M 19 3M 20 3M 19 3M 20 3M 19 3M 20 3M 19 3M 20
Non-Life
Life
In EUR mio
General Account
Result suffering from market volatility & storms
Result reflecting challenging Motor market & storms
Strong Non-Life performance & reserve release
Financial markets volatility
Suffering from bad weather in Belgium & UK
Belgium
UK
CEU
Asia
Reinsurance
Ageas
17Periodical financial information I 3M 20 results I 13 May 2020
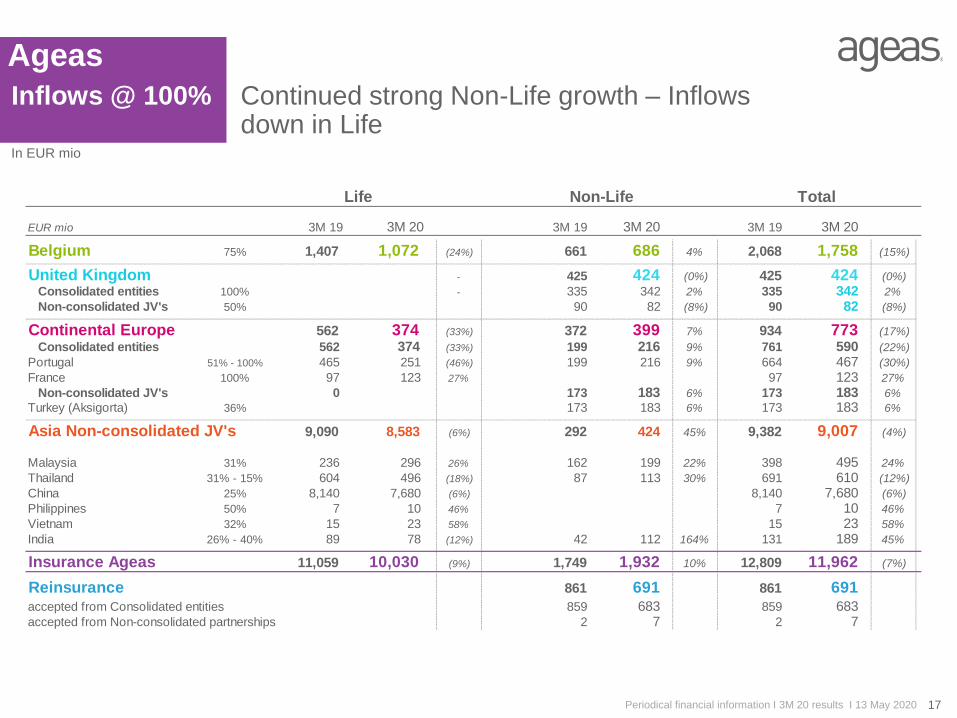
Continued strong Non-Life growth – Inflows down in Life
In EUR mio
EUR mio 3M 19 3M 20 3M 19 3M 20 3M 19 3M 20
Belgium 75% 1,407 1,072 (24%) 661 686 4% 2,068 1,758 (15%)
United Kingdom - 425 424 (0%) 425 424 (0%)
Consolidated entities 100% - 335 342 2% 335 342 2%
Non-consolidated JV's 50% 90 82 (8%) 90 82 (8%)
Continental Europe 562 374 (33%) 372 399 7% 934 773 (17%)
Consolidated entities 562 374 (33%) 199 216 9% 761 590 (22%)
Portugal 51% - 100% 465 251 (46%) 199 216 9% 664 467 (30%)
France 100% 97 123 27% 97 123 27%
Non-consolidated JV's 0 173 183 6% 173 183 6%
Turkey (Aksigorta) 36% 173 183 6% 173 183 6%
Asia Non-consolidated JV's 9,090 8,583 (6%) 292 424 45% 9,382 9,007 (4%)
Malaysia 31% 236 296 26% 162 199 22% 398 495 24%
Thailand 31% - 15% 604 496 (18%) 87 113 30% 691 610 (12%)
China 25% 8,140 7,680 (6%) 8,140 7,680 (6%)
Philippines 50% 7 10 46% 7 10 46%
Vietnam 32% 15 23 58% 15 23 58%
India 26% - 40% 89 78 (12%) 42 112 164% 131 189 45%
Insurance Ageas 11,059 10,030 (9%) 1,749 1,932 10% 12,809 11,962 (7%)
Reinsurance 861 691 861 691accepted from Consolidated entities 859 683 859 683accepted from Non-consolidated partnerships 2 7 2 7
Life Non-Life Total
Inflows @ 100%

Inflows
18Periodical financial information I 3M 20 results I 13 May 2020
Inflows down in Life – Non-Life increasing across all regions
1,055 804 347 263
2,318 2,190
3,720 3,257
496 514
380 383 261 282
80 123
1,217
1,302
-15%
+1%
-10%
-4%
-8%
1,551 1,318
608 545
2,398 2,313
4,937
4,559
861 690
3M 19 3M 20 3M 19 3M 20 3M 19 3M 20 3M 19 3M 20 3M 19 3M 20 3M 19 3M 20
Belgium UK CEU Asia Insurance Reins.
Non-Life
Life
In EUR mio
Strong growth in Non-Life in a mature market – Life commercial campaigns in 2019
Volumes stabilising
Non-Life growth in Portugal & Turkey – Life suffering from low i-rate
Impact of Covid-19 mitigated by renewals
Inflows include one-offs related to ramp-up phase & QS agreements
Belgium
UK
CEU
Asia
Reinsurance
@ ageas part
* Inflows excluding Luxembourg, divested in 2018 & India Non-Life acquired in 2019

Net realisedcap gains*
19Periodical financial information I 3M 20 results I 13 May 2020
Equity impairments due to Covid-19
In EUR mio
* Net capital gains include capital gains, impairments & related changes in profit sharing
(consolidated entitities), net of tax & @ ageas’s part – CEU JV’s not included
3M 19 3M 20
Life 33 (48) Quarterly impairments
Non-Life 3 (3) driven by Equities
Belgium 37 (51)
UK 3 4
Life 2 (3)
Non-Life 1 (0)
CEU 3 (3)
Life 49 16 Impairments on equities mainly in Thailand
Non-Life (0) (1) offset by capital gains in China
Asia 49 14
Reinsurance 0 0
Life 85 (36)
Non-Life 8 (0)
Insurance 93 (36)
General Account
& Eliminations
(4) 306
Total Ageas 89 270

Ageas
20Periodical financial information I 3M 20 results I 13 May 2020
Affected by adverse weather in Belgium & UKCombined ratio
Net earned premium (In EUR mio)
In % Net earned premium
64.4 62.267.0
59.7 58.5 59.7 63.2 64.8
35.234.7
34.1
35.5 35.8 35.335.1 34.9
99.6 96.9101.1
95.2 94.3 95.098.3 99.7
(4.0) (5.9) (3.0)(5.6) (7.7) (8.4) (6.4)
(8.6)2014 2015 2016 2017 2018 2019 3M 19 3M 20
claims ratio expense ratio PY claims ratio
Quarter
COR in both years impacted by adverse weather events (8 pp in
3M 20 vs. 6pp in 3M 19)
Underlying improvement driven by CEU and Belgium Motor
Claims ratio
CY ratio slightly deteriorated under pressure of weather claims –
further improvement in CEU in all product lines
Strong PY claims results in Belgium
Expense ratio improved compared to LY thanks to higher volumes
3,843 4,038 4,112 4,148 3,890 3,894 945 980
Ageas
21Periodical financial information I 3M 20 results I 13 May 2020
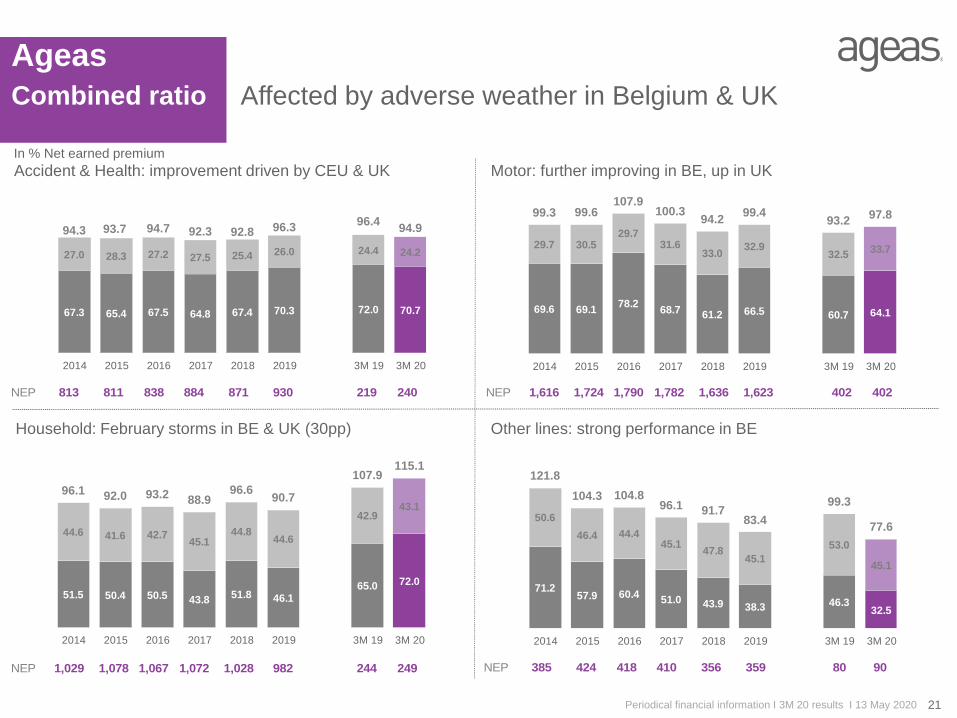
Combined ratio
Accident & Health: improvement driven by CEU & UK Motor: further improving in BE, up in UK
Household: February storms in BE & UK (30pp) Other lines: strong performance in BE
Affected by adverse weather in Belgium & UK
In % Net earned premium
67.3 65.4 67.5 64.8 67.4 70.3 72.0 70.7
27.0 28.3 27.2 27.5 25.4 26.0 24.4 24.2
94.3 93.7 94.7 92.3 92.8 96.396.4
94.9
2014 2015 2016 2017 2018 2019 3M 19 3M 20
69.6 69.178.2
68.7 61.2 66.5 60.7 64.1
29.7 30.529.7
31.633.0
32.932.5
33.7
99.3 99.6107.9
100.394.2
99.493.2
97.8
2014 2015 2016 2017 2018 2019 3M 19 3M 20
51.5 50.4 50.5 43.851.8 46.1
65.0 72.0
44.6 41.6 42.745.1
44.844.6
42.943.1
96.1 92.0 93.2 88.996.6
90.7
107.9115.1
2014 2015 2016 2017 2018 2019 3M 19 3M 20
71.257.9 60.4
51.0 43.9 38.3 46.332.5
50.6
46.4 44.445.1
47.845.1
53.0
45.1
121.8
104.3 104.896.1 91.7
83.4
99.3
77.6
2014 2015 2016 2017 2018 2019 3M 19 3M 20
NEP 813 811 838 884 871 930 219 240 NEP 1,616 1,724 1,790 1,782 1,636 1,623 402 402
NEP 1,029 1,078 1,067 1,072 1,028 982 244 249 NEP 385 424 418 410 356 359 80 90

Ageas
22Periodical financial information I 3M 20 results I 13 May 2020
Guaranteed: on target - UL closing the gap
In bps Avg techn. liabilities
Operating margins
Life Unit-Linked
Belgium above target level thanks to higher management
fees
Improving in Portual
Impacted by arbitrage costs in France
Life Guaranteed
Lower realised net capital gains (-37 bps vs. +33 bps)
Reserve release in Portugal
38 33 41 39 41 37 38 39
9080
88 96 89 98 95
25
(39)(23)
(36) (42) (42) (47) (45)
(8)
8990
93 93 88 88 88
56
2014 2015 2016 2017 2018 2019 3M 19 3M 20
1217
4 3 2 2 1 2
2
1
2
(4)
6
18
19 2423
26
17
30
20
36
2527
2528
18
28
2014 2015 2016 2017 2018 2019 3M 19 3M 20
Operating margin
Expense & other m.
Investment m.
Underwriting m.
Avg techn liabilities (In EUR bn)
12.6 13.0 12.1 15.1 15.7 16.0 16.1 15.7
Avg techn liabilities (In EUR bn)
56.9 57.9 57.3 55.9 55.9 56.6 56.2 57.1
In bps avg technical liabilities In bps avg technical liabilitiesIn % NEP
Belgium
23
Solid underlying performance offset by adverse financial markets & weather
Headlines
In EUR mio In EUR mio In EUR bn
69
(6)
12
18
81
12
3M 19 3M 20
Life Non-Life
1,4071,072
661
686
2,068
1,758
3M 19 3M 20
Life Non-Life
58.2 57.4
3.1 2.8
61.3 60.2
FY 19 3M 20
excl shadow shadow
104.2 100.3
3M 19 3M 20
78
1
3M 19 3M 20
26
47
3M 19 3M 20
Net result: EUR 88 mio lower net capital gains
Inflows: 3M 19 included UL cash-back campaign - Non-Life +4%
Life Technical Liabilities lower due to decrease of UL unit prices
Non-Life combined ratio impacted by weather (12 pp) - Solid Motor & Other lines
Operating margin Guaranteed suffered from financial markets (-44 bps)
Operating margin Unit-Linked – 3M 19 incl. cost of cash back campaign (≈15 bps)
Periodical financial information I 3M 20 results I 13 May 2020
Life
Belgium
24
Net result & Life liabilitiesIn EUR mio
58.2 57.4
3.1 2.8
61.3 60.2
FY 19 3M 20
excl shadow shadow
Net result impacted by financial markets
Periodical financial information I 3M 20 results I 13 May 2020
69
(6)
12
18
81
12
3M 19 3M 20
Life Non-Life
In EUR bn
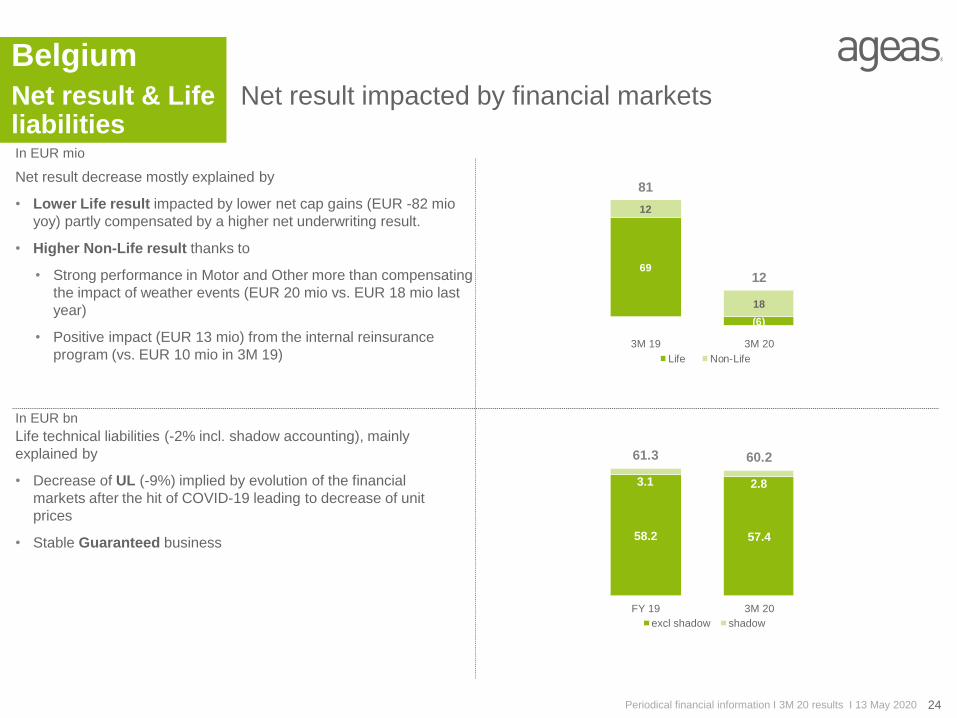
Net result decrease mostly explained by
• Lower Life result impacted by lower net cap gains (EUR -82 mio
yoy) partly compensated by a higher net underwriting result.
• Higher Non-Life result thanks to
• Strong performance in Motor and Other more than compensating
the impact of weather events (EUR 20 mio vs. EUR 18 mio last
year)
• Positive impact (EUR 13 mio) from the internal reinsurance
program (vs. EUR 10 mio in 3M 19)
Life technical liabilities (-2% incl. shadow accounting), mainly
explained by
• Decrease of UL (-9%) implied by evolution of the financial
markets after the hit of COVID-19 leading to decrease of unit
prices
• Stable Guaranteed business
201 211
185 190
205 212
7073
+4%
661 686
3M 19 3M 20
972 897
435
175
1,407
1,072
3M 19 3M 20
Life
Belgium
25
Decrease in UL & Guaranteed - Solid Non-life growth Inflows
Unit-Linked
Guaranteed
Other
Household
Accident & Health
Motor
In EUR mio
Periodical financial information I 3M 20 results I 13 May 2020
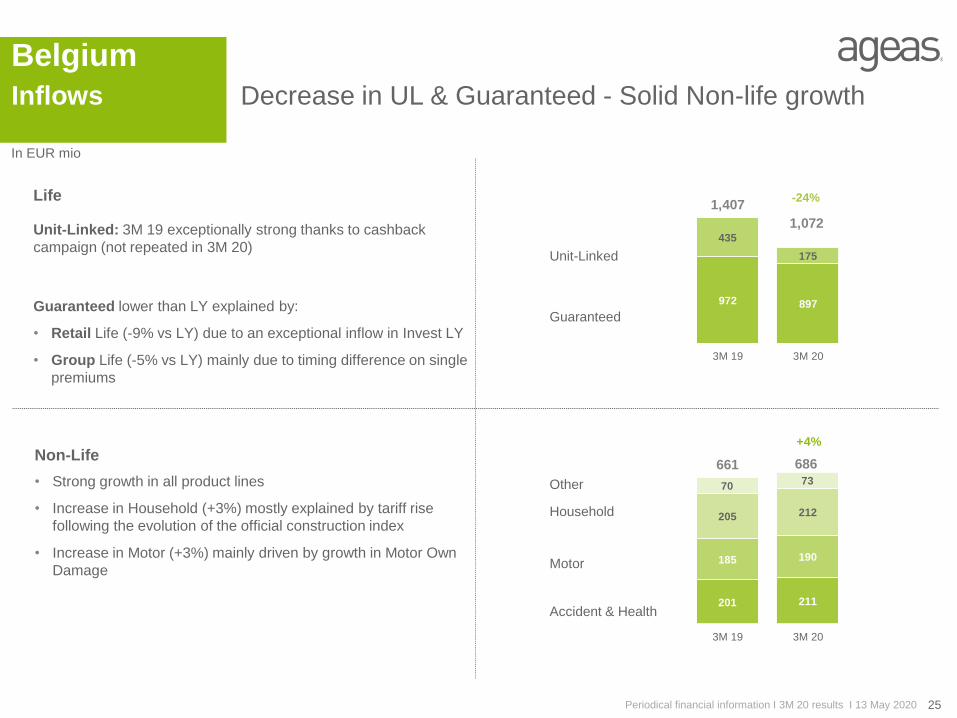
-24%Life
Unit-Linked: 3M 19 exceptionally strong thanks to cashback
campaign (not repeated in 3M 20)
Guaranteed lower than LY explained by:
• Retail Life (-9% vs LY) due to an exceptional inflow in Invest LY
• Group Life (-5% vs LY) mainly due to timing difference on single
premiums
Non-Life
• Strong growth in all product lines
• Increase in Household (+3%) mostly explained by tariff rise
following the evolution of the official construction index
• Increase in Motor (+3%) mainly driven by growth in Motor Own
Damage
Belgium
26Periodical financial information I 3M 20 results I 13 May 2020
Combined ratio2019 & 2020 before QS
In % Net earned premium
Net earned premium (in EUR mio)
Solid operating performance despite weather events in the first quarter
63.2 63.556.9 58.3
53.1 56.0 57.866.5 63.0
36.7 37.7
37.8 37.737.9
37.4 37.4
37.737.3
99.9 101.294.7 96.0
91.0 93.4 95.2
104.2100.3
(3.6) (3.4)(7.2) (8.2) (7.7) (8.3) -8.3 (7.8)
(12.7)
2013 2014 2015 2016 2017 2018 2019 3M 19 3M 20
claims ratio expense ratio PY claims ratio
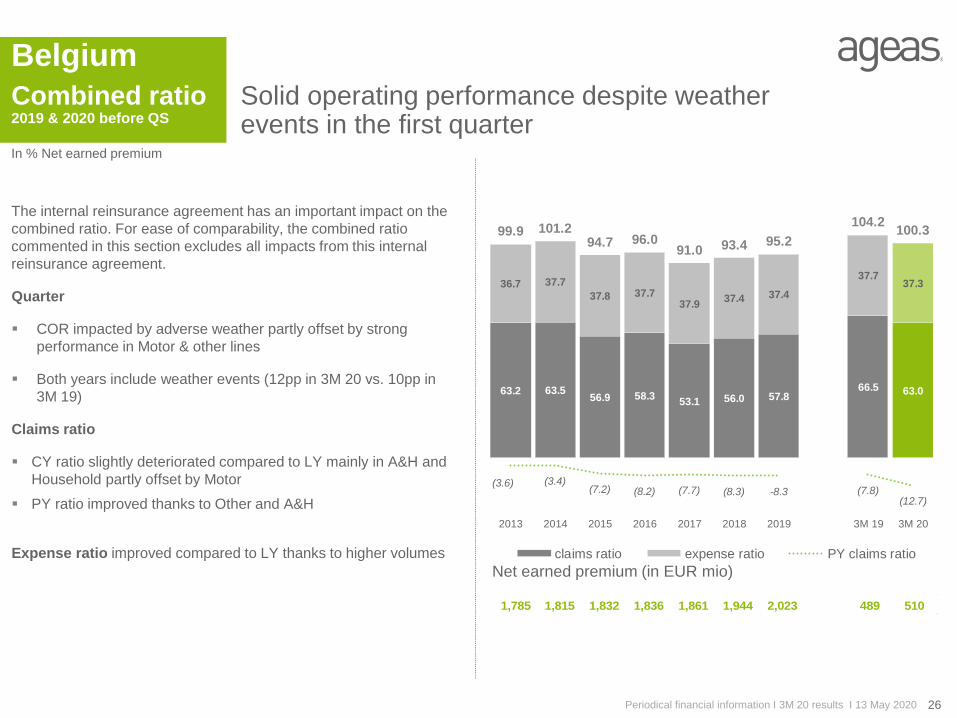
The internal reinsurance agreement has an important impact on the
combined ratio. For ease of comparability, the combined ratio
commented in this section excludes all impacts from this internal
reinsurance agreement.
Quarter
COR impacted by adverse weather partly offset by strong
performance in Motor & other lines
Both years include weather events (12pp in 3M 20 vs. 10pp in
3M 19)
Claims ratio
CY ratio slightly deteriorated compared to LY mainly in A&H and
Household partly offset by Motor
PY ratio improved thanks to Other and A&H
Expense ratio improved compared to LY thanks to higher volumes
1,785 1,815 1,832 1,836 1,861 1,944 2,023 489 510

Belgium
27Periodical financial information I 3M 20 results I 13 May 2020
Combined ratio2019 & 2020 before QS
In % Net earned premium
Solid operating performance despite weather events in the first quarter
Accident & Health: Higher PY offset by lower CY results Motor: Better CY result thanks to lower frequency
Household: 36 pp weather impact (vs. 30 pp LY) Other lines : Excellent performance thanks to sale of 2 old reinsurance
portfolios in run-off
73.7 70.1 70.4 70.0 68.0 71.0 76.2 78.6 79.8
23.8 25.4 27.6 27.6 26.9 24.424.4 24.6 23.5
97.5 95.5 98.0 97.6 94.9 95.4100.6 103.2 103.4
2013 2014 2015 2016 2017 2018 2019 3M 19 3M 20
NEP 507 504 484 472 481 522 562 131 140
64.7 62.6 56.2 59.7 58.0 55.3 60.3 55.6 50.3
36.3 37.236.4 36.4 36.8 37.3
37.337.7
37.8
101.0 99.892.6 96.1 94.8 92.6
97.6 93.388.1
2013 2014 2015 2016 2017 2018 2019 3M 19 3M 20
51.4 51.743.9 47.8
38.649.3 46.3
72.7 78.8
45.6 45.745.2 44.8
45.6
46.6 46.6
46.746.5
97.0 97.489.1 92.6
84.2
95.9 92.9
119.4125.3
2013 2014 2015 2016 2017 2018 2019 3M 19 3M 20
NEP 564 579 595 605 609 621 640 157 162
66.187.5
65.8 58.346.8 40.3 35.8
46.1
6.5
47.2
47.6
45.044.6
44.843.0 44.3
45.2
44.7
113.3
135.1
110.8102.9
91.683.3 80.1
91.2
51.3
2013 2014 2015 2016 2017 2018 2019 3M 19 3M 20
NEP 162 170 185 190 193 206 207 52 52
NEP 552 562 568 570 578 596 614 149 155

Belgium
28Periodical financial information I 3M 20 results I 13 May 2020
Operating marginsIn bps Avg techn. liabilities
Guaranteed: impacted by financial marketsUL: above the group target range
Avg techn liabilities (In EUR bn)
47.5 48.1 48.7 48.0 47.7 48.0 47.8 48.4
(38)(27) (34) (36) (37) (37) (40) (40)
30 25 29 27 31 25 26 28
9588
91 94 91 100 92
13
8786
86 85 85 8878
1
2014 2015 2016 2017 2018 2019 3M 19 3M 20
(2)1 1 1 1
32 31 3133
39 39
26
46
30 32 3134
40 40
26
47
2014 2015 2016 2017 2018 2019 3M 19 3M 20
Operating margin
Investment m.
Expense & other m.
Underwriting m.
Avg techn liabilities (In EUR bn)
5.7 5.9 6.1 7.6 8.1 9.0 8.6 9.4
Life Unit-Linked
Higher management fees
3M 19 included cost (≈15 bps) related to cashback campaign (not
repeated in 3M 20).
Life Guaranteed
Lower investment margin due to higher level of impairments and
lower level of capital gains.
The recurring financial revenues impacted by lower Real Estate
revenues related to the COVID-19 lock-down
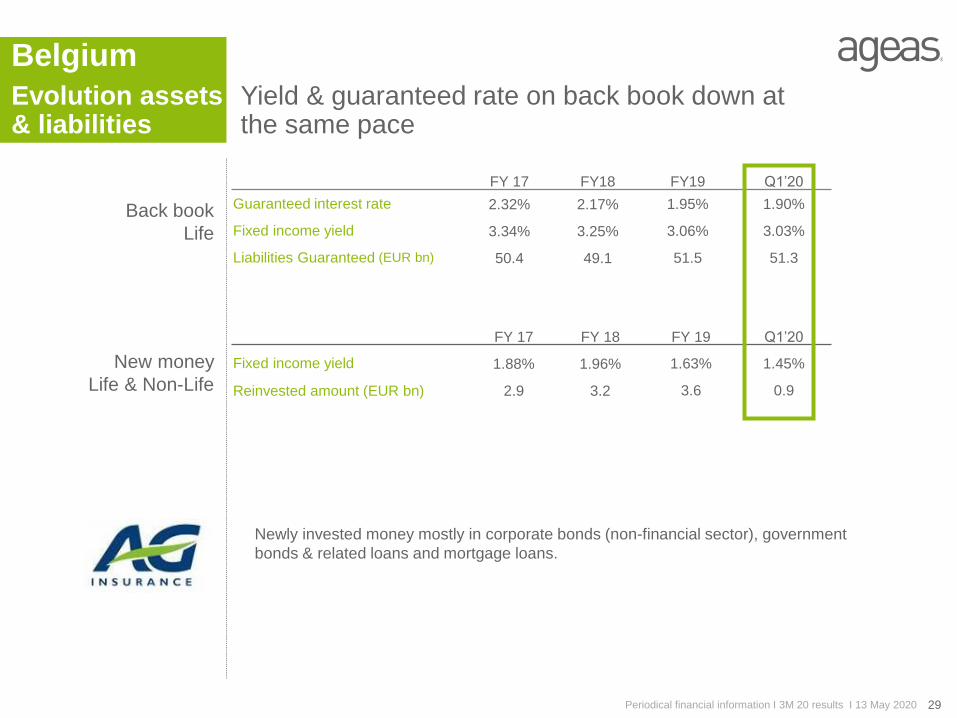
FY 17 FY18 FY19 Q1’20
Guaranteed interest rate 2.32% 2.17% 1.95% 1.90%
Fixed income yield 3.34% 3.25% 3.06% 3.03%
Liabilities Guaranteed (EUR bn) 50.4 49.1 51.5 51.3
FY 17 FY 18 FY 19 Q1’20
Fixed income yield 1.88% 1.96% 1.63% 1.45%
Reinvested amount (EUR bn) 2.9 3.2 3.6 0.9
Newly invested money mostly in corporate bonds (non-financial sector), government
bonds & related loans and mortgage loans.
Belgium
29Periodical financial information I 3M 20 results I 13 May 2020
Yield & guaranteed rate on back book down at the same pace
Evolution assets & liabilities
Back book
Life
New money
Life & Non-Life
Belgium
30Periodical financial information I 3M 20 results I 13 May 2020
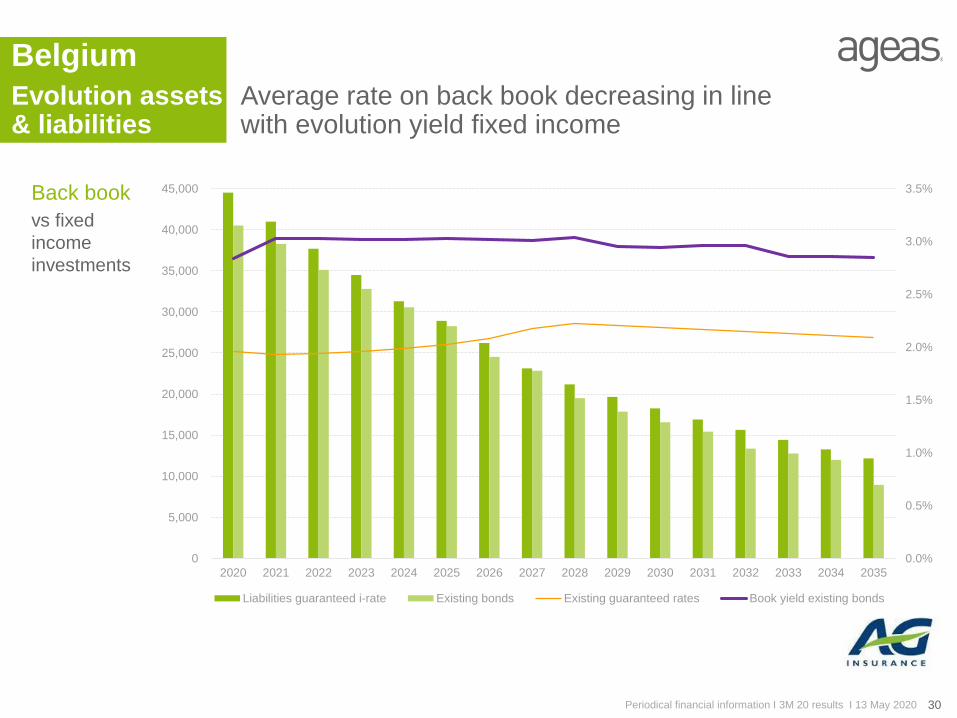
Average rate on back book decreasing in line with evolution yield fixed income
Evolution assets & liabilities
Back book
vs fixed
income
investments
0.0%
0.5%
1.0%
1.5%
2.0%
2.5%
3.0%
3.5%
0
5,000
10,000
15,000
20,000
25,000
30,000
35,000
40,000
45,000
2020 2021 2022 2023 2024 2025 2026 2027 2028 2029 2030 2031 2032 2033 2034 2035
Liabilities guaranteed i-rate Existing bonds Existing guaranteed rates Book yield existing bonds

In EUR mio
UK
31
Weather events heavily impacting net resultHeadlines
In % of NEP
In EUR mio
* incl. non-consolidated partnerships @ 100%
Net result impacted by weather events (Ciara & Dennis storms)
Inflows* stable compared with 3M 2019 Non-Life combined ratio @ 98.7% excluding February weather events
11
1
3M 19 3M 20
425 424
3M 19 3M 20
95.5107.1
3M 19 3M 20
Periodical financial information I 3M 20 results I 13 May 2020

UK
32
Impact from weather events & one-offs – inflows stableNet result & Inflows
Other
Household
Accident & Health
Motor
Net result
Weather claims of EUR 15m compared to benign 3M 19
weather; combined with continued market wide Motor claims
inflation
3M 19 included EUR 12 million restructuring cost
In EUR mio
Inflows *
Motor down 8%: reflecting lower volumes from TU and focus
on maintaining pricing discipline
Household up 9% benefitting from new deals in the
Intermediated distribution channel
Other up 18% reflecting growth in Commercial lines business
sold through digital channels and from new deals
Periodical financial information I 3M 20 results I 13 May 2020
11
1
3M 19 3M 20
* incl. non-consolidated partnerships @ 100% & @ constant exchange rate
6 10
299 278
87 96
32 39
0%
425 424
3M 19 3M 20
UK
33
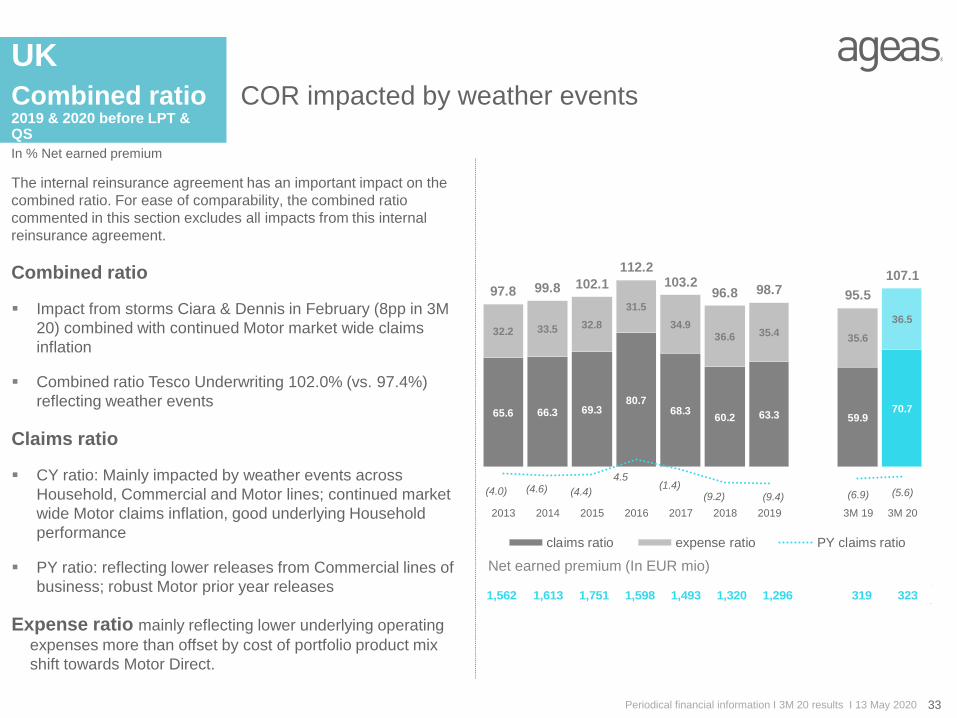
COR impacted by weather eventsCombined ratio2019 & 2020 before LPT & QS
In % Net earned premium
The internal reinsurance agreement has an important impact on the
combined ratio. For ease of comparability, the combined ratio
commented in this section excludes all impacts from this internal
reinsurance agreement.
Combined ratio
Impact from storms Ciara & Dennis in February (8pp in 3M
20) combined with continued Motor market wide claims
inflation
Combined ratio Tesco Underwriting 102.0% (vs. 97.4%)
reflecting weather events
Claims ratio
CY ratio: Mainly impacted by weather events across
Household, Commercial and Motor lines; continued market
wide Motor claims inflation, good underlying Household
performance
PY ratio: reflecting lower releases from Commercial lines of
business; robust Motor prior year releases
Expense ratio mainly reflecting lower underlying operating
expenses more than offset by cost of portfolio product mix
shift towards Motor Direct.
Net earned premium (In EUR mio)
Periodical financial information I 3M 20 results I 13 May 2020
65.6 66.3 69.380.7
68.360.2 63.3 59.9
70.7
32.2 33.5 32.8
31.5
34.936.6 35.4
35.6
36.5
97.8 99.8 102.1
112.2103.2
96.8 98.7 95.5
107.1
(4.0) (4.6) (4.4)
4.5(1.4)
(9.2) (9.4) (6.9) (5.6)
2013 2014 2015 2016 2017 2018 2019 3M 19 3M 20
claims ratio expense ratio PY claims ratio
1,562 1,613 1,751 1,598 1,493 1,320 1,296 319 323

UK
34
Performance impacted by weather events across almost allbusiness lines
Combined ratio2019 & 2020 before LPT & QS
Motor: Continued market wide claims inflation & weather eventsAccident & Health: Excellent performance driven by an IBNR
review
Household: February weather events’ impact 29pp
Periodical financial information I 3M 20 results I 13 May 2020
76.266.0
55.8 58.4 56.1 57.8 60.251.4
25.4
34.338.7
43.3 40.9 46.7 51.4 54.3
48.0
55.5
110.5104.7
99.1 99.3 102.8109.2
114.5
99.4
80.9
2013 2014 2015 2016 2017 2018 2019 3M 19 3M 20
71.9 74.6 75.891.0
75.063.7
72.1 65.8 72.0
25.0 25.1 27.2
25.5
27.629.7
29.430.3
31.5
96.9 99.7 103.0
116.5
102.693.4
101.596.1
103.5
2013 2014 2015 2016 2017 2018 2019 3M 19 3M 20
51.4 51.062.2 57.6 51.7 56.9
42.8 48.5
71.6
42.4 43.337.3 40.6 47.8 45.1
44.142.7
40.7
93.8 94.399.5 98.2 99.5 102.0
86.9 91.2
112.3
2013 2014 2015 2016 2017 2018 2019 3M 19 3M 20
59.8 56.0 55.373.7 67.0
46.3 54.0 50.5
75.0
44.4 54.3 48.6
44.947.0
56.7 47.9 49.1
50.1
104.2110.3
103.9
118.6 114.0103.0 101.9 99.6
125.1
2013 2014 2015 2016 2017 2018 2019 3M 19 3M 20
Other: Up on commmercial line & weather events
NEP 79 71 72 39 30 30 34 7 11 NEP 907 958 1,062 1,014 947 844 831 203 202
NEP 374 399 413 361 341 309 289 71 76 NEP 202 185 204 185 175 137 142 37 35

CEU
35
Headlines
In EUR mio In EUR mio In EUR bn
In bps avg technical liabilities In bps avg technical liabilities
In % NEP
12
26
19
2032
46
3M 19 3M 20
Life Non-Life
562374
372
399
934
773
3M 19 3M 20
Life Non-Life
15.4 14.7
0.80.5
16.2 15.3
FY 19 3M 20
excl shadow shadow
91.7 87.3
3M 19 3M 20
140
356
3M 19 3M 20
8
03M 19 3M 20
Strong operating performanceLife result supported by reserve release
Net result strongly up on reserve release in Life - Solid performance in Non-Life
Inflows down 17% on low i-rates – strong growth in Non-Life (+12% at cst. FX)
Life Technical liabilities 6% down due to UL following the drop in financial markets
Operating margin Guaranteed up on reserve release in Portugal (251 bps)
Operating margin Unit-Linked impacted by financial markets volatility
Periodical financial information I 3M 20 results I 13 May 2020
Excellent Non-Life combined ratio
CEU
36
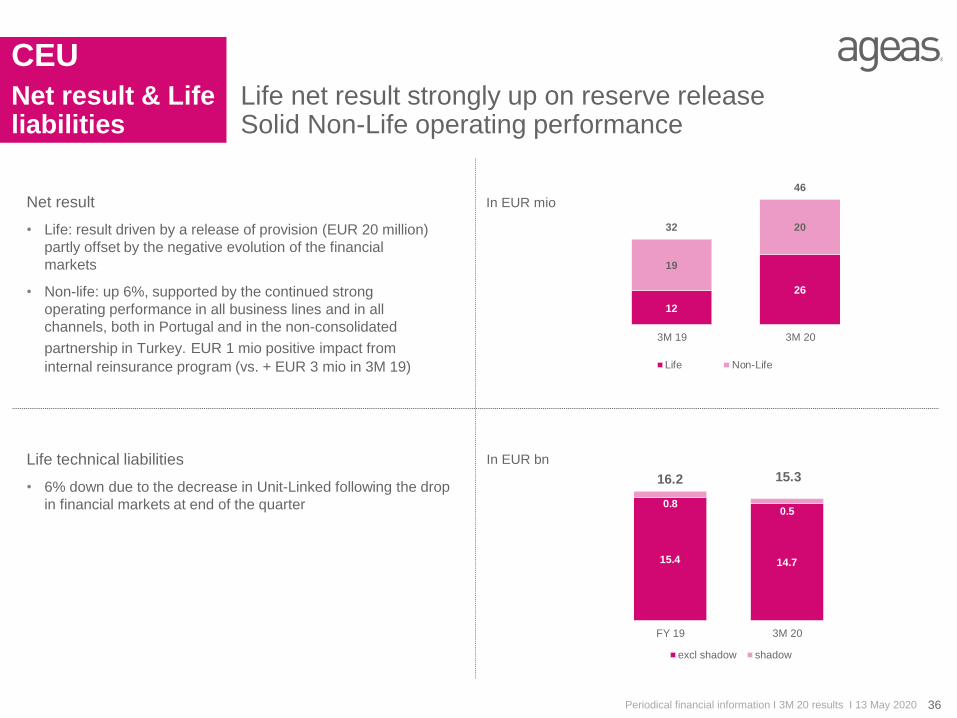
Life net result strongly up on reserve release Solid Non-Life operating performance
Net result & Life liabilities
In EUR mio
15.4 14.7
0.80.5
16.2 15.3
FY 19 3M 20
excl shadow shadow
Periodical financial information I 3M 20 results I 13 May 2020
12
26
19
2032
46
3M 19 3M 20
Life Non-Life
Net result
• Life: result driven by a release of provision (EUR 20 million)
partly offset by the negative evolution of the financial
markets
• Non-life: up 6%, supported by the continued strong
operating performance in all business lines and in all
channels, both in Portugal and in the non-consolidated
partnership in Turkey. EUR 1 mio positive impact from
internal reinsurance program (vs. + EUR 3 mio in 3M 19)
In EUR bnLife technical liabilities
• 6% down due to the decrease in Unit-Linked following the drop
in financial markets at end of the quarter

CEU
37Periodical financial information I 3M 20 results I 13 May 2020
UL strongly up, mitigating decrease in GuaranteedContinued Non-Life growth
Inflows
Unit-Linked
Guaranteed
Other
Household
Accident & Health
Motor
In EUR mio
439
182
123
192
-33%
562
374
3M 19 3M 20
Life Unit-Linked
• Inflows strongly up (+56%) supported by good market performance
during the first months of the quarter and by new product launched
end of last year
Life Guaranteed
• Strongly down on last year due to lower sales appetite in a low
interest rates environment – transition phase ongoing in Portugal
with the launch of new product
Non-Life
• Strong sales in both Portugal and Turkey
• In Portugal, excellent commercial performance in all segments
• In Turkey, 17% growth at constant FX, driven by Motor and
Health, and partly offset by FX
130 143
131152
75
6936
34
+7%
372398
3M 19 3M 20

CEU
38Periodical financial information I 3M 20 results I 13 May 2020
Combined ratio2019 & 2020 before LPT & QS
Net earned premium (In EUR mio)
In % Net earned premium
Combined ratio well below group target on lower claims frequency
63.7 61.355.9 58.6 59.2 62.7 60.5 64.0 59.5
30.0 30.8
29.530.1 31.2
29.7 30.7 27.727.8
93.7 92.185.4
88.7 90.4 92.4 91.2 91.787.3
(4.0) (4.3) (6.5) (6.5) (8.0)(2.9) -2.4
0.0 (1.4)
2013 2014 2015 2016 2017 2018 2019 3M 19 3M 20
claims ratio expense ratio PY claims ratio
403 415 454 664 768 594 657 157 174
The internal reinsurance agreement has an important impact on the
combined ratio. For ease of comparability, the combined ratio
commented in this section excludes all impacts from this internal
reinsurance agreement.
Combined ratio of consolidated companies at 87.3%, reflecting a
continued excellent operating performance
Improved claims ratio partly driven by lower claims frequency and
supporting all lines of business
Combined ratio in Turkey at 97.2% vs. 102.3% last year

CEU
39
Combined ratio2019 & 2020 before LPT & QS
Continued excellent operating performance
Other: very small & volatile portfolio
Periodical financial information I 3M 20 results I 13 May 2020
59.7 61.9 58.8 64.9 61.4 62.5 63.0 65.5 61.8
26.6 26.725.2
25.1 26.8 24.8 26.0 22.2 22.9
86.3 88.684.0
90.0 88.2 87.3 89.0 87.7 84.8
2013 2014 2015 2016 2017 2018 2019 3M 19 3M 20
79.360.1
71.5 65.5 70.4 68.0 67.2 66.1 66.1
29.2
31.6
32.332.5
35.0 35.3 36.6 34.0 34.3
108.5
91.7
103.898.0
105.4 103.3 103.8 100.1 100.4
2013 2014 2015 2016 2017 2018 2019 3M 19 3M 20
53.5 54.036.1 42.3 46.5 48.5
40.355.4
41.5
38.8 40.3
35.938.0 34.7 34.2
33.2
32.7
31.5
92.3 94.3
72.080.3 81.2 82.7
73.5
88.1
73.0
2013 2014 2015 2016 2017 2018 2019 3M 19 3M 20
59.672.3
31.712.1 3.9
72.6
28.3 48.7
21.2
43.7
45.1
40.8
41.339.2
41.5
42.4
37.5
34.6
103.3
117.4
72.5
53.443.1
114.0
70.7
86.2
55.8
2013 2014 2015 2016 2017 2018 2019 3M 19 3M 20
NEP 227 238 255 328 373 318 349 84 94 NEP 99 96 94 202 249 188 207 50 53
NEP 48 51 70 91 105 74 86 19 23 NEP 29 30 35 43 41 13 15 4 4
Accident & Health: Still excellent despite slightly higher costs Motor: Improved claims ratio due to lower accident frequency
Household: Claims ratio strongly down
CEU
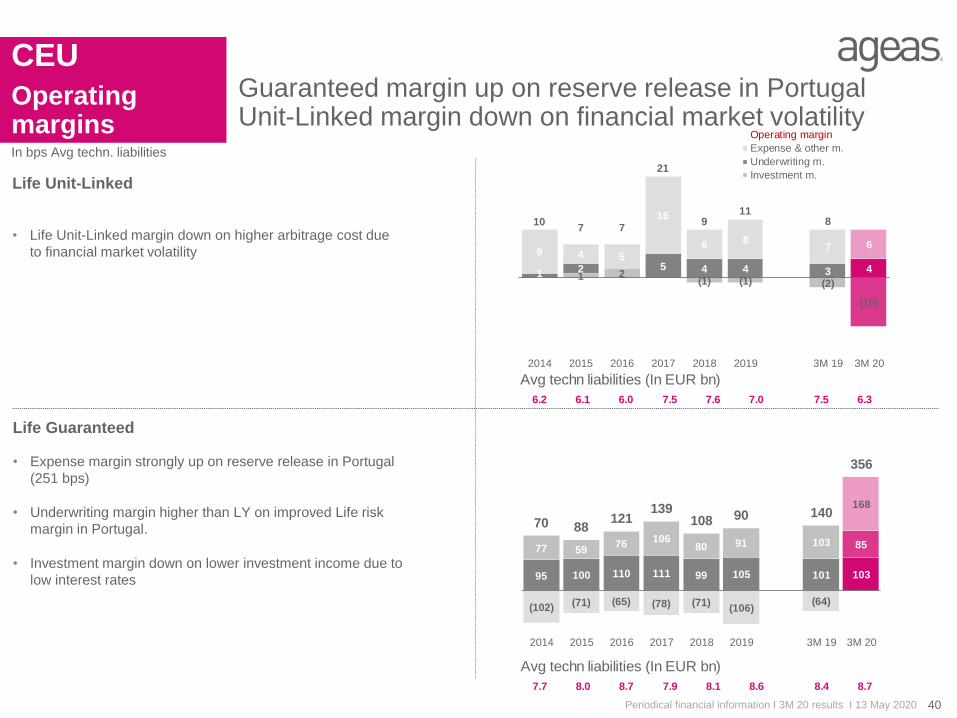
40Periodical financial information I 3M 20 results I 13 May 2020
Operating marginsIn bps Avg techn. liabilities
95 100 110 111 99 105 101 103
77 5976
10680 91 103 85
(102) (71) (65) (78) (71)(106)
(64)
168
70 88121
139108 90 140
356
2014 2015 2016 2017 2018 2019 3M 19 3M 20
1 2(1) (1) (2)
(10)
1 2 5 4 4 3 4
9 4 5
16
6 87 6
107 7
21
911
8
2014 2015 2016 2017 2018 2019 3M 19 3M 20
Operating margin
Expense & other m.
Underwriting m.
Investment m.
Avg techn liabilities (In EUR bn)
7.7 8.0 8.7 7.9 8.1 8.6 8.4 8.7
Avg techn liabilities (In EUR bn)
6.2 6.1 6.0 7.5 7.6 7.0 7.5 6.3
Guaranteed margin up on reserve release in PortugalUnit-Linked margin down on financial market volatility
Life Unit-Linked
• Life Unit-Linked margin down on higher arbitrage cost due
to financial market volatility
Life Guaranteed
• Expense margin strongly up on reserve release in Portugal
(251 bps)
• Underwriting margin higher than LY on improved Life risk
margin in Portugal.
• Investment margin down on lower investment income due to
low interest rates

8,515 7,873
575711
9,090 8,584
3M 19 3M 20
regular single
9,090 8,583
292424
9,382 9,007
3M 19 3M 20
Life Non-Life
In EUR mio In EUR mio In EUR bn
Asia
41
Resilient operational performance mitigating negative impact from Covid-19
Headlines
In % NEP
* incl. non-consolidated partnerships @ 100%
Higher Non-Life combined ratio following the acquisition in India (only partly integrated in Q1 2019)
Inflows* -4% @ constant FX due to Covid-19, cushioned by renewals
Life Technical liabilities up 7% fromrenewals
In EUR mio
Regular premium: remaining above 90% of Life inflows
142
69
5
5
147
74
3M 19 3M 20
Life Non-Life
94.2% 95.7%
3M 19 3M 20
82.2 87.5
FY 19 3M 20
Resilient net result compared to an exceptionally high result LY
Periodical financial information I 3M 20 results I 13 May 2020
Additional information on Ageas
non-consolidated partnerships in
Asia is available on the excel
spreadsheet published on Ageas’
website under quarterly results
(www.ageas.com/investors/quarterly-results)
Asia
42
Resilient operational performance mitigating negative impact from Covid-19
Net result & Life liabilities
In EUR mio
142
69
5
5
147
74
3M 19 3M 20
Life Non-Life
82.2 87.5
FY 19 3M 20
Periodical financial information I 3M 20 results I 13 May 2020
Net result
• Negative impact of Covid-19 :
− Equity impairments, offset by positive capital gains
− Downward movement of yields in China leading to unfavourable
evolution of discount rate curve
− Lower sales impacting VANB
• Lower Life Result compared to an exceptionally high result LY:
− Lower net capital gains (EUR 16 mio vs EUR 49 mio)
− Lower inflows
− Negative impact of the discount rate curve in China
• Life Technical liabilities driven by high persistency levels
In EUR bn

Asia
43
Limited decrease in Life inflows thanks to renewals Continued solid growth in Non-Life inflows
Inflows
Unit-Linked
Guaranteed
Other
Household
Accident & Health
Motor
In EUR mio
8,715 8,181
375402
9,0908,583
3M 19 3M 20
29 31
149206
43
5571
132
292
424
3M 19 3M 20
incl. non-consolidated partnerships @ 100%
All growth rates are at constant FX Periodical financial information I 3M 20 results I 13 May 2020
Life
• Only limited decrease in Life gross inflows (-5%)
during the pandemic, thanks to continued strong
persistency
• Renewals up 2%
• Profitable regular premium still above 90% of total life
inflow
Non-Life
• Up 43%, supported by the contribution from India,
integrated as from 22 February 2019
• Up 23% scope on scope, supported by both Thailand
and Malaysia.
• Continued growth in all business lines
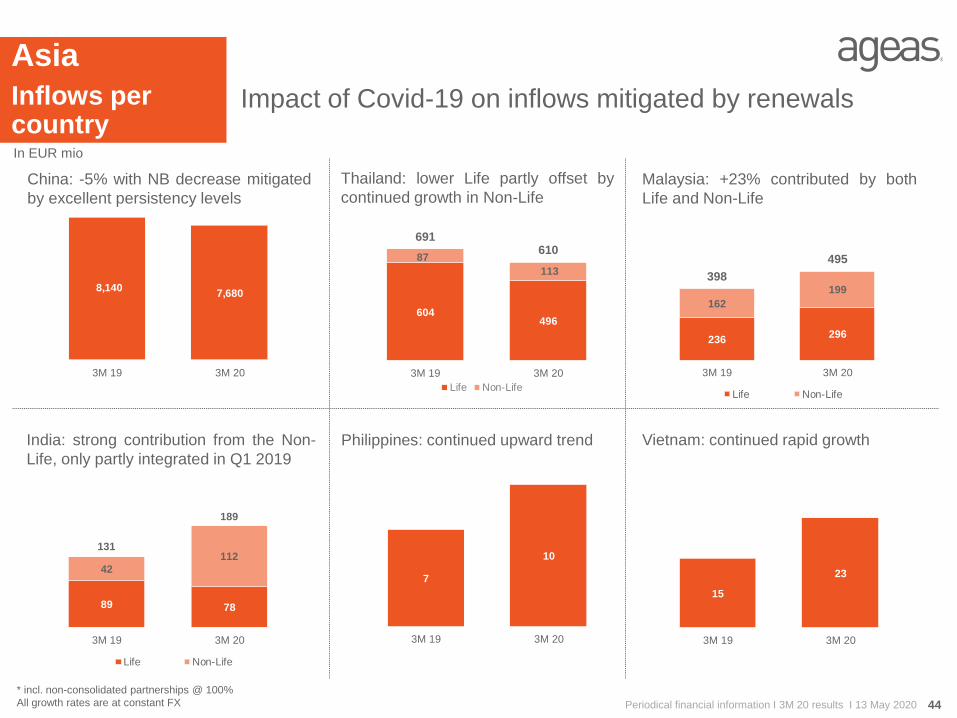
Malaysia: +23% contributed by both
Life and Non-Life
Asia
44
Impact of Covid-19 on inflows mitigated by renewals Inflows per country
China: -5% with NB decrease mitigated
by excellent persistency levels
In EUR mio
8,1407,680
3M 19 3M 20
604496
87
113
691610
3M 19 3M 20
Life Non-Life
7
10
3M 19 3M 20
India: strong contribution from the Non-
Life, only partly integrated in Q1 2019
Philippines: continued upward trend Vietnam: continued rapid growth
* incl. non-consolidated partnerships @ 100%
All growth rates are at constant FX Periodical financial information I 3M 20 results I 13 May 2020
236296
162
199
398
495
3M 19 3M 20
Life Non-Life
89 78
42
112131
189
3M 19 3M 20
Life Non-Life
15
23
3M 19 3M 20
Thailand: lower Life partly offset by
continued growth in Non-Life

In EUR mio
Reinsurance
45
Cession rate on internal QS & LPT reinsurance agreements up to 40%
Headlines
In % NEP
In EUR mio
Net result: impacted by adverse weather
Inflows: EUR 420 mio from QSagreements
Combined ratio: slightly higher claims
Implementation of an internal reinsurance programme within ageas SA/NV in order to
enhance capital fungibility in the group
Non-Life Quota Share (QS) Treaties: 40% with AG Insurance in Belgium*, 40% with Ageas
Insurance Limited in the UK, and 40% with all Portuguese Non-Life Entities
Loss Portfolio Transfers (LPT): 40% with Ageas Insurance Limited in the UK, and 40%
with the Portuguese Non-Life Entities
The Pillar I Solvency II for ageas SA/NV amounted to 343%
ageas SA/NV
reinsurance activities
(12)
(21)
3M 19 3M 20
861
690
3M 19 3M 20
79.5%89.1%
3M 19 3M 20
Periodical financial information I 3M 20 results I 13 May 2020* of which 75% is underwritten by ageas SA/NV

22 33117
161
642
339
80
157
861
690
3M 19 3M 20
In EUR mio
Reinsurance
46
Significant impact from weather eventsNet result & Inflows
Portugal
UK
Protection
Belgium
• EUR 420 mio from the quota share agreements (vs. EUR
240 mio in 3M 19)
• EUR 191 mio from the Loss Portfolio Transfer (LPT)
• EUR 46 mio from prior year unearned premiums
• EUR 33 mio from traditional protection programme
Periodical financial information I 3M 20 results I 13 May 2020
• EUR 2 mio from traditional protection programme – flat year-
on-year
• EUR 17 mio loss from the QS treaty in Belgium due to
claims related to windstorms and floods
• EUR 5 mio loss from the UK mainly explained by the
increased claims from February storms
• EUR 1 mio loss from Portugal due to one-off impact of the
LPT contract (from 20% to 40%) not fully offset by the
positive contribution of the QS
(12)
(21)
3M 19 3M 20
Net result
Inflows

Value legacies
GA
47Periodical financial information I 3M 20 results I 13 May 2020
Result driven by capital gain on the tender of Fresh securities & RPN(i) revaluation
Headlines
Total liquid assets down following tender of the Fresh securities
Positive evolution of RPN(i) Staff & Operating expenses: include non-recurring costs
In EUR mio In EUR bn
In EUR mio
In EUR mio
Upstream from Portugal, Reinsurance, Turkey & India
(7)
339
3M 19 3M 20
(359) (303)
7 5
(514)
(472)
FY 19 3M 20
RPN(i) RPI Settlement
2.2
1.6
FY 19 3M 20
7 7
22 22
29 29
3M 19 3M 20
Staff & Intercompany Operating
27
56
3M 19 3M 20
Net result: capital gain on tender of the Fresh & positive RPN(i) contributionIn EUR mio <
In EUR mio
66
1191
87
3M 20
Portugal
Reinsurance
Turkey
India
GA
48Periodical financial information I 3M 20 results I 13 May 2020
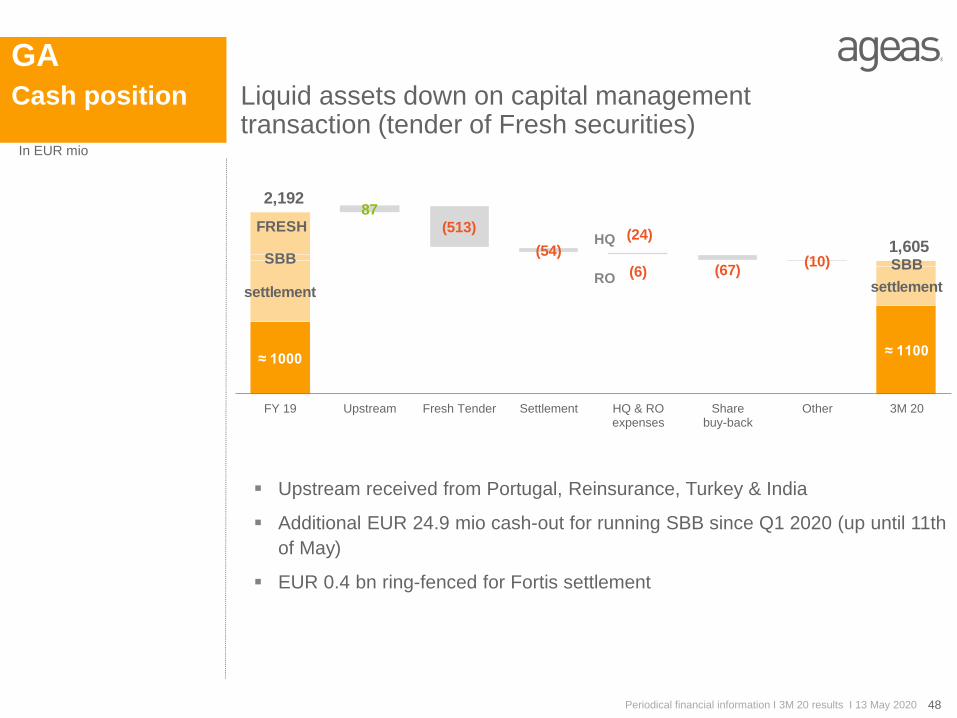
Liquid assets down on capital management transaction (tender of Fresh securities)
Cash position
In EUR mio
Upstream received from Portugal, Reinsurance, Turkey & India
Additional EUR 24.9 mio cash-out for running SBB since Q1 2020 (up until 11th
of May)
EUR 0.4 bn ring-fenced for Fortis settlement
≈ 1000≈ 1100
settlement settlement
SBB SBB
FRESH
2,192
1,605
(513)
(54)(24)
(67)(10)
87
(6)
FY 19 Upstream Fresh Tender Settlement HQ & ROexpenses
Sharebuy-back
Other 3M 20
HQ
RO
GA
49Periodical financial information I 3M 20 results I 13 May 2020
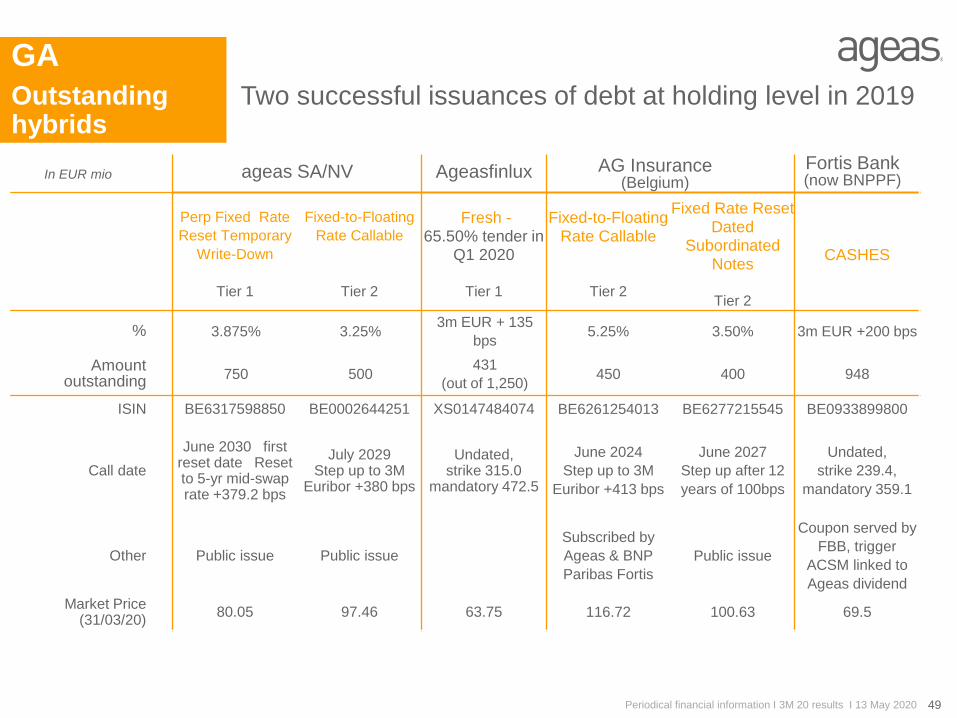
Two successful issuances of debt at holding level in 2019Outstandinghybrids
In EUR mio ageas SA/NV Ageasfinlux
Perp Fixed Rate
Reset Temporary
Write-Down
Tier 1
Fixed-to-Floating
Rate Callable
Tier 2
Fresh -65.50% tender in
Q1 2020
Tier 1
Fixed-to-Floating Rate Callable
Tier 2
Fixed Rate Reset Dated
Subordinated Notes
Tier 2
CASHES
% 3.875% 3.25%3m EUR + 135
bps5.25% 3.50% 3m EUR +200 bps
Amountoutstanding
750 500431
(out of 1,250)450 400 948
ISIN BE6317598850 BE0002644251 XS0147484074 BE6261254013 BE6277215545 BE0933899800
Call date
June 2030 first reset date Reset to 5-yr mid-swap rate +379.2 bps
July 2029Step up to 3M
Euribor +380 bps
Undated, strike 315.0
mandatory 472.5
June 2024
Step up to 3M
Euribor +413 bps
June 2027
Step up after 12
years of 100bps
Undated,
strike 239.4,
mandatory 359.1
Other Public issue Public issue
Subscribed by
Ageas & BNP
Paribas Fortis
Public issue
Coupon served by
FBB, trigger
ACSM linked to
Ageas dividend
Market Price (31/03/20)
80.05 97.46 63.75 116.72 100.63 69.5
Fortis Bank (now BNPPF)
AG Insurance (Belgium)
50Periodical financial information I 3M 20 results I 13 May 2020
ContentSlides used during analyst call 2
Segment information 15
Equity / Solvency 50
Investment portfolio 62
Legal Settlement 67
General Information 70

Equity
51Periodical financial information I 3M 20 results I 13 May 2020
Equity down on negative impact of financial markets
In EUR mio
7,290 7,611
3,9313,151
452
71 22
(780)(68) (156)
EUR 58.89 EUR 57.75
11,22110,762
FY 19 result changeUG/L
treasuryshares
FX IAS 19 other 3M 20
Shareholders’ equity
per segment Belgium 5,135 ► 4,672 Asia 4,008 ► 3,828
UK 998 ► 940 Reinsurance 108 ► (52)
Continental Europe 1,326 ► 1,261 General Account (354) ► 113
Shareholdersequity
Equity per share
Unrealised gains &
losses
Equity per segment
Equity
52Periodical financial information I 3M 20 results I 13 May 2020
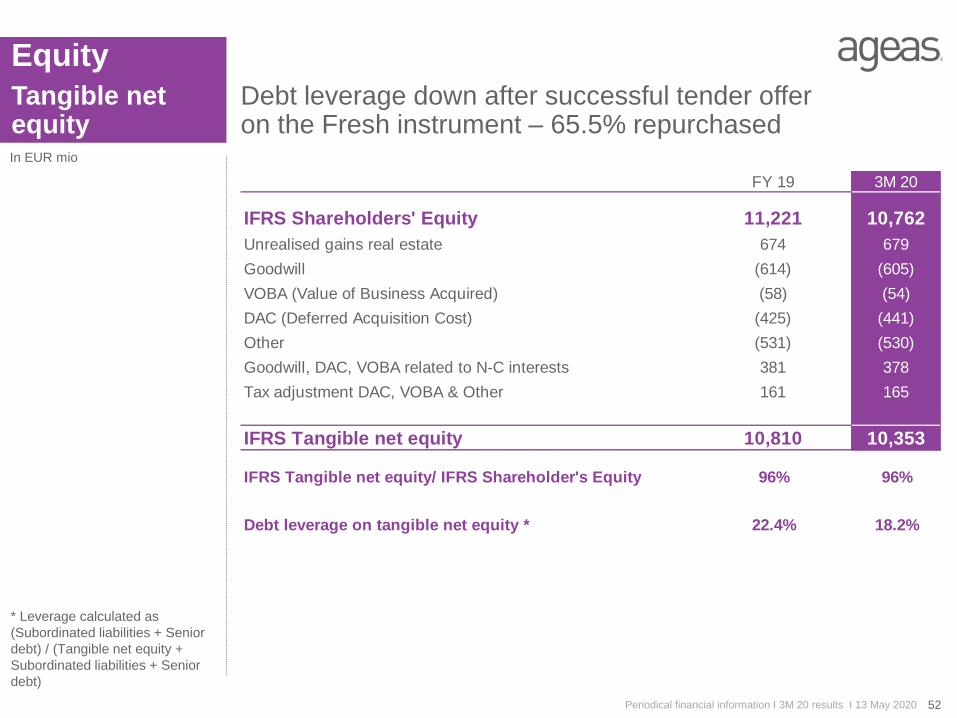
Debt leverage down after successful tender offer on the Fresh instrument – 65.5% repurchased
Tangible net equity
I page 52
* Leverage calculated as
(Subordinated liabilities + Senior
debt) / (Tangible net equity +
Subordinated liabilities + Senior
debt)
In EUR mio
FY 19 3M 20
IFRS Shareholders' Equity 11,221 10,762
Unrealised gains real estate 674 679
Goodwill (614) (605)
VOBA (Value of Business Acquired) (58) (54)
DAC (Deferred Acquisition Cost) (425) (441)
Other (531) (530)
Goodwill, DAC, VOBA related to N-C interests 381 378
Tax adjustment DAC, VOBA & Other 161 165
IFRS Tangible net equity 10,810 10,353
IFRS Tangible net equity/ IFRS Shareholder's Equity 96% 96%
Debt leverage on tangible net equity * 22.4% 18.2%
Solvency
53Periodical financial information I 3M 20 results I 13 May 2020
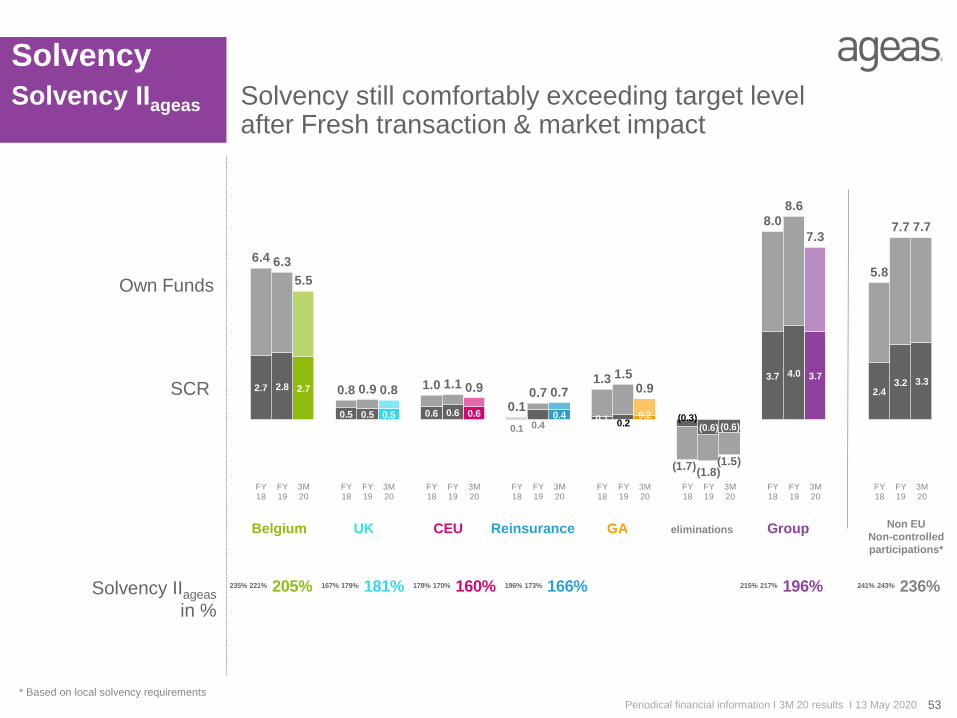
Solvency still comfortably exceeding target level after Fresh transaction & market impact
Solvency IIageas
Solvency IIageas
in %
Own Funds
SCR
Non EU
Non-controlled
participations*
Belgium UK CEU Reinsurance GA eliminations Group
2.7 2.8 2.7
0.5 0.5 0.5 0.6 0.6 0.6
0.1 0.40.4 0.1 0.2
0.2 (0.3)(0.6) (0.6)
3.7 4.0 3.7
2.43.2 3.3
6.4 6.3
5.5
0.8 0.9 0.8 1.0 1.1 0.9
0.10.7 0.7
1.3 1.50.9
(1.7)(1.8)
(1.5)
8.08.6
7.3
5.8
7.7 7.7
FY18
FY19
3M20
FY18
FY19
3M20
FY18
FY19
3M20
FY18
FY19
3M20
FY18
FY19
3M20
FY18
FY19
3M20
FY18
FY19
3M20
FY18
FY19
3M20
235% 221% 205% 167% 179% 181% 178% 170% 160% 196% 173% 166% 215% 217% 196% 241% 243% 236%
* Based on local solvency requirements

Solvency II
54Periodical financial information I 3M 20 results I 13 May 2020
Solvency down on Fresh & market – contribution from operations covering dividend accrual
Solvency IIageas
* Impact including secondary impact, diversification & non-transferable
Impact on Solvency IIageas* FY ’19 3M ’20
217% 196%
Debt initiatives -11 pp Tender of the Fresh
Model refinements + 1 pp
Market movements
& RPN(i)
- 11 pp
+1 pp
Swap, spread & equity
Operational +2 pp
SBB - 2 pp
Expected dividend - 1 pp

Free CapitalGeneration
55Periodical financial information I 3M 20 results I 13 May 2020
Operational FCG affected by February storms
expected
dividend
Operational impact – includes EUR 10 mio dividend upstream Non-European NCP’s
Market: Covid-19 impact
Fresh tender: pre-compensated by EUR 750mio T1 in 2019
Capital transactions = SBB & injection in Asia
Based on 175% SCR
Solvency IIageas
Solvency IIageas
In EUR mio*
2,438
1,979
1,474
491
491
529
726 26
85
(459)
(517)
(72)
2,929
2,470
2,0041095
Tier 1instrument
FY 19 Fresh tender FY 19restated
Model changes Market impact Operationalimpact
Capitaltransactions
3M 20
* FCG Non-European NCP’s over
FY 2019 at EUR 806 mio -
Operational FCG at EUR 369 mio
- outside of Solvency II scope
Free CapitalGeneration
56Periodical financial information I 3M 20 results I 13 May 2020
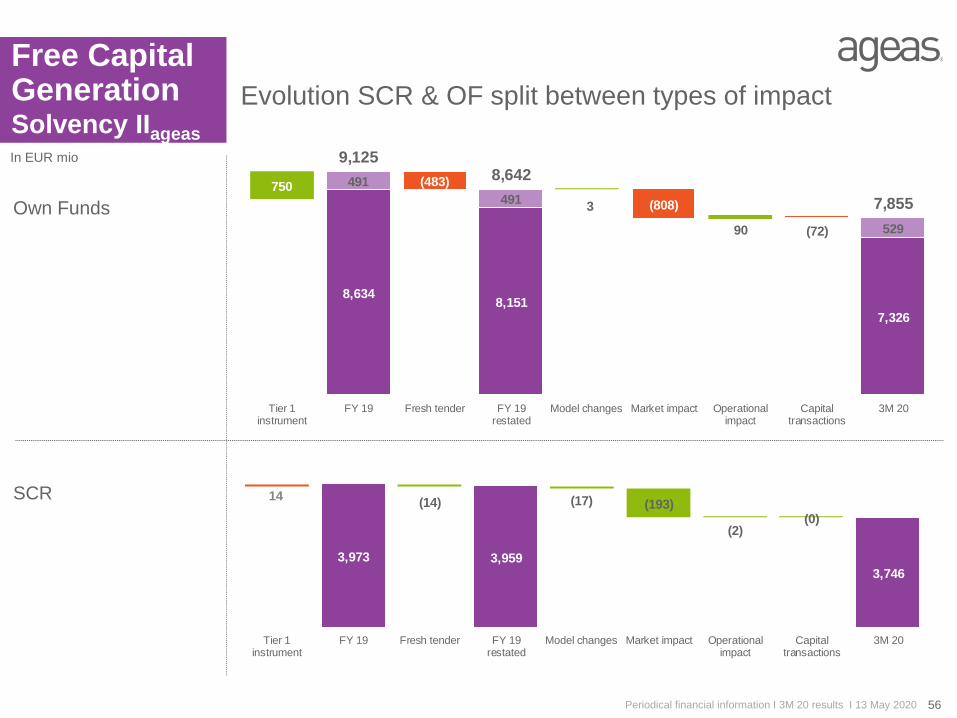
Evolution SCR & OF split between types of impact Solvency IIageas
Own Funds
SCR
In EUR mio
3,973 3,959
3,746
14(14) (17) (193)
(2)(0)
Tier 1instrument
FY 19 Fresh tender FY 19restated
Model changes Market impact Operationalimpact
Capitaltransactions
3M 20
8,6348,151
7,326
491
491
529
750
3
90
(483)
(808)
(72)
9,1258,642
7,855
Tier 1instrument
FY 19 Fresh tender FY 19restated
Model changes Market impact Operationalimpact
Capitaltransactions
3M 20

Free CapitalGeneration
57Periodical financial information I 3M 20 results I 13 May 2020
Operational FCG movement affected by weather & one-off related to step-up internal LPT on segment level
OF SCR FCG
Belgium 144 (6) 155 strong & steady OF generation
despite weather
UK 12 4 5 impacted by weather
CEU 23 (10) 40 SCR supported by step-up to 40%
Reinsurance (12) 26 (58) SCR increase following step-up to 40%
OF impacted by weather
General Account (26) (1) (25)
Group eliminations (51) (16) (22) SCR linked to step-up to 40%
Total Ageas 90 (2) 95 including dividend NCP's
Solvency II scope
Operational YTD
In EUR mio
Solvency IIageas
Solvency
58
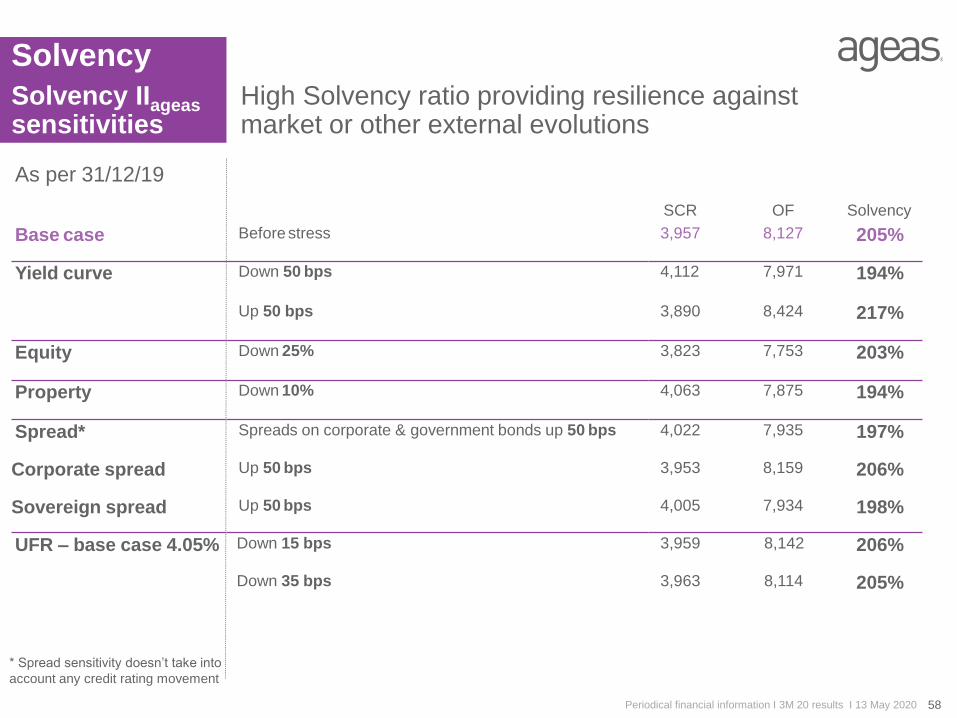
High Solvency ratio providing resilience against market or other external evolutions
Solvency IIageas
sensitivities
As per 31/12/19
SCR OF Solvency
Base case Before stress 3,957 8,127 205%
Yield curve Down 50 bps 4,112 7,971 194%
Up 50 bps 3,890 8,424 217%
Equity Down 25% 3,823 7,753 203%
Property Down 10% 4,063 7,875 194%
Spread* Spreads on corporate & government bonds up 50 bps 4,022 7,935 197%
Corporate spread Up 50 bps 3,953 8,159 206%
Sovereign spread Up 50 bps 4,005 7,934 198%
UFR – base case 4.05% Down 15 bps 3,959 8,142 206%
Down 35 bps 3,963 8,114 205%
* Spread sensitivity doesn’t take into
account any credit rating movement
Periodical financial information I 3M 20 results I 13 May 2020
Solvency
59Periodical financial information I 3M 20 results I 13 May 2020
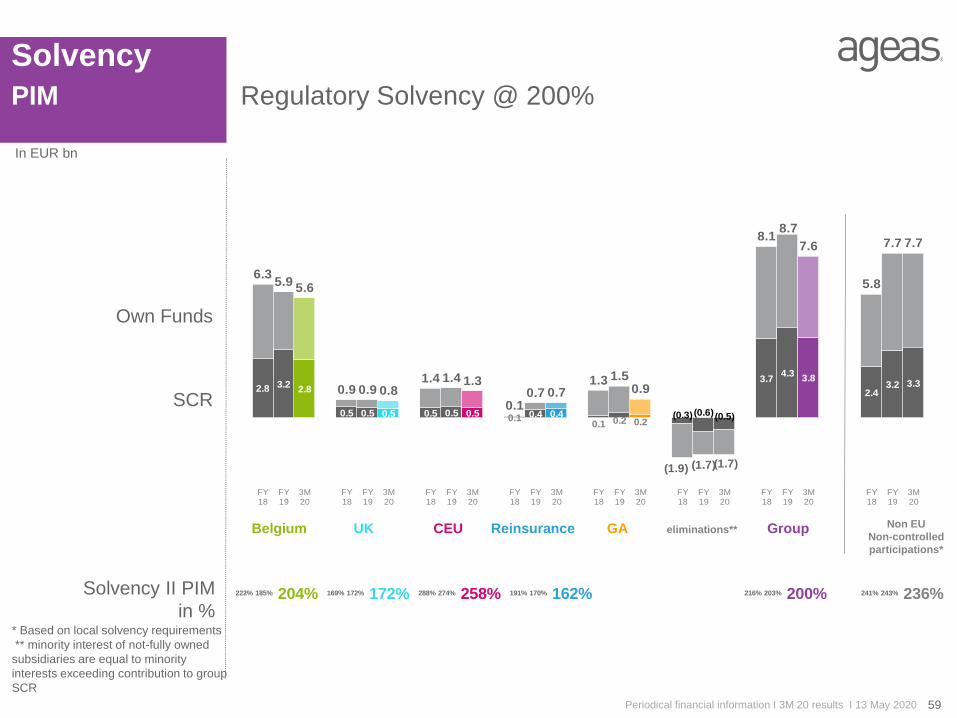
Regulatory Solvency @ 200%PIM
Solvency II PIM
in %
Own Funds
SCR
* Based on local solvency requirements
** minority interest of not-fully owned
subsidiaries are equal to minority
interests exceeding contribution to group
SCR
In EUR bn
Belgium UK CEU Reinsurance GA eliminations** Group Non EU
Non-controlled
participations*
222% 185% 204% 169% 172% 172% 288% 274% 258% 191% 170% 162% 216% 203% 200% 241% 243% 236%
2.8 3.22.8
0.5 0.5 0.5 0.5 0.5 0.50.1 0.4 0.4
0.1 0.2 0.2(0.3)(0.6)(0.5)
3.74.3
3.8
2.43.2 3.3
6.35.9
5.6
0.9 0.9 0.81.4 1.4 1.3
0.10.7 0.7
1.3 1.50.9
(1.9) (1.7)(1.7)
8.18.7
7.6
5.8
7.7 7.7
FY18
FY19
3M20
FY18
FY19
3M20
FY18
FY19
3M20
FY18
FY19
3M20
FY18
FY19
3M20
FY18
FY19
3M20
FY18
FY19
3M20
FY18
FY19
3M20
Solvency
60
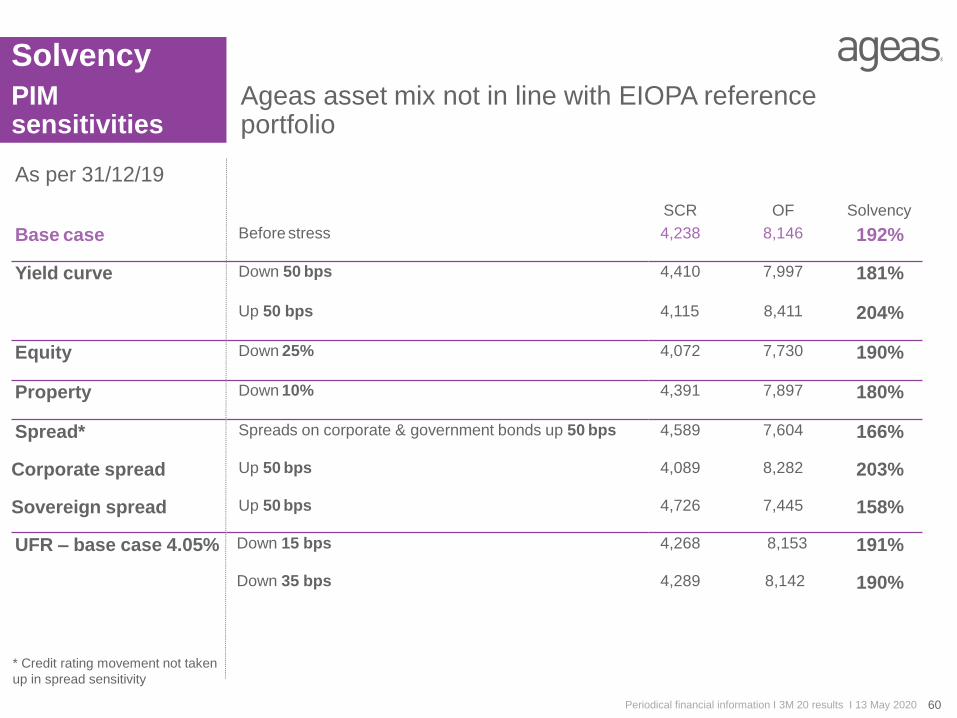
Ageas asset mix not in line with EIOPA reference portfolio
PIMsensitivities
As per 31/12/19
SCR OF Solvency
Base case Before stress 4,238 8,146 192%
Yield curve Down 50 bps 4,410 7,997 181%
Up 50 bps 4,115 8,411 204%
Equity Down 25% 4,072 7,730 190%
Property Down 10% 4,391 7,897 180%
Spread* Spreads on corporate & government bonds up 50 bps 4,589 7,604 166%
Corporate spread Up 50 bps 4,089 8,282 203%
Sovereign spread Up 50 bps 4,726 7,445 158%
UFR – base case 4.05% Down 15 bps 4,268 8,153 191%
Down 35 bps 4,289 8,142 190%
* Credit rating movement not taken
up in spread sensitivity
Periodical financial information I 3M 20 results I 13 May 2020

( 1.4 ) ( 1.5 ) ( 1.5 )
( 1.0 ) ( 1.0 ) ( 0.9 )
( 0.9 ) ( 0.8 ) ( 0.8 )
4.4 4.8 4.3
0.4 0.4
0.4
0.6 0.8
0.7
0.3
0.3
0.3
0.7
0.8
0.8
0.5
0.5
0.5
3.7 4.3
3.8
FY 18 FY 19 3M 20
Non Diversifiable
Non-life UW
Health UW
Life UW
Counterparty Default
Market
Loss-Absorption Deferred Taxes
Loss-Absorption Techn. Liab.
Diversification
Solvency
61Periodical financial information I 3M 20 results I 13 May 2020
Composition of SCR & OFComposition of SCR & OF
Diversification
Loss-Absorption Deferred Taxes
Insurance SCRageas per risk type
Market risk main factor in SCR – decreased
following financial market evolution
Tiering of Group PIM own funds
Q4 Tier 2 included overflow from Tier 1 – down
on Fresh tender
5.6 5.5 5.3
1.4 1.4 1.2
1.0 1.7
1.0
0.1
0.1
0.1
8.1
8.7
7.6
FY 18 FY 19 3M 20
Tier 3
Tier 2
Tier 1 restricted
Tier 1
In EUR bn
62Periodical financial information I 3M 20 results I 13 May 2020
Content
Slides used during analyst call 2
Segment information 15
Equity / Solvency 50
Investment portfolio 62
Legal Settlement 67
General Information 70

Investment portfolio
63Periodical financial information I 3M 20 results I 13 May 2020
Investment portfolio down on lower UG/L
* All assets at fair value except the ‘Held to Maturity’ assets & loans which are valued at amortized costs
Gross UG/L on
Available for Sale
Gross UG/L on Real
Estate
Gross UG/L on Held
to Maturity
Sovereign bonds 38.4
Sovereign bonds 38.1
Corporate bonds 20.8
Corporate bonds 19.8
Structured0.1
Structured0.1
Loans11.1
Loans11.7
Equities 4.6 Equities 4.2
Real Estate5.6
Real Estate5.6
Cash 3.7Cash 2.7
84.382.2
FY 19 3M 20
Total portfolio: at EUR 7.3 bn (vs. EUR 8.7 bn)
Fixed income: at EUR 7.0 bn (vs. EUR 7.9 bn)
° Sovereigns at EUR 6.3 bn (vs. EUR 6.4 bn)
° Corporates at EUR 0.8 bn (vs. EUR 1.5 bn)
Equities: at EUR 0.2 bn (vs. EUR 0.8 bn)
at EUR 1.9 bn
• not reflected in shareholders’ equity
Up to EUR 2.5 bn (vs. EUR 2.4 bn)
• not reflected in shareholders’ equity
Ageas Group has joined the commitment to incorporate ESG issues into its investment analysis
and decisions and signed on behalf of all its consolidated entities the UN PRI
In EUR bn

Investment portfolio
64Periodical financial information I 3M 20 results I 13 May 2020
Value fixed income assets down on lower UG/L
* All assets at fair value except the ‘Held to Maturity’ assets & loans which are valued at amortized costs
Belgium18.5
Belgium18.6
France 6.3 France 6.3
Austria 2.7 Austria 2.6
Portugal 2.8 Portugal 2.8
Spain 2.2 Spain 2.2Italy, 1.5 Italy, 1.5
Germany 1.2 Germany 1.1Ireland 0.5 Ireland 0.4
Other 2.6 Other 2.5
38.4 38.1
FY 19 3M 20
Gross UG/L at EUR 6.3 bn (vs. EUR
6.4 bn)
99.9% investment grade; 84% rated
A or higher
Belgium duration gap close to zero
– matched portfolio
Sovereign bond
portfolio*
In EUR bn
Loan portfolio
(customers & banks)*
Other: mostly government related loans
benefiting from an explicit guarantee by
the Belgian regions or the French State
Loans to banks 0.6Loans to banks 0.9
RE 0.2RE 0.2
Infrastructure1.1
Infrastructure 1.2Mortgages 1.2Mortgages 1.2
Other 8.0Other 8.2
11.111.7
FY 19 3M 20
Investment portfolio
65Periodical financial information I 3M 20 results I 13 May 2020
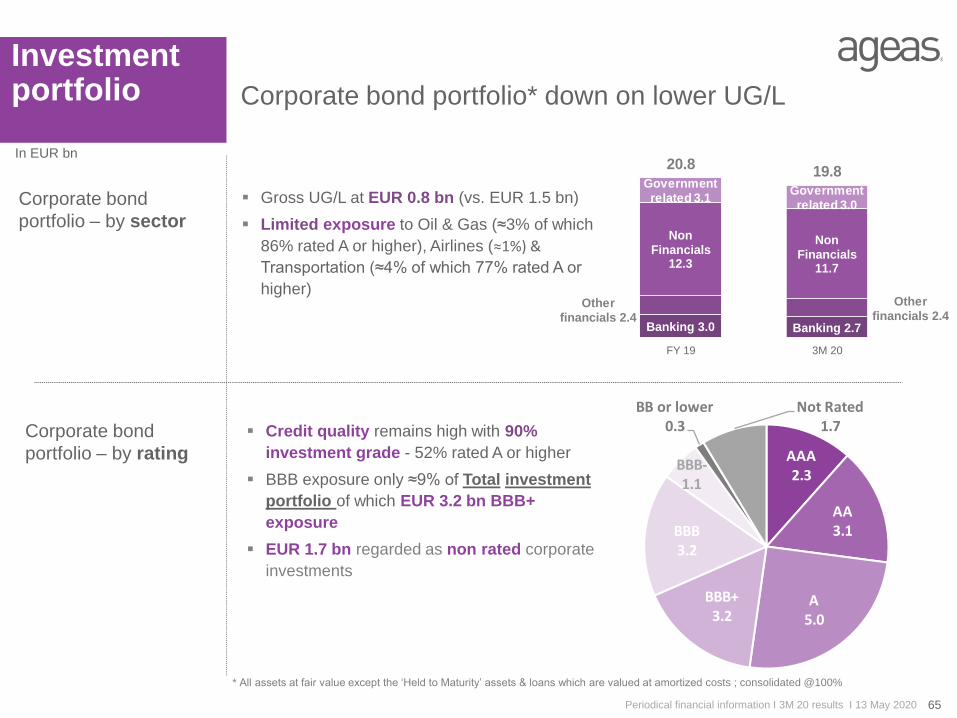
Corporate bond portfolio* down on lower UG/L
* All assets at fair value except the ‘Held to Maturity’ assets & loans which are valued at amortized costs ; consolidated @100%
Corporate bond
portfolio – by sector
Banking 3.0 Banking 2.7
Other financials 2.4
Other financials 2.4
Non Financials
12.3
Non Financials
11.7
Government related 3.1
Government related 3.0
20.819.8
FY 19 3M 20
Gross UG/L at EUR 0.8 bn (vs. EUR 1.5 bn)
Limited exposure to Oil & Gas (≈3% of which
86% rated A or higher), Airlines (≈1%) &
Transportation (≈4% of which 77% rated A or
higher)
In EUR bn
Corporate bond
portfolio – by rating
Credit quality remains high with 90%
investment grade - 52% rated A or higher
BBB exposure only ≈9% of Total investment
portfolio of which EUR 3.2 bn BBB+
exposure
EUR 1.7 bn regarded as non rated corporate
investments
AAA 2.3
AA3.1
A5.0
BBB+ 3.2
BBB3.2
BBB-1.1
BB or lower0.3
Not Rated1.7

Investment portfolio
66Periodical financial information I 3M 20 results I 13 May 2020
In EUR bn
* All assets at fair value except the ‘Held to Maturity’ assets & loans which are valued at amortized costs
Equity portfolio* Gross UG/L at EUR 0.2 bn (vs. EUR 0.8 bn)
Equities 2.4Equities 1.9
Equity funds0.5
Equity funds0.4
RE funds 0.9
RE funds 0.9
Mixed funds & others 0.8
Mixed funds & others 1.0
4.6
4.2
FY 19 3M 20
Real estate portfolio* Exposure mainly in Belgium
Gross UG/L at EUR 1.9 bn (not reflected
in shareholders’ equity but contributing to
available capital for solvency calculation)
Investment Offices 2.6
Investment Offices 2.6
Car Parks1.3
Car Parks1.3
Investment Retail 1.2
Investment Retail 1.2
RE Development0.3
RE Development0.3
Invest. Warehouses0.3
Invest. Warehouses0.3
5.6 5.6
FY 19 3M 20
Equity portfolio* down on lower UG/L
67Periodical financial information I 3M 20 results I 13 May 2020
Content
Slides used during analyst call 2
Segment information 15
Equity / Solvency 50
Investment portfolio 62
Legal Settlement 67
General Information 70

Legal
68Periodical financial information I 3M 20 results I 13 May 2020
Settlement in full execution mode
Ageas offers to pay EUR 1.2 bn compensation – additional effort of EUR 0.1 bn announced
16/10/2017
Cash impact of EUR 1.0 bn
No recognition of any wrongdoing by Ageas
Commitment by eligible shareholders to abandon any ongoing civil proceeding & not to start
any legal proceeding related to the events
Publication of binding declaration notice on 27/07/2018 launched execution of the settlement
Early filing & opt-out period ended on 31/12/2018
Limited number of opt-outs received for ≈1% of total settlement amount
Computershare Investor Services plc acting as independent claims administrator
Further information available on www.FORsettlement.com
≈290K claims received of which ≈221K have received early payment as at end of April 2020
End of Q1 2020 ≈EUR 725 mio compensation paid to eligible shareholders of which EUR 140
mio coming from D&O insurers – Additional ≈EUR 18 mio paid in April 2020
Due to higher than expected number of claims, dilution likely in certain cases
70% of estimated per share compensation guaranteed for claimants filing before 31/12/2018
Claims validation and payments to continue in 2020
Announcement
14/03/2016
Court’s decision to declare the settlement binding on 13/07/2018
Binding declaration and
claims filing period
Claims validation &
payments ongoing
Claims filing ended on 28/07/2019

Legal
69Periodical financial information I 3M 20 results I 13 May 2020
Proceedings related to the past that remain outstanding
Administrative proceedings
Criminal investigation
Civil proceedings
Other proceedings
None
Public prosecutor has announced discontinuation of proceeding
Public prosecutor has sent his proposal to Chambre du Conseil on referral
Written submissions are being exchanged
Hearing session before the Chambre du Conseil scheduled on 8 and 9 June 2020
Opt-out cases from settlement
Limited number of opt-outers for ≈1% of settlement amount
Patrinvest: first instance in favour of Ageas, appeal filed by plaintiff
Mr. Modrikamen: suspended awaiting outcome criminal procedure
MCS: Appeal Court ruled in favour of Ageas, appellants filed appeal before Supreme
Court

70Periodical financial information I 3M 20 results I 13 May 2020
Slides used during analyst call 2
Segment information 18
Equity / Solvency 53
Investment portfolio 65
Legal Settlement 70
General Information 73
Content

Outstandingshares
71Periodical financial information I 3M 20 results I 13 May 2020
Reclassification of 2.6 mio treasury shares following tender on the FRESH securities
* After deduction of shares for management plans
situation 31/12/2019 situation 31/03/2020 situation 11/05/2020
198,374,327 198,374,327 198,374,327
11,747,866 13,355,195 14,126,552
3,820,753 5,428,082 6,199,439
3,968,254 1,369,048 1,369,048
0 2,599,206 2,599,206
3,958,859 3,958,859 3,958,859
186,626,461 185,019,132 184,247,775
Total Issued Shares
Shares not entitled to dividend nor voting rights
1. TREASURY SHARES Share buy-back
FRESH
Other treasury shares
2. CASHES
Shares entitled to dividend & voting rights
*

Shareholdersstructure
72Periodical financial information I 3M 20 results I 13 May 2020
Ageas5.1%
Ping An
BlackRock, Inc.
FosunIdentified retail
investors22%
Identified institutional investors
48%
Other investors
14%
Based upon press release 11 May 2020
Based upon the number of shares mentioned in the notification received 6 May 2013
Based upon the number of shares mentioned in the notification received 6 April 2020
Based upon the number of shares mentioned in the notification received 16 May 2019
Estimate by
Estimate by
Ageas
Ping An
BlackRock, Inc.
Fosun
Identified retail investors
Identified institutional investors

Ratings
73Periodical financial information I 3M 20 results I 13 May 2020
S&P MOODY'S FITCH
Operating entities AG Insurance (Belgium) A / positive A2 / stable* A+ / stable
Last review 21/11/19 13/12/19 29/04/20
unsollicited
Ageas Insurance Limited A / positive A+ / stable
Last review 21/11/19 29/04/20
Muang Thai Life BBB+ / Stable A- / negative
Last review 15/04/20 08/05/20
Etiqa Insurance Berhad (Malaysia) A / stable
Last review 06/05/20
China Taiping Life A+ / stable
Last review 16/03/20
Holding ageas SA/NV A / positive A3 / stable* A+ / stable
Last review 21/11/19 13/12/19 29/04/20
unsollicited
* Ageas has requested in early 2009 that this rating should be withdrawn. Ageas no longer participates in Moody's credit rating process.
Ageas does not provide, for purposes of Moody's rating, access to the books, records and other relevant internal documents of these rated entities.

74Periodical financial information I 3M 20 results I 13 May 2020
Certain of the statements contained herein are statements of
future expectations and other forward-looking statements that are
based on management's current views and assumptions and involve
known and unknown risks and uncertainties that could cause actual
results, performance or events to differ materially from those
expressed or implied in such statements. Future actual results,
performance or events may differ materially from those in such
statements due to, without limitation, (i) general economic conditions,
including in particular economic conditions in Ageas’s core markets,
(ii) performance of financial markets, (iii) the frequency and severity
of insured loss events, (iv) mortality and morbidity levels and trends,
(v) persistency levels, (vi) interest rate levels, (vii) currency exchange
rates, (viii) increasing levels of competition, (ix) changes in laws and
regulations, including monetary convergence and the Economic and
Monetary Union, (x) changes in the policies of central banks and/or
foreign governments and (xi) general competitive factors, in each
case on a global, regional and/or national basis. In addition, the
financial information contained in this presentation, including the pro
forma information contained herein, is unaudited and is provided for
illustrative purposes only. It does not purport to be indicative of what
the actual results of operations or financial condition of Ageas and its
subsidiaries would have been had these events occurred or
transactions been consummated on or as of the dates indicated, nor
does it purport to be indicative of the results of operations or financial
condition that may be achieved in the future.
Investor Relations
Tel:
E-mail:
Website:
+ 32 2 557 57 32
www.ageas.com