Embed Size (px)
Citation preview
28
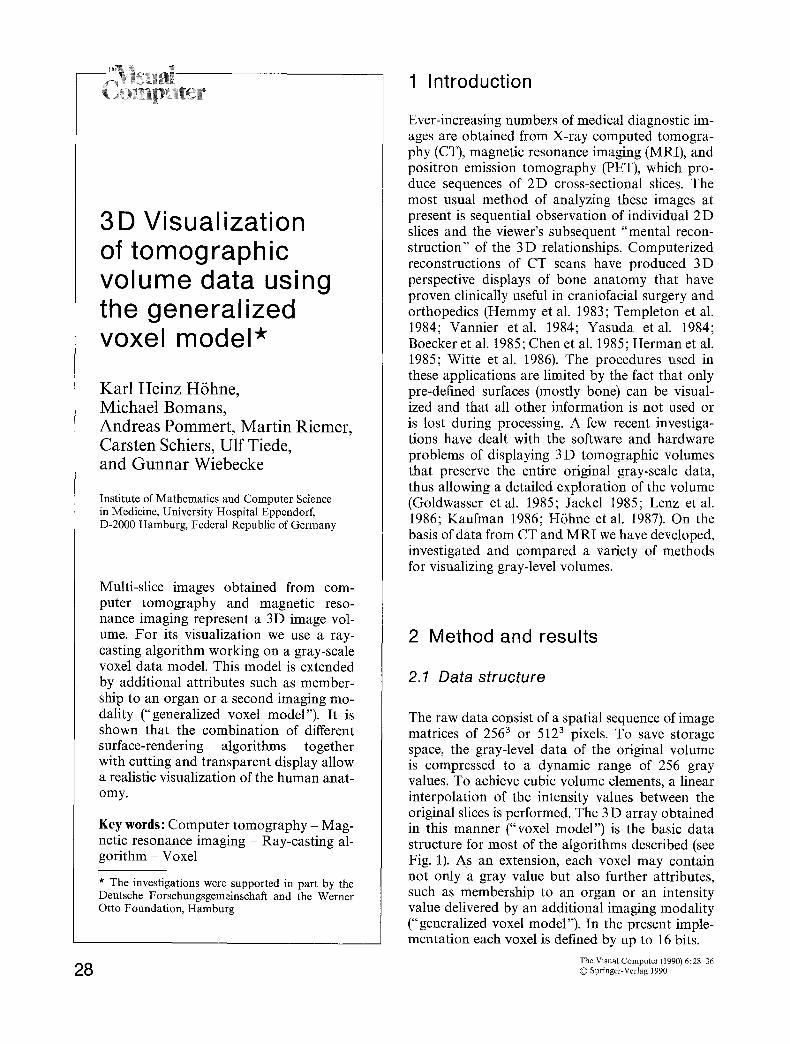
3 D Visual ization of tomographic volume data using the generalized voxel model*
Karl Heinz H6hne, Michael Bomans, Andreas Pommert, Martin Riemer, Carsten Schiers, Ulf Tiede, and Gunnar Wiebecke
Institute of Mathematics and Computer Science in Medicine, University Hospital Eppendorf, D-2000 Hamburg, Federal Republic of Germany
Multi-slice images obtained from com- puter tomography and magnetic reso- nance imaging represent a 3D image vol- ume. For its visualization we use a ray- casting algorithm working on a gray-scale voxel data model. This model is extended by additional attributes such as member- ship to an organ or a second imaging mo- dality ("generalized voxel model"). It is shown that the combination of different surface-rendering algorithms together with cutting and transparent display allow a realistic visualization of the human anat- omy.
Key words: Computer tomography - Mag- netic resonance imaging Ray-casting al- gorithm - Voxel
* The investigations were supported in part by the Deutsche Forschungsgemeinschaft and the Werner Otto Foundation, Hamburg
1 Introduction
Ever-increasing numbers of medical diagnostic im- ages are obtained from X-ray computed tomogra- phy (CT), magnetic resonance imaging (MRI), and positron emission tomography (PET), which pro- duce sequences of 2D cross-sectional slices. The most usual method of analyzing these images at present is sequential observation of individual 2D slices and the viewer's subsequent "mental recon- struction" of the 3 D relationships. Computerized reconstructions of CT scans have produced 3D perspective displays of bone anatomy that have proven clinically useful in craniofacial surgery and orthopedics (Hemmy et al. 1983; Templeton et al. 1984; Vannier etal. 1984; Yasuda etal. 1984; Boecker et al. 1985; Chen et al. 1985; Herman et al. 1985; Witte et al. 1986). The procedures used in these applications are limited by the fact that only pre-defined surfaces (mostly bone) can be visual- ized and that all other information is not used or is lost during processing. A few recent investiga- tions have dealt with the software and hardware problems of displaying 3 D tomographic volumes that preserve the entire original gray-scale data, thus allowing a detailed exploration of the volume (Goldwasser et al. 1985; Jackel 1985; Lenz et al. 1986; Kaufman 1986; H6hne et al. 1987). On the basis of data from CT and MRI we have developed, investigated and compared a variety of methods for visualizing gray-level volumes.
2 Method and results
2.1 Data structure
The raw data consist of a spatial sequence of image matrices of 2563 or 5123 pixels. To save storage space, the gray-level data of the original volume is compressed to a dynamic range of 256 gray values. To achieve cubic volume elements, a linear interpolation of the intensity values between the original slices is performed. The 3 D array obtained in this manner ("voxel model") is the basic data structure for most of the algorithms described (see Fig. 1). As an extension, each voxel may contain not only a gray value but also further attributes, such as membership to an organ or an intensity value delivered by an additional imaging modality ("generalized voxel model"). In the present imple- mentation each voxel is defined by up to 16 bits.
The Visual Computer (1990) 6:28-36 �9 Springer-Verlag 1990
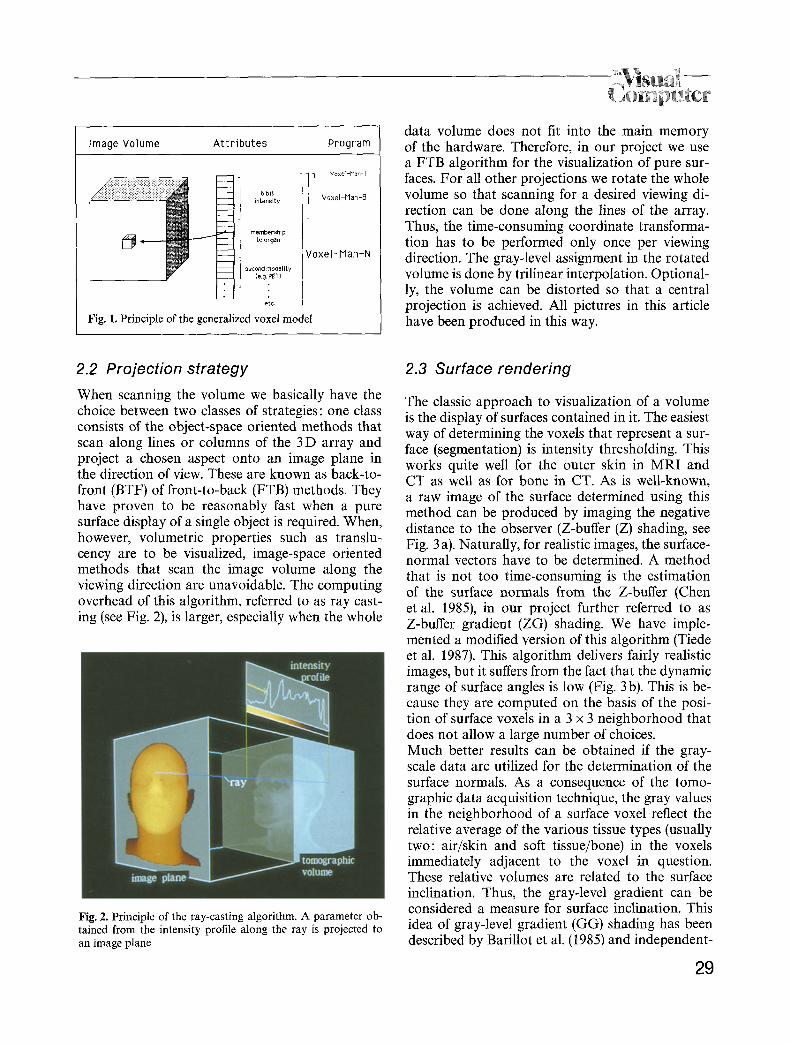
Image Volume Attributes Program
-I -- 6 bit ~_Z intensity
1 moob. .,o to organ
) second modality ~ _ _ (e.g. PET)
�9 e'tc
Fig. 1. Principle of the generalized voxel model
] Vo>:el-Man ~I
Voxel-Man-8
Voxel-Man-N
data volume does not fit into the main memory of the hardware. Therefore, in our project we use a FTB algorithm for the visualization of pure sur- faces. For all other projections we rotate the whole volume so that scanning for a desired viewing di- rection can be done along the lines of the array. Thus, the time-consuming coordinate transforma- tion has to be performed only once per viewing direction. The gray-level assignment in the rotated volume is done by trilinear interpolation. Optional- ly, the volume can be distorted so that a central projection is achieved. All pictures in this article have been produced in this way.
2.2 Projection strategy
When scanning the volume we basically have the choice between two classes of strategies: one class consists of the object-space oriented methods that scan along lines or columns of the 3 D array and project a chosen aspect onto an image plane in the direction of view. These are known as back-to- front (BTF) of front-to-back (FTB) methods. They have proven to be reasonably fast when a pure surface display of a singl e object is required. When, however, volumetric properties such as translu- cency are to be visualized, image-space oriented methods that scan the image volume along the viewing direction are unavoidable. The computing overhead of this algorithm, referred to as ray cast- ing (see Fig. 2), is larger, especially when the whole
Fig. 2. Principle of the ray-casting algorithm. A parameter ob- tained from the intensity profile along the ray is projected to an image plane
2.3 Surface rendering
The classic approach to visualization of a volume is the display of surfaces contained in it. The easiest way of determining the voxels that represent a sur- face (segmentation) is intensity thresholding. This works quite well for the outer skin in MRI and CT as well as for bone in CT. As is well-known, a raw image of the surface determined using this method can be produced by imaging the negative distance to the observer (Z-buffer (Z) shading, see Fig. 3 a). Naturally, for realistic images, the surface- normal vectors have to be determined. A method that is not too time-consuming is the estimation of the surface normals from the Z-buffer (Chen et al. 1985), in our project further referred to as Z-buffer gradient (ZG) shading. We have imple- mented a modified version of this algorithm (Tiede et al. 1987). This algorithm delivers fairly realistic images, but it suffers from the fact that the dynamic range of surface angles is low (Fig. 3 b). This is be- cause they are computed on the basis of the posi- tion of surface voxels in a 3 x 3 neighborhood that does not allow a large number of choices. Much better results can be obtained if the gray- scale data are utilized for the determination of the surface normals. As a consequence of the tomo- graphic data acquisition technique, the gray values in the neighborhood of a surface voxel reflect the relative average of the various tissue types (usually two: air/skin and soft tissue/bone) in the voxels immediately adjacent to the voxel in question. These relative volumes are related to the surface inclination. Thus, the gray-level gradient can be considered a measure for surface inclination. This idea of gray-level gradient (GG) shading has been described by Barillot et al. (1985) and independent-
29
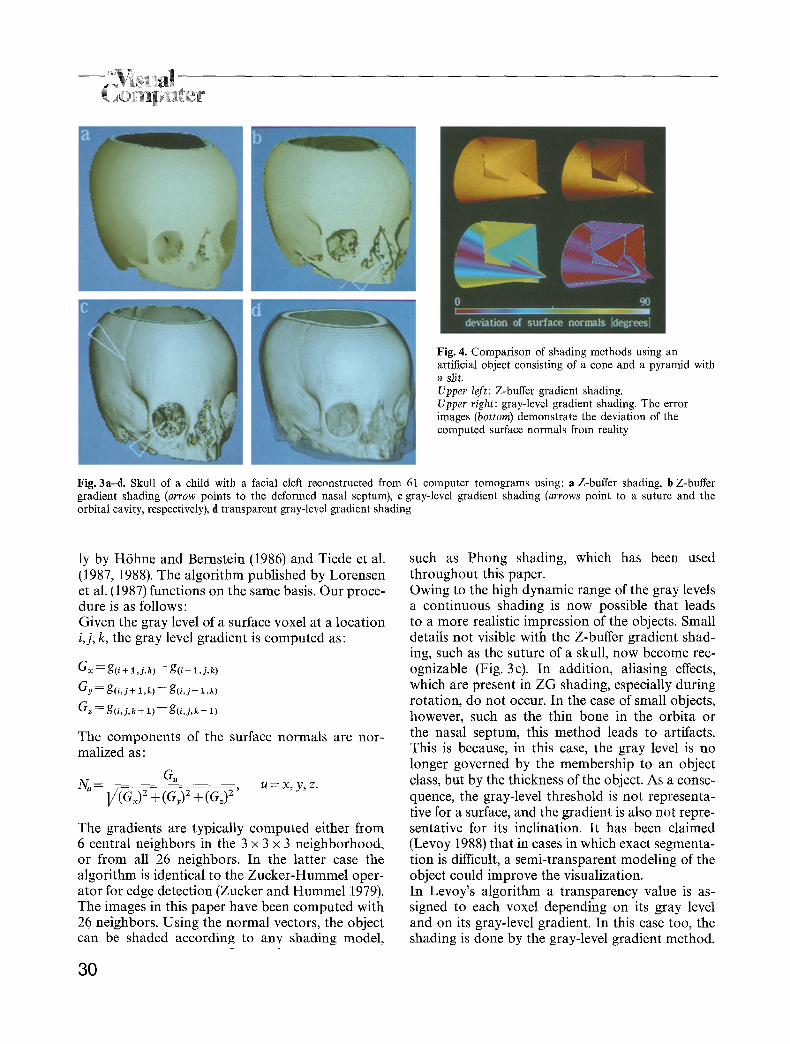
Fig. 4. Comparison of shading methods using an artificial object consisting of a cone and a pyramid with a slit. Upper left: Z-buffer gradient shading. Upper right: gray-level gradient shading. The error images (bottom) demonstrate the deviation of the computed surface normals from reality
Fig. 3a-d. Skull of a child with a facial cleft reconstructed from 61 computer tomograms using: a Z-buffer shading, b Z-buffer gradient shading (arrow points to the deformed nasal septum), c gray-level gradient shading (arrows point to a suture and t h e orbital cavity, respectively), d transparent gray-level gradient shading
ly by H6hne and Bernstein (1986) and Tiede et al. (1987, 1988). The algorithm published by Lorensen et al. (1987) functions on the same basis. Our proce- dure is as follows: Given the gray level of a surface voxel at a location i,j, k, the gray level gradient is computed as:
Gx = g(i + 1,j,k)-- g ( i - 1,j,k)
Gy = g(i,j+ 1 ,k) - - g ( i , j - 1 ,k)
G~ = g(i , j ,k + 1) - - g(i , j ,k - 1)
The components of the surface normals are nor- malized as:
G, N, - l/(Gx) 2 + (G,) 2 + (G~) 2 , u = x, y, z.
The gradients are typically computed either from 6 central neighbors in the 3 x 3 x 3 neighborhood, or from all 26 neighbors. In the latter case the algorithm is identical to the Zucker-Hummel oper- ator for edge detection (Zucker and Hummel 1979). The images in this paper have been computed with 26 neighbors. Using the normal vectors, the object can be shaded according to any shading model,
30
such as Phong shading, which has been used throughout this paper. Owing to the high dynamic range of the gray levels a continuous shading is now possible that leads to a more realistic impression of the objects. Small details not visible with the Z-buffer gradient shad- ing, such as the suture of a skull, now become rec- ognizable (Fig. 3c). In addition, aliasing effects, which are present in ZG shading, especially during rotation, do not occur. In the case of small objects, however, such as the thin bone in the orbita or the nasal septum, this method leads to artifacts. This is because, in this case, the gray level is no longer governed by the membership to an object class, but by the thickness of the object. As a conse- quence, the gray-level threshold is not rePresenta- tive for a surface, and the gradient is also not repre- sentative for its inclination. It has been claimed (Levoy 1988) that in cases in which exact segmenta- tion is difficult, a semi-transparent modeling of the object could improve the visualization. In Levoy's algorithm a transparency value is as- signed to each voxel depending on its gray level and on its gray-level gradient. In this case too, the shading is done by the gray-level gradient method.
. emp ter Our preliminary experience with this transparent gray level gradient (TGG) shading method shows that small details on an otherwise compact surface (e.g., bone sutures) can show up very well (see Fig. 3 d). However, really problematic regions, such as the orbital cavity or the deformed nasal septum, are not recognized any better, although the image looks smoother. An additional problem with the TGG method is that two parameters can be chosen arbitrarily: the assignment of a transparency to the gray levels and the weight of the gradient. In this manner, a very broad spectrum of visual impres- sions can be obtained from a single object and it is difficult to decide which are the most accurate. Since it is obviously difficult to evaluate surface- rendering algorithms without being able to recog- nize the true surface, we have started a study on the quantification of image quality. Geometrically simulated objects undergo the same data acquisi- tion and processing steps as the real ones. Global and local error measures for the surface location and inclination are computed. Figure 4 shows an error image of the surface normals for an object shaded with Z-buffer gradient or GG shading, re- spectively. From this image we infer that GG shad- ing involves a much lower error rate, yields smooth surfaces, and even visualizes a slit 0.5 voxels wide. Despite the large numerical errors, the Z-buffer gradient image represents the shape of the object very well. The slit, however, is not recognizable. For further results we refer to Pommert et al. (1989a, b).
2.4 Cut planes
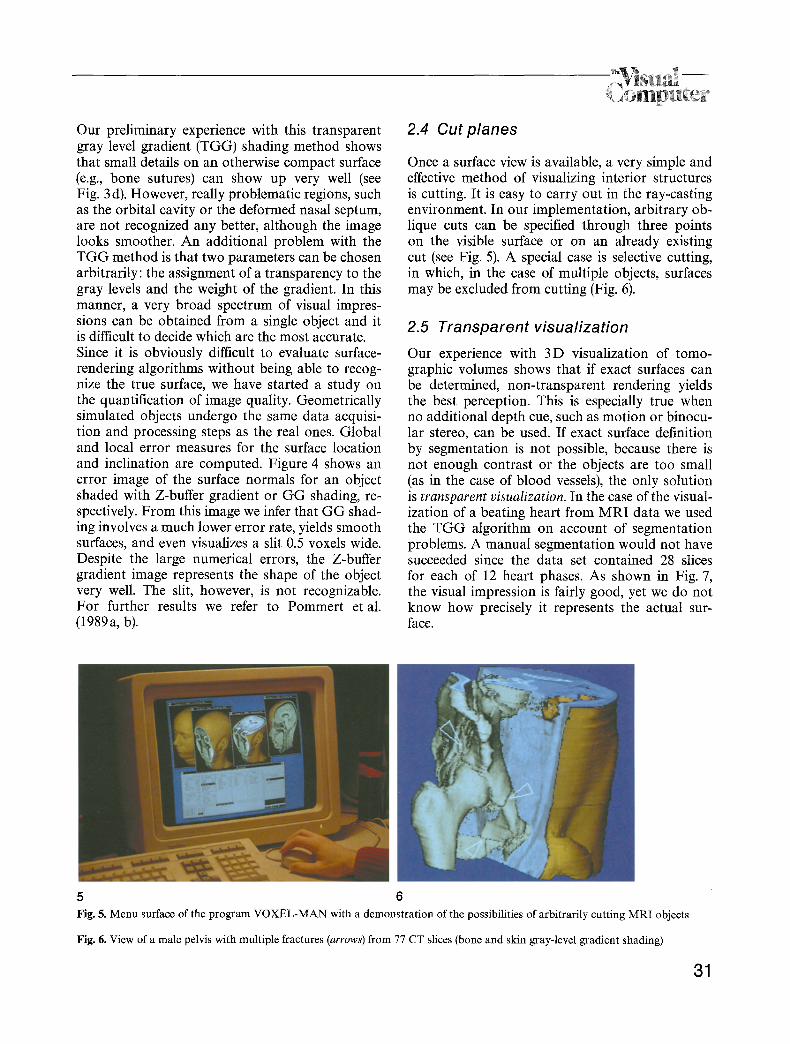
Once a surface view is available, a very simple and effective method of visualizing interior structures is cutting. It is easy to carry out in the ray-casting environment. In our implementation, arbitrary ob- lique cuts can be specified through three points on the visible surface or on an already existing cut (see Fig. 5). A special case is selective cutting, in which, in the case of multiple objects, surfaces may be excluded from cutting (Fig. 6).
2.5 Transparent visualization
Our experience with 3D visualization of tomo- graphic volumes shows that if exact surfaces can be determined, non-transparent rendering yields the best perception. This is especially true when no additional depth cue, such as motion or binocu- lar stereo, can be used. If exact surface definition by segmentation is not possible, because there is not enough contrast or the objects are too small (as in the case of blood vessels), the only solution is transparent visualization. In the case of the visual- ization of a beating heart from MRI data we used the TGG algorithm on account of segmentation problems. A manual segmentation would not have succeeded since the data set contained 28 slices for each of 12 heart phases. As shown in Fig. 7, the visual impression is fairly good, yet we do not know how precisely it represents the actual sur- face.
5 6 Fig. 5. Menu surface of the program VOXEL-MAN with a demonstration of the possibilities of arbitrarily cutting MRI objects
Fig. 6. View of a male pelvis with multiple fractures (arrows) from 77 CT slices (bone and skin gray-level gradient shading)
31
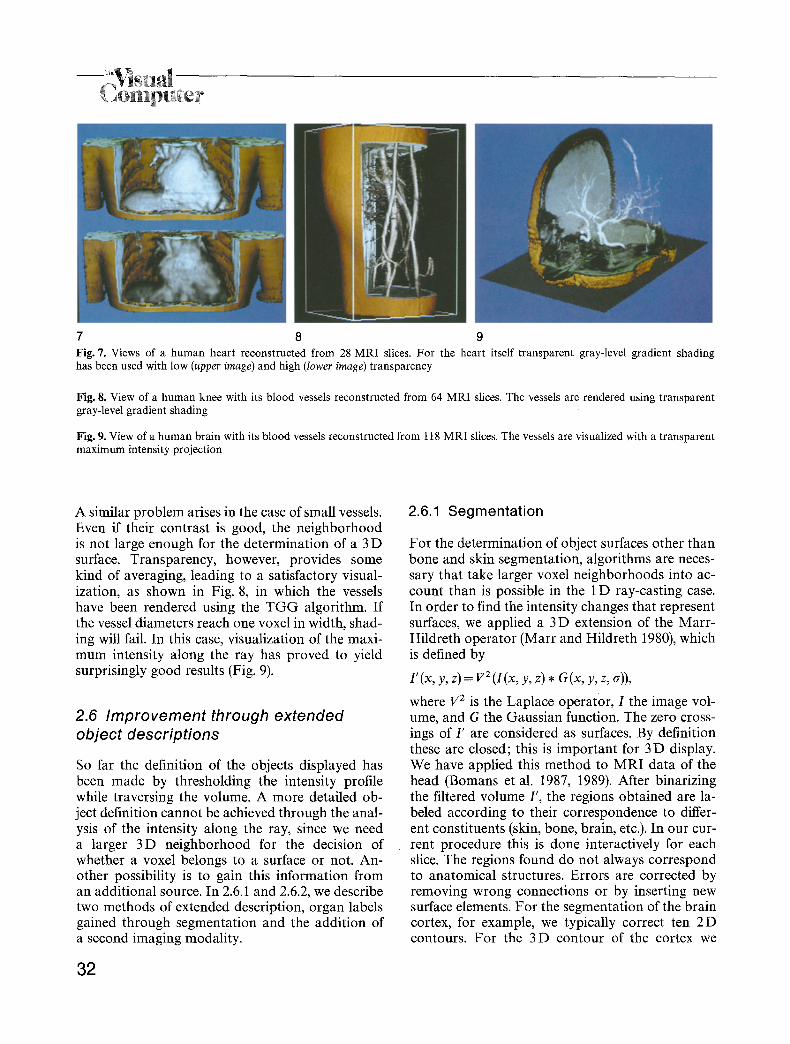
7 8 9 Fig. 7. Views of a human heart reconstructed from 28 MRI slices. For the heart itself transparent gray-level gradient shading has been used with low (upper image) and high (lower image) transparency
Fig. 8, View of a human knee with its blood vessels reconstructed from 64 MRI slices. The vessels are rendered using transparent gray-level gradient shading
Fig. 9. View of a human brain with its blood vessels reconstructed from 118 MRI slices. The vessels are visualized with a transparent maximum intensity projection
A similar problem arises in the case of small vessels. Even if their contrast is good, the neighborhood is not large enough for the determination of a 3 D surface. Transparency, however, provides some kind of averaging, leading to a satisfactory visual- ization, as shown in Fig. 8, in which the vessels have been rendered using the TGG algorithm. If the vessel diameters reach one voxel in width, shad- ing will fail. In this case, visualization of the maxi- mum intensity along the ray has proved to yield surprisingly good results (Fig. 9).
2.6 Improvement through extended object descriptions
So far the definition of the objects displayed has been made by thresholding the intensity profile while traversing the volume. A more detailed ob- ject definition cannot be achieved through the anal- ysis of the intensity along the ray, since we need a larger 3D neighborhood for the decision of whether a voxel belongs to a surface or not. An- other possibility is to gain this information from an additional source. In 2.6.1 and 2.6.2, we describe two methods of extended description, organ labels gained through segmentation and the addition of a second imaging modality.
32
2.6.1 Segmentation
For the determination of object surfaces other than bone and skin segmentation, algorithms are neces- sary that take larger voxel neighborhoods into ac- count than is possible in the 1 D ray-casting case. In order to find the intensity changes that represent surfaces, we applied a 3 D extension of the Marr- Hildreth operator (Marr and Hildreth 1980), which is defined by
l '(x, y, z)= v i ( I (x , y, z) * G(x, y, z, ~)),
where 172 is the Laplace operator, 1 the image vol- ume, and G the Gaussian function. The zero cross- ings of I' are considered as surfaces. By definition these are closed; this is important for 3D display. We have applied this method to MRI data of the head (Bomans et al. 1987, 1989). After binarizing the filtered volume I', the regions obtained are la- beled according to their correspondence to differ- ent constituents (skin, bone, brain, etc.). In our cur- rent procedure this is done interactively for each slice. The regions found do not always correspond to anatomical structures. Errors are corrected by removing wrong connections or by inserting new surface elements. For the segmentation of the brain cortex, for example, we typically correct ten 2D contours. For the 3D contour of the cortex we
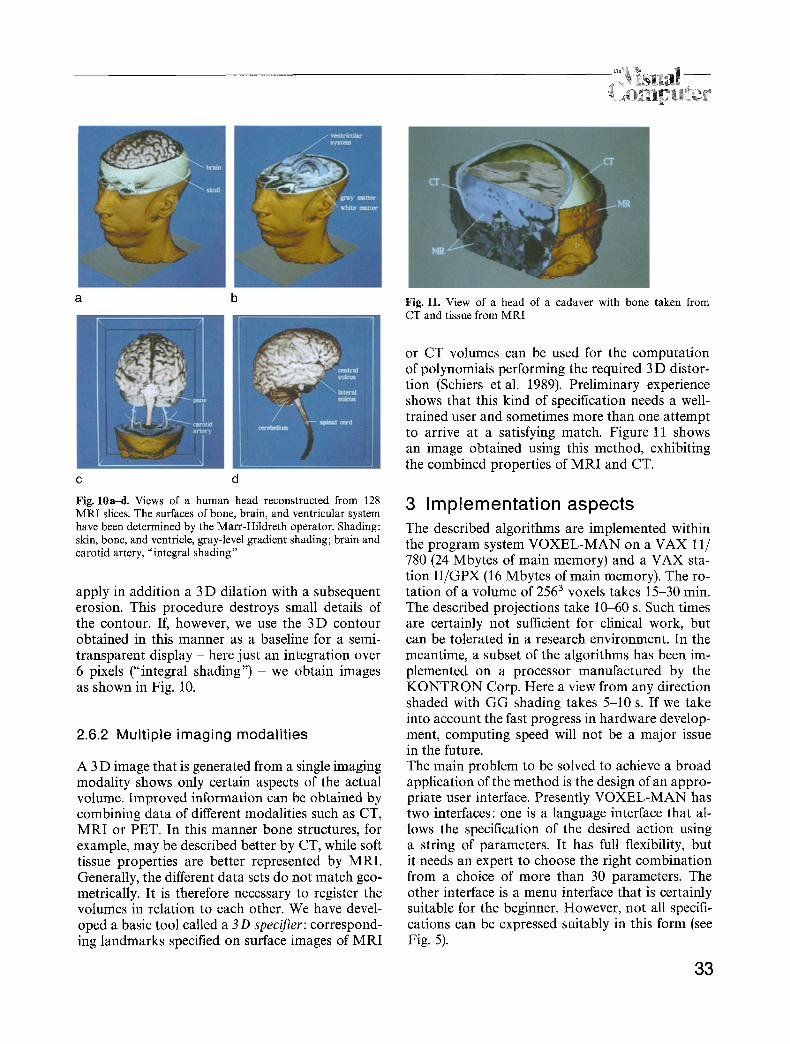
a b Fig. 11. View of a head of a cadaver with bone taken from CT and tissue from MRI
c d
Fig. 10ad. Views of a human head reconstructed from 128 MRI slices. The surfaces of bone, brain, and ventricular system have been determined by the Marr-Hildreth operator. Shading: skin, bone, and ventricle, gray-level gradient shading; brain and carotid artery, "integral shading"
apply in addition a 3 D dilation with a subsequent erosion. This procedure destroys small details of the contour. If, however, we use the 3D contour obtained in this manner as a baseline for a semi- transparent display - here just an integration over 6 pixels ("integral shading") - we obtain images as shown in Fig. 10.
2.6.2 Multiple imaging modalities
A 3 D image that is generated from a single imaging modality shows only certain aspects of the actual volume. Improved information can be obtained by combining data of different modalities such as CT, MRI or PET. In this manner bone structures, for example, may be described better by CT, while soft tissue properties are better represented by MRI. Generally, the different data sets do not match geo- metrically. It is therefore necessary to register the volumes in relation to each other. We have devel- oped a basic tool called a 3D specifier: correspond- ing landmarks specified on surface images of MRI
or CT volumes can be used for the computation of polynomials performing the required 3 D distor- tion (Schiers et al. 1989). Preliminary experience shows that this kind of specification needs a well- trained user and sometimes more than one attempt to arrive at a satisfying match. Figure 11 shows an image obtained using this method, exhibiting the combined properties of MRI and CT.
3 Implementation aspects The described algorithms are implemented within the program system VOXEL-MAN on a VAX 11/ 780 (24 Mbytes of main memory) and a VAX sta- tion I I /GPX (16 Mbytes of main memory). The ro- tation of a volume of 2563 voxels takes 15-30 min. The described projections take 10-60 s. Such times are certainly not sufficient for clinical work, but can be tolerated in a research environment. In the meantime, a subset of the algorithms has been im- plemented on a processor manufactured by the K O N T R O N Corp. Here a view from any direction shaded with G G shading takes 5-10 s. If we take into account the fast progress in hardware develop- ment, computing speed will not be a major issue in the future. The main problem to be solved to achieve a broad application of the method is the design of an appro- priate user interface. Presently VOXEL-MAN has two interfaces: one is a language interface that al- lows the specification of the desired action using a string of parameters. It has full flexibility, but it needs an expert to choose the right combination from a choice of more than 30 parameters. The other interface is a menu interface that is certainly suitable for the beginner. However, not all specifi- cations can be expressed suitably in this form (see Fig. 5).
33
4 Applications
3D Imaging, especially of bone, has for several years proved to be useful in craniofacial surgery (Fig. 3), t raumatology (Fig. 6), and orthopedics. The possibilities shown in this paper lend them- selves to further applications. In diagnostic radiology the assessment of arbitrary cross sections is facilitated. Al though of course ra- diologists are well accustomed to mentally project- ing 3 D visualizations from multiple 2D images, these techniques facilitate rapid and sure orienta- tion, particularly in instances where the angle of slice is unusual or unconventional. Once the outer surface and/or bone is visibly defined in three di- mensions, the viewer can always be sure about the position of the cross section he is looking at. It is obvious that neurosurgical therapy will bene- fit. The relationships between regions to be treated (e.g., tumors) and those which have to be conserved (e.g., blood vessels) can be assessed prior to an op- eration (Figs. 8, 9). For broader applications, how- ever, the procedures are still too complicated. The high realism of the images gained from living persons makes them suited for computer-aided teaching in anatomy. Here we can afford the high expenditure of work, because we have to process only a small number of specimens, from which we
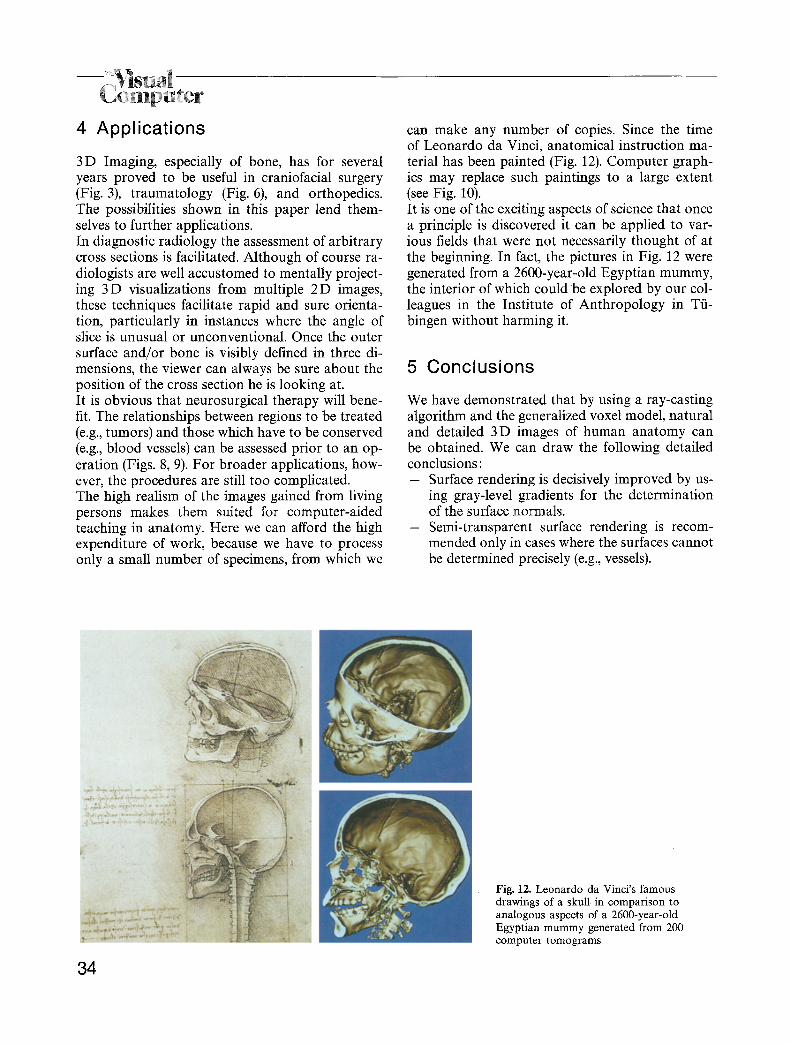
can make any number of copies. Since the time of Leonardo da Vinci, anatomical instruction ma- terial has been painted (Fig. 12). Computer graph- ics may replace such paintings to a large extent (see Fig. 10). It is one of the exciting aspects of science that once a principle is discovered it can be applied to var- ious fields that were not necessarily thought of at the beginning. In fact, the pictures in Fig. 12 were generated from a 2600-year-old Egyptian mummy, the interior of which could be explored by our col- leagues in the Institute of Anthropology in T/i- bingen without harming it.
5 Conclusions
We have demonstrated that by using a ray-casting algorithm and the generalized voxel model, natural and detailed 3D images of human anatomy can be obtained. We can draw the following detailed conclusions: - Surface rendering is decisively improved by us-
ing gray-level gradients for the determination of the surface normals.
- Semi-transparent surface rendering is recom- mended only in cases where the surfaces cannot be determined precisely (e.g., vessels).
34
Fig. 12. Leonardo da Vinci's famous drawings of a skull in comparison to analogous aspects of a 2600-year-old Egyptian mummy generated from 200 computer tomograms
t_ emp er - At least in the case of MRI, more detailed ob-
ject definitions can be achieved by segmenta- tion or multi-modality imaging, thus allowing the display of multiple objects.
- Combining multiple surfaces with different kinds of shading and cuts through the volume allows detailed visualization of tomographic volumes, especially if it can be done interactive- ly.
- As computing power will not be an issue in the future, the problem to be solved is the de- sign of a user interface that will allow easy and consistent specification of the various possible manipulations that we have described.
Acknowledgements. The authors would like to thank Professor Wolf-Joachim H61tje (Department of Craniofacial Surgery), Professor Wolfgang Schulze (Department of Anatomy), Dr. Jtirgen Wening (Department of Traumatology), and Dr. Gerd Witte (Department of Radiology) for many discussions. We also thank Ellen Vaske and Rainer Schubert for their help. We are grateful to Siemens (Erlangen) for providing the original MRI volume data from which the perspective views have been pro- duced. The images of the mummy were produced in collabora- tion with the Institute of Anthropology and the Department of Neuroradiology, University of Tiibingen. The tomograms of the cadaver have kindly been provided by the Department of Neuroanatomy, Medical University of Hanover.
References
Barillot C, Gibaud B, Luo LM, Scarabin IM (1985) 3-D Repre- sentation of anatomic structures from ct examinations. Bio- stereometrics '85. Proc SPIE 602:307 314
Boecker FRP, Tiede U, H6hne KH (1985) Combined use of different algorithms for interactive surgical planning. In: Lemke U et al. (eds) Computer assisted radiology. Springer, Berlin Heidelberg New York, pp 572 577
Bomans M, Riemer M, Tiede U, H6hne KH (1987) 3-D Seg- mentation von Kernspintomogrammen. Ninth DAGM Meeting, Braunschweig. Informatik Fachberichte 149:231- 235
Bomans M, H6hne KH, Riemer M, Tiede U (1989) 3 D-Segmen- tation of MR images of the head for 3D-display. IEEE Trans Med Imaging (in press)
Chen LS, Herman GT, Reynolds RA, Udupa JK (1985) Surface shading in the cuberille environment. Comput Graph Appl 5: 33-43
Goldwasser SM, Reynolds RA, Bapty T, Baraff D, Summers J, Talton DA, Walsh E (1985) Physicians workstation with real time performance. Comput Graph Appl 5:44-57
Hemmy DC, David DJ, Herman GT (1983) Three-dimensional reconstruction of craniofacial deformity using computed to- mography. Neurosurgery 13:534-541
Herman GT, Vose WF, Gomori JM, Gefter WB (1985) Stereo- scopic computed three-dimensional surface displays. Radio- graphics 5: 825-852
H6hne KH, Bomans M, Tiede U, Riemer M (1988) Display of multiple 3D-objects using the generalized voxel-model. Proc SPIE 914:850-854
H6hne KH, DeLaPaz RL, Bernstein R, Taylor RC (1987) Com- bined surface display and reformatting for the 3 D analysis of tomographic data. Invest Radiol 22:658-664
H6hne KH, Bernstein R (1986) Shading 3D images from CT using gray level gradients. IEEE Trans Med Imaging 5:45- 47
Jackel D (1985) The graphics PARCUM system: a 3D memory based computer architecture for processing and display of solid objects. Computer Graphics Forum 4:21-32
Kaufman A (1986) Voxel based architectures for three-dimen- sional graphics. Proc IFIP 86:361-366
Lenz R, Danielsson PE, Cronstr6m S, Gudmundson B (1986) Interactive display of 3D medical objects. In: H6hne KH (ed) Pictorial information systems in medicine. Springer, Ber- lin Heidelberg New York, pp 449-468
Levoy M (1988) Display of surface from volume data. IEEE Comput Graph and Appl 8:29 37
Lorensen WE, Cline HE (1987) Marching cubes: A high resolu- tion 3 D surface construction algorithm. Computer Graphics 21:163 169
Marr D, Hildreth EC (1980) Theory of edge detection. Proc R Soc Lond [B] 207:187-217
Pommert A, Bomans M, Tiede U, H6hne KH (1989a) Image Quality in voxel-based Surface shading. In: Lemke HU et al (eds) Computer assisted radiology (Proc CAR '89). Springer, Berlin Heidelberg New York 737 741
Pommert A, Bomans M, Tiede U, H6hne KH (1989b) Simula- tion studies for quality assurance of 3 D-images from com- puted tomograms. In: Todd-Pokropek A, Viergever MA (eds) The formation, handling and evaluation of medical images. (NATO ASI Series F, Computer and Systems Sci- ences) Springer, Berlin Heidelberg New York (in press)
Schiers C, Tiede U, H6hne KH (1989) Interactive 3D registra- tion of image volumes from different sources. In: Lemke HU et al. (eds), Computer assisted radiology. (Proc. CAR '89) Springer, Berlin Heidelberg New York, pp 666-670
Templeton AW, Johnson JA, Anderson WH (1985) Computer graphics for digitally formatted images. Radiology 152:527 528
Tiede U, H6hne KH, Riemer M (1987) Comparison of surface rendering techniques for 3D tomographic objects. In: Lemke U et al. (ed) Computer assisted radiology. Springer, Berlin Heidelberg New York, pp 599-610
Tiede U, Riemer M, Bomans M, H6hne KH (1988) Display techniques for 3D-tomographic volume data. In Proc. NCGA '88, vol III. Anaheim, pp 188-197
Vannier MW, Marsh JL, Warren J (1984) Three-dimensional CT reconstruction images for eraniofacial surgical planning. Radiology 150:179-184
Witte G, H61tje W, Tiede U, Riemer M (1986) Die dreidimen- sionale Darstellung computertomographischer Untersu- chungen kraniofacialer Anomalien. Fortschr R6ntgenstr 144: 24-29
Yasuda T, Toriwaki J, Yokoi S, Katada K (1984) Three-dimen- sional display system of CT images for surgical planning. International Symposium on Medical Images and Icons, Silver Spring Md. IEEE Computer Society, pp 322 327
Zucker SW, Hummel RA (1979) An optimal three-dimensional edge operator. McGill Univ Rep 79-10
35
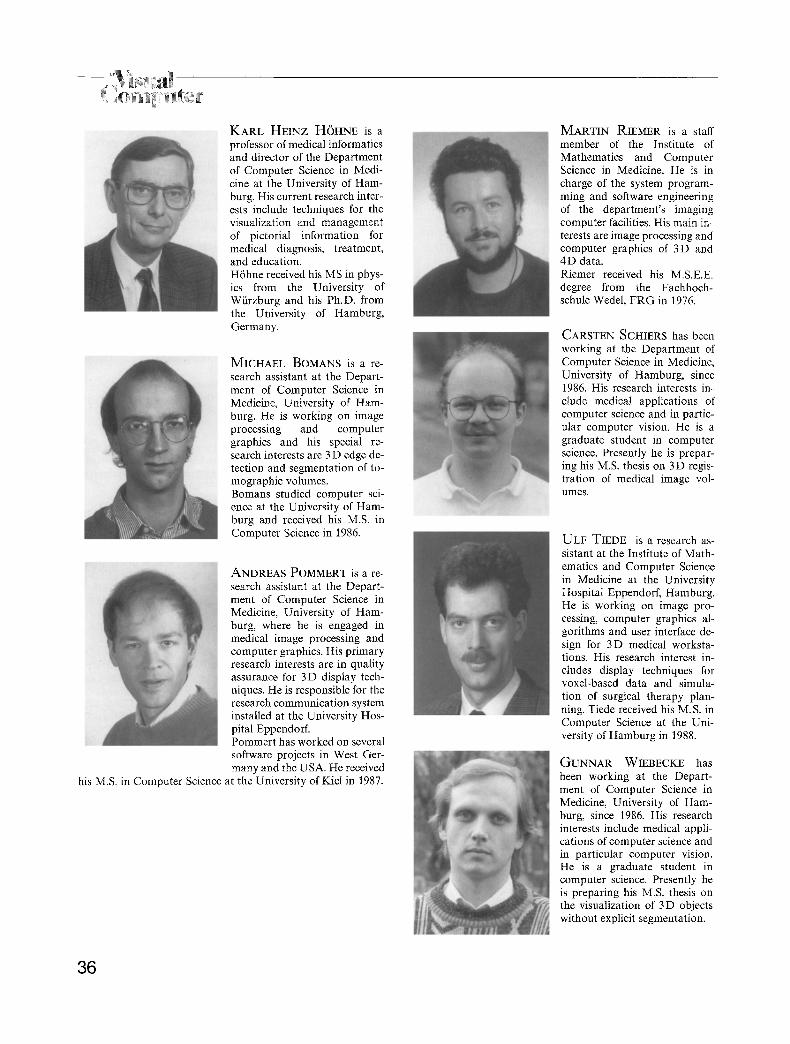
KARL HEINZ HOHNE is a professor of medical informatics and director of the Department of Computer Science in Medi- cine at the University of Ham- burg. His current research inter- ests include techniques for the visualization and management of pictorial information for medical diagnosis, treatment, and education. H6hne received his MS in phys- ics from the University of Wfirzburg and his Ph.D. from the University of Hamburg, Germany.
MICHAEL BOMANS is a re- search assistant at the Depart- ment of Computer Science in Medicine, University of Ham- burg. He is working on image processing and computer graphics and his special re- search interests are 3 D edge de- tection and segmentation of to- mographic volumes. Bomans studied computer sci- ence at the University of Ham- burg and received his M.S. in Computer Science in 1986.
ANDREAS POMMERT is a re- search assistant at the Depart- ment of Computer Science in Medicine, University of Ham- burg, where he is engaged in medical image processing and computer graphics. His primary research interests are in quality assurance for 3D display tech- niques. He is responsible for the research communication system installed at the University Hos- pital Eppendorf. Pommert has worked on several software projects in West Ger- many and the USA. He received
his M.S. in Computer Science at the University of Kiel in 1987.
36
MARTIN RIEMER is a staff member of the Institute of Mathematics and Computer Science in Medicine. He is in charge of the system program- ming and software engineering of the department's imaging computer facilities. His main in- terests are image processing and computer graphics of 3D and 4D data. Riemer received his M.S.E.E. degree from the Fachhoch- schule Wedel, F R G in 1976.
CARSTEN SCHIERS has been working at the Department of Computer Science in Medicine, University of Hamburg, since 1986. His research interests in- clude medical applications of computer science and in partic- ular computer vision. He is a graduate student in computer science. Presently he is prepar- ing his M.S. thesis on 3 D regis- tration of medical image vol- umes.
U L F TIEDE is a research as- sistant at the Institute of Math- ematics and Computer Science in Medicine at the University Hospital Eppendorf, Hamburg. He is working on image pro- cessing, computer graphics al- gorithms and user interface de- sign for 3D medical worksta- tions. His research interest in- cludes display techniques for voxel-based data and simula- tion of surgical therapy plan- ning. Tiede received his M.S. in Computer Science at the Uni- versity of Hamburg in 1988.
GUNNAR WIEBECKE has been working at the Depart- ment of Computer Science in Medicine, University of Ham- burg, since 1986. His research interests include medical appli- cations of computer science and in particular computer vision. He is a graduate student in computer science. Presently he is preparing his M.S. thesis on the visualization of 3 D objects without explicit segmentation.