Embed Size (px)
Citation preview
NDTMA 2016 Annual Conference
3DVisualiza+onToolfortheNDTMarketplace
Bruce A. Pellegrino Vice President - Marketing Sensor Networks, Inc. Boalsburg, PA
GoldenNuggetHotel,LasVegas,NVFebruary16-18,2016

NDTMA 2016 Annual Conference
GoldenNuggetHotel,LasVegas,NVFebruary16-18,2016
Today’sAgenda1. NDTMarketRevisited2. What&Why3D?3. ModelingtheMarket4. Conclusions

“Only the dead know NY City” Pete Hamill
A Drinking Life
“Only the dead know NDT” Bruce Pellegrino
An NDT life
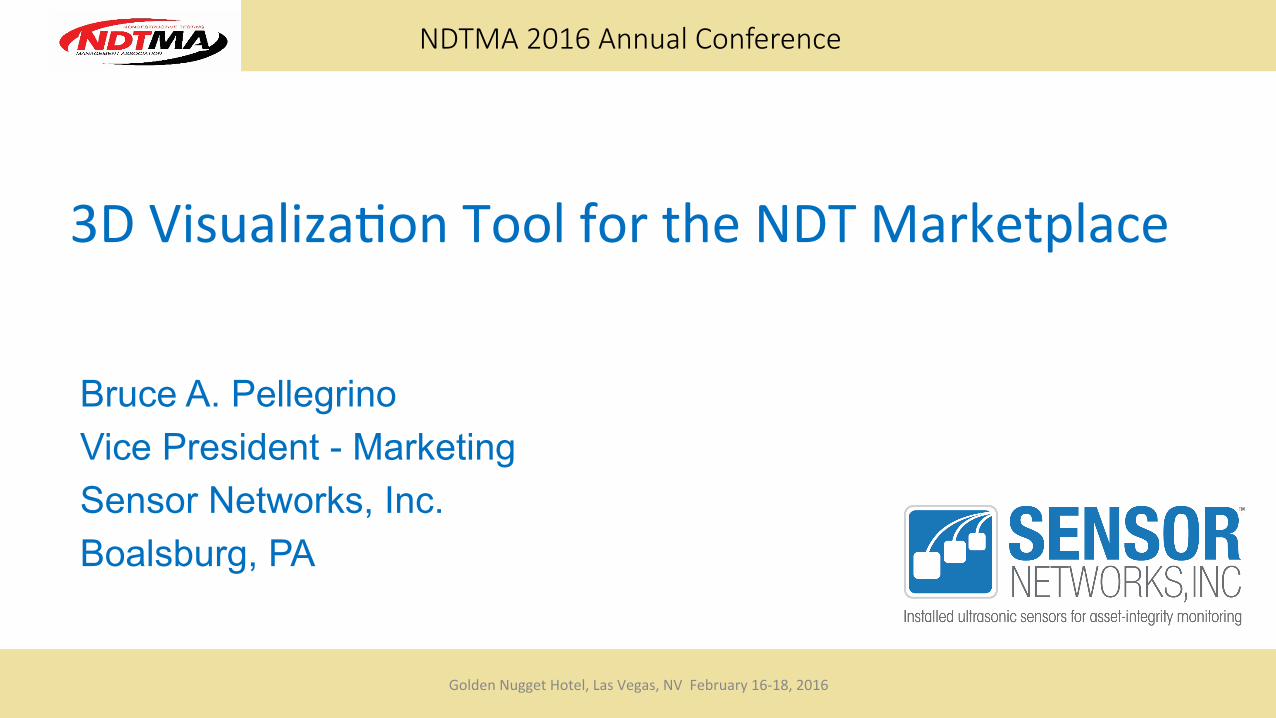
GeHng calibrated: NDT Products and Services is a very fragmented, global, ~ $10 Billion / Year Market
§ CAGRof~6%§ Ex:FactoryIn-house§ Oil&Gasis65%ofServices§ NDTServices$≈LVGaming$Source: Frost & Sullivan – Various Reports
[CATEGORYNAME]$480
RT$525
[CATEGORYNAME]$225
[CATEGORYNAME]$195
PT$75
UT RT MT/ET VT PT
[CATEGORYNAME]$[VALUE]
[CATEGORYNAME]$[VALUE]
[CATEGORYNAME]$250
Products Services Training
“Products & Services: an implicit partnership”

Core NDT
Our NDT Solar System:
UT
Dozens of technologies
Addressing dozens of sub-segments
Result: Thousands and thousands of applicaWons
MT ET
RT
AE PT
FL
CT XR
IS
DR CR VT N

CondiWon Monitoring
NDT Technologies Metrology
Infrastructure
Materials Engineering
Security
Process Control
NDT’s Broader Universe
QA / QC
Asset Integrity
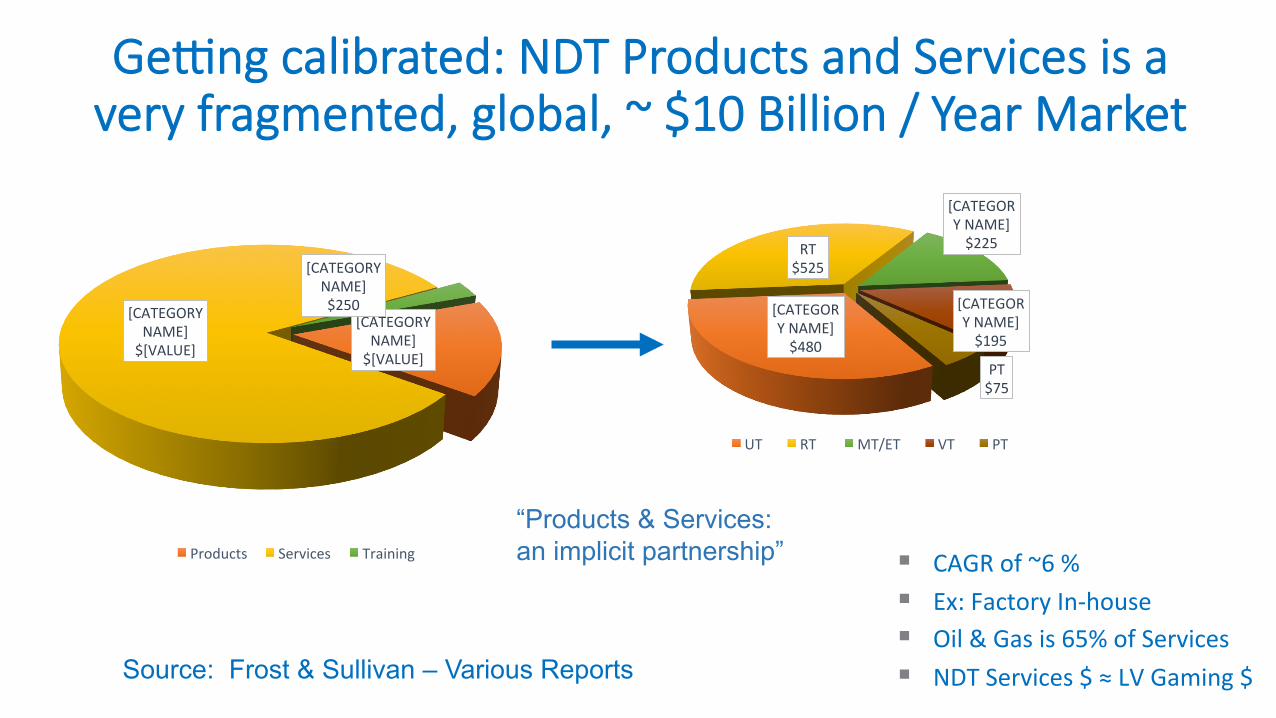
So Why 3 D ? Ourrealworldis3Dandwe“see”andthinkin3D!• 3DMovies• 3DScanners• Stereo-photogrammetry• Autonomousvehiclevisionsystem• 3DDesign&Prin+ng• Facili+esMaintenancePlanning• 911dispatch• 3DComputedTomography• 3DUltrasound
So“whynot”3Dvisualiza+onofamarket?
Volumetric
Superficial

A voxel is a volumetric pixel and the unit of currency for any 3D rendering.
3D 101: What is a voxel ?

3 D MARKET Model Example
X-Axis=Region:NorthAmerica
Z-Axis=Segments:Oil&Gas
Y-Axis=MethodorTechnology:PAUT
OtherPossibleAxes=Buyingbehavior,Applica:ons,Time,etc.
• Unitofmeasure:Voxeldensityorintensity=Revenueorprofitability($$or%)
• Marketresolu+onisdeterminedbythenumberofvoxelsinourmodel.
• 5x5x5=125micro-markets
1 Voxel = 1 Micro-market e.g. UT , Nuclear Power, Europe
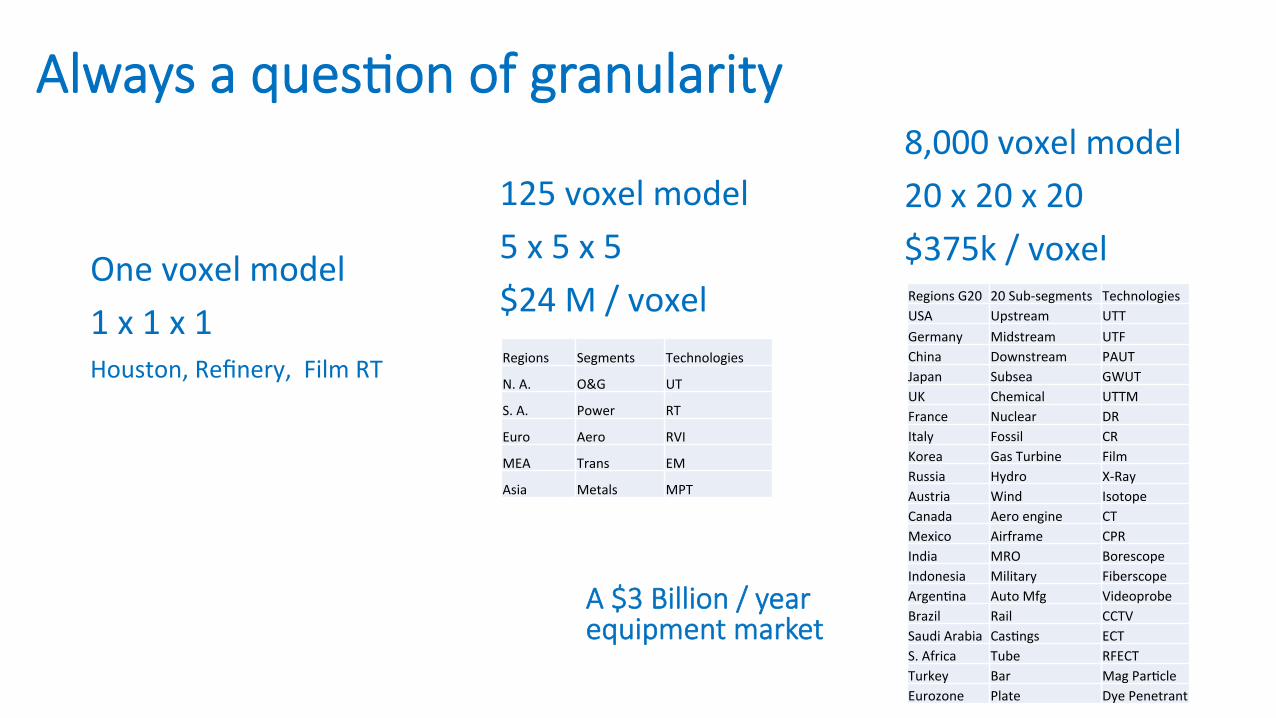
Always a quesWon of granularity
Onevoxelmodel1x1x1Houston,Refinery,FilmRT
8,000voxelmodel20x20x20$375k/voxel
125voxelmodel5x5x5$24M/voxel
RegionsG20 20Sub-segments TechnologiesUSA Upstream UTTGermany Midstream UTFChina Downstream PAUTJapan Subsea GWUTUK Chemical UTTMFrance Nuclear DRItaly Fossil CRKorea GasTurbine FilmRussia Hydro X-RayAustria Wind IsotopeCanada Aeroengine CTMexico Airframe CPRIndia MRO BorescopeIndonesia Military FiberscopeArgen+na AutoMfg VideoprobeBrazil Rail CCTVSaudiArabia Cas+ngs ECTS.Africa Tube RFECTTurkey Bar MagPar+cleEurozone Plate DyePenetrant
Regions Segments Technologies
N.A. O&G UT
S.A. Power RT
Euro Aero RVI
MEA Trans EM
Asia Metals MPT
A $3 Billion / year equipment market

Regional view
Technology view
Segment view TechnologyvsRegion
NA SA Euro MEA AsiaUT 260 25 265 60 260RT 290 25 260 65 290RVI 115 13 140 24 115ECT 110 20 110 29 110
SegmentvsTechnologyUT RT RVI ECT MPT
O&G 230 285 72 41 90PG 245 295 67 160 85Aero 250 190 175 85 85Auto 90 90 59 53 77Mfg. 55 70 34 40 77
SegmentvsRegionNA SA Euro MEA Asia
O&G 230 18 155 85 230PG 270 22 245 45 270Aero 225 25 275 35 225Auto 95 17 145 17 95Mfg. 80 18 80 18 80
Asia UT RT RVI ECT MPTO&G 75 100 20 10 25PG 75 100 20 50 25Aero 75 50 50 25 25Auto 20 20 15 15 25Mfg. 15 20 10 10 25
MEA UT RT RVI ECT MPTO&G 25 30 10 10 10PG 15 15 5 5 5Aero 10 10 5 5 5Auto 5 5 2 4 1Mfg. 5 5 2 5 1
Euro UT RT RVI ECT MPTO&G 50 50 20 10 25PG 75 75 20 50 25Aero 85 75 65 25 25Auto 40 40 25 15 25Mfg. 15 20 10 10 25
S.A. UT RT RVI ECT MPTO&G 5 5 2 1 5PG 5 5 2 5 5Aero 5 5 5 5 5Auto 5 5 2 4 1Mfg. 5 5 2 5 1
N.A. UT RT RVI ECT MPTO&G 75 100 20 10 25PG 75 100 20 50 25Aero 75 50 50 25 25Auto 20 20 15 15 25Mfg. 15 20 10 10 25
Poor Man’s 3D Model via Excel
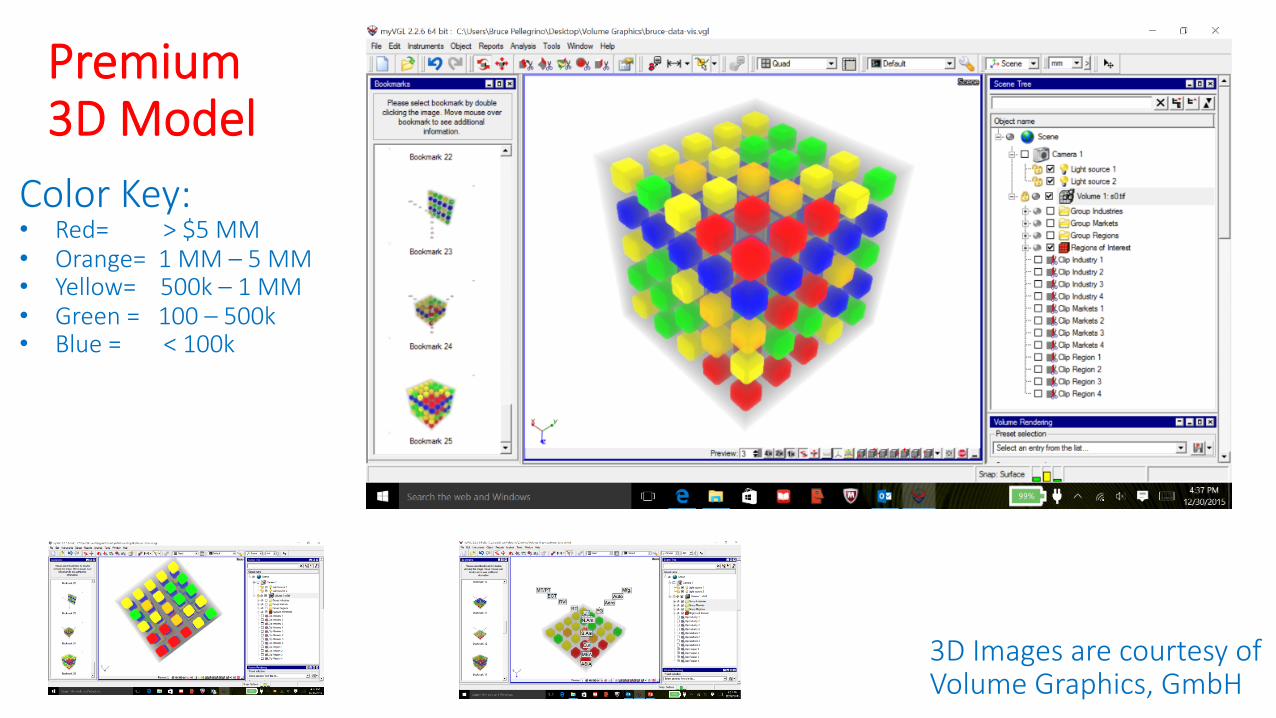
Premium 3D Model
3D Images are courtesy of Volume Graphics, GmbH
Color Key: • Red= > $5 MM • Orange= 1 MM – 5 MM • Yellow= 500k – 1 MM • Green = 100 – 500k • Blue = < 100k

NDTMA 2016 Annual Conference
GoldenNuggetHotel,LasVegas,NVFebruary16-18,2016
Conclusions1. Itissome+mesusefultothinkofyourbusiness
asa3Dimageormodel.2. Strategyisprimarilyaroundfocus.Modelingthe
markethelpstoprovideclarityandfocus.3. Youdecidehowgranularyourdataneedsare.