Embed Size (px)
Citation preview

3D VISIBILITY ANALYSIS IN URBAN ENVIRONMENT
- COGNITION RESEARCH BASED ON VGE
T. P. Lina, *, H. Linb, M. Y. Hub
a Earth Sys and Geo Info Science, The Chinese University of Hong Kong, Sha Tin, N. T., Hong Kong -
[email protected] b Shenzhen Research Institute, The Chinese University of Hong Kong, Shenzhen, Guangdong, China - (huilin,
humingyuan)@cuhk.edu.hk
ISPRS 3DGeoInfo Conference 2013
KEY WORDS: 3D Visibility Analysis, Virtual Geographic Environment, Urban Environment, Human Perception, Visual Field
ABSTRACT:
The author in this research attempts to illustrate a measurable relationship between the physical environment and human’s visual
perception, including the distance, visual angle impact and visual field (a 3D isovist conception) against human’s cognition way, by
using a 3D visibility analysis method based on the platform of Virtual Geographic Environment (VGE). The whole project carries
out in the CUHK campus (the Chinese University of Hong Kong), by adopting a virtual 3D model of the whole campus and survey
in real world. A possible model for the simulation of human cognition in urban spaces is expected to be the output of this research,
such as what the human perceive from the environment, how their feelings and behaviours are and how they affect the surrounding
world.
Kevin Lynch raised 5 elements of urban design in 1960s, which are “vitality, sense, fit, access and control”. As the development of
urban design, several problems around the human’s cognitive and behaviour have come out. Due to the restriction of sensing
knowledge in urban spaces, the research among the “sense” and the “fit” of urban design were not quite concerned in recent decades.
The geo-spatial cognition field comes into being in 1997 and developed in recent 15 years, which made great effort in way-finding
and urban behaviour simulation based on the platform of GIS (geographic information system) or VGE. The platform of VGE is
recognized as a proper tool for the analysis of human’s perception in urban places, because of its efficient 3D spatial data
management and excellent 3D visualization for output result.
This article will generally describe the visibility analysis method based on the 3D VGE platform. According to the uncertainty and
variety of human perception existed in this research, the author attempts to arrange a survey of observer investigation and validation
for the analysis results. Four figures related with space and human’s perception will be mainly concerned in this proposal: openness,
permeability, environmental pressure and visibility, and these will also be used as the identification for different type of spaces.
Generally, the author is aiming at contributing a possible way to understand the reason of human’s cognition in geo-spatial area, and
provides efficient mathematical model between spatial information and visual perception to the related research field.
* Corresponding author.
1. INTRODUCTION AND RESEARCH BACKGROUND
1.1 General Instructions
3D visibility analysis is mainly discussed in this article, which
is also related with the relationship between the space types and
human’s visual perception in a 3-dimensional research scale.
The initial idea of this research originates from the research
progress of Kevin Lynch in 1981, where he has listed five basic
elements for urban planning (Lynch 1981), including vitality,
sense, fit, access and control. These elements supply a guide for
urban design and relatively efficient value standards. In these
five elements, “Sense” of urban space is described as the
perception or mental structure received by urban users, and
another word “fit” means the form and capability of urban space
fit the behaviour of human being. However, during current
research the field related with human perception has not been
concerned quite much, since it is thought to be difficult to deal
with human’s mental world. One reason is that, the research
around human perception is considered hard to be measured or
quantified, which restricts the analysis between the environment
and human’s perception.
The visual perception of human is often thought to be the most
significant issue among all types of human’s perception. All the
human senses of urban spaces come from urban image of the
observers, which are considered to be various from each person.
Human’s knowledge background and activity with urban space
will affect and generate different sense from standard meaning
(Montgomery 1998). In the past there were not quite much
psychological investigation related with metal images of
geographic space, and all the efforts for psychologists mainly
focused on the physics and physiology of the senses in
laboratory work (Gould 1973). After the conception of isovist
and viewshed were raised by several scholars (Tandy 1967,
Benedikt 1979, Lynch 1976), the topic between space and
human’s visual sense starts to be introduced as the visibility
analysis into the research field, and most of the researchers tend
to focus on the common sense of the observer generated by the
located environment. As a result of development of 3D
ISPRS Annals of the Photogrammetry, Remote Sensing and Spatial Information Sciences,Volume II-2/W1, ISPRS 8th 3DGeoInfo Conference & WG II/2 Workshop, 27 – 29 November 2013, Istanbul, Turkey
This contribution has been peer-reviewed. The double-blind peer-review was conducted on the basis of the full paper. 227

technology and visibility analysis, the idea of 3D visibility
analysis has come into being, which mainly deals with the
visibility computation for urban area in 3D scales.
After the introduction of Geographic Information Science (GIS)
and Virtual Geographic Environment (VGE) technologies,
modern analysis methods have been playing an important role
in the field related to urban environment in recent few decades.
Not only for the basic analysis aspects such as the information
management, road network analysis and routing, GIS begins
taking part in the research of visibility analysis via the tool of
DEMs (Digital Elevation Model) (Yang et al 2007, Morello and
Ratti 2009, Suleiman et al 2011). VGE provides an efficient 3D
based platform for the data access, storing and management,
and a friendly interface accepted by final users, which makes
the geographic output result lively and comprehensive. Due to
its full 3D visualization scenes, VGE is thought to be an
available platform for the visibility analysis, and also capable in
the complex urban environment with quantities of buildings.
Due to these reasons, the 3D VGE platform is adopted as the
place for the extraction of building spatial relationship, the 3D
visibility analysis and correlation study with human’s
perception in this article.
1.2 Current Visibility Analysis Progress and Limitations
The conception of visibility (or visual, visual perception)
analysis was raised very early. In some traditional practices the
views of pedestrians walking in the urban open space were
recorded through photographs or sketches in order to
understand the visual effects (Yang et al 2007). In the 1970s,
two main approaches emerge in the visibility analysis context:
the concept of viewshed in terrain and landscape analysis and
the concept of isovist in architecture and urban space (Leduc et
al 2011). Benedikt (1979) was the first who systematically
introduced the isovist, the area visible directly from any
location within the space. According to current research
progress, numbers of researchers showed their interests in the
research of isovist and found a few new ways for the acquisition
of spatial indexes from the isovist idea, which could be applied
to describe the figures like space volume, openness, and
visibility (Turner and Penn 1999, Turner et al 2001, Stamps III
2005a, Stamps III 2005b). The other one viewshed analysis, in
the opinion of Llobera (2003), is efficient in recent GIS
applications since it could be acquired from connecting the grid
cells in a digital elevation model (DEM) with the location of
viewpoint as the line of sight within any specified distance. The
idea has been widely adopted in recent viewshed or isovist
studies, which is common in the research field of 2.5D and 3D
visibility analysis. Currently the GIS-based viewshed analysis
provides a full 360° horizontal view orientation, and 0° to 90°
vertical view orientation.
Based on the knowledge of 2D isovist and viewshed, several
approaches for 3D visibility analysis has been carried out in
recent 8 years, and numbers of automated models have been
developed as the efficient analysis tools. Several researchers
have developed the method as viewsphere (Yang et al 2007) or
view-oriented 3D visibility analysis model (Fisher-Gewirtzman
and Wagner 2003, Fisher-Gewirtzman et al 2005) for dealing
with the visual effects in urban environment. Besides, the idea
of DEM or TIN models are widely used because of its suitable
feature for visibility analysis (Morello and Ratti 2009, Suleiman
et al 2011).
Referring to the research attempts done by other researchers,
although visibility analysis in 2D, 2.5D and 3D has achieved
fruitful goals, some problems are still remaining to be solved in
the near future. These may include: (1) Lack of full 3D scene
for visibility analysis, since even DEM or TIN based visibility
analysis can only be recognized as 2.5D; (2) Lack of
consideration about areas below horizon, since most of the
researchers supposed the experiment site to be located on a flat
plane and neglect the negative visual angles; (3) Lack of
combination of terrain and buildings / urban environment, and
most researches are integrating the two features together for the
data procession; (4) Lack of consideration about human agent,
as rare of the researchers designed the experiment with a
movable view point, or represent it by a human agent.
According to this situation the author intends to design a
method for 3D visibility analysis to overcome the barrier in
current research, and provide a reference to the related research
fields.
2. METHODOLOGY AND EXPERIMENT
PREPARATION
2.1 Inner Structure of the VGE Platform
Comparing with 3D GIS which is also an expert platform
dealing with terrains, urban environment and building models in
3D scales, the virtual Geographic Environment (VGE) has some
special features while dealing with geographic problems. In this
experiment, VGE acts more alike a platform integrating all
types of data source with friendly interface, and can support or
be accessed by other software. The functions such as data
storing, management, analysis and visualization could be
realized in this platform by inputting data into VGE. The
software of Open Simulator (OpenSim for short, website:
http://opensimulator.org/) together with Second Life Viewer
will be adopted as the platform of VGE.
2.1.1 Input, Storing and Management of 3D Spatial Data:
Due to the MySQL based 3D spatial information management
feature, application for the Second Life engine (website:
http://secondlife.com/) and a few 3D related research progresses
(Friedman et al 2007, Kinicki and Claypool 2008), the
OpenSim has been chosen and adopted as the platform software
for this experiment. The 3D geographic information are able to
be handled by OpenSim, including the input and storing of
terrain (via DEM), building models and vegetation, and
visualized through the its viewer for the final presentation.
According to the operation structure of OpenSim, two parts as
server and customer are separated for different functions, which
are normally operated by two or more computers (Figure 1).
Figure 1. Inner Structure of OpenSim – The VGE Platform
Used in this Experiment
ISPRS Annals of the Photogrammetry, Remote Sensing and Spatial Information Sciences,Volume II-2/W1, ISPRS 8th 3DGeoInfo Conference & WG II/2 Workshop, 27 – 29 November 2013, Istanbul, Turkey
This contribution has been peer-reviewed. The double-blind peer-review was conducted on the basis of the full paper. 228

The function of Open Simulator Grid is for the data storing,
procession and management, which contains the spatial
information for terrain and building models. The other one, the
browser of Second Life, is in charge of the data input (via
building model construction or importing from external) and
visualization, which directly faces to the final user. For 3D
visibility analysis, the required information as building models
is acquired from the database, which belongs to the part of
server. Necessary external data such as DEM for terrain will be
integrated with the fetched model for more detailed analysis.
Moreover, it is possible to use the integrated information by the
browser for the final visualization.
2.1.2 Computation of 3D Spatial Data:
OpenSim provides a platform for 3D spatial data input, storing
and management, but it is not suitable for the computation with
these data sources due to its inner structure. As the existence of
MySQL based database, the spatial data stored inside by
OpenSim could be extracted and processed through other
programs, only if it has the ability of reading the information
from the database. Currently the author applies Python as the
program language tool for the extraction and computation, and a
website based on Python / Django is acting as the data engine
and interface presenting to the user who are the controllers of
the computation. Not only the data source stored inside the
OpenSim database, but also external data in MySQL format,
such as the pollutants or noise distribution data handled by
other software, could be integrated in this platform and finally
applied for the visualization according to the experience of the
author’s group. Besides, as the DEM data is treated as a type of
external data in this research, the import and computation are
also handled by the program via MySQL database for the
further data integration.
2.1.3 Visualization and Expression of 3D Spatial Data:
After the procession of 3D spatial data for visibility analysis,
the visualization and expression of the output needs to be
handled via the VGE platform – this is the work of the customer
viewer as Second Life (Figure 2). Normally the data sources for
the visualization are from OpenSim Grid (server), but necessary
plugins for external data sources are in demand in this step,
because of unsupported external sources by the customer viewer
(browser). Proper modification is done and plugins are added to
the Second Life viewer, including the part in charge of
rendering specified data source reading from MySQL database.
According to the special features of data source, colourful
points, lines, planes and transparent boxes are adopted for the
final result representation due to these input sources.
Figure 2. A Brief View of the 3D Based VGE Platform Used in
this Experiment – OpenSim and Second Life Viewer;
This Picture Shows the Extraction Procession for the Visual
Angle of Models inside the Platform
2.2 3D Visibility Analysis Model
As an extension function of OpenSim based VGE, the author is
trying to develop a tool for visibility analysis in urban
environment, which is called “3D Visibility Analysis Model” in
this article. The general idea of this model is: from the spatial
distribution of different types of terrain, buildings, city furniture
and vegetation, the computation of spatial relationship could be
processed and applied for correlation study with human’s
feeling. Two more issues are discussed in the following
paragraphs as:
2.2.1 Data Sources:
According to the various features among the target objects, 3
types of data sources are considered in this experiment, which
are terrain, buildings and vegetation (Figure 3).
Figure 3. Integration of 3 Types of Data Sources in the 3D
Visibility Analysis Model
For the representation of terrain, a 0.5m * 0.5m resolution DEM
(Digital Elevation Model) is adopted for the computation of
viewshed for specified viewpoint. The pixel-based data
arrangement adapts properly for the viewshed analysis and
result storing based on MySQL database. The second step, the
author extracts the building models from the OpenSim Grid, for
the representation of building data of the reality. Based on the
platform of OpenSim, the whole campus of CUHK has been
virtualized into the server with enough precision for the
building locations, scales and textures, which meets the data
source requirements of this experiment. The extraction of
buildings’ spatial data is processed by Second Life Viewer,
which is a customer viewer for the 3D building models
visualization and do the exportation during the rendering
process. The final issue, the vegetation is thought to be an
additional data source for the visibility analysis, according to
the widely distribution of vegetation inside the campus.
Currently there is not any good method for the representation of
vegetation due to its complexity, and it still remains to be
discussed in the author’s further progress. These 3 types of data
sources process separately in the visual data computation, and
the integration is designed afterward for the analysis of
visibility features.
2.2.2 Features Concerned:
For the 3D visibility analysis model in this article, 3 features are
mainly concerned here, which are visual distance, visual angle
and visual field. These features are the first group of outcomes
in the visibility analysis, relatively significant for the data
source of building models in OpenSim. The visual distance is
defined as the distance in 3D from the observer towards a target
object, and it could be calculated if the coordinates of the
viewpoint and target are known. The visual angle (for single
building) in this article is divided into two categories as
ISPRS Annals of the Photogrammetry, Remote Sensing and Spatial Information Sciences,Volume II-2/W1, ISPRS 8th 3DGeoInfo Conference & WG II/2 Workshop, 27 – 29 November 2013, Istanbul, Turkey
This contribution has been peer-reviewed. The double-blind peer-review was conducted on the basis of the full paper. 229

horizontal and vertical, for the representation of object visible
part in those two mutually perpendicular directions. As the
location and shape of the building is known, the visual angle
calculation for a specified viewpoint turns to be possible. The
last factor visual field, whose definition is the distribution of
visual angle for surrounding objects in all directions (360
degrees), could be drawn from the visual angle data collected
for visible objects. It could also be treated as the viewpoint
skyline spectrum for the surrounding objects. These
mathematical figures could be applied in founding the relations
with human’s visual perception, such as the feeling of crowd,
order, continuous or even emotional feelings as comfortable and
harmonious, as this result, they are our initial concerned factors
in this visibility analysis approach.
2.3 Experimental Sites in Reality – CUHK Campus
The experiments take place in the campus of CUHK (the
Chinese University of Hong Kong), which occupies an area of
1.34 km2 and includes over 80 single buildings. Because CUHK
is located on a hillside with the altitude range from 5m to 170m,
compared with other same area places, it contains more
abundant topography types obviously. The various terrain and
buildings in CUHK supply relatively suitable experimental sites
to this research, as most of the representative space types can be
discovered in the small campus. Due to the level of enclosure,
openness and visibility, there are four main types of building
groups in CUHK, which are defined as squares, courtyards,
terraces and streets (Details in 2.4). The distribution of
specified group of sites could be referred to the Figure 4. Based
on the spatial information extracted from the VGE models as
visual distance, visual angle and visual field, the four figures
like openness, permeability, visibility and environment pressure
will be processed for the identification to distinguish each space
type.
Although in CUHK there are abundant space types, it also
indicates a few existed problems that are distinct from other
outside places. According to the terrain and building groups
types in CUHK, several special circumstances have been listed
as following:
2.3.1 A new space type of half-enclosure as “terraces”
commonly exists inside the campus.
The terraces, which are often recognized as the flat spaces on
the hillside, refer to the places surrounded by buildings or walls
in no more than two directions and separated from the other
space through its special topography. Few researches have been
down due to the rarity of this space type, but here it would be
considered to have the same importance as squares or
courtyards, because of its commonness in the campus of
CUHK. Besides, as most of CUHK buildings are facing to the
coast, there are a numbers of roof terraces in the campus, which
also belong to this space type.
2.3.2 Some target objects are long distance away from
observer, whose effect towards visual sense is slighter than
closer ones.
This situation is common inside the campus because of its
mountainous topography, such as the a few hill tops locating far
away from the campus. These places could be seen during good
weather but often disappear due to the unusual situation of low
visibility (fog, haze or heavy rain). Besides, the insufficient
contrast of the scene could also decrease the influence of these
objects. However, to reduce the uncertainly of weather issues,
only good weather is considered in this experiment but effects
of distance are considered to be added as a special issue.
2.3.3 Negative vertical visual angle may be existed
because of the hilly topography.
As most of the past studies have only concerned the visual angle
above the horizon, the scene below our visual line hasn’t been
considered. For the hilly topography inside the campus of
CUHK, this situation becomes obvious and urgent in the study
of this proposal. For instance, several terraces such as the
platforms of several teaching buildings, the observer standing
on the platforms can easily get the visual image from low
altitude area, even a few of lower buildings would get into the
scene and influence the person.
2.3.4 Vegetation issue is also significant in the campus
during the visibility analysis.
Because of the high coverage of vegetation inside campus, the
effect of vegetation cannot be neglect during this research. They
play a very important role in the space enclosure inside campus
and are significant for the enclosure of streets. Besides, the trees
and bushes often exist and separate two close spaces, which
make the empty space full of interests.
2.4 Classification of Space Types for Experimental Sites
According to the research progress of Ashihara 1975, the author
used phrases as “squares”, “courtyards” and “streets” to
describe the space openness in his research. Similar with that
research, the classification of space types in this article is
justified to the level of enclosure but with “terraces” added.
According to the definition of 4 space types (Squares,
Courtyards, Terrace and Streets) introduced, the author will
select 40 points from CUHK campus and divided them into
these 4 groups. The classification of space types shows a
relationship as following table (Table 1):
Space
Types
– Enclosure
– Square
(Open type)
E.g. Central Campus
Square
Square in front of
MTR Station
– Courtyard
(Closed Type)
E.g. Backyard of
Science Centre
Courtyard of Lady
Shaw Bldg.
– Half-
enclosure
– Terrace
(Two Adjacent
Boundaries)
E.g. Platform of
Esther Lee Bldg.
Platform of S. H. Ho
College
– Street
(Two Opposite
Boundaries)
E.g. Central Avenue
Road next to Tin Ka
Ping Bldg.
Table 1. Classifications of Space Types in this Proposal
At the very beginning all spaces are divided into two main types,
the one of enclosure spaces and the other of half-enclosure
spaces. For the first type, the word “enclosure spaces” refers to
the spaces totally surrounded by boundaries, which may include
walls, buildings, terrains (hillside) or vegetation. A few gaps
may exist in this type of space, but they are not wide enough to
interrupt the enclosure property of the whole space. Squares and
courtyards are considered to be two different space types under
the definition of enclosure spaces. For the other one, the half-
ISPRS Annals of the Photogrammetry, Remote Sensing and Spatial Information Sciences,Volume II-2/W1, ISPRS 8th 3DGeoInfo Conference & WG II/2 Workshop, 27 – 29 November 2013, Istanbul, Turkey
This contribution has been peer-reviewed. The double-blind peer-review was conducted on the basis of the full paper. 230
enclosure space contains the space types with boundary
surrounded not in the entire perimeter. This type includes
streets and terraces that are normally have only two or three
boundaries, either in opposite or adjacent directions.
3. CURRENT PROGRESS, EXPERIMENTS AND
RESULTS
Based on the platform of Open Simulator (a VGE platform), a
set of experiments have been designed for the 3D visibility
analysis model. These include the attempts in the following 5
sections, from the selection of information collation in
experimental sites to the data processing methods.
3.1 Information Collation of Experimental Sites
Information collation of experimental sites is necessary at the
beginning of the experiment. As mentioned in Section 2.3 of
this article, the author has picked up 40 points from CUHK
campus to represent the 4 types of space, with each 10 points
for squares, courtyards, terraces and streets. Several efforts have
been made before the experiment is taken, including the
investigation of site basic information and collation. Pictures,
geographical location and a brief description have been
prepared for each experimental site. The detailed information as
the locations of those 40 points could be referred to Figure 4.
Figure 4. Experimental Sites Distribution in CUHK Campus,
and Categories of 40 Selected Points
Although the topography in CUHK is diverse enough to find
sufficient places to meet the classification requirement in this
article, there are still a few problems remaining to be solved in
the author’s further progress. Take the streets for instance, the
hilly terrain of CUHK limited the length of straight street,
which makes the experiment lack of the spaces with regular,
orderly and continuous street façade. Besides, terraces as a
special feature for hilly campus have been added into the space
types, and they will be on behalf of the visibility analysis in a
special space type that has never been explored before. Because
of this, the examples of the points in CUHK may not be
representative enough for each space type, and extra experiment
may be designed in future to validate the accuracy of the
classification method.
3.2 Spatial Relationship Figures: Visual Distance, Visual
Angle and Visual Field
For initial data process of 3D visibility analysis 3 figures are
considered to be significant, that is the visual distance, visual
angle and visual field mentioned in Section 2.2.2. These three
are important because they define the geometric issues of space.
Distance, that means the distance from the observer (viewpoint)
to the boundary, is controlling the width scale of the opening
space. Once the distance is getting smaller, most of the observer
would feel the surrounding space more crowed, narrow and
even pressured, which is thought to be the common sense of
human being. The figures of visual angle are decided by the
height of surrounding buildings, which indicates the visual
significance or impact caused by the target objects. For the
same building, different visual angle may be generated if the
distance is changing, and for larger distance between viewpoint
and target, the visual angle will become smaller. Larger visual
angle indicates that the object could be more easily perceived
by the observer, which means more significant or impact
towards the human being’s sense. If considering the
surrounding visual angle distribution as a total, the idea of
visual field comes into being. As the visual field is decided by
the surrounding environment, it defines the space type of the
urban environment. Moreover, several sorts of human
perception are closely related with the type of visual field, such
as openness, permeability, visibility and environment pressure.
3.2.1 Visual Distance:
It is proved that human’s two eyes could generate a full 3D
scene of the world because there’s slightly visual direction
difference between the images percept by the two eyes, and
that’s why the distance has been noticed as one of the
significant figures here. Different distance will affect the
variance in visual perception, such as the change of openness
and intimacy. Visual distance could be conveniently drawn out
from either DEM or 3D building models. As the coordinates of
both viewpoint and target are known, the distance is get from
the distance formula in three-dimensional space as Formula 1:
d = (x- x0 )2 + (y- y0 )
2 + (z- z0 )2 (1)
where d = distance between viewpoint and target
x0, y0, z0 = coordinates of viewpoint
x, y, z = coordinates of target
Visual distance is thought to be the one significantly
influencing human’s openness perception. During the research
result of Bittermann and Ciftcioglu 2006, the relationship
between distance of noticing flat object and openness
perception is described by a sigmoid function, that is, the
openness feeling normally increases with distance gradually at
the beginning, sharply around certain value and tends to be
steady finally. Another figure may relate with distance is visual
impact. It is not similar with openness, which concerns more
about how important an object could be perceived by human
being and acts inversely proportional to the distance. Those
would both be considered in the visibility analysis process.
ISPRS Annals of the Photogrammetry, Remote Sensing and Spatial Information Sciences,Volume II-2/W1, ISPRS 8th 3DGeoInfo Conference & WG II/2 Workshop, 27 – 29 November 2013, Istanbul, Turkey
This contribution has been peer-reviewed. The double-blind peer-review was conducted on the basis of the full paper. 231
3.2.2 Visual Angle:
Visual angle is another significant issue because it decides the
visual impact of the target. It is considered that larger visual
angle attracts human’s attention more easily, which means
larger visual impact for the target object. Visual angle in this
research is divided into two smaller groups for better
representation in 3D world, and they are visual angle in
horizontal and vertical direction. The visible area of the target
object could be formed by integrating the two types of visual
angle value together. The horizontal visual angle is valued from
0° (to the north) and increasing clockwise to 359°, and the
vertical visual angle is ranged from -90° to 90°, with 0°
referring to the horizon.
Similar with the process for distance computation, the
calculation of visual angle must be done both for DEM (terrain)
and building models. For DEM, the visual angle for each pixel
is processed from the coordinates of viewpoint and target pixel
like the following formula, and all the visual angle value will be
changed from radius to degree:
2
0
2
0
2
0
0
02
0
2
0
0
002
0
2
0
0
)()()(arctan
)(,)()(
arccos
),(,)()(
arccos
zzyyxx
zzv
yyyyxx
yyv
yyyyyyxx
yyv
v
h
h
(2)
where vh = horizontal visual angle
vv = vertical visual angle
x0, y0, z0 = coordinates of viewpoint
x, y, z = coordinates of target
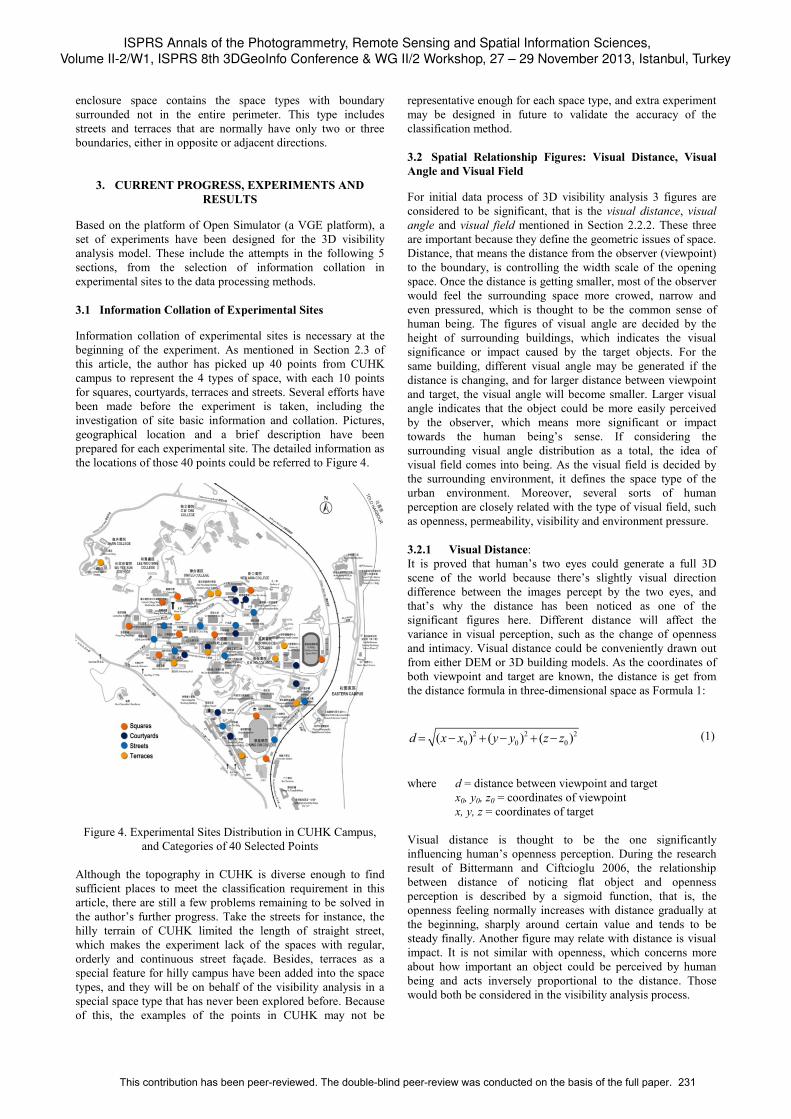
For building models, a method of bounding box is applied in
this experiment, that is to use a 3D box tightly contained the
irregular building model and do the visual angle calculation for
box only (Figure 5). For complex buildings groups of boxes
will be used, making sure that each small box is only in charge
of containing for a part of the building, and do the result
integration afterward. By calculating the visual angle value for
each vertex, the range occupied for each building will be clear.
Currently only the maximum and minimum visual angle in both
horizontal and vertical is considered. The improvement is
necessary for better representation of building visual angle
distribution.
Figure 5. Visual Angle Computation Method for Buildings:
Bounding Box is used and calculation is for each vertex, only
max and min of horizontal or vertical value is considered
3.2.3 Visual Field:
Visual field can be explained as the combination of a set of
spatial visual data for a specified viewpoint, which is based on
the idea of 3D isovist with expression method changed. It could
be recognized as the integration of distributed visual distance
and visual angle in every direction, and is closely connected
with the space type and potential influence with human’s
perception. As just mentioned, the visual distance and visual
angle will be contained and dealt separately in the generation of
visual field. The distribution of distance for the viewpoint
indicates the openness of the whole environment, and the other
of visual angle indicates the skyline and horizon of surrounding.
This spectrum-liked visual field could provide a quantified data
source for the analysis of images in the human’s mental mind,
which is perceived by the eyes.
Different visual field pattern will imply different spatial types.
Take the latter one, the vertical visual field composed by visual
angle for instance, for the square-liked pattern, the visual angle
surrounding by the observer should be more or less the same
and limited no more than a certain value; for courtyards the
visual angle value is larger, but also controllable. Because the
squares and courtyards are belonging to enclosure space types,
normally there won’t be any wide “gaps” between each visual
angle bar. But this would be different from the half-enclosure
spaces, such as streets or terraces. For streets the bar of visual
angle are high enough with two obvious gaps in two opposite
directions; for terraces the visual angle bar is similar but with
wider, more continuous gaps in between. These also could be
inferred from the percentage distribution of visual angle value.
Same information could be extracted from the distance visual
field, which is often introduced by 2D isovist theories.
Moreover, even for the same space type, the openness,
enclosure or permeability is affected by the level or distribution
of visual angle value. For enclosed space the visual angle is
relatively higher than open space; and for streets the width of
the “gaps” decides the permeability of the whole environment.
As a result, the visual field spectrum indicates different pattern
with each other but similar with the same type of urban spaces,
which could be extracted through the disciplines of spectrum.
3.3 Visual Data Computation for Terrain: by Using DEM
According to the data source layers introduced in Section 2.2.1,
visual data computation is processed separately for terrain and
buildings. DEM of CUHK Campus area is used for the
representation of terrain, with a fine resolution of 0.5m * 0.5m.
This magnitude of resolution should meet the requirement of
the experiment. DEM and TIN based visibility analysis is often
thought to be the initial study for the environmental spatial
relationship in the 3D scales. According to the methods
developed by the former scholars (Fisher-Gewirtzman et al
2005, Yang et al 2007, Morello and Ratti 2009), viewshed or
isovist extraction has often been done based on the data sources
of DEM. These progresses give the author some suggestion
about the computation of visual data in the current progressing
experiment.
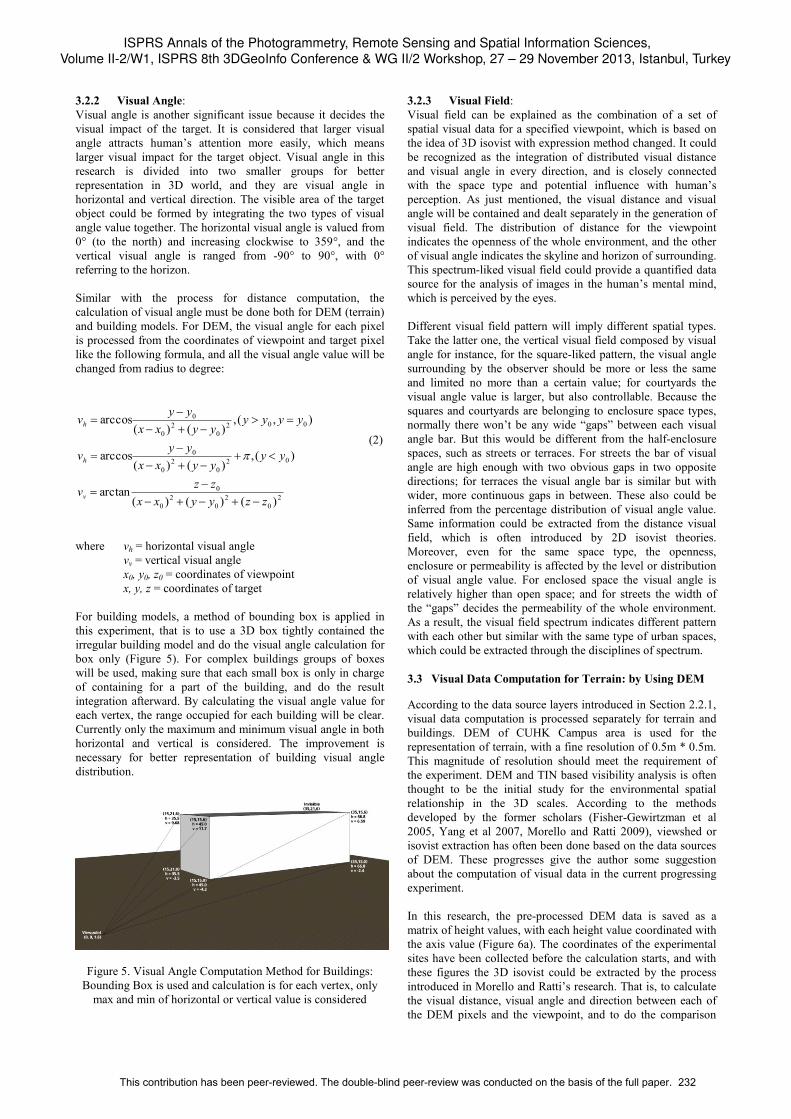
In this research, the pre-processed DEM data is saved as a
matrix of height values, with each height value coordinated with
the axis value (Figure 6a). The coordinates of the experimental
sites have been collected before the calculation starts, and with
these figures the 3D isovist could be extracted by the process
introduced in Morello and Ratti’s research. That is, to calculate
the visual distance, visual angle and direction between each of
the DEM pixels and the viewpoint, and to do the comparison
ISPRS Annals of the Photogrammetry, Remote Sensing and Spatial Information Sciences,Volume II-2/W1, ISPRS 8th 3DGeoInfo Conference & WG II/2 Workshop, 27 – 29 November 2013, Istanbul, Turkey
This contribution has been peer-reviewed. The double-blind peer-review was conducted on the basis of the full paper. 232
work between the visual angles if two directions are the same.
The largest visual angle value will be retained and marked on
the map as the 3D isovist for the target site, and the distance
would be saved together with the visual border point (Figure 6b,
6c). This data procession would be similar with that with
building models, and visual distance, visual angle and visual
field will be computed and stored sequentially in order to
intergrade with the result for buildings. After the extraction for
a series of points in 360 degrees direction, the visual field of the
viewpoint locating in each experimental site will be clear.
(a)
(b)
(c)
Figure 6. (a) DEM Used in this Experiment (CUHK Campus,
0.5m * 0.5m); (b) DEM (Height Matrix): Use the algorithm to
calculate the visual data for each pixel, and do the comparison;
(c) Visual Angle for DEM: For direction 135, take max value of
2.86 as the visual angle for Point Red (E.g.)
The visual data result for terrain cannot be used for visibility
analysis directly. For a specified view, terrain, buildings and
vegetation compose the scene of the surrounding environment,
and they cannot be separated from each other. As the DEM data
only represents the geographical visible area of terrain for a
certain viewpoint, and there may be other shelters (such as the
buildings) narrowing the visible area, especially for the
viewpoint locating in a crowded environment.
3.4 Visual Data Computation for Buildings: by Using
Models from OpenSim
The steps for building representation in 3D VGE platform are
more complicated than terrain, because of the complexity of
building shapes, structures and textures. In this article,
OpenSim models have been applied for the shape representation
of buildings, and used for the visual data computation. As there
are around 80-100 buildings in CUHK campus, computation for
each building can only be done one by one. According to a
specified scene (a viewpoint in one experimental site) Visual
distance, visual angle and visual field calculation are done for
every building and building group.
To avoid inaccurate computation, in this experiment building
models are required to be divided into smaller parts, as most of
the buildings are in irregular shapes and cannot be dealt as a
total. Smaller parts for the building will reduce the unnecessary
error in the spatial information extraction. During the
procession a bounding box restricts each part of the building,
with each vertex on the building part strictly limited inside the
surface of the box. The distance between the observer and the
target could be got from the closest vertex and the location of
viewpoint. The other figure is the building view angle, which is
decided by the maximum and minimum value of vertex
generated visual angle value in both horizontal and vertical
direction. Although this method is still not accurate enough, it is
thought to be capable for current visibility analysis.
This process should be done for every visible building inside a
certain scene, and normally there won’t be over 20 visible
objects in the same scene. Taking the site of Central Campus
Square (P1) for example (Location as Figure 7), the author has
arranged the viewpoint located in between Sir Run Run Shaw
Hall and Lady Shaw Building. There are total 18 objects
(buildings) visible from this point, and they are shown
according to the following Table 2. In this table I have listed the
distance and visual angle figure for all visible buildings
extracted from the VGE platform. For instruction, the visual
angle for a single building is expressed by a group of 4 figures,
which are the maximum and minimum of angle in horizontal
direction, and the maximum and minimum in vertical direction.
Figure 7. Map of Visible Area for P1 – Central Campus Square,
Which Also Shows the Location of Each Surrounding Building;
The View Point is in the Center and Marked with Orange
P1 - Building Visibility Figures
Name of Buildings Avg.
Dist Visual A.H. Visual A.V.
FYT Remote Sensing
Science Bldg. 175.59 3.47 -21.62 23.36 9.17
Sir Run Run Shaw Hall 52.53 27.39 -14.89 16.87 -1.21
ISPRS Annals of the Photogrammetry, Remote Sensing and Spatial Information Sciences,Volume II-2/W1, ISPRS 8th 3DGeoInfo Conference & WG II/2 Workshop, 27 – 29 November 2013, Istanbul, Turkey
This contribution has been peer-reviewed. The double-blind peer-review was conducted on the basis of the full paper. 233

Cheng Ming Bldg. 212.43 31.36 16.70 16.41 9.83
Ch'ien Mu Library 249.94 38.15 28.48 13.68 9.12
NA Water Tower 212.47 49.79 46.50 22.21 11.09
Charles K. Kao Bldg. 46.76 85.45 48.05 26.53 -0.05
Science Centre
Lecture Hall 73.08 100.92 79.86 15.72 -0.44
Ma Lin Bldg. 46.48 132.71 94.93 26.36 -7.96
Centralized Science
Laboratories Bldg. 57.76 153.80 100.97 12.45 -11.29
William M W Mong
Engineering Bldg. 151.45 156.67 141.43 0.87 -18.02
Ho Sin-Hang
Engineering Bldg. 136.05 177.76 151.32 6.72 -14.95
Lady Shaw Bldg. 19.71 234.77 147.91 5.36 -20.05
Institute of
Chinese Studies 64.46 263.70 217.87 14.00 -14.28
Beacon and
Gate of Wisdom 166.07 273.11 266.89 1.29 -0.83
University Library 194.47 275.60 271.27 10.19 -1.51
Lee Shau Kee Bldg. 319.74 275.89 275.36 8.81 -0.24
Siu Loong Pao Bldg. 122.42 287.23 275.79 7.93 -0.23
Pi Ch'iu Bldg. 23.54 337.80 278.88 28.34 -2.93
Table 2. Building Visibility Figures (Visual Distance and
Angle) for the Experimental Site of Central Campus Square
The visual data computation result implies that the author
cannot directly adopt others’ hemisphere visual model into this
research. As the result of the hilly topography feature of CUHK
campus, from the result it is obviously noticed that some
buildings are showing negative vertical visual angle in this site,
such as Lady Shaw Bldg., Ho Sin-Hang Engineering Bldg. and
William M W Mong Engineering Bldg. That is because these
three buildings are below the horizon of central campus square.
Furthermore, a few buildings are on the top of the hill, such as
FYT Remote Sensing Science Building and water towers saw
by the observer, also show a different situation from the case of
plain cities, which are generating short visual distance and large
visual angle. According to the result got for all visible
buildings, a few efforts could be made such as the computation
for the visual impacts for single buildings, which is usually
applied in the figure of environmental pressures. Normally the
pressure is thought to be proportional to the visual impacts of a
single building, and also to the value of visual angle. The
ranking of building pressure for the observer could be down by
these sets of data source, from the value of visual angle in
vertical and horizontal direction.
3.5 Integration of Visual Data for Terrain and Buildings
According to the data procession outputs for terrain and
buildings, the integration work has been done between the two
sources in visual distance and visual angle. The visual field for
each experimental site is the main output of the integration, as it
will be applied for the identification of space types and
correlation study of human’s feeling. As the definition of visual
field is a distribution of visual distance and angle in 360
directions, the comparison work is necessary to integrate the
data from terrain and building models. That is, for visual
distance sources, only smaller one will be concerned in the
integration, because it represent the visible border for the
viewpoint; for visual angle sources, the larger figure of max-
vertical one is thought to be the significant figure and used in
visual field, since it represents the skyline of the visible area.
Currently, the author has applied the conversions in a few
example sites and got some outputs. These representative sites
are: Central Campus Square, Chung Chi Lotus Pond, United
College Square and New Asia College Courtyard, which all
locate inside CUHK campus. Similar with the method of DEM
based 3D isovist (Morello and Ratti 2009), the figures of visual
field can also be generated from the VGE platform, which is
using a comparison method of visual angle in different
directions. In this preliminary study, the visual fields for these 4
points mentioned above have been computed and the output
could be referred from Figure 8 and Figure 9. Besides, a
statistics work has been done for each experimental site to see if
there are any features for the identification of its spatial type.
Figure 8. Visual Field for 4 Experimental Sites in the
Preliminary Research
The graphs of visual field represents the distribution of visible
visual angle from the observer’s location, which tents to be
similar with the skyline, although meets the rule of bigger when
closer and smaller when farther. From the visual field graphs, a
few environmental distinct features could be noticed, such as
the water towers in both United College and New Asia College,
which are showing distinct peaks and could be noticed from the
graphs. But currently, only maximum of the vertical visual
angle is used, because it is significant and marks the border
between buildings and sky. The visual fields are more or less
continuous with the value distributed in a few ranges. In this
situation, if the statistics work is done for every 15-degree or 5-
degree for the processed result, a percentage distribution of
vertical visual angle could be seen as following Figure 9.
Figure 9. Visual Field Statistics for Central Campus Square,
and Distribution of Visual Angles in 5-degree Ranges
ISPRS Annals of the Photogrammetry, Remote Sensing and Spatial Information Sciences,Volume II-2/W1, ISPRS 8th 3DGeoInfo Conference & WG II/2 Workshop, 27 – 29 November 2013, Istanbul, Turkey
This contribution has been peer-reviewed. The double-blind peer-review was conducted on the basis of the full paper. 234
For similar space types, the distribution patterns should also be
similar with each other. From this, the space pattern could be
identified and applied for further analysis, such as the
correlation between these figures and human’s feeling. Take
squares for instance, the distribution of the visual angle is
strongly restricted in the range between 5° and 30° and mostly
continuous and without any gaps; but for courtyards, the visual
angle border has relatively higher values and ranges from 25° to
50°. Although the locations are different, similar space types
will have similar visual field distribution figures. As this is a
preliminary study, more progresses are going to be found in
future, and experiments will be taken in more locations to
validate this assumption.
4. REMARKS, CONCLUSIONS AND FUTURE PLAN
This article is aiming at providing a new solution for the
relationship study between the spaces and human’s perception,
and doing the 3D visibility analysis by using the VGE platform.
According to the experiment in this article, a few conclusions
have been drawn from the author’s current research progresses.
Firstly, this article introduced the method of 3D visibility
analysis applying in the experimental sites with hilly
topography, and tried to discover a few conditions not noticed
before, such as the new space type – terraces. Then, to quantify
the spatial information in the environment and make it
measurable, the author used 3 features here as visual distance,
visual angle and visual field, which could also be applied for
the computation of openness, permeability, environmental
pressure and visibility. To avoid the inaccuracy generated by the
procession of DEM or TIN model only, in this experiment the
author developed a method of terrain and structures integration,
by using the data source from both DEM and building models.
Furthermore, after getting the results of visual data for each
single building, a ranking of building importance, pressure and
impact could be done according to the possession of the visual
angle size and distance, which is useful for us to understanding
the cognition processes of the environment. At the end, the idea
of visual field has been adopted in the identification of 4 space
types – squares, courtyards, terraces and streets, depending on
its enclosure level and continuity of visual field. These 4 types
of spaces are showing different enclosure, permeability,
environmental pressure and visibility from each other, and this
point may be focused in the further research to find out more
details about the relationship with human’s perception.
At present this research approach still has several things to do.
Vegetation is going to be led into as a factor and focused on its
effect towards human’s feeling in the certain environment.
Moreover, due to the inexperience for building models applied
in visibility analysis, the extraction method of visual angle for
buildings is necessary to be improved to achieve better
accuracy, as currently it only considered about the value in each
vertex of the bounding box in this research. The correlation
study between the spatial features and human’s feeling are
going to be carried on, and the transferring method from visual
distance, visual angle and visual field to the human’s perception
figure as enclosure or permeability will be concerned in the
future progress. Besides, proper validation work will take in the
further research to ensure the practicality of this methodology.
These goals are going to be achieved next to enrich the current
research work of the author.
5. ACKNOWLEDGEMENTS
The work described in this paper is supported by National
Natural Science Foundation of China (grant no. 41171146 and
41101370) and the Open Research Fund of Key Laboratory of
Disaster Reduction and Emergency Response Engineering of
the Ministry of Civil Affairs (grant no. LDRERE20120302).
We also appreciate the detailed suggestions and comments from
the editor and the anonymous reviewers.
REFERENCE:
Ashihara Y.. Design of Exterior Spaces. Shokokusha, Tokyo,
Japan, 1975. (芦原義信、外部空間の設計、彰国社、1975
年 in Japanese)
Benedikt M. L. To take hold of space: isovists and isovist fields.
Environment and Planning B, 1979, volume 6, pp. 47-65.
Bittermann M. Intelligent Design Objects (IDO): a cognitive
approach for performance-based design. PhD Research in Delft
University of Technology, 2009.
Fisher-Gewirtzman D., Wagner I. Spatial Openness as a
Practical Metric for Evaluating Built-Up Environments.
Environment and Planning B: Planning and Design, 2003, Vol.
30 issue 1 pp. 37-49.
Fisher-Gewirtzman D., Pinsly D. S., Wagner I. A., Burt M.
View-oriented three-dimensional visibility analysis models for
the urban environment. Urban Design International, 2005,
volume 10, pp. 23–37.
Friedman D., Steed A., Slater M. Spatial Social Behavior in
Second Life. IVA 2007, LNAI 4722, 2007, pp. 252–263.
Gould, P. On mental maps. In R. M. Downs and D. Stea (eds.)
Image and Environment: Cognitive Mapping and Spatial
Behaviour. London: Edward Arnold, 1973, pp. 182 - 220.
Kinicki J., Claypool M. Traffic Analysis of Avatars in Second
Life, NOSSDAV ’08 Braunschweig, Germany, 2008.
Leduc T., Tourre V., Woloszyn P., Miguet F. Measuring
Surrounding Space to Assess the Pedestrian Visual Aperture
Angle in the Urban Fabric: Toward a Kurtosis-Based Isovist
Indicator. Information Fusion and Geographic Information
Systems, 2011, Chapter 11, pp. 129-142.
Llobera M. Extending GIS-based visibility analysis: the concept
of visualscapes. International Journal of Geographic
Information Science, 2003, Volume 17, pp. 25-48.
Lynch K. Managing the Sense of Region. MIT Press,
Cambridge, MA, USA, 1976.
Lynch K. A Theory of Good City Form. MIT Press, Cambridge,
MA, USA, 1981.
Montgomery J. Making a City: Urbanity, Vitality and Urban
Design. Journal of Urban Design Quarterly, 1998, No 53
(January) pp. 15-17.
ISPRS Annals of the Photogrammetry, Remote Sensing and Spatial Information Sciences,Volume II-2/W1, ISPRS 8th 3DGeoInfo Conference & WG II/2 Workshop, 27 – 29 November 2013, Istanbul, Turkey
This contribution has been peer-reviewed. The double-blind peer-review was conducted on the basis of the full paper. 235

Morello E., Ratti C. A digital image of the city: 3D isovists in
Lynch’s urban analysis. Environment and Planning B: Planning
and Design, 2009, volume 36(5), pp. 837-853.
Stamps III A. E. Isovists, enclosure, and permeability theory.
Environment and Planning B: Planning and Design 2005,
volume 32, pp. 735-762.
Stamps III A. E. Visual Permeability, Locomotive Permeability,
Safety and Enclosure. Environment and Behavior, 2005,
volume 37(5), pp. 587-619.
Suleiman W., Joliveau T., Favier E. 3D Urban Visibility
Analysis with Vector GIS Data. Presented at the GISRUK,
2011, University of Portsmouth, UK, 27-29 avril 2011 April 26
(2011).
Tandy C. R. V. The isovist method of landscape survey.
Methods of Landscape Analysis, Landscape Research Group,
London, 1967, pp. 9-10
Turner A., Doxa M., O'Sullivan D., Penn A. From isovists to
visibility graphs: a methodology for the analysis of
architectural space. Environment and Planning B: Planning and
Design, 2001, volume 28, pp. 103-121
Turner A., Penn A. Making isovists syntactic: isovist
integration analysis. 2nd International Symposium on Space
Syntax, Universidad de Brasilia, Brazil, April 1999.
Yang P. P., Putra S. Y., Li W. J. Viewsphere: a GIS-based 3D
visibility analysis for urban design evaluation. Environment
and Planning B: Planning and Design, 2007, volume 34, pp.
971-992.
ISPRS Annals of the Photogrammetry, Remote Sensing and Spatial Information Sciences,Volume II-2/W1, ISPRS 8th 3DGeoInfo Conference & WG II/2 Workshop, 27 – 29 November 2013, Istanbul, Turkey
This contribution has been peer-reviewed. The double-blind peer-review was conducted on the basis of the full paper. 236


![Packet Loss Visibility Across SD, HD, 3D, and UHD Video ... · Packet Loss Visibility (PLV) [1][2] appraises video quality according to the network response and in doing so may cut](https://img.pdfslide.us/doc/110x75/6013ebfe85424336d32b6922/packet-loss-visibility-across-sd-hd-3d-and-uhd-video-packet-loss-visibility.jpg)