Embed Size (px)
Citation preview
8/10/2019 3D-QSAR CNS.pdf
http://slidepdf.com/reader/full/3d-qsar-cnspdf 1/11
European Journal of Medicinal Chemistry 37 (2002) 219–229
Original article
Local intersection volume: a new 3D descriptor applied to developa 3D-QSAR pharmacophore model for benzodiazepine receptor
ligands
Hugo Verli a,b, Magaly Girao Albuquerque b,*, Ricardo Bicca de Alencastro b,Eliezer J. Barreiro a
a Laboratorio de Aaliacao e Sıntese de Substancias Bioati as ( LASSBio ) , Departamento de Farmacos, Faculdade de Farmacia,
Centro de Ciencias da Saude, Uni ersidade Federal do Rio de Janeiro, CP 68006 , Rio de Janeiro, RJ 21944 -970 , Brazil b Laboratorio de Modelagem Molecular ( LabMMol ) , Departamento de Quımica Organica, Instituto de Quımica,
Centro de Ciencias Matematicas e da Natureza, Uni ersidade Federal do Rio de Janeiro, CT , Bloco A, Lab. 609 , Rio de Janeiro,
RJ CEP 21949 -900 , Brazil
Received 15 June 2001; received in revised form 3 January 2002; accepted 7 January 2002
Abstract
In this work, we have developed a new descriptor, named local intersection volume (LIV), in order to compose a 3D-QSAR
pharmacophore model for benzodiazepine receptor ligands. The LIV can be classified as a 3D local shape descriptor in
contraposition to the global shape descriptors. We have selected from the literature 49 non-benzodiazepine compounds as a
training data set and the model was obtained and evaluated by genetic algorithms (GA) and partial least-squares (PLS) methods
using LIVs as descriptors. The LIV 3D-QSAR model has a good predictive capacity according the cross-validation test by
‘leave-one-out’ procedure (Q2=0.72). The developed model was compared to a comprehensive and extensive SAR pharma-
cophore model, recently proposed by Cook and co-workers, for benzodiazepine receptor ligands [J. Med. Chem. 43 (2000) 71]. Itshowed a relevant correlation with the pharmacophore groups pointed out in that work. Our LIV 3D-QSAR model was also able
to predict affinity values for a series of nine compounds (test data set) that was not included into the training data set. © 2002
Editions scientifiques et medicales Elsevier SAS. All rights reserved.
Keywords: 3D-quantitative structure–activity relationship; Benzodiazepine receptor; Local intersection volume; Volume descriptor
www.elsevier.com/locate/ejmech
1. Introduction
The -aminobutyric acid (GABA), one of the major
inhibitory neurotransmitters in the mammalian central
nervous system (CNS), binds to type GABA receptor A(GABAA) [1,2], a ligand-gated chloride ion channel [2].
The GABAA/benzodiazepine receptor (GABAA/BzR)
recognizes a large spectrum of compounds from diffe-
rent chemical classes that are grouped together as ben-
zodiazepine receptor ligands. Of these, benzodiazepine
constitutes a well-known class of therapeutics displaying
hypnotic, anxiolytic and anticonvulsant effects. Conse-
quently, there has been an intensive search for GABA
modulatory agents via GABAA/BzR with a non-benzo-
diazepine structure and an improved therapeutic profile
[3].
Benzodiazepine enhances allosterically the actions of
GABA at GABAA receptors by increasing the fre-
quency of the opening of the chlorine channel, poten-tiating the inhibitory GABA action in the brain. The
consequent effect of this action is a continuum of
intrinsic efficacy, ranging from positive efficacy (ago-
nists causing anxiolytic, anticonvulsant, and sedative
effects), through null efficacy (antagonists), to negative
efficacy (inverse agonist causing anxiogenic, stimulant,
proconvulsant, and convulsant effects). Partial agonists
and partial inverse agonists exist among these three
categories [1–3].
Different pharmacophore models have been pro-
posed for the benzodiazepine receptor site [4]. Accor-
ding to structure–activity relationship (SAR) studies, a* Corresponding author. Tel./fax: +55-21-2562-7132/7256.E -mail address: [email protected] (M.G. Albuquerque).
0223-5234/02/$ - see front matter © 2002 Editions scientifiques et medicales Elsevier SAS. All rights reserved.
PII: S 0 2 2 3 - 5 2 3 4 ( 0 2 ) 0 1 3 3 4 - X
8/10/2019 3D-QSAR CNS.pdf
http://slidepdf.com/reader/full/3d-qsar-cnspdf 2/11
H . Verli et al . / European Journal of Medicinal Chemistry 37 (2002) 219 – 229 220
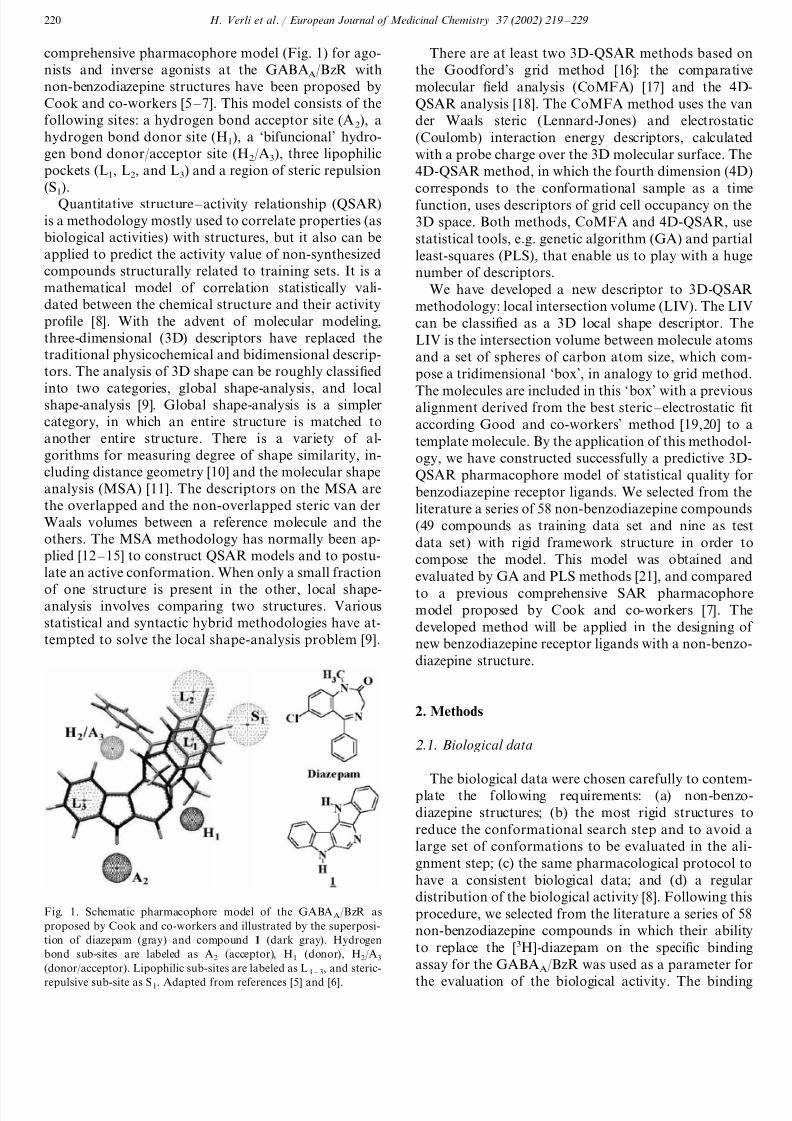
comprehensive pharmacophore model (Fig. 1) for ago-
nists and inverse agonists at the GABAA/BzR with
non-benzodiazepine structures have been proposed by
Cook and co-workers [5 – 7]. This model consists of the
following sites: a hydrogen bond acceptor site (A2), a
hydrogen bond donor site (H1), a ‘bifuncional’ hydro-
gen bond donor/acceptor site (H2/A3), three lipophilic
pockets (L1, L2, and L3) and a region of steric repulsion
(S1).Quantitative structure – activity relationship (QSAR)
is a methodology mostly used to correlate properties (as
biological activities) with structures, but it also can be
applied to predict the activity value of non-synthesized
compounds structurally related to training sets. It is a
mathematical model of correlation statistically vali-
dated between the chemical structure and their activity
profile [8]. With the advent of molecular modeling,
three-dimensional (3D) descriptors have replaced the
traditional physicochemical and bidimensional descrip-
tors. The analysis of 3D shape can be roughly classified
into two categories, global shape-analysis, and localshape-analysis [9]. Global shape-analysis is a simpler
category, in which an entire structure is matched to
another entire structure. There is a variety of al-
gorithms for measuring degree of shape similarity, in-
cluding distance geometry [10] and the molecular shape
analysis (MSA) [11]. The descriptors on the MSA are
the overlapped and the non-overlapped steric van der
Waals volumes between a reference molecule and the
others. The MSA methodology has normally been ap-
plied [12 – 15] to construct QSAR models and to postu-
late an active conformation. When only a small fraction
of one structure is present in the other, local shape-
analysis involves comparing two structures. Various
statistical and syntactic hybrid methodologies have at-
tempted to solve the local shape-analysis problem [9].
There are at least two 3D-QSAR methods based on
the Goodford’s grid method [16]: the comparative
molecular field analysis (CoMFA) [17] and the 4D-
QSAR analysis [18]. The CoMFA method uses the van
der Waals steric (Lennard-Jones) and electrostatic
(Coulomb) interaction energy descriptors, calculated
with a probe charge over the 3D molecular surface. The
4D-QSAR method, in which the fourth dimension (4D)
corresponds to the conformational sample as a timefunction, uses descriptors of grid cell occupancy on the
3D space. Both methods, CoMFA and 4D-QSAR, use
statistical tools, e.g. genetic algorithm (GA) and partial
least-squares (PLS), that enable us to play with a huge
number of descriptors.
We have developed a new descriptor to 3D-QSAR
methodology: local intersection volume (LIV). The LIV
can be classified as a 3D local shape descriptor. The
LIV is the intersection volume between molecule atoms
and a set of spheres of carbon atom size, which com-
pose a tridimensional ‘box’, in analogy to grid method.
The molecules are included in this ‘box’ with a previousalignment derived from the best steric – electrostatic fit
according Good and co-workers’ method [19,20] to a
template molecule. By the application of this methodol-
ogy, we have constructed successfully a predictive 3D-
QSAR pharmacophore model of statistical quality for
benzodiazepine receptor ligands. We selected from the
literature a series of 58 non-benzodiazepine compounds
(49 compounds as training data set and nine as test
data set) with rigid framework structure in order to
compose the model. This model was obtained and
evaluated by GA and PLS methods [21], and comparedto a previous comprehensive SAR pharmacophore
model proposed by Cook and co-workers [7]. The
developed method will be applied in the designing of
new benzodiazepine receptor ligands with a non-benzo-
diazepine structure.
2. Methods
2 .1. Biological data
The biological data were chosen carefully to contem-plate the following requirements: (a) non-benzo-
diazepine structures; (b) the most rigid structures to
reduce the conformational search step and to avoid a
large set of conformations to be evaluated in the ali-
gnment step; (c) the same pharmacological protocol to
have a consistent biological data; and (d) a regular
distribution of the biological activity [8]. Following this
procedure, we selected from the literature a series of 58
non-benzodiazepine compounds in which their ability
to replace the [3H]-diazepam on the specific binding
assay for the GABAA
/BzR was used as a parameter for
the evaluation of the biological activity. The binding
Fig. 1. Schematic pharmacophore model of the GABAA/BzR as
proposed by Cook and co-workers and illustrated by the superposi-
tion of diazepam (gray) and compound 1 (dark gray). Hydrogen
bond sub-sites are labeled as A2 (acceptor), H1 (donor), H2/A3
(donor/acceptor). Lipophilic sub-sites are labeled as L1 – 3, and steric-repulsive sub-site as S1. Adapted from references [5] and [6].
8/10/2019 3D-QSAR CNS.pdf
http://slidepdf.com/reader/full/3d-qsar-cnspdf 3/11
H . Verli et al . / European Journal of Medicinal Chemistry 37 (2002) 219 – 229 221
af finities measured as IC50 (nM) were converted to IC50
(M) and then converted to pIC50, and those expressed
as K i (nM) were first converted to IC50 (M) according
to Cheng and Prussoff equation [22].
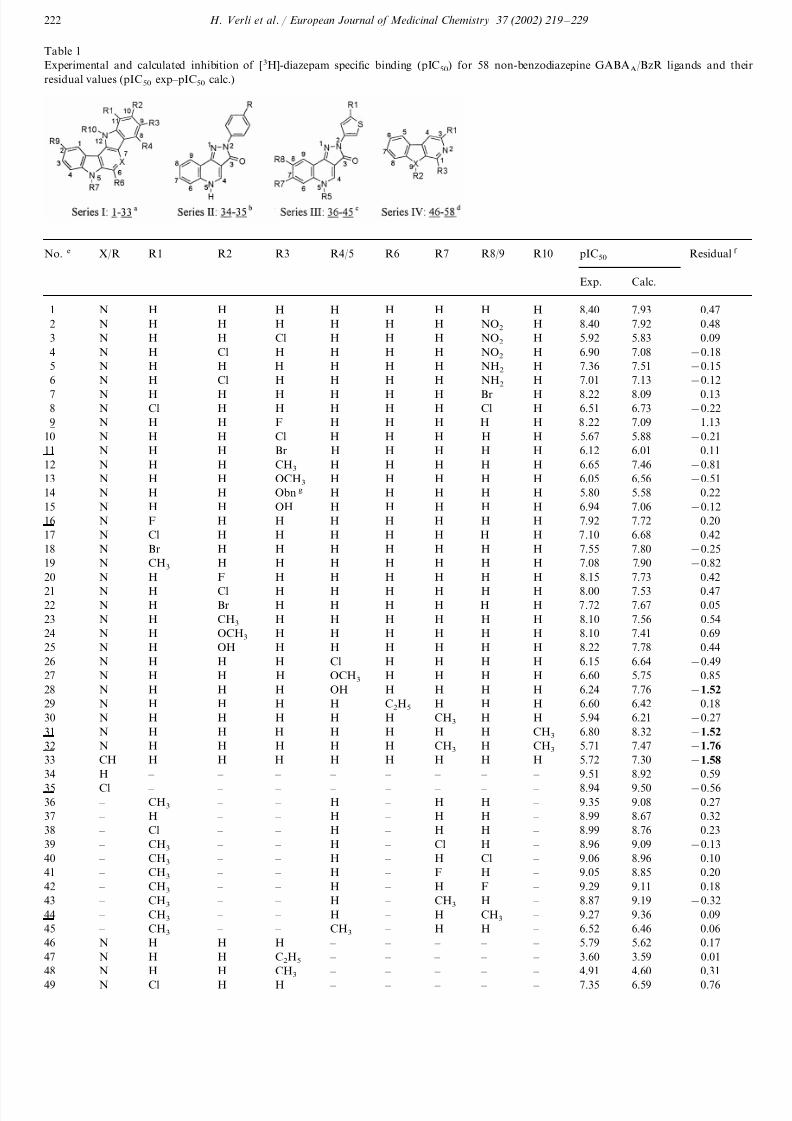
The structures and biological activities for the 58
compounds are shown in Table 1 and they represent
four different classes of non-benzodiazepine structures.
The first series comprise dihydroindolo--carboline
compounds 1 – 32 [23,24] and the related analogue 33[24,25]. The second and third series comprise dihydro-
pyrazolo-quinolinone compounds 34 and 35 [24,26 – 28]
and 36 – 45 [27,28], respectively. The fourth series com-
prise -carboline compounds 46 – 53 [24] and their re-
lated analogues 54 – 58 [24]. The first series represents
the most rigid and bulky class of compounds. There-
fore, we may suppose that it will fill the cavity space in
the GABAA/BzR site better than the other compounds
would. The second and third series have almost the
same size of first series, but more conformational free-
dom. The fourth series, like the first series, represents a
rigid class, but as it is less bulky, we may suppose thatit will not fill the cavity space in the GABAA/BzR site
as well as the previous series does.
2 .1.1. The training data set
The 3D-QSAR model was developed using a set of
49 compounds (1 – 8, 10, 12 – 15, 17 – 30, 33, 34, 36 – 43,
45 – 49, and 52 – 58), randomly selected from the original
58 compounds. We were careful to include all classes of
compounds in this data set.
2 .1.2 . The test data setThe 3D-QSAR model was externally validated with
the use of nine compounds (9, 11, 16, 31, 32, 35, 44, 50,
and 58), randomly selected from the original 58 com-
pounds. We were careful to include all classes of com-
pounds in this data set to validate the model.
2 .2 . Molecular modeling
2 .2 .1. General software and hardware
Calculations using INSIGHT II [29], MOPAC 93 [30],
and WOLF 6.2 [31] computational programs were per-formed on an O
2 Silicon Graphics R5000 and R10000
workstation, under the UNIX based-operational system
IRIX 6.3. Calculations using MOPAC 6.0 [32] and
MOLDEN [33] computational programs were performed
on a Pentium II 266 MHz PC.
2 .2 .2 . Conformational search
Three-dimensional models of each of the 58 com-
pounds reported in Table 1 in their neutral forms, were
constructed using the Sketcher module from the IN-
SIGHT II software [29]. As a first step, the structures
were geometry-optimized using the CVFF molecular
mechanics force field [34] from the INSIGHT II software
[29]. Each structure was then submitted to the MOPAC
6.0 semi-empirical software [32] for geometry-optimiza-
tion and conformational search. The optimization was
done without any geometrical restriction, and the fol-
lowing keywords were used: AM1, PRECISE, EF,
HESS=1; in the conformational search the following
were used: AM1, STEP=30, POINT=13,
GNORM=1.0.As we have selected the most rigid structures, a
conformational search was performed only for com-
pounds 13 – 15, 24, 25, 27 – 29, 36 – 45, 47, 51 – 58 in
which the first torsion angle was rotated through 360°
with an increment of 30°, obtaining 12 geometries
starting with the AM1 geometry from the optimization
step. We have selected four geometries (0, 90, 180, and
270°) from the 12 conformers, obtained at the first
torsion angle, to rotate the second torsion angle
through 360° with the same angle increment. From the
12 geometries obtained, another four were selected to
rotate the third torsion angle, and so on.In order to discard duplicated conformations or very
similar conformations, the conformations obtained
were selected by means of root-mean-square (RMS)
distance. All geometries for each compound were super-
imposed using all atoms. The 20 geometries that show
the highest RMS values were selected because our goal
is to find neither every conformation nor the global
minimum conformation. Instead, we are trying to ge-
nerate the most distinct conformations. The global
minimum conformation was not used as there is no
guarantee that this geometry is the bioactive one; any-way, the energy barriers of these compounds are ca. 5
kcal mol−1, which are lower enough to be overcome in
biological conditions. The RMS fitting was realized in
the Search – Compare module from the INSIGHT II soft-
ware [29]. The final conformation for each compound
used to generate the model was selected from the
original generated conformations by means of the best
steric – electrostatic fit to a reference compound.
2 .2 .3 . Electrostatic potential deri ed charges ( ESPq ) To obtain the charges that will be used in the align-
ment step, the resultant geometries from the conforma-
tional search for the 58 compounds have been
submitted to an electrostatic potential derived charges
(ESPq) calculation. The partial atomic charges derived
from the molecular electrostatic potential (MEP) [35]
were calculated using the MOPAC 93 program [30,32] to
which the following keywords were applied: AM1, ESP,
POTWRT. The default partial atomic charges (q) were
replaced by the derived ESPq in the resumed output file
from MOPAC 93 program so as to import them into the
INSIGHT II software [29].
8/10/2019 3D-QSAR CNS.pdf
http://slidepdf.com/reader/full/3d-qsar-cnspdf 4/11
H . Verli et al . / European Journal of Medicinal Chemistry 37 (2002) 219 – 229 222
Table 1
Experimental and calculated inhibition of [3H]-diazepam specific binding (pIC50) for 58 non-benzodiazepine GABAA/BzR ligands and their
residual values (pIC50 exp – pIC50 calc.)
R1 R2 R3 R4/5No. e R6X/R R7 R8/9 R10 pIC50 Residual f
Exp. Calc.
H H H H H1 HN H H 8.40 7.93 0.47
2 N H H H H H H NO2 H 8.40 7.92 0.48
H H Cl H H H3 NO2N H 5.92 5.83 0.09
H Cl H H H HN NO24 H 6.90 7.08 −0.18
H H H H H H5 NH2N H 7.36 7.51 −0.15
H Cl H H H HN NH26 H 7.01 7.13 −0.12
N7 H H H H H H Br H 8.22 8.09 0.13
Cl H H H H HN Cl8 H 6.51 6.73 −0.22
N9 H H F H H H H H 8.22 7.09 1.13
N10 H H Cl H H H H H 5.67 5.88 −0.21
H H Br H H HN H11 H 6.12 6.01 0.11
H H CH3 H H H12 HN H 6.65 7.46 −0.81
H H OCH3 H H HN H13 H 6.05 6.56 −0.51
N14 H H Obn g H H H H H 5.80 5.58 0.22
H H OH H H HN H15 H 6.94 7.06 −0.12
N16 F H H H H H H H 7.92 7.72 0.20
N17 Cl H H H H H H H 7.10 6.68 0.42
Br H H H H HN H18 H 7.55 7.80 −0.25
N19 CH3 H H H H H H H 7.08 7.90 −0.82
H F H H H H20 HN H 8.15 7.73 0.42
H Cl H H H HN H21 H 8.00 7.53 0.47
N22 H Br H H H H H H 7.72 7.67 0.05
H CH3 H H H H H H 8.1023 7.56N 0.54
H OCH3 H H H HN H24 H 8.10 7.41 0.69
H OH H H H H25 HN H 8.22 7.78 0.44
H H H Cl H HN H26 H 6.15 6.64 −0.49
N27 H H H OCH3 H H H H 6.60 5.75 0.85
H H H OH H HN H28 H 6.24 7.76 −1.52
N29 H H H H C2H5 H H H 6.60 6.42 0.18
H H H H H CH330 HN H 5.94 6.21 −0.27
H H H H H HN H31 CH3 6.80 8.32 −1.52
H H H H H CH332 HN CH3 5.71 7.47 −1.76
H H H H H HCH H33 H 5.72 7.30 −1.58
H34 – – – – – – – – 9.51 8.92 0.59 – – – – – – Cl – 35 – 8.94 9.50 −0.56
– 36 CH3 – – H – H H – 9.35 9.08 0.27
H – 37 – – H – H H – 8.99 8.67 0.32
Cl – – H – H – H38 – 8.99 8.76 0.23
CH3 – – H – Cl39 H – – 8.96 9.09 −0.13
CH3 – – H – H – Cl40 – 9.06 8.96 0.10
– 41 CH3 – – H – F H – 9.05 8.85 0.20
CH3 – – H – H – F42 – 9.29 9.11 0.18
– 43 CH3 – – H – CH3 H – 8.87 9.19 −0.32
CH3 – 44 – – H – H CH3 – 9.27 9.36 0.09
CH3 – – CH3 – H – H45 – 6.52 6.46 0.06
N46 H H H – – – – – 5.79 5.62 0.17
H H C2H5 – – – – – 3.6047 3.59N 0.01
H H CH3 – – – N – 48 – 4.91 4.60 0.31Cl H49 HN – – – – – 7.35 6.59 0.76
8/10/2019 3D-QSAR CNS.pdf
http://slidepdf.com/reader/full/3d-qsar-cnspdf 5/11
H . Verli et al . / European Journal of Medicinal Chemistry 37 (2002) 219 – 229 223
Table 1 (Continued )
No. e R8/9X/R R1 R2 R3 R4/5 R6 R7 Residual f pIC50R10
Exp. Calc.
– 0.81 – – 6.90 6.0950 N NO2 H H – –
51 −1.016.415.40 – – – – – HHOHN
5.866.91 – – – – 1.05 – HHOCH3N52
– – – – – 8.30 6.93 1.3753 N CO2CH3 H H
−1.18 – – – 4.59 5.7754 C CO2C2H5 O H – – – – – – – 5.30 4.67 0.6355 C CO2C2H5 NOH H
−1.496.535.04 – – – – 56 – H – CO2C2H5O
– – – 6.17 – – H – CO2C2H5CH257 6.51 −0.34
– −0.64S CO2C2H558 H – – 6.415.77 – – –
a Ref. [23 – 25].b Ref. [24,26 – 28].c Ref. [27,28].d Ref. [24].e The underlined compound numbers are from the test data set.f The residual values in bold are the outlier compounds (2×SD of the residual values for the training data set).g Obn=benzyloxy.
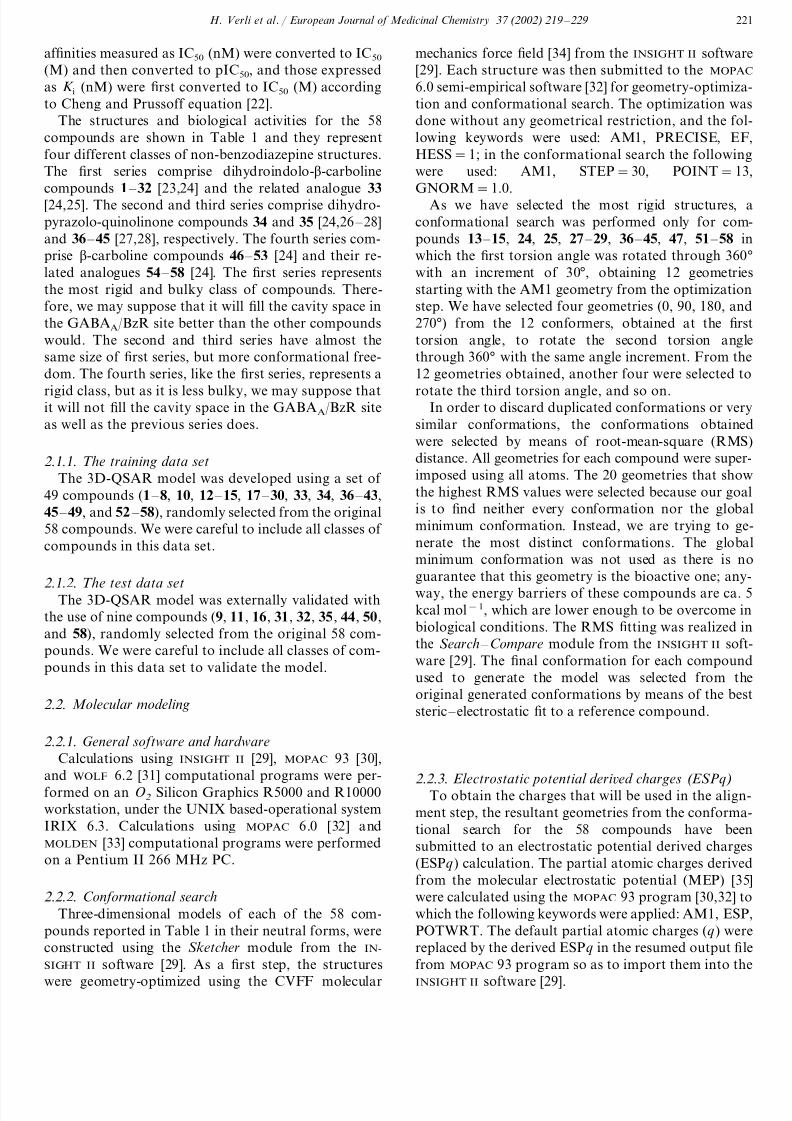
2 .2 .4 . The grid matrix of hard spheres
In analogy to the grid method [16], we have con-
structed a grid matrix of 206 hard spheres, composed
by unitary cells, corresponding to a quadrangular base
pyramid (Fig. 2). The pyramid vertices correspond to
the Cartesian coordinates of the five carbon atoms and
their arrest lengths are 3.08 A (twice the carbon van der
Waals radii, 1.54 A ). The grid matrix was assembled
using the MOLDEN program [33]. The grid matrix of
carbon atoms was imported into the INSIGHT II pro-
gram [29] where we calculated the volume for each hard
sphere, using a radii length of 1.54 A in the Search – Compare module. Therefore, we have composed a grid
matrix of hard spheres where the volumes of each
sphere do not overlap each other. We have chosen the
quadrangular base pyramid figure because it means a
lower volume lost among the hard spheres, than a cubic
organization of the carbon atoms would mean. How-
ever, it is possible to use different geometric figures and
different scale factors for the van der Waals radii,
having in mind that we cannot lose so much informa-
tion in terms of volumes between the spheres.
2 .2 .5 . Alignment rules
The alignment step is critical for the development of
3D-QSAR and of pharmacophore models. The most
common alignment procedure is based on the RMS
fitting. Unfortunately, it does not take into account the
steric and electrostatic profiles of the compounds,
which leads a different orientation on the receptor site.For this reason, we have used a combined approach
applying a steric – electrostatic fitting [19,20] that needs
a previous alignment by RMS. The reference com-
pound chosen for the alignment step was compound 1.
It was chosen because its series is the most representa-
tive one for the following reasons: we have more com-
pounds from this class than from all the others;
presents the highest occupation level of the receptor
site; it is the most rigid compound, and a highly active
one. The overall alignment step was performed using
standard tools, available in the Search – Compare mo-
dule of the INSIGHT II program [29]. Compound 1 wasinserted in the grid matrix by the superimposition of
the Alternate – Space Axes of both compound 1 and the
grid matrix. Each conformation of the 58 compounds
was then superimposed to compound 1 (the reference
compound) in a two-step alignment procedure.
(a) Pre-alignment step by RMS : we have selected two
or three atoms from each compound to be pre-aligned
to the corresponding atoms of the reference compound
1 by RMS procedure. We have used two criteria to
choose these atoms. First, they are in accordance with
the proposed pharmacophore groups in the Cook and
co-workers’ model (Fig. 1) [7]. Secondly, we have
Fig. 2. The grid matrix of hard spheres (A) composed by the
quadrangular base pyramid unitary cell (B), and the associatedcarbon atom volumes (C) used to calculate the LIVs.
8/10/2019 3D-QSAR CNS.pdf
http://slidepdf.com/reader/full/3d-qsar-cnspdf 6/11
H . Verli et al . / European Journal of Medicinal Chemistry 37 (2002) 219 – 229 224
selected only atoms from the rigid heterocycle frame-
work of all compounds to avoid conformational uncer-
tainty when choosing atoms from the flexible chains.
Atom numbers (Table 1) 5 , 7 , and 12 from compound
1 were, respectively, superimposed to: atom numbers 5 ,
7 , and 12 of compounds 2 – 33; atom numbers 5 , 3 , and
1 of compounds 34, 35, 36 – 45; atom numbers 9 and 2
of compounds 46 – 58. As it may be seen, there is no
correspondence for atom number 12 of compound 1 inthe last series, although maybe we could find corre-
sponding atoms if we looked at the substituent R1
(Table 1). However, since we are choosing only atoms
from the rigid heterocycle framework of all compounds,
we have discarded these options. Anyway, the RMS
pre-alignment step is only an initial step for the subse-
quent alignment by steric – electrostatic fit [36].
(b) Alignment by steric and electrostatic fit: subse-
quent to the pre-alignment step, we have realized a
steric and electrostatic fit. The similarity index is in
accordance with the method proposed by Good and
co-workers [19,20] to evaluate the steric and electro-static potential similarity between a pair of molecules.
We have used the default option for the weights of the
steric and electrostatic factors (50%). We have used the
steric and electrostatic fit with the purpose of not only
obtaining the spatial orientation of each compound in
the receptor site, but also as a parameter to select the
‘best’ conformation for interaction with the receptor.
This means that those conformations represent the
‘bioactive’ conformations in the cases in which we have
generated multiple conformations. As it will be seen
later, the LIV descriptors are volume descriptors, andso the steric – electrostatic fit is used to include in the
3D-QSAR-pharmacophore model a ‘sense’ of electronic
property.
2 .2 .6 . The local intersection olume ( LIV ) descriptors
After the superimposition of the 58 compounds to
reference compound 1, according to the described align-
ment procedure, we have performed the molecular volu-
me calculation for each of the 58 compounds, using the
van der Waals radii. Subsequently, we have calculated
the intersection volume (or the overlapped volume — the 3D-QSAR descriptors) between the molecular volu-
me of each compound (1 – 58) and the volume of each
hard sphere that composes the grid matrix. We have
named this intersection volume local intersection olume
(LIV) since it can be located in 3D space according to
its Cartesian coordinates. Consequently, for each com-
pound, we have a set of LIV descriptors (independent
variables) and their corresponding biological activities
(dependent variables). The molecular volume and the
intersection volume calculations were performed using
the tools available in the Search – Compare module of
the INSIGHT II program [29].
2 .2 .7 . Data reduction
Two levels of data reduction were considered. The
first, a preliminary data reduction, uses both of the
following filtering criteria; one filter to exclude LIV
descriptors the variance of which (self-variance) over
the whole set of compounds is zero; other to eliminate
LIV descriptors in which the compound occurrence is
less than six. The first criterion excludes useless vari-
ables and the second harmonizes the data, not taking
into account structural peculiarities of a few com-
pounds, both criteria functions as a noise data reduc-
tion. A second level of data reduction consists of
constructing 3D-QSAR models using a genetic al-
gorithm optimization; i.e. at the same time, a data
reduction (variable selection) and a model construction.
As a next step in this study we employed in 3D-QSAR
model building and optimization, the genetic function
approximation (GFA) [37], using the WOLF 6.2 soft-
ware [31], implemented with PLS regression [21].
2 .2 .8 . 3 D-QSAR model calculation: GA-PLS approachThe GA-PLS optimizations were initiated using 200
randomly generated models (functions or equations),
each model depending on four independent variables
(base functions). Mutation probability over the
crossover optimization was set to a rate of 200% at
each ten-crossover operation. The smoothing factor
was set at 0.01. It controls the number of independent
variables in the models. We have used three compo-
nents for the PLS regression and 20 000-crossover oper-
ations. All other options were left in their default
values. The five best 3D-QSAR models as scored by the
lack-of-fit (LOF) measure [37] from the GA-PLS analy-sis were evaluated by an internal validation process.
The internal validation process was carried out by the
‘leave-one-out’ cross-validation procedure, using the
training data set. The test data set was used only for the
external validation process. The GA-PLS analysis was
performed using the WOLF 6.2 software [31].
3. Results and discussion
3 .1. Statistical parameters for the LIV 3 D-QSAR
model for GABAA/BzR ligands
The GA-PLS analysis gave us a series of good equa-
tions or good models. From them we chose the one
which had the highest activity prediction (Q2=0.722)
and the lowest number of variables (eight descriptors),
namely Eq. (1). The cross-correlation coef ficients of the
selected descriptors in Eq. (1) were calculated (data not
shown) in order to verify the non-redundancy of infor-
mation. The highest value was found for the pair of
descriptors LIV – 065 and LIV – 110 (R=−0.49), and
so we do not have high internal correlation among the
selected variables.
8/10/2019 3D-QSAR CNS.pdf
http://slidepdf.com/reader/full/3d-qsar-cnspdf 7/11
H . Verli et al . / European Journal of Medicinal Chemistry 37 (2002) 219 – 229 225
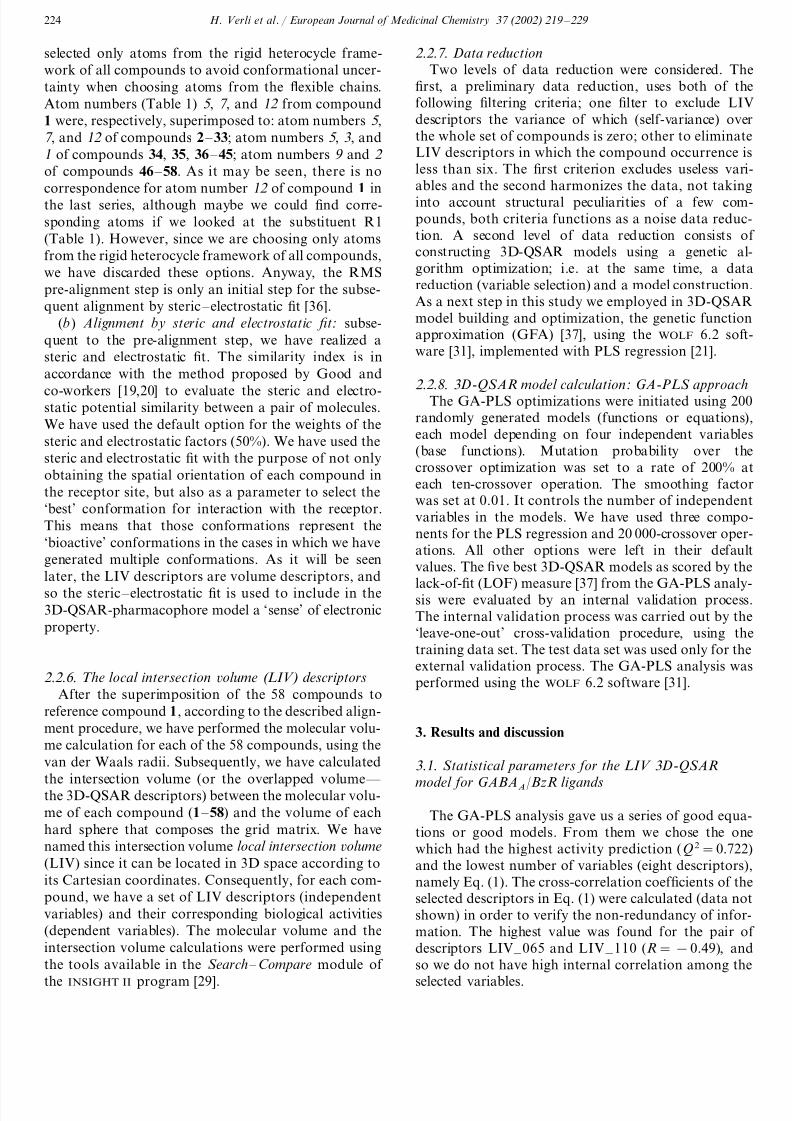
Fig. 3. Graphical representation of the LIV 3D-QSAR pharma-
cophore model for ligands of GABAA/BzR proposed in this work
using compound 1 as reference. LIVs of positive contribution (gray):
110, 130, and 139. LIVs of negative contribution (dark gray): 065,074, 111, 140, and 168. The LIVs descriptors are represented in their
maximum size.
data set, in accordance with the internal validation
process. The experimental af finity (pIC50 exp) and the
predicted af finity (pIC50 calc.) values can be seen in
Table 1 for the test data set.
3 .2 . Graphical representation for the LIV 3 D-QSAR
model for GABAA/BzR ligands
Fig. 3 shows a graphical 3D representation of thebest model (Eq. (1)) in which the LIVs are represented
as hard spheres in their maximal intersection volume
possible, using compound 1 as a template. Therefore,
this is not the representation of the LIV values for
compound 1. The LIVs that contribute positively for
the af finity are LIVs 110, 130, and 139, all of them
located on the core framework of compound 1. This
means that there is an almost constant contribution
from these variables to the af finity, since the com-
pounds are not so flexible. The LIVs that contribute
negatively for the af finity are LIVs 065, 074, 111, 140,and 168, all of them located around the core framework
of compound 1, more precisely at the northeast, the
south and the east sides of this compound. This means
that there is a steric limitation near these sides. On the
other hand, we could not observe a LIV on the north,
northwest, or west side of the molecule.
Although there is no significant internal cross-corre-
lation between the descriptors (data not shown), we
have observed a cooperative behavior between LIV – 110 of positive contribution and two LIVs of negative
contribution: LIV – 111 and LIV – 140. At a glance,LIV – 111 and LIV – 140 correspond to substituents on
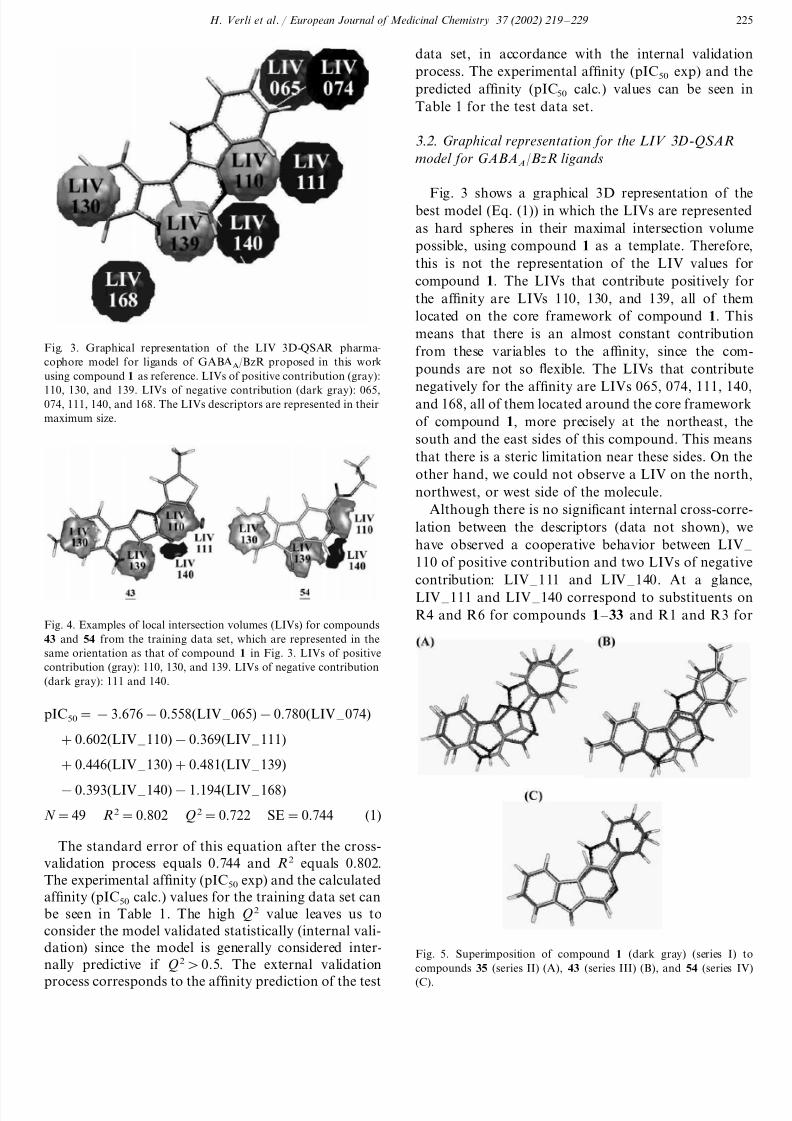
R4 and R6 for compounds 1 – 33 and R1 and R3 forFig. 4. Examples of local intersection volumes (LIVs) for compounds
43 and 54 from the training data set, which are represented in the
same orientation as that of compound 1 in Fig. 3. LIVs of positive
contribution (gray): 110, 130, and 139. LIVs of negative contribution
(dark gray): 111 and 140.
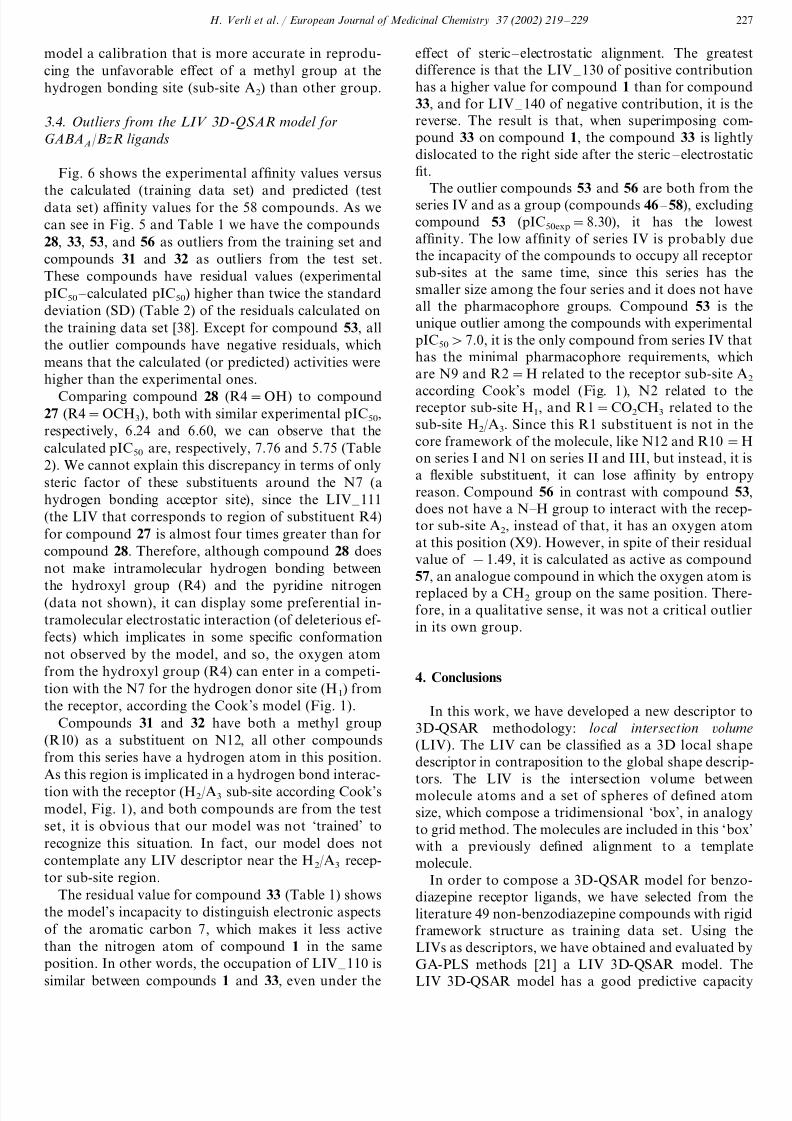
Fig. 5. Superimposition of compound 1 (dark gray) (series I) to
compounds 35 (series II) (A), 43 (series III) (B), and 54 (series IV)(C).
pIC50=−3.676−0.558(LIV – 065)−0.780(LIV – 074)
+0.602(LIV – 110)−0.369(LIV – 111)
+0.446(LIV – 130)+0.481(LIV – 139)
−0.393(LIV – 140)−1.194(LIV – 168)
N =49 R2=0.802 Q2=0.722 SE=0.744 (1)
The standard error of this equation after the cross-
validation process equals 0.744 and R2 equals 0.802.
The experimental af finity (pIC50 exp) and the calculated
af finity (pIC50 calc.) values for the training data set can
be seen in Table 1. The high Q2 value leaves us to
consider the model validated statistically (internal vali-
dation) since the model is generally considered inter-
nally predictive if Q20.5. The external validation
process corresponds to the af finity prediction of the test
8/10/2019 3D-QSAR CNS.pdf
http://slidepdf.com/reader/full/3d-qsar-cnspdf 8/11
H . Verli et al . / European Journal of Medicinal Chemistry 37 (2002) 219 – 229 226
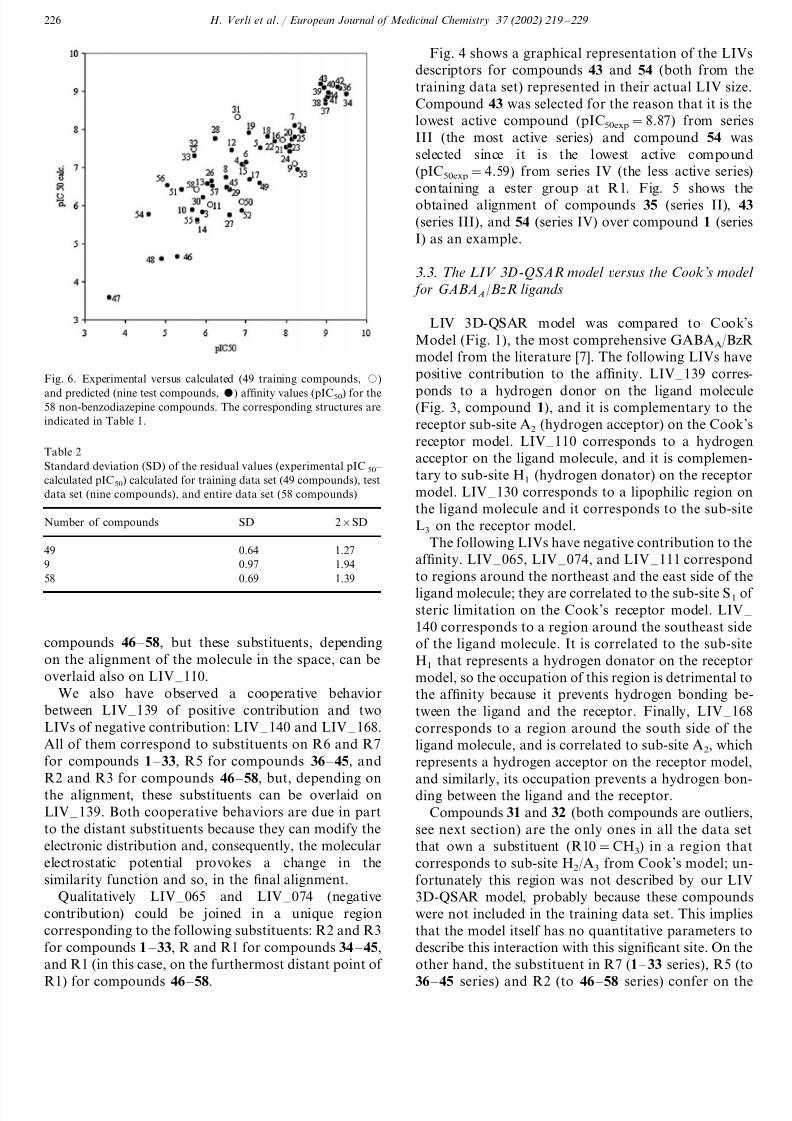
Fig. 6. Experimental versus calculated (49 training compounds, )
and predicted (nine test compounds, ) af finity values (pIC50) for the
58 non-benzodiazepine compounds. The corresponding structures are
indicated in Table 1.
Fig. 4 shows a graphical representation of the LIVs
descriptors for compounds 43 and 54 (both from the
training data set) represented in their actual LIV size.
Compound 43 was selected for the reason that it is the
lowest active compound (pIC50exp=8.87) from series
III (the most active series) and compound 54 was
selected since it is the lowest active compound
(pIC50exp=4.59) from series IV (the less active series)
containing a ester group at R1. Fig. 5 shows theobtained alignment of compounds 35 (series II), 43
(series III), and 54 (series IV) over compound 1 (series
I) as an example.
3 .3 . The LIV 3 D-QSAR model ersus the Cook ’ s model
for GABAA/BzR ligands
LIV 3D-QSAR model was compared to Cook’s
Model (Fig. 1), the most comprehensive GABAA/BzR
model from the literature [7]. The following LIVs have
positive contribution to the af finity. LIV – 139 corres-
ponds to a hydrogen donor on the ligand molecule(Fig. 3, compound 1), and it is complementary to the
receptor sub-site A2 (hydrogen acceptor) on the Cook’s
receptor model. LIV – 110 corresponds to a hydrogen
acceptor on the ligand molecule, and it is complemen-
tary to sub-site H1 (hydrogen donator) on the receptor
model. LIV – 130 corresponds to a lipophilic region on
the ligand molecule and it corresponds to the sub-site
L3 on the receptor model.
The following LIVs have negative contribution to the
af finity. LIV – 065, LIV – 074, and LIV – 111 correspond
to regions around the northeast and the east side of theligand molecule; they are correlated to the sub-site S1 of
steric limitation on the Cook’s receptor model. LIV – 140 corresponds to a region around the southeast side
of the ligand molecule. It is correlated to the sub-site
H1 that represents a hydrogen donator on the receptor
model, so the occupation of this region is detrimental to
the af finity because it prevents hydrogen bonding be-
tween the ligand and the receptor. Finally, LIV – 168
corresponds to a region around the south side of the
ligand molecule, and is correlated to sub-site A2, which
represents a hydrogen acceptor on the receptor model,
and similarly, its occupation prevents a hydrogen bon-ding between the ligand and the receptor.
Compounds 31 and 32 (both compounds are outliers,
see next section) are the only ones in all the data set
that own a substituent (R10=CH3) in a region that
corresponds to sub-site H2/A3 from Cook’s model; un-
fortunately this region was not described by our LIV
3D-QSAR model, probably because these compounds
were not included in the training data set. This implies
that the model itself has no quantitative parameters to
describe this interaction with this significant site. On the
other hand, the substituent in R7 (1 – 33 series), R5 (to
36 – 45 series) and R2 (to 46 – 58 series) confer on the
Table 2
Standard deviation (SD) of the residual values (experimental pIC50 –
calculated pIC50) calculated for training data set (49 compounds), test
data set (nine compounds), and entire data set (58 compounds)
SDNumber of compounds 2×SD
0.64 1.2749
0.979 1.94
58 1.390.69
compounds 46 – 58, but these substituents, depending
on the alignment of the molecule in the space, can be
overlaid also on LIV – 110.
We also have observed a cooperative behavior
between LIV – 139 of positive contribution and two
LIVs of negative contribution: LIV – 140 and LIV – 168.
All of them correspond to substituents on R6 and R7
for compounds 1 – 33, R5 for compounds 36 – 45, and
R2 and R3 for compounds 46 – 58, but, depending onthe alignment, these substituents can be overlaid on
LIV – 139. Both cooperative behaviors are due in part
to the distant substituents because they can modify the
electronic distribution and, consequently, the molecular
electrostatic potential provokes a change in the
similarity function and so, in the final alignment.
Qualitatively LIV – 065 and LIV – 074 (negative
contribution) could be joined in a unique region
corresponding to the following substituents: R2 and R3
for compounds 1 – 33, R and R1 for compounds 34 – 45,
and R1 (in this case, on the furthermost distant point of
R1) for compounds 46 – 58.
8/10/2019 3D-QSAR CNS.pdf
http://slidepdf.com/reader/full/3d-qsar-cnspdf 9/11
H . Verli et al . / European Journal of Medicinal Chemistry 37 (2002) 219 – 229 227
model a calibration that is more accurate in reprodu-
cing the unfavorable effect of a methyl group at the
hydrogen bonding site (sub-site A2) than other group.
3 .4 . Outliers from the LIV 3 D-QSAR model for
GABAA/BzR ligands
Fig. 6 shows the experimental af finity values versus
the calculated (training data set) and predicted (testdata set) af finity values for the 58 compounds. As we
can see in Fig. 5 and Table 1 we have the compounds
28, 33, 53, and 56 as outliers from the training set and
compounds 31 and 32 as outliers from the test set.
These compounds have residual values (experimental
pIC50 – calculated pIC50) higher than twice the standard
deviation (SD) (Table 2) of the residuals calculated on
the training data set [38]. Except for compound 53, all
the outlier compounds have negative residuals, which
means that the calculated (or predicted) activities were
higher than the experimental ones.
Comparing compound 28 (R4=OH) to compound
27 (R4=OCH3), both with similar experimental pIC50,
respectively, 6.24 and 6.60, we can observe that the
calculated pIC50 are, respectively, 7.76 and 5.75 (Table
2). We cannot explain this discrepancy in terms of only
steric factor of these substituents around the N7 (a
hydrogen bonding acceptor site), since the LIV – 111
(the LIV that corresponds to region of substituent R4)
for compound 27 is almost four times greater than for
compound 28. Therefore, although compound 28 does
not make intramolecular hydrogen bonding between
the hydroxyl group (R4) and the pyridine nitrogen(data not shown), it can display some preferential in-
tramolecular electrostatic interaction (of deleterious ef-
fects) which implicates in some specific conformation
not observed by the model, and so, the oxygen atom
from the hydroxyl group (R4) can enter in a competi-
tion with the N7 for the hydrogen donor site (H1) from
the receptor, according the Cook’s model (Fig. 1).
Compounds 31 and 32 have both a methyl group
(R10) as a substituent on N12, all other compounds
from this series have a hydrogen atom in this position.
As this region is implicated in a hydrogen bond interac-tion with the receptor (H2/A3 sub-site according Cook’s
model, Fig. 1), and both compounds are from the test
set, it is obvious that our model was not ‘trained’ to
recognize this situation. In fact, our model does not
contemplate any LIV descriptor near the H2/A3 recep-
tor sub-site region.
The residual value for compound 33 (Table 1) shows
the model’s incapacity to distinguish electronic aspects
of the aromatic carbon 7, which makes it less active
than the nitrogen atom of compound 1 in the same
position. In other words, the occupation of LIV –
110 is
similar between compounds 1 and 33, even under the
effect of steric – electrostatic alignment. The greatest
difference is that the LIV – 130 of positive contribution
has a higher value for compound 1 than for compound
33, and for LIV – 140 of negative contribution, it is the
reverse. The result is that, when superimposing com-
pound 33 on compound 1, the compound 33 is lightly
dislocated to the right side after the steric – electrostatic
fit.
The outlier compounds 53 and 56 are both from theseries IV and as a group (compounds 46 – 58), excluding
compound 53 (pIC50exp=8.30), it has the lowest
af finity. The low af finity of series IV is probably due
the incapacity of the compounds to occupy all receptor
sub-sites at the same time, since this series has the
smaller size among the four series and it does not have
all the pharmacophore groups. Compound 53 is the
unique outlier among the compounds with experimental
pIC507.0, it is the only compound from series IV that
has the minimal pharmacophore requirements, which
are N9 and R2=H related to the receptor sub-site A2
according Cook’s model (Fig. 1), N2 related to thereceptor sub-site H1, and R1=CO2CH3 related to the
sub-site H2/A3. Since this R1 substituent is not in the
core framework of the molecule, like N12 and R10=H
on series I and N1 on series II and III, but instead, it is
a flexible substituent, it can lose af finity by entropy
reason. Compound 56 in contrast with compound 53,
does not have a N H group to interact with the recep-
tor sub-site A2, instead of that, it has an oxygen atom
at this position (X9). However, in spite of their residual
value of −1.49, it is calculated as active as compound
57, an analogue compound in which the oxygen atom isreplaced by a CH2 group on the same position. There-
fore, in a qualitative sense, it was not a critical outlier
in its own group.
4. Conclusions
In this work, we have developed a new descriptor to
3D-QSAR methodology: local intersection olume
(LIV). The LIV can be classified as a 3D local shape
descriptor in contraposition to the global shape descrip-
tors. The LIV is the intersection volume betweenmolecule atoms and a set of spheres of defined atom
size, which compose a tridimensional ‘box’, in analogy
to grid method. The molecules are included in this ‘box’
with a previously defined alignment to a template
molecule.
In order to compose a 3D-QSAR model for benzo-
diazepine receptor ligands, we have selected from the
literature 49 non-benzodiazepine compounds with rigid
framework structure as training data set. Using the
LIVs as descriptors, we have obtained and evaluated by
GA-PLS methods [21] a LIV 3D-QSAR model. The
LIV 3D-QSAR model has a good predictive capacity
8/10/2019 3D-QSAR CNS.pdf
http://slidepdf.com/reader/full/3d-qsar-cnspdf 10/11
H . Verli et al . / European Journal of Medicinal Chemistry 37 (2002) 219 – 229 228
according the cross-validation test by ‘leave-one-out’
procedure (Q2=0.72). The LIV 3D-QSAR model is in
agreement with some previous studies developed by
Cook and co-workers in which they proposed a com-
prehensive pharmacophore model for benzodiazepine
receptor ligands [7]. It showed a relevant correlation
with the pharmacophore groups pointed out in that
work. In addition, the af finity values were correctly
predicted for seven compounds from the test data setconsisting of nine compounds that were not included in
the training data set.
It should be noted that a similarity function [19,20]
was used to align the compounds in space. This
methodology shows that some substituents, even if not
interacting directly with the receptor, can cause a de-
crease in the receptor af finity of some compounds.
These substituents modify the compound’s steric and
electronic properties in such way that its alignment at
the receptor cavity becomes different from that
achieved when no substituents are in the same position.
This new alignment can, for example, modify the opti-mal distance of the hydrogen bond with the receptor
and, therefore, reduce the receptor af finity for that
compound. This effect causes the convergence of posi-
tions R6 and R7, to series I, and of positions R2 and
R3, to series IV, to the same space, affecting the
interaction with the receptor, as discussed before.
Work is underway to apply this methodology to
other classes of compounds. We are also modifying the
grid box atom size, in order to have a more refined
resolution. Another change is to include a percentage of
conformations from the conformational analysis, par-ticularly important for compounds with more confor-
mational freedom, and to associate an electronic
component in each LIV descriptor, like charges derived
from the molecular electrostatic potential.
Acknowledgements
We thank the Conselho Nacional de Desenvolvi-
mento Cientıfico e Tecnologico (CNPq) of the Brazil
government, the Coordenacao de Aperfeicoamento de
Pessoal de Nıvel Superior (CAPES) of the Brasil go-vernment, the Fundacao de Amparo a Pesquisa do
Estado do Rio de Janeiro (FAPERJ), the Fundacao
Universitaria Jose Bonifacio (FUJB), and the Conselho
de Ensino para Graduados e Pesquisa (CEPG) da
Universidade Federal do Rio de Janeiro (UFRJ) for
their support.
References
[1] W. Sieghart, Pharmcol. Rev. (1995) 181 – 234.[2] E.A. Barnard, P. Skolnick, R.W. Olsen, H. Mohler, W. Sieghart,
G. Biggio, C. Braestrup, A.N. Bateson, S.Z. Langer, Pharmcol.
Rev. 1 (1998) 291 – 313.
[3] (a) L. Teuber, F. Watjen, L.H. Jensen, Curr. Pharm. Des. 5
(1999) 317 – 343.(b) A. Doble, L. Martin, Trends Pharmacol. Sci.
13 (1992) 76 – 81.
[4] H.O. Villar, M.F. Davies, G.H. Loew, P.A. Maguire, Life Sci. 48
(1991) 593 – 602.
[5] A. Da Settimo, G. Primofiore, F. Da Settimo, A.M. Marini, E.
Novellino, G. Greco, C. Martini, G. Giannaccini, A. Lucacchini,
J. Med. Chem. 39 (1966) 5083 – 5091.
[6] E.D. Cox, H. Diaz-Arauzo, Q. Huang, M.S. Reddy, C. Ma, B.Harris, R. McKernan, P. Skolnick, J.M. Cook, J. Med. Chem.
41 (1998) 2537 – 2552.
[7] Q. Huang, X. He, C. Ma, R. Liu, S. Yu, C.A. Dayer, G.R.
Wenger, R. McKernan, J.M. Cook, J. Med. Chem. 43 (2000)
71 – 95.
[8] H. Kubinyi, in: R. Mannhold, P. Krogsgaard-Larsen, H. Tim-
merman (Eds.), QSAR: Hansch Analysis and Related Ap-
proaches. Methods and Principles in Medicinal Chemistry, VHC,
Weinheim, 1993.
[9] D.D. Robinson, P.D. Lyne, W.G. Richards, J. Chem. Inf. Com-
put. Sci. 39 (1999) 594 – 600.
[10] G.M. Crippen, J. Med. Chem. 22 (1979) 988 – 997.
[11] A.J. Hopfinger, J. Am. Chem. Soc. 102 (1980) 7196 – 7206.
[12] J.S. Tokarski, A.J. Hopfinger, J. Med. Chem. 37 (1994) 3639 –
3654.
[13] K.B. Rhyu, H.C. Patel, A.J. Hopfinger, J. Chem. Inf. Comput.
Sci. 35 (1995) 771 – 778.
[14] Y. Kawakami, A. Inoue, T. Kawai, M. Wakita, H. Sugimoto,
A.J. Hopfinger, Bioorg. Med. Chem. 4 (1996) 1429 – 1446.
[15] U. Holzgrabe, A.J. Hopfinger, J. Chem. Inf. Comput. Sci. 36
(1996) 1018 – 1024.
[16] P.J. Goodford, J. Med. Chem. 28 (1985) 849 – 857.
[17] R.C. Cramer, D.E. Patterson, J.D. Bunce, J. Am. Chem. Soc.
110 (1988) 5959 – 5967.
[18] A.J. Hopfinger, S. Wang, J.S. Tokarski, B. Jin, M. Albuquerque,
P.J. Madhav, C. Duraiswami, J. Am. Chem. Soc. 119 (1997)
10509 – 10524.[19] A.C. Good, E.E. Hodgking, W.G. Richards, J. Chem. Inf.
Comput. Sci. 32 (1992) 188 – 191.
[20] A.C. Good, J. Mol. Graphics 10 (1992) 144 – 151.
[21] W.J. Dunn, D. Rogers, in: J. Devillers (Ed.), Genetic Partial
Least Squares in QSAR in Genetic Algorithms in Molecular
Modeling, Academic Press, London, 1996, pp. 109 – 130.
[22] Y.C. Cheng, W.H. Prusoff, Biochem. Pharmacol. 22 (1973)
3099 – 3108.
[23] M.L. Trudell, S.L. Lifer, Yun-Chou Tan, M.J. Martin, Li Deng,
P. Skolnick, J.M. Cook, J. Med. Chem. 33 (1990) 2412 – 2420.
[24] M.S. Allen, Yun-C. Tan, M.L. Trudell, K. Narayanan, L.R.
Schindler, M.J. Martin, C. Schultz, T.J. Hagen, K.F. Koehler,
P.W. Codding, P. Skolnick, J.M. Cook, J. Med. Chem. 33 (1990)
2343 – 2357.
[25] M.J. Martin, M.L. Trudell, H.D. Arauzo, M.S. Allen, A.J.
LaLoggia, Li Deng, C.A. Schultz, Yun-Chou Tan, Y. Bi, K.
Narayanan, L.J. Dorn, K.F. Koehler, P. Skolnick, J.M. Cook, J.
Med. Chem. 35 (1992) 4105 – 4117.
[26] Y. Kitaura, O. Nakaguchi, H. Takeno, S. Okada, S. Yonishi, K.
Hemmi, J. Mori, H. Senoh, Y. Mine, M. Hashimoto, J. Med.
Chem. 25 (1982) 337 – 339.
[27] S. Takada, H. Shindo, T. Sasatani, N. Chomei, A. Matsushita,
M. Eigyo, K. Kawasaki, S. Murata, Y. Takahara, H. Shintaku,
J. Med. Chem. 31 (1988) 1738 – 1745.
[28] H. Shindo, S. Takada, S. Murata, M. Eigyo, A. Matsushita, J.
Med. Chem. 32 (1989) 1213 – 1217.
[29] INSIGHT II, Biosym, Molecular Simulations Inc., 9685 ScrantonRoad, San Diego, CA 92121-3752, USA, 1998.
8/10/2019 3D-QSAR CNS.pdf
http://slidepdf.com/reader/full/3d-qsar-cnspdf 11/11
H . Verli et al . / European Journal of Medicinal Chemistry 37 (2002) 219 – 229 229
[30] MOPAC 93, J.P. Stewart, Frank J. Seiler Research Laboratory,
United States Air Force Academy, Colorado Springs, CO 80840-
6528, USA, 1993.
[31] WOLF 6.2, D. Rogers, Molecular Simulations Inc., Wolf Genetic
Function Approximation Manual, Version 6.2., 1994.
[32] (a) MOPAC 6.0, J.P. Stewart, Frank J. Seiler Research Labora-
tory, United States Air Force Academy, Colorado Springs, CO
80840 – 6528, 1990. (b) M.J.S. Dewar, E.G. Zoebisch, E.F.
Healy, J.J.P. Stewart, J. Am. Chem. Soc. 107 (1985) 3902 – 3909.
[33] MOLDEN, G. Schaftenaar, CAOS/CAMM Center, University of
Nijmegen, Toernooiveld 1, 6525 ED NIJMEGEN, The Nether-lands, 1997.
[34] P. Dauber-Osguthorpe, V.A. Roberts, D.J. Osguthorpe, J.
Wolff, M. Genest, A.T. Hagler, Proteins: Struct. Funct. Genet. 4
(1988) 31 – 47.
[35] B.H. Besler, K.M. Merz Jr., P.A. Kollman, J. Comp. Chem. 11
(1990) 431 – 439.
[36] Search – Compare, Biosym, Molecular Simulations Inc., Confor-
mational Search & Molecular Comparision User Guide, 9685
Scranton Road, San Diego, CA 92121-3752, USA, 1995.
[37] D. Rogers, A.J. Hopfinger, J. Chem. Inf. Comput. Sci. 34 (1994)
854 – 866.
[38] M.G. Albuquerque, A.J. Hopfinger, E.J. Barreiro, R.B. Alen-castro, J. Chem. Inf. Comput. Sci. 38 (1998) 925 – 938.