Embed Size (px)
Citation preview

3D opportunity for life cycle assessmentsAdditive manufacturing branches out
A Deloitte series on additive manufacturing

Beth McGrath
Beth McGrath is a director with Deloitte Consulting LLP’s Federal Strategy and Operations group. She has broad, multidisciplined strategic and operational management experience acquired dur-ing her 25+ years in the US federal government in positions up to the undersecretary level in the Department of Defense. McGrath is a proven thought leader in strategic planning, program and performance management, investment reviews, and business transformation.
Jaymes Hanna
Jaymes Hanna is a manager with Monitor Deloitte Consulting LLP. He focuses on growth/innovation and business unit strategy, primarily in the high-technology and telecommunications industries.
Runze Huang
Runze Huang is a researcher in Energy & Resource System Analysis Laboratory (ERSAL) and a PhD candidate of mechanical engineering at Northwestern University. He leads the research of innovative life cycle assessment (LCA) methods, and he focuses on identifying opportunities and accelerating R&D of advanced manufacturing technologies using LCA models. In his research, he collaborates with the Advanced Manufacturing Office of the US Department of Energy and multiple national labs. He has also served as director of ZHSR Biotechnology, which commercializes emerg-ing biofuel processes in southern China.
Amar Shivdasani
Amar Shivdasani is a consultant with Deloitte Consulting LLP. He has experience in supply chain analytics within the manufacturing sector and in the aerospace and defense industry.
About the authors
Deloitte Consulting LLP’s Supply Chain and Manufacturing Operations practice helps companies understand and address opportunities to apply advanced manufacturing technologies to impact their businesses’ performance, innovation, and growth. Our insights into additive manufacturing allow us to help organizations reassess their people, process, technology, and innovation strategies in light of this emerging set of technologies. Contact the authors for more information, or read more about our alliance with 3D Systems and our 3D Printing Discovery Center on www.deloitte.com.
3D opportunity for life cycle assessments: Additive manufacturing branches out

Contents
Introduction | 2
Traditional decision making in AM adoption | 5
Performing a life cycle assessment | 6
Conclusion | 13
Endnotes | 15
Contacts | 17
A Deloitte series on additive manufacturing
1

COLLOQUIALLY known as 3D print-ing, additive manufacturing (AM) offers
myriad advantages in terms of labor, materials, speed to market, and prototyping and design.1 It can also be more cost-effective than conven-tional manufacturing in situations that involve long lead times, high inventory costs, com-plex or expensive parts, and remote locations where sourcing and shipping are difficult.2 To
realize the potential benefits of AM, however, inherent challenges must be managed, includ-ing limitations on volume, size, and range of materials, many of which make conventional manufacturing better for some products.3 These trade-offs are, by now, well established in the AM literature.
With an increasing number of manufactur-ers considering the adoption of AM in their supply chains, companies should be able to evaluate whether AM makes sense for their particular purposes. To do so might require looking beyond traditional cost models and metrics to more holistically determine the impacts of AM adoption. Life cycle assess-ment (LCA) adds an important perspective, enabling companies to more fully evaluate this critical decision. The goal of an LCA is to understand the environmental impact of
bringing a product or service to the market.4 An LCA evaluates an expanded set of inputs at their rawest form across each stage of the life cycle, from extraction or development of raw materials through processing, manufacturing, use, and end-of-life disposal.
Over the past five years LCAs have become increasingly common at the world’s leading companies. R&D departments within com-
panies such as Kimberly-Clark,5 universities such as the Georgia Institute of Technology,6 and govern-ment researchers at the Environmental Protection Agency7 and National Science Foundation8 all use LCAs to assess environmental impact. Likewise, the National Center for Defense Manufacturing and Machining serves on the board of the Mission
Ready Sustainability Initiative, a project devoted in part to using “streamlined” LCAs to promote sustainability in product and service acquisition.9
The body of research around LCA applica-tion is growing. One study suggests that the number of scientific publications involving LCA more than doubled between 2009 and 2011.10 Research also makes the link between sustainability and value creation, by dem-onstrating how the application of LCAs can provide useful insights for business decisions.11
Although LCA has primarily been used to assess the environmental impact of pro-cesses, LCA assessments can—and have—also helped to quantify the total cost savings of AM adoption. By exploring LCA models and their applications, this paper introduces an approach for better estimating the material and energy
Introduction
Companies may need to look beyond traditional cost models and metrics to more holistically determine the impacts of AM adoption.
3D opportunity for life cycle assessments: Additive manufacturing branches out
2

THE ADDITIVE MANUFACTURING FRAMEWORKAM is an important technological innovation that helps manufacturers break existing performance trade-offs in two fundamental ways. First, AM helps reduce the capital involved in achieving economies of scale. Second, it can increase flexibility and reduce the capital needed to achieve scope.12
Capital versus scale: AM has the potential to reduce the capital required to reach minimum efficient scale for production, thus lowering the barriers to entry for manufacturing in a given location.
Capital versus scope: The flexibility of AM can facilitate an increase in the variety of products a unit of capital can produce, reducing the costs typically associated with production changeovers, customization, and the overall amount of necessary capital.
Evaluating the capital versus scale relationship through LCA modeling allows manufacturers to begin to understand the many different efficiencies AM can create throughout the supply chain (see figure 1), and enables companies to choose between four tactical paths to deploy AM across their businesses:
Path I: Companies do not radically alter their supply chains or products, but they may explore AM technologies to help improve value delivery for current products within existing supply chains.
Path II: Companies take advantage of scale economics offered by AM to help transform supply chains for the products they offer.
Path III: Companies take advantage of the scope economics offered by AM technologies to enable new levels of performance in the products they offer.
Path IV: Companies alter supply chains as well as products in pursuit of new business models.
Graphic: Deloitte University Press | DUPress.com
Figure 1. Framework for understanding AM paths and value
Path III: Product evolution• Strategic imperative: Balance of
growth, innovation, and performance
• Value driver: Balance of profit, risk, and time
• Key enabling AM capabilities:– Customization to customer
requirements– Increased product functionality– Market responsiveness– Zero cost of increased complexity
Path IV: Business model evolution• Strategic imperative: Growth and
innovation• Value driver: Profit with revenue
focus, and risk• Key enabling AM capabilities:
– Mass customization– Manufacturing at point of use– Supply chain disintermediation– Customer empowerment
Path I: Stasis • Strategic imperative: Performance• Value driver: Profit with a cost
focus• Key enabling AM capabilities:
– Design and rapid prototyping– Production and custom tooling– Supplementary or “insurance”
capability– Low rate production/no
changeover
Path II: Supply chain evolution• Strategic imperative: Performance• Value driver: Profit with a cost
focus, and time• Key enabling AM capabilities:
– Manufacturing closer to point of use
– Responsiveness and flexibility– Management of demand
uncertainty– Reduction in required inventory
High product change
No
supp
ly c
hain
cha
nge
High supply chain change
No product change
Source: Mark Cotteleer and Jim Joyce, “3D opportunity: Additive manufacturing paths to performance, innovation, and growth,” Deloitte Review 14, Deloitte University Press, January 17, 2014, http://dupress.com/articles/dr14-3d-opportunity/.
A Deloitte series on additive manufacturing
3

impact of AM technologies, allowing opera-tions and finance leaders to determine whether to incorporate AM into their supply chains.
Additionally, this paper focuses on an example from the aerospace industry, in which researchers at Northwestern University used LCA to assess 3D-printed aircraft compo-nents, and thus were able to quantify savings related to energy consumption, fuel, and emissions.13 The findings of this analysis also apply to other industries trying to under-stand the potential impacts of replacing
conventionally manufactured components with AM-created alternatives.
While other resources are required to analyze the impacts of improved scope, the LCA model presented in this paper can help companies evaluate AM adoption from a scale perspective, allowing them to tangibly quantify the material and energy savings offered by AM technology across a supply chain. Companies can decide which of the four paths they should pursue based on an LCA analysis along with a separate analysis of the impacts to scope.
3D opportunity for life cycle assessments: Additive manufacturing branches out
4

Traditional decision making in AM adoption
WHEN considering machinery invest-ments for traditional manufacturing,
producers typically develop in-depth cost models to examine direct costs, such as raw materials and labor, as well as other indirect costs—production overhead, machine mainte-nance costs, and so on—to determine whether an investment is justified.14 Evaluation of simi-lar factors is recommended when constructing
a business case for additive manufacturing.15 Thinking in these terms alone, however,
may be limiting, as these elements may not reveal the full picture of the value offered by AM. For example, AM can be more environ-mentally friendly than more conventional manufacturing methods.16 Beyond generating less material waste, AM’s use in a supply chain along path II can help reduce the need for shipping and transportation, resulting in fewer emissions.17 In addition, AM can decrease the need for other environmentally detrimental
materials, including cutting fluids that may be caustic or hazardous;18 and the lighter weight of many AM-produced parts can help save fuel and energy.19
Thus, in hewing only to traditional cost models, business leaders may not be seeing the full financial and environmental benefits they could achieve from employing AM. Indeed, many analyses that include a quantification of
AM’s environmental impact have been somewhat limited, focusing on criteria such as standby and in-process electrical consumption.20 They may lack additional measurements, such as waste flows, resource consumption, and emissions generated during production, which provide a more complete picture.21
Without an estimate of the returns from using 3D printing that involves this wider set of factors, many may not understand where to employ the technology, and they may not account for the opportunities AM presents for greater environmental optimization. Using LCA to model some of these second-ary impacts—primary energy savings or greenhouse gas emissions, for example—may provide additional incentive and guidance regarding where to invest.
In hewing only to traditional cost models, business leaders may not be seeing the full financial and environmental benefits they could achieve from employing AM.
A Deloitte series on additive manufacturing
5

Performing a life cycle assessment
BUSINESSES and government agencies primarily use LCAs to assess the “potential
human health and environmental impacts” of resources used and emissions released dur-ing production, and LCAs typically span the full life cycle of a product.22 The International Organization for Standardization (ISO) pro-vides a set of standards and a framework—ISO 14040:2006 and ISO 14044:2006—for LCAs and their relevant stages (see figure 2).23 Here we briefly describe these steps.
Goal definition and scope: Setting system boundaries
When developing a life cycle inventory (LCI), the first step is to define the scope of the analysis as well as the boundaries of the system. The scope can encompass either the
cradle-to-gate (a product’s lifespan from raw materials through the moment it leaves the manufacturing plant) or the full cradle-to-grave lifespan (a product’s full lifespan from raw materials, processing, and manufactur-ing, through use, disposal, and any potential reuse, repurposing, or recycling) of a product. The boundaries can include detailed data on all components of the supply chain. In other cases, however, the system boundaries can often be limited by the available information or research constraints.25
Inventory analysis: Executing an LCI to collect and track environmental impact against standardized data sets
One of the most crucial stages of an LCA is the LCI, in which data are collected to account for all inputs and outputs to the system, encompassing the entire supply chain. These data can include raw materials; energy used; water and other fluids as inputs; and emissions, including what types and where they are emit-ted, and where outputs end up (such as bodies of water, air, or landfills).26 Due to the com-plexity of supply chains, the number of inputs and substances involved, and the amount of information and processes that take place, LCI models can be extremely complex.
The LCI model provides a standardized methodology to help ensure consistency across LCAs, making it possible to compare differ-ent product and vendor alternatives. The LCI serves as a lynchpin of sorts for conducting an LCA, offering a framework to quantify require-ments and resulting processes and products,
Graphic: Deloitte University Press | DUPress.com
Source: ISO 14044:2006; Deloitte Development LLC.
Goal de�nition and scope
Inventory analysis (LCI)
Impact assessment (LCIA)
Interpretation of
data and �ndings
Figure 2. LCA framework according to ISO standards 14040 and 1044424
3D opportunity for life cycle assessments: Additive manufacturing branches out
6

and providing a consistent top-down method to estimate impact on savings.
Many LCI models are being validated and aggregated into national databases to standard-ize and track environmental effects, making the development of new models easier. For example, the Cooperative Effort on Process Emissions in Manufacturing initiative has developed methodologies to systematize inventory analysis of emissions generated via manufacturing and production. The goal is to store these standardized data sets and speci-fications in LCI databases for reference and use in LCAs, as well as provide guidelines for improving manufacturing.27
Understanding a system’s components requires extensive research. This can start with surveys of the major elements of the supply chain—probing into the raw materials and energy resources required to deliver a product’s inputs. Otherwise, secondary sources, such as industry studies or national databases, can be used as proxies.28 Once the list of inputs and outputs at the system boundaries is established, the data are collected to complete the model.
Impact assessment: Understanding the inputs and their impact
A life cycle impact assessment (LCIA) evaluates the information gathered during an LCI to understand the environmental impacts of any outputs identified during the inventory analysis. While this phase may not expressly quantify the impacts associated with any one specific process, it can serve to link or correlate a system with specific impacts.29 In this way, the relative impact of two approaches—say, that of AM versus conventional manufactur-ing—can be compared to ascertain where each may have a more favorable impact.
Interpreting findings and determining next steps: Once an LCIA is complete, the findings are then evaluated and interpreted using a systematic process. According to the ISO, the interpretation phase is meant to ana-lyze the results to provide recommendations
based on the information uncovered by the LCIA—and to help ensure the findings fall within the goal and scope established in the first stage of the LCA.33
Understanding the trade-offs Despite their value, LCA and LCI models
can, in some cases, be limited. The essential trade-off in using these models lies between precision and scope. At its heart, the LCI model provides a systematic approach to eval-uating environmental effects associated with a product or service at a system level, along with a consistent method for analyzing different
IN PRACTICE: WHEN THE LCIA STAGE UNCOVERS DIFFERENCES BETWEEN ADDITIVE AND CONVENTIONAL MANUFACTURINGA recent LCA compared conventional manufacturing using a computer numerical control (CNC) mill with both fused deposition modeling (FDM) and PolyJet to create two parts made of ABS plastic (or a similar material).30 The LCA took a cradle-to-grave scope, and the LCI model catalogued “impacts, transportation, energy used during manufacturing, energy used while idling and in standby, material used in final parts, waste material generated, cutting fluid for CNC, and disposal.”31 By comparing all three approaches while manufacturing the same parts, the LCIA revealed that the utilization rate had the greatest impact on which approach was the most sustainable. The AM approaches were impacted most heavily by electricity usage. When operating at maximum production, CNC machining was impacted most heavily by material waste and, to a lesser extent, cutting fluid. In the end, the LCIA found that FDM had the lowest environmental impact, while PolyJet’s ability to perform better than CNC depended on utilization and other factors.32
A Deloitte series on additive manufacturing
7

products and services. However, the accuracy of the model is highly dependent on the detail and veracity of the available data sources, and it struggles to account for variance in costs, either of raw materials or energy, across the supply chain.
Thus while the LCI model can enable an end-to-end, aggregated view of consumption, it sacrifices the nuances and variances that exist across the value chain. To overcome this, businesses can augment the LCA with financial models for a deeper understanding of direct financial impacts.34
The case study below demonstrates how one assessment was conducted using LCA to understand impacts resulting from employing AM in lightweight aircraft component systems.35
Developing and defining an LCA The LCA analysis proceeded as follows
(also see figure 3):First, scope and system boundaries were
set using established selection criteria to identify candidate component systems. For the comparative AM configuration, the set of which eligible component systems could be replaced, such as wing components, brackets and clips, and seats, was approximated using secondary sources that included previously
CASE STUDY: MODELING ENERGY AND EMISSION SAVINGS POTENTIAL IN LIGHTWEIGHT AIRCRAFT COMPONENTS The aerospace industry has been at the forefront of AM adoption.36 While experimentation has started with small, noncritical parts, the dynamic nature of the aerospace industry makes broader adoption attractive. An operating aircraft consumes an immense amount of energy, and small changes in weight can significantly affect the associated costs and emissions. In addition, a great deal of metal scrap is often lost during the aircraft production process—with the ratio of raw metal input to completed component mass (the “buy-to-fly” ratio) often ranging from 12:1 to 25:1.37 Taken together, fuel savings and scrap reduction can provide significant value to both aircraft manufacturers and operators (for example, airlines and the military).
In light of these potential impacts, an LCA focused on parts eligible for near-term adoption within the aerospace industry. A group of researchers at Northwestern University’s McCormick School of Engineering, including one of this paper’s authors, analyzed the component systems in an aircraft to estimate the net impact of switching the production of eligible candidates to AM processes. Comparing the assessments with and without AM adoption, they projected the annual and cumulative material, energy, and emissions impact through 2050.38
Graphic: Deloitte University Press | DUPress.com
Figure 3. Lightweight aircraft opportunity assessment workflow
Source: Deloitte Development LLC analysis.
Set scope & boundaries
Establish part selection criteria
Conduct in-scope part selection
Estimate comparative AM configuration
Calculate fuel usage for CM/AM
Develop LCI model
Conduct LCIA for CM & AM
Research
Conduct in-scope part selection
Estimate comparative AM configuration
Consumption scenarios
3D opportunity for life cycle assessments: Additive manufacturing branches out
8

published case studies and industry targets from companies experienced in using AM for aerospace production.
Second, a model was developed to estimate total energy and emissions during produc-tion under both AM and more traditional manufacturing methods. Academic studies were used to construct baseline estimates. For the AM comparison, an adoption model was constructed to account for AM penetration over time; then an aircraft fuel use model was employed to calculate projected fuel and emis-sions during aircraft operations for both cases.
Third, the two cases—the base conven-tional manufacturing consumption and the projected consumption from AM production scenarios—were compared to understand the impact of adoption. This assessment resulted in an estimate of materials and energy savings, against which estimated costs of component design and manufacturing changes could be compared.
Selecting the component systems to include within the assessment scope was driven by a feasibility scoring method that was determined using three steps:
1. Noncritical systems made primarily of metallic components were selected.
2. System mass was subdivided into struc-tural, functional, and auxiliary categories.
3. Each component system was graded on three characteristics: load rating, shape complexity, and geometric volume.
Grades were summed, and systems with feasibility scores above five were included in the model.39
The mass of the key metal alloys typically used in aircraft components—aluminum, titanium, nickel, and steel—was analyzed using case studies and industry targets. Based on an empty 40,622-kilogram 142-seat com-mercial aircraft, an estimated 9–17 percent of average mass was estimated as replaceable
with AM components, given the component systems included within the assessment scope. Using this range, the LCI model was used to estimate savings.
For the LCIA, a model was constructed to capture the energy use and emissions from the component-system manufacturing process—
limiting the scope to cradle to gate. This scope is defined by four key phases: raw material production, materials distribution, component manufacturing, and component distribution. Within the boundaries of each phase, the key processes were compared (see figure 4): min-ing, ingot casting, milling (for conventional manufacturing), and selective laser printing (SLM; for printing).40
Assessing the outputsWith the model defined, the materials
and energy savings were assessed based on
At its heart, the LCI model provides a systematic approach to evaluating environmental effects associated with a product or service at a system level, along with a consistent method for analyzing different products and services.
A Deloitte series on additive manufacturing
9

literature reviews on buy-to-fly ratios, trans-portation distances, and manufacturing energy and emissions for the selected component systems. For the selected components, the buy-to-fly ratio dropped from 4.5–8.0 under conventional manufacturing to 1.5 across all
AM processes, reducing overall material scrap. Through redesign, average estimates for the reduction of empty aircraft mass was 4–7 per-cent, driven largely by engine system compo-nents, aluminum alloy–based furnishing, and equipment components such as seat buckles
Graphic: Deloitte University Press | DUPress.com
Figure 4. Cradle-to-gate LCI model for lightweight aircraft
Source: Reprinted from Runze Huang et al., “Energy and emissions saving potential of additive manufacturing: The case of lightweight aircraft components,” Journal of Cleaner Production 109, May 8, 2015, with permission from Elsevier.
Set scope & boundaries
Research
Resource production
Distribution
Manufacturing-CM
Manufacturing-AM
Stainless steel Aluminum Titanium
Bayer refining, Hall-Herould
smelting
Becher and Kroll processes
BF, BOF, EAF
Rolling Ingot casting Atomization
Annealing
Plate Ingot Powder
Conventional manufacturing
Additivemanufacturing
Distribution I
Distribution II
Milling
Cutting
Turning
Casting
SLM
EBM
DMLS
FDM
Elec
tric
ityEl
ectr
icity
Die
sel
Die
sel
Die
sel
Nat
ural
gas
Energy consumption Cradle-to-gate
Assembling
Use
Recycle & disposal
3D opportunity for life cycle assessments: Additive manufacturing branches out
10

and brackets. These materials savings trans-lated into energy and emission reductions. The engine component replacements resulted in savings of up to 7,200 gigajoules of energy and 550 metric tons of CO2-equivalent emissions per aircraft annually—contributing more than 50 percent of the total value.41
The adoption model was built based on the Bass diffusion curve, the classic S-curve
model frequently used to estimate technology penetration.42 Each component system was analyzed by component category to assign an expected time of AM replacement availability, ranging from 5 years (for some furnishing and nacelle components) to 20 years for functional engine components. Three adoption scenarios were run on the model (see figure 5):
Figure 5. Projected penetration of AM-produced components into airplane fleets
Graphic: Deloitte University Press | DUPress.com
10,000
8,000
6,000
4,000
2,000
0
2013
2018
2023
2023
2033
2038
2043
2048
2013
2018
2023
2023
2033
2038
2043
2048
2013
2018
2023
2023
2033
2038
2043
2048
Num
ber
of a
irpla
nes
in fl
eet
10,000
8,000
6,000
4,000
2,000
0
2013
2018
2023
2023
2033
2038
2043
2048
2013
2018
2023
2023
2033
2038
2043
2048
2013
2018
2023
2023
2033
2038
2043
2048
Num
ber
of a
irpla
nes
in fl
eet
Source: Reprinted from Huang et al., “Energy and emissions saving potential of additive manufacturing,” with permission from Elsevier.
AM new production AM retrofit Non-AM
A. Furnishings and equipment systems at slow adoption
B. Furnishings and equipment systems at medium adoption
C. Furnishings and equipment systems at rapid adoption
D. Engine components at slow adoption
E. Engine components at medium adoption
F. Engine components at rapid adoption
A Deloitte series on additive manufacturing
11
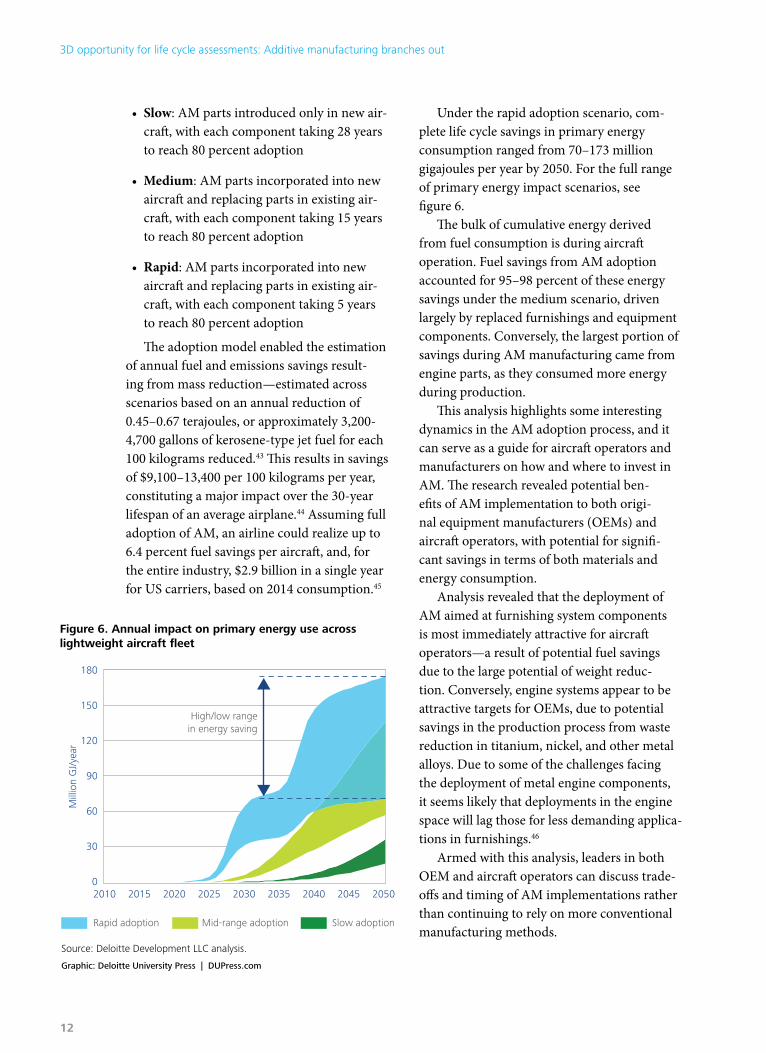
• Slow: AM parts introduced only in new air-craft, with each component taking 28 years to reach 80 percent adoption
• Medium: AM parts incorporated into new aircraft and replacing parts in existing air-craft, with each component taking 15 years to reach 80 percent adoption
• Rapid: AM parts incorporated into new aircraft and replacing parts in existing air-craft, with each component taking 5 years to reach 80 percent adoption
The adoption model enabled the estimation of annual fuel and emissions savings result-ing from mass reduction—estimated across scenarios based on an annual reduction of 0.45–0.67 terajoules, or approximately 3,200-4,700 gallons of kerosene-type jet fuel for each 100 kilograms reduced.43 This results in savings of $9,100–13,400 per 100 kilograms per year, constituting a major impact over the 30-year lifespan of an average airplane.44 Assuming full adoption of AM, an airline could realize up to 6.4 percent fuel savings per aircraft, and, for the entire industry, $2.9 billion in a single year for US carriers, based on 2014 consumption.45
Under the rapid adoption scenario, com-plete life cycle savings in primary energy consumption ranged from 70–173 million gigajoules per year by 2050. For the full range of primary energy impact scenarios, see figure 6.
The bulk of cumulative energy derived from fuel consumption is during aircraft operation. Fuel savings from AM adoption accounted for 95–98 percent of these energy savings under the medium scenario, driven largely by replaced furnishings and equipment components. Conversely, the largest portion of savings during AM manufacturing came from engine parts, as they consumed more energy during production.
This analysis highlights some interesting dynamics in the AM adoption process, and it can serve as a guide for aircraft operators and manufacturers on how and where to invest in AM. The research revealed potential ben-efits of AM implementation to both origi-nal equipment manufacturers (OEMs) and aircraft operators, with potential for signifi-cant savings in terms of both materials and energy consumption.
Analysis revealed that the deployment of AM aimed at furnishing system components is most immediately attractive for aircraft operators—a result of potential fuel savings due to the large potential of weight reduc-tion. Conversely, engine systems appear to be attractive targets for OEMs, due to potential savings in the production process from waste reduction in titanium, nickel, and other metal alloys. Due to some of the challenges facing the deployment of metal engine components, it seems likely that deployments in the engine space will lag those for less demanding applica-tions in furnishings.46
Armed with this analysis, leaders in both OEM and aircraft operators can discuss trade-offs and timing of AM implementations rather than continuing to rely on more conventional manufacturing methods.
Graphic: Deloitte University Press | DUPress.com
Figure 6. Annual impact on primary energy use across lightweight aircraft fleet
Source: Deloitte Development LLC analysis.
2010 2015 2020 2025 2030 2035 2040 2045 2050
180
150
120
90
60
30
0
Mill
ion
GJ/
year
Rapid adoption Mid-range adoption Slow adoption
High/low rangein energy saving
3D opportunity for life cycle assessments: Additive manufacturing branches out
12

Conclusion
ADDITIVE manufacturing presents busi-ness leaders across numerous industries
with an opportunity to improve existing designs and processes, while also highlighting the potential for more complex and intricate designs. As a result, the technology is seeing increased adoption beyond prototyping, mak-ing inroads within some sectors into tooling, replacement parts, final production, and other areas. However, with widespread implementa-tion still emerging, experience around AM’s potential benefits is not deep, and therefore the best opportunities for initial use and impact are still being determined. Making longer-term investment decisions in AM can seem uncertain, with the process for prioritizing opportunities still a work in progress.
To enhance the decision-making process, business leaders can benefit from a more systematic way of identifying opportunities—one that can better highlight potential benefits of AM. Life cycle assess-ment and inventory modeling can provide such a methodology by focusing on the material and energy savings seen across the supply chain, production, and use. Using this method, companies can hone in on prime targets (such as furnishing and equipment in aircraft) for immediate investigation.
As companies continue to consider the adoption of AM and look to LCA modeling to identify opportunities, here are some key actions to take:
Consider the role of LCA in decision-making processes related to AM adoption. This approach can reveal efficiencies inherent
in AM that may not be readily apparent in traditional cost modeling, so LCA can play an important role in the decision-making process.
Take inventory of current materials used in key components. Companies look-ing to substitute AM parts for conventionally manufactured ones should first understand the breadth of raw materials used in their products and component parts. Prioritizing materials according to volume used, energy required to process, and scrap ratio can help manag-
ers begin to assess their impact within the model. It will be important to stay abreast of AM’s process and technology improvements, as these could shift the economics that drive decision making.
Establish priority criteria for replacement. Design requirements and specifications vary greatly across applications. Businesses seeking to take near-term advantage of AM, whether for scrap material savings or design efficiency, should understand the trade-offs associated with AM processes. Also, managers should
To enhance the decision-making process, business leaders can benefit from a more systematic way of identifying opportunities—one that can better highlight potential benefits of AM.
A Deloitte series on additive manufacturing
13

seek to understand the characteristics critical to the market success of their products (for example, geometric precision and structural integrity) to ensure that these are not at odds with the current AM-related trade-offs. Initial successes in adoption, even if auxiliary, can provide a great deal of learning and potential savings upon which to build momentum.
Leverage existing LCA models and LCI databases. With many LCA models being built by businesses and government agencies pursuing sustainability, there is a great deal of knowledge than can already be leveraged for under-resourced managers. Using publicly
available research and models can accelerate the assessment process. By focusing incremen-tal effort on enhanced assessment and deeper analysis (such as around projected develop-ment costs, switching costs, and penetration time), leaders can develop more complete business cases for targeted AM investment and deployment.
Some business leaders interested in under-standing AM’s inherent impact and harnessing its potential benefits would benefit from using a systematic approach such as LCA, which considers the technology’s trade-offs, to better prioritize their development investments.
3D opportunity for life cycle assessments: Additive manufacturing branches out
1414

Endnotes1. Mark Cotteleer and Jim Joyce, “3D op-
portunity: Additive manufacturing paths to performance, innovation, and growth,” Deloitte Review 14, Deloitte Univer-sity Press, January 17, 2014, http://dupress.com/articles/dr14-3d-opportunity/.
2. Wohlers Associates, Wohlers report 2015: 3D printing and additive manu-facturing—state of the industry annual worldwide progress report, 2015.
3. Mark Cotteleer, Jonathan Holdowsky, and Monika Mahto, The 3D opportunity primer: The basics of additive manufacturing, Deloitte University Press, March 6, 2014.
4. United Nations Environment Programme, “Life cycle assessment,” http://www.unep.org/resourceefficiency/Consumption/StandardsandLabels/MeasuringSustain-ability/LifeCycleAssessment/tabid/101348/Default.aspx, accessed August 19, 2015.
5. Kimberly-Clark, “Life cycle assessment of alternative fibers,” http://www.kimberly-clark.com/sustainability/people/LCAMessag-ing.aspx, accessed August 25, 2015.
6. Ibid.
7. US Environmental Protection Agency, “Life cycle assessment (LCA),” http://www.epa.gov/nrmrl/std/lca/lca.html, accessed August 19, 2015.
8. Examples of various research and projects can be found at the National Science Foundation website, http://www.nsf.gov/.
9. Mission Ready Sustainability Initiative, Stream-lined life cycle assessment: A value proposition for the department of Defense, October 10, 2014, http://ncdmm-mrsi.org/wp-content/uploads/2014/10/MRSI-SLCA-White-Paper-Fi-nal-101014.pdf, accessed September 15, 2015.
10. David Schatsky, “Surge in take up of life cycle assessment tools to improve sustain-ability,” Guardian, May 17, 2011.
11. B. M. Krishna Manda, Henk Bosch, and Ernst Worrell, “Sustainable value creation with life cycle management,” Life Cycle Management, LCA Compendium: The Complete World of Life Cycle Assessment 2015, 2015, pp. 129–46.
12. For a full discussion of these dynamics, see Cotteleer and Joyce, “3D opportu-nity: Additive manufacturing paths to performance, innovation, and growth.”
13. Runze Huang et al., “Energy and emis-sions saving potential of additive manufacturing: The case of lightweight aircraft components,” Journal of Cleaner Production, http://www.sciencedirect.com/science/article/pii/S0959652615004849, available online May 8, 2015.
14. Douglas S. Thomas and Stanley W. Gilbert, Costs and cost effectiveness of additive manu-facturing: A literature review and discussion, National Institute of Standards and Technology, US Department of Commerce, December 2014.
15. Mark Cotteleer, “3D opportunity for produc-tion: Additive manufacturing makes its (busi-ness) case,” Deloitte Review 15, Deloitte Uni-versity Press, July 28, 2014, http://dupress.com/articles/additive-manufacturing-business-case/.
16. Karel Kellens et al., “Environmental impact modeling of selective laser sintering processes,” Rapid Prototyping Journal 20, no. 6 (2014): pp. 459–70.
17. D. Bourell, M. Leu, and D. Rosen, Roadmap for additive manufacturing: Identifying the future of freeform processing, Labora-tory for Freeform Fabrication, 2009.
18. Ibid.
19. Huang et al., “Energy and emissions saving potential of additive manufacturing.”
20. Florent Le Bourhis et al., “Sustainable manu-facturing: Evaluation and modeling of envi-ronmental impacts in additive manufacturing,” International Journal of Advanced Manufactur-ing Technology 69 (2013): pp. 1927–39.
21. A. Drizo and J. Pegna, “Environmental impacts of rapid prototyping: An overview of research to date,” Rapid Prototyping Journal 12, no. 2 (2006): pp. 64–71; Kellens et al., “Environmental impact modeling of selective laser sintering processes.”
22. Environmental Protection Agency and Scientific Applications International Corporation (SAIC), Life cycle impact assess-ment: Principles and practice, May 2006.
A Deloitte series on additive manufacturing
15

23. International Organization for Standardiza-tion, “ISO standards for life cycle assessment to promote sustainable development,” July 7, 2006, http://www.iso.org/iso/home/news_index/news_archive/news.htm?refid=Ref1019, accessed August 19, 2015.
24. We observe that the LCI and LCIA are subsets, or stages, of the LCA.
25. Patrick Hofstetter, Perspectives in life cycle impact assessment: A structured approach to combine models of the technosphere, ecosphere, and valuesphere, Springer US, 1998.
26. Environmental Protection Agency and SAIC, Life cycle assessment, chapter 3.
27. Karel Kellens et al., “Methodology for systematic analysis and improvement of manufacturing unit process life cycle inventory (UPLCI)—CO2PE! initiative (cooperative effort on process emissions in manufactur-ing). Part 1: Methodology description,” International Journal of Life Cycle As-sessment 17, no. 1 (2012): pp 69–78.
28. European Commission, Joint Research Centre, Institute for Environment and Sustainability, International Reference Life Cycle Data System (ILCD) Handbook: Specific Guide For Life Cycle Inventory Data Sets, 1st ed. (Luxembourg: Publications Office of the European Union, 2010); Environmental Protection Agency and SAIC, Life cycle assessment, chapter 2.
29. Environmental Protection Agency and SAIC, Life cycle assessment, chapter 4.
30. CNC milling machines are vertical milling machines controlled by a computer that can cut along the three axes of an object to create mul-tidimensional parts. For further information about PolyJet printing, see Cotteleer, Hold-owsky, and Mahto, The 3D opportunity primer.
31. Jeremy Faludi et al., “Comparing environmental impacts of additive manufacturing vs. traditional machining via life cycle assessment,” Rapid Prototyp-ing Journal 21, no. 1 (2015): pp. 14–33.
32. Ibid.
33. Matthias Finkbeiner et al., “The new international standards for life cycle assessment: ISO 14040 and ISO 14044,” International Journal of Life Cycle Assessment 11, no. 2 (2006): pp 80–85.
34. For a more complete overview of this process, see Cotteleer, “3D opportunity for production.”
35. For a complete description of this analysis, see the full article by Huang et al., “Energy and emissions saving potential of additive manufacturing.”
36. John Coykendall et al., 3D opportunity for aerospace and defense: Additive manufacturing takes flight, Deloitte University Press, June 2, 2014, http://dupress.com/articles/additive-manufacturing-3d-opportunity-in-aerospace/.
37. Huang et al., “Energy and emissions saving potential of additive manufacturing.”
38. For further information, or a full review of the published research referenced in this section, see Huang et al., “Energy and emissions saving potential of additive manufacturing.”
39. As noted in the full analysis, component categories receiving feasibility scores greater than 5 were considered to be most suitable for near-term adoption of AM components and thus deserved to be called out. For further information, see “Table 2: Aircraft component systems attribute ratings,” of Huang et al., “Energy and emissions saving potential of additive manufacturing.”
40. For further information on SLM and other additive manufacturing pro-cesses, see Cotteleer, Holdowsky, and Mahto, The 3D opportunity primer.
41. A gigajoule refers to the amount of potential energy present in a standard US barrel of oil were it to be ignited or used as fuel.
42. For further information regarding the Bass dif-fusion model, see Frank Bass, “A new product growth for model consumer durables,” Man-agement Science 15, no. 5 (1969): pp. 215–27; or visit http://www.bassbasement.org/BassModel/, where Bass’s approach is further explained.
43. ConverUnits.com, “Convert terajoule to gallon [U.S.] of kerosene type jet fuel,” http://www.convertunits.com/from/terajoule/to/gallon+[U.S.]+of+kerosene+type+jet+fuel, accessed August 19, 2015.
44. Bureau of Transportation Statistics, “Airline fuel cost and consumption (U.S. carriers—scheduled): January 2000–July 2015,” US Department of Transporta-tion, http://www.transtats.bts.gov/fuel.asp?pn=1, accessed September 11, 2015.
45. Ibid.
46. For further information regarding chal-lenges of additively manufactured metal components, see Coykendall et al., 3D op-portunity for aerospace and defense.
3D opportunity for life cycle assessments: Additive manufacturing branches out
16

AcknowledgementsThe authors would like to thank Eric Masanet, associate professor, McCormick School of
Engineering and Applied Science, Northwestern University; Diane Graziano, complex systems analyst, chemical engineer, and senior fellow, Northwestern-Argonne Institute of Science and Engineering; Matthew E. Riddle, assistant energy scientist, Argonne National Laboratory; Joshua Warren, Oak Ridge National Laboratory; Sujit Das, Oak Ridge National Laboratory; Sachin Nimbalkar, Oak Ridge National Laboratory; and Joe Cresko, Advanced Manufacturing Office, Office of Energy Efficiency and Renewable Energy, US Department of Energy.
ContactsBeth McGrathFederal Strategy and OperationsDirectorDeloitte Consulting LLP+1 571 420 [email protected]
Mark J. CotteleerCenter for Integrated ResearchResearch director Deloitte Services, LP+1 414 977 2359 [email protected]
A Deloitte series on additive manufacturing
17

About Deloitte University Press Deloitte University Press publishes original articles, reports and periodicals that provide insights for businesses, the public sector and NGOs. Our goal is to draw upon research and experience from throughout our professional services organization, and that of coauthors in academia and business, to advance the conversation on a broad spectrum of topics of interest to executives and government leaders.
Deloitte University Press is an imprint of Deloitte Development LLC.
About this publication This publication contains general information only, and none of Deloitte Touche Tohmatsu Limited, its member firms, or their related entities (collectively the “Deloitte Network”) is, by means of this publication, rendering professional advice or services. Before making any decision or taking any action that may affect your finances or your business, you should consult a qualified professional adviser. No entity in the Deloitte Network shall be responsible for any loss whatsoever sustained by any person who relies on this publication.
About Deloitte Deloitte refers to one or more of Deloitte Touche Tohmatsu Limited, a UK private company limited by guarantee (“DTTL”), its network of member firms, and their related entities. DTTL and each of its member firms are legally separate and independent entities. DTTL (also referred to as “Deloitte Global”) does not provide services to clients. Please see www.deloitte.com/about for a more detailed description of DTTL and its member firms.
Deloitte provides audit, tax, consulting, and financial advisory services to public and private clients spanning multiple industries. With a globally connected network of member firms in more than 150 countries and territories, Deloitte brings world-class capabilities and high-quality service to clients, delivering the insights they need to address their most complex business challenges. Deloitte’s more than 200,000 professionals are committed to becoming the standard of excellence.
© 2015. For information, contact Deloitte Touche Tohmatsu Limited.
Follow @DU_Press
Sign up for Deloitte University Press updates at DUPress.com.