Embed Size (px)
Citation preview
8/12/2019 3d Model of Insulated Wall
http://slidepdf.com/reader/full/3d-model-of-insulated-wall 1/32
Publisher’s version / Version de l'éditeur:
Contact us / Contactez nous: [email protected].
http://nparc.cisti-icist.nrc-cnrc.gc.ca/npsi/jsp/nparc_cp.jsp?lang=fr
L’accès à ce site Web et l’utilisation de son contenu sont assujettis aux conditions présentées dans le site
LISEZ CES CONDITIONS ATTENTIVEMENT AVANT D’UTILISER CE SITE WEB.
READ THESE TERMS AND CONDITIONS CAREFULLY BEFORE USING THIS WEBSITE.
NRC Publications Record / Notice d'Archives des publications de CNRC:http://nparc.cisti-icist.nrc-cnrc.gc.ca/npsi/ctrl?lang=en
http://nparc.cisti-icist.nrc-cnrc.gc.ca/npsi/ctrl?lang=fr
Access and use of this website and the material on it are subject to the Terms and Conditions set forth at
http://nparc.cisti-icist.nrc-cnrc.gc.ca/npsi/jsp/nparc_cp.jsp?lang=en
NRC Publications Archive
Archives des publications du CNRC
This publication could be one of several versions: author’s original, accepted manuscript or the publisher’s version. /
La version de cette publication peut être l’une des suivantes : la version prépublication de l’auteur, la version
acceptée du manuscrit ou la version de l’éditeur.
For the publisher’s version, please access the DOI link below./ Pour consulter la version de l’éditeur, utilisez le lien
DOI ci-dessous.
http://dx.doi.org/10.1080/19401493.2010.532568
International Journal of Building Performance Simulation, pp. 1-17, 2011-01-24
3D heat and air transport model for predicting the thermal resistance of
insulated wall assemblies
Saber, H. H.; Maref, W.; Elmahdy, A. H.; Swinton, M. C.; Glazer, R.
8/12/2019 3d Model of Insulated Wall
http://slidepdf.com/reader/full/3d-model-of-insulated-wall 2/32
http://www.nrc-cnrc.gc.ca/irc
3D heat and air transport model for predict ing the t hermal resistance
of insulate d w all assemblies
N R C C - 5 3 5 8 3
S a b e r , H . H . ; M a r e f , W . ; E l m a h d y , A . H . ;S w i n t o n , M . C . ; G l a z e r , R .
Janua ry 2011
A version of this document is published in / Une version de ce document se trouve dans:
International Journal of Building Performance Simulation, pp. 1-17, January24, 2011, DOI: 10.1080/19401493.2010.532568
The material in this document is covered by the provisions of the Copyright Act, by Canadian laws, policies, regulations and international
agreements. Such provisions serve to identify the information source and, in specific instances, to prohibit reproduction of materials withoutwritten permission. For more information visit http://laws.justice.gc.ca/en/showtdm/cs/C-42
Les renseignements dans ce document sont protégés par la Loi sur le droit d'auteur, par les lois, les politiques et les règlements du Canada etdes accords internationaux. Ces dispositions permettent d'identifier la source de l'information et, dans certains cas, d'interdire la copie dedocuments sans permission écrite. Pour obtenir de plus amples renseignements : http://lois.justice.gc.ca/fr/showtdm/cs/C-42

8/12/2019 3d Model of Insulated Wall
http://slidepdf.com/reader/full/3d-model-of-insulated-wall 3/32
8/12/2019 3d Model of Insulated Wall
http://slidepdf.com/reader/full/3d-model-of-insulated-wall 4/32
1
3D Heat and Air Transport Model for Predicting theThermal Resistances of Insulated Wall Assemblies
Hamed H. Saber1, Wahid Maref2, Hakim Elmahdy3,Michael C. Swinton4 and Rock Glazer5
1 PhD, Research Officer and Corresponding Author (phone: 1-613-993-9772,
2 PhD, Senior Research Officer3 PhD, PE, Principal Research Officer
4 MSc, PE, Principal Research Officer and Group Leader
5 Technical Officer
National Research Council Canada, Institute for Research in Construction, Bldg. M-24,
1200 Montreal Road, Ottawa, Ontario, Canada K1A 0R6
http://irc.nrc-cnrc.gc.ca/irccontents.html
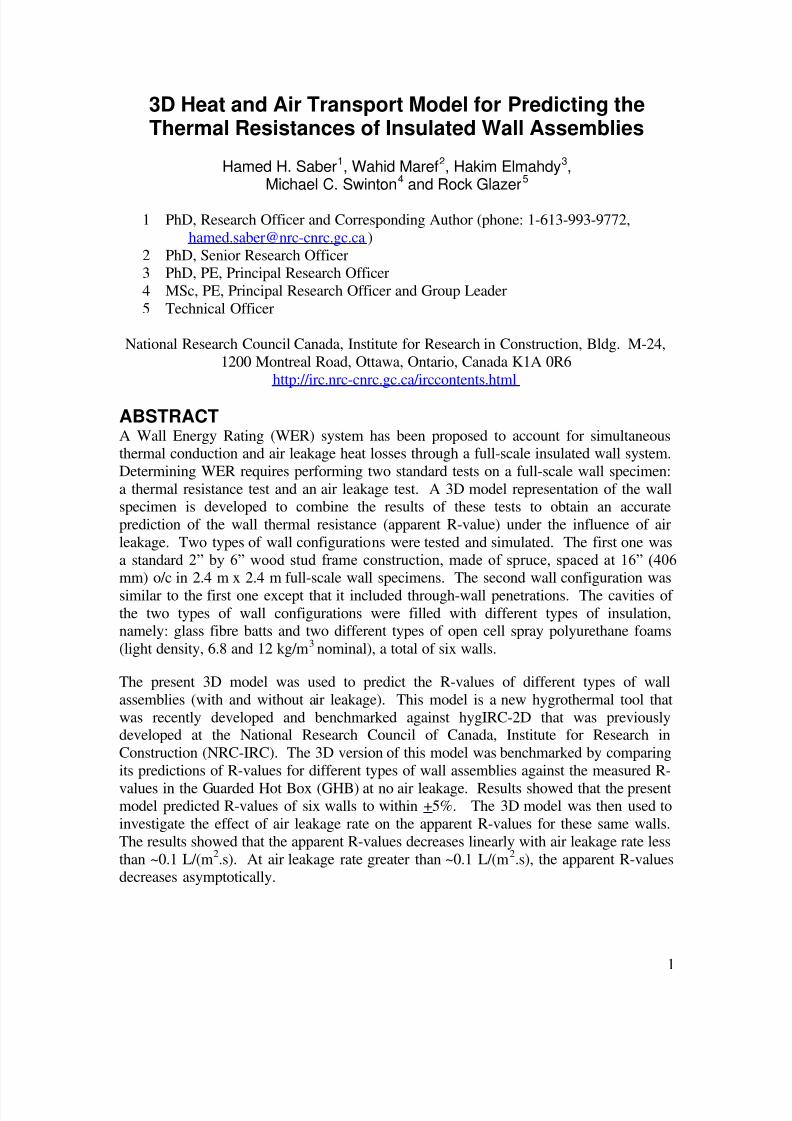
ABSTRACTA Wall Energy Rating (WER) system has been proposed to account for simultaneousthermal conduction and air leakage heat losses through a full-scale insulated wall system.
Determining WER requires performing two standard tests on a full-scale wall specimen:
a thermal resistance test and an air leakage test. A 3D model representation of the wallspecimen is developed to combine the results of these tests to obtain an accurate
prediction of the wall thermal resistance (apparent R-value) under the influence of air
leakage. Two types of wall configurations were tested and simulated. The first one was
a standard 2” by 6” wood stud frame construction, made of spruce, spaced at 16” (406mm) o/c in 2.4 m x 2.4 m full-scale wall specimens. The second wall configuration was
similar to the first one except that it included through-wall penetrations. The cavities of
the two types of wall configurations were filled with different types of insulation,namely: glass fibre batts and two different types of open cell spray polyurethane foams
(light density, 6.8 and 12 kg/m3 nominal), a total of six walls.
The present 3D model was used to predict the R-values of different types of wall
assemblies (with and without air leakage). This model is a new hygrothermal tool that
was recently developed and benchmarked against hygIRC-2D that was previouslydeveloped at the National Research Council of Canada, Institute for Research in
Construction (NRC-IRC). The 3D version of this model was benchmarked by comparing
its predictions of R-values for different types of wall assemblies against the measured R-
values in the Guarded Hot Box (GHB) at no air leakage. Results showed that the presentmodel predicted R-values of six walls to within +5%. The 3D model was then used to
investigate the effect of air leakage rate on the apparent R-values for these same walls.
The results showed that the apparent R-values decreases linearly with air leakage rate less
than ~0.1 L/(m2.s). At air leakage rate greater than ~0.1 L/(m
2.s), the apparent R-values
decreases asymptotically.
8/12/2019 3d Model of Insulated Wall
http://slidepdf.com/reader/full/3d-model-of-insulated-wall 5/32
2
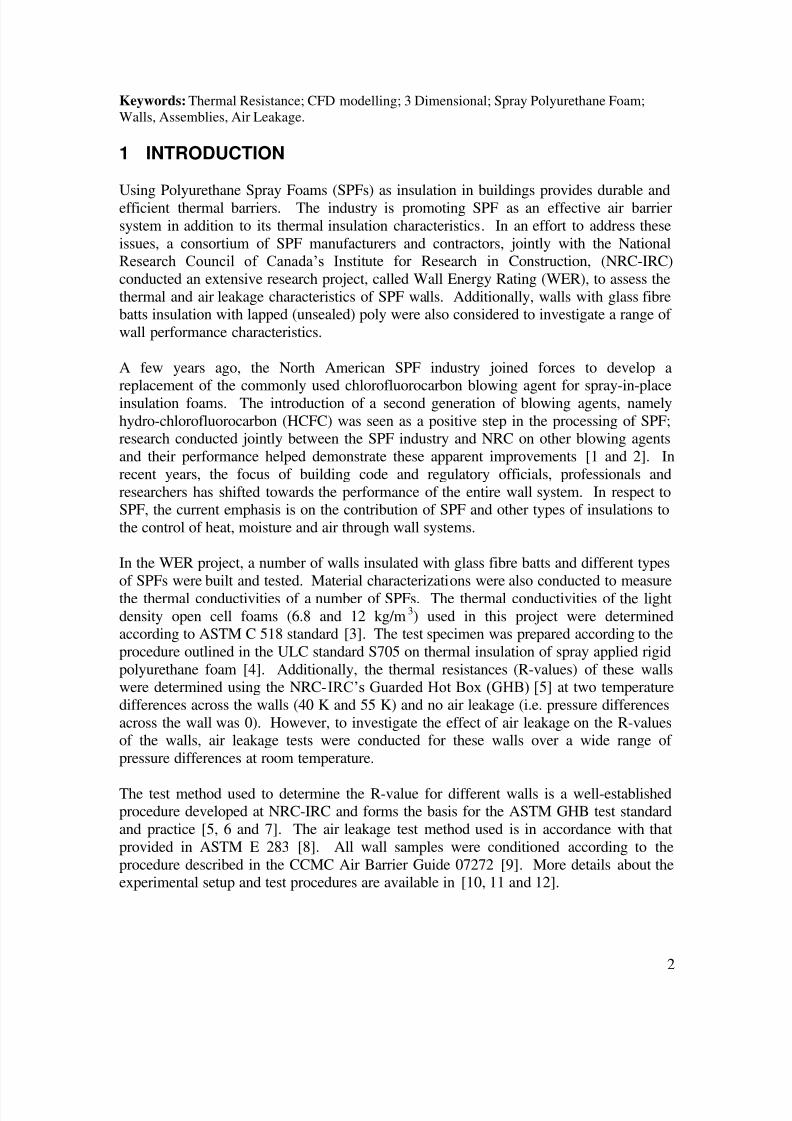
Keywords: Thermal Resistance; CFD modelling; 3 Dimensional; Spray Polyurethane Foam;
Walls, Assemblies, Air Leakage.
1 INTRODUCTION
Using Polyurethane Spray Foams (SPFs) as insulation in buildings provides durable andefficient thermal barriers. The industry is promoting SPF as an effective air barrier
system in addition to its thermal insulation characteristics. In an effort to address these
issues, a consortium of SPF manufacturers and contractors, jointly with the National
Research Council of Canada’s Institute for Research in Construction, (NRC-IRC)
conducted an extensive research project, called Wall Energy Rating (WER), to assess the
thermal and air leakage characteristics of SPF walls. Additionally, walls with glass fibrebatts insulation with lapped (unsealed) poly were also considered to investigate a range of
wall performance characteristics.
A few years ago, the North American SPF industry joined forces to develop a
replacement of the commonly used chlorofluorocarbon blowing agent for spray-in-placeinsulation foams. The introduction of a second generation of blowing agents, namely
hydro-chlorofluorocarbon (HCFC) was seen as a positive step in the processing of SPF;research conducted jointly between the SPF industry and NRC on other blowing agents
and their performance helped demonstrate these apparent improvements [1 and 2]. In
recent years, the focus of building code and regulatory officials, professionals and
researchers has shifted towards the performance of the entire wall system. In respect toSPF, the current emphasis is on the contribution of SPF and other types of insulations to
the control of heat, moisture and air through wall systems.
In the WER project, a number of walls insulated with glass fibre batts and different types
of SPFs were built and tested. Material characterizations were also conducted to measure
the thermal conductivities of a number of SPFs. The thermal conductivities of the light
density open cell foams (6.8 and 12 kg/m3) used in this project were determinedaccording to ASTM C 518 standard [3]. The test specimen was prepared according to the
procedure outlined in the ULC standard S705 on thermal insulation of spray applied rigid
polyurethane foam [4]. Additionally, the thermal resistances (R-values) of these wallswere determined using the NRC-IRC’s Guarded Hot Box (GHB) [5] at two temperature
differences across the walls (40 K and 55 K) and no air leakage (i.e. pressure differences
across the wall was 0). However, to investigate the effect of air leakage on the R-valuesof the walls, air leakage tests were conducted for these walls over a wide range of
pressure differences at room temperature.
The test method used to determine the R-value for different walls is a well-establishedprocedure developed at NRC-IRC and forms the basis for the ASTM GHB test standard
and practice [5, 6 and 7]. The air leakage test method used is in accordance with that
provided in ASTM E 283 [8]. All wall samples were conditioned according to the
procedure described in the CCMC Air Barrier Guide 07272 [9]. More details about theexperimental setup and test procedures are available in [10, 11 and 12].
8/12/2019 3d Model of Insulated Wall
http://slidepdf.com/reader/full/3d-model-of-insulated-wall 6/32
3
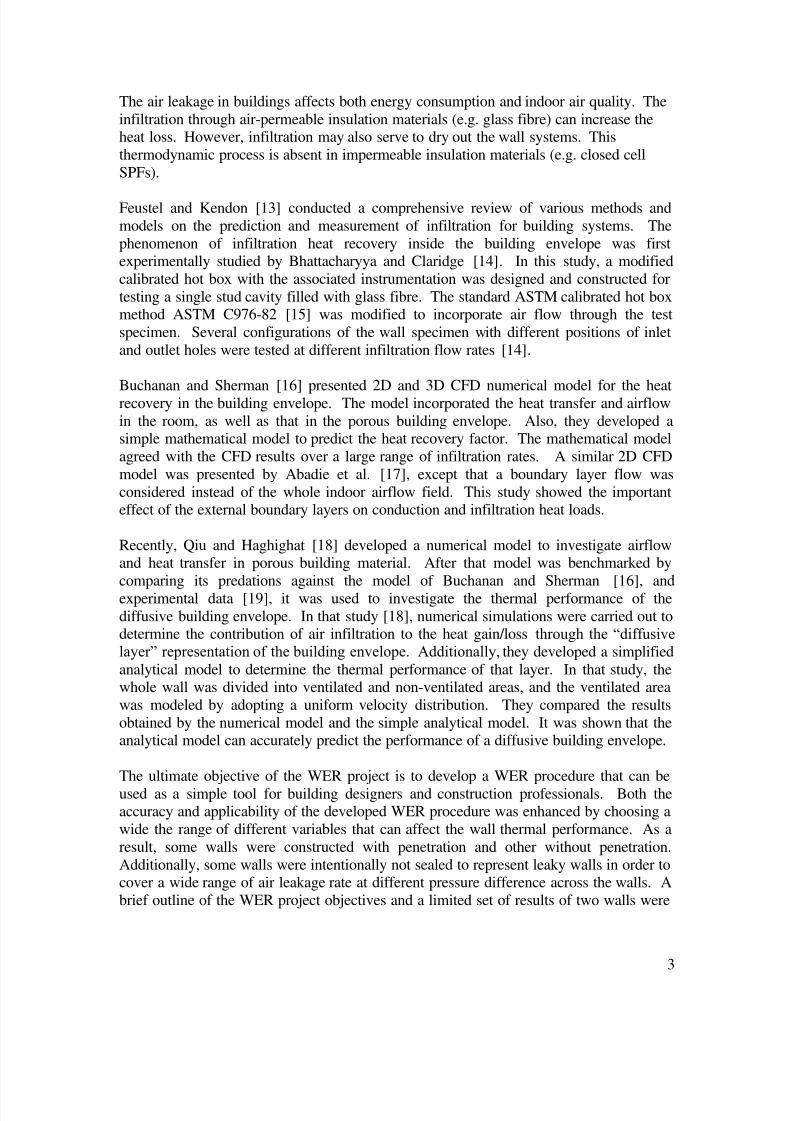
The air leakage in buildings affects both energy consumption and indoor air quality. The
infiltration through air-permeable insulation materials (e.g. glass fibre) can increase theheat loss. However, infiltration may also serve to dry out the wall systems. This
thermodynamic process is absent in impermeable insulation materials (e.g. closed cell
SPFs).
Feustel and Kendon [13] conducted a comprehensive review of various methods and
models on the prediction and measurement of infiltration for building systems. The
phenomenon of infiltration heat recovery inside the building envelope was firstexperimentally studied by Bhattacharyya and Claridge [14]. In this study, a modified
calibrated hot box with the associated instrumentation was designed and constructed for
testing a single stud cavity filled with glass fibre. The standard ASTM calibrated hot boxmethod ASTM C976-82 [15] was modified to incorporate air flow through the test
specimen. Several configurations of the wall specimen with different positions of inlet
and outlet holes were tested at different infiltration flow rates [14].
Buchanan and Sherman [16] presented 2D and 3D CFD numerical model for the heatrecovery in the building envelope. The model incorporated the heat transfer and airflow
in the room, as well as that in the porous building envelope. Also, they developed asimple mathematical model to predict the heat recovery factor. The mathematical model
agreed with the CFD results over a large range of infiltration rates. A similar 2D CFD
model was presented by Abadie et al. [17], except that a boundary layer flow was
considered instead of the whole indoor airflow field. This study showed the importanteffect of the external boundary layers on conduction and infiltration heat loads.
Recently, Qiu and Haghighat [18] developed a numerical model to investigate airflowand heat transfer in porous building material. After that model was benchmarked by
comparing its predations against the model of Buchanan and Sherman [16], and
experimental data [19], it was used to investigate the thermal performance of the
diffusive building envelope. In that study [18], numerical simulations were carried out todetermine the contribution of air infiltration to the heat gain/loss through the “diffusivelayer” representation of the building envelope. Additionally, they developed a simplified
analytical model to determine the thermal performance of that layer. In that study, thewhole wall was divided into ventilated and non-ventilated areas, and the ventilated area
was modeled by adopting a uniform velocity distribution. They compared the results
obtained by the numerical model and the simple analytical model. It was shown that theanalytical model can accurately predict the performance of a diffusive building envelope.
The ultimate objective of the WER project is to develop a WER procedure that can be
used as a simple tool for building designers and construction professionals. Both theaccuracy and applicability of the developed WER procedure was enhanced by choosing a
wide the range of different variables that can affect the wall thermal performance. As a
result, some walls were constructed with penetration and other without penetration.
Additionally, some walls were intentionally not sealed to represent leaky walls in order tocover a wide range of air leakage rate at different pressure difference across the walls. A
brief outline of the WER project objectives and a limited set of results of two walls were
8/12/2019 3d Model of Insulated Wall
http://slidepdf.com/reader/full/3d-model-of-insulated-wall 7/32
4
presented in an earlier paper [10] and test results of six walls were presented in a
subsequent paper [11]. Two of these walls were intentionally constructed with somedeficiencies to represent leaky walls for the purpose of development the WER procedure.
These two walls (WER-1 and WER-5) were insulated with glass fibre. The air barrier
featured poly that was lapped at a joint and penetrations were not sealed. Note that these
two walls do not meet all the air barrier requirements of Canadian National BuildingCode (NBC) 2005 [20]. The other four walls were insulated with medium density closed
cell SPF (34.9 to 46.3 kg/m3). The purpose of this study was not to compare the
performance of the insulation products but the performance of airtight system versusleaky system regardless of the type of insulations. In a third paper [12], additional details
on the testing program for another six walls was presented, in addition to a brief
description of the analytical approach used to determine the Wall Energy Rating (WER)of insulated wall assemblies. Four of the six walls were insulated using light density
open cell SPF (6.8 and 12 kg/m3). The remaining two walls were reference walls (WER-
1 and WER-5, [11]).
The objective of this paper is to report on the development of the 3D numerical approachthat was developed and on the results of 3D numerical simulations for walls with and
without penetration from which was derived the R-values with and without air leakage.These simulations were conducted using the recently developed 3D hygrothermal model
that solves simultaneously the highly nonlinear constitutive equations for Heat, Air and
Moisture (HAM) transfer through materials. Using this model, the predictions of the R-
values for different types of walls are compared with those measured from testsconducted in the GHB at zero air leakage. Following viable results in predicting the R-
values at no air leakage, a parametric study was then conducted to predict the apparent R-
values at different leakage rates that were measured for each wall assembly. The work inthis project is progressing and the plan is to test and conduct 3D simulations for
additional walls; this will help further develop and refine the WER procedure, which, it is
expected, could be used as a simple tool for building designers and construction
professionals. The WER procedure could also be used to assess whether specific wallconfigurations comply with current or future energy code requirements.
2 Need for 3D Heat and Air Transport Model
The heat flow through a wall assembly involves a multi-dimensional heat exchange
within the wall. The multi-dimensional effect on the heat transfer through the wallbecomes significant in a wall subjected to a large temperature difference (e.g. 40 - 55 K).
This is due to the effect of thermal bridges that are created by wood frames. Also, in the
case of a wall with a penetration, the wood frame around the penetration will create morethermal bridges. Air movement through the wall assembly is expected when pressuredifference exists across the wall. The rate of air movement through a wall due to air
leakage depends on the air tightness of the wall assembly as well as the air permeability
of the different wall components. It is important to note that air movement through wallsadds a convective heat transfer component when determining the overall degree of heat
transfer across the wall.
8/12/2019 3d Model of Insulated Wall
http://slidepdf.com/reader/full/3d-model-of-insulated-wall 8/32
5
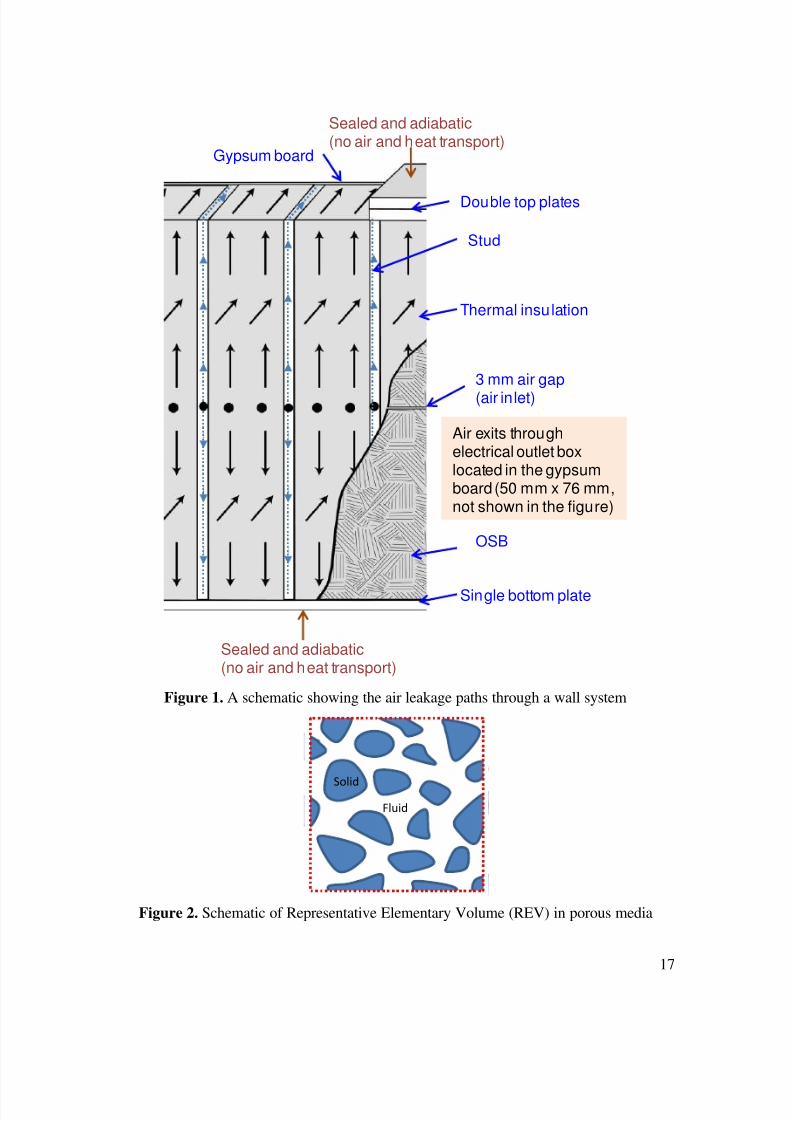
The air leakage paths through the wall assembly are quite complicated. Figure 1 shows a
schematic of air leakage paths through a wall assembly. In the air leakage tests, all wallperimeters were sealed. As such, for a given pressure difference across the wall, air
enters the wall assembly at low temperature (e.g. -20oC or -35oC) through a 3 mm air gap
between the two OSB sheathing boards. After the air finds its way through the wall, it
exits mainly through the electrical outlet box located in the drywall. Because of thedifferent shapes and locations of the 3 mm gap between the two OSB boards and the
electrical outlet box, the air can move through the wall in vertical, horizontal and lateral
directions (3D movement).
While air moves through the wall, it carries a quantity of heat that depends not only on
the leakage rate but also on the temperature difference across the wall system. The airpaths and movements within the wall assembly could be through the thermal insulation
(the case of open cell SPF or glass fibre), through openings in construction (due to
tolerances in installation practice), cracks, and due to material imperfections. The
openings that occur due to construction tolerances results in air gaps between all solid-
solid interfaces of the different wall components through which air can pass (studs – OSB, studs-top plate, studs-bottom plate, studs-gypsum board interfaces). Note that the
amount of heat carried by the air depends on its local velocity. For example, a high localair velocity would result in a large effect in the local temperature distribution within the
wall. In order to accurately predict both the temperature and heat flux distributions, and
hence determine the wall thermal resistance, an accurate prediction for the velocity field
in the wall is needed. However, to capture the multi-dimensional effects on the heattransfer and air flow through different wall assemblies (with and without penetration)
there is a need to develop a 3D model to be used for evaluating the thermal performance
of different wall systems.
Recently, a hygrothermal model (2D and 3D) that uses COMSOL as a solver was
developed at NRC-IRC. This model solves simultaneously the highly nonlinear 2D and
3D Heat, Air and Moisture (HAM) transport equations. These equations were discretizedusing the Finite Element Method (FEM). The use of the FEM is important as it permits
modeling complicated wall geometries with less discretizing errors. The present model
accounts for surface-to-surface radiation (e.g. foundation wall system with low emissivityof foil bonded to expanded polystyrene foam in a furred-airspace assembly [20]).
Recently, the 2D version of the present model was used to conduct numerical simulations
in order to investigate the effect of the emissivity of foil on the effective thermalresistance of a foundation wall system with foil bonded to expanded polystyrene foam in
a furred assembly with airspace next to the foil [20]. In this work, no moisture transport
was accounted for in predicting the thermal performance of different types of walls. The
heat and air transport equations in the different material layers are presented next.
3 Governing Equations
The continuity and momentum equations for air flow through porous medium are given
as [22]:
8/12/2019 3d Model of Insulated Wall
http://slidepdf.com/reader/full/3d-model-of-insulated-wall 9/32
6
Mass balance equation:f f
f v
t
(1)
Darcy's law: gPk
v f
f
f
f
, (2)
where: P is the air pressure (Pa), g
is vector of acceleration due to gravity (m2
/s), f v
isDarcy velocity vector of the air (m/s), f is air density (kg/m3), is material porosity,
f k is air permeability (m2), and f is air dynamic viscosity (Pa.s). When Eqs. (1) and (2)
are combined, the equation of motion of air through porous medium is rewritten as:
gP
k
t f
f
f f f
(3)
In the airspace (air gaps layers, electrical outlet box), the continuity equation and
momentum equation (compressible Navier-Stokes equation) are respectively given as[22]:
and ,f f f v
t
(4)
,3
2)( gIvvvPvv
t
vf f f
T
f f f f f f
f
f
(5)
where, I is a 3x3 unit matrix
The energy equation in porous media is obtained from local volume averaging. An
averaging volume should be sized small enough in order to not filter global flowstructures but it should be large enough so as to guarantee containing both fluid and solid
phases everywhere in the structure at all times. Such volume is called a Representative
Elementary Volume, REV (see Figure 2). The volume-averaged energy equation for thefluid phase inside an REV is given in terms of fluid temperature, f T , and solid
temperature, sT , as:
k source/sinqTThTTvCpTCp
t f ssf sf f f f f f f f f f
, (6)
where: f Cp is the air specific heat (J/(kg.K)), f is the air thermal conductivity
(W/(m.K)), sf h is the interfacial heat transfer coefficient (W/(m2.K)), sf is the specific
surface area of the solid-fluid interface inside REV (m2 /m3), and k source/sinq is the
volumetric heat source/sink (e.g. due to condensation/evaporation inside the REV)
(W/m3). Similarly, for the solid phase inside an REV, its volume-averaged energyequation is:
f ssf sf sssss TThTTCp
t
)1()1( (7)
The subscript s in the above equation refers to the solid phase. The second term on the
RHS in Eqs. (6) and (7) was used to achieve the full coupling between the two energy
equations of solid and fluid phases. It also represents the energy exchange between thetwo phases due to temperature difference between solid and fluid inside the REV.
8/12/2019 3d Model of Insulated Wall
http://slidepdf.com/reader/full/3d-model-of-insulated-wall 10/32
7
In many practical applications, the temperature difference between the solid and fluidphases inside an REV is much smaller than the global scale temperature variation [23,
24]. This condition is met if the REV is much smaller compared to global length scale
[25]. Under this condition, the temperatures of the fluid and solid phases could be
assumed equal to the local thermodynamic equilibrium temperature, T . In other words,the local thermal equilibrium between the two phases inside an REV is assumed to occur.
Based on this assumption, the energy equations for the fluid and solid phases (Eqs. (6)
and (7)) are combined to one energy equation as:
k source/sin)1()1( qTTvCpTCpCp
t sf f f f ssf f
(8)
In building applications, the range of the temperature difference across different building
components is not large. As such, f Cp , sCp , and s can be assumed constants (i.e.
independent of temperature). Based on this assumption, the combination of the fluidmass balance equation given by Eq. (1) and the energy equation given by Eq. (8) leads to:
) / (and ,)1(where
k source/sin
of f seff sf eff
eff f f f eff o
CpCpCp
qTTvCpt
TCp
(9)
The parameters so )1( , eff and eff Cp in Eq. (9) are the matrix density, effective
thermal conductivity and effective specific heat, respectively, for a porous material.These parameters are measurable and obtained from material characterization. In the
case of airspace, however, the energy equation is also given by Eq. (9) where 1 . In
this case, f eff and f f eff o CpCp .
Since no moisture transport was considered in this work, the last term on the RHS of Eq.
(9) was neglected. The first term on the RHS of Eq. (9) accounts for heat transport byconduction. Also, the second term on the LHS of this equation accounts for heat
transport by convection, where the velocity vector, f v
, is given by Eq. (2) in the case of
porous media and Eq. (5) in the case of airspace. In order to predict the wall thermalresistance (R-value), Eqs. (1), (2) and (9) for porous media, and Eqs. (4), (5) and (9) for
airspace are solved simultaneously at the steady state condition, where only the effective
thermal conductivity eff (see Eq. (9)), and air permeability, f k , of different material
layers are need.
4 Benchmark the Present Model
Since the present model has 2D and 3D capabilities, its 2D capability was activated to
compare its predictions against the hygIRC-2D model that previously developed at NRC-
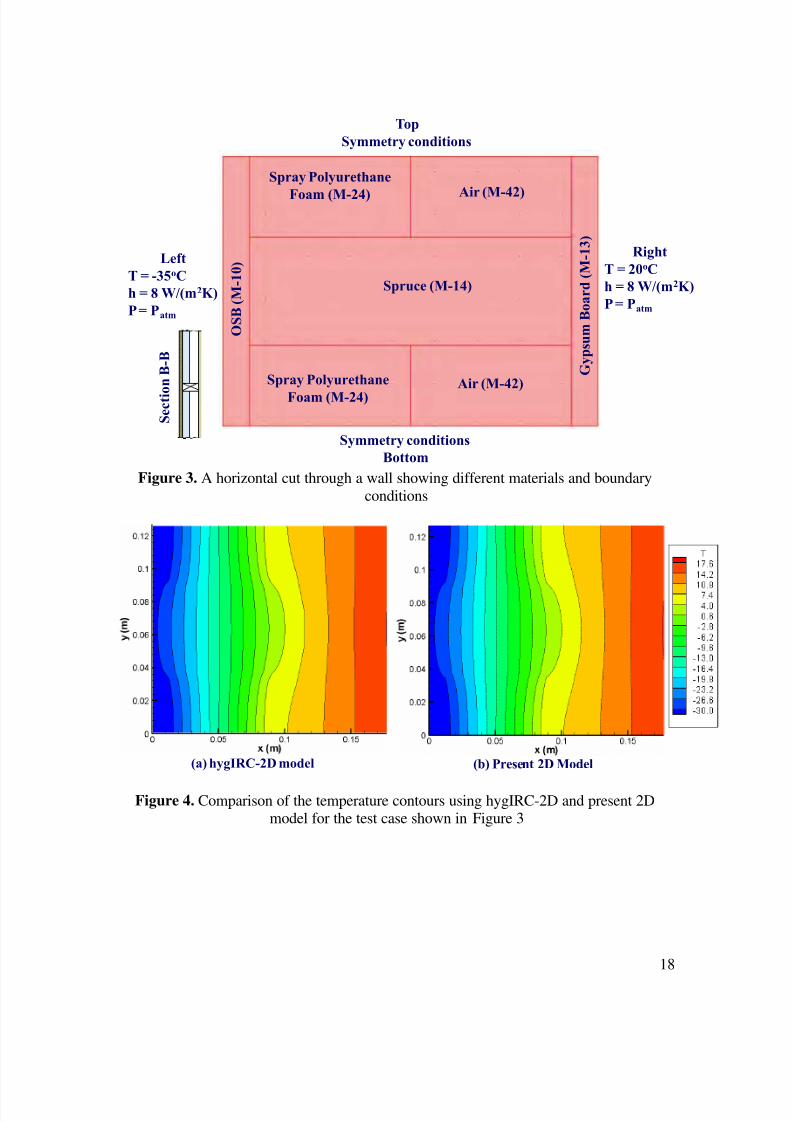
IRC [26 and 27]. Figure 3 shows a test case for a horizontal cut through a wall specimen
and the different material layers. Note that symbol (M-xx) in this figure specifies the
material ID number in the NRC-IRC database of the material properties. Also, this figure
shows the boundary conditions that have been used in this test case.
8/12/2019 3d Model of Insulated Wall
http://slidepdf.com/reader/full/3d-model-of-insulated-wall 11/32
8
Figure 4 shows the temperature contours in this horizontal cut obtained using hygIRC-2D
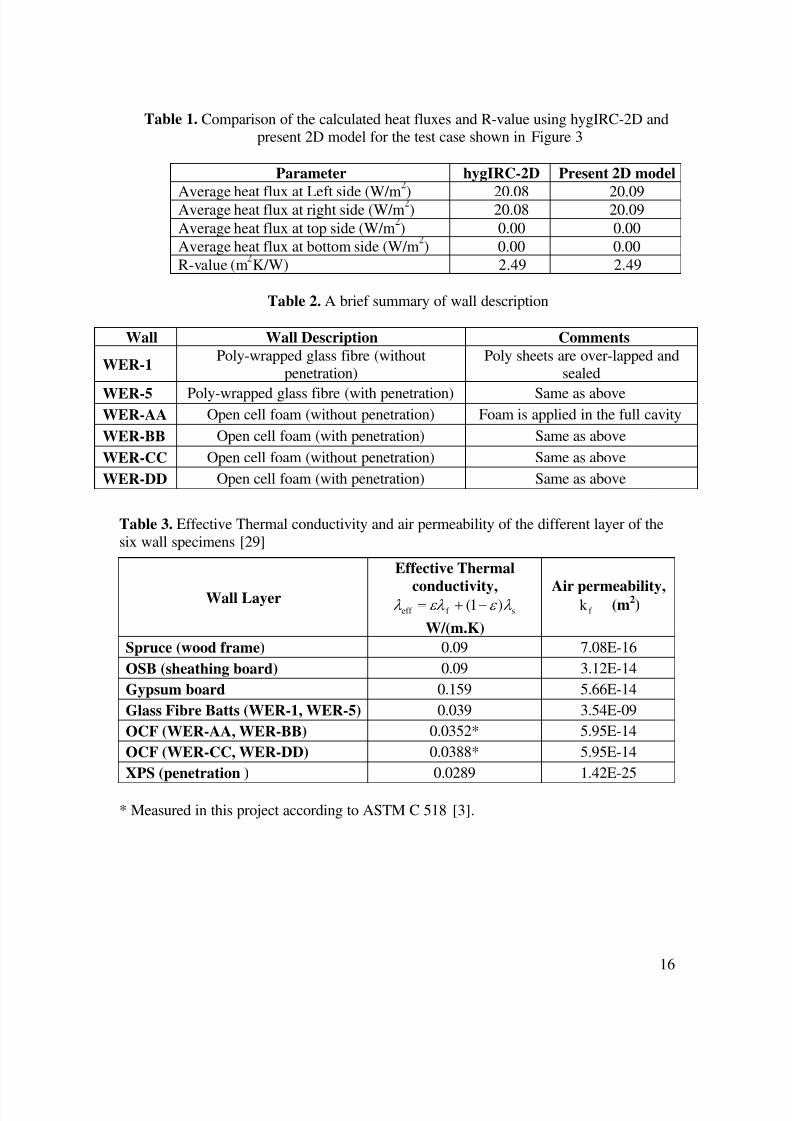
[28] and the present 2D model. As shown in this figure, both models predict the sametemperature distribution. Furthermore, as shown in Table 1, the calculated heat fluxes
(on the top, bottom, left and right sides) and the R-value using hygIRC-2D and the
present 2D model are identical. Other test cases using the 2D capability of the present
model were carried out and the obtained results were compared against the hygIRC-2Dmodel. The results showed that the predictions of both models are in good agreement.
Another step for benchmarking the present 3D model was taken by comparing its
predictions for the R-values of six wall specimens against the measured R-values in theGuarded Hot Box (GHB). The descriptions of these walls and the material properties
used in the numerical simulations are presented next.
5 Description of Wall Specimens
Six wall specimens were constructed according to common North American construction
industry practice. All walls were built according to the CCMC Air Barrier Guide 07272
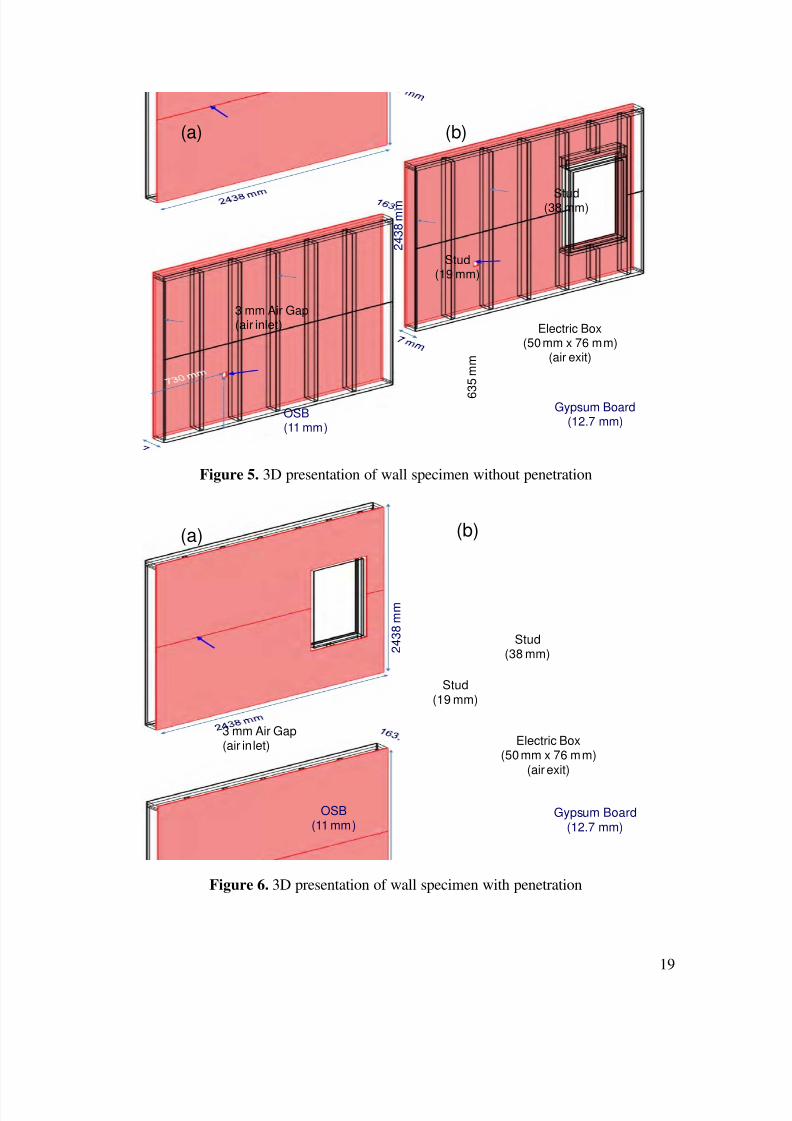
[9]. Table 2 provides a brief description of these walls. Figure 5 and Figure 6 show wall
specimens with and without penetration, respectively, illustrating the construction details.
The six walls listed in Table 2 were built using the conventional 2” by 6” (38 mm by 138
mm) wood stud frame construction. The studs were spaced at 406 mm (16”) on center
with double top plates and a single bottom plate. A 19 mm stud was used at each end of
the wall. Two reference walls were lapped poly, no sealing of penetrations and the
insulation not contributing to the air barrier (WER-1 and WER-5) and the other four
walls (WER-AA, WER-BB, WER-CC and WER-DD) were insulated with two light
densities, open cell SPF insulations (6.8 and 12 kg/m3). Three walls were opaque (WER-
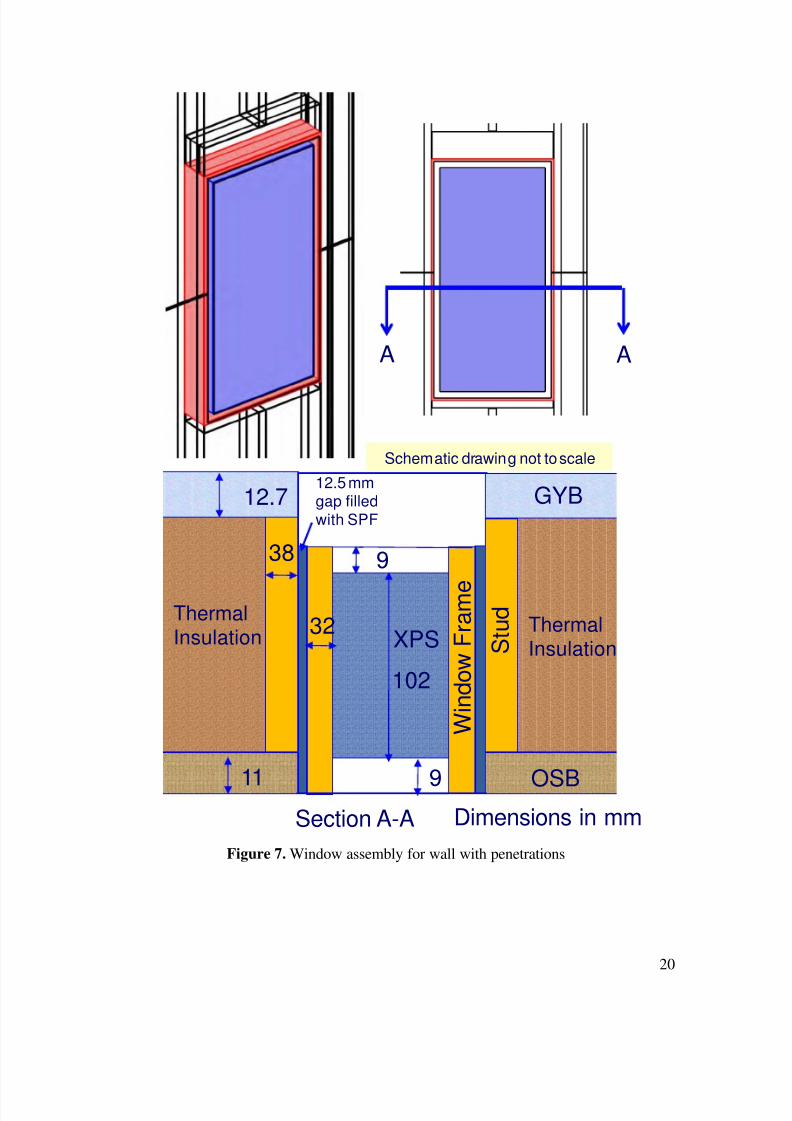
1, WER-AA and WER-CC) and other three included penetrations (WER-5, WER-BB andWER-DD) to simulate a window (see Figure 7 for the details of the window). Thermal
test and air leakage test were conducted for these walls and the results of these tests are
available in [12].
WER-1 and WER-5 were built to field installation practices to illustrate the Wall Energy
Rating with poor air tightness, including the following detailing choices:
o Part 9 of the National Building Code of Canada (NBC) 2005 [20] requires one oftwo options be followed for air barrier continuity between 2 sheets of poly
for the air barrier:
1. Sealing the joint2. Lapping the joint by not less than 100 mm and clamping between framing
members and rigid panels
We chose the second option, with the understanding that it is likely less effective in
controlling air leakage.
o NBC 2005 [20] also requires sealing of windows, piping, ducting and electrical
boxes to maintain the integrity of the air barrier.
We purposely did none of these.
8/12/2019 3d Model of Insulated Wall
http://slidepdf.com/reader/full/3d-model-of-insulated-wall 12/32
9
So WER-1 and WER-5 do not meet all of the air barrier requirements of NBC 2005 [20].
The present 3D model was used at steady-state condition to predict the R-values of
different wall specimens with and without air leakage. At steady-state condition,
however, the only material properties needed for the numerical simulations are the
effective thermal conductivity ( eff , see Eq. 9) and air permeability ( f k ) of the differentmaterial layers. These properties are listed in Table 3. All material properties shown in
this table except the effective thermal conductivities of the open cell SPF insulations
were obtained from Kumaran et al. [29]. The effective thermal conductivity of the opencell foams were measured at the NRC-IRC’s material characterization laboratory. The
test method used to measure the thermal conductivity was ASTM C 518 [3].
6 Assumptions, Boundary Conditions, and 3D Simulations
This section presents the assumptions, boundary conditions and the steps of conductingnumerical simulation using the present 3D model for different walls with and without
penetration. Each wall specimen was made of a number of material layers. Beforeconducting thermal tests in the GHB, all wall samples before and after conditioning were
tested at room temperature to determine their air leakage performance at differentpressure differential across the wall according to ASTM E283 (ASTM 1997) (see
references [10], [11] and [12] for more details). The extraneous air leakage (system air
leakage) was determined for each wall assembly. After many modifications in the NRC-
IRC’s air leakage tester, the system has approximately zero extraneous air leakage. All
perimeter boundaries of each wall assembly were sealed (i.e. no air transport, 0 f vn
).
As such, for a given pressure difference across the wall assembly, the air enters the wallspecimen through a 3 mm air gap between the two OSB sheathing boards and exits
through the electrical outlet box (see Figure 5 and Figure 6 for a wall without and with
penetration, respectively).
Figure 1 shows the air leakage paths through the wall assembly. It was assumed that
there is a 1 mm air gap to represent construction tolerance at all solid-solid interfaces,
namely: studs-OSB, studs-gypsum board, studs-top plate, and studs-bottom plateinterfaces. In the case of wall specimens with penetrations, the window wood frame adds
more construction tolerances than wall specimen without penetrations. As such, for the
same pressure difference across the wall, the measured air leakage rate in the wall withpenetrations was higher than that for wall without penetration (see reference [12] formore details). Consequently, it is expected that the R-value of a wall specimen with
penetrations would be lower than that for wall without penetrations due to the greater
number of thermal bridges and higher air leakage rate in the former as compared to the
latter. In all wall assemblies, it was assumed that the thermal insulations were in goodcontact with other wall components (the glass fibre batts were friction fit with other wall
components, and the open cell foams were sprayed-in-place).
The boundary conditions used to solve the air transport equation are: (a) inlet boundary at
the exterior surface of the 3 mm air gap between the OSB layers with prescribed uniform
velocity. This velocity was calculated from the measured air leakage rate at a given
8/12/2019 3d Model of Insulated Wall
http://slidepdf.com/reader/full/3d-model-of-insulated-wall 13/32
10
pressure differential across the wall, and (b) outlet boundary at the exterior surface of
electric box with prescribed pressure of 101 kPa. To check the air mass balance at steadystate condition, however, the predicted air mass flow rate at the outlet of the electrical
box was equal to the air mass flow rate at the 3 mm air gap between the two OSB layers.
Because the shape and the location of the 3 mm air gap and the electrical outlet box are
quite different, the air moves through the wall specimen in all directions (x-, y-, and z-direction, see Figure 1).
The boundary conditions used to solve the heat transport equation are: (a) adiabatic (i.e.
no heat losses, 0 Tk n
) on all perimeter boundaries, (b) convective boundary
condition on the outdoor wall surface with prescribed air temperature and heat transfercoefficient of -20oC and 8 W/(m2K), respectively, and (c) convective boundary condition
on the indoor wall surface with prescribed air temperature and heat transfer coefficient of
+20oC and 8 W/(m2K), respectively. In this study, the effects of wind and thermal
radiation on both outdoor and indoor surfaces of the wall were neglected. Although thepresent 3D model has the capability of handling hygrothermal properties as a function of
temperature, the thermal conductivities of the different material layers were taken asbeing constant. This is because the measured thermal conductivities were very nearlyconstant within the temperature range that was used in conducting the thermal tests in the
GHB (see [12] for more details).
In all wall specimens, it was assumed that the thermal insulations were uniformly
distributed in the stud cavities. In the case of wall with open cell SPFs, small air voids
were observed in the foams. Because the thermal conductivity of the air (~0.025
W/(m.K)) is comparable with the values of the thermal conductivities of these foams (seeTable 3), the small air voids in the foams would not have a significant effect on the R-
values. The type of mesh used in the numerical simulations is tetrahedral elements.Several mesh size were tested to identify the mesh size needed to obtain a mesh-
independent solution. In the numerical simulation, the convergence criteria were set to10-6. The temperature contours and air velocity field in a wall specimen with and without
penetrations is provided next.
7 Heat Transfer and Air Flow in Wall Specimens with andwithout Penetrations
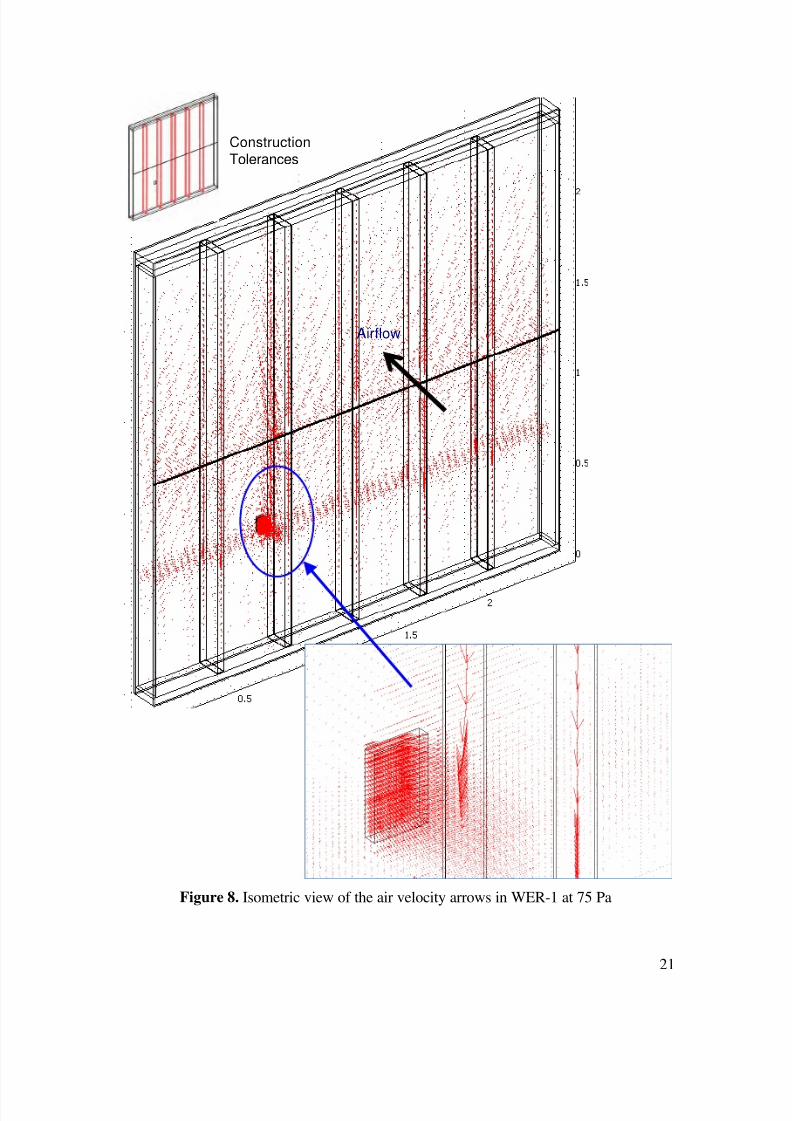
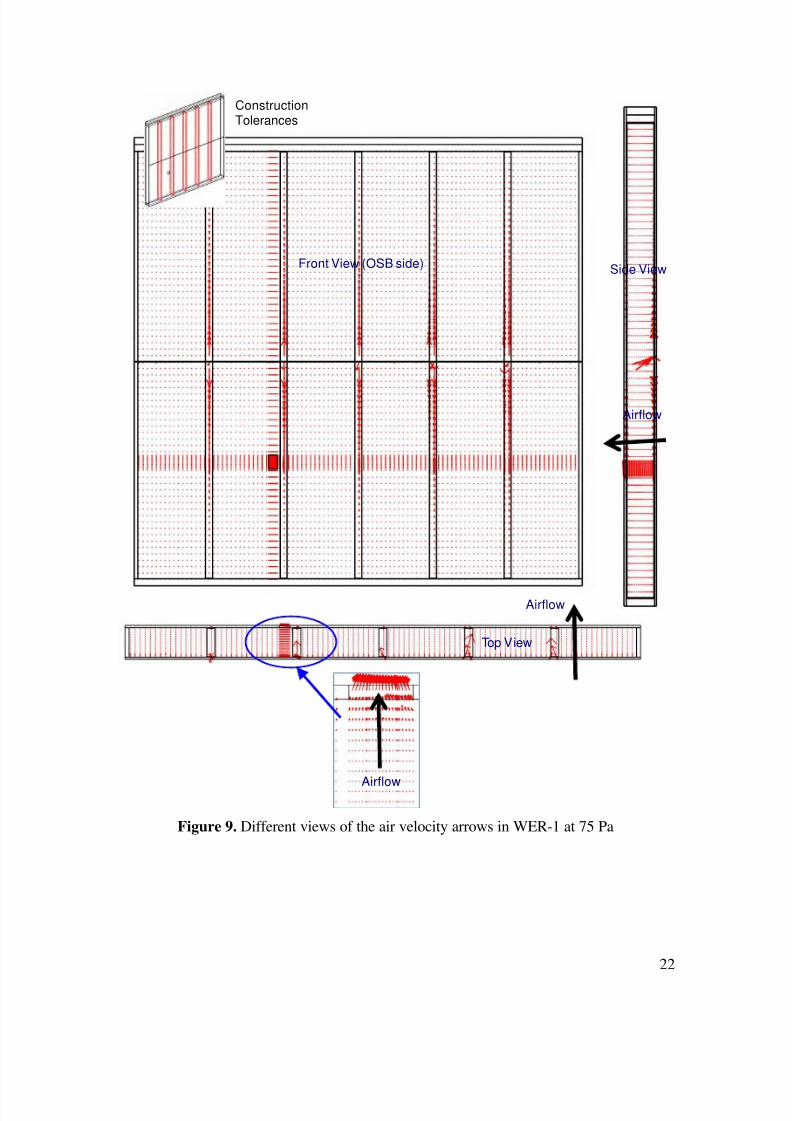
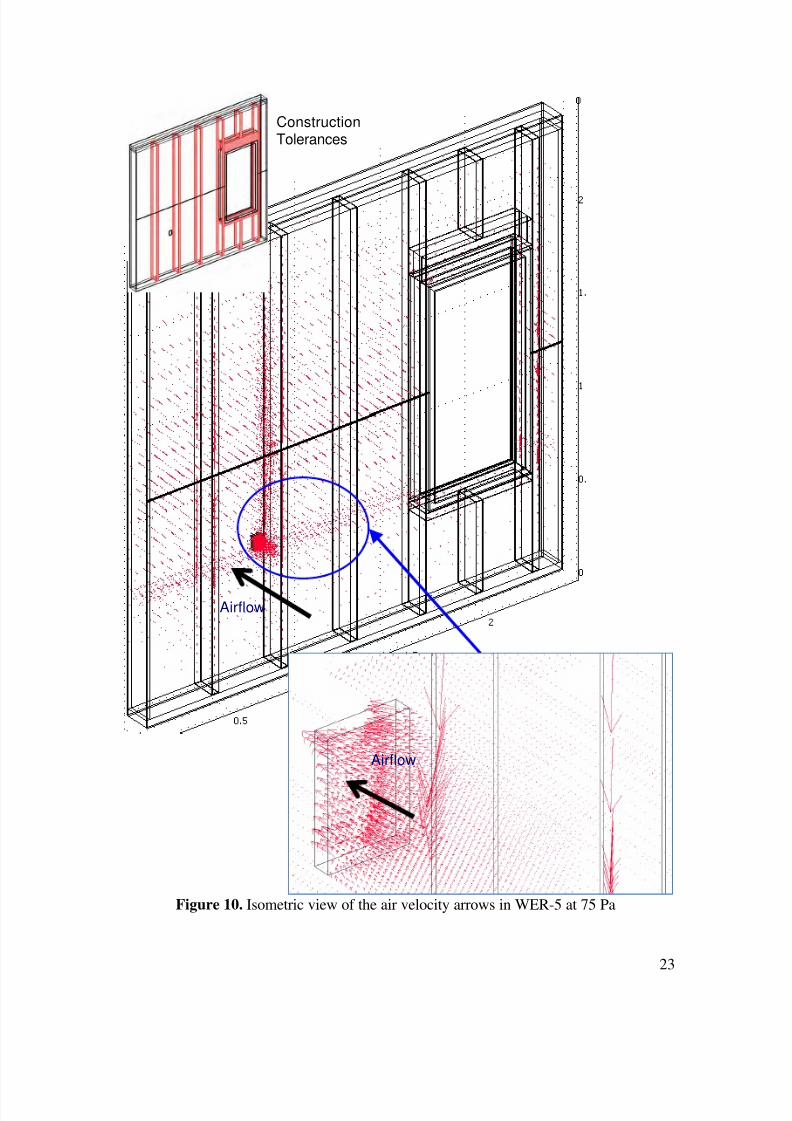
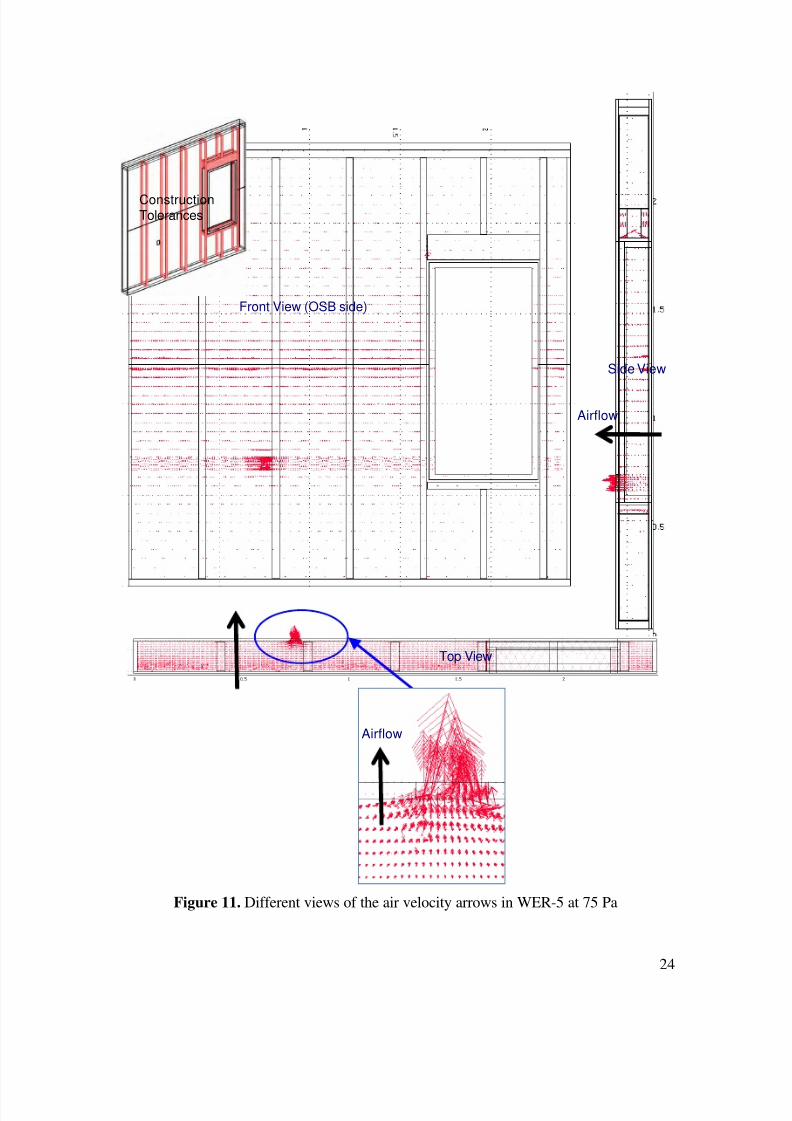
Figure 8 & Figure 9, and Figure 10 & Figure 11 show the air velocity field in a wall
specimen without penetration (WER-1) and with penetration (WER-5), respectively, formeasured leakage rates at a pressure difference across the wall of 75 Pa. In these figures,
the highly 3-dimentional nature of the air leakage flows through the wall can be easilyrecognized. The length of the velocity arrows is proportional to the magnitude of the
resultant velocity, resv ( 222 wvuvres ). The air enters the wall specimen through
the 3 mm air gap between the OSB sheathing boards at -20oC. Then, it flows through thewall and eventually exits the wall assembly through the electrical outlet box. As shown
in these figures, the local air velocity and its direction vary within the wall specimen.
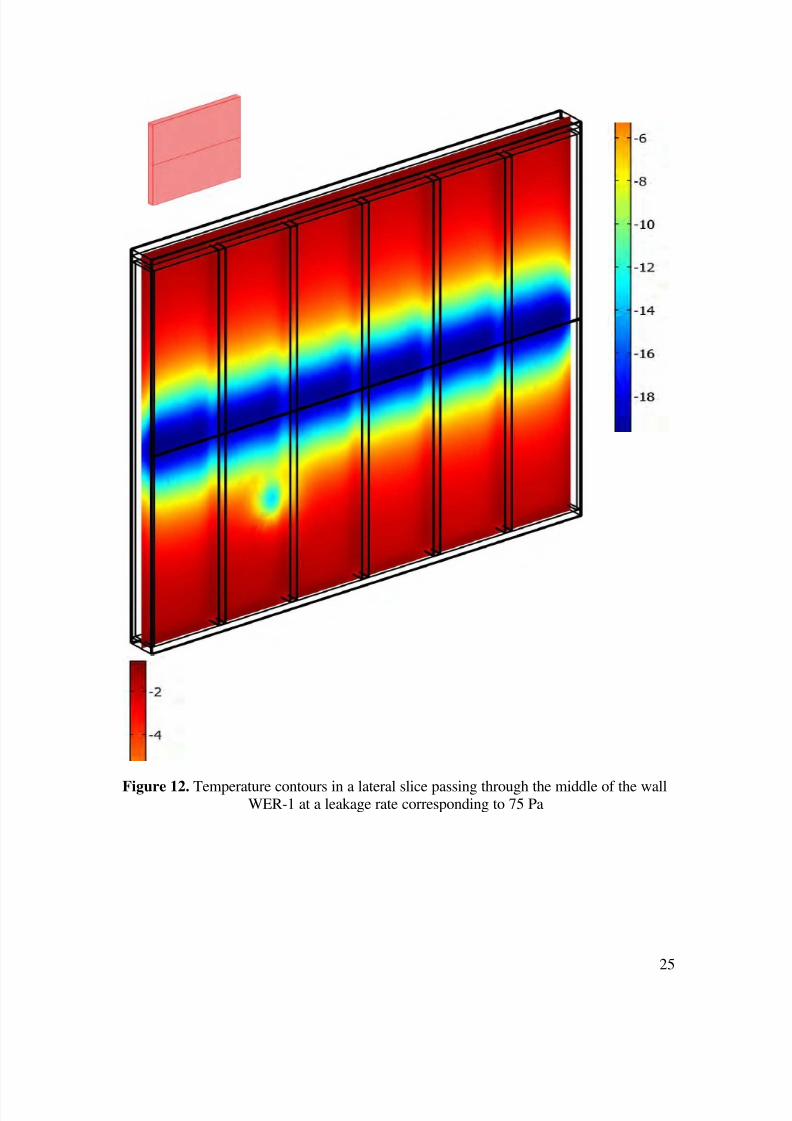
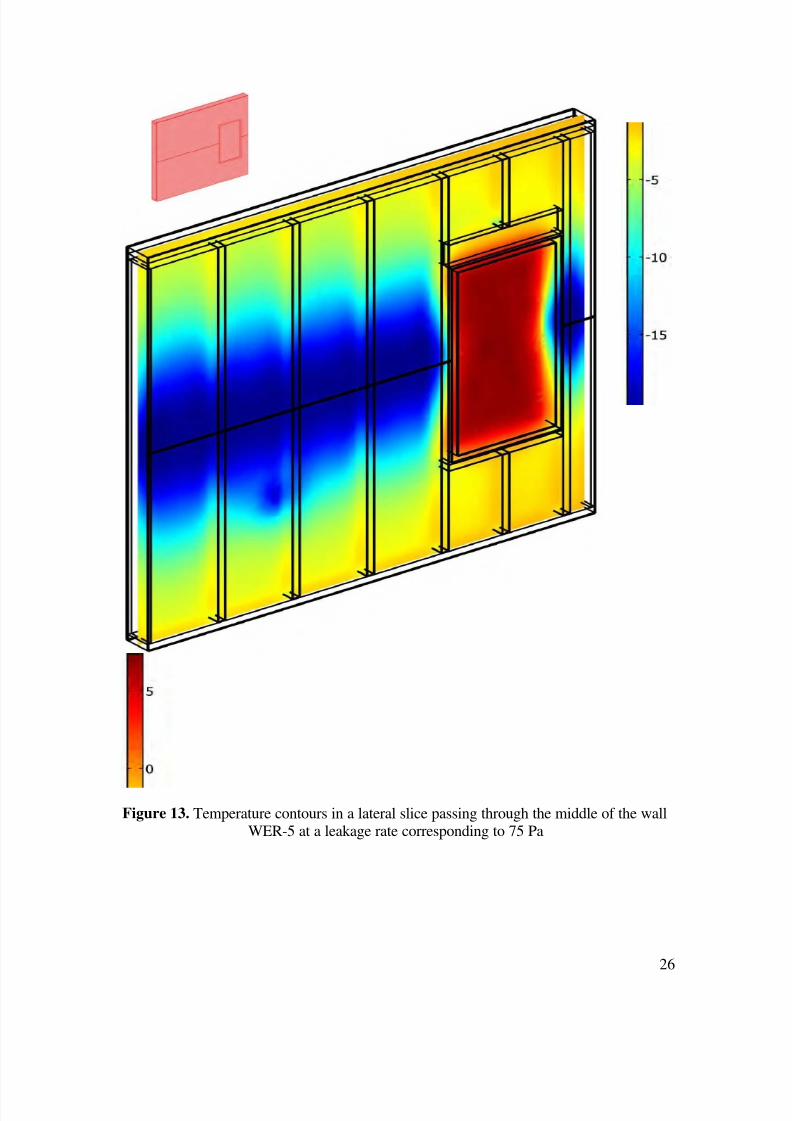
The effects of the air flow through these wall specimens on the local temperaturedistribution are shown Figure 12 and Figure 13. These figures show the temperature
8/12/2019 3d Model of Insulated Wall
http://slidepdf.com/reader/full/3d-model-of-insulated-wall 14/32
11
contours in a slice passing through the middle of the wall assemblies at a leakage rate
corresponding to P = 75 Pa. As shown in these figures, the local value of the airvelocity greatly affects the local temperature distribution in the wall. For example, the
region around the entry points of the air into the wall assembly has the lowest
temperatures. Accurate prediction of the apparent R-value for a wall assembly requires
capturing the three-dimensional effect on both the air flow and heat transfer through thewall assembly. The comparison of the present 3D predictions for the R-values of the six
wall specimens listed in Table 2 against the measured R-values are presented next.
8 Results and Discussion
The present 3D model was used to predict the R-values for the six wall assemblies shown
in Table 2 with and without air leakage. As indicated earlier, the test method used to
determine the R-values of all wall specimens is based on the ASTM GHB test standard
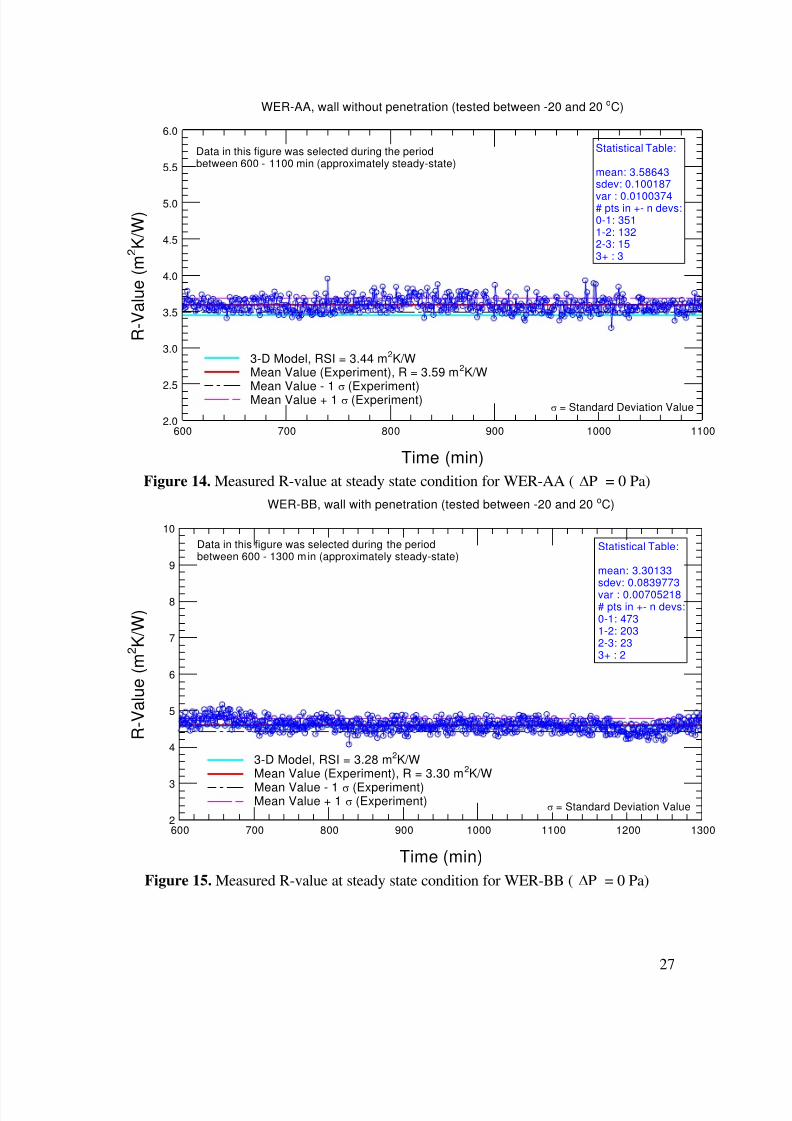
and practice [5 and 7]. Details of the measurements of R-values and air leakages fordifferent wall specimens are available in [10, 11, and 12]. Figure 14 and Figure 15 show
sample results of the measured R-values in the GHB for the wall specimens WER-AA,WER-BB, respectively, with open cell SPF as thermal insulations. The steady state
condition was achieved after ~10 hours. As shown in these figures, about 2/3 of the
collected data for R-values falls within 1 (where, = standard deviation value in
m2K/W). The mean R-values for WER-AA and WER-BB were 3.59 and 3.30 m2K/W,respectively. The corresponding standard deviation values of the measured R-values
were 0.10 and 0.08 m2K/W, respectively. The 1 corresponds to a deviation from themean R-values of +2.8%, and +2.5%, for WER-AA and WER-BB, respectively. These
figures clearly show that the uncertainty in most of the collected data for R-values was
~+6% (see Elmahdy, [5]).
Because the thermal conductivity of the studs is greater than that of the different types ofthermal insulations (see Table 3), these studs act as thermal bridges. In the case of wall
specimens with penetrations, a greater number of thermal bridges exist as a result of thewindow wood frame (Figure 7). As such, the wall specimens with penetration results in
lower R-values than that without penetration. For example, the stud cavities of both
WER-AA (opaque wall) and WER-BB (wall with penetration) were filled by the same
type of thermal insulation (open cell foam). The predicted and measured R-values forWER-AA were 3.44, and 3.59 m2K/W, respectively. For WER-BB, however, the
predicted and measured R-value (3.28, and 3.30 m2K/W, respectively) were lower than
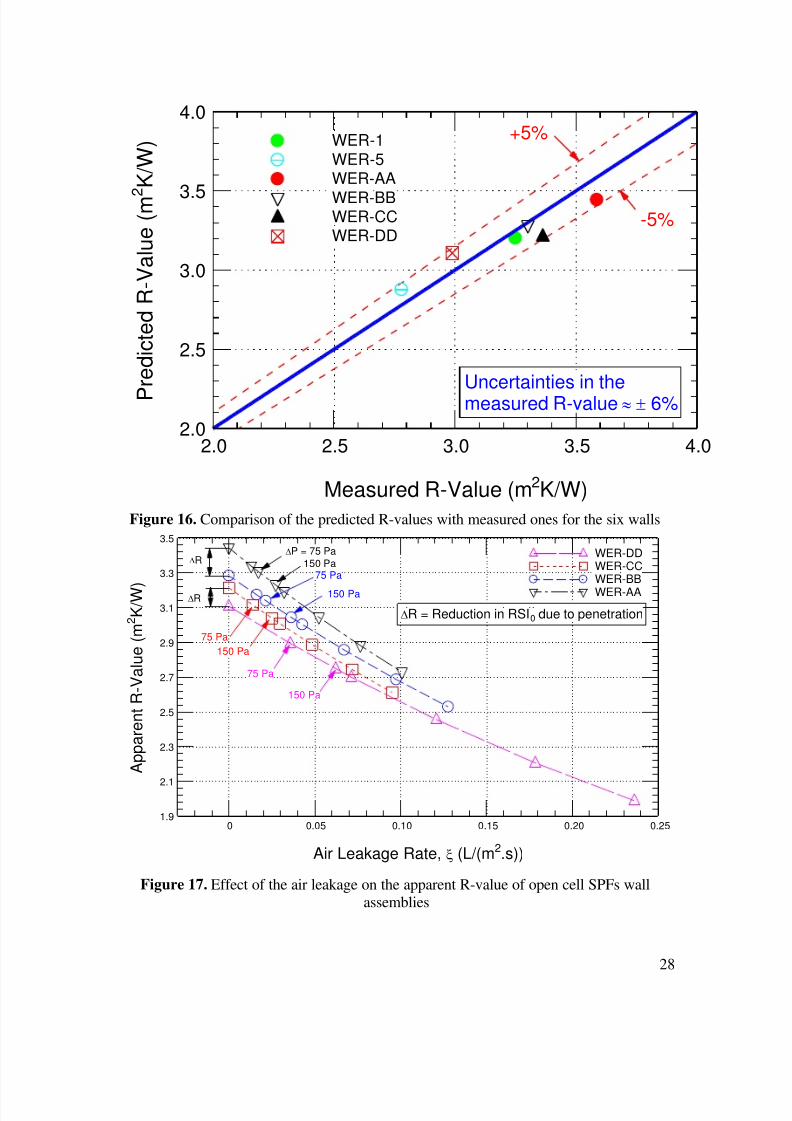
that for WER-AA (see Figure 14 and Figure 15). Figure 16 shows a comparison betweenthe predicted R-values using the present 3D model and the measured R-values for the six
wall specimens listed in Table 2 at no air leakage. As shown in this figure, the predictedR-values for all wall are in good agreement with the measured ones (within +5%).
After gaining confidence in the present 3D model in predicting R-values at no air
leakage, it was then used to predict the apparent R-values at different air leakage rates for
the six wall specimens. The CCMC Air Barrier Guide [9] sets the maximum allowable
air leakage rate for the product to be labeled as “air barrier”. This limit is set at 0.05L/(m2.s) at pressure difference, P = 75 Pa for higher indoor relative humidity
8/12/2019 3d Model of Insulated Wall
http://slidepdf.com/reader/full/3d-model-of-insulated-wall 15/32
12
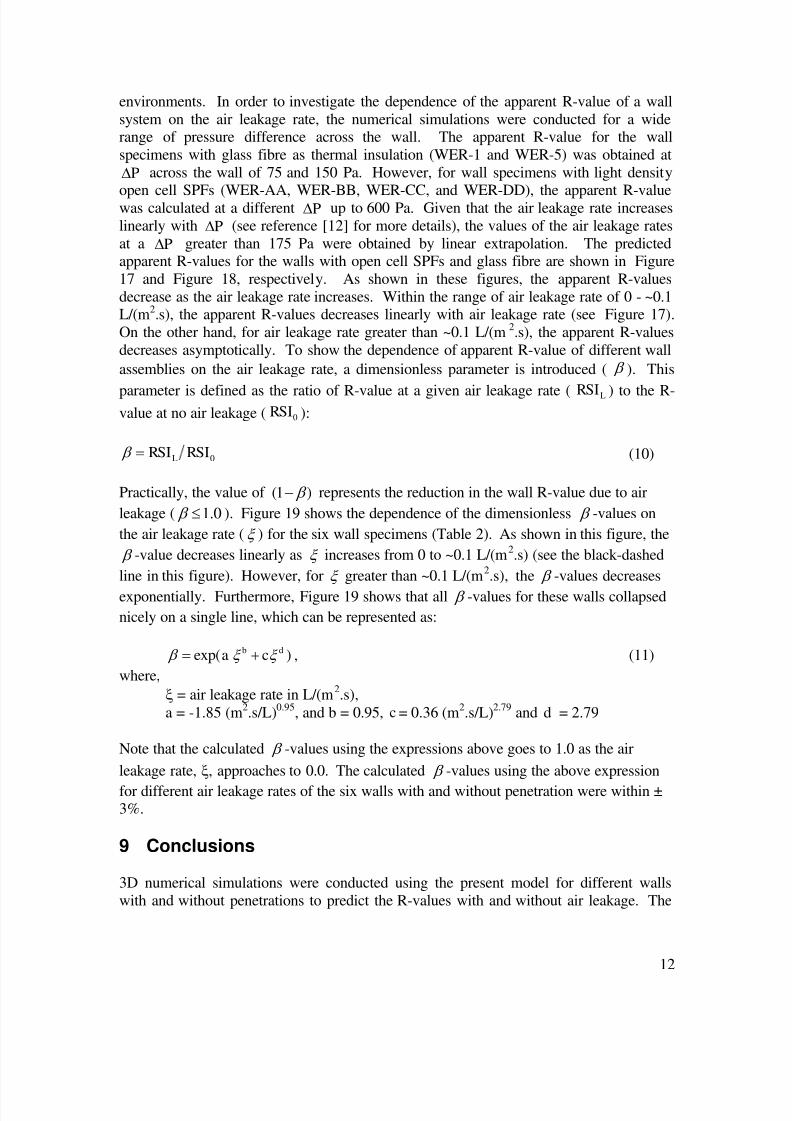
environments. In order to investigate the dependence of the apparent R-value of a wall
system on the air leakage rate, the numerical simulations were conducted for a widerange of pressure difference across the wall. The apparent R-value for the wall
specimens with glass fibre as thermal insulation (WER-1 and WER-5) was obtained at
P across the wall of 75 and 150 Pa. However, for wall specimens with light density
open cell SPFs (WER-AA, WER-BB, WER-CC, and WER-DD), the apparent R-valuewas calculated at a different P up to 600 Pa. Given that the air leakage rate increases
linearly with P (see reference [12] for more details), the values of the air leakage rates
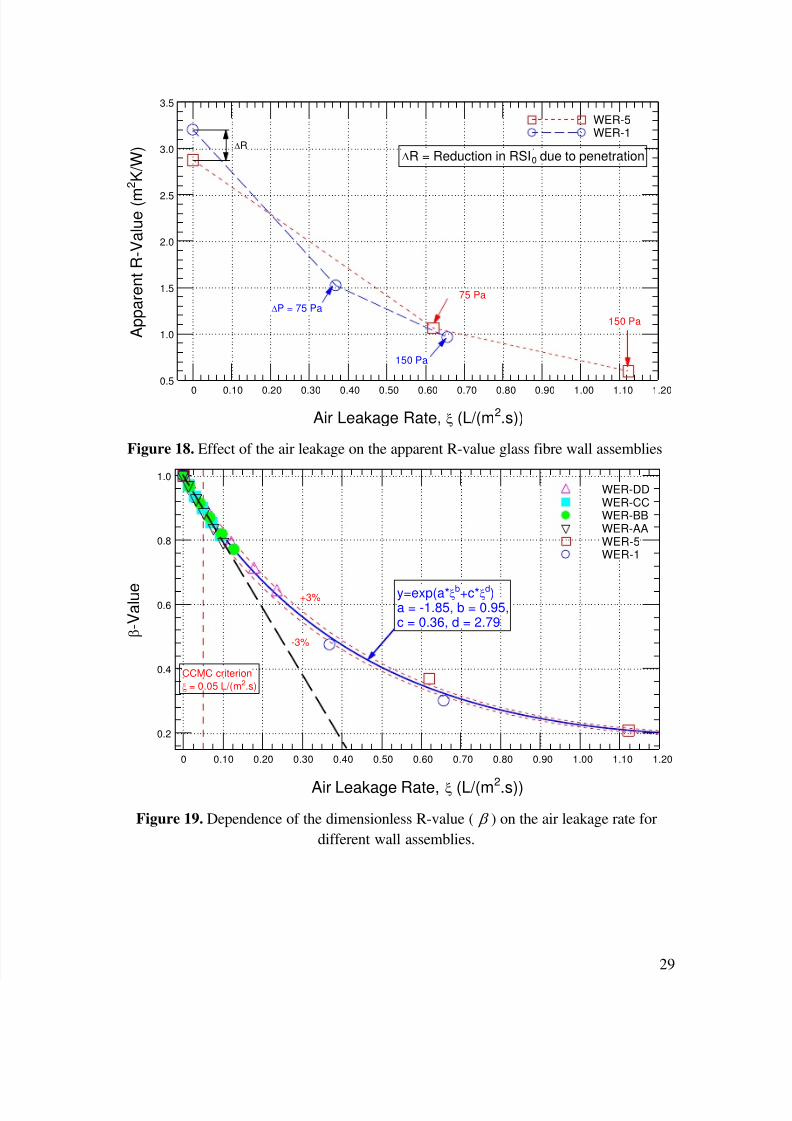
at a P greater than 175 Pa were obtained by linear extrapolation. The predictedapparent R-values for the walls with open cell SPFs and glass fibre are shown in Figure
17 and Figure 18, respectively. As shown in these figures, the apparent R-values
decrease as the air leakage rate increases. Within the range of air leakage rate of 0 - ~0.1L/(m2.s), the apparent R-values decreases linearly with air leakage rate (see Figure 17).
On the other hand, for air leakage rate greater than ~0.1 L/(m2.s), the apparent R-values
decreases asymptotically. To show the dependence of apparent R-value of different wall
assemblies on the air leakage rate, a dimensionless parameter is introduced ( ). This
parameter is defined as the ratio of R-value at a given air leakage rate ( LRSI ) to the R-value at no air leakage ( 0RSI ):
0RSIRSIL (10)
Practically, the value of )1( represents the reduction in the wall R-value due to air
leakage ( 0.1 ). Figure 19 shows the dependence of the dimensionless -values on
the air leakage rate ( ) for the six wall specimens (Table 2). As shown in this figure, the
-value decreases linearly as increases from 0 to ~0.1 L/(m2.s) (see the black-dashed
line in this figure). However, for greater than ~0.1 L/(m2.s), the -values decreases
exponentially. Furthermore, Figure 19 shows that all -values for these walls collapsed
nicely on a single line, which can be represented as:
)exp( db ca , (11)
where,
= air leakage rate in L/(m2.s),
a = -1.85 (m2.s/L)0.95, and b = 0.95, c = 0.36 (m2.s/L)2.79 and d = 2.79
Note that the calculated -values using the expressions above goes to 1.0 as the air
leakage rate, , approaches to 0.0. The calculated -values using the above expression
for different air leakage rates of the six walls with and without penetration were within ±3%.
9 Conclusions
3D numerical simulations were conducted using the present model for different walls
with and without penetrations to predict the R-values with and without air leakage. The
8/12/2019 3d Model of Insulated Wall
http://slidepdf.com/reader/full/3d-model-of-insulated-wall 16/32
13
2D capability of the present model was used to compare its predictions against the
hygIRC-2D model, previously developed at NRC-IRC. The results showed that thepredictions of both models are in good agreement. After gaining confidence in the
present model, its 3D capability was used to predict the R-values of six wall specimens
with and without penetrations at no air leakage. Two of these walls were insulated with
glass fibre (reference walls) with an unsealed poly – air barrier that resulted in high ratesof air leakage. The other four walls were insulated using light density open cell SPF (6.8
and 12 kg/m3) with sealed double top plates that resulted in good air tightness. The
predicted R-values for these walls were in good agreement with the measured R-values inthe Guarded Hot Box (GHB) (within + 5%). The present 3D model was also used to
predict the apparent R-values at different air leakage rates corresponding to pressure
differences across the six wall specimens up to 600 Pa. Results showed that the apparentR-value decreases linearly as air leakage rate increases within the range 0 - ~1.0 L/(m2.s),
and decreases exponentially for air leakage rate greater than ~0.1 L/(m2.s).
The results obtained for wall R-values with and without air leakage for the six walls
presented in this paper, as well as for other walls that used medium density closed cellSPFs as thermal insulation [10, 11], and new walls that are currently being built and
tested at NRC-IRC, will be used to develop a simple engineering correlation fordetermining the Wall Energy Rating (WER) number for different types of wall systems.
The results of these efforts will be the subject for future publications.
10 ACKNOWLEDGEMENTS
The authors wish to acknowledge the contribution from the following: CanadianUrethane Foam Contractors Association (CUFCA), Honeywell, BASF and Demilec. The
authors also wish to thank Dr. Kumar Kumaran for his support and guidance during the
development of the 3D model, and Mr. Mike Nicholls for his efforts in constructing thewall samples.
11 REFERENCES
1. Bomberg, M.T.; Kumaran, M.K., "Report on sprayed polyurethane foam with
alternative blowing agents," CFCs and the Polyurethane Industry: Vol. 2: (A
Compilation of Technical Publications) pp. 112-128, 1989, (NRCC-31113) (IRC-P-1638).
2. Kumaran, M.K.; Bomberg, M.T., "Thermal performance of sprayed polyurethane
foam insulation with alternative blowing agents," Journal of Thermal Insulation, 14,
pp. 43-57, 1990, (NRCC-32365) (IRC-P-1695).3. ASTM 2004. ASTM C 518 Steady-State Thermal Transmission Properties by Means
of the Heat Flow Meter Apparatus, Section 4, Volume 04.06, Philadelphia: American
Society for Testing and Materials, 2004.4. Underwriters' Laboratories of Canada (ULC): ULC S705.1-01, (Including
amendments 1&2). "Standard for Thermal Insulation - Spray Applied Rigid
Polyurethane Foam, Medium Density Material - Specification". 7 Underwriters Road,Toronto ON, Canada M1R 3B4, 2005.
8/12/2019 3d Model of Insulated Wall
http://slidepdf.com/reader/full/3d-model-of-insulated-wall 17/32
14
5. Elmahdy, A.H., "Heat transmission and R-value of fenestration systems using IRC
hot box: procedure and uncertainty analysis," ASHRAE Transactions, 98, (2),ASHRAE Annual Meeting, pp. 630-637, 1992.
6. ASTM 1998. ASTM C 1199 Test Method for Measuring the Steady State Thermal
Transmittance of Fenestration Systems Using Hot Box Methods, Philadelphia:
American Society for Testing and Materials, 1998.7. ASTM 1998. ASTM E 1423 Practice for Determining the Steady State Thermal
Transmittance of Fenestration Systems, Philadelphia: American Society for Testing
and Materials, 1998.8. ASTM 1997. E 283 Test Method for Rate of Air Leakage through Exterior Windows,
Curtain Walls and Doors, Philadelphia: American Society for Testing and Materials,
1997.9. Canadian Construction Materials Center (CCMC). Technical Guide for Air Barrier
Systems for Exterior Walls of Low-Rise Buildings, Masterformat Section 07272,
National Research Council of Canada, 1996.
10. Elmahdy, A. H., Maref, W. Swinton, M.C., Tariku, F., “Energy rating of
polyurethane spray foamed walls: procedures and preliminary results”. 4thInternational Building Physics Conference, Istanbul, Turkey, 15-18 June, 2009.
11. Maref, W., Elmahdy, A.H., Swinton, M.C., and Tariku, F., “Assessment of Energy
Rating of Polyurethane Spray Walls: Procedure and Interim Results”, ASTM 2nd
Symposium on Heat-Air-Moisture Transport: Measurements and Implications in
Buildings, Sponsored by ASTM C16 on Thermal Insulation, April 19-20, 2009,
Vancouver, British Colombia, Canada.12. Elmahdy, A.H., Maref, W., Swinton, M.C., Saber, H.H., and Glazer, R.,
“Development of Energy Ratings for Insulated Wall Assemblies” 2009 Building
Envelope Symposium (San Diego, CA. 2009-10-26) pp. 21-30, 2009.13. Feustel, H. E., and Kendon, V. M., "Infiltration Models for Multicellular Structures –
A Literature Review," Energy and Buildings, Vol. 8, pp. 123-136, 1988.
14. Bhattacharyya, S., and Claridge, D.E. “The Energy Impact of Air Leakage through
Insulated Walls”, Journal of Solar Engineering 117 (3) pp. 167– 172, 1995.15. ASTM, 1982, "Standard Test Method for Thermal Performance of Building
Assemblies by means of a Calibrated Hot Box," ASTM C976082, American Society
for Testing and Materials, Philadelphia, PA.16. Buchanan, C.R., and Sherman, M.H. A mathematical model for infiltration heat
recovery, Lawrence Berkeley Laboratory Report, LBL-44294, Berkeley, CA, 2000.
17. Abadie, M.O., Finlayson, E.U., and Gadgil, A.J., Infiltration Heat Recovery inBuilding Walls: Computational Fluid Dynamics Investigations Results, Lawrence
Berkeley Laboratory Report, LBNL-51324, Berkeley, CA, August, 2002.
18. Qiu, K. and Haghighat, F. “Modeling the combined conduction – Air infiltration
through diffusive building envelope”, Energy and Buildings 39, pp. 1140– 1150,2007.
19. Claridge, D. E., and Bhattacharyya, S., “The measured impact of infiltration in a testcell”, J. Solar Energy Engineering, Vol. 117, pp. 167-172, 1990.
20. National Building Code of Canada, 2005, Volume 1, Issued by the CanadianCommission on Building and Fire Codes, National Research Council of Canada.
8/12/2019 3d Model of Insulated Wall
http://slidepdf.com/reader/full/3d-model-of-insulated-wall 18/32
15
21. Saber, H.H., and Swinton, M.C., “Determining through Numerical Modeling the
Effective Thermal Resistance of a Foundation Wall System with Low EmissivityMaterial and Furred – Airspace” submitted to International Conference on BuildingEnvelope Systems and Technologies, ICBEST 2010, Vancouver, Canada, June 27-30,
2010.
22. Bird, R. B., Stewart, W.E., and Lightfoot, E.N., Transport Phenomena, John Wiley &Sons, Inc., 1960.
23. Vafai, K., and Tien, C.L., “Boundary and Inertia Effects on Flow and Heat Transfer
in Porous Media”, Int. J. of Heat and Mass Transfer, 24, pp. 195-203, 1981.24. Pakdee, W., and Rattanadecho, P. “Unsteady Effects of Natural Convective Heat
Transfer Through Porous Media in Cavity due to Top Surface Partial Convection”,
Applied Thermal Engineering, 26, pp. 2316-1326, 2006.25. Sozer, E., and Shyy, W., “Multi-scale Thermo-fluid Transport in Porous Media”, Int.
J. of Numerical Methods for Heat & Fluid Flow, Vol. 19, No. 7/8, pp. 883-899, 2008.
26. Maref, W., Kumaran, M.K., Lacasse, M.A., Swinton, M.C., and van Reenen, D.,
"Laboratory measurements and benchmarking of an advanced hygrothermal model,"
Proceedings of the 12th International Heat Transfer Conference (Grenoble, France,August 18, 2002), pp. 117-122, October 01, 2002 (NRCC-43054).
27. Maref, W., Lacasse, M.A., Kumaran, M.K., and Swinton, M.C., "Benchmarking ofthe advanced hygrothermal model-hygIRC with mid-scale experiments," eSim 2002
Proceedings (University of Concordia, Montreal, September 12, 2002), pp. 171-176,
October 01, 2002 (NRCC-43970).
28. Tariku, F., Maref, W., Swinton M.C., and Elmahdy A.H. “Numerical simulations fordetermining the thermal response of wall systems with medium density polyurethane
spray foams” eSim 2010 Conference, Winnipeg, Manitoba, Canada, May 18 -21,
2010.29. Kumaran, K., Lackey, J., Normandin, N., Tariku, F and van Reenen, D. A Thermal
and Moisture Transport Property Database for Common Building and Insulating
Materials, Final Report from ASHRAE Research Project 1018-RP, pp. 1-229, 2004.
8/12/2019 3d Model of Insulated Wall
http://slidepdf.com/reader/full/3d-model-of-insulated-wall 19/32
16
Table 1. Comparison of the calculated heat fluxes and R-value using hygIRC-2D andpresent 2D model for the test case shown in Figure 3
Parameter hygIRC-2D Present 2D model
Average heat flux at Left side (W/m ) 20.08 20.09Average heat flux at right side (W/m ) 20.08 20.09
Average heat flux at top side (W/m ) 0.00 0.00
Average heat flux at bottom side (W/m ) 0.00 0.00
R-value (m K/W) 2.49 2.49
Table 2. A brief summary of wall description
Wall Wall Description Comments
WER-1Poly-wrapped glass fibre (without
penetration)Poly sheets are over-lapped and
sealed
WER-5 Poly-wrapped glass fibre (with penetration) Same as aboveWER-AA Open cell foam (without penetration) Foam is applied in the full cavity
WER-BB Open cell foam (with penetration) Same as above
WER-CC Open cell foam (without penetration) Same as above
WER-DD Open cell foam (with penetration) Same as above
Table 3. Effective Thermal conductivity and air permeability of the different layer of the
six wall specimens [29]
Wall Layer
Effective Thermal
conductivity,sf eff )1(
W/(m.K)
Air permeability,f k (m
2)
Spruce (wood frame) 0.09 7.08E-16
OSB (sheathing board) 0.09 3.12E-14
Gypsum board 0.159 5.66E-14
Glass Fibre Batts (WER-1, WER-5) 0.039 3.54E-09
OCF (WER-AA, WER-BB) 0.0352* 5.95E-14
OCF (WER-CC, WER-DD) 0.0388* 5.95E-14
XPS (penetration ) 0.0289 1.42E-25
* Measured in this project according to ASTM C 518 [3].
8/12/2019 3d Model of Insulated Wall
http://slidepdf.com/reader/full/3d-model-of-insulated-wall 20/32
17
3 mm air gap
(air inlet)
Double top plates
Single bottom plate
OSB
Thermal insulation
Stud
Gypsum board
Sealed and adiabatic(no air and heat transport)
Sealed and adiabatic(no air and heat transport)
Air exits throughelectrical outlet boxlocated in the gypsumboard (50 mm x 76 mm,not shown in the figure)
Figure 1. A schematic showing the air leakage paths through a wall system
Solid
Fluid
Figure 2. Schematic of Representative Elementary Volume (REV) in porous media
8/12/2019 3d Model of Insulated Wall
http://slidepdf.com/reader/full/3d-model-of-insulated-wall 21/32
18
S e c t i o
n B - B
COMSOL
O S B ( M - 1 0 )
G y p s u m B o a r d ( M - 1 3 )
Spray Polyurethane
Foam (M-24)
Spray Polyurethane
Foam (M-24) Air (M-42)
Spruce (M-14)
Air (M-42)
Left
T = -35oC
h = 8 W/(m2K)
P = Patm
Right
T = 20oC
h = 8 W/(m2K)
P = Patm
Symmetry conditions
Bottom
Top
Symmetry conditions
Figure 3. A horizontal cut through a wall showing different materials and boundary
conditions
(b) Present 2D Model(a) hygIRC-2D model
Figure 4. Comparison of the temperature contours using hygIRC-2D and present 2Dmodel for the test case shown in Figure 3
8/12/2019 3d Model of Insulated Wall
http://slidepdf.com/reader/full/3d-model-of-insulated-wall 22/32
19
OSB(11 mm)
3 mm Air Gap(air inlet)
Gypsum Board(12.7 mm)
Electric Box(50 mm x 76 mm)
(air exit)
(a) (b)
6 3 5 m m
2 4 3 8 m m Stud
(38 mm)
Stud(19 mm)
Figure 5. 3D presentation of wall specimen without penetration
OSB(11 mm)
3 mm Air Gap(air inlet)
Gypsum Board(12.7 mm)
Electric Box(50 mm x 76 mm)
(air exit)
Stud(38 mm)
Stud(19 mm)
(a) (b)
2 4 3 8 m m
Figure 6. 3D presentation of wall specimen with penetration
8/12/2019 3d Model of Insulated Wall
http://slidepdf.com/reader/full/3d-model-of-insulated-wall 23/32
20
Section A-A
12.7
11
102
938
AA
9Dimensions in mm
32
GYB
OSB
ThermalInsulation S
t u d
XPS
W i n d o w F r a m e
12.5 mmgap filledwith SPF
Schematic drawing not to scale
ThermalInsulation
Figure 7. Window assembly for wall with penetrations
8/12/2019 3d Model of Insulated Wall
http://slidepdf.com/reader/full/3d-model-of-insulated-wall 24/32
21
Airflow
Construction
Tolerances
Figure 8. Isometric view of the air velocity arrows in WER-1 at 75 Pa
8/12/2019 3d Model of Insulated Wall
http://slidepdf.com/reader/full/3d-model-of-insulated-wall 25/32
22
Top View
Side ViewFront View (OSB side)
Airflow
Airflow
Airflow
ConstructionTolerances
Figure 9. Different views of the air velocity arrows in WER-1 at 75 Pa
8/12/2019 3d Model of Insulated Wall
http://slidepdf.com/reader/full/3d-model-of-insulated-wall 26/32
23
Airflow
Airflow
ConstructionTolerances
Figure 10. Isometric view of the air velocity arrows in WER-5 at 75 Pa
8/12/2019 3d Model of Insulated Wall
http://slidepdf.com/reader/full/3d-model-of-insulated-wall 27/32
24
Top View
Side View
Front View (OSB side)
Airflow
Airflow
ConstructionTolerances
Figure 11. Different views of the air velocity arrows in WER-5 at 75 Pa
8/12/2019 3d Model of Insulated Wall
http://slidepdf.com/reader/full/3d-model-of-insulated-wall 28/32
25
Figure 12. Temperature contours in a lateral slice passing through the middle of the wallWER-1 at a leakage rate corresponding to 75 Pa
8/12/2019 3d Model of Insulated Wall
http://slidepdf.com/reader/full/3d-model-of-insulated-wall 29/32
26
Figure 13. Temperature contours in a lateral slice passing through the middle of the wallWER-5 at a leakage rate corresponding to 75 Pa
8/12/2019 3d Model of Insulated Wall
http://slidepdf.com/reader/full/3d-model-of-insulated-wall 30/32
8/12/2019 3d Model of Insulated Wall
http://slidepdf.com/reader/full/3d-model-of-insulated-wall 31/32
28
2.0
2.5
3.0
3.5
4.0
2.0 2.5 3.0 3.5 4.0
WER-1
WER-5WER-AA
WER-BBWER-CCWER-DD
Uncertainties in themeasured R-value 6%
+5%
-5%
Measured R-Value (m2K/W)
P
r e d i c t e d R - V a l u e ( m 2 K / W )
Figure 16. Comparison of the predicted R-values with measured ones for the six walls
1.9
2.1
2.3
2.5
2.7
2.9
3.1
3.3
3.5
0 0.05 0.10 0.15 0.20 0.25
WER-DDWER-CCWER-BB
WER-AA150 Pa
150 Pa
150 Pa
150 Pa
75 Pa
75 Pa
75 Pa
P = 75 Pa
R
R
R = Reduction in RSI0 due to penetration
Air Leakage Rate, (L/(m2.s))
A p p a r e n t R - V a l u e ( m 2 K / W )
Figure 17. Effect of the air leakage on the apparent R-value of open cell SPFs wallassemblies
8/12/2019 3d Model of Insulated Wall
http://slidepdf.com/reader/full/3d-model-of-insulated-wall 32/32
0.5
1.0
1.5
2.0
2.5
3.0
3.5
0 0.10 0.20 0.30 0.40 0.50 0.60 0.70 0.80 0.90 1.00 1.10 1.20
WER-5WER-1
150 Pa
150 Pa
75 Pa
P = 75 Pa
R = Reduction in RSI0 due to penetrationR
Air Leakage Rate, (L/(m2.s))
A p p a r e n t R - V a l u e ( m
2 K / W )
Figure 18. Effect of the air leakage on the apparent R-value glass fibre wall assemblies
0.2
0.4
0.6
0.8
1.0
0 0.10 0.20 0.30 0.40 0.50 0.60 0.70 0.80 0.90 1.00 1.10 1.20
WER-DDWER-CCWER-BBWER-AAWER-5WER-1
CCMC criterion
= 0.05 L/(m2.s)
-3%
+3% y=exp(a*b+c*d)a = -1.85, b = 0.95,c = 0.36, d = 2.79
Air Leakage Rate, (L/(m2.s))
- V a l u e
Figure 19. Dependence of the dimensionless R-value ( ) on the air leakage rate for
different wall assemblies.