Embed Size (px)
Citation preview
3D Geomechanical Analysis of Multiple Caverns
in Bedded Salt
by
Michael Bruno, Luis Dorfmann, Gang Han, Khang Lao, and Jean Young
Terralog Technologies USA, Inc. Arcadia, California 91006 USA
(626) 305-8460; www.terralog.com
SMRI Fall 2005 Meeting October 1-5, 2005
Nancy, France
1
Solution Mining Research Institute, Fall 2005 Technical Meeting Nancy, France, October 1-5, 2005
3D Geomechanical Analysis of Multiple Caverns
in Bedded Salt
Michael Bruno, Luis Dorfmann, Gang Han, Khang Lao, and Jean Young Terralog Technologies USA, Inc.
332 E. Foothill Blvd, Arcadia CA, 91006 USA
ABSTRACT
This paper summarizes results from a recently concluded research project sponsored by the Gas Research Institute, the Petroleum Research Technology Council, and the US Department of Energy. The primary objective of this work has been to improve the state-of-the-art for designing and operating single and multiple caverns in thin bedded salt formations. The effort has included a geologic and geomechanical review of the Permian, Michigan, and Appalachian basins, followed by geomechanical modeling for single and multiple caverns in layered media.
A modified creep viscoplastic model has been developed and implemented in Flac3D to
simulate bedded salt material behavior. Both cyclic pressure operations and direct pressure drawdown are simulated. Cavern design parameters are varied to evaluate how they influence propagation of damage and the deformation of cavern. These are the cavern pressure, operating conditions, cavern size expressed in terms of height/diameter (H/D) ratio, overburden stiffness and roof thickness. The baseline results for single cavern simulations illustrate a shear stress distribution primarily around the cavern top and bottom corners, salt damage mainly around the cavern sidewall and slippage in the top interface between the salt formation and the anhydrite layer. During cyclic pressure operations, the shear-stress zones propagate into a wider region, which is responsible for an increase in the amount of slippage in the interface. During cyclic pressure loading, the magnitude of the maximum shear stress does not increase, resulting in no additional damage (micro-cracks) in the surrounding salt.
The influence of the overburden stiffness is shown to be a critical parameter on the overall
cavern response. A substantial part of the weight of the overburden material is carried by the anhydrite layer and by the cavern roof itself. For this particular case, the anhydrite reaches it tensile limit and fails. This failure implies that the cavern roof is subjected to a much higher load and therefore the amount and extension of damage increases substantially.
We further evaluate minimum safe center to center distance of multiple horizontal caverns.
We find that a center to center distance of two cavern diameters is not sufficient to eliminate the mutual interaction. Increasing the center to center distance to three cavern diameters, however, generally eliminates most interaction.
2
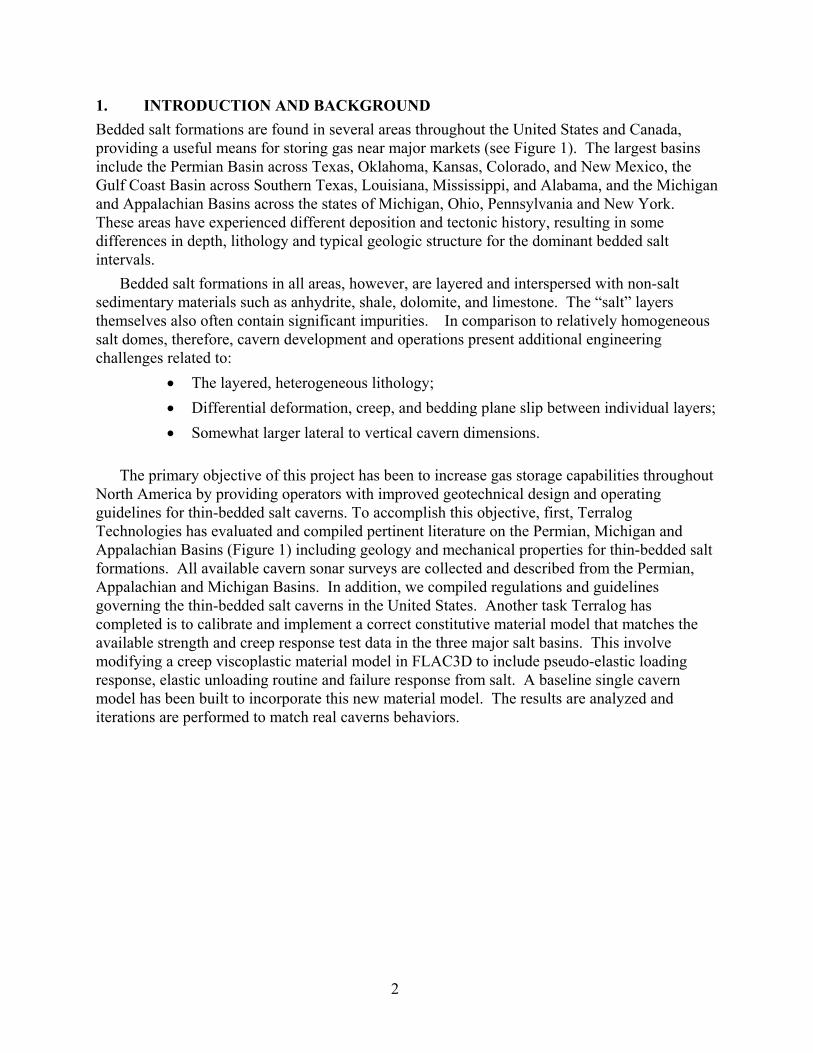
1. INTRODUCTION AND BACKGROUND Bedded salt formations are found in several areas throughout the United States and Canada, providing a useful means for storing gas near major markets (see Figure 1). The largest basins include the Permian Basin across Texas, Oklahoma, Kansas, Colorado, and New Mexico, the Gulf Coast Basin across Southern Texas, Louisiana, Mississippi, and Alabama, and the Michigan and Appalachian Basins across the states of Michigan, Ohio, Pennsylvania and New York. These areas have experienced different deposition and tectonic history, resulting in some differences in depth, lithology and typical geologic structure for the dominant bedded salt intervals.
Bedded salt formations in all areas, however, are layered and interspersed with non-salt sedimentary materials such as anhydrite, shale, dolomite, and limestone. The “salt” layers themselves also often contain significant impurities. In comparison to relatively homogeneous salt domes, therefore, cavern development and operations present additional engineering challenges related to:
• The layered, heterogeneous lithology; • Differential deformation, creep, and bedding plane slip between individual layers; • Somewhat larger lateral to vertical cavern dimensions.
The primary objective of this project has been to increase gas storage capabilities throughout
North America by providing operators with improved geotechnical design and operating guidelines for thin-bedded salt caverns. To accomplish this objective, first, Terralog Technologies has evaluated and compiled pertinent literature on the Permian, Michigan and Appalachian Basins (Figure 1) including geology and mechanical properties for thin-bedded salt formations. All available cavern sonar surveys are collected and described from the Permian, Appalachian and Michigan Basins. In addition, we compiled regulations and guidelines governing the thin-bedded salt caverns in the United States. Another task Terralog has completed is to calibrate and implement a correct constitutive material model that matches the available strength and creep response test data in the three major salt basins. This involve modifying a creep viscoplastic material model in FLAC3D to include pseudo-elastic loading response, elastic unloading routine and failure response from salt. A baseline single cavern model has been built to incorporate this new material model. The results are analyzed and iterations are performed to match real caverns behaviors.
3
Figure 1. Bedded Salt Deposits in US
2. GEOLOGIC OVERVIEW
Detailed geologic characterization is an important and necessary pre-requisite for any analytical or numerical investigations on the geomechanical processes in bedded salt formation. This process allows us to establish a realistic range of scenarios for parametric model investigations within the Permian, Michigan and Appalachian Basins:
2.1 Permian Basin Complex
Complex faulting in the mid Permian Period created platforms and arches that subdivided the Permian Basin Complex into the five separate basins: Anadarko, Palo Duro, Dalhart, Midland and Delaware Basins. At times, these basins were interconnected by shallow seaways. Marine water entered the basins from open ocean to the southwest (Johnson and Gonzales, 1978). The oldest salt, the Early Permian age Hutchison Salt Member was found in the northern Anadarko Basin, Kansas and Oklahoma border. Evaporites accumulation moved southward. By Late
Williston Basin Michigan Basin
Appalachian Basin
Permian Basin
Gulf Coast
Source: National Petroleum Technology Office
4
Permian time, evaporite deposits had reached the Delaware and Midland Basins (Johnson and Gonzales, 1978). Basin evolution after evaporite deposition is important for salt cavern siting because the salt geometry was modified by burial dissolution (Hovorka and Nava, 2000). The Permian Basin Complex region was tectonically stable after the deposition of salts. Salt dissolution and subsequent collapse of overlying strata is common in the Permian Basin Complex. Most of the dissolution occurs within 400 m (1,300 ft) of the surface (McGookey, Gustavson and Hoadley, 1988). All the salt bearing formations within the Permian Basin Complex have been affected locally by salt dissolution.
The Midland Basin has the most salt cavern operations. Thirteen operators are actively
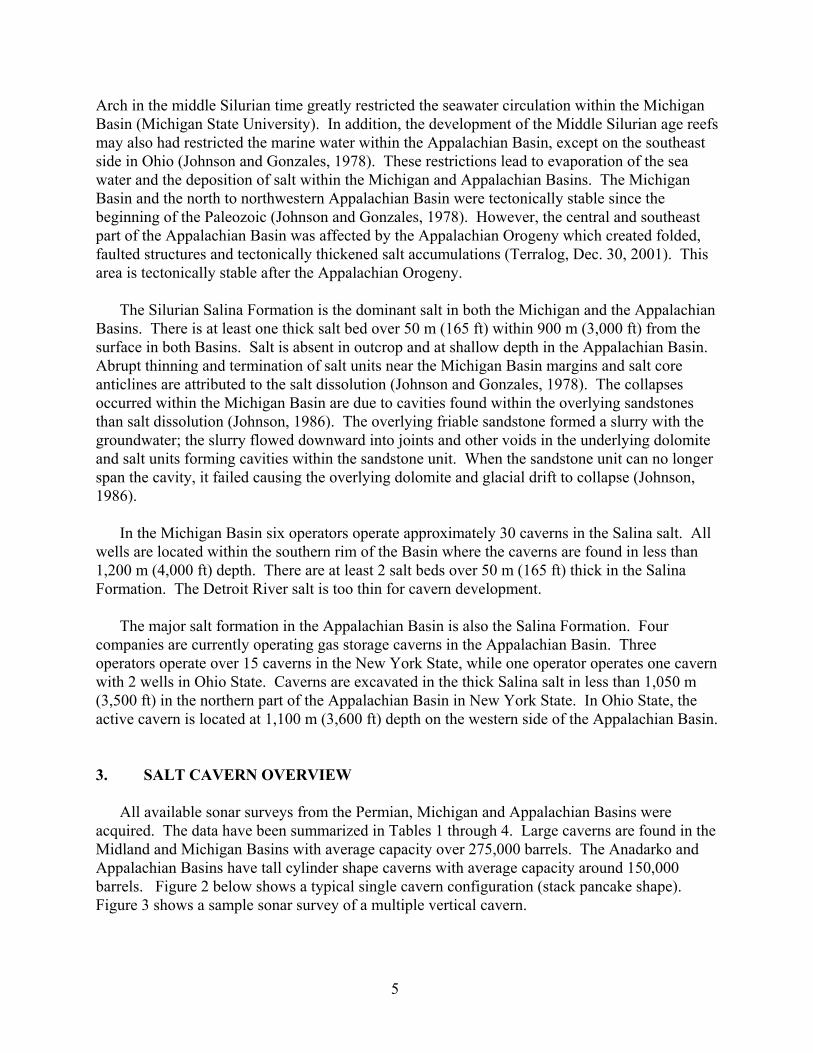
operating approximately 100 wells within the Midland Basin. Salado is the dominant salt bearing unit where all the active caverns are found. Figure 3 is the sonar survey of a multiple caverns within the Midland Basin. The thickest Salado salt can be found in the southwestern part of the Basin in less than 600 m (2,000 ft) depth. The Queen Formation offers another potential salt unit for cavern siting where locally over 50 m (165 ft) thick salt can be found in the north. However, it is below the Salado Formation. The cost for developing the lower salt layer has to be considered when the shallow Salado salts are available.
The Salado salt is also the dominant halite unit within the Delaware Basin, however the salt is found in less than 300 m (1,000 ft) depth, too shallow for salt cavern siting. Thick salt unit may be found locally within the Castile Formation especially in the northern part of the Basin which can be used for cavern development.
The San Andres Formation is the dominant salt within the Palo Duro Basin, where over 50 m
(165 ft) thick is found on the southwest side of the Basin. The top of the salt can be reached between 600-900 m (2,000-3,000 ft) from the surface. The Upper Clear Fork salt can reach 120 m (400 ft) thick locally which may offers another possible cavern siting on the eastern part of the Basin. This Basin offers potential for salt cavern development.
Within the Dalhart Basin, Blaine Formation is the dominant salt unit, found in less than 300
m (1,000 ft) depth (Johnson and Gonzales, 1987), and too shallow for cavern development. The Upper Clear Fork salt unit is not thick enough for cavern siting.
Salt caverns operations are also found in the Anadarko Basin. Two operators are actively
operating over 25 wells between 425-550 m (1,400 ft to 1,800 ft) depth. The caverns are found in the main salt unit, the Lower Cimarron Salt Formation. Thirty to ninety meters (100-300 ft) thick halite can be found in the southern and eastern portion of the Basin. Other potential salt unit for cavern siting is the Hutchison Member which is found only in the northeast, where locally thick salt may be found in less than 900 m (3,000 ft) depth.
2.2 Appalachian and Michigan Basins Throughout the Paleozoic, the Michigan Basin continued to subside faster than the
Appalachian Basin and the surrounding regions (Johnson and Gonzales, 1978). A shallow sea spread over the Great Lakes region as Paleozoic Era began. The emergence of the Kankakee
5
Arch in the middle Silurian time greatly restricted the seawater circulation within the Michigan Basin (Michigan State University). In addition, the development of the Middle Silurian age reefs may also had restricted the marine water within the Appalachian Basin, except on the southeast side in Ohio (Johnson and Gonzales, 1978). These restrictions lead to evaporation of the sea water and the deposition of salt within the Michigan and Appalachian Basins. The Michigan Basin and the north to northwestern Appalachian Basin were tectonically stable since the beginning of the Paleozoic (Johnson and Gonzales, 1978). However, the central and southeast part of the Appalachian Basin was affected by the Appalachian Orogeny which created folded, faulted structures and tectonically thickened salt accumulations (Terralog, Dec. 30, 2001). This area is tectonically stable after the Appalachian Orogeny.
The Silurian Salina Formation is the dominant salt in both the Michigan and the Appalachian
Basins. There is at least one thick salt bed over 50 m (165 ft) within 900 m (3,000 ft) from the surface in both Basins. Salt is absent in outcrop and at shallow depth in the Appalachian Basin. Abrupt thinning and termination of salt units near the Michigan Basin margins and salt core anticlines are attributed to the salt dissolution (Johnson and Gonzales, 1978). The collapses occurred within the Michigan Basin are due to cavities found within the overlying sandstones than salt dissolution (Johnson, 1986). The overlying friable sandstone formed a slurry with the groundwater; the slurry flowed downward into joints and other voids in the underlying dolomite and salt units forming cavities within the sandstone unit. When the sandstone unit can no longer span the cavity, it failed causing the overlying dolomite and glacial drift to collapse (Johnson, 1986).
In the Michigan Basin six operators operate approximately 30 caverns in the Salina salt. All
wells are located within the southern rim of the Basin where the caverns are found in less than 1,200 m (4,000 ft) depth. There are at least 2 salt beds over 50 m (165 ft) thick in the Salina Formation. The Detroit River salt is too thin for cavern development.
The major salt formation in the Appalachian Basin is also the Salina Formation. Four companies are currently operating gas storage caverns in the Appalachian Basin. Three operators operate over 15 caverns in the New York State, while one operator operates one cavern with 2 wells in Ohio State. Caverns are excavated in the thick Salina salt in less than 1,050 m (3,500 ft) in the northern part of the Appalachian Basin in New York State. In Ohio State, the active cavern is located at 1,100 m (3,600 ft) depth on the western side of the Appalachian Basin.
3. SALT CAVERN OVERVIEW
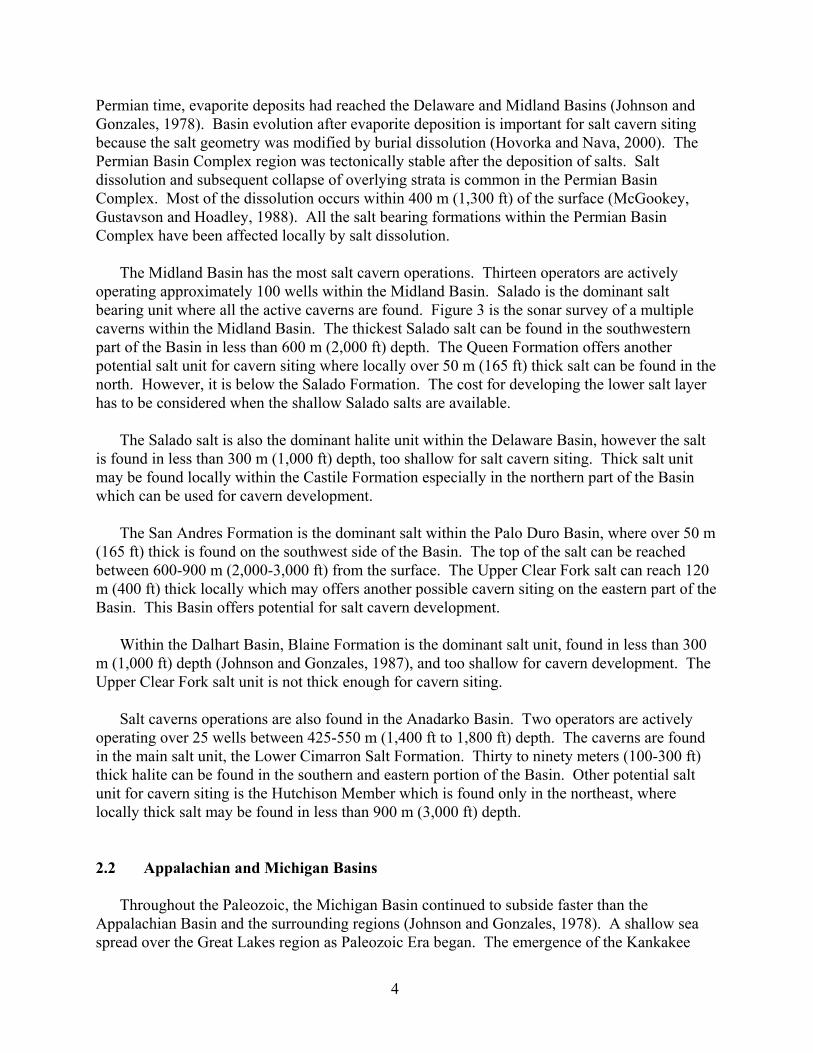
All available sonar surveys from the Permian, Michigan and Appalachian Basins were acquired. The data have been summarized in Tables 1 through 4. Large caverns are found in the Midland and Michigan Basins with average capacity over 275,000 barrels. The Anadarko and Appalachian Basins have tall cylinder shape caverns with average capacity around 150,000 barrels. Figure 2 below shows a typical single cavern configuration (stack pancake shape). Figure 3 shows a sample sonar survey of a multiple vertical cavern.
6
Figure 2: Typical single cavern configuration
Figure 3: Sample sonar survey of a multiple vertical cavern
7
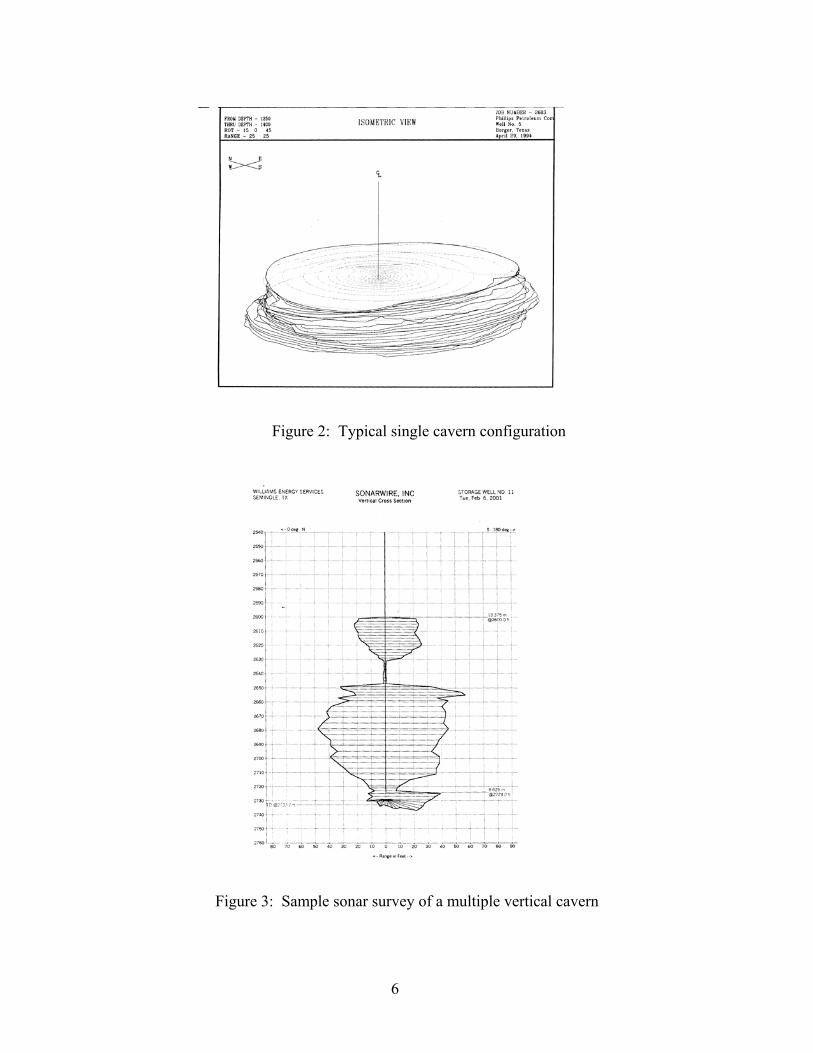
Table 1 Anardarko Basin Sonar Survey Summary
CompanyCavern
No.Main Roof
Bottom Depth (ft)
Ave. Height (ft)
Ave. Diameter
Cavern Volumn
Ht/W Ratio Shape
Phillips Petroleum Co. 3 1438 1482 44 230 209,056 0.1913 cylinderPhillips Petroleum Co. 4 1472 1528 56 266 455,591 0.2105 cylinderPhillips Petroleum Co. 5 1331 1376 45 209 266,973 0.2153 cylinderPhillips Petroleum Co. 6 1426 1446 20 295 243,337 0.0678 cylinderPhillips Petroleum Co. 7 1415 1483 68 225 436,130 0.3022 cylinderPhillips Petroleum Co. 8 1450 1474 24 270 244,609 0.0889 cylinderPhillips Petroleum Co. 9 1447 1467 20 241 167,785 0.0830 cylinderPhillips Petroleum Co. 10 1450 1500 50 259 457,566 0.1931 cylinderPhillips Petroleum Co. 11 1472 1500 28 320 400,859 0.0875 upside down cone
12a 1456 1501 45 72 32,615 0.6250 cylinder12b 1501 1536 35 205 205,641 0.1707 cylinder
Phillips Petroleum Co. 12 238,255 Phillips Petroleum Co. 13 1490 1540 50 200 279,617 0.2500Phillips Petroleum Co. 14 1475 1525 50 180 226,490 0.2778 cylinderPhillips Petroleum Co. 21 1426 1536 110 94 135,888 1.1702 stack pancakesPhillips Petroleum Co. 22 1460 1510 50 130 118,138 0.3846 upside down conePhillips Petroleum Co. 23 1457 1520 63 115 116,485 0.5478 cylinderPhillips Petroleum Co. 24 1431 1461 30 200 167,770 0.1500 cylinder
1a 1737 1752 15 130 35,441 0.1154 cylinder1b 1755 1775 20 29 2,352 0.6897 upside down cone
Diamond Koch 1 37,793 2a 1690 1745 55 81 50,451 0.6790 stack pancakes2b 1776 1785 9 15 283 0.6000 upside down cone
Diamond Koch 2 50,734 Diamond Koch 3 1723 1754 31 119 61,375 0.2605 stack pancakesDiamond Koch 4 1700 1768 68 63 37,733 1.0794 upside down coneDiamond Koch 5 1709 1734 25 82 23,502 0.3049 cylinder
6a 1704 1737 33 82 31,022 0.4024 cylinder6b 1752 1768 16 36 2,899 0.4444 upside down cone
Diamond Koch 6 33,921 Diamond Koch 7 1739 1774 35 101 49,917 0.3465 upside down coneDiamond Koch 9 1756 1766 10 163 37,146 0.0613 cylinder
Average 39 158 151793
The average cavern in the Anadarko Basin has a height of 39ft and diameter of 158ft. The cavern is primarily cylindrical in shape with an average capacity of 151,793 barrels.
8
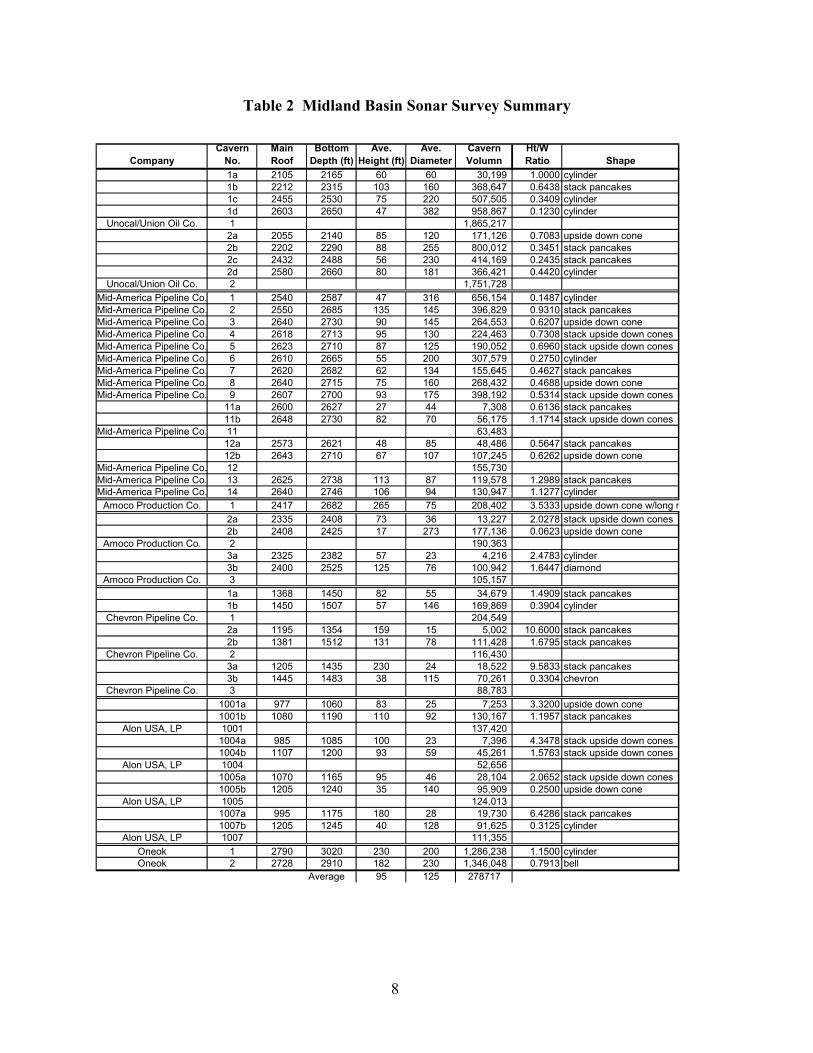
Table 2 Midland Basin Sonar Survey Summary
CompanyCavern
No.Main Roof
Bottom Depth (ft)
Ave. Height (ft)
Ave. Diameter
Cavern Volumn
Ht/W Ratio Shape
1a 2105 2165 60 60 30,199 1.0000 cylinder1b 2212 2315 103 160 368,647 0.6438 stack pancakes1c 2455 2530 75 220 507,505 0.3409 cylinder1d 2603 2650 47 382 958,867 0.1230 cylinder
Unocal/Union Oil Co. 1 1,865,217 2a 2055 2140 85 120 171,126 0.7083 upside down cone2b 2202 2290 88 255 800,012 0.3451 stack pancakes2c 2432 2488 56 230 414,169 0.2435 stack pancakes2d 2580 2660 80 181 366,421 0.4420 cylinder
Unocal/Union Oil Co. 2 1,751,728Mid-America Pipeline Co. 1 2540 2587 47 316 656,154 0.1487 cylinderMid-America Pipeline Co. 2 2550 2685 135 145 396,829 0.9310 stack pancakesMid-America Pipeline Co. 3 2640 2730 90 145 264,553 0.6207 upside down coneMid-America Pipeline Co. 4 2618 2713 95 130 224,463 0.7308 stack upside down conesMid-America Pipeline Co. 5 2623 2710 87 125 190,052 0.6960 stack upside down conesMid-America Pipeline Co. 6 2610 2665 55 200 307,579 0.2750 cylinderMid-America Pipeline Co. 7 2620 2682 62 134 155,645 0.4627 stack pancakesMid-America Pipeline Co. 8 2640 2715 75 160 268,432 0.4688 upside down coneMid-America Pipeline Co. 9 2607 2700 93 175 398,192 0.5314 stack upside down cones
11a 2600 2627 27 44 7,308 0.6136 stack pancakes11b 2648 2730 82 70 56,175 1.1714 stack upside down cones
Mid-America Pipeline Co. 11 63,483 12a 2573 2621 48 85 48,486 0.5647 stack pancakes12b 2643 2710 67 107 107,245 0.6262 upside down cone
Mid-America Pipeline Co. 12 155,730 Mid-America Pipeline Co. 13 2625 2738 113 87 119,578 1.2989 stack pancakesMid-America Pipeline Co. 14 2640 2746 106 94 130,947 1.1277 cylinder
Amoco Production Co. 1 2417 2682 265 75 208,402 3.5333 upside down cone w/long n2a 2335 2408 73 36 13,227 2.0278 stack upside down cones2b 2408 2425 17 273 177,136 0.0623 upside down cone
Amoco Production Co. 2 190,363 3a 2325 2382 57 23 4,216 2.4783 cylinder3b 2400 2525 125 76 100,942 1.6447 diamond
Amoco Production Co. 3 105,157 1a 1368 1450 82 55 34,679 1.4909 stack pancakes1b 1450 1507 57 146 169,869 0.3904 cylinder
Chevron Pipeline Co. 1 204,549 2a 1195 1354 159 15 5,002 10.6000 stack pancakes2b 1381 1512 131 78 111,428 1.6795 stack pancakes
Chevron Pipeline Co. 2 116,430 3a 1205 1435 230 24 18,522 9.5833 stack pancakes3b 1445 1483 38 115 70,261 0.3304 chevron
Chevron Pipeline Co. 3 88,783 1001a 977 1060 83 25 7,253 3.3200 upside down cone1001b 1080 1190 110 92 130,167 1.1957 stack pancakes
Alon USA, LP 1001 137,420 1004a 985 1085 100 23 7,396 4.3478 stack upside down cones1004b 1107 1200 93 59 45,261 1.5763 stack upside down cones
Alon USA, LP 1004 52,656 1005a 1070 1165 95 46 28,104 2.0652 stack upside down cones1005b 1205 1240 35 140 95,909 0.2500 upside down cone
Alon USA, LP 1005 124,013 1007a 995 1175 180 28 19,730 6.4286 stack pancakes1007b 1205 1245 40 128 91,625 0.3125 cylinder
Alon USA, LP 1007 111,355 Oneok 1 2790 3020 230 200 1,286,238 1.1500 cylinderOneok 2 2728 2910 182 230 1,346,048 0.7913 bell
Average 95 125 278717
9
The average cavern in the Midland Basin has a height of 95ft and diameter of 125ft. The cavern shape varies from narrow cylindrical to stack pancakes to upside down cone shapes. The average capacity of the cavern is 278, 717 barrels.
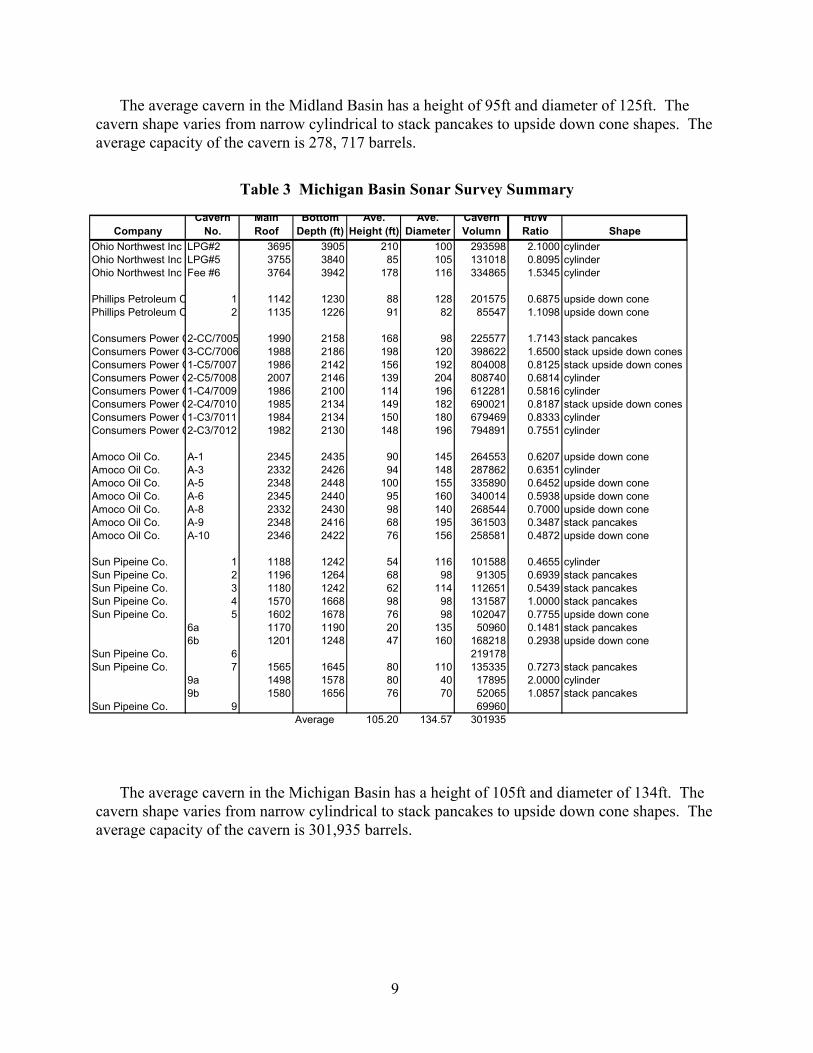
Table 3 Michigan Basin Sonar Survey Summary
The average cavern in the Michigan Basin has a height of 105ft and diameter of 134ft. The cavern shape varies from narrow cylindrical to stack pancakes to upside down cone shapes. The average capacity of the cavern is 301,935 barrels.
CompanyCavern
No.Main Roof
Bottom Depth (ft)
Ave. Height (ft)
Ave. Diameter
Cavern Volumn
Ht/W Ratio Shape
Ohio Northwest Inc LPG#2 3695 3905 210 100 293598 2.1000 cylinderOhio Northwest Inc LPG#5 3755 3840 85 105 131018 0.8095 cylinderOhio Northwest Inc Fee #6 3764 3942 178 116 334865 1.5345 cylinder
Phillips Petroleum C 1 1142 1230 88 128 201575 0.6875 upside down conePhillips Petroleum C 2 1135 1226 91 82 85547 1.1098 upside down cone
Consumers Power C2-CC/7005 1990 2158 168 98 225577 1.7143 stack pancakesConsumers Power C3-CC/7006 1988 2186 198 120 398622 1.6500 stack upside down conesConsumers Power C1-C5/7007 1986 2142 156 192 804008 0.8125 stack upside down conesConsumers Power C2-C5/7008 2007 2146 139 204 808740 0.6814 cylinderConsumers Power C1-C4/7009 1986 2100 114 196 612281 0.5816 cylinderConsumers Power C2-C4/7010 1985 2134 149 182 690021 0.8187 stack upside down conesConsumers Power C1-C3/7011 1984 2134 150 180 679469 0.8333 cylinderConsumers Power C2-C3/7012 1982 2130 148 196 794891 0.7551 cylinder
Amoco Oil Co. A-1 2345 2435 90 145 264553 0.6207 upside down coneAmoco Oil Co. A-3 2332 2426 94 148 287862 0.6351 cylinderAmoco Oil Co. A-5 2348 2448 100 155 335890 0.6452 upside down coneAmoco Oil Co. A-6 2345 2440 95 160 340014 0.5938 upside down coneAmoco Oil Co. A-8 2332 2430 98 140 268544 0.7000 upside down coneAmoco Oil Co. A-9 2348 2416 68 195 361503 0.3487 stack pancakesAmoco Oil Co. A-10 2346 2422 76 156 258581 0.4872 upside down cone
Sun Pipeine Co. 1 1188 1242 54 116 101588 0.4655 cylinderSun Pipeine Co. 2 1196 1264 68 98 91305 0.6939 stack pancakesSun Pipeine Co. 3 1180 1242 62 114 112651 0.5439 stack pancakesSun Pipeine Co. 4 1570 1668 98 98 131587 1.0000 stack pancakesSun Pipeine Co. 5 1602 1678 76 98 102047 0.7755 upside down cone
6a 1170 1190 20 135 50960 0.1481 stack pancakes6b 1201 1248 47 160 168218 0.2938 upside down cone
Sun Pipeine Co. 6 219178Sun Pipeine Co. 7 1565 1645 80 110 135335 0.7273 stack pancakes
9a 1498 1578 80 40 17895 2.0000 cylinder9b 1580 1656 76 70 52065 1.0857 stack pancakes
Sun Pipeine Co. 9 69960Average 105.20 134.57 301935
10
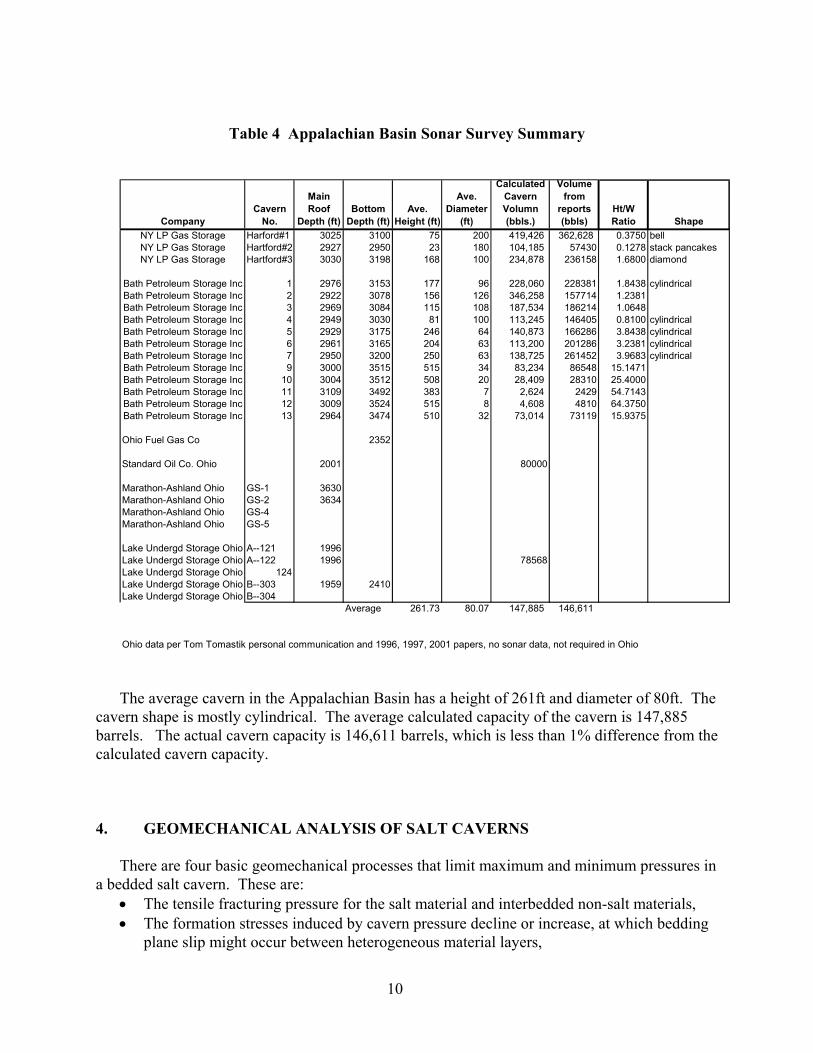
Table 4 Appalachian Basin Sonar Survey Summary
CompanyCavern
No.
Main Roof
Depth (ft)Bottom
Depth (ft)Ave.
Height (ft)
Ave. Diameter
(ft)
Calculated Cavern Volumn (bbls.)
Volume from
reports (bbls)
Ht/W Ratio Shape
NY LP Gas Storage Harford#1 3025 3100 75 200 419,426 362,628 0.3750 bellNY LP Gas Storage Hartford#2 2927 2950 23 180 104,185 57430 0.1278 stack pancakesNY LP Gas Storage Hartford#3 3030 3198 168 100 234,878 236158 1.6800 diamond
Bath Petroleum Storage Inc 1 2976 3153 177 96 228,060 228381 1.8438 cylindricalBath Petroleum Storage Inc 2 2922 3078 156 126 346,258 157714 1.2381Bath Petroleum Storage Inc 3 2969 3084 115 108 187,534 186214 1.0648Bath Petroleum Storage Inc 4 2949 3030 81 100 113,245 146405 0.8100 cylindricalBath Petroleum Storage Inc 5 2929 3175 246 64 140,873 166286 3.8438 cylindricalBath Petroleum Storage Inc 6 2961 3165 204 63 113,200 201286 3.2381 cylindricalBath Petroleum Storage Inc 7 2950 3200 250 63 138,725 261452 3.9683 cylindricalBath Petroleum Storage Inc 9 3000 3515 515 34 83,234 86548 15.1471Bath Petroleum Storage Inc 10 3004 3512 508 20 28,409 28310 25.4000Bath Petroleum Storage Inc 11 3109 3492 383 7 2,624 2429 54.7143Bath Petroleum Storage Inc 12 3009 3524 515 8 4,608 4810 64.3750Bath Petroleum Storage Inc 13 2964 3474 510 32 73,014 73119 15.9375
Ohio Fuel Gas Co 2352
Standard Oil Co. Ohio 2001 80000
Marathon-Ashland Ohio GS-1 3630Marathon-Ashland Ohio GS-2 3634Marathon-Ashland Ohio GS-4Marathon-Ashland Ohio GS-5
Lake Undergd Storage Ohio A--121 1996Lake Undergd Storage Ohio A--122 1996 78568Lake Undergd Storage Ohio 124Lake Undergd Storage Ohio B--303 1959 2410Lake Undergd Storage Ohio B--304
Average 261.73 80.07 147,885 146,611
Ohio data per Tom Tomastik personal communication and 1996, 1997, 2001 papers, no sonar data, not required in Ohio
The average cavern in the Appalachian Basin has a height of 261ft and diameter of 80ft. The cavern shape is mostly cylindrical. The average calculated capacity of the cavern is 147,885 barrels. The actual cavern capacity is 146,611 barrels, which is less than 1% difference from the calculated cavern capacity. 4. GEOMECHANICAL ANALYSIS OF SALT CAVERNS
There are four basic geomechanical processes that limit maximum and minimum pressures in
a bedded salt cavern. These are: • The tensile fracturing pressure for the salt material and interbedded non-salt materials, • The formation stresses induced by cavern pressure decline or increase, at which bedding
plane slip might occur between heterogeneous material layers,
11
• The minimum cavern pressure that might induce roof instability or excessive closures. • The creep response of the material, which again is a function of the cavern pressure. Low
cavern pressures increase the creep response in the surrounding salt material thereby accelerating the closure process
Terralog is continuing our investigation and performing various simulations to determine the
minimum and maximum pressure limits for thin bedded salt caverns in a variety of typical settings occurring within the Permian Basin Complex and the Michigan and Appalachian Basins.
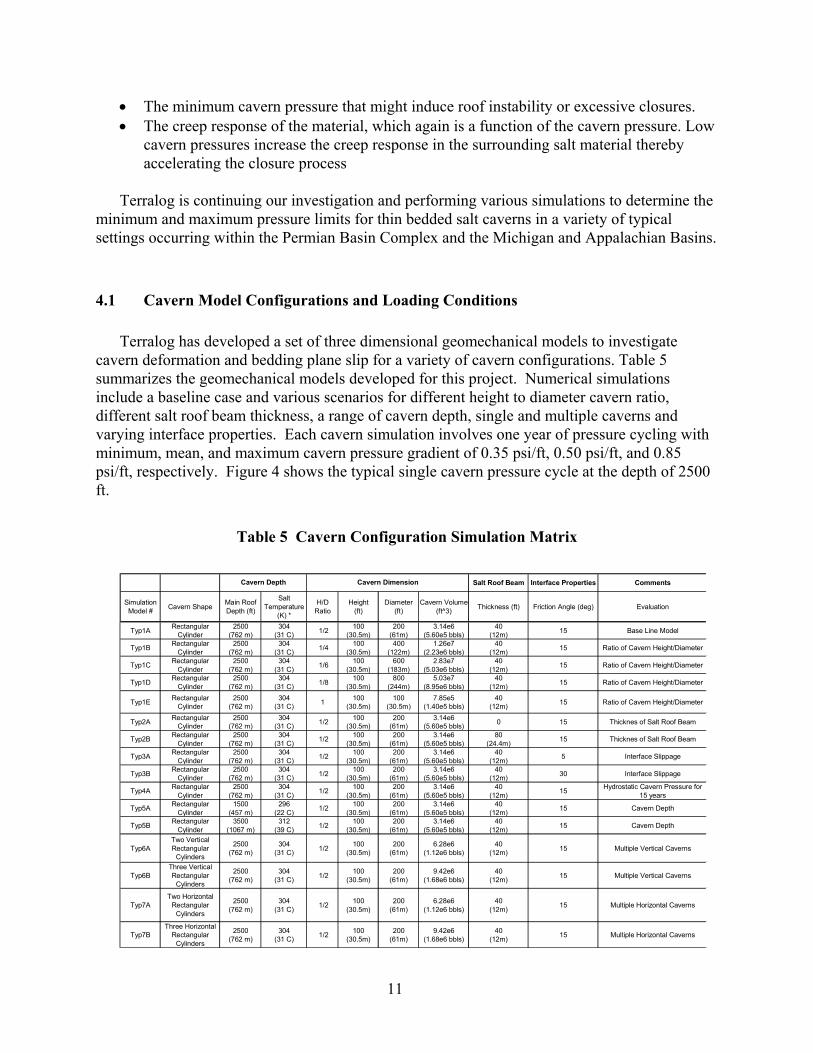
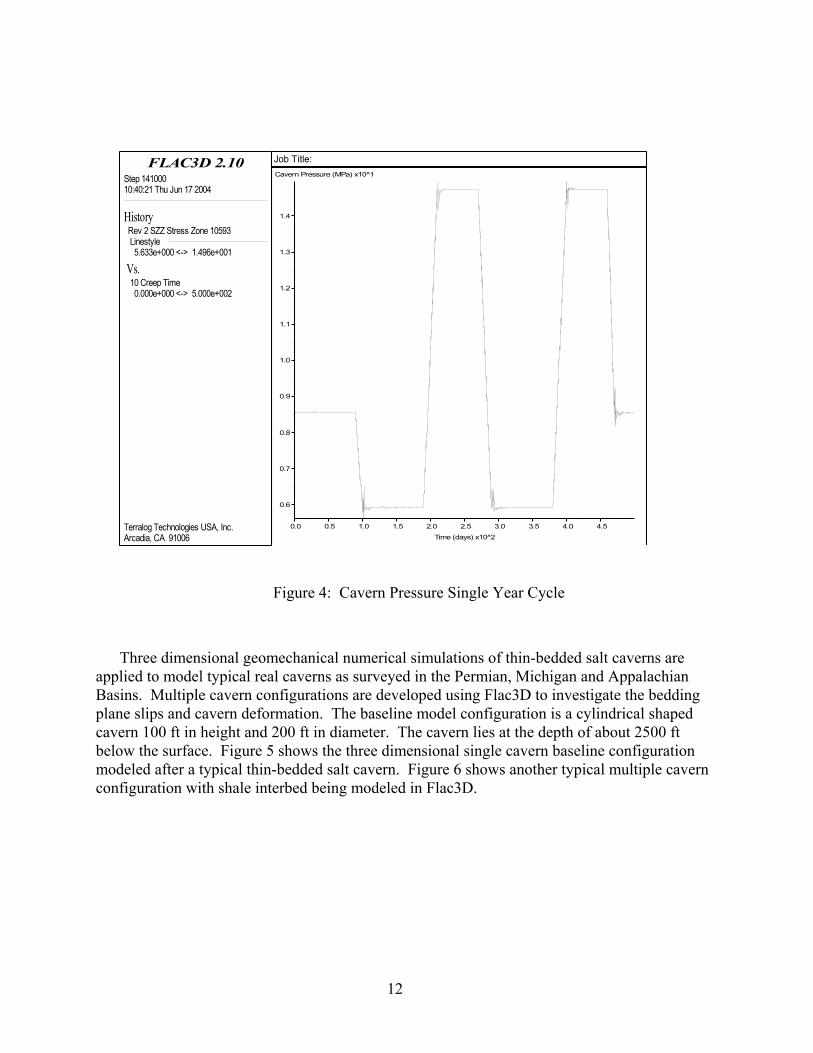
4.1 Cavern Model Configurations and Loading Conditions Terralog has developed a set of three dimensional geomechanical models to investigate
cavern deformation and bedding plane slip for a variety of cavern configurations. Table 5 summarizes the geomechanical models developed for this project. Numerical simulations include a baseline case and various scenarios for different height to diameter cavern ratio, different salt roof beam thickness, a range of cavern depth, single and multiple caverns and varying interface properties. Each cavern simulation involves one year of pressure cycling with minimum, mean, and maximum cavern pressure gradient of 0.35 psi/ft, 0.50 psi/ft, and 0.85 psi/ft, respectively. Figure 4 shows the typical single cavern pressure cycle at the depth of 2500 ft.
Table 5 Cavern Configuration Simulation Matrix
Salt Roof Beam Interface Properties Comments
Simulation Model # Cavern Shape Main Roof
Depth (ft)
Salt Temperature
(K) *
H/D Ratio
Height (ft)
Diameter (ft)
Cavern Volume (ft^3) Thickness (ft) Friction Angle (deg) Evaluation
Typ1A Rectangular Cylinder
2500 (762 m)
304 (31 C) 1/2 100
(30.5m)200
(61m)3.14e6
(5.60e5 bbls)40
(12m) 15 Base Line Model
Typ1B Rectangular Cylinder
2500 (762 m)
304 (31 C) 1/4 100
(30.5m)400
(122m)1.26e7
(2.23e6 bbls)40
(12m) 15 Ratio of Cavern Height/Diameter
Typ1C Rectangular Cylinder
2500 (762 m)
304 (31 C) 1/6 100
(30.5m)600
(183m)2.83e7
(5.03e6 bbls)40
(12m) 15 Ratio of Cavern Height/Diameter
Typ1D Rectangular Cylinder
2500 (762 m)
304 (31 C) 1/8 100
(30.5m)800
(244m)5.03e7
(8.95e6 bbls)40
(12m) 15 Ratio of Cavern Height/Diameter
Typ1E Rectangular Cylinder
2500 (762 m)
304 (31 C) 1 100
(30.5m)100
(30.5m)7.85e5
(1.40e5 bbls)40
(12m) 15 Ratio of Cavern Height/Diameter
Typ2A Rectangular Cylinder
2500 (762 m)
304 (31 C) 1/2 100
(30.5m)200
(61m)3.14e6
(5.60e5 bbls) 0 15 Thicknes of Salt Roof Beam
Typ2B Rectangular Cylinder
2500 (762 m)
304 (31 C) 1/2 100
(30.5m)200
(61m)3.14e6
(5.60e5 bbls)80
(24.4m) 15 Thicknes of Salt Roof Beam
Typ3A Rectangular Cylinder
2500 (762 m)
304 (31 C) 1/2 100
(30.5m)200
(61m)3.14e6
(5.60e5 bbls)40
(12m) 5 Interface Slippage
Typ3B Rectangular Cylinder
2500 (762 m)
304 (31 C) 1/2 100
(30.5m)200
(61m)3.14e6
(5.60e5 bbls)40
(12m) 30 Interface Slippage
Typ4A Rectangular Cylinder
2500 (762 m)
304 (31 C) 1/2 100
(30.5m)200
(61m)3.14e6
(5.60e5 bbls)40
(12m) 15 Hydrostatic Cavern Pressure for 15 years
Typ5A Rectangular Cylinder
1500 (457 m)
296 (22 C) 1/2 100
(30.5m)200
(61m)3.14e6
(5.60e5 bbls)40
(12m) 15 Cavern Depth
Typ5B Rectangular Cylinder
3500 (1067 m)
312 (39 C) 1/2 100
(30.5m)200
(61m)3.14e6
(5.60e5 bbls)40
(12m) 15 Cavern Depth
Typ6ATwo Vertical Rectangular
Cylinders
2500 (762 m)
304 (31 C) 1/2 100
(30.5m)200
(61m)6.28e6
(1.12e6 bbls)40
(12m) 15 Multiple Vertical Caverns
Typ6BThree Vertical Rectangular
Cylinders
2500 (762 m)
304 (31 C) 1/2 100
(30.5m)200
(61m)9.42e6
(1.68e6 bbls)40
(12m) 15 Multiple Vertical Caverns
Typ7ATwo Horizontal
Rectangular Cylinders
2500 (762 m)
304 (31 C) 1/2 100
(30.5m)200
(61m)6.28e6
(1.12e6 bbls)40
(12m) 15 Multiple Horizontal Caverns
Typ7BThree Horizontal
Rectangular Cylinders
2500 (762 m)
304 (31 C) 1/2 100
(30.5m)200
(61m)9.42e6
(1.68e6 bbls)40
(12m) 15 Multiple Horizontal Caverns
Cavern Depth Cavern Dimension
12
FLAC3D 2.10
Terralog Technologies USA, Inc.Arcadia, CA 91006
Step 14100010:40:21 Thu Jun 17 2004
Job Title:
History
0.0 0.5 1.0 1.5 2.0 2.5 3.0 3.5 4.0 4.5
Time (days) x10^2
0.6
0.7
0.8
0.9
1.0
1.1
1.2
1.3
1.4
Cavern Pressure (MPa) x10^1
Rev 2 SZZ Stress Zone 10593 Linestyle 5.633e+000 <-> 1.496e+001
Vs. 10 Creep Time 0.000e+000 <-> 5.000e+002
Figure 4: Cavern Pressure Single Year Cycle
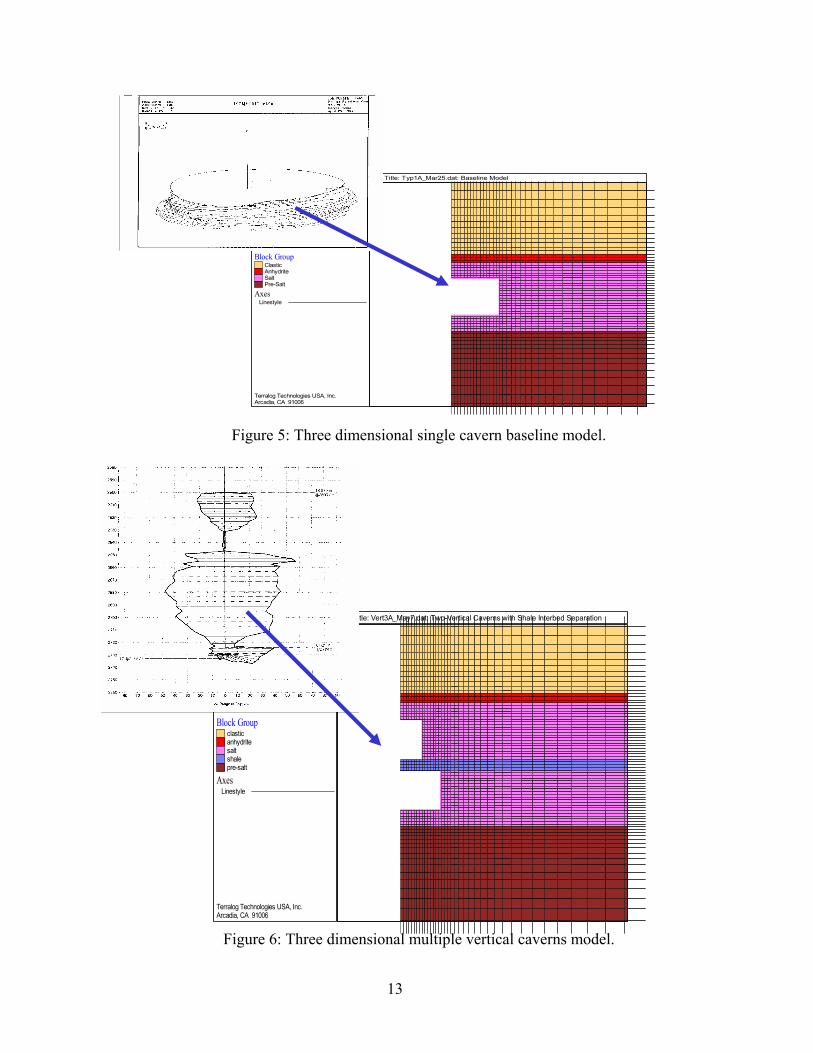
Three dimensional geomechanical numerical simulations of thin-bedded salt caverns are applied to model typical real caverns as surveyed in the Permian, Michigan and Appalachian Basins. Multiple cavern configurations are developed using Flac3D to investigate the bedding plane slips and cavern deformation. The baseline model configuration is a cylindrical shaped cavern 100 ft in height and 200 ft in diameter. The cavern lies at the depth of about 2500 ft below the surface. Figure 5 shows the three dimensional single cavern baseline configuration modeled after a typical thin-bedded salt cavern. Figure 6 shows another typical multiple cavern configuration with shale interbed being modeled in Flac3D.
13
Figure 5: Three dimensional single cavern baseline model.
Figure 6: Three dimensional multiple vertical caverns model.
FLAC3D 2.10
Terralog Technologies USA, Inc.Arcadia, CA 91006
Settings: Model Perspective11:52:43 Wed Jun 16 2004
Center: X: 3.476e+001 Y: 5.460e+000 Z: 7.750e+002
Rotation: X: 180.000 Y: 0.000 Z: 350.000
Dist: 3.223e+003 Mag.: 7.45Ang.: 22.500
Job Title: Typ1A_Mar25.dat: Baseline Model
Block GroupClasticAnhydriteSaltPre-Salt
Axes Linestyle
FLAC3D 2.10
Terralog Technologies USA, Inc.Arcadia, CA 91006
Settings: Model Perspective11:07:57 Wed Jun 16 2004
Center: X: 5.966e+001 Y: 9.849e+000 Z: 8.019e+002
Rotation: X: 180.000 Y: 0.000 Z: 350.000
Dist: 3.223e+003 Mag.: 5.96Ang.: 22.500
Job Title: Vert3A_May7.dat: Two-Vertical Caverns with Shale Interbed Separation
Block Groupclasticanhydritesaltshalepre-salt
Axes Linestyle
14
4.2 Salt Material Modeling An empirical creep law based on the Waste Isolation Pilot Plant (WIPP) Program has been
implemented by Itasca, Inc. for Flac3D creep material modeling. To account for the plastic and other failure mechanisms in standard bedded salt behaviors, the WIPP creep model are combined with the Drucker-Prager plasticity criterion, WIPP-Creep Viscoplastic Model in FLAC 3D. In order to simulate available material, the viscoplastic model in FLAC was modified by Terralog. The three principal modifications are:
1. Damage accumulation during primary loading; 2. Material failure and volumetric dilation after the Drucker-Prager failure criterion has
been reached; 3. Loading-unloading response using initial stiffness properties, i.e. properties of
undamaged material. Damage accumulation during primary loading was achieved by introducing a deformation
dependent shear modulus G. The magnitude of G has a nonlinear dependence on the second deviatoric stress invariant. A change in the shear modulus induces a change in the volumetric response as well. Once the state of stress satisfies the Drucker-Prager criterion, the material starts to dilate and its strength reduces gradually to zero.
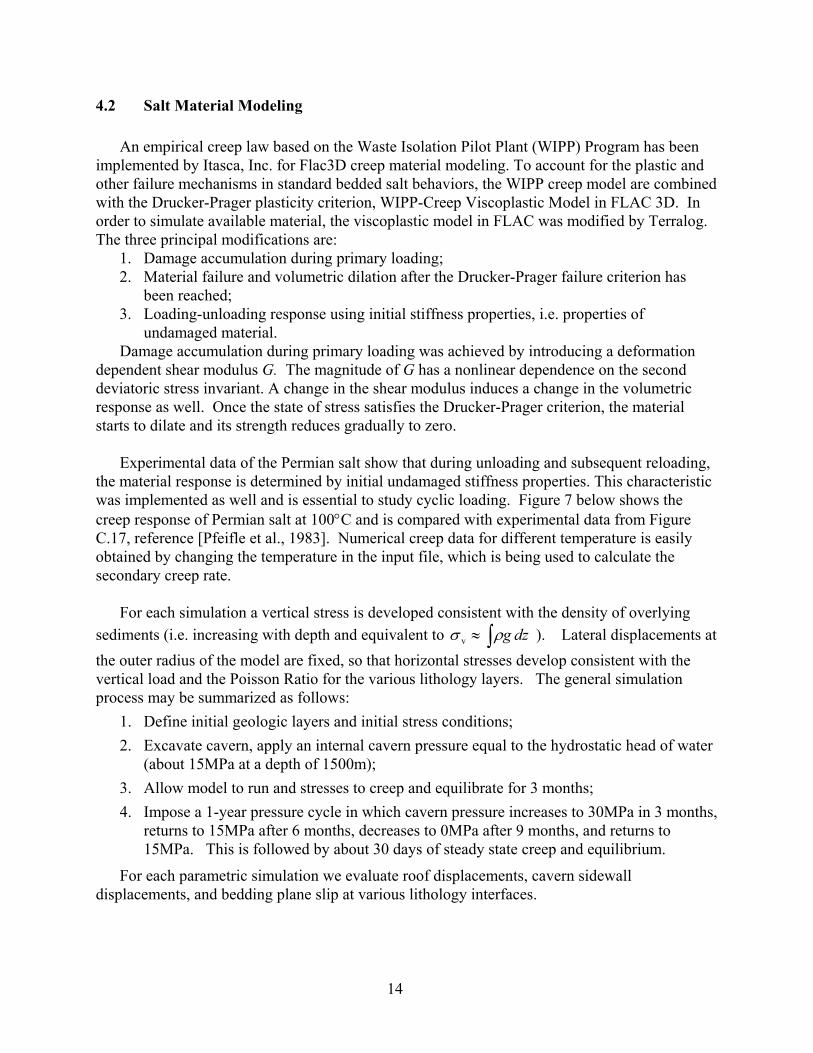
Experimental data of the Permian salt show that during unloading and subsequent reloading,
the material response is determined by initial undamaged stiffness properties. This characteristic was implemented as well and is essential to study cyclic loading. Figure 7 below shows the creep response of Permian salt at 100°C and is compared with experimental data from Figure C.17, reference [Pfeifle et al., 1983]. Numerical creep data for different temperature is easily obtained by changing the temperature in the input file, which is being used to calculate the secondary creep rate.
For each simulation a vertical stress is developed consistent with the density of overlying
sediments (i.e. increasing with depth and equivalent to ∫≈ dzgρσ v ). Lateral displacements at the outer radius of the model are fixed, so that horizontal stresses develop consistent with the vertical load and the Poisson Ratio for the various lithology layers. The general simulation process may be summarized as follows:
1. Define initial geologic layers and initial stress conditions; 2. Excavate cavern, apply an internal cavern pressure equal to the hydrostatic head of water
(about 15MPa at a depth of 1500m); 3. Allow model to run and stresses to creep and equilibrate for 3 months; 4. Impose a 1-year pressure cycle in which cavern pressure increases to 30MPa in 3 months,
returns to 15MPa after 6 months, decreases to 0MPa after 9 months, and returns to 15MPa. This is followed by about 30 days of steady state creep and equilibrium.
For each parametric simulation we evaluate roof displacements, cavern sidewall displacements, and bedding plane slip at various lithology interfaces.
15
Figure 7: Creep response of Permian Salt. 15 MPa confinement pressure, 5MPa stress
difference. The temperature of the simulation equal to 100°C
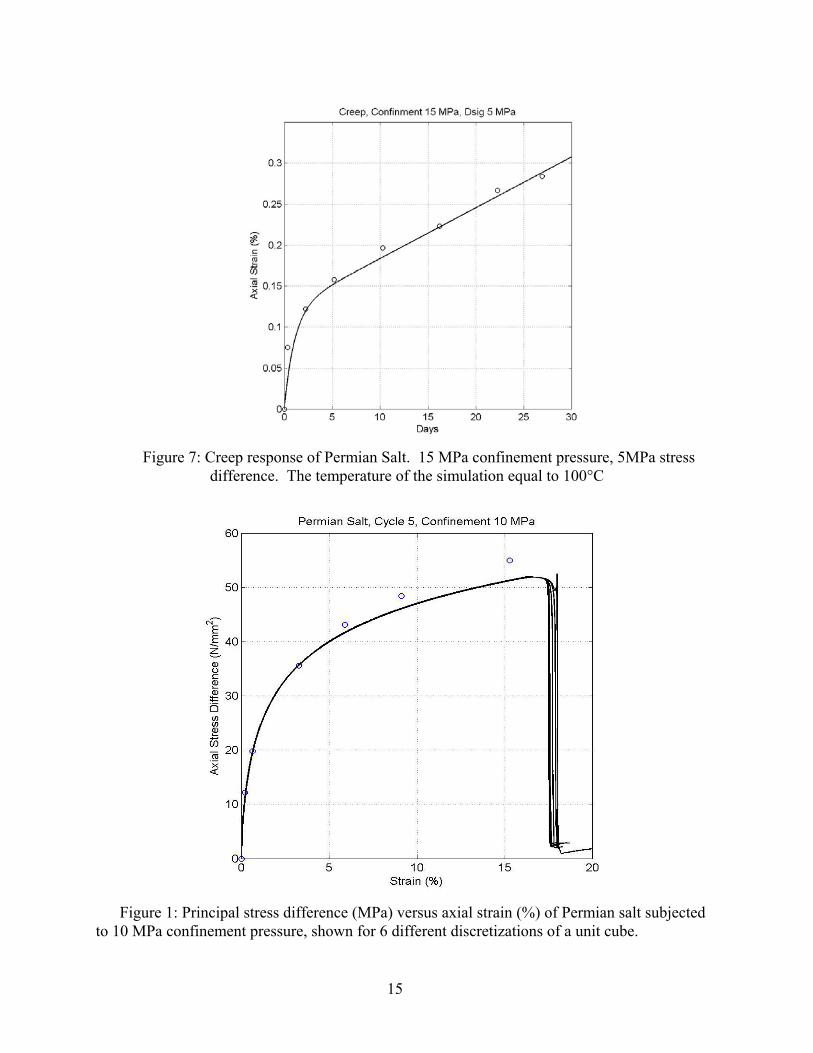
Figure 1: Principal stress difference (MPa) versus axial strain (%) of Permian salt subjected
to 10 MPa confinement pressure, shown for 6 different discretizations of a unit cube.
16
4.3.1 Multiple Horizontal Cavern Simulations
Numerical models for a variety of multiple horizontal caverns configurations have been
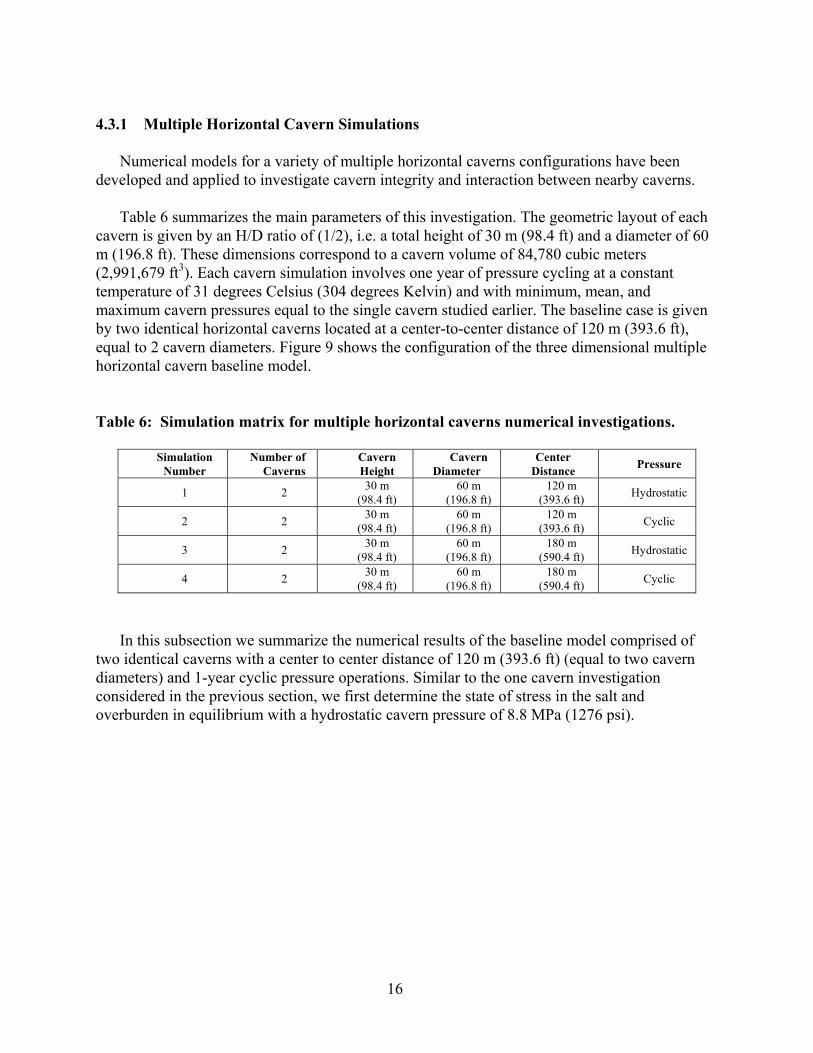
developed and applied to investigate cavern integrity and interaction between nearby caverns. Table 6 summarizes the main parameters of this investigation. The geometric layout of each
cavern is given by an H/D ratio of (1/2), i.e. a total height of 30 m (98.4 ft) and a diameter of 60 m (196.8 ft). These dimensions correspond to a cavern volume of 84,780 cubic meters (2,991,679 ft3). Each cavern simulation involves one year of pressure cycling at a constant temperature of 31 degrees Celsius (304 degrees Kelvin) and with minimum, mean, and maximum cavern pressures equal to the single cavern studied earlier. The baseline case is given by two identical horizontal caverns located at a center-to-center distance of 120 m (393.6 ft), equal to 2 cavern diameters. Figure 9 shows the configuration of the three dimensional multiple horizontal cavern baseline model.
Table 6: Simulation matrix for multiple horizontal caverns numerical investigations.
Simulation Number
Number of Caverns
Cavern Height
Cavern Diameter
Center Distance Pressure
1 2 30 m (98.4 ft)
60 m (196.8 ft)
120 m (393.6 ft) Hydrostatic
2 2 30 m (98.4 ft)
60 m (196.8 ft)
120 m (393.6 ft) Cyclic
3 2 30 m (98.4 ft)
60 m (196.8 ft)
180 m (590.4 ft) Hydrostatic
4 2 30 m (98.4 ft)
60 m (196.8 ft)
180 m (590.4 ft) Cyclic
In this subsection we summarize the numerical results of the baseline model comprised of
two identical caverns with a center to center distance of 120 m (393.6 ft) (equal to two cavern diameters) and 1-year cyclic pressure operations. Similar to the one cavern investigation considered in the previous section, we first determine the state of stress in the salt and overburden in equilibrium with a hydrostatic cavern pressure of 8.8 MPa (1276 psi).
17
Figure 9: Three dimensional multiple horizontal caverns baseline model.
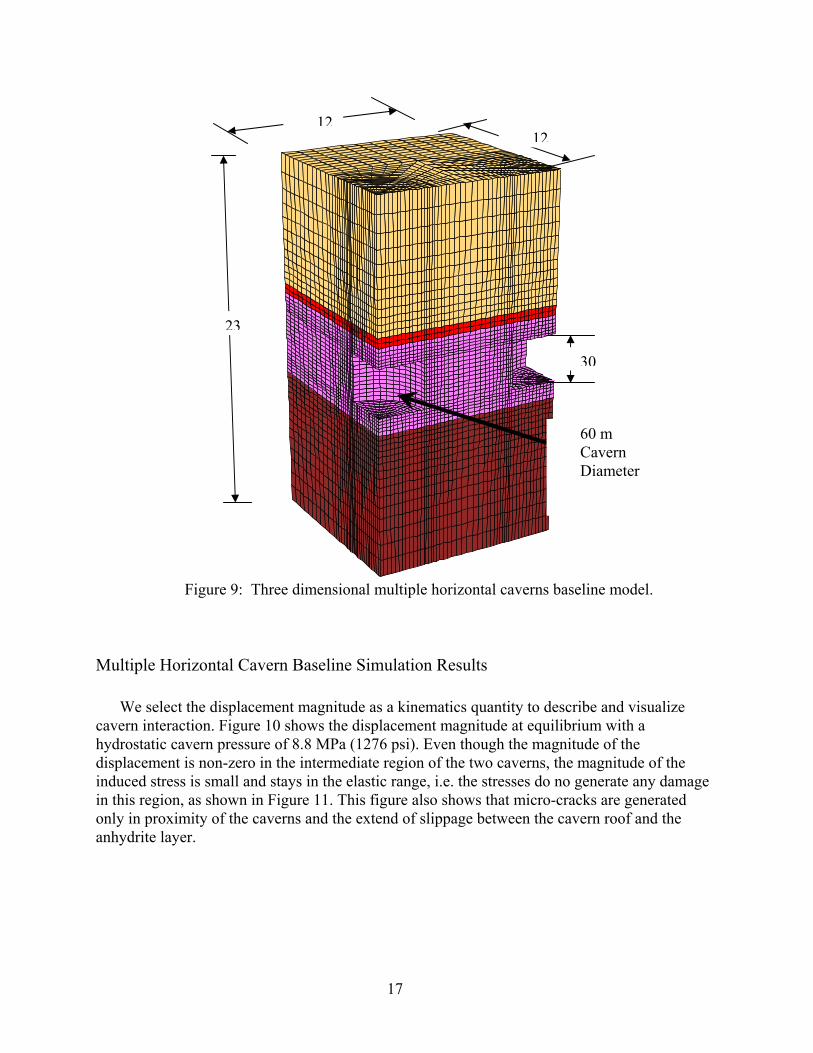
Multiple Horizontal Cavern Baseline Simulation Results We select the displacement magnitude as a kinematics quantity to describe and visualize
cavern interaction. Figure 10 shows the displacement magnitude at equilibrium with a hydrostatic cavern pressure of 8.8 MPa (1276 psi). Even though the magnitude of the displacement is non-zero in the intermediate region of the two caverns, the magnitude of the induced stress is small and stays in the elastic range, i.e. the stresses do no generate any damage in this region, as shown in Figure 11. This figure also shows that micro-cracks are generated only in proximity of the caverns and the extend of slippage between the cavern roof and the anhydrite layer.
30
1212
23
60 m Cavern Diameter
18
Figure 10: Plot of displacement magnitude for caverns in equilibrium with cavern pressure of 8.8 MPa (1276 psi). Center to center distance is 2 cavern diameters.
Figure 11: Distribution of damage and interface slip of caverns with center to center distance of 2 cavern diameters. Cavern pressure is 8.8 MPA (1276 psi).
Terralog Technologies USA, Inc.Terralog Technologies USA, Inc.
Terralog Technologies USA, Inc.Terralog Technologies USA, Inc.
19
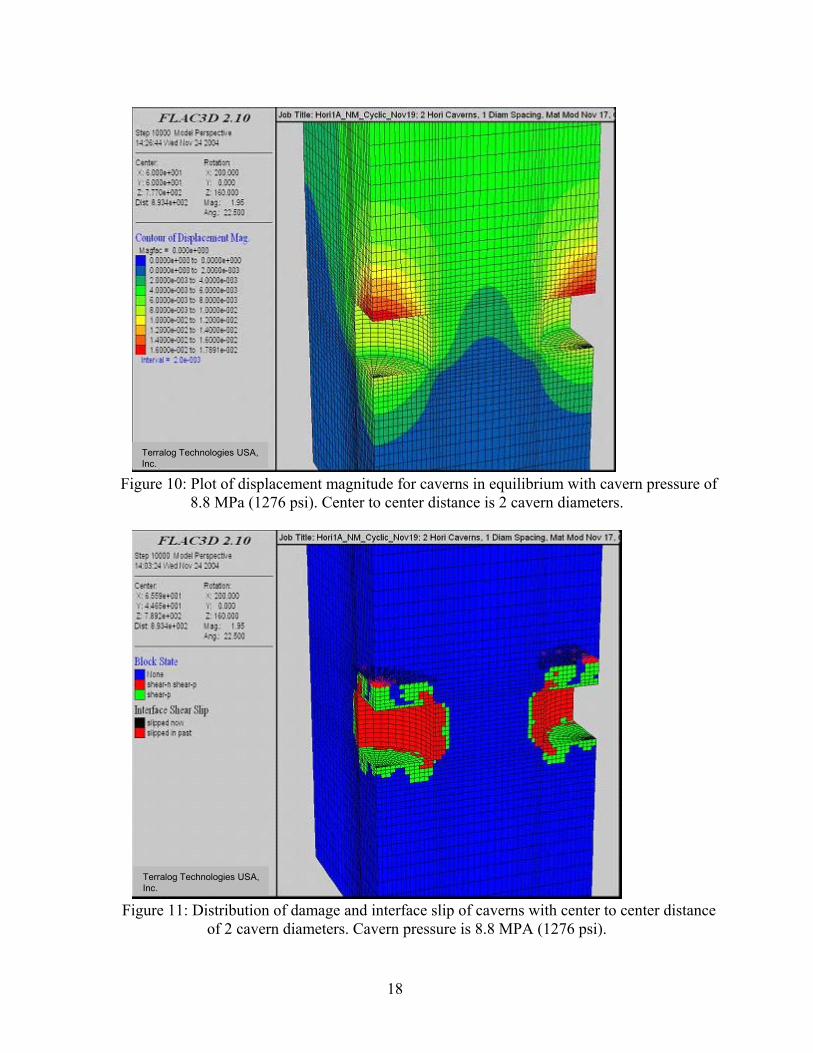
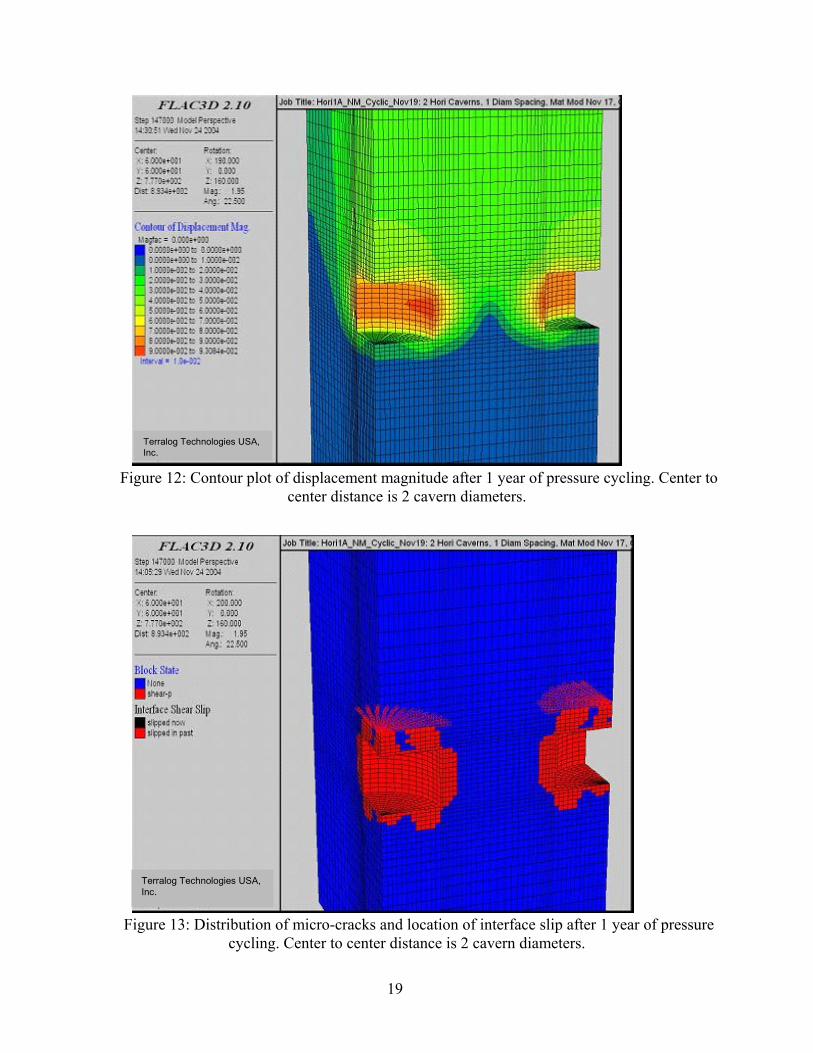
Figure 12: Contour plot of displacement magnitude after 1 year of pressure cycling. Center to center distance is 2 cavern diameters.
Figure 13: Distribution of micro-cracks and location of interface slip after 1 year of pressure cycling. Center to center distance is 2 cavern diameters.
Terralog Technologies USA, Inc.Terralog Technologies USA, Inc.
Terralog Technologies USA, Inc.Terralog Technologies USA, Inc.
20
Figure 12 and Figure 13 show the results of the baseline case after 1 year of pressure cycling.
From Figure 10 and Figure 11, an increase in the lateral displacement of the cavern side wall from approximately 0.01 m (0.0328 ft) to 0.09 m (0.2952 ft) can be noted. An increase in the vertical displacement of the cavern roof also occurs. However, no additional cracks are generated. This may be observed by comparing Figure 11 and Figure 13. This can be explained by the viscous response of salt. Creep tends to reduce the magnitude of any deviatoric stress component in the salt, which ultimately approaches a pure hydrostatic state of stress. Therefore, the cavern closure in this particular case is due to creep deformation only and not to additional damage in the material.
The amount of damage is larger compared to the results of the one cavern baseline case. The
model for the baseline case involving one cavern assumes axisymmetric geometry and loading. Multiple cavern simulation results indicate that the interaction of these two caverns, located at a center to center distance of two cavern diameters, does affect the response during pressure cycling. The interaction is best seen by the increase in the lateral wall displacement, although no additional damage is generated.
Influence of Horizontal Caverns Separation Distance on Cavern Deformation and Stability
In this subsection, we investigate the effect of horizontal cavern distance on the displacement
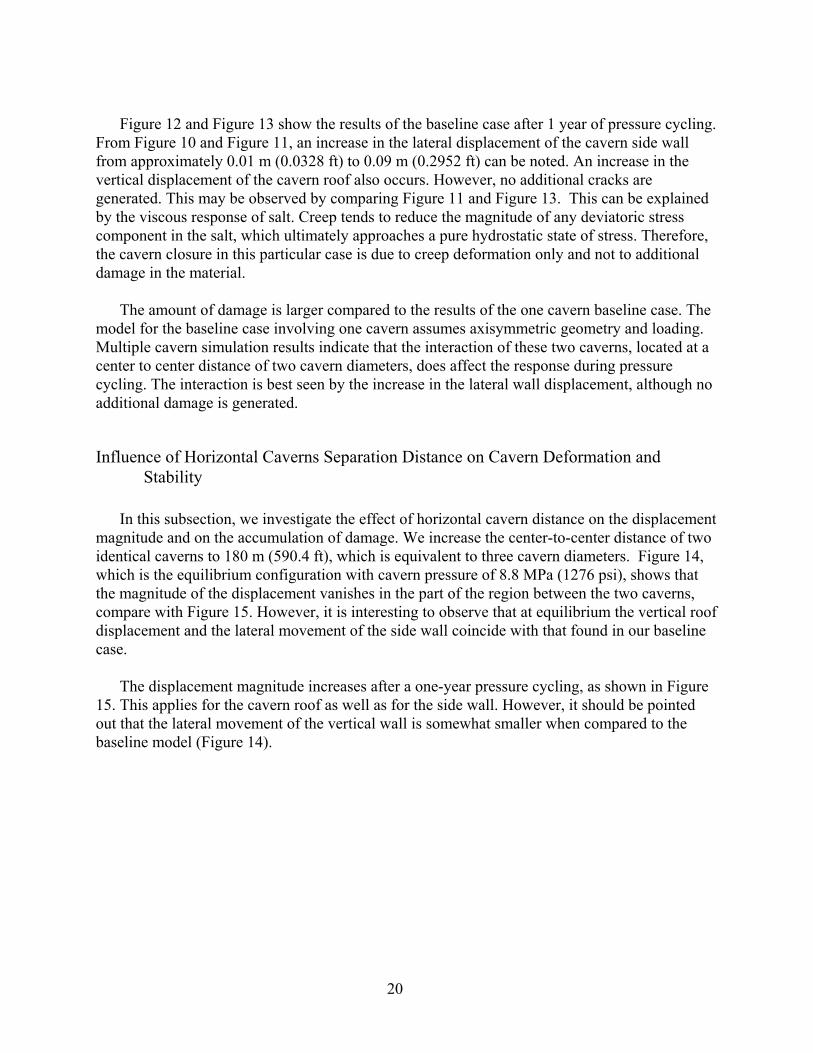
magnitude and on the accumulation of damage. We increase the center-to-center distance of two identical caverns to 180 m (590.4 ft), which is equivalent to three cavern diameters. Figure 14, which is the equilibrium configuration with cavern pressure of 8.8 MPa (1276 psi), shows that the magnitude of the displacement vanishes in the part of the region between the two caverns, compare with Figure 15. However, it is interesting to observe that at equilibrium the vertical roof displacement and the lateral movement of the side wall coincide with that found in our baseline case.
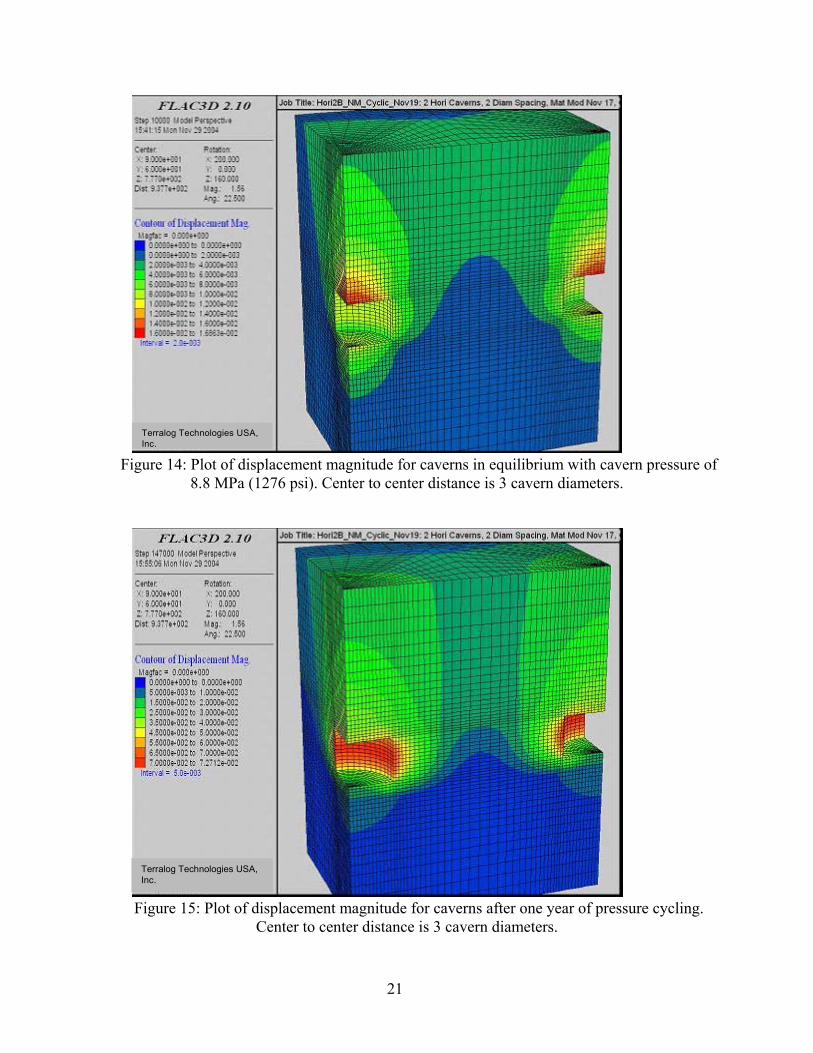
The displacement magnitude increases after a one-year pressure cycling, as shown in Figure
15. This applies for the cavern roof as well as for the side wall. However, it should be pointed out that the lateral movement of the vertical wall is somewhat smaller when compared to the baseline model (Figure 14).
21
Figure 14: Plot of displacement magnitude for caverns in equilibrium with cavern pressure of 8.8 MPa (1276 psi). Center to center distance is 3 cavern diameters.
Figure 15: Plot of displacement magnitude for caverns after one year of pressure cycling. Center to center distance is 3 cavern diameters.
Terralog Technologies USA, Inc.Terralog Technologies USA, Inc.
Terralog Technologies USA, Inc.Terralog Technologies USA, Inc.
22
5. SUMMARY AND CONCLUSIONS
Designing bedded salt caverns for natural gas and liquid storage should take into account the mechanical properties of natural bedded salt in order to perform accurate numerical simulations. In this research, a modified creep viscoplastic model has been developed and implemented in Flac3D to simulate the response of cavern embedded into layered salt of the Permian, Michigan and Appalachian Basins. The original viscoplastic model is based on an empirical creep law developed for Waste Isolation Pilot Plant (WIPP) Program and combined with the Drucker-Prager yield model to describe damage. Experimental data for the Permian salt provided by Pfeifle et al. 1983, are used to validate the basic assumptions made in the development of the damage model. A number of one element numerical simulations have been performed to calibrate the model, such as uniaxial tension test, uniaxial compression test, triaxial compression test and creep test. The numerical results show that the modified creep model approximates experimental data reasonable well.
With the modified creep viscoplastic model, bedded salt caverns for natural gas storage are
simulated numerically considering various layer properties, e.g. salt, anhydrite layer, overburden clastic, and underlying pre-salt. A baseline model using a predefined cyclic pressure history is used to determine the stress distribution around the cavern and the distribution of damage with possible implication on the salt roof stability. Different design parameters are varied to determine the influence on the accumulation of damage in salt and on the deformation of the salt cavern. These are the lower limit of the cavern pressure, the cavern pressure history, operational conditions, and cavern size expressed in terms of height/diameter ratio, overburden stiffness, interface properties and roof thickness.
The baseline model of a single cavern suggests that at equilibrium with the hydrostatic cavern pressure, a shear stress distribution around the cavern top and bottom corners. Furthermore, in order to reach equilibrium micro-cracks have been induced around the cavern sidewalls and slippage along the interface between the salt and anhydrite layers occurs. During cyclic pressure operations, no additional micro-cracks are generated. However additional interface slip occurs mainly due to the minimum cavern pressure reached during operations. Additional cavern closure during cycling is primarily due to creep deformation and interface slippage.
The amount of damage and interface slippages in the cavern with an H/D ratio of (1/4) after
one year of pressure cycling increase and also extend over larger regions. For the smaller cavern with an H/D ratio of (1/1), the damaged region is smaller and involves primarily the vertical wall. Interface slippage occurs only in the interface above the cavern.
The effect of the overburden stiffness on the cavern response shows that by reducing the stiffness by an order of magnitude, for example, a substantial part of the overburden weight is supported by the anhydrite layer and the cavern roof itself. As a consequence the interface and the anhydrite layer fail and the vertical displacement of the cavern roof increases with a corresponding increase in damage and slippage. Doubling the salt roof thickness does reduce the extension of damage in the roof itself. The transfer of horizontal stress between the salt and the
23
anhydrite layer is still in excess of the interface strength, therefore slip conditions are present. Doubling the roof thickness, does not, as expected, influence the response along the vertical cavern wall.
Numerical models are also developed to analyze and to determine the interaction of multiple caverns. In particular, the influence of the center to center distance of multiple caverns on displacement magnitude and accumulation of damage, are investigated. We also consider the mechanical properties and the elasto-plastic response of non-salt strata above and below the salt cavern. Various formations are simulated in FLAC3D, including an elasto-plastic anhydrite layer, a Mohr-Coulomb type overburden clastic and an elastic underlying presalt.
The interaction of multiple horizontal bedded salt caverns is evaluated to determine the
minimum save distance without compromising safety issues. Similar to the single cavern analyses, a baseline case is considered, which is first subjected to a hydrostatic pressure loading of 8.8 MPa (1276 psi) and then to pressure cycling over a one year period.
The geometric dimensions of each cavern are equal to the baseline case of the single cavern
model. However, the important value is the center to center distance, which initially is selected as 120 m (393.6 ft) and corresponds to 2 cavern diameters. Subsequently, to quantify the cavern to cavern interaction, this distance is increased to 180 m (590.4 ft), which corresponds to 3 cavern diameters, see Table 6.
To describe und visualize the mutual cavern interaction, we select the displacement
magnitude as our basic variable. Comparing the corresponding values for the same loading conditions, but different cavern distances, we find that for a distance of 180 m (590.4 ft) all interactions vanish. This is in contrast to the results obtained for the 120 m (393.6 ft) center to center distance, where an increase in the lateral wall displacement is noted during pressure cycling. In the latter case, even though the interaction extends throughout the interconnecting region, the generated stresses are small and remain elastic, i.e. no permanent damage.
In summary, cavern development and operation in thin bedded salt provides additional
challenges over conventional domal salt cavern operations. The challenges are related to the heterogeneous material properties, the resulting differences in fracture pressure, and the potential for bedding plane slip across the cavern height (leading to gas migration risk) and within the roof and caprock (leading to roof caving and well shear damage risk). Notwithstanding these challenges, however, appropriate geologic characterization and geomechanical assessment efforts can be applied to safely develop and operate caverns in bedded salt formations.
24
6. REFERENCES
American Gas Association (AGA), 1998 Survey of Underground Storage of Natural Gas in the United States and Canada.
API, 1994, “Design of Solution-Mined Underground Storage Practices,” API Recommended Practice 1114, American Petroleum Institute, Washington, DC, June.
Bruno, M.S., Dewolf, G., and Foh, S. (2000): Geomechanical analysis and decision analysis for delta pressure operations in gas storage reservoirs, Proc. AGA Operations Conf., Denver, CO, May 7-9.
Cromwell, D.W., 1984, The Upper Delaware Mountain Group, Permian (Guadalupian), southeast New Mexico and West Texas in Mazzullo, S.J., ed., The Geologic Evolution of the Permian Basin section, Midland, Texas, Permian Basin Section – SEPM, Symposium, p.32-34
DeVries K.L., Mellegard K.D., Callahan G.D., 2002, Salt Damage Criterion Proof-of-Concept Research, Technical Report RSI-1675, November 2002. Fossum A.F. and Fredrich J.T., 2002, Salt mechanics primer for near-salt and sub-salt deepwater Gulf of Mexico field developments. SANDIA Report, SANDIA 2002-2063, July 2002.
Gustavson, T.C., Finley, R.J. and McGillis, K.A., 1980, Regional Dissolution of Permian Salt in the Anadarko, Dalhart and Palo Duro Basins of the Texas Panhandle, Texas Bureau of Economic Geology, Report of Investigations No. 106
Hoffman E.L. and Ehgartner B.L., 1992, Evaluating the Effects of the Number of Caverns on the Performance of Underground Oil Storage Facilities. Sandia Report, SANDIA-92-2183C, 1992
Hovorka, S.D. and Nava R., 2000, Characterization of Bedded Salt for Storage Salt Caverns – A Case Study from the Midland Basin, Texas, National Petroleum Technology Office, DOE/BC/15030-1
IOGCC, 1995, "Natural Gas Storage in Salt Caverns - A Guide for State Regulators," Interstate Oil and Gas Compact Commission, Oklahoma City, OK, October.
IOGCC, 1998, Natural Gas Storage in Salt Caverns, A Guide for State Regulators, Interstate Oil and Gas Compact Commission, 45pp.
Jizba, D. and Nur, A, 1990, Static and dynamic moduli of tight gas sandstones and their relation to formation properties, SPWLA 31st Annual Logging Symposium, Paper BB
Johnson, K.S. and Gonzales, S., 1978. Salt Deposits in the United States and RegionalGeological Characteristics Important for Storage of Radioactive Wastes. Office of Waste Isolation, Union Carbide Corp., US Dept of Energy, Y/OW1/SUB-7414/1, 188 pp.
Johnson, K.S. and Gonzales, S., 1978, Salt Deposits in the United States and Regional Geologic Characteristics Important for Storage of Radioactive Waste, Office of Waste Isolation, Y/OWI/SUB-7414/1
Johnson, K.S., 1986, Salt Dissolution and Collapse at the Wink Sink in West Texas, Office of Nuclear Waste Isolation, Battelle Memorial Institute, BMI/ONWI-598
Lytle, W.S., 1963, Underground Gas Storage in Pennsylvanian, Pennsylvanian Geological Survey, Bulletin M46.
25
McGillis, K.A. and Presley, M.W., 1981, Tansill, Salado, and Alibates Formations: Upper Permian Evaporite/ Carbonate Strata of the Texas Panhandle, Texas Bureau of Economic Geology, Geological Circular 81-8
McGookey, D., Gustavson, T.C. and Hoadley, A.D., 1988, Regional Structural Cross Sections, Mid Permian to Quaternary Strata, Texas Panhandle and Eastern New Mexico, Distribution of Evaporites and Areas of Evaporite Dissolution and Collapse, Texas Bureau of Economic Geology
McGookey, D., Gustavson, T.C. and Hoadley, A.D., 1988, Regional Structural Cross Sections, Mid Permian to Quaternary Strata, Texas Panhandle and Eastern New Mexico, Distribution of Evaporites and Areas of Evaporite Dissolution and Collapse, Texas Bureau of Economic Geology
Michigan State University, www.geo.msu.edu/geo333/miBasin.html Munson, D.E., 1998, Analysis of Multistage and other Creep Data for Domal Salts, Sandia
Report, SAND98-2276, 1998. Munson, D.E.,1999, Multimechanism-Deformation Parameters of Domal Salts using
Transient Creep Analysis, Sandia Report, SAND99-2104, 1999. Neal, J.T. and Magorian, T.R., 1995. Geological Site Characterization Requirements for
Storage and Mining is Salt. Proceedings Solution Mining Research Institute Spring Meeting, New Orleans LA, 19 pages.
Nieland J.D. and Mellegard K.D., 2002, Storage of Chilled Natural Gas in Bedded Salt Storage Caverns Economic and technical Feasibility. SMRI Spring Meeting, Alberta Canada, 2002.
Ohio Department of Natural Resources, 2002, Report on Ohio Mineral Industries, complied by Mark E. Wolfe.
Pfeifle, T.W., Mellegard, K.D., Senseny P.E., 1983, Preliminary constitutive properties for salt and nonsalt rocks from four potential repository sites. Technical Report. RE/SPEC Inc., July 1983.
Pfeifle, T.W., Vogt, T.J., Brekken G.A.,1995, Correlation of Chemical, Mineralogic and Physical Characteristics of Gulf Coast Dome Salt to Deformation and Strength Properties. SMRI 1996 Spring Meeting, Houston, TX, 1995.
Senseny P.E., Triaxial Compression Creep Tests on Salt from the Waste Isolation Pilot Plant, Topical report RSI-0294, 1986.
Smosna, R. and Patchen, D., 1978, Silurian Evolution of Central Appalachian Basin, American Association of Petroleum Geologists, Bulletin, v.62, no.11, p.2308-2328.
Stone and Webster Engineering Corp., 1983, Major Salt Beds of the Palo Duro and Dalhart Basins, Texas, Office of Nuclear Waste Isolation, Battelle Memorial Institute, BMI/ONWI-518
Tomastik, T.E., 1996, An Examination of the Geology of the Bass Islands and Salina groups in Ohio and Its Effect on Salt Solution Mining and Underground Storage, Solution Mining Research Institute, Meeting Paper, Oct.20-23, 1996, p.175-206.
Tomastik, T.E., 1997, The Sedimentology of the Bass Islands and Salina Groups in Ohio and Its Effect on Salt Solution Mining and Underground Storage, USA, in Carbonates and Evaporites, Friedman, Gerald M. Editor, vol.12, no.2, p.236-253.


![Alabaster Caverns[1]](https://img.pdfslide.us/doc/110x75/577cc1eb1a28aba7119403cd/alabaster-caverns1.jpg)