Embed Size (px)
Citation preview
HAL Id: hal-02049434https://hal.archives-ouvertes.fr/hal-02049434
Submitted on 26 Feb 2019
HAL is a multi-disciplinary open accessarchive for the deposit and dissemination of sci-entific research documents, whether they are pub-lished or not. The documents may come fromteaching and research institutions in France orabroad, or from public or private research centers.
L’archive ouverte pluridisciplinaire HAL, estdestinée au dépôt et à la diffusion de documentsscientifiques de niveau recherche, publiés ou non,émanant des établissements d’enseignement et derecherche français ou étrangers, des laboratoirespublics ou privés.
3D cellular automata simulations of intra andintergranular corrosion
Dung Di Caprio, Janusz Stafiej, Giorgio Luciano, Laurent Arurault
To cite this version:Dung Di Caprio, Janusz Stafiej, Giorgio Luciano, Laurent Arurault. 3D cellular automata sim-ulations of intra and intergranular corrosion. Corrosion Science, Elsevier, 2016, 112, pp.438-450.�10.1016/j.corsci.2016.07.028�. �hal-02049434�

OATAO is an open access repository that collects the work of Toulouse researchers and makes it freely available over the web where possible
Any correspondence concerning this service should be sent to the repository administrator: [email protected]
This is an author’s version published in: http://oatao.univ-toulouse.fr/21895
To cite this version:
Di Caprio, Dung and Stafiej, Janusz and Luciano, Giorgio and Arurault,
Laurent 3D cellular automata simulations of intra and intergranular
corrosion. (2016) Corrosion Science, 112. 438-450. ISSN 0010-938X
Official URL: https://doi.org/10.1016/j.corsci.2016.07.028
3D cellular automata simulations of intra and intergranular corrosion
D. di Caprio a ,*,J. Stafiejb, G. Luciano c,d, L. Arurault e
a Chimie ParisTech, PSL Research University, CNRS, Institut de Recherche de Chimie Paris (IRCP), F-75005 Paris, France b Cardinal Stefan Wyszynski University, Department of Mathematics and Natural Sciences, W6ycickiego 1/3, Warsaw, Poland c Institute of Marine Science -National Research Council, ISMAR-CNR, Via De Marini, 6 -IV P., 16149 GE, Italy d Institutefor the Study ofMacromolecules - National Research Council, ISMAR-CNR, Via De Marini, 6 - IV P., 16149 GE, Italy • Cirimat, Université de Toulouse, UPS/INPT/CNRS, 118 route de Narbonne, 31062 Toulouse Cedex 9, France
ARTICLE INFO ABSTRACT
A simple mode! for the effect of intergranular corrosion on overall corrosion processes is investigated using a cellular automata approach. The corroding polycrystalline material consists of domains and their boundaries. The domains represent the monocrystalline cores while their boundaries represent the intergranular defects. Either, a periodic pattern or randomly generated domains of Voronoï tessellation are
used to represent the polycrystalline structure. The parameters of the mode!, taking into account the polycrystalline aspect of corrosion, are the domain density and the corrosion probabilities of metal grain core and grain boundary sites. The corrosion probability for grain boundary is set to a value higher than it is for the grain core. A complex surface structure appears with a high geometrical roughness when defects are not too dense. A strong correlation is established between the roughness evolution, the metal crystalline properties and the corrosion mechanism ofmetal dissolution. This work concerns simulations in 3D and extends the previous work limited to 2D simulations.
Keywords: Intergranular corrosion Modelling Cellular automata Exfoliation corrosion
1. Introduction
Physical properties of materials e.g. mechanical properties are
strongly dependent on structural features, such as grain sizes
of the polycrystalline material [ 1 ]. This is also true for suscep
tibility/resistivity to corrosion. It is known, for instance, that
susceptibility to corrosion increases with the roughness [2,3]
related with the presence of intergranular material and granuiar
junctions at the outer surface of the material.
A common type of corrosion attack, for which the grain structure
is important, is intergranular (IGC) or intercrystalline corrosion.
IGC is defined [4] as a selective corrosion of grain boundaries or
closely adjacent regions without considerable attack on the grains
or crystals themselves. In IGC, the grain boundaries become anodic
and the bulk material between the grain boundaries is not affected
and therefore becomes cathodic. Due to its nature, IGC penetrates
more quickly than pitting corrosion and it has drastic effect as a
stress riser, in comparison to pitting corrosion, reducing the num
ber of cycles required to initia te a fatigue crack [ 5 ]. The same kind
of subsurface fissure can be produced by transgranular corrosion
* Corresponding author.
https://doi.org/10.1016/j.corsci.2016.07 .028
where a small volume of metal is removed in preferential paths
that proceed across or through the grains. Alloys with enhanced
resistance to corrosion as well as methodologies to analyze, predict
corrosion development and avoid corrosion failures remain a very
active field of research. This is confirmed by a selection of recent
articles found on the topic [6-18].
Cellular automaton models (CA) based on discretized descrip
tion of time, space and states, have been applied successfully for
modelling pitting corrosion and passivation/depassivation events
[19-31 ]. The present study is an extension in 3D of a previous 2D
numerical mode! [32-36] simulating the effect of the grain size on
the corrosion processes by using a CA mode! focusing on intra and
intergranular corrosion (IGC). It adds to recent findings published
in this field [37].
In this work, both surface properties and internai bulk struc
ture of the material are investigated. The focus of this paper is on
geometrical effects of the grain shape and their spatial organiza
tion in the system. The objective is to study how fast corrosion
can penetrate into material and besides chemical dissolution of
the corroded material determine the effect of pure mechanical
detachment of chunks of material. These chunks are nearly always
parti ail y dissolved grains of polycrystalline material when their link
to the bulk material becomes corroded by the faster intergranular
corrosion. The chunk effect may also occur in random dissolution
of the material when the external medium grows as in the Eden mode! [38]. Originally, the medium is defined a connected set. However, the material may form peninsulas detached as islands when a straight corrosion cuts the peninsula from the mainland. This chunk effect gives a plausible explanation for non-faradaic material Joss in some electrode processes. The inhomogeneous granular structure leads to an enhancement of this scenario [32]. The modelling is very simple. The grain cores are embedded in intergranular material. Both the core and intergranular materials are homogeneous and isotropie. Cores are more resistant to corrosion therefore the corrosion proceeds by dissolving intergranular material at grain boundaries. Ultimately, grain cores "fall off' when the intergranular material around them gets corroded. The progression of the corrosion front is to some degree delayed, compared to "pure intergranular material", by the sinuosity effect of the lines of "steepest descent" from the surface. These lines can be described as the "shortest path" within the intragranular space connecting two points on a line normal to the surface. There is a sinuosity coefficient due to the fact that the line cannot go through the cores. Imagine a signal is sent from one of the points to another propagating isotropically and with constant speed. Compare the time of arrivai in two cases. In the first event, the signal is allowed to propagate only in intergranular space and in the second case it propagates in both cores and intergranular spaces ignoring the difference. The ratio between the two Iengths of time is the sinuosity coefficient. In our mode!, the sinuosity coefficient is the main consequence of the granular structure of the material. It is isotropie for the Voronoï tessellation but, in general, it is direction dependent.
2. Model
As in [32], let us consider a simplified mode! of intergranuIar corrosion. The grain boundaries are assumed to be the only defect of the crystalline structure susceptible to enhance corrosion rate. The intergranular region has chemical and physical properties distinct from that of the grains. A common occurrence is segregation or depletion of some components of the alloys in the intergranular region [39-47]. For instance, in the case of sensitized stainless steels, chromium carbide precipitates fragilize the intergranular region [48]. In general, several different components can segregate at the grain interface, such as phosphorous, tin, silicium, nickel, Ieading by different mechanisms to a higher susceptibility to corrosion of the material [49,50]. In this paper, the focus is on the difference in corrosion kinetics between intra and intergranular corrosion. Consequently, the dependence of corrosion on crystalline orientation is not taken into account. The grains of polycrystalline material are presented as homogeneous isotropie domains arranged as adjacent polyhedra in three dimensional space. The material, in the thin intergranular spaces of the polygonal faces of the polyhedra, is regarded as more susceptible to corrosion than the grain cores.
Let us look at regular structured fillings of three dimensional space analogous to those shown in [32] in two dimensions. The first case, referred to as cube piling (CP), is a regular piling with cubes one above the other with matching edges. The second case, referred to as brick piling(BP), is a regular piling, with the edges of the cubes shifted by half a lattice dimension in the two directions parallel to the metal surface with respect to the plane below. Finally, three dimensional Voronoï tessellation is considered as an example of non periodic irregular structures.
The Voronoï tessellation is obtained by randomly generating a number of vertices with uniform distribution corresponding to a given density or, conversely, to the average domain volume. Periodic boundary conditions in ail directions are used for the vertices to avoid deformation of the Voronoï tessellation at the facets of the
simulation cube. The domains start growth at the vertices. Initially they form vertex centred spheres. Gradually, the domains grow by slightly incrementing the radius and including points which do not belong to another sphere. The growing domains meet ultimately at the faces ofVoronoï polyhedra if growth starts simultaneously and growth rate is identical at ail vertices. The two nearest neighbouring sites, each belonging to different domains, are marked as intergranular sites in our lattice version of the growth process.
lt is possible to represent this system on a discrete, three dimensional lattice, Nx x Ny x Nz where Ni, i =x, y, z are the integer dimensions of the lattice in the three directions. In our mode!, there are three types of lattice sites corresponding to the inter, the intragranular material and the solution. The solution corresponds to an aggressive, corrosive environment - acidic solution for instance. The top z plane is composed of solution sites and below lies the bare metal made of granular and intergranular material. Hence, the direction z is the direction perpendicular to the metal surface, which also corresponds to the main direction in the propagation of corrosion. Periodic boundary conditions are used in the plane parailei to the x and y directions. The cellular au toma ta Iattice approach adopts a mesoscopic viewpoint. As in [ 51,52 ], to relate the simulation to the real world, space and time equivalence for our pixel size and simulation time step must be set in terms of real dimensions. In this paper, a cube of Iateral dimension a= 0.2 µm is chosen for the pixel size, a size sufficiently small for a typical grain dimension as chosen in this paper [53,54]. The time scale is set considering a corrosion process for the intergranular material of 1 mm/y. With the above value of a, the simulation time step corresponds to of 6310 s. Such value is comparable to that illustrated in [17]. In this paper, the authors find that in one instance a period of 1000 h corresponds to the detachment of one layer of grains of characteristic dimension 84 µm. In one year, the corrosion rate corresponds approximately to 0.74mm/y. The round value of 1 mm/y adopted here is consistent with the above experimental value, and simplifies discussion for the case studies discussed in this paper.
The intergranular region has a width of two lattice sites. This value is a minimal value chosen in order to ensure a regular propagation of corrosion in the intergranular region. The characteristic dimensions of the intragranular domains will be specified in more detail later, as grains may not be isotropie. Typically, they are between 6 and 24 µm, which is in the range of a micrometre to 100 µm found in the literature [53,54], although smaller than the grains studied in [17]. Clearly, the order of magnitude is only indicative, as real systems may have grains of different dimensions depending on the metallurgical treatment or the "history of the sample". The corrosion rates of inter and intragranular material depend on the treatment and also on aggressiveness (temperature, pressure, composition) of the external environment in contact with the metal.
In our simulation, the active sites susceptible to corrosion are those which have a neighbouring solution site. It means that during a time step they are converted to the solution site with a certain probability. The intergranular material can corrode with a probability Pig which can be set to Pig = 1. Choosing a different value rescales the correspondence between the simulation time step and the real corrosion rate. The choice is arbitrary in the sense there are many possible sets of values of simulation time step and Pig corresponding to the same corrosion rate. This means that Pig = 1 and time step of 6310 s can also be simulated by Pig = 0.5 a time step of 3155 s. In terms of computational efficiency Pig = 1 is the better choice, as each computational time step results in an intergranular corrosion, whereas the second choice would require double the number of simulation steps. In both cases the physical corrosion rate is identical.
The grain material can corrode with a probability pg, With
the choice of Pig = 1, the corrosion rate for the grain is seen as
relative to the corrosion rate of the grain boundaries and pg
< 1 is assumed.
At each time step, the lattice sites in contact with the aggressive environment dissolve according to the probabilities Pig and Pg• Furthermore, any metal material disconnected from the main piece is removed. By convention, the main piece is connected to the lowest bottom part of the metal. Corrosion proceeds downwards and the connectivity check starts from the bottom up to the top surface. The top surface is exposed to solution and susceptible to corrosion.
The average height at a time step t is given as: Nx,Ny - 1 � h(t) = NxNy L... hx,y(t)x,y=0
(1)
where hx,y(t) is the height (z-coordinate) of the topmost site ofthe material column over the site referenced by x and y in the xy plane. The mean squared deviation of hx,y(t) averaged over the (x,
y) surface is denoted a(t)
1 X, y
[ N N l 1/2
a(t) = NxNy x�O (hx,y(t) - ii(t)l
and it serves as a measure for surface roughness.
3. Results
3.1. Mode! grains: cube and brick pilings
(2)
In the following, results of simulations performed with grain size of 64 lattice units for the cube and brick pilings are presented. The simulation box size is 512 x 512 x 4096 sites. It is 512 x 512 in
Iateral size (horizontal plane) and 4096 sites high. The simulation
4lXK)
3000
1000
o����������������
1000 2000 3000 t (lime step)
40()()
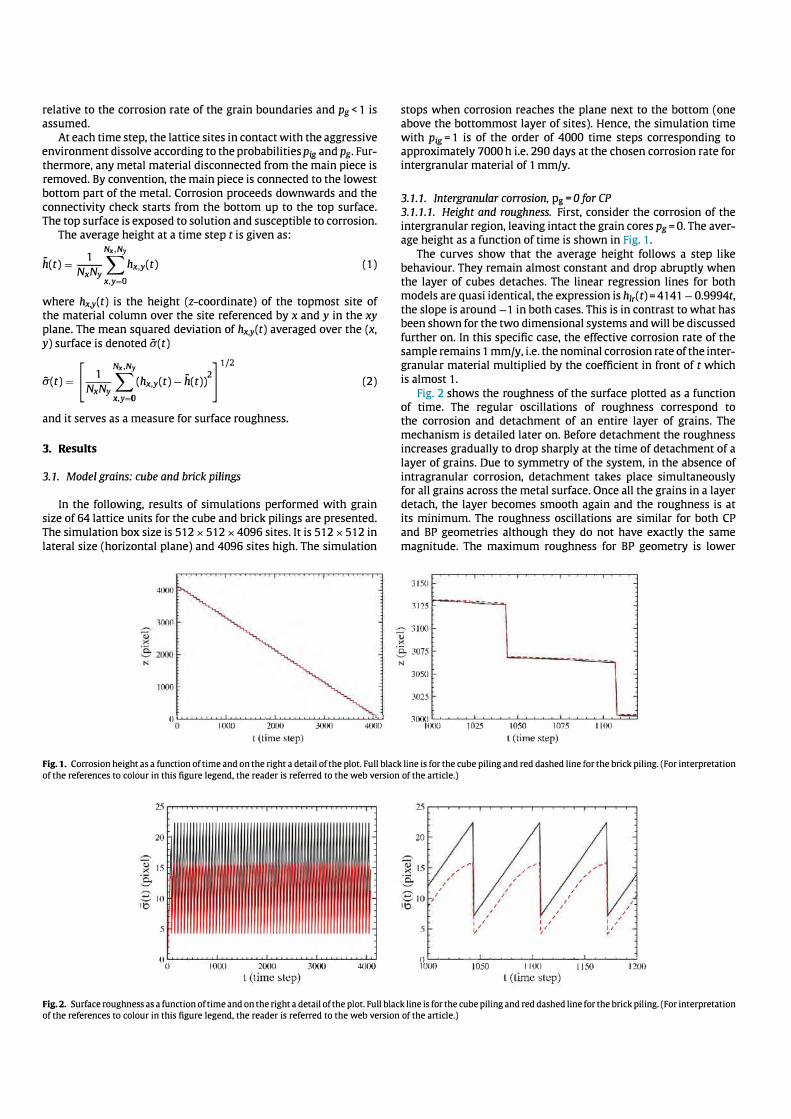
stops when corrosion reaches the plane next to the bottom ( one above the bottommost layer of sites). Hence, the simulation time with Pig = 1 is of the order of 4000 time steps corresponding to approximately 7000 h i.e. 290 days at the chosen corrosion rate for intergranular material of 1 mm/y.
3.1.1. Intergranular corrosion, pg = 0 for CP 3.1.1.1. Height and roughness. First, consider the corrosion of theintergranular region, leaving intact the grain cores p
g = O. The aver
age height as a function of time is shown in Fig. 1.
The curves show that the average height follows a step like behaviour. They remain almost constant and drop abruptly when the layer of cubes detaches. The linear regression lines for bath models are quasi identical, the expression is h1r(t) =4141 - 0.9994t, the slope is around -1 in bath cases. This is in contrast to what has been shown for the two dimensional systems and will be discussed
further on. In this specific case, the effective corrosion rate of the sample remains 1 mm/y, i.e. the nominal corrosion rate of the intergranular material multiplied by the coefficient in front of t which is almost 1.
Fig. 2 shows the roughness of the surface plotted as a function of time. The regular oscillations of roughness correspond to the corrosion and detachment of an entire layer of grains. The mechanism is detailed later on. Before detachment the roughness increases gradually to drop sharply at the time of detachment of a
layer of grains. Due to symmetry of the system, in the absence of
intragranular corrosion, detachment takes place simultaneously for ail grains across the metal surface. Once ail the grains in a layer detach, the layer becomes smooth again and the roughness is at its minimum. The roughness oscillations are similar for bath CP and BP geometries although they do not have exactly the same
magnitude. The maximum roughness for BP geometry is lower
3150
3125 r-�--===-
� 3100
5 3075
N
3050
3025
3(HI L..L��-'-��'--'-���L..L��-'-"---"-= 1()()(1 1025 1050 1075
L (lime �lep) l l(K)
Fig. 1. Corrosion height as a function of time and on the right a detail of the plot. Full black line is for the cube piling and red dashed line for the brick piling. (For interpretation of the references to colour in this figure legend, the reader is referred to the web version of the article.)
20
-;:'., l() lb
.'i
(10 1000 2000 3000 l (time �tep)
4000
20
I
I ,
,,'
1 / 1/
f ,
I
I I
./,,,.,,..,,..
I
1 ,
1 / I
, ,
I
I
I
,
, ,
1/1 /
, I
I
(1 ����������������� 1000 1050 1100 l 150 1200
t (lime �lep)
Fig. 2. Surface roughness as a function of time and on the right a detail of the plot. Full black line is for the cube piling and red dashed line for the brick piling. (For interpretation of the references to colour in this figure legend, the reader is referred to the web version of the article.)
--■■■■ --■■■■ --■■■■ ....__.___._____,____. ■■■■
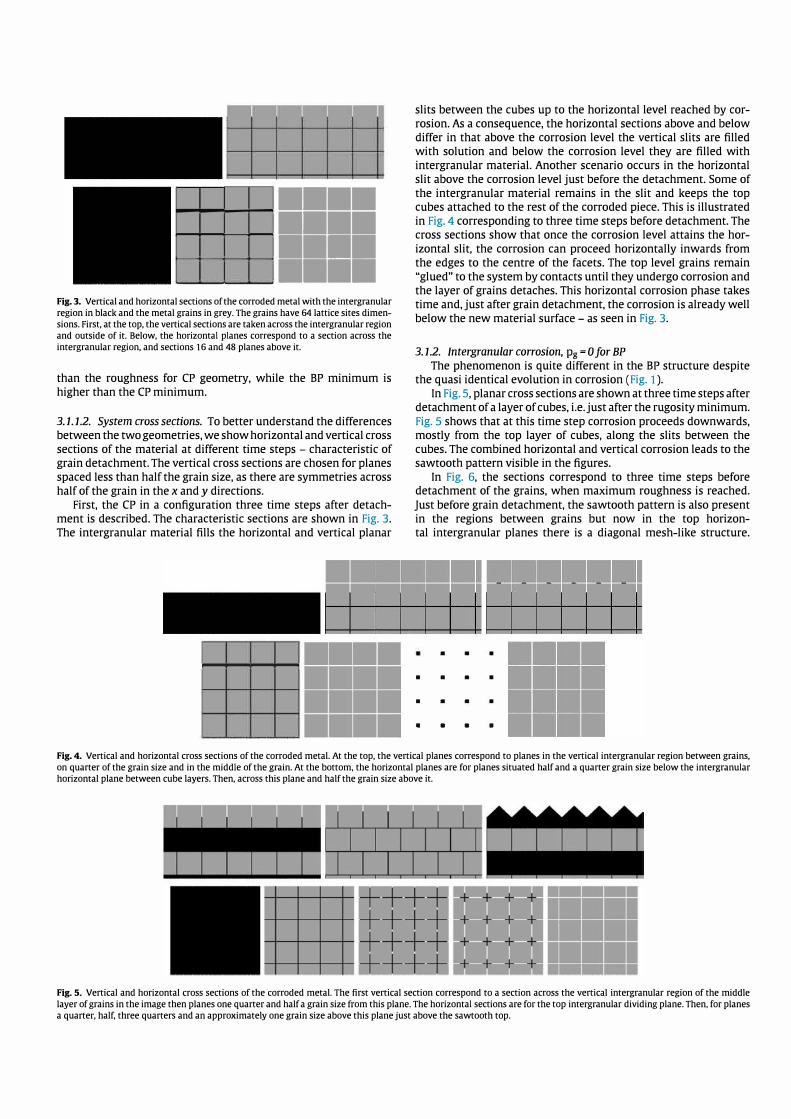
Fig. 3. Vertical and horizontal sections of the corroded metal with the intergranular
region in black and the metal grains in grey. The grains have 64 lattice sites dimen
sions. First, at the top, the vertical sections are taken across the intergranular region
and outside of it. Below, the horizontal planes correspond ta a section across the
intergranular region, and sections 16 and 48 planes above it.
than the roughness for CP geometry, while the BP minimum is
higher than the CP minimum.
3.1.1.2. System cross sections. To better understand the differences
between the two geometries, we show horizontal and vertical cross
sections of the material at different time steps - characteristic of
grain detachment. The vertical cross sections are chosen for planes
spaced Jess than half the grain size, as there are symmetries across
half of the grain in the x and y directions.
First, the CP in a configuration three time steps after detach
ment is described. The characteristic sections are shown in Fig. 3.
The intergranular material fills the horizontal and vertical planar
slits between the cubes up to the horizontal level reached by cor
rosion. As a consequence, the horizontal sections above and below
differ in that above the corrosion level the vertical slits are filled
with solution and below the corrosion level they are filled with
intergranular material. Another scenario occurs in the horizontal
slit above the corrosion level just before the detachment. Sorne of
the intergranular material remains in the slit and keeps the top
cubes attached to the rest of the corroded piece. This is illustrated
in Fig. 4 corresponding to three time steps before detachment. The
cross sections show that once the corrosion level attains the hor
izontal slit, the corrosion can proceed horizontally inwards from
the edges to the centre of the facets. The top level grains remain
"glued" to the system by contacts until they undergo corrosion and
the layer of grains detaches. This horizontal corrosion phase takes
time and, just after grain detachment, the corrosion is already well
below the new material surface - as seen in Fig. 3.
3.1.2. Intergranular corrosion, pg
= 0 for BP
The phenomenon is quite different in the BP structure despite
the quasi identical evolution in corrosion (Fig. 1 ).
In Fig. 5, planar cross sections are shown at three time steps after
detachment of a layer of cubes, i.e. just after the rugosity minimum.
Fig. 5 shows that at this time step corrosion proceeds downwards,
mostly from the top layer of cubes, along the slits between the
cubes. The combined horizontal and vertical corrosion leads to the
sawtooth pattern visible in the figures.
In Fig. 6, the sections correspond to three time steps before
detachment of the grains, when maximum roughness is reached.
Just before grain detachment, the sawtooth pattern is also present
in the regions between grains but now in the top horizon
tal intergranular planes there is a diagonal mesh-like structure.
�� ■■■■ • • •
• • • •
• • • •
• • • •
Fig. 4. Vertical and horizontal cross sections of the corroded metal. At the top, the vertical planes correspond ta planes in the vertical intergranular region between grains,
on quarter of the grain size and in the middle of the grain. At the bottom, the horizontal planes are for planes situated half and a quarter grain size below the intergranular
horizontal plane between cube layers. Then, across this plane and half the grain size above it.
Fig. 5. Vertical and horizontal cross sections of the corroded metal. The first vertical section correspond ta a section across the vertical intergranular region of the middle
layer of grains in the image then planes one quarter and half a grain size from this plane. The horizontal sections are for the top intergranular dividing plane. Then, for planes
a quarter, half, three quarters and an approximately one grain size above this plane just above the sawtooth top.
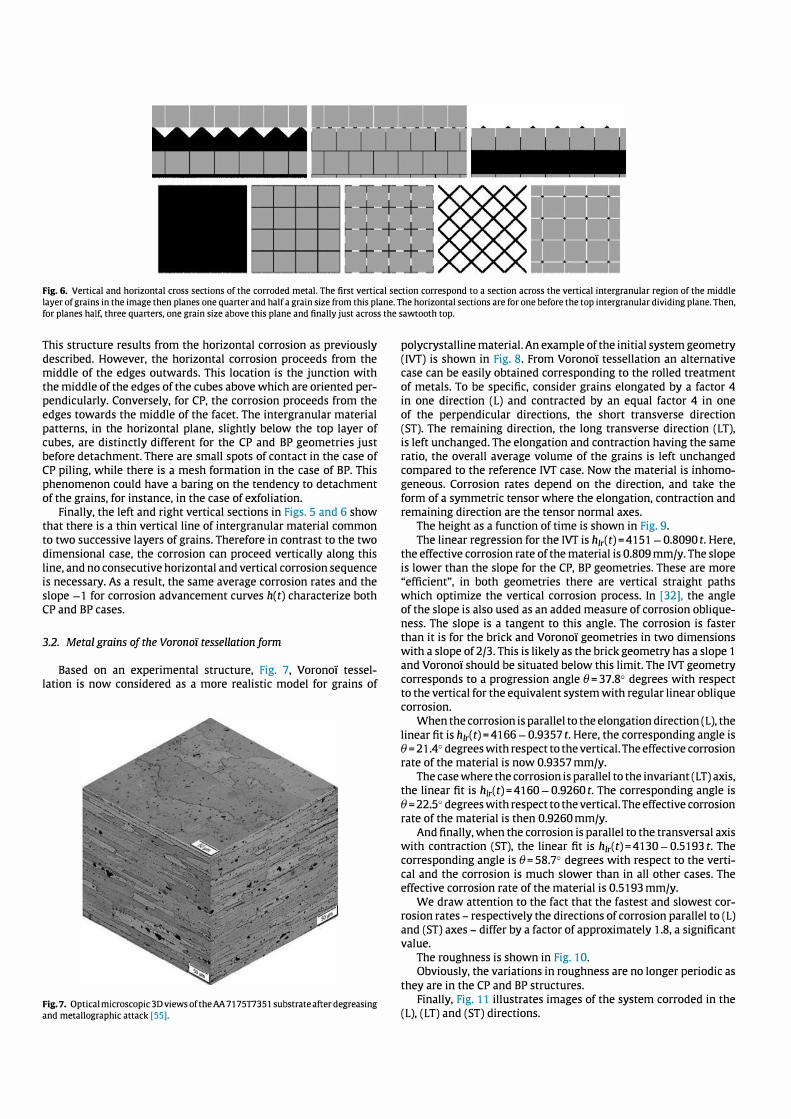
Fig. 6. Vertical and horizontal cross sections of the corroded metal. The first vertical section correspond to a section across the vertical intergranular region of the middle
layer of grains in the image then planes one quarter and half a grain size from this plane. The horizontal sections are for one before the top intergranular dividing plane. Then,
for planes half, three quarters, one grain size above this plane and finally just across the sawtooth top.
This structure results from the horizontal corrosion as previously
described. However, the horizontal corrosion proceeds from the
middle of the edges outwards. This location is the junction with
the middle of the edges of the cubes above which are oriented per
pendicularly. Conversely, for CP, the corrosion proceeds from the
edges towards the middle of the facet. The intergranular material
patterns, in the horizontal plane, slightly below the top layer of
cubes, are distinctly different for the CP and BP geometries just
before detachment. There are small spots of contact in the case of
CP piling, while there is a mesh formation in the case of BP. This
phenomenon could have a baring on the tendency to detachment
of the grains, for instance, in the case of exfoliation. Finally, the left and right vertical sections in Figs. 5 and 6 show
that there is a thin vertical line of intergranular material common
to two successive layers of grains. Therefore in contrast to the two
dimensional case, the corrosion can proceed vertically along this
line, and no consecutive horizontal and vertical corrosion sequence is necessary. As a result, the same average corrosion rates and the
slope -1 for corrosion advancement curves h(t) characterize bath
CP and BP cases.
3.2. Meta! grains of the Voronoï tessellation form
Based on an experimental structure, Fig. 7, Voronoï tessel
lation is now considered as a more realistic mode! for grains of
Fig. 7. Optical microscopic3D views of the M 7175T7351 substrate after degreasing
and metallographic attack [55].
polycrystalline material. An example of the initial system geometry
(IVT) is shown in Fig. 8. From Voronoï tessellation an alternative case can be easily obtained corresponding to the rolled treatment
of metals. To be specific, consider grains elongated by a factor 4
in one direction (L) and contracted by an equal factor 4 in one
of the perpendicular directions, the short transverse direction
(ST). The remaining direction, the long transverse direction (LT),
is left unchanged. The elongation and contraction having the same
ratio, the overall average volume of the grains is left unchanged compared to the reference IVT case. Now the material is inhomo
geneous. Corrosion rates depend on the direction, and take the
form of a symmetric tensor where the elongation, contraction and
remaining direction are the tensor normal axes. The height as a function of time is shown in Fig. 9.
The linear regression for the IVT is h1r(t) = 4151 -0.8090 t. Here,
the effective corrosion rate of the material is 0.809 mm/y. The slope
is lower than the slope for the CP, BP geometries. These are more
"efficient", in bath geometries there are vertical straight paths
which optimize the vertical corrosion process. In [32], the angle of the si ope is also used as an added measure of corrosion oblique
ness. The slope is a tangent to this angle. The corrosion is faster
than it is for the brick and Voronoï geometries in two dimensions
with a slope of 2/3. This is likely as the brick geometry has a slope 1
and Voronoï should be situated below this limit. The IVT geometry
corresponds to a progression angle 0=37.8° degrees with respect to the vertical for the equivalent system with regular linear oblique
corrosion.
When the corrosion is parallel to the elongation direction (L), the
linear fit is h1r(t) = 4166 -0.9357 t. Here, the corresponding angle is
0 = 21.4° degrees with respect to the vertical. The effective corrosion rate of the material is now 0.9357 mm/y.
The case where the corrosion is parallel to the invariant (LT) axis,
the linear fit is h1r(t)=4160-0.9260t. The corresponding angle is
0 = 22.5° degrees with respect to the vertical. The effective corrosion
rate of the material is then 0.9260 mm/y.
And finally, when the corrosion is parallel to the transversal axis with contraction (ST), the linear fit is h1r(t)=4130-0.5193t. The
corresponding angle is 0 = 58.7° degrees with respect to the verti
cal and the corrosion is much slower than in ail other cases. The
effective corrosion rate of the material is 0.5193 mm/y.
We draw attention to the fact that the fastest and slowest cor
rosion rates - respectively the directions of corrosion parallel to (L)
and (ST) axes - differ by a factor of approximately 1.8, a significant value.
The roughness is shown in Fig. 10. Obviously, the variations in roughness are no longer periodic as
they are in the CP and BP structures.
Finally, Fig. 11 illustrates images of the system corroded in the
(L), (LT) and (ST) directions.
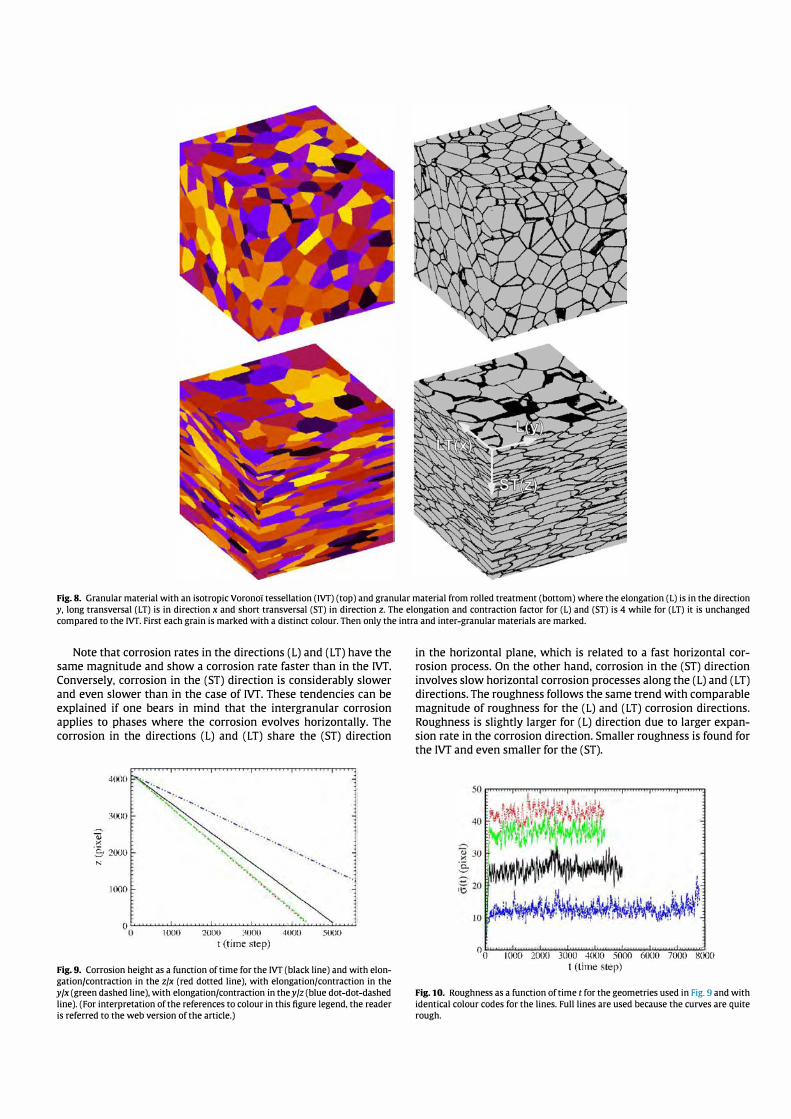
Fig. 8. Granular material with an isotropie Voronoï tessellation {!Vf) (top) and granular material from rolled treatment (bottom) where the elongation (L) is in the direction y, long transversal {LT) is in direction x and short transversal (ST) in direction z. The elongation and contraction factor for (L) and {ST) is 4 while for {LT) it is unchanged compared to the lVf. First each grain is marked with a distinct colour. Then only the intra and inter-granular materials are marked.
Note that corrosion rates in the directions (L) and (LT) have the
same magnitude and show a corrosion rate faster than in the IVT.
Conversely, corrosion in the (ST) direction is considerably slower
and even slower than in the case of IVT. These tendencies can be
explained if one bears in mind that the intergranular corrosion
applies to phases where the corrosion evolves horizontally. The
corrosion in the directions (L) and (LT) share the (ST) direction
-�
.; ><
4000
3000
b 2000 N
1000
o�������������������
1000 2001.1 :moo 41_100
t (time step) 51.100
Fig. 9. Corrosion height as a function of time for the lVf (black line) and with elongation/contraction in the z/x (red dotted line), with elongation/contraction in the y/x (green dashed line), with elongation/contraction in the y Jz (blue dot-dot-dashed line). (For interpretation of the references to colour in this figure legend, the reader is referred to the web version of the article.)
in the horizontal plane, which is related to a fast horizontal cor
rosion process. On the other hand, corrosion in the (ST) direction
involves slow horizontal corrosion processes along the (L) and (LT)
directions. The roughness follows the same trend with comparable
magnitude of roughness for the (L) and (LT) corrosion directions.
Roughness is slightly larger for (L) direction due to larger expan
sion rate in the corrosion direction. Smaller roughness is found for
the IVT and even smaller for the (ST).
O O ]()()() 2000 3000 4000 5000 6000 7000 8(K)() t (tirne step)
Fig. 10. Roughness as a function of time t for the geometries used in Fig. 9 and with identical colour codes for the lines. Full lines are used because the curves are quite rough.
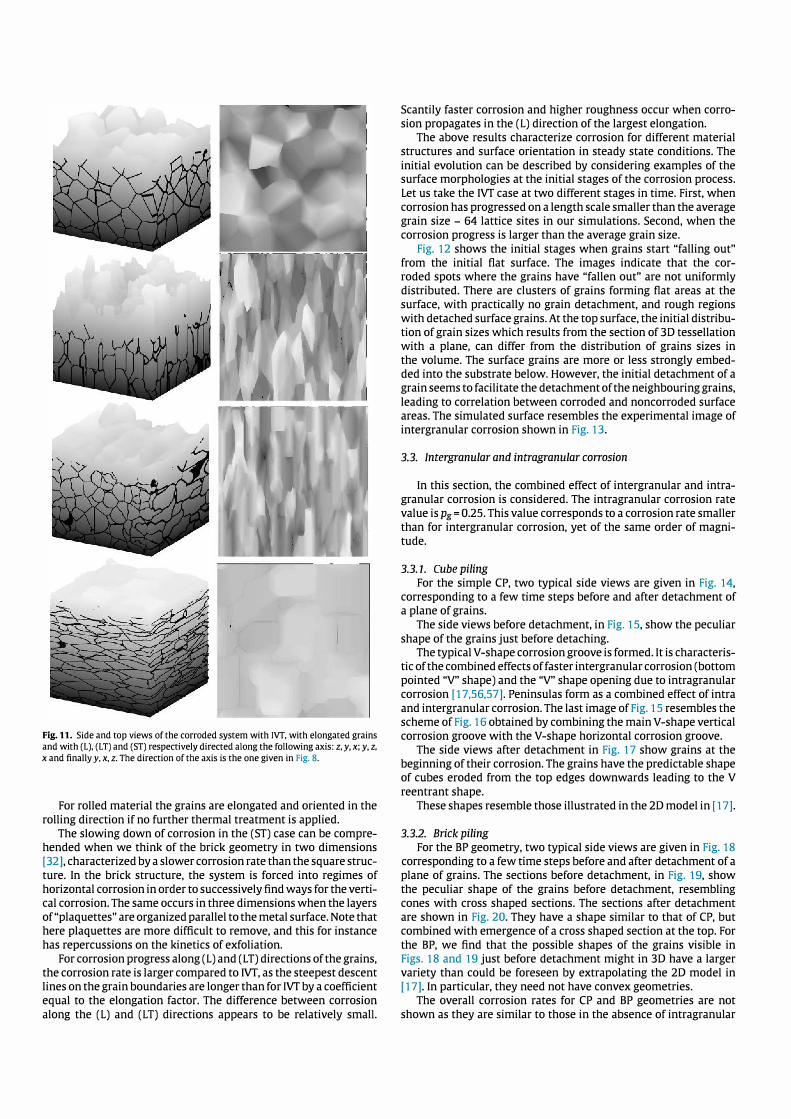
Fig. 11. Side and top views of the corroded system with !Vf, with elongated grains and with (L), (LT) and (ST) respectively directed along the following axis: z, y, x; y, z, x and finally y, x, z. The direction of the axis is the one given in Fig. 8.
For rolled material the grains are elongated and oriented in the
rolling direction if no further thermal treatment is a pp lied.
The slowing down of corrosion in the (ST) case can be compre
hended when we think of the brick geometry in two dimensions
[ 32 ], characterized by a slower corrosion rate than the square struc
ture. In the brick structure, the system is forced into regimes of
horizontal corrosion in order to successively find ways for the verti
cal corrosion. The same occurs in three dimensions when the layers
of"plaquettes" are organized parallel to the metal surface. Note that
here plaquettes are more difficult to remove, and this for instance
has repercussions on the kinetics of exfoliation.
For corrosion progress along (L) and (LT) directions of the grains,
the corrosion rate is Iarger compared to IVf, as the steepest descent
lines on the grain boundaries are longer than for !Vf by a coefficient
equal to the elongation factor. The difference between corrosion
along the (L) and (LT) directions appears to be relatively smalt.
Scantily faster corrosion and higher roughness occur when corro
sion propagates in the (L) direction of the Iargest elongation.
The above results characterize corrosion for different materiaI
structures and surface orientation in steady state conditions. The
initial evolution can be described by considering examples of the surface morphologies at the initial stages of the corrosion process.
Let us take the IVf case at two different stages in time. First, when
corrosion has progressed on a length scale smaller than the average
grain size - 64 Iattice sites in our simulations. Second, when the
corrosion progress is larger than the average grain size.
Fig. 12 shows the initial stages when grains start "falling out"
from the initial flat surface. The images indicate that the cor
roded spots where the grains have "fallen out" are not uniformly
distributed. There are clusters of grains forming flat areas at the
surface, with practically no grain detachment, and rough regions
with detached surface grains. At the top surface, the initial distribu
tion of grain sizes which results from the section of 3D tessellation
with a plane, can differ from the distribution of grains sizes in
the volume. The surface grains are more or Jess strongly embed
ded into the substrate below. However, the initial detachment of a
grain seems to facilita te the detachment of the neighbouring grains,
leading to correlation between corroded and noncorroded surface
areas. The simulated surface resembles the experimental image of
intergranular corrosion shown in Fig. 13.
3.3. lntergranular and intragranular corrosion
In this section, the combined effect of intergranular and intra
granular corrosion is considered. The intragranular corrosion rate
value is Pg
= 0.25. This value corresponds to a corrosion rate smaller
than for intergranular corrosion, yet of the same order of magni
tude.
3.3.1. Cube piling
For the simple CP, two typical side views are given in Fig. 14,
corresponding to a few time steps before and after detachment of
a plane of grains.
The side views before detachment, in Fig. 15, show the peculiar
shape of the grains just before detaching.
The typical V-shape corrosion groove is formed. It is characteris
tic of the combined effects of faster intergranular corrosion (bottom
pointed "V" shape) and the "V" shape opening due to intragranular
corrosion [17,56,57]. Peninsulas form as a combined effect of intra
and intergranular corrosion. The last image of Fig. 15 resembles the
scheme of Fig. 16 obtained by combining the main V-shape vertical
corrosion groove with the V-shape horizontal corrosion groove.
The side views after detachment in Fig. 17 show grains at the
beginning of their corrosion. The grains have the predictable shape
of cubes eroded from the top edges downwards Ieading to the V
reentrant shape.
These shapes resemble those illustrated in the 2D model in [ 17].
3.3.2. Brick piling
For the BP geometry, two typical side views are given in Fig. 18
corresponding to a few time steps before and after detachment of a
plane of grains. The sections before detachment, in Fig. 19, show
the peculiar shape of the grains before detachment, resembling
canes with cross shaped sections. The sections after detachment
are shown in Fig. 20. They have a shape similar to that of CP, but
combined with emergence of a cross shaped section at the top. For
the BP, we find that the possible shapes of the grains visible in
Figs. 18 and 19 just before detachment might in 3D have a larger
variety than could be foreseen by extrapolating the 2D mode) in
[17]. In particular, they need not have convex geometries.
The overall corrosion rates for CP and BP geometries are not
shown as they are similar to those in the absence of intragranular
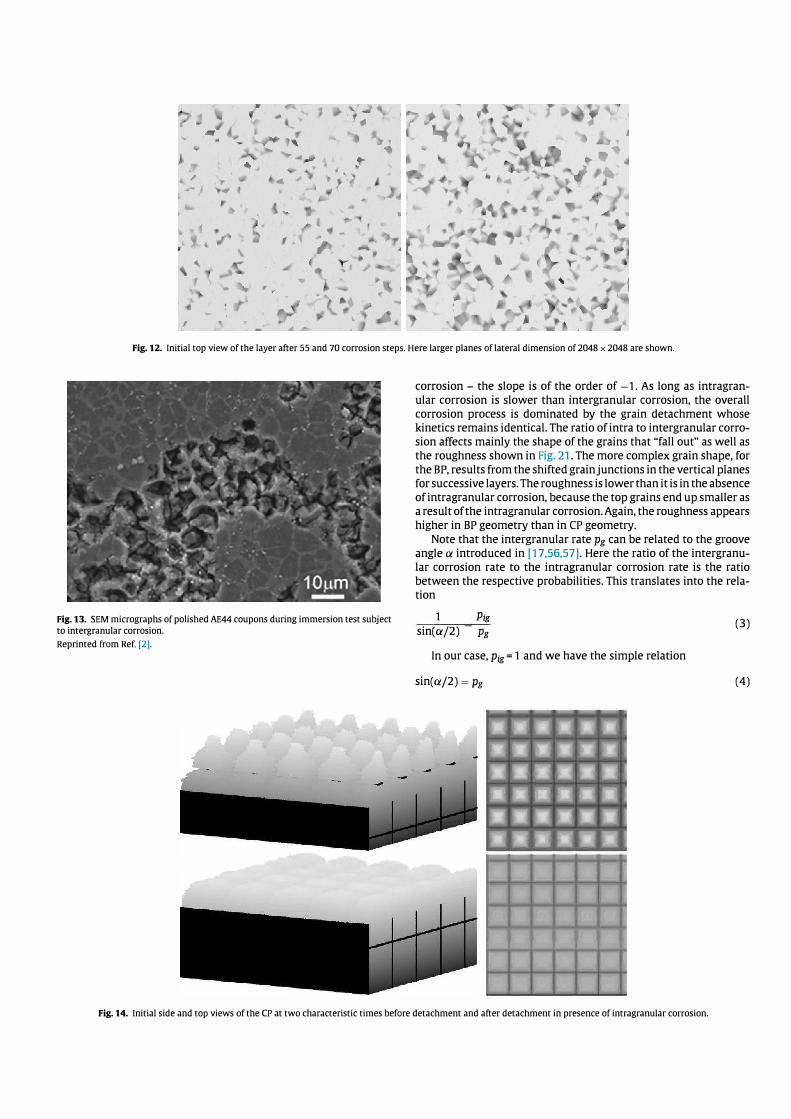
Fig. 12. Initial top view of the layer after 55 and 70 corrosion steps. Here larger planes oflateral dimension of2048 x 2048 are shown.
Fig. 13. SEM micrographs ofpolished AE44 coupons during immersion test subject
ta intergranular corrosion.
Reprinted from Ref. [2].
corrosion - the slope is of the order of -1. As long as intragranular corrosion is slower than intergranular corrosion, the overall corrosion process is dominated by the grain detachment whose kinetics remains identical. The ratio ofintra to intergranular corrosion affects mainly the shape of the grains that "fall out" as well as the roughness shown in Fig. 21. The more complex grain shape, for the BP, results from the shifted grainjunctions in the vertical planes for successive layers. The roughness is lower than it is in the absence ofintragranular corrosion, because the top grains end up smaller as a result of the intragranular corrosion.Again, the roughness appears higher in BP geometry than in CP geometry.
Note that the intergranular rate Pg can be related to the groove angle a introduced in [17,56,57]. Here the ratio of the intergranular corrosion rate to the intragranular corrosion rate is the ratio between the respective probabilities. This translates into the relation
1 Pig
sin(a/2) Pg
In our case, Pig = 1 and we have the simple relation
sin(a/2) = pg
- - .� - ·- �' '
- :',_ ,,,_ - ,, i_ - - - -
,,
Cl -, fJ
-, .'.] ,-, :__.J ''..-, �
- 1 ,, 1 ,',_, - -
., ' . � \ 1,,
(3)
(4)
Fig. 14. Initial side and top views of the CP at two characteristic times before detachment and after detachment in presence of intragranular corrosion.
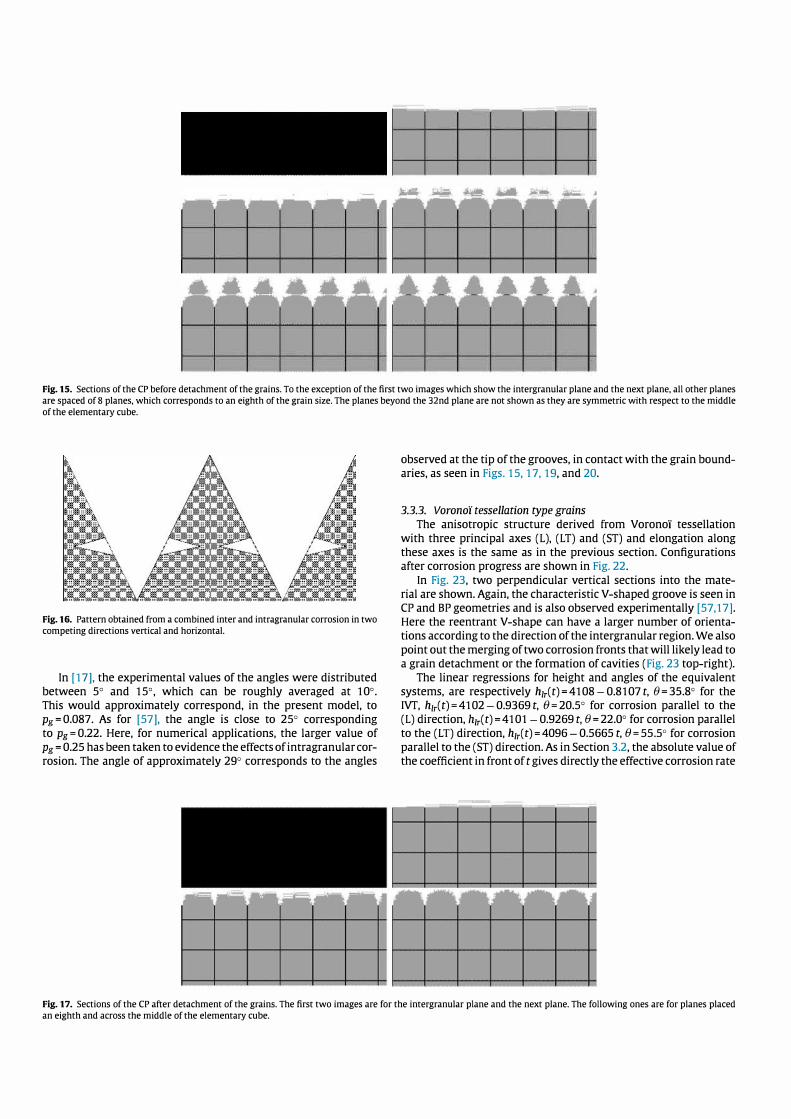
Fig. 15. Sections of the CP before detachment of the grains. To the exception of the first two images which show the intergranular plane and the next plane, ail other planes
are spaced of 8 planes, which corresponds to an eighth of the grain size. The planes beyond the 32nd plane are not shown as they are symmetric with respect to the middle
of the elementary cube.
Fig. 16. Pattern obtained from a combined inter and intragranular corrosion in two
competing directions vertical and horizontal.
In [ 17]. the experimentaI values of the angles were distributed
between 5° and 15° , which can be roughly averaged at 10° .
This would approximately correspond, in the present mode!, to
pg
= 0.087. As for [57]. the angle is close to 25° corresponding
to pg
= 0.22. Here, for numerical applications, the larger value of
Pg = 0.25 has been taken to evidence the effects ofintragranular cor
rosion. The angle of approximately 29° corresponds to the angles
observed at the tip of the grooves, in contact with the grain bound
aries, as seen in Figs. 15, 17, 19, and 20.
3.3.3. Voronoï tessellation type grains
The anisotropie structure derived from Voronoï tessellation
with three principal axes (L), (LT) and (ST) and elongation along
these axes is the same as in the previous section. Configurations
after corrosion progress are shown in Fig. 22.
In Fig. 23, two perpendicular vertical sections into the mate
rial are shown. Again, the characteristic V-shaped groove is seen in
CP and BP geometries and is also observed experimentally [57, 17].
Here the reentrant V-shape can have a larger number of orienta
tions according to the direction of the intergranular region. We also
point out the merging of two corrosion fronts that will likely lead to
a grain detachment or the formation of cavities (Fig. 23 top-right).
The linear regressions for height and angles of the equivalent
systems, are respectively h1r(t)= 4108-0.8107t, 0=35.8° for the
IVT, h 1r(t)= 4102-0.9369t, 0= 20.5° for corrosion parallel to the
(L) direction, h1r(t) = 4101 -0.9269 t, 0= 22.0° for corrosion parallel
to the (LT) direction, h1r(t) = 4096 -0.5665 t, 0 = 55.5° for corrosion
parallel to the (ST) direction. As in Section 3.2, the absolute value of
the coefficient in front of t gives directly the effective corrosion rate
Fig. 17. Sections of the CP after detachment of the grains. The first two images are for the intergranular plane and the next plane. The following ones are for planes placed
an eighth and across the middle of the elementary cube.
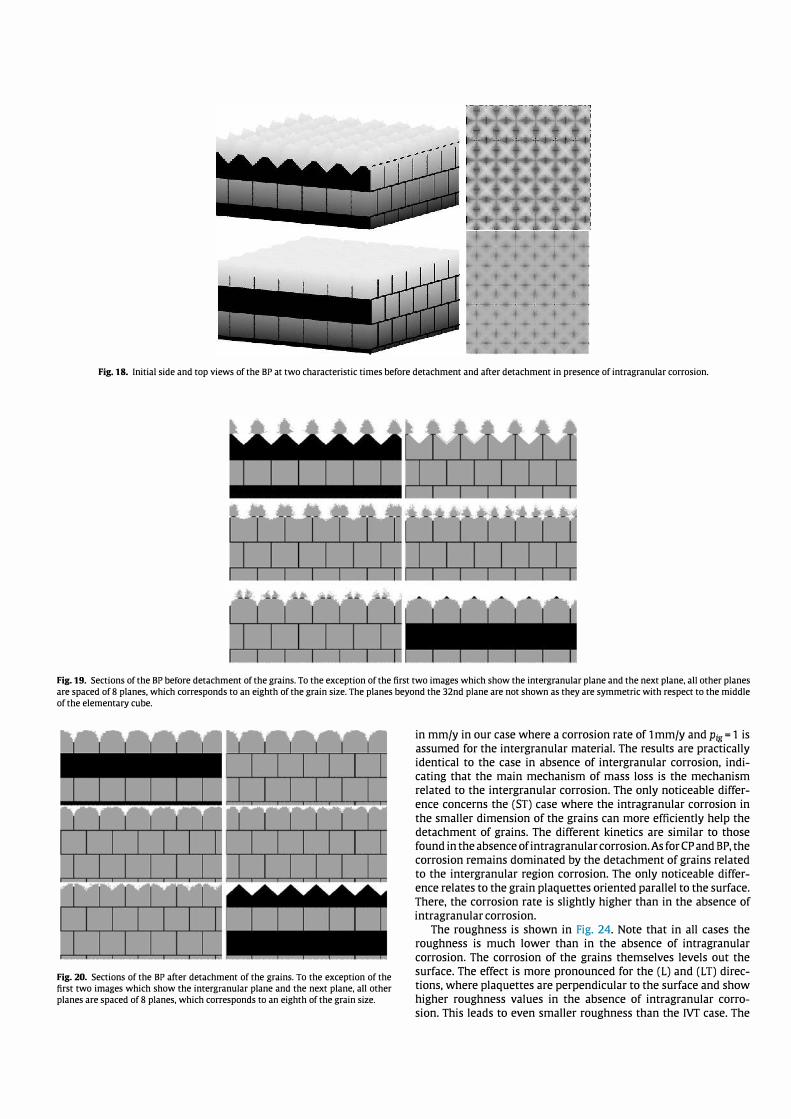
Fig. 18. Initial side and top views of the BP at two characteristic times before detachment and after detachment in presence of intragranular corrosion.
Fig. 19. Sections of the BP before detachment of the grains. To the exception of the first two images which show the intergranular plane and the next plane, ail other planes
are spaced of 8 planes, which corresponds to an eighth of the grain size. The planes beyond the 32nd plane are not shown as they are symmetric with respect to the middle
of the elementary cube.
Fig. 20. Sections of the BP after detachment of the grains. To the exception of the
first two images which show the intergranular plane and the next plane, ail other
planes are spaced of 8 planes, which corresponds to an eighth of the grain size.
in mm/y in our case where a corrosion rate of 1 mm/y and Pig = 1 is
assumed for the intergranular material. The results are practically
identical to the case in absence of intergranular corrosion, indi
cating that the main mechanism of mass Joss is the mechanism
related to the intergranular corrosion. The only noticeable differ
ence concerns the (ST) case where the intragranular corrosion in
the smaller dimension of the grains can more efficiently help the
detachment of grains. The different kinetics are similar to those
found in the absence of intragranular corrosion. As for CP and BP, the
corrosion remains dominated by the detachment of grains related
to the intergranular region corrosion. The only noticeable differ
ence relates to the grain plaquettes oriented parallel to the surface.
There, the corrosion rate is slightly higher than in the absence of
intragranular corrosion.
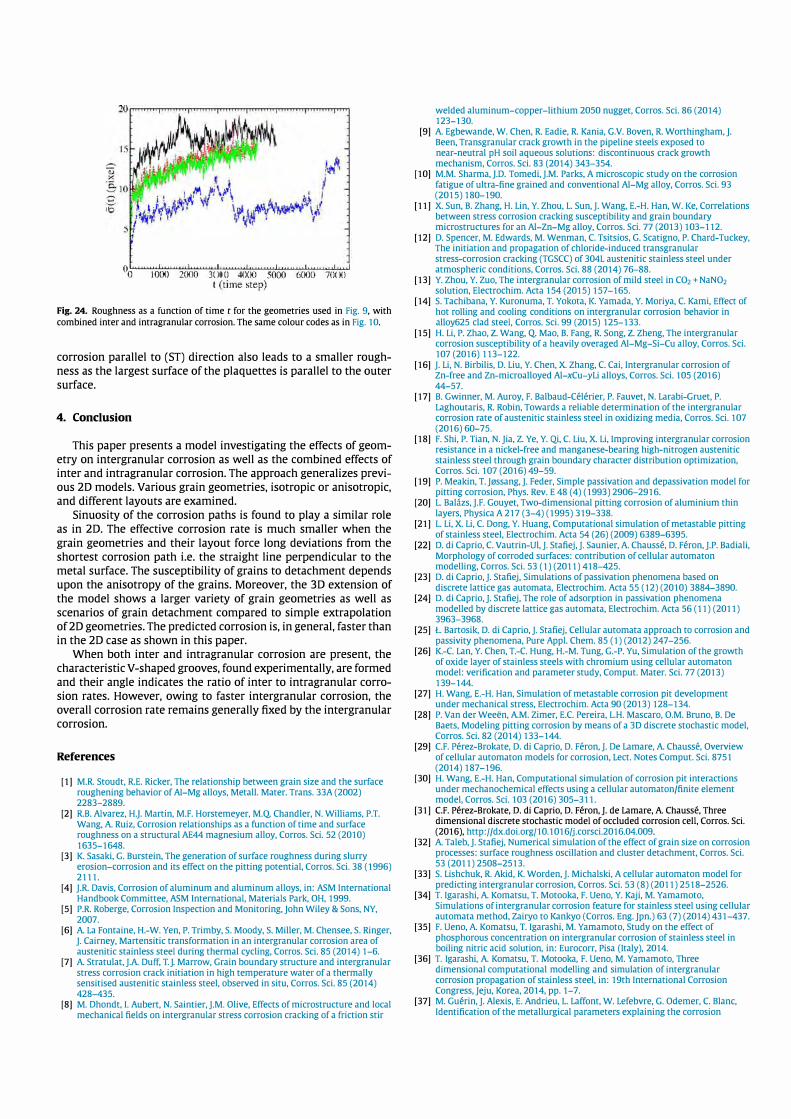
The roughness is shown in Fig. 24. Note that in ail cases the
roughness is much lower than in the absence of intragranular
corrosion. The corrosion of the grains themselves levels out the
surface. The effect is more pronounced for the (L) and (LT) direc
tions, where plaquettes are perpendicular to the surface and show
higher roughness values in the absence of intragranular corro
sion. This leads to even smaller roughness than the IVT case. The
0
() 2000 3000 t (Lime Slep)
20
0
1000 1050
1 , ,,
1 l(X)
/
L (lime Slep)
,' ,
' ,
,'
' ,
1150
I ,
1 , 1.-'
, 1
1200
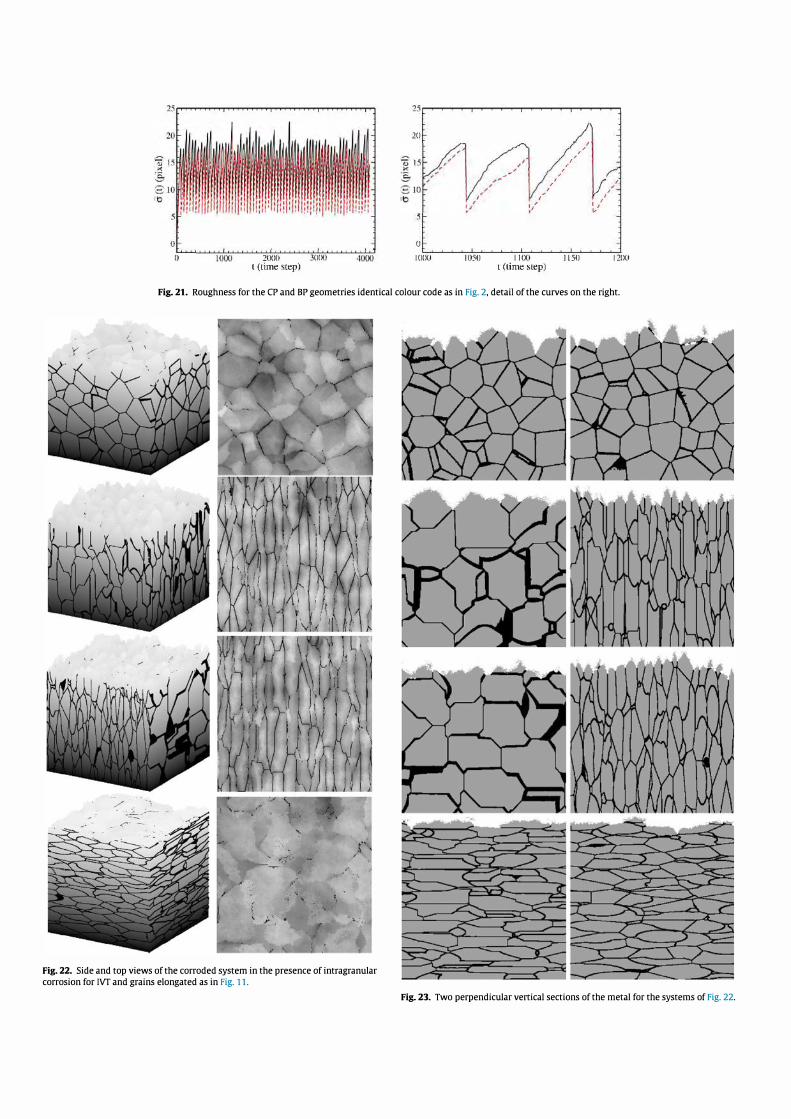
Fig. 21. Roughness for the CP and BP geometries identical colour code as in Fig. 2, detail of the curves on the right.
Fig. 22. Side and top views of the corroded system in the presence of intragranular
corrosion for IVf and grains elongated as in Fig. 11.
Fig. 23. Two perpendicular vertical sections of the metal for the systems of Fig. 22.
o(."-) ��l(..,.)()(�
)�2�
(,i....)()
0�3..J()(w
)ü��
4(,L)()()��5�0
L..
00��600
.L....0�7�0
L.()()
...J
t (time step)
Fig. 24. Roughness as a function of time t for the geometries used in Fig. 9, with combined inter and intragranular corrosion. The same colour codes as in Fig. 10.
corrosion parallel to (ST) direction also leads to a smaller rough
ness as the largest surface of the plaquettes is parallel to the outer
surface.
4. Conclusion
This paper presents a mode! investigating the effects of geom
etry on intergranular corrosion as well as the combined effects of
inter and intragranular corrosion. The approach generalizes previ
ous 2D models. Various grain geometries, isotropie or anisotropie,
and different layouts are examined.
Sinuosity of the corrosion paths is found to play a similar role
as in 2D. The effective corrosion rate is much smaller when the
grain geometries and their layout force long deviations from the
shortest corrosion path i.e. the straight line perpendicular to the
metal surface. The susceptibility of grains to detachment depends
upon the anisotropy of the grains. Moreover, the 3D extension of
the mode! shows a larger variety of grain geometries as well as
scenarios of grain detachment compared to simple extrapolation
of 2D geometries. The predicted corrosion is, in general, faster than
in the 2D case as shown in this paper.
When both inter and intragranular corrosion are present, the
characteristic V-shaped grooves, found experimentally, are formed
and their angle indicates the ratio of inter to intragranular corro
sion rates. However, owing to faster intergranular corrosion, the
overall corrosion rate remains generally fixed by the intergranular
corrosion.
References
[1] M.R. Stoudt, R.E. Ricker, The relationship between grain size and the surface roughening behavior of Al-Mg alloys, Metall. Mater. Trans. 33A (2002) 2283-2889.
[2] R.B. Alvarez, H.j. Martin, M.F. Horstemeyer, M.Q. Chandler, N. Williams, P.T. Wang, A. Ruiz, Corrosion relationships as a function of time and surface roughness on a structural AE44 magnesium alloy, Carros. Sei. 52 (2010) 1635-1648.
[3] K. Sasaki, G. Burstein, The generation of surface roughness during slurry erosion-corrosion and its effect on the pitting potential, Carros. Sei. 38 ( 1996) 2111.
[4] J.R. Davis, Corrosion of aluminum and aluminum alloys, in: ASM International Handbook Committee, ASM International, Materials Park, OH, 1999.
[ 5] P.R. Ra berge, Corrosion Inspection and Monitoring, John Wiley & Sons, NY, 2007.
[6] A. La Fontaine, H.-W. Yen, P. Trimby, S. Moody, S. Miller, M. Chensee, S. Ringer, J. Cairney, Martensitic transformation in an intergranular corrosion area of austenitic stainless steel during thermal cycling, Carros. Sei. 85 (2014) 1-6.
[7] A. Stratulat, J.A. Duff, T.J. Marrow, Grain boundary structure and intergranular stress corrosion crack initiation in high temperature water of a thermally sensitised austenitic stainless steel, observed in situ, Carros. Sei. 85 (2014) 428-435.
[8] M. Dhondt, I. Aubert, N. Saintier,J.M. Olive, Effects of microstructure and local mechanical fields on intergranular stress corrosion cracking of a friction stir
welded aluminum-copper-Iithium 2050 nugget, Carros. Sei. 86 (2014) 123-130.
[9] A. Egbewande, W. Chen, R. Eadie, R. Kania, G.V. Boven, R. Worthingham,J. Been, Transgranular crack growth in the pipeline steels exposed ta near-neutral pH soit aqueous solutions: discontinuous crack growth mechanism, Carros. Sei. 83 (2014) 343-354.
[10] M.M. Sharma,j.D. Tomedi,J.M. Parks, A microscopie study on the corrosion fatigue of ultra-fine grained and conventional Al-Mg alloy, Carros. Sei. 93
(2015) 180-190. [11] X. Sun, B. Zhang, H. Lin, Y. Zhou, L. Sun, J. Wang, E.-H. Han, W. I<e, Correlations
between stress corrosion cracking susceptibility and grain boundary microstructures for an Al-Zn-Mg alloy, Carros. Sei. 77 (2013) 103-112.
[12] D. Spencer, M. Edwards, M. Wenman, C. Tsitsios, G. Scatigno, P. Chard-Tuckey, The initiation and propagation of chloride-induced transgranular stress-corrosion cracking (TGSCC) of 304L austenitic stainless steel under atmospheric conditions, Carros. Sei. 88 (2014) 76-88.
[13] Y. Zhou, Y. Zuo, The intergranular corrosion of mild steel in C02 + NaN02
solution, Electrochim. Acta 154 (2015) 157-165. [14] S. Tachibana, Y. Kuronuma, T. Yokota, K. Yamada, Y. Moriya, C. Kami, Effect of
hot rolling and cooling conditions on intergranular corrosion behavior in alloy625 clad steel, Carros. Sei. 99 (2015) 125-133.
[ 15] H. Li, P. Zhao, z. Wang, Q, Mao, B. Fang, R. Song, z. Zheng, The intergranular corrosion susceptibility of a heavily overaged Al-Mg-Si-Cu alloy, Carros. Sei. 107 (2016) 113-122.
[16] J. Li, N. Birbilis, D. Liu, Y. Chen, X. Zhang, C. Cai, Intergranular corrosion of Zn-free and Zn-microalloyed Al-xCu-yLi alloys, Carros. Sei. 105 (2016) 44-57.
[17] B. Gwinner, M. Auray, F. Balbaud-Célérier, P. Fauvet, N. Larabi-Gruet, P. Laghoutaris, R. Robin, Towards a reliable determination of the intergranular corrosion rate of austenitic stainless steel in oxidizing media, Carros. Sei. 107 (2016) 60-75.
[18] F. Shi, P. Tian, N. Jia, Z. Ye, Y. Qi, C. Liu, X. Li, Improving intergranular corrosion resistance in a nickel-free and manganese-bearing high-nitrogen austenitic stainless steel through grain boundary character distribution optimization, Carros. Sei. 107 (2016) 49-59.
[19] P. Meakin, T.J0ssang,J. Feder, Simple passivation and depassivation mode! for pitting corrosion, Phys. Rev. E 48 (4) (1993) 2906-2916.
[20] L. Balazs, J.F. Gouyet, Two-dimensional pitting corrosion of aluminium thin layers, Physica A 217 (3-4) (1995) 319-338.
[21] L. Li, X. Li, C. Dong, Y. Huang, Computational simulation of metastable pitting of stainless steel, Electrochim. Acta 54 (26) (2009) 6389-6395.
[22] D. di Ca pria, C. Vautrin-Ul, J. Stafiej, J. Saunier, A. Chaussé, D. Féron,J.P. Badiali, Morphology of corroded surfaces: contribution of cellular automaton modelling, Carros. Sei. 53 (1) (2011) 418-425.
[23] D. di Caprio, J. Stafiej, Simulations of passivation phenomena based on discrete lattice gas automata, Electrochim. Acta 55 (12) (2010) 3884-3890.
[24] D. di Caprio, J. Stafiej, The raie of adsorption in passivation phenomena modelled by discrete lattice gas automata, Electrochim. Acta 56 (11) (2011) 3963-3968.
[25] L Bartosik, D. di Caprio,J. Stafiej, Cellular automata approach ta corrosion and passivity phenomena, Pure Appl. Chem. 85 (1) (2012) 247-256.
[26] K.-C. Lan, Y. Chen, T.-C. Hung, H.-M. Tung, G.-P. Yu, Simulation of the growth of oxide layer of stainless steels with chromium using cellular automaton mode!: verification and parameter study, Comput. Mater. Sei. 77 (2013) 139-144.
[27] H. Wang, E.-H. Han, Simulation of metastable corrosion pit development under mechanical stress, Electrochim. Acta 90 (2013) 128-134.
[28] P. Van der Weeën, A.M. Zimer, E.C. Pereira, L.H. Mascara, O.M. Bruno, B. De Baets, Modeling pitting corrosion by means of a 3D discrete stochastic mode!, Carros. Sei. 82 (2014) 133-144.
[29] C.F. Pérez-Brokate, D. di Ca pria, D. Féron, J. De Lamare, A. Chaussé, Overview of cellular automaton models for corrosion, Lect. Notes Comput. Sei. 8751 (2014) 187-196.
[30] H. Wang, E.-H. Han, Computational simulation of corrosion pit interactions under mechanochemical effects using a cellular automaton/finite element mode!, Carros. Sei. 103 (2016) 305-311.
[31] C.F. Pérez-Brokate, D. di Ca pria, D. Féron, J. de Lamare, A. Chaussé, Three dimensional discrete stochastic mode! of occluded corrosion cell, Carros. Sei. (2016), http: / /dx.doi.org/10.1016/j.corsci.2016.04.009.
[32] A. Taleb,J. Stafiej, Numerical simulation of the effect of grain size on corrosion processes: surface roughness oscillation and cluster detachment, Carros. Sei. 53(2011) 2508-2513.
[33] S. Lishchuk, R. Akid, K. Worden, J. Michalski, A cellular automaton mode! for predicting intergranular corrosion, Carros. Sei. 53 (8) (2011) 2518-2526.
[34] T. Igarashi, A. Komatsu, T. Motooka, F. Ueno, Y. Kaji, M. Yamamoto, Simulations of intergranular corrosion feature for stainless steel using cellular automata method, Zairyo ta Kankyo (Carros. Eng.Jpn.) 63 (7) (2014) 431-437.
[35] F. Ueno, A. Komatsu, T. Igarashi, M. Yamamoto, Study on the effect of phosphorous concentration on intergranular corrosion of stainless steel in boiling nitric acid solution, in: Eurocorr, Pisa (Italy), 2014.
[36] T. Igarashi, A. Komatsu, T. Motooka, F. Ueno, M. Yamamoto, Three dimensional computational modelling and simulation of intergranular corrosion propagation of stainless steel, in: 19th International Corrosion Congress,Jeju, Korea, 2014, pp. 1-7.
[37] M. Guérin,J. Alexis, E. Andrieu, L. Laffont, W. Lefebvre, G. Odemer, C. Blanc, Identification of the metallurgical parameters explaining the corrosion
susceptibility in a 2050 aluminium alloy, Corros. Sei. 102 (2016) 291-300.
[38] C. Vautrin-Ul, A. Taleb,J. Stafiej, A. Chaussé,J. Badiali, Mesoscopic modelling of corrosion phenomena: coupling between electrochemical and mechanical pro cesses, analysis of the deviation from the faraday law, Electrochim. Acta 52 (2007) 5368-5376.
[39] H. Grabke, Grain boundary segregation of impurities in iron and steels and effects on steel properties, in: C. Briant (Ed.), Impurities in Engineering Materials, Marcel Dekker Inc., New York, 1999, pp. 143-192.
[40] C. Briant, The effect of grain boundary segregation on intergranular failures, in: C. Briant (Ed.), Impurities in Engineering Materials, Marcel Dekker Inc., New York, 1999, pp. 193-224.
[41] C. Vargel, Chapter B.2 - types of corrosion on aluminium, in: C. Vargel (Ed.), Corrosion of Aluminium, Elsevier, Amsterdam, 2004, pp. 113-146.
[42] J.K. Kim, Y.H. Kim,J,S. Lee, K.Y. Kim, Effect ofchromium content on intergranular corrosion and precipitation ofTi-stabilized ferritic stainless steels, Corros. Sei. 52 (5) (2010) 1847-1852.
[43] 5.-X. Li, Y.-N. He, 5.-R. Yu, P.-Y. Zhang, Evaluation of the effect of grain size on chromium carbide precipitation and intergranular corrosion of316L stainless steel, Corros. Sei. 66 (2013) 211-216.
[ 44] B.S. Kumar, B.S. Prasad, V. Kain, J. Reddy, Methods for making alloy 600 resistant to sensitization and intergranular corrosion, Corros. Sei. 70 (2013) 55-61.
[45] P. Lejcek, Grain Boundary Segregation in Metals Springer Series in Materials Science, vol. 136, 1st edition, Springer-Verlag Berlin Heidelberg, 2010.
[46] H.-J. Kim, 5.-H. Jeon, 5.-T. Kim, 1.-5. Lee, Y.-5. Park, K.-T. Kim, Y.-5. Kim, Investigation of the sensitization and intergranular corrosion of tube-to-tubesheet welds of hyper duplex stainless steel using an electrochemical reactivation method, Corros. Sei. 87 (2014) 60-70.
[47] 5.-H. Jeon, D.H. Hur, H.-J. Kim, Y.-5. Park, Effect of Ce addition on the precipitation of deleterious phases and the associated intergranular corrosion resistance of27Cr-7Ni hyper duplex stainless steels, Corros. Sei. 90 (2015) 313-322.
[48] P.-J, Cunat, Aciers inoxydables critères de choix et structure, Techniques de l'ingénieur: Aciers inoxydables, aciers réfractaires et aciers résistant au fluage M4540 (2000) 1-17.
[49] M.P. Seah, Grain boundary segregation,J. Phys. F: Met. Phys. 10 (6) (1980) 1043.
[50] F. Christien, R.L. Gall, G. Saindrenan, Phosphorus grain boundary segregation in steel 17-4 PH, Ser. Mater. 48 (1) (2003), 11-16, 301-306.
[51] M. Lucas, J. Stafiej, C. Slim, S. Delpech, D. di Caprio, Cellular automata modeling of scanning electrochemical microscopy (SECM) experiments, Electrochim. Acta 145 (2014) 314-318.
[52] C.F. Pérez-Brokate, D. di Caprio, E. Mahé, D. Féron, J. de Lamare, Cyclic voltammetry simulations with cellular automata, J. Comput. Sei. 11 (2015) 269-278.
[53] S.H. Whang (Ed.), Nanostructured Metals and Alloys, Woodhead Publishing Series in Metals and Surface Engineering, Woodhead Publishing, 2011.
[ 54] W. Tian, S. Li, X. Chen, J. Liu, M. Yu, Intergranular corrosion of spark plasma sintering assembled bimodal grain sized M7075 aluminum alloys, Corros. Sei. 107 (2016) 211-224.
[55] Y. Goueffon, L. Arurault, C. Mabru, C. Tonon, P. Guigue, Black anodic coatings for space applications: study of the process parameters, characteristics and mechanical properties,J. Mater. Process. Technol. 209 (2009) 5145-5151.
[56] L. Beaunier, M. Froment, C. Vignaud, A kinetical mode! for the electrochemical grooving of grain boundaries, Electrochim. Acta 25 ( 10) ( 1980) 1239-1246.
[57] V. Bague, S. Chachoua, Q.T. Tran, P. Fauvet, Determination of the long-term intergranular corrosion rate of stainless steel in concentrated nitric acid, J.Nucl. Mater. 392 (2009) 396-404.