Embed Size (px)
Citation preview
8/6/2019 3a-Montecarlo Simulation Concepts 2
http://slidepdf.com/reader/full/3a-montecarlo-simulation-concepts-2 1/21
ASST – 8588 (Decision Making Under Risk)
Topic 3a : Montecarlo Simulation (1)
8/6/2019 3a-Montecarlo Simulation Concepts 2
http://slidepdf.com/reader/full/3a-montecarlo-simulation-concepts-2 2/21
How does Montecarlo Simulation work?
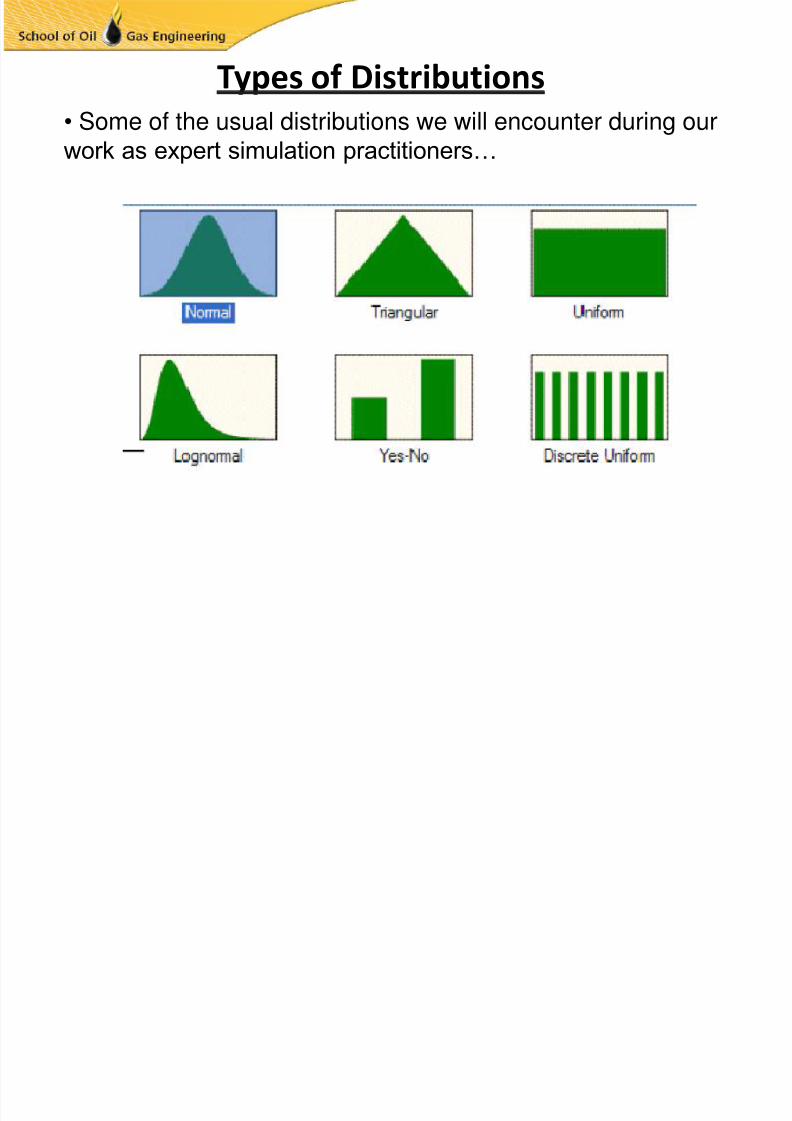
• It relies on the use of probability distributions of input
variables to represent their uncertainty
• Recalculates a deterministic model many times, combiningthe input variables for each iteration by means of random
sampling
• Results for key nominated variables (analytical concerns)are recorded for each pass and reported as an output
probability distribution
8/6/2019 3a-Montecarlo Simulation Concepts 2
http://slidepdf.com/reader/full/3a-montecarlo-simulation-concepts-2 3/21
8/6/2019 3a-Montecarlo Simulation Concepts 2
http://slidepdf.com/reader/full/3a-montecarlo-simulation-concepts-2 4/21
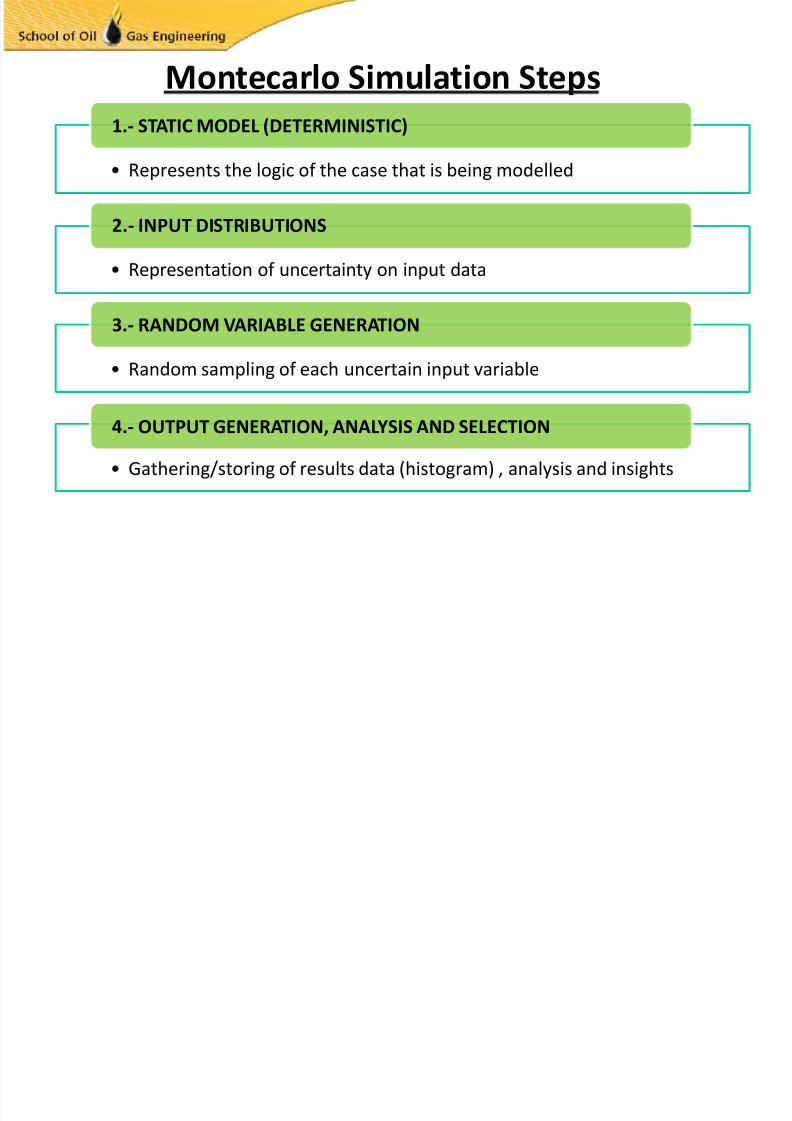
Montecarlo Simulation Steps
• Represents the logic of the case that is being modelled
1.- STATIC MODEL (DETERMINISTIC)
• Representation of uncertainty on input data
2.- INPUT DISTRIBUTIONS
• Random sampling of each uncertain input variable
3.- RANDOM VARIABLE GENERATION
• Gathering/storing of results data (histogram) , analysis and insights
4.- OUTPUT GENERATION, ANALYSIS AND SELECTION
8/6/2019 3a-Montecarlo Simulation Concepts 2
http://slidepdf.com/reader/full/3a-montecarlo-simulation-concepts-2 5/21
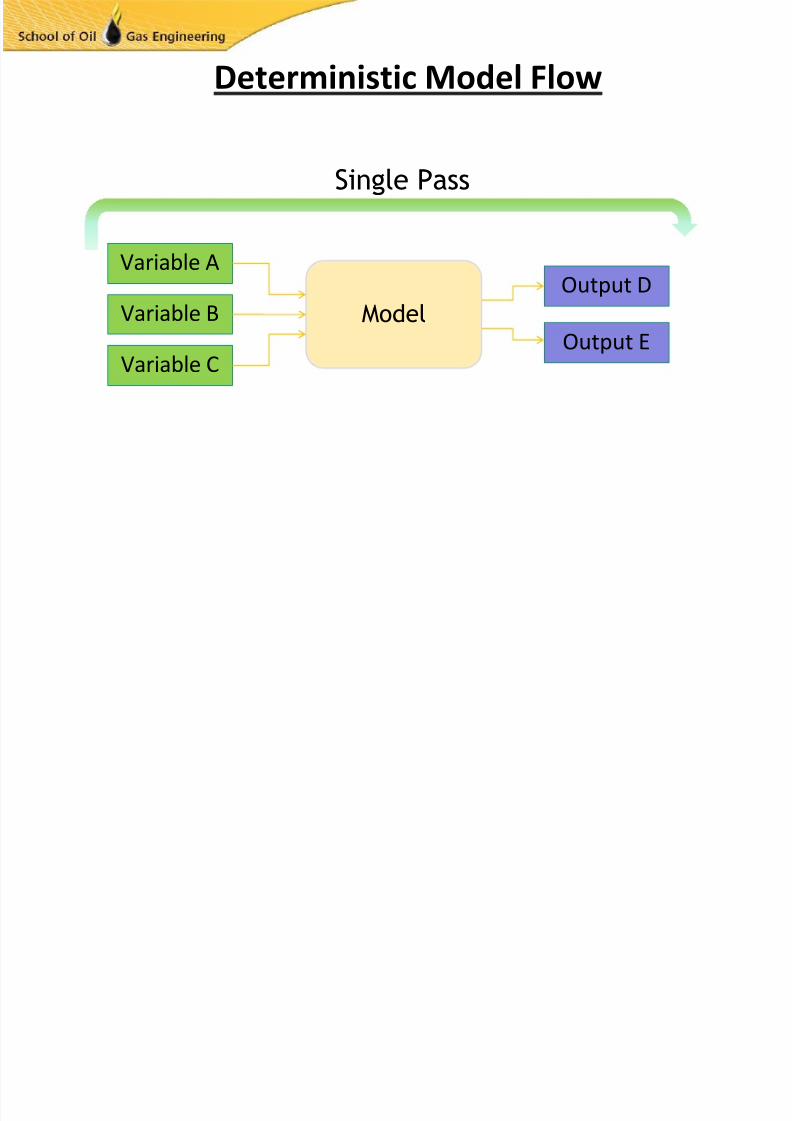
Deterministic Model Flow
Model
Variable A
Variable C
Variable BOutput D
Output E
Single Pass
8/6/2019 3a-Montecarlo Simulation Concepts 2
http://slidepdf.com/reader/full/3a-montecarlo-simulation-concepts-2 6/21
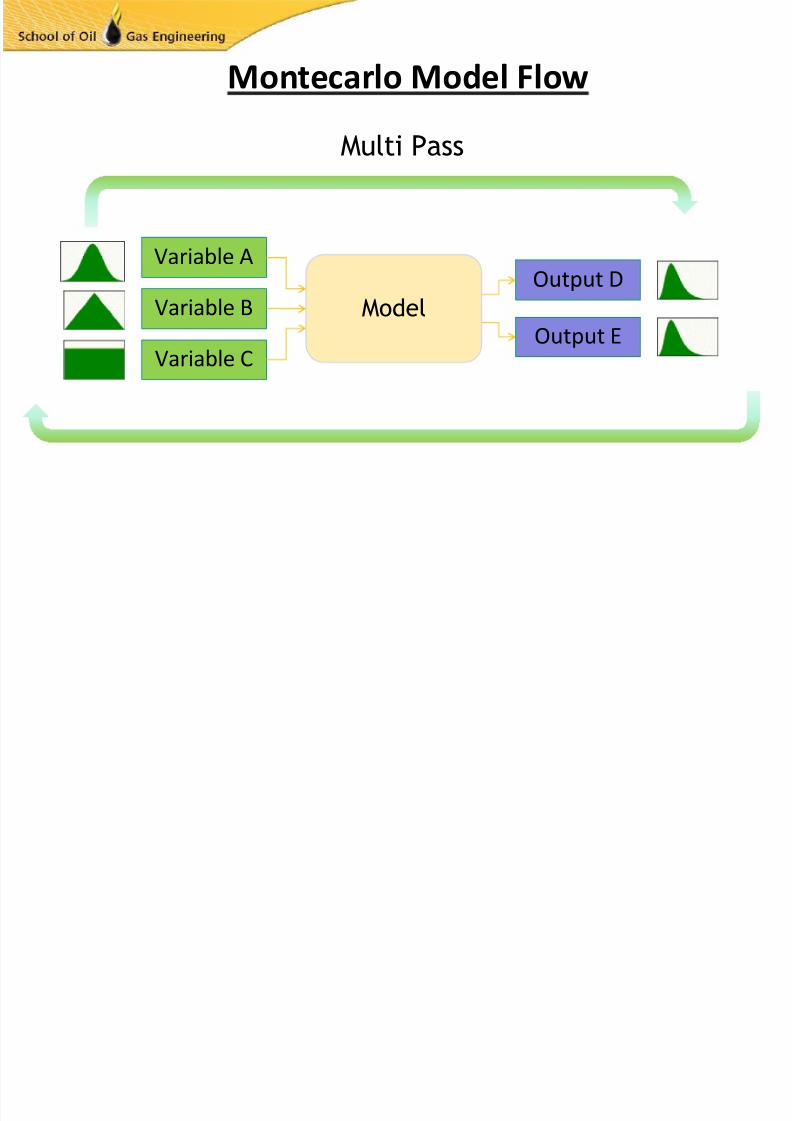
Montecarlo Model Flow
Model
Variable A
Variable C
Variable BOutput D
Output E
Multi Pass
8/6/2019 3a-Montecarlo Simulation Concepts 2
http://slidepdf.com/reader/full/3a-montecarlo-simulation-concepts-2 7/21
8/6/2019 3a-Montecarlo Simulation Concepts 2
http://slidepdf.com/reader/full/3a-montecarlo-simulation-concepts-2 8/21
Benefits of Montecarlo over Other Techniques• No meaningful increase in model logic complexity although
complex mathematics can be accommodated if required
• The computer does all the work in calculating outputdistributions
• Montecarlo method is now widely used and understood inthe industry, therefore its results accepted with ease
• It is easy to perform changes to the calculation models
• Correlation and interdependency between variables can be
implemented• A wide variety of professional and public domain software isavailable for users at all levels
8/6/2019 3a-Montecarlo Simulation Concepts 2
http://slidepdf.com/reader/full/3a-montecarlo-simulation-concepts-2 9/21
What is Random Sampling?
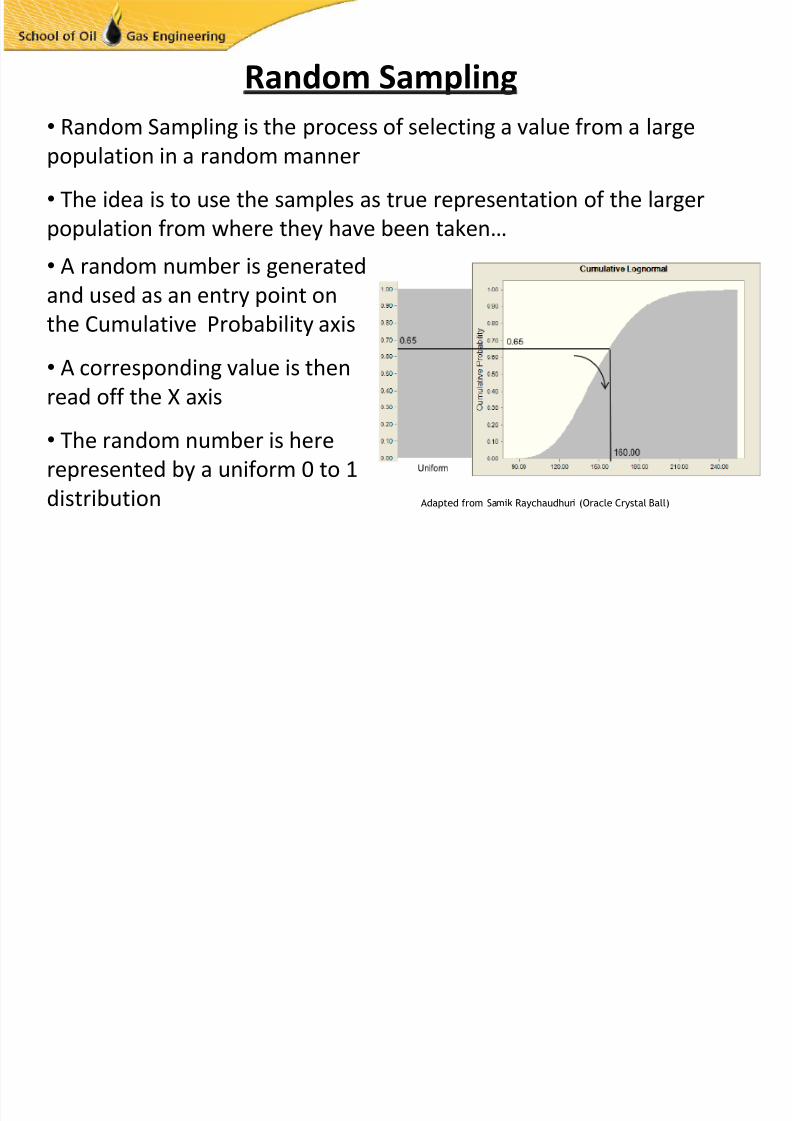
• It is the random selection of hundreds or thousands of
values from a distributed sample of those values• The sampling is performed in such a manner that when
performed a large enough number of times, reproduces the
original distribution’s shape
• The distribution of the values calculated therefore reflects
the probability of the values that could occur
8/6/2019 3a-Montecarlo Simulation Concepts 2
http://slidepdf.com/reader/full/3a-montecarlo-simulation-concepts-2 10/21
8/6/2019 3a-Montecarlo Simulation Concepts 2
http://slidepdf.com/reader/full/3a-montecarlo-simulation-concepts-2 11/21
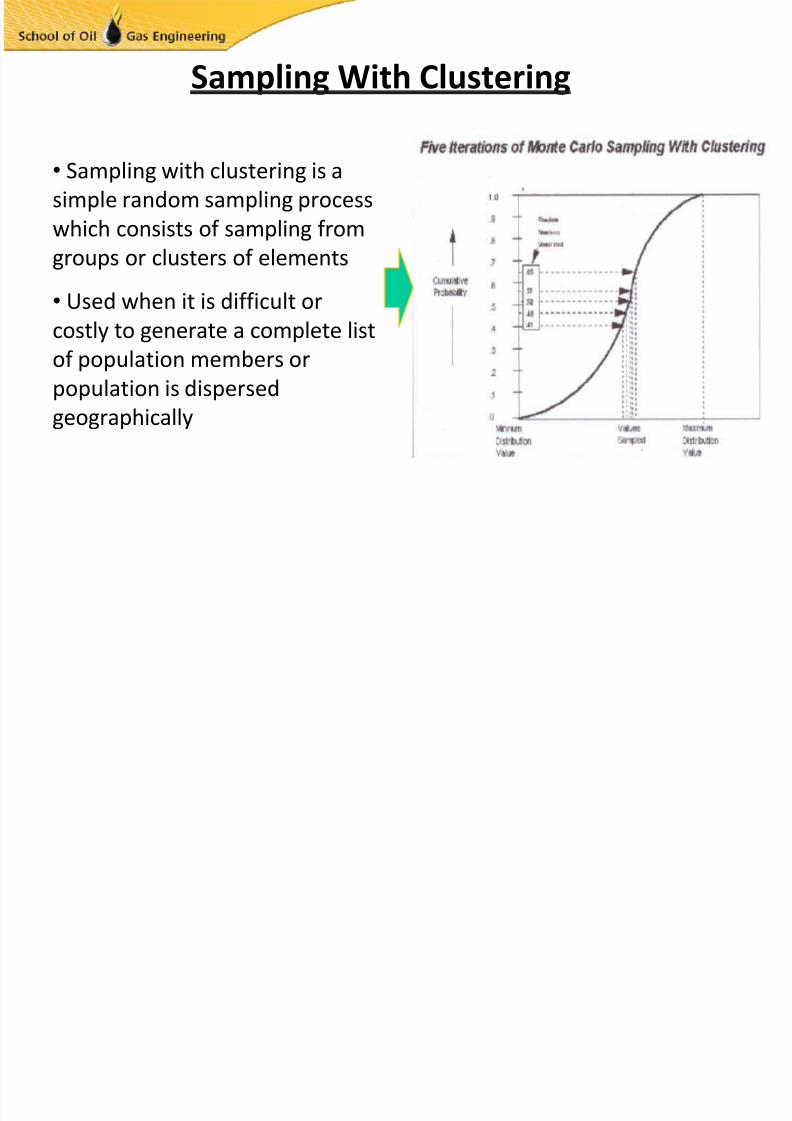
Sampling With Clustering
• Sampling with clustering is a
simple random sampling process
which consists of sampling from
groups or clusters of elements
• Used when it is difficult or
costly to generate a complete list
of population members or
population is dispersed
geographically
8/6/2019 3a-Montecarlo Simulation Concepts 2
http://slidepdf.com/reader/full/3a-montecarlo-simulation-concepts-2 12/21
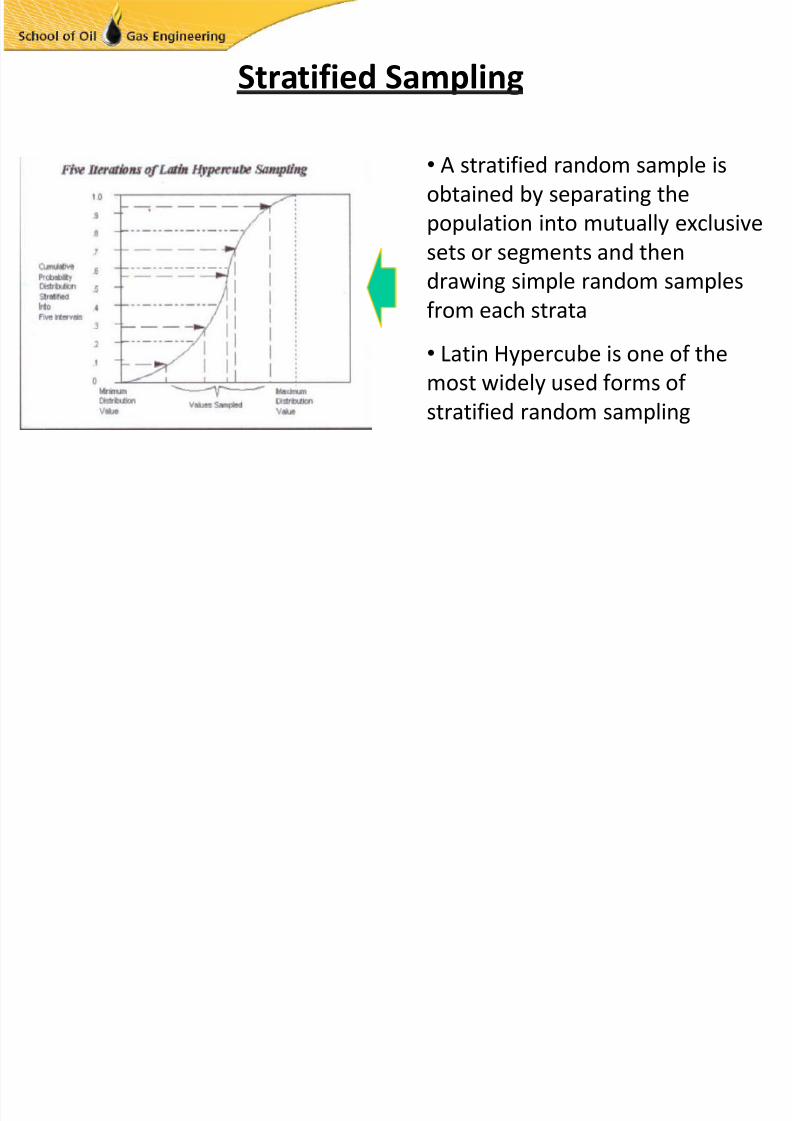
Stratified Sampling
• A stratified random sample is
obtained by separating the
population into mutually exclusive
sets or segments and then
drawing simple random samplesfrom each strata
• Latin Hypercube is one of the
most widely used forms of
stratified random sampling
8/6/2019 3a-Montecarlo Simulation Concepts 2
http://slidepdf.com/reader/full/3a-montecarlo-simulation-concepts-2 13/21
Benefits of Stratified Random Sampling
The key benefits of stratified random sampling are …• Can provide greater precision than a simple random sampleof the same size
• Saves computer time and cost as it requires a smaller
sample for the same level of precision
• A stratified random sampling choice can ensure that arepresentative sample of the whole spectrum is obtained
• Can ensure that enough sample points are obtained to
support a separate analysis of any sub group
• The most well known strata sampling method is the LatinHypercube, used by @Risk and most of similar software
8/6/2019 3a-Montecarlo Simulation Concepts 2
http://slidepdf.com/reader/full/3a-montecarlo-simulation-concepts-2 14/21
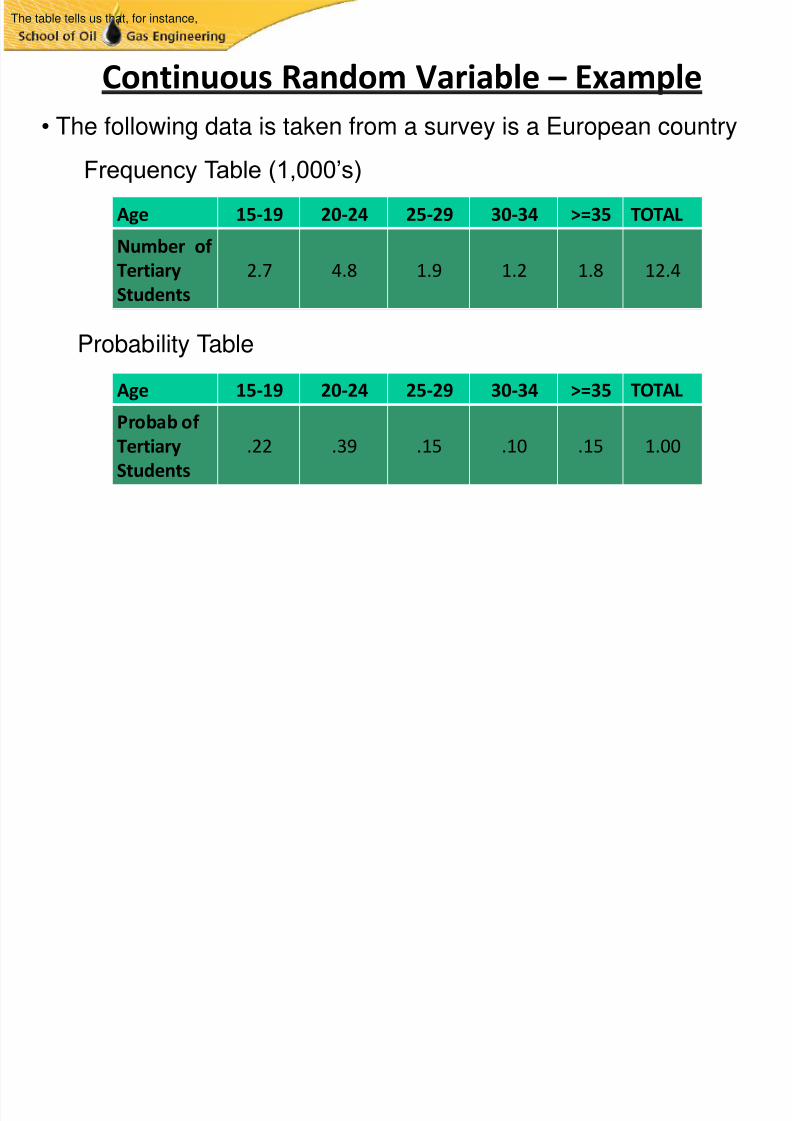
Continuous Random Variable and Histograms
• A random variable is a function X that assigns to each possibleoutcome in an experiment a real number
• If X may assume any value in some given interval, it is called a
continuous random variable
• If it can assume only a number of separated values, it is called a
discrete random variable
• If X is a random variable, we are usually interested in the probability
that X takes on a value in a certain range
• We can use a bar chart, called a (probability distribution) histogram,
to display the probabilities that X lies in selected ranges
8/6/2019 3a-Montecarlo Simulation Concepts 2
http://slidepdf.com/reader/full/3a-montecarlo-simulation-concepts-2 15/21
8/6/2019 3a-Montecarlo Simulation Concepts 2
http://slidepdf.com/reader/full/3a-montecarlo-simulation-concepts-2 16/21
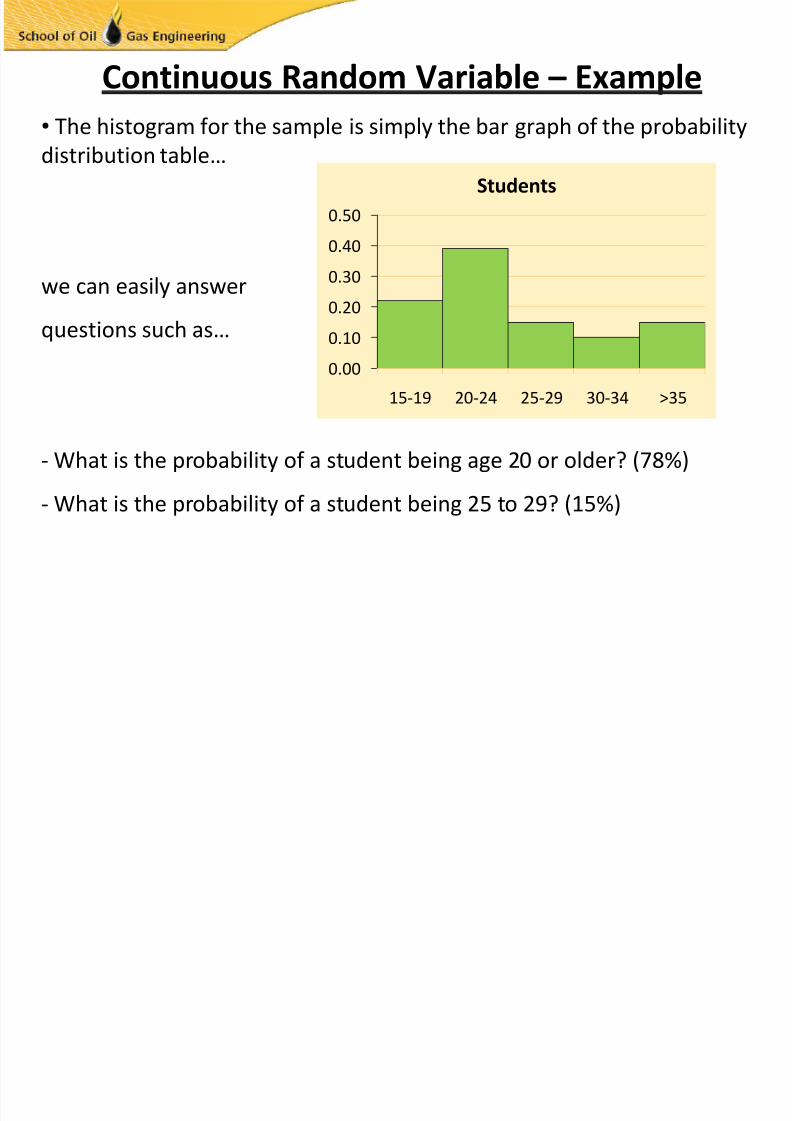
Continuous Random Variable – Example
• The histogram for the sample is simply the bar graph of the probability
distribution table…
we can easily answer
questions such as…
- What is the probability of a student being age 20 or older? (78%)
- What is the probability of a student being 25 to 29? (15%)
0.00
0.10
0.200.30
0.40
0.50
15-19 20-24 25-29 30-34 >35
Students
8/6/2019 3a-Montecarlo Simulation Concepts 2
http://slidepdf.com/reader/full/3a-montecarlo-simulation-concepts-2 17/21
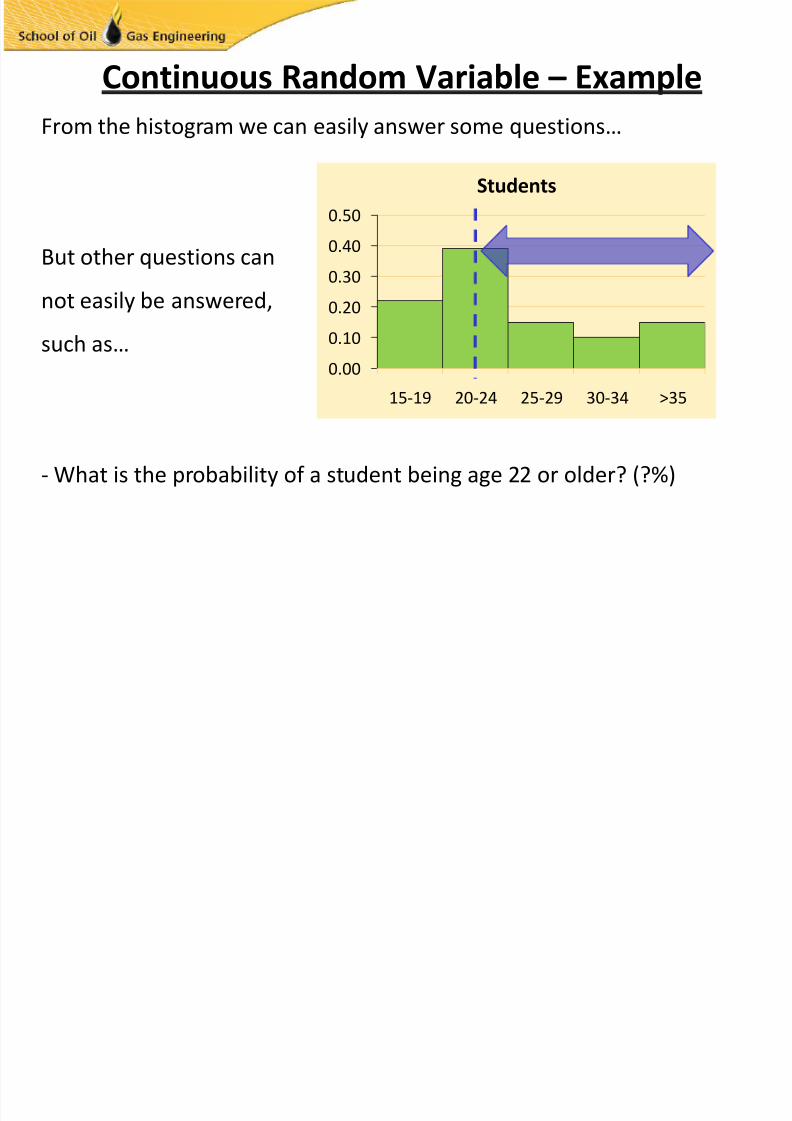
Continuous Random Variable – Example
From the histogram we can easily answer some questions…
But other questions can
not easily be answered,
such as…
- What is the probability of a student being age 22 or older? (?%)
0.00
0.10
0.200.30
0.40
0.50
15-19 20-24 25-29 30-34 >35
Students
8/6/2019 3a-Montecarlo Simulation Concepts 2
http://slidepdf.com/reader/full/3a-montecarlo-simulation-concepts-2 18/21
Continuous Random Variable – Example
• The histogram as plotted did allow some partial answers to selected
questions only
• We needed a “smoother” type of histogram
• It could have been achieved by selected finer ranges, for instance the
range could have been divided in steps of 1 year instead, this would havecreated a smoother graph, albeit lower in height
• Nevertheless, it still would have not easily answered questions such as…
What is the probability of a student being 20 ½ years or older?
• The above leads to the need for using continuous distribution graphs
and calculating probabilities by estimating the “area under the curve”
8/6/2019 3a-Montecarlo Simulation Concepts 2
http://slidepdf.com/reader/full/3a-montecarlo-simulation-concepts-2 19/21
Discrete and Continuous Distributions• We know that a Relative Frequency Diagram is simply a histogram of
actual observations for any given experiment
• The number of total observations is represented by the sum of all
observations in each of the histogram segments
• The histograms can be used to generate probability density
distributions i.e. area under the curve is 1.0 or 100%
• Theory of statistical probability for continuous random variable is
based on continuous probability density distributions
• We know that “smoother” histograms can be generated by finer
definition of the ranges
• Sometimes Continuous Probability Distributions are defined as
functions f(x)

8/6/2019 3a-Montecarlo Simulation Concepts 2
http://slidepdf.com/reader/full/3a-montecarlo-simulation-concepts-2 20/21
Recommended Reading
1.- “Decision Analysis for Petroleum Exploration”
Paul D. Newendorp
PennWell Books

8/6/2019 3a-Montecarlo Simulation Concepts 2
http://slidepdf.com/reader/full/3a-montecarlo-simulation-concepts-2 21/21
End of Topic 3a