Embed Size (px)
Citation preview

Kesk
o’s ye
ar 2
008
www.kesko.fi
Bu
siness ID
010
98
62-
8
Kesko
’s ye
ar

1Kesko’s year 2008
Contents Financial
statements
70 Contents
71 Report by the Board of Directors
82 Consolidated fi nancial statements
(IFRS)
86 Notes to the consolidated fi nancial
statements
137 Parent's fi nancial statements (FAS)
146 Shares and shareholders
153 Information for shareholders
154 Information about Kesko for
investors
155 Contact information
157 Glossary
Kesko's
year 2008
2 Kesko in brief
3 Vision and values
4 Review by the President and CEO
7 Year 2008 in brief
10 Strategic emphases
14 Diverse rewards through K-Plussa
16 Kesko Food
22 Rautakesko
29 VV-Auto
33 Anttila
35 Kesko Agro
38 Other operating activities
Konekesko
Intersport Finland
Indoor Group
Musta Pörssi
Kenkäkesko
45 Real estate operations
49 Kesko is a good place to work
51 Competitive advantage from chain
operations and K-retailer enterprise
52 Corporate Responsibility in Kesko
58 Kesko's Corporate Governance
66 Board of Directors
68 Corporate Management Board

2 Kesko’s year 2008
Rautakesko | Page 22
Rautakesko is engaged in the building
and home improvement trade in Finland,
Sweden, Norway, the Baltic countries,
Russia, and Belarus. It manages and
develops its retail chains K-rauta, Rautia,
Byggmakker, Senukai and OMA and also
B-to-B sales in its operating area. Rau-
takesko is responsible for the chains'
concepts, marketing, sourcing and logis-
tics services, store network, and for
retailer resources in Finland. Rautakesko
also acts as a retailer in Sweden, Estonia,
Latvia, Lithuania, Belarus and Russia,
and in Norway, where retailer entrepre-
neurs are also active.
VV-Auto | Page 29
VV-Auto imports and markets Volkswa-
gen, Audi and Seat passenger cars and
Volkswagen commercial vehicles in
Finland. VV-Auto is also engaged in car
retailing and provides after-sales services
at its own outlets in the Greater Helsinki
area and Turku. VV-Auto's subsidiary
Auto-Span Oy imports Seat passenger
cars and markets them in Finland,
Estonia and Latvia.
Anttila | Page 33
Anttila is the leading home and special-
ity goods retailer in Finland. Anttila
serves its customers at Anttila depart-
ment stores, Kodin Ykkönen department
stores for interior decoration and home
goods, and through NetAnttila, which
focuses on distance sales. Centralised
purchasing and logistics combined with
an efficient organisation and operating
practices guarantee competitive prices.
Anttila's operations are based on a long-
term strategy, multi-channel service and
competence in strong, selected product
areas.
Kesko Agro | Page 35
Kesko Agro's K-maatalous chain pur-
chases and sells agricultural inputs and
machinery to agricultural entrepreneurs,
and trades in grain. Kesko Agro is active
in Finland and the Baltic countries.
Kesko Agro's business operations were
reorganised as of the beginning of 2009.
The K-maatalous chain and the agricul-
tural trade were transferred to Rauta-
kesko, while the tractor and combine
harvester business and the Kesko Agro
subsidiaries in the Baltic countries were
transferred to Konekesko.
Other operating activities | Page 38
Konekesko
Konekesko is a service company special-
ising in the import and sales of con-
struction and environmental machinery,
trucks and buses, and recreational
machinery. Konekesko arranges the
manufacture of and sells Yamarin boats
in Finland and exports them to several
European countries and Russia.
Konekesko operates in Finland, the Baltic
countries, and Russia.
Sports trade – Intersport Finland
The K-Group's sports store chains are
Intersport, Budget Sport and Kesport.
Furniture and interior
decoration trade – Indoor
Indoor is a retailer of home furniture and
interior decoration items, which operates
in Finland and the Baltic countries. Its
retail chains are Asko and Sotka.
Home technology trade – Musta Pörssi
The Musta Pörssi chain and Konebox.fi
online store offer home technology
products and services.
Shoe trade – Kenkäkesko
The K-Group's specialist shoe stores are
K-kenkä and Andiamo.
In 2009, the Kesko Group's primary
reportable segments are the food trade,
the home and speciality goods trade, the
building and home improvement trade,
and the car and machinery trade.
The food trade comprises the food
business based on Kesko Food's K-retailer
business model and Kespro's grocery
wholesaling. The home and speciality
goods trade comprises Anttila, K-citymar-
ket's home and speciality goods trade
and the other home and speciality goods
companies (Indoor, Intersport Finland,
Musta Pörssi and Kenkäkesko).
The building and home improvement
trade includes Rautakesko, the K-maa-
talous chain and the agricultural trade as
of the beginning of 2009. The car and
machinery trade comprises the opera-
tions of VV-Auto and Konekesko.
Kesko in brief
Kesko is the leading provider
of trading sector services and
a highly valued listed company.
Through its stores, Kesko offers
quality to the daily lives of con-
sumers. Kesko has about 2,000
stores engaged in chain operations
in the Nordic and Baltic countries,
Russia, and Belarus.
Our core competence areas
Development and management of ●
store concepts and brands
Development, ownership and man- ●
agement of the store site network
International retail expertise ●
Combining retailer entrepreneurship ●
and chain operations efficiently
Leveraging centralised resources and ●
economies of scale
DivisionsKesko Food | Page 16
Kesko Food is engaged in the grocery
trade in Finland. The operations of the
more than 1,000 K-food stores are based
on the K-retailer business model. These
stores form Kesko Food's K-citymarket,
K-supermarket, K-market and K-extra
chains. In grocery wholesaling, Kesko
Food’s subsidiary Kespro Ltd is the lead-
ing wholesaler in the Finnish HoReCa
business.

3Kesko’s year 2008
We exceed our customers'expectationsWe recognise our customers'
needs and expectations. We
strive to offer them positive
experiences through the
continual reform of our
operations and emphasis
on entrepreneurial activity.
We are the best operator in the trading sectorWe offer our customers the
best products and services
in the market to ensure our
competitiveness and success.
We create a good working communityWe operate in an open, in-
teractive working community
where people are respected
and every individual can
contribute to the full and
use his or her initiative.
We bear our corporate responsibilityOur operations are respon-
sible and we follow ethically
acceptable principles in all
actions within our working
community and in relations
with our partners.
ValuesThe values guide our operations:
Vision
Kesko is the leading provider of trading sector services
and a highly valued listed company.
Quality service through these brands:

4 Kesko’s year 2008
Kesko faces the recession head-onReview by the President and CEO
transactions were completed. The gain
on the disposals totalled approximately
€180 million.
Thanks to the excellent profit perform-
ance and well-timed company and prop-
erty disposals in recent years, Kesko's
liquidity is strong and solvency is high.
The cost-effectiveness of investments is
assessed more carefully and they are
postponed, if necessary. Our aim is to
maintain the good financial position
and benefit from lower construction costs
when building new store sites.
Work and productivity
Kesko's strategy focuses on healthy
growth, sales and services provided to
consumer-customers, and responsible
and cost-efficient business models.
Kesko carried out major organisational
reforms during 2008. A decision was
taken to divide Kesko Agro, joining it
partly with Rautakesko and partly with
Konekesko. A decision was also taken to
intensify cooperation of Anttila, K-city-
market's home and speciality goods and
the other home and speciality goods
chains particularly in goods purchasing,
management and customer relationship
management. The activities aim at cost-
efficiency and improvements in customer
service. The divisions implemented sev-
eral cooperation negotiations aimed at
cutting the number of employees.
The trading sector wage solution made
in 2007 will increase labour costs over
several years. As growth expectations are
weakening, various rationalisation activi-
ties will be necessary. We will be opening
new stores and will also recruit new
employees for them. Availability of labour
force is improving at the moment, but
competition for skilled personnel will, in
the longer run, intensify.
In order to maintain our competitive-
ness we have to be able to increase work
productivity. The work and productivity
programme covering Kesko and its chain
stores was launched at the end of 2007.
The aim of the programme is to
strengthen our competitiveness by
increasing employees' work productivity.
There are extensive projects underway
concerning the automation of activities
and processes. We continue the system-
The financial environment in the trading
sector quickly deteriorated during 2008.
As a result of consumer prudence, con-
struction and other major household
acquisitions in particular declined. In
the current cyclical conditions, it is an
advantage that the steadily developing
grocery trade accounts for nearly half of
our business.
More for our customers
The K-Group stores are visited daily by
about one million customers.
Success in the con-
sumer-customer busi-
ness requires that the
customer and brand
promises are delivered
at every visit to the
store. Kesko has sev-
eral successful chain
and product brands.
Brand development
work is a key to
future success. In
practice this also
means increasing the
efficiency of market-
ing and developing
measurement
methods.
The importance
of electronic cus-
tomer communica-
tions is increasing
in the trading sec-
tor. Customers visit
web sites to look for product
information to support their purchasing
decisions. Various online services and
interactivity are increasing. Kesko and its
subsidiaries develop electronic customer
communications and online store sites.
Kesko holds a strong position in online
sales of home and speciality goods with
its NetAnttila and Kodin1.com concepts.
In autumn 2008, we launched Konebox.fi
selling home technology and in spring
2009, we will open the Budget Sport
online store.
Year of reorganisations and
investments
In 2008, Kauko-Telko, Tähti Optikko and
K-Rahoitus were divested and real estate
A new K-citymarket is being built in
Koivukylä, Vantaa. The foundation stone
was laid on 23 January 2009.

5Kesko’s year 2008
atic enhancement of employee compe-
tencies and are looking for new, effective
forms of training. Our units have also
started projects focusing on improving
wellbeing at work.
Steady development in the grocery
trade
Kesko operates in many product lines
and markets at different stages of devel-
opment in several countries. In the
weakening business environment, the
stability of Kesko's grocery trade in par-
ticular contributes to levelling cyclical
changes. In addition, Kesko's business
model, in which retailer entrepreneurs
are, to a large extent, responsible for
retailing, is competitive even in hard
market conditions. Retailers' creativity
and responsibility have proved to be
strong attributes in the changing operat-
ing environment. In 2008, the growth of
the Group's net sales slowed down as a
result of the more difficult business
environment. Operating profit excluding
non-recurring items decreased on the
previous years' record results, but
remained at a reasonable level.
A pioneer in corporate
responsibility
Kesko has been a trading sector pioneer
in corporate responsibility for years and
been recognised internationally for this
work. We have drawn up a new respon-
sibility programme for the years 2008–
2012. The programme sets concrete tar-
gets for the areas of fighting climate
change, responsible purchasing and
employees' wellbeing. We have, among
other things, signed a trading sector
energy-efficiency agreement and com-
mitted to saving more than 65 GWh of
energy by the end of 2016. The agreed
savings target is significant, as it corre-
sponds to the annual consumption of
about 2,600 one-family houses at the
annual level.
Attitude and competence in
customer service
Kesko and the K-Group stores have
around 50,000 employees in eight differ-
ent countries. Most of them work in cus-
tomer service duties, in which compe-
tence and the right attitude are decisive.
We want to ensure the best customer
satisfaction and our future competitive-
ness. In 2008, the Kesko Group recruited
some 12,000 new employees and
K-instituutti, the K-Group's own training
centre, had some 25,000 participants in
its training events.
I wish to extend my warmest thanks to
all Kesko employees for their diligence
and commitment to our objectives. I
would also like to thank our sharehold-
ers, K-retailers and their employees, and
all our partners for their trust and coop-
eration during 2008.
Matti HalmesmäkiPresident and CEO


7Kesko’s year 2008
Recession slowed down the
construction market; steady
development in the grocery trade
In 2008, the market weakened in almost
all of Kesko's product lines, especially
towards the end of the year. This was
reflected, above all, in the building and
home improvement, and car and
machinery trades.
Kesko's net sales increased by 3.4%. In
Finland, the growth was 4.4%, but activ-
ities in other countries showed some
decrease.
Steady growth continued in the grocery
trade throughout the year. The retail sales
of K-food stores increased by 6.0%, but
fell short of the estimated overall market
development. Kesko Food's net sales
grew by 6.2% and accounted for 43% of
the Group's total net sales.
Rautakesko's net sales performance
was greatly affected by the weakening
construction market in the Nordic and
Baltic countries, particularly towards the
end of the year. Rautakesko's net sales
dropped by 0.8% from the previous year.
Sales growth in the car trade can be
attributed to the competitive Audi and
Volkswagen ranges, imported by VV-Auto,
and to the car tax reform which became
effective at the beginning of the year.
However, demand for new and trade-in
cars dropped towards the end of the year.
VV-Auto's net sales increased by 9.9%.
In the department store trade, Anttila's
sales performance was affected by the
slowdown in the sale of homes particu-
larly in late 2008, which reduced demand
for interior decoration items and home
electronics. Anttila's net sales dropped by
0.7% from the previous year.
In the agricultural trade, the market
situation deteriorated clearly in the Baltic
countries in particular. Kesko Agro's net
sales increased by 6.6%.
In other operating activities, Inter-
sport's sales were good and its net sales
grew. Kenkäkesko, too, had a good year.
The sales of Asko, Sotka and Musta Pörssi
did not develop as expected. Konekesko's
sales were, above all, negatively impacted
by the slowdown in the recreational
machinery market.
Operating profit fell short of the
previous year
The Group's operating profit excluding
non-recurring items was €217.0 million,
representing a decrease of €98 million
from the previous year. This can be
mainly attributed to the weakening con-
struction market and the strong expan-
sion and refurbishing of the networks of
the food and the building and home
improvement stores. Owing to the dete-
rioration of the economic situation, the
measurement principles applied to
inventories and trade receivables were
tightened further.
During the year, 37 new food stores
were opened. Two new building and
home improvement stores were opened
in Finland and 12 stores in other coun-
tries.
Gains on business and real estate
disposals
The gains on business and real estate
disposals totalled approximately €180
million in 2008. During the first half of
the year, K-Rahoitus, Tähti Optikko and
Kauko-Telko, all representing non-core
business operations, were sold.
Synergy benefits by intensifying
cooperation
During 2008, several plans aiming at
saving costs and improving efficiency
progressed.
A decision was taken to intensify the
cooperation between Anttila, K-citymar-
ket's home and speciality goods trade
and Kesko's other companies engaged in
the home and speciality goods business.
In this way synergy benefits are being
sought particularly in goods purchasing,
management and customer relationship
management. Customers will continue to
see each K-citymarket as one store in
which a K-retailer is responsible for the
food trade. All of the existing home and
speciality goods chains will continue
operating separately.
At the beginning of 2009, Kesko Agro's
activities were combined with Rautakesko
and Konekesko. The agricultural trade
activities in Finland became part of Rau-
takesko, while the tractors and combines
trade and the Baltic subsidiaries both
became part of Konekesko. The objective
is to enhance product selections, cus-
tomer service and the maintenance and
spare part network.
In 2009, Kesko's reportable segments
are the food trade, the home and spe-
ciality goods trade, the building and
home improvement trade, and the car
and machinery trade.
Year 2008 in brief
Kesko's net sales from continu- ●
ing operations increased by
3.4% to €9,600 million
Operating profit excluding non- ●
recurring items was €217 mil-
lion, a decrease of €98 million
The Kesko Group's profit before ●
tax was €288.5 million, a
decrease of €69.3 million
The retail sales of the K-Group ●
increased by 3.4% to €11,916
million (incl. VAT)
The Kesko Group's earnings per ●
share were €2.24 (€2.90)
The Board of Directors proposes ●
to the Annual General Meeting
that €1.00 per share be distrib-
uted as a dividend for 2008

8 Kesko’s year 2008
350
300
250
200
150
100
50
0
4.0
3.5
3.0
2.5
2.0
1.5
1.0
0.5
0
financial highlights for 2008
Key indicators 2008 2007 Change
Net sales* € million 9,600 9,287 3.4%
Operating profit* € million 286 322 -11.2%
Operating profit excl. non-recurring items* € million 217 315 -31.1%
Profit before tax* € million 289 358 -19.4%
Return on investment % 14.2 17.4 -3.2 pp
Return on equity % 12.1 16.4 -4.4 pp
Cash flow from operating activities € million 134 248 -46.0%
Investments* € million 338 228 48.6%
Equity ratio % 52.4 48.5 3.9 pp
Gearing % 2.3 14.0 -11.6 pp
Dividend per share € 1.00** 1.60 -37.5%
Earnings per share, diluted € 2.24 2.90 -22.8%
Equity per share, diluted € 20.09 19.53 2.9%
Personnel (average)* 21,327 20,520 3.9%
* continuing operations ** proposal to the Annual General Meeting
Kesko Food €4,110 million (42.7%)
Rautakesko €2,518 million (26.2%)
VV-Auto €884 million (9.2%)
Anttila €560 million (5.8%)
Kesko Agro €846 million (8.8%)
Other operating activities €699 million (7.3%)
Net sales by division*, € million
Operating profit excl. non-recurring items by division*,
€ million
Kesko Food €135 million (56.1%)
Rautakesko €53 million (22.1%)
VV-Auto €36 million (15.1%)
Anttila €20 million (8.2%)
Kesko Agro €-4 million (-1.5%)
Other operating activities €0 million (-0.0%)
Group's net sales*, € million
Finland
Other countries
2004 2005 2006 2007 2008
10,000
9,000
8,000
7,000
6,000
5,000
4,000
3,000
2,000
1,000
0
Group's operating profit
excl. non-recurring items*, € million
2004 2005 2006 2007 2008
* continuing operations
** proposal to the Annual General Meeting
Earnings per share and
dividend per share, €
2004 2005 2006 2007 2008
Earnings per share, diluted
Dividend per share
**
The Group's operating profit excluding non-recurring items also includes common
operations and eliminations in a total amount of €-24 million.

10 Kesko’s year 2008
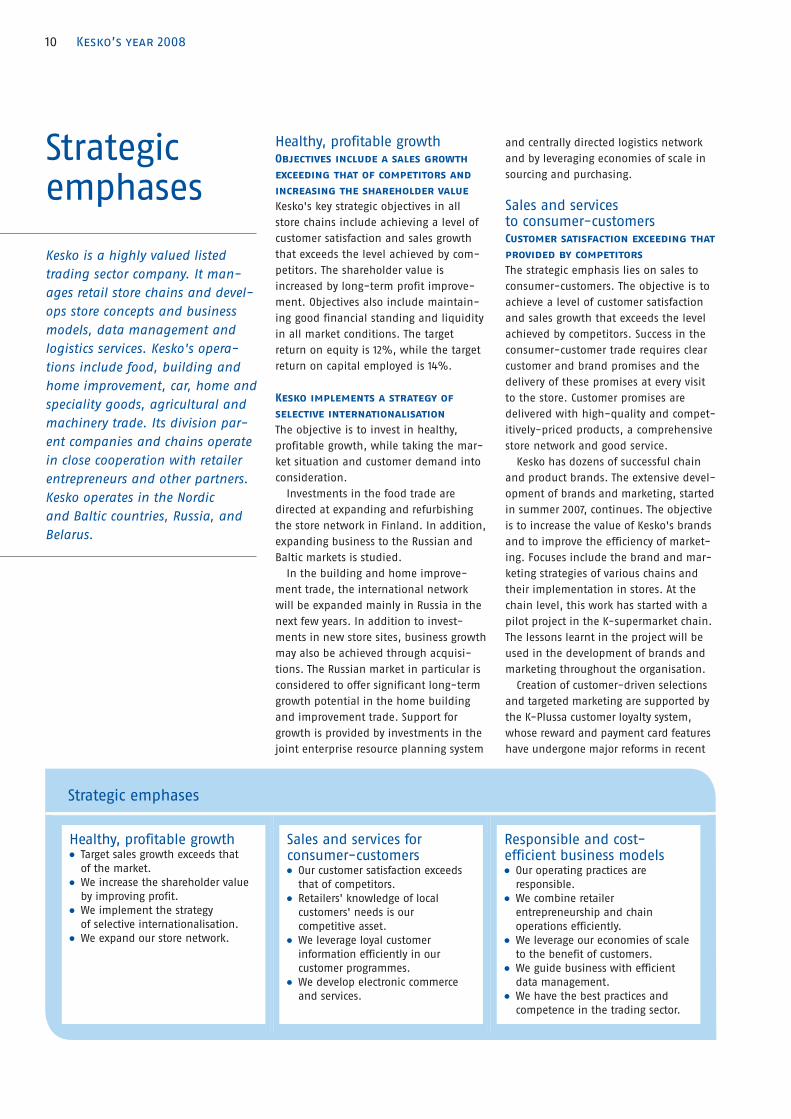
Strategic emphases
Healthy, profitable growthTarget sales growth exceeds that ●
of the market.
We increase the shareholder value ●
by improving profit.
We implement the strategy ●
of selective internationalisation.
We expand our store network. ●
Sales and services for consumer-customers
Our customer satisfaction exceeds ●
that of competitors.
Retailers' knowledge of local ●
customers' needs is our
competitive asset.
We leverage loyal customer ●
information efficiently in our
customer programmes.
We develop electronic commerce ●
and services.
Responsible and cost-efficient business models
Our operating practices are ●
responsible.
We combine retailer ●
entrepreneurship and chain
operations efficiently.
We leverage our economies of scale ●
to the benefit of customers.
We guide business with efficient ●
data management.
We have the best practices and ●
competence in the trading sector.
Strategic emphases
Kesko is a highly valued listed
trading sector company. It man-
ages retail store chains and devel-
ops store concepts and business
models, data management and
logistics services. Kesko's opera-
tions include food, building and
home improvement, car, home and
speciality goods, agricultural and
machinery trade. Its division par-
ent companies and chains operate
in close cooperation with retailer
entrepreneurs and other partners.
Kesko operates in the Nordic
and Baltic countries, Russia, and
Belarus.
Healthy, profitable growthObjectives include a sales growth
exceeding that of competitors and
increasing the shareholder value
Kesko's key strategic objectives in all
store chains include achieving a level of
customer satisfaction and sales growth
that exceeds the level achieved by com-
petitors. The shareholder value is
increased by long-term profit improve-
ment. Objectives also include maintain-
ing good financial standing and liquidity
in all market conditions. The target
return on equity is 12%, while the target
return on capital employed is 14%.
Kesko implements a strategy of
selective internationalisation
The objective is to invest in healthy,
profitable growth, while taking the mar-
ket situation and customer demand into
consideration.
Investments in the food trade are
directed at expanding and refurbishing
the store network in Finland. In addition,
expanding business to the Russian and
Baltic markets is studied.
In the building and home improve-
ment trade, the international network
will be expanded mainly in Russia in the
next few years. In addition to invest-
ments in new store sites, business growth
may also be achieved through acquisi-
tions. The Russian market in particular is
considered to offer significant long-term
growth potential in the home building
and improvement trade. Support for
growth is provided by investments in the
joint enterprise resource planning system
and centrally directed logistics network
and by leveraging economies of scale in
sourcing and purchasing.
Sales and services to consumer-customersCustomer satisfaction exceeding that
provided by competitors
The strategic emphasis lies on sales to
consumer-customers. The objective is to
achieve a level of customer satisfaction
and sales growth that exceeds the level
achieved by competitors. Success in the
consumer-customer trade requires clear
customer and brand promises and the
delivery of these promises at every visit
to the store. Customer promises are
delivered with high-quality and compet-
itively-priced products, a comprehensive
store network and good service.
Kesko has dozens of successful chain
and product brands. The extensive devel-
opment of brands and marketing, started
in summer 2007, continues. The objective
is to increase the value of Kesko's brands
and to improve the efficiency of market-
ing. Focuses include the brand and mar-
keting strategies of various chains and
their implementation in stores. At the
chain level, this work has started with a
pilot project in the K-supermarket chain.
The lessons learnt in the project will be
used in the development of brands and
marketing throughout the organisation.
Creation of customer-driven selections
and targeted marketing are supported by
the K-Plussa customer loyalty system,
whose reward and payment card features
have undergone major reforms in recent

11Kesko’s year 2008
Kesko in the value chain of trade
CONSUMERS
SUPPLIERS AND
SERVICE
PROVIDERS
Retailer
entrepreneurs'
retailing
Kesko's own
retailing
B-to-B sales
Store concepts and ●
business models
Sourcing, logistics and ●
marketing services
Store chain ●
management
Store sites ●
Retailer resources ●
Support processes ●
years. The objective of the system is to
offer significant product and service ben-
efits to customers, encouraging them to
centralise their purchases in the K-Group.
Use of customer information has increased
considerably in key business areas. Chains
and stores leverage customer information,
for example, in their selection planning,
pricing and marketing.
Customer-driven business models
The business models applied in Kesko's
sales to consumer-customers are retail-
ing through retailer entrepreneurs and
Kesko's own retailing. Kesko is also
engaged in B-to-B sales.
1) Retailer entrepreneurs' retailing
The principal business model in the
Finnish market is the chain business
model, in which independent K-retailers
run retail stores in the chains managed
by Kesko. In Finland, for example, all
food and building and home improve-
ment stores in the K-Group are run by
retailer entrepreneurs. With its chain
operations, Kesko provides a first-class
setting for its retailer entrepreneurs to
serve their customers as well as possible.
The K-retailer entrepreneur is responsible
for his or her store's customer satisfac-
tion, personnel and profitability of busi-
ness. Good service and knowledge of
customers' needs provide the K-Group
with a competitive edge.
At the end of 2008, Kesko had 1,305
K-retailer entrepreneurs as partners and,
in addition, about 250 other retailer
partners in the Asko, Sotka, Byggmakker
and Senukai chains. Kesko's sales to
retailer partners accounted for 49% of
net sales in 2008.
2) Kesko's own retailing
Kesko acts as a retailer in business oper-
ations where the competitive advantage
is based on the centrally managed chain
concept. Kesko's own retail stores in
Finland include the Anttila and Kodin
Ykkönen department stores. In addition,
Kesko is also responsible for retailing
home and speciality goods in the K-city-
market chain. Kesko's own retailing is
also the model mainly used in expand-
ing business operations outside Finland.
In 2008, Kesko's own retailing accounted
for 26% of net sales.
3) B-to-B sales
Kesko is engaged in B-to-B sales in
those business operations that support
consumer-customer sales. Typical busi-
ness customers include building compa-
nies, agricultural entrepreneurs, the
manufacturing industry, institutional
kitchens and the public sector. In 2008,
Kesko's B-to-B sales accounted for 25%
of net sales.
Electronic customer communications
and e-commerce
The importance of electronic customer
communications in trading has increased
continuously. Kesko is developing online
customer communications and the
chains' online trading sites. The objective
Retailer entrepreneurs' retailing 49%
Kesko's own retailing 26%
B-to-B sales 25%
Shares of net sales, %

12 Kesko’s year 2008
local selections and delivering the cus-
tomer promise in their stores.
Kesko's efficient chain operations and
joint processes provide support to retail-
ers. Chain operations offer the retailer a
joint business concept which includes,
among other things, chain control and
business management support related to
chain selection, pricing and marketing.
Joint chain operations carried out by
retailers and Kesko are further intensified
by developing increasingly better tools
and business models for the stores. The
most important of these are regional and
store-specific selections and pricing
guidance as well as tools for customer
relationship and store personnel man-
agement.
Kesko participates in international pur-
chasing cooperation in various product
lines, which increases purchasing vol-
umes and efficiency. The most important
partnership organisations in which Kesko
participates include AMS Sourcing B.V. in
the grocery trade, tooMax-x in the build-
ing and home improvement trade, Inter-
sport International Corporation in the
sports trade and Electronic Partner Inter-
national in the home technology trade.
Work and productivity programme
Cost-efficient operations build price
competitiveness and customer satisfac-
tion in the retailing sector. They are also
a basic requirement for increasing Kes-
ko's profitability and shareholder value.
The key objective of the work and pro-
ductivity programme launched is to
increase employees' work productivity in
Kesko and chain stores. The most impor-
tant tools for improving productivity
include increasing personnel competence
and the efficiency of operating practices.
Promoting the wellbeing of empoyees has
also become an increasingly important
factor. Retail stores also focus on enhanc-
ing the productivity of store space and
capital.
Electronic and automated processes
A project to automate processes and rou-
tines has been started with the purpose
of improving cost-efficiency. One area is
the shared service centre, K-talouspalve-
lukeskus Oy, the duties of which include
determining uniform and efficient oper-
ating practices for the Group's financial
management processes. The project to
replace paper invoices with electronic
ones will contribute to this automation.
The aim is to receive all suppliers' pur-
chasing invoices in electronic form start-
ing from 1 October 2009.
More detailed information about each
division's strategic emphases and
projects is provided in the division-spe-
cific presentations starting from page 16.
Financial objectives and their realisation
The objectives
announced on
5.2.2009 Target level
The objectives
announced on
23.5.2007 Target level Realised 2008 Realised 2007
Net sales growth Growth rate
exceeding that of
the market
Net sales growth In Finland growth
exceeding that of
the market
Increasing proportion
of international
operations
Realised: VV-Auto,
Intersport Finland,
Kenkäkesko
Change -0.8% pp
(continuing operations)
Realised:
Kesko Food, VV-Auto, Konekesko,
Intersport Finland, Musta Pörssi
Growth 2.2% pp
(continuing operations)
Return on equity 12% Return on equity 14% 12%,
excl. non-recurring
items 8.1%
16%,
excl. non-recurring
items 12.7%
Return on capital
employed
14% Return on invested
capital
16% 14%,
excl. non-recurring
items 10.0%
17%,
excl. non-recurring
items 14.5%
Interest-bearing
net debt/EBITDA < 3
Interest-bearing net
debt/EBITDA < 3 0.1 0.6
Equity ratio 40–50% Equity ratio 40–45% 52% 48%
Economic value
added
Growing positive EVA
as internal indicator
Economic value
added
Growing positive EVA
as internal indicator
Not realised Realised
is to improve customer satisfaction and
to increase sales. Kesko has gained a
strong position in online sales of home
and speciality goods through the NetAnt-
tila and Kodin1.com concepts. In addi-
tion, Konebox.fi, an online store for
home technology goods, was opened in
autumn 2008 and the Budget Sport
online store will open in spring 2009.
Responsible and cost-efficient business modelsSustainable development and
responsible operating practices
The principles of sustainable develop-
ment and responsible operating practices
are a central part of Kesko's and its
chains' daily activities. Consumer-cus-
tomers require the trading sector to bear
responsibility for products' safety and
healthiness, and for the environmental
and social impact of business operations.
The results of responsible operations are
reported annually in Kesko's Corporate
Responsibility Report.
Efficient combination of retailer
entrepreneurship and chain
operations and leveraging
economies of scale
The strategic objective is an efficient
combination of K-retailer entrepreneur-
ship and chain operations. K-retailers
are responsible for customer service,

14 Kesko’s year 2008
The K-Plussa customer loyalty system
operates on three levels. Benefits
granted to customers are either store-
specific, chain-specific or provided across
the entire K-Plussa network. The more
customers use their K-Plussa cards, the
more diversified the customer loyalty
benefits they receive will be.
Store-specific benefits and services to meet the needs of local customersWhen customers shop with their K-Plussa
cards in K-Group stores, retailers are
provided with important information
which they can use to develop their
stores' selections and services to best
serve their clientele. Customer informa-
tion is also used interactively between
the K-stores and customers. By concen-
trating their purchases, customers get
store-specific K-Plussa benefits and
services that are based on their needs
and shopping behaviour. Targeted ben-
efits and services provided by local
K-retailers increase customer satisfaction
and sales.
Diverse rewards through K-Plussa
K-Plussa, the K-Group's customer
loyalty system, experienced
a period of growth in 2008. The
K-Plussa network expanded to
include more than 3,500 outlets.
The overall benefits provided to
K-Plussa customers increased con-
siderably, particularly the amount
of K-Plussa special offer benefits
granted at checkouts. The K-Plussa
customer loyalty programme
gained more than 210,000 new
customers.
Chain-specific customer programmes provide benefits and services to meet customers' needs in specific product lines The K-Group chains have their own cus-
tomer programmes which offer chain-
specific benefits and services to K-Plussa
customers based on their needs in these
particular sectors. For example, Kodin
Ykkönen has a loyalty programme which
gives customers a discount on the price
of the assembly service and free use of
removal boxes. Chain-level customer
information is leveraged to develop the
network and concepts, and to build the
chains' selections and services that meet
the needs of customers as well as pos-
sible.
K-Plussa benefits provided to all K-Plussa cardholdersK-Plussa also offers significant benefits
that are available to all K-Plussa cus-
tomers. K-Plussa offers always reward
customers with a discount of at least 10
percent provided at the checkout; this is
a guaranteed K-Plussa reduction. By
centralising their purchases in the
K-Plussa network, customers receive a
reward of up to 5 percent in the form
of Plussa points.
Other benefits available to all K-Plussa
customers include co-branding cards and
the chance for customers to deposit their
K-Plussa points in their bank account
with any bank. The partnerships with the
OP-Pohjola Group and Nordea that
started in 2007 have got off to a good
start. More than 600,000 customers

15Kesko’s year 2008
already have a debit or credit card with
the K-Plussa feature. A co-branding card
makes things easier for customers as it
enables the collection of K-Plussa points
and reduces the number of cards in the
wallet.
K-Plussa cardholders also get the
Pirkka magazine, which celebrated its
75th anniversary, distributed to their
homes. In 2008, Pirkka further reinforced
its position as the most widely read mag-
azine in Finland (source: the National
Readership Survey). In addition to the
Pirkka magazine, the Plussa.com website
is an important communications channel
between K-Plussa customers and the
K-Group. According to a survey conducted
in September 2008, K-Plussa's loyal cus-
tomers are extremely satisfied with the
Plussa.com pages and provided the web-
site with an excellent grade. Customers
visit Plussa.com for benefits and special
offers. The website provides nearly 300
nationwide K-Plussa benefits each
month.
Cooperation with Nuori Suomi, the
Young Finland Association, continued to
play an important role in sponsorship by
K-Plussa. In 2008, the cooperation
included customer events arranged by
retailers and cooperation between retail-
ers and local, recognised sports clubs.
Customer information at the core of businessTo enable us to develop the most
rewarding benefit levels and customer
programmes, we need a sufficient
amount of information about customer
relationships and the competence to
analyse and make use of this informa-
tion. Collecting and saving reliable cus-
tomer information in sufficient quantity
is of primary importance in customer
relationship analysis. K-Plus Oy collects
and analyses this information in the
K-Group.
Customers' privacy protection is
ensured when customer information is
collected and made use of. K-Plus Oy
processes customers' purchasing data on
the sum total or product group level.
Anonymous receipt line level purchasing
data may also be used. Customer infor-
mation and programmes play a key role
in business planning.
Targeted marketing by means of cus-
tomer information is becoming increas-
ingly common. This type of marketing is
more cost-efficient and often attracts
more attention. Results gained from tar-
geting have been extremely good. For
example, by classifying information
about eating habits, customer groups
who appreciate healthy eating or tradi-
tional foods can be identified and
approached in a way they find interest-
ing.
The importance of electronic customer
contacts in targeted communications is
increasing. Those who have agreed to
electronic marketing receive a K-Plussa
e-letter with special offers once a month.
Customers can also be approached with
personalised e-mail offers.
Since the end of 2008, customers have
also been able to download the location
of nearly 2,000 K-Group stores and out-
lets of certain K-Plussa cooperation part-
ners to their car navigators. This service
complements the map and route service
previously offered to customers.
At the end of 2008, 3.6 million Finns in
2 million households had a K-Plussa
card. In 2008, the K-Plussa customer loy-
alty programme gained more than
210,000 new customers.
Several new partners joined the growing K-Plussa network
The K-Plussa network expanded
considerably in 2008. Thanks to the
cooperation between Kesko and
Teboil, K-Group customers began
to receive K-Plussa points for their
purchases at nearly 300 Teboil
stations.
Budget Sport stores and Center Inn
restaurants located in the Greater
Helsinki area also joined the K-Plussa
network during the year. Active efforts
to increase the number of cooperation
partners continue.

16 Kesko’s year 2008
Kesko Food
Kesko Food is engaged in the
grocery trade in Finland. The
operations of the more than 1,000
K-food stores are based on the
K-retailer business model. These
stores form Kesko Food's K-city-
market, K-supermarket, K-market
and K-extra chains. In grocery
wholesaling, Kesko Food’s subsidi-
ary Kespro Ltd is the leading
wholesaler in the Finnish HoReCa
business.
MarketThe Finnish grocery retail market totals
about €14.2 billion. The average monthly
increase in grocery prices compared with
the previous year was 7.6% during 2008
(Statistics Finland).
In addition to K-food stores, primary
operators include Prisma, S-market and
Alepa (S Group), Valintatalo, Siwa and
Euromarket (Suomen Lähikauppa Oy, pre-
viously Tradeka), and Lidl. The estimated
market share of the K-food stores is
33.4% (own estimate).
The Finnish HoReCa (hotels, restaurants
and catering) market's purchases in Fin-
land totalled about €2.5 billion in 2008
(own estimate). Kesko Food's subsidiary
Kespro Ltd is the leading wholesaler in
the Finnish HoReCa business. Kespro's
main competitors are Meiranova Oy,
Metro-tukku and Heinon Tukku Oy.
The aim is to provide successful customer experiences At the end of 2008, there were 1,055
K-food stores. They are visited by nearly
840,000 customers every day. In 2008,
the total number of customer visits was
nearly 310 million. Every customer
encounter is important when it comes to
our success. Success is ensured by the
highest quality and most comprehensive
selections on the market, combined with
the best service and favourable prices.
Local K-retailers are responsible for the
customer service, competence of person-
nel, and profitability of business at their
stores. Retailers are able to react quickly
to their customers' wishes and to build
selections and services that meet their
needs.
Kesko Food manages the operations of
the chains made up by the stores. Coop-
eration between Kesko Food and the
K-retailer is based on the chain opera-
tions defined in the chain agreement.
Chain operations ensure higher competi-
tiveness for the entire chain. Key factors
contributing to competitiveness in chain
operations include customer-orientation
and operational efficiency.
Major duties include centralised pur-
chasing of goods and logistics, chain
concepts and their development, forma-
tion of selections that are available
throughout the entire chain, the chains'
marketing, data management and store
site operations, and man-
agement.
K-food stores have their
own quality system. Its
objective is to ensure con-
tinuous, systematic develop-
ment of the operations of the
store and the whole chain to
best serve the customers. The
quality system includes meas-
uring customer satisfaction,
measuring the store's condition,
assessing price control, and
assessing management. The best
retailing competence is main-
tained with the help of constant
training in cooperation with the
K-instituutti, the K-Group's train-
ing centre.
The high quality of products
is assured by Kesko Food's own
Product Research Unit and K-test
kitchen. All Pirkka products have
been tested by the Product
Research Unit and all recipes pub-
lished in Kesko Food's own media
have been developed and tested by
the K-test kitchen. Food recipes are
published in Pirkka, the K-Group's
magazine distributed to loyal cus-
tomers, and on the largest Finnish
online cookery book Pirkka.fi. They
are also featured on the K-Ruoka-
Pirkka leaflet that is published weekly
and available at all K-food stores, and
shown on the TV programme “What are
we having today?”.
Favourable prices are a prerequisite
for growth and customer satisfaction.
The basis for favourable prices is built
with the help of the basic selection that
is available throughout the chain, per-
manently low-priced Pirkka products,
the chain's campaigns and store-specific
activities.
Pirkka products combine targeted
quality and low prices in the most con-
crete way. In 2008, the sales growth of
Pirkka products was nearly double that
of the groceries and the total number of
products reached about 1,700 at the end
of the year. The number of Pirkka prod-
ucts has increased by about 200 during
the past three years. According to con-
sumer studies, customers feel that Pirkka
products are an easy and safe choice
because of their high quality and low
Kesko Food 42.7%
Others total 57.3%
Kesko Food 56.1%
Others total 43.9%
Kesko Food's share of
Group's net sales, %
Kesko Food's share of
Group's operating profit
excl. non-recurring items, %


18 Kesko’s year 2008
price. The most recent consumer survey,
conducted in the autumn 2008, confirms
that customers consider low prices, reli-
ability, Finnish origin and constant
renewing as the greatest strengths of the
Pirkka range. Pirkka also has the follow-
ing sub-ranges: Pirkka organic, Pirkka
Fairtrade and Pirkka Parhaat, which con-
sists of premium products.
K-citymarkets offer their customers
diversified and wide selections of grocer-
ies and home and speciality goods. Their
low prices, committed personnel and the
best selections strengthen the customer
promise which is “Good shopping. And a
whole lot more.” There are 64 K-citymar-
kets in Finland in 49 towns. In 2008, new
K-citymarkets were opened in Kuopio,
Pori, Jämsä, Tornio, Klaukkala in Nurmi-
järvi, Kemi, Ylivieska and Oulu. Currently
there are K-citymarkets under construc-
tion in Koivukylä in Vantaa, the Skanssi
shopping centre in Turku, Ylöjärvi, Kirk-
konummi, and Linnainmaa in Tampere.
K-supermarkets' customer promise is
“A better than average food store”. Com-
petitive advantages include food exper-
tise as well as wide and diversified selec-
tions of fresh products. At K-supermar-
kets, in addition to the retailer and other
staff, customers are also served by over
160 employees with a specialist food
manager qualification. These meat and
fish experts give customers cooking
advice. The chain consists of 163 stores.
In 2008, 13 new K-supermarkets were
opened and four K-supermarkets are
currently under construction.
K-markets are high-quality and reli-
able food stores located near customers.
In addition to the good basic selections,
K-markets offer customers freshly baked
local bread, high-quality fruit and veg-
etables, versatile ready-to-eat food
choices and the best local services. Many
Neste and Teboil service stations also
have a K-market on their premises. The
customer promise is “The retailer takes
care of it”. 14 new K-market stores were
opened in 2008. The chain comprises 469
stores.
K-extras are neighbourhood stores
which provide customers with daily
essentials and which focus on personal
service. Additionally, as the name
implies, many K-extras located in the
countryside offer extra services, such as
the sale of agricultural and builders’ sup-
plies, fuel distribution, lottery and postal
services. The customer promise of the
K-extra chain is “Good service for you”.
The chain comprises 210 stores.
The most comprehensive store network in Finland for various customer needs The K-food store concepts cater for vari-
ous consumer needs from daily local
services to hypermarkets which also carry
a wide range of clothing and other home
and speciality goods. The K-food store
network is the most comprehensive in
Finland. More than 45% of Finns live less
than a kilometre away from a K-food
store. The K-Group's neighbourhood
store network is the most comprehensive
in Finland. The total number of K-mar-
kets and K-extras is 679.
Kesko Food actively develops the
K-food store network by investing in
stores of all sizes. The constant develop-
ment of the network is required to meet
the needs of ageing stores, expanding
selections, new services and migration.
Efficient operations and use of customer information enable high quality and low pricesThrough chain operations, Kesko Food
ensures a strong operational base for
K-retailers in terms of sourcing and pur-
chasing, formation of selections, market-
ing and price competition. Permanently
low prices are reinforced by efficient
practices all the way from customer to
supplier, chain operations and long-term
cooperation models with selected part-
ners. Considerable benefits are obtained
both in Finland and internationally by
combining purchasing volumes. Kesko
Food is a member of the rapidly expand-
ing international sourcing alliance, Asso-
ciated Marketing Services (AMS).
A prerequisite of Kesko Food's success
is customer satisfaction in K-food stores.
The efficient use of customer information,
building store- and chain-specific selec-
tions and services, and fast reaction to
changing customer needs create the basis
for improving customer satisfaction. Lev-
eraging customer information relies on
customer and product group level infor-
mation produced by K-Plus Oy.
Kesko Food's Product Research and K-test kitchen guarantee quality
TNS Gallup's study on the attitude
of Finns towards product safety was
presented in spring 2008. According
to the study, Finnish consumers are
of the opinion that retail stores have
a very important role to play in
ensuring product safety.
Quality assurance of Pirkka products
is carried out by Kesko's own Product
Research Unit and K-test kitchen. The
Product Research Unit approves all
own label products to be included in
the selections and the K-test kitchen
develops and tests all recipes that will
be published. In 2008, the Unit tested
about 9,400 samples and developed
860 recipes. The Unit employs 20
professionals, including home eco-
nomics teachers, research chemists
and laboratory workers.
19Kesko’s year 2008
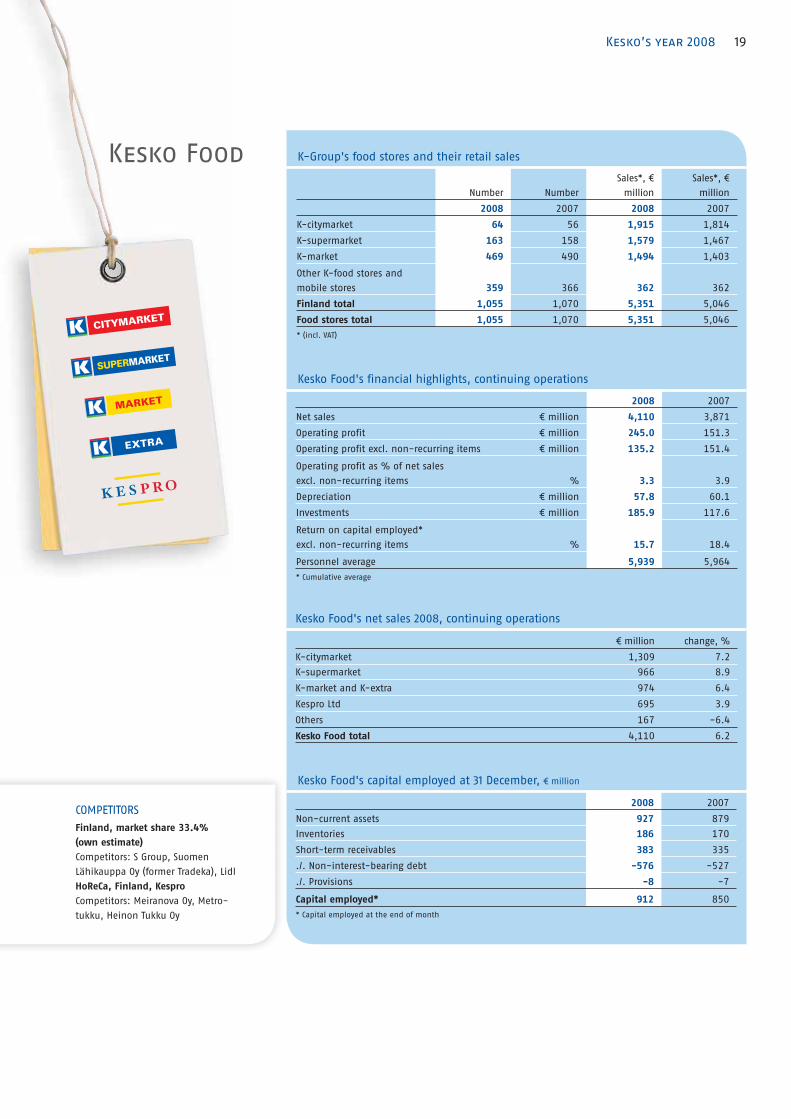
Kesko Food
Number Number
Sales*, €
million
Sales*, €
million
2008 2007 2008 2007
K-citymarket 64 56 1,915 1,814
K-supermarket 163 158 1,579 1,467
K-market 469 490 1,494 1,403
Other K-food stores and
mobile stores 359 366 362 362
Finland total 1,055 1,070 5,351 5,046
Food stores total 1,055 1,070 5,351 5,046
* (incl. VAT)
K-Group's food stores and their retail sales
2008 2007
Net sales € million 4,110 3,871
Operating profit € million 245.0 151.3
Operating profit excl. non-recurring items € million 135.2 151.4
Operating profit as % of net sales
excl. non-recurring items % 3.3 3.9
Depreciation € million 57.8 60.1
Investments € million 185.9 117.6
Return on capital employed*
excl. non-recurring items % 15.7 18.4
Personnel average 5,939 5,964
* Cumulative average
Kesko Food's financial highlights, continuing operations
€ million change, %
K-citymarket 1,309 7.2
K-supermarket 966 8.9
K-market and K-extra 974 6.4
Kespro Ltd 695 3.9
Others 167 -6.4
Kesko Food total 4,110 6.2
Kesko Food's net sales 2008, continuing operations
2008 2007
Non-current assets 927 879
Inventories 186 170
Short-term receivables 383 335
./. Non-interest-bearing debt -576 -527
./. Provisions -8 -7
Capital employed* 912 850
* Capital employed at the end of month
Kesko Food's capital employed at 31 December, € million
COMPETITORS
Finland, market share 33.4%
(own estimate)
Competitors: S Group, Suomen
Lähikauppa Oy (former Tradeka), Lidl
HoReCa, Finland, Kespro
Competitors: Meiranova Oy, Metro-
tukku, Heinon Tukku Oy

21Kesko’s year 2008
Store- and chain-specific customer
programmes as well as those available
in all chains are built on the basis of the
information to ensure that customers'
service experience in K-food stores will
be as good as possible. Extensive infor-
mation about the customer groups' pur-
chasing behaviour which is produced by
K-Plussa, the K-Group's customer loyalty
card, is used for the benefit of customers
in selection planning, targeted special
offers and rewarding customers.
Year 2008Kesko Food's net sales totalled €4,110
million in 2008, an increase of 6.2%.
Kesko Food's operating profit excluding
non-recurring items was €135.2 million,
which represented a decrease of €16.2
million from 2007. The retail sales of
K-food store chains totalled €5,351 mil-
lion in 2008, an increase of 6.0% over
the previous year.
It is estimated that the total grocery
market in Finland grew in January-
December 2008 by approximately 9%
over the previous year (own estimate)
and the average monthly increase in
prices was about 7.6% (Statistics Finland).
During the year, eight new K-citymar-
kets, 13 K-supermarkets, 14 K-markets
and five K-extras were opened. A total of
40 new food stores were opened, three
of which replaced existing stores. Ten
extension projects and several renova-
tions were also carried out in 2008.
ObjectivesThe implementation of Kesko Food's
strategy aims at growth faster than the
market, higher customer satisfaction and
competitiveness. Kesko Food's opportu-
nities for internationalisation will also be
actively surveyed.
Anttila, home and speciality goods of
K-citymarket and other home and speci-
ality goods companies of the Kesko Group
will intensify their cooperation in 2009.
Synergy benefits are sought, above all,
in product sourcing and purchasing,
management and customer relationship
management.
Significant launches in the Pirkka range
In 2008, many significant new
products were launched in the Pirkka
range. Important high-volume
products launched in February were
Pirkka milk, cream and butter, made
using Finnish ingredients. Pirkka beer
was launched on the market later in
spring, and many consumers were
pleased with the taste. A completely
new sub-range called Pirkka Parhaat
was also launched on the market,
with premium products for moments
of indulgence.
Eight new Pirkka Fairtrade products
were also launched during the year,
the most important of which were
Pirkka Fairtrade bananas and Pirkka
yogurt, which combines Fairtrade
ingredients and Finnish milk. The
Pirkka range has made Fairtrade
products accessible to consumers
throughout Finland, which is why the
Association for Promoting Fairtrade in
Finland awarded Kesko Food with its
annual prize in December.
Throughout 2008, new Pirkka
products were frequently included in
consumers' and taste juries' tests
carried out by different media and
succeeded excellently both in terms
of quality and price. Kesko Food's
Product Research Unit is committed
to ongoing development and quality
control of the range. Quality, price,
and innovation have brought success
to the range in competitions, too.
The prizes won by Pirkka products in
recent years include the Finnish Food
Product of the Year and the Organic
Product of the Year.

22 Kesko’s year 2008
Rautakesko 26.2%
Others total 73.8%
Rautakesko 22.1%
Others total 77.9%
Rautakesko's share of
Group's net sales, %
Rautakesko's share of
Group's operating profit
excl. non-recurring items, %
Rautakesko
Rautakesko is engaged in the
building and home improvement
trade in Finland, Sweden, Norway,
the Baltic countries, Russia, and
Belarus. It manages and develops
its retail chains K-rauta, Rautia,
Byggmakker, Senukai and OMA and
also B-to-B sales in its operating
area. Rautakesko is responsible for
the chains' concepts, marketing,
sourcing and logistics services,
store network, and for retailer
resources in Finland. Rautakesko
also acts as a retailer in Sweden,
Estonia, Latvia, Lithuania, Belarus,
Russia, and in Norway, where
retailer entrepreneurs are also
active.
The building and home improvement marketRautakesko's building and home
improvement store chains K-rauta, Rau-
tia, Byggmakker and Senukai serve both
consumer and professional customers.
Consumer customers mainly comprise
home builders, renovators and interior
decorators. Important professional cus-
tomers include construction companies,
the manufacturing industry and public
institutions. Rautakesko aims to be the
leading service provider in the building
and home improvement trade.
In terms of its chains' sales, Rautakesko
is one of the five largest companies in
the European building and home
improvement market. The principal Euro-
pean competitors operating in Rautake-
sko's market area are Castorama (King-
fisher Group), Leroy Merlin (Groupe Adeo),
OBI, DT Group (Wolseley Group), Bauhaus
and Hornbach.
The total retail market of this sector in
Rautakesko's operating area amounts to
some €17 billion. It is estimated that the
overall market change in the 2008 build-
ing and home improvement trade in
Estonia and Latvia was -15%, and in
Norway, Sweden, Finland and Lithuania
between -5% and 0%. The increase in
the Russian market is estimated at over
15%. The main reason for the decrease in
demand has been the decline in con-
struction. Falling prices of wood materials
and basic construction supplies in par-
ticular have also contributed negatively.
Retail sales of Rautakesko's chains
totalled €3,616.1 million (incl. VAT) in
2008.
Finland
The Finnish retail market in the building
and home improvement sector totals
some €4.0 billion (Finnish Hardware
Association, DIY) and declined by 0.9%
in 2008 (Finnish Hardware Association,
DIY). The K-Group's market share in this
sector was some 36% (own estimate).
In Finland, Rautakesko operates the
K-rauta and Rautia retail chains and
Rautakesko B-to-B Service which serves
construction companies, the manufactur-
ing industry and other nationwide and
regional professional customers.
The K-rauta chain consists of 42 stores,
with some 66% of sales going to con-
sumers. The Rautia chain consists of 102
stores. The emphasis in the sales struc-
ture of Rautia is more on basic building
products. Sales to consumers account for
about 64% of total sales. All Finnish
K-rauta and Rautia stores are run by
retailer entrepreneurs. 47 of Rautia stores
operate as combined Rautia-K-maatalous
stores, which are also engaged in the
agricultural trade.
The combined sales of the K-rauta and
Rautia chains, Rautakesko B-to-B Service
and K-customer contract stores in Finland
were €1,225.4 million (incl. VAT).
The principal competitors in Finland
are Starkki, S Group and Bauhaus.
Sweden
The Swedish building and home
improvement market totals some €4.0
billion (SCB, HUI), down by 5% in 2008
(HUI).
At the end of 2008, Rautakesko had 19
K-rauta stores of its own and one
retailer-owned store in Sweden. Retail
sales of K-rauta stores in Sweden totalled
€233.5 million (incl. VAT). Rautakesko's
market share is about 4.5% (own esti-
mate).
Private customers account for around
85% of K-rauta clientele. Principal com-
petitors are Bauhaus, Byggmax, DT Group
(Beijer, Silvan and Cheapy), and local
speciality stores.
Norway
The Norwegian building and home
improvement market totals some €5.2
billion (TBF), down by 0.1% in 2008 (TBF).
In Norway, Rautakesko owns Bygg-
makker Norge AS, which manages the
Byggmakker chain of 120 building and
home improvement stores, 18 of which
are owned by Byggmakker. Other stores
within the chain are owned by retailer
entrepreneurs who have chain agree-
ments with Byggmakker. Retail sales of
the chain's stores totalled €1,117.9 million
(incl. VAT) in 2008. Rautakesko's market
share in Norway is about 18% (own esti-
mate). More than half of all sales are to
professional customers. Rautakesko's
competitors are Monter/Optimera (Saint
Gobain), Maxbo and Coop.


24 Kesko’s year 2008
Estonia
The Estonian building and home
improvement market totals some €0.38
billion (own estimate) and in 2008 the
market decreased by 15% (own estimate).
Rautakesko has eight K-rauta stores and
a nationwide network of wholesale out-
lets in Estonia. Retail sales of K-rauta
stores totalled €96.0 million (incl. VAT) in
2008. Professional customers account for
some 63% of all customers. Rautakesko's
market share in Estonia is about 20%
(own estimate). Rautakesko's competitors
are Ehitus ABC (Saint Gobain), Bauhof
and Espak.
Latvia
The Latvian building and home improve-
ment market totals approximately €0.5
billion (CSB), a decrease of 15% in 2008
(CSB). Rautakesko has eight K-rauta
stores of its own and two K-rauta part-
ner stores in Latvia. Retail sales of
K-rauta stores totalled €86.8 million
(incl. VAT) in 2008. Professional custom-
ers account for some 43% of all custom-
ers. It is estimated that Rautakesko's
market share in Latvia is 16% (own esti-
mate). Rautakesko's competitors are
Depo DIY, Tapeks/Aile and Kursi.
Lithuania
The Lithuanian building and home
improvement market totals some €0.6
billion (own estimate) and it was at the
same level as in the previous year (own
estimate). In Lithuania, Rautakesko has
the majority shareholding in UAB Senuku
Prekybos centras, which is the market
leader in Lithuania with a share of about
25%. The Senukai chain consists of 15
stores of its own and 76 partnershop
stores. Senukai's retail sales totalled
€532.5 million (incl. VAT) in 2008. Profes-
sional customers account for some 42%
of all clientele. Senukai sells to both
consumers and business customers.
Senukai's competitors include local
building supplies outlets and speciality
stores.
Russia
The building and home improvement
market in the St. Petersburg area totals
some €1.0 billion (own estimate), an
increase of 15–20% in 2008 (Ros Business
Consulting and own estimate).
There are nine K-rauta stores in St.
Petersburg and their retail sales totalled
€239.8 million (incl. VAT) in 2008. Profes-
sional customers account for some 36%
of all clientele. Rautakesko's market
share in the St. Petersburg area is about
15% (own estimate). Rautakesko's com-
petitors are Maxidom, Metrica, OBI, Cas-
torama and Leroy Merlin.
Belarus
The building and home improvement
market in Belarus totals some €1.3 billion
(own estimate). OMA, the company
acquired by Senukai in Belarus in July
2007, has three stores. The market share
of OMA is about 5% of the total market
(own estimate) and its retail sales
amounted to €84.3 million (incl. VAT) in
2008.
Strong chain conceptsRautakesko's operations are based on
strong chain concepts, efficient sourcing,
and the best practices, which are dupli-
cated internationally. Rautakesko oper-
ates in the background of the chains,
combining their category management,
purchasing, logistics, information system
control and network improvements. The
synergy benefits and economies of scale
achieved enable the company to offer
products and services to customers at
competitive prices.
K-rauta is Rautakesko's international
concept. K-rauta operates in Finland,
Sweden, Estonia, Latvia and St. Peters-
burg, Russia. The renewed K-rauta con-
cept focuses on wide selections, total
solutions planned to make customers' life
easier and a good price-quality ratio. The
widening of the traditional building and
home improvement concept has also
expanded the clientele: about one third
of all customers are women. The concept
has succeeded in combining the service,
selections and business models for con-
sumers, builders and professional cus-
tomers. Overall, the K-rauta chain's com-
petitive advantages include larger indoor
and outdoor stores than those of its
competitors.
Rautia is the largest building and
home improvement store chain in Fin-
land. Its selections are targeted at build-
ers, renovators and building profession-
als in particular. Key competitive advan-
Own brands strengthened
The strong development of Rauta-
kesko's own international brands
continued. Prof, Cello, Fiorin and
FXA offer a reliable and affordable
solution for the building and
renovation needs of both consumer
and professional customers.
The number of our own brand
items grew by 250 in 2009 and the
total number reached 1,300 by the
end of the year. Sales growth of our
own brands clearly exceeded average
growth in sales. Cello, Rautakesko's
own brand for interior decoration, for
example, accounted for around 15%
of the total sales of interior paints in
Finland (own estimate).
Rautakesko's partnership in
tooMax-x, the purchasing company,
will further improve our opportunities
to offer more comprehensive and
competitively priced selection of our
own brands.
25Kesko’s year 2008
Rautakesko
2008 2007
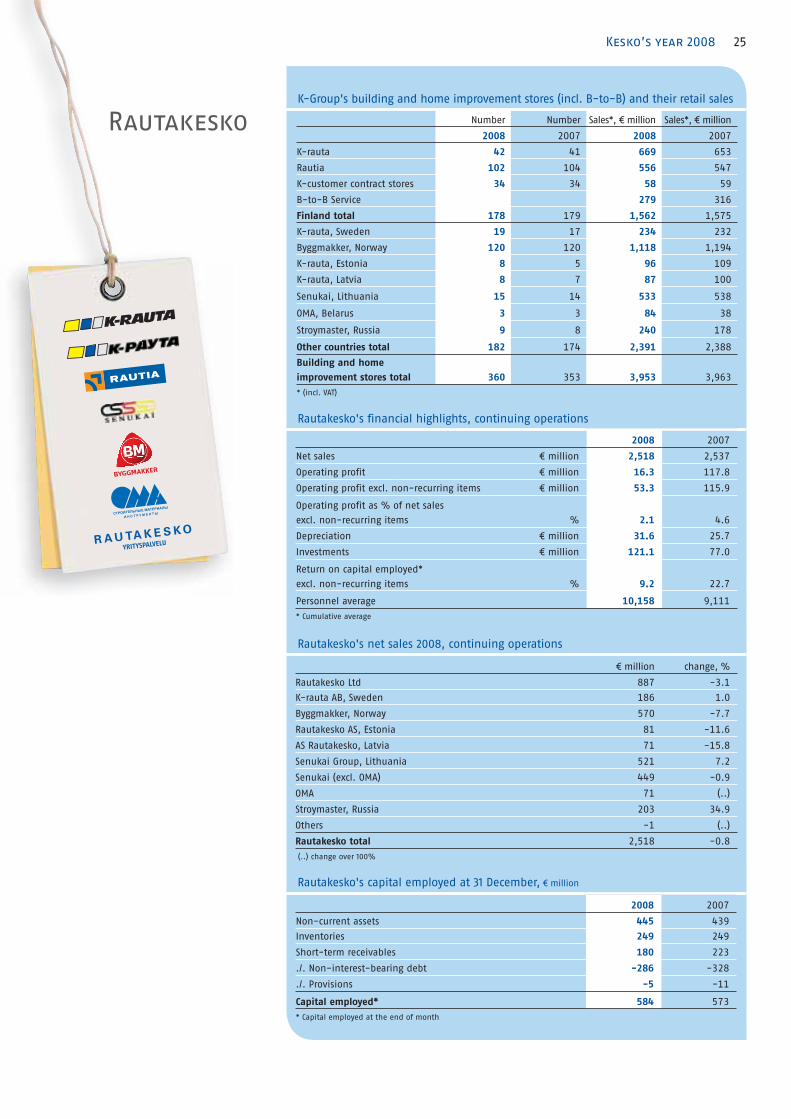
Net sales € million 2,518 2,537
Operating profit € million 16.3 117.8
Operating profit excl. non-recurring items € million 53.3 115.9
Operating profit as % of net sales
excl. non-recurring items % 2.1 4.6
Depreciation € million 31.6 25.7
Investments € million 121.1 77.0
Return on capital employed*
excl. non-recurring items % 9.2 22.7
Personnel average 10,158 9,111
* Cumulative average
Rautakesko's financial highlights, continuing operations
Number Number Sales*, € million Sales*, € million
2008 2007 2008 2007
K-rauta 42 41 669 653
Rautia 102 104 556 547
K-customer contract stores 34 34 58 59
B-to-B Service 279 316
Finland total 178 179 1,562 1,575
K-rauta, Sweden 19 17 234 232
Byggmakker, Norway 120 120 1,118 1,194
K-rauta, Estonia 8 5 96 109
K-rauta, Latvia 8 7 87 100
Senukai, Lithuania 15 14 533 538
OMA, Belarus 3 3 84 38
Stroymaster, Russia 9 8 240 178
Other countries total 182 174 2,391 2,388
Building and home
improvement stores total 360 353 3,953 3,963
* (incl. VAT)
K-Group's building and home improvement stores (incl. B-to-B) and their retail sales
€ million change, %
Rautakesko Ltd 887 -3.1
K-rauta AB, Sweden 186 1.0
Byggmakker, Norway 570 -7.7
Rautakesko AS, Estonia 81 -11.6
AS Rautakesko, Latvia 71 -15.8
Senukai Group, Lithuania 521 7.2
Senukai (excl. OMA) 449 -0.9
OMA 71 (..)
Stroymaster, Russia 203 34.9
Others -1 (..)
Rautakesko total 2,518 -0.8
(..) change over 100%
Rautakesko's net sales 2008, continuing operations
2008 2007
Non-current assets 445 439
Inventories 249 249
Short-term receivables 180 223
./. Non-interest-bearing debt -286 -328
./. Provisions -5 -11
Capital employed* 584 573
* Capital employed at the end of month
Rautakesko's capital employed at 31 December, € million
Rautakesk

27Kesko’s year 2008
tages include comprehensive customer
service, knowledge of the local market
and the cooperation network. Many
Rautia stores also complement their
range with agricultural items.
Byggmakker is the largest building
and home improvement store chain in
Norway. The chain's principal business
model is retailer entrepreneurship. Spe-
cial strengths include sales of building
supplies and knowledge of professional
customers. The Norwegian concept has
undergone a reform and 25–30 Bygg-
makker stores are annually refurbished
to comply with the new concept. The first
large full-service Byggmakker outlet of
the new type was opened in 2008.
The Senukai chain is the market leader
in Lithuania. The chain also incorporates
the Mega Store concept, which offers cus-
tomers just about every product related
to building and living at its stores of over
20,000 m2.
Rautakesko B-to-B Service operates
in Finland. Its customers include nation-
wide construction companies, the manu-
facturing industry and other professional
customers. Rautakesko B-to-B Service's
strengths include close cooperation with
the network of Finnish K-rauta and Rau-
tia stores through which a significant part
of deliveries are made.
Year 2008Rautakesko's net sales totalled €2,518
million, representing a decrease of 0.8%.
Net sales in Finland amounted to €882
million, down by 3.0%. The net sales of
subsidiaries in other countries totalled
€1,636 million; the increase was 0.5%.
Foreign subsidiaries accounted for 65%
of Rautakesko's net sales.
Rautakesko's operating profit excluding
non-recurring items was €53.3 million,
down by €62.6 million. Rautakesko's
investments totalled €121 million, with
investments outside Finland accounting
for 80.1%.
Strong reforms in the store network
continued in 2008. In Finland, eight new
stores were opened, of which two were
replacement investments. In other coun-
tries, a total of 13 new stores were opened,
of which one was a replacement invest-
ment. In Finland, new K-rauta stores
opened in Raisio and Lohja, a new Rautia
store in Ivalo and Rautia-K-maatalous
stores in Huittinen, Sodankylä and
Kajaani.
In Sweden, new K-rauta stores were
opened in Stockholm and Göteborg, in
Estonia in Võru, Rakvere and Kuressaare,
in Latvia in Rezekne, and in Lithuania in
Klaipeda. In Russia, a new store was
opened along the Peterhof Highway, in
the Krasnoselskiy district and in Norway
Byggmakker opened a new type large
full-service store in Trondheim.
In 2008, Rautakesko actively sought
synergy benefits in order to develop and
improve the efficiency of its international
operations. In October 2008, Rautakesko
signed a partnership agreement with
tooMax-x Handels GmbH, a DIY purchas-
ing alliance. Thanks to the expanding
international purchasing cooperation,
Rautakesko is able to provide an increas-
ingly comprehensive and competitively
priced selection of products for the cus-
tomers of its store chains. Rautakesko's
partnership in tooMax-x made it the
third largest European sourcing channel
for home building and interior decoration
items.
Building the international logistics
network is part of Rautakesko's strategic
development. Itella Logistics was chosen
as Rautakesko's international logistics
partner. The cooperation agreement
signed in November first extends the
operation to Norway and Sweden, and
subsequently to other Rautakesko's oper-
ating countries in the Baltic countries
and Russia.
Best Practice Retail Solution (BPRS) is
Rautakesko's business harmonisation
project, which aims at introducing uni-
form business models and retail store
information systems in the company's
various operating countries by the end
of 2011.
The Rautia store concept was renewed
in 2008. The aim is to renovate the cur-
rent store network to comply with the
new concept within the next five years.
A new kind of business model for pro-
fessional customers was piloted with the
help of Rautakesko's Cello. The online
service will improve the purchasing effi-
ciency and speed of construction compa-
nies and widen the choice available to
customers. Cooperation targets with VVO
were set in 2008 and enhancement of
COMPETITORS
Finland, market share 36%
(own estimate)
Competitors: Starkki, S Group and Bauhaus
Sweden, market share 4.5%
(own estimate)
Competitors: Bauhaus, Byggmax, DT Group
(Beijer, Silvan and Cheapy), and local
speciality stores
Norway, market share 18%
(own estimate)
Competitors: Monter/Optimera
(Saint Gobain), Maxbo and Coop
Estonia, market share 20%
(own estimate)
Competitors: Ehitus ABC (Saint Gobain),
Bauhof and Espak
Latvia, market share 16% (own estimate)
Competitors: Depo DIY, Tapeks/Aile and Kursi
Lithuania, market share some 25%
(own estimate)
Competitors: local building supplies outlets
and speciality stores
Russia, St. Petersburg area, market share
15% (own estimate)
Competitors: Maxidom, Metrica, OBI,
Castorama and Leroy Merlin

28 Kesko’s year 2008
electronic operations in the B-to-B busi-
ness will continue in 2009.
In September 2008, K-rauta and
Finndomo Oy signed an agreement on
starting the sale of Finndomo's one-fam-
ily houses at K-rauta stores in Russia. The
first point of sales was opened in K-rauta
Rustaveli in St. Petersburg. Finndomo
built twelve one-family houses on
Russia's first housing fair area in St.
Petersburg.
Responsibility
In 2008, Rautakesko focused strongly on
the implementation of the K-environ-
mental store system and made a deci-
sion to incorporate the system into all
chains' business concept during the year
2009.
Rautakesko and its chains promote
energy-efficient and healthy living. Rau-
tia published a guidebook supporting
these targets to help builders and reno-
vators of one-family houses or holiday
homes.
Rautakesko has been cooperating with
the Pulmonary Association Heli since
2005. The K-rauta and Rautia chains have
supported the renovation of mould-
affected one-family houses by providing
the required supplies for interior decora-
tion, sanitary areas and ventilation free
of charge. During the years 2009 and 2010
cooperation will focus on drawing up
renovation guidelines and training sales
people of the K-Group's building and
home improvement stores.
Fredrik Flygare, K-rauta AB's HR Man-
ager, was voted the Swedish HR Manager
of the Year. The recognition was given by
Market magazine, Svensk Handel (the
Swedish Trade Federation), which is the
trading sector interest group, and Retail
Knowledge.
ObjectivesRautakesko continues to strengthen the
present store network. In 2009, three
new stores will be opened in the Moscow
area. Two new stores will open in Swe-
den, and one in Estonia, Latvia and
Lithuania each. Three new K-rauta stores
and one Rautia-K-maatalous store will
be opened in Finland.
Cooperation with tooMax-x will
increase Rautakesko's purchasing effi-
ciency. By the end of 2010, most of the
company's purchases from the Far East
will take place through this partnership.
In line with the cooperation agreement
made with Itella Logistics, Rautakesko's
international logistics network will first
expand to Norway and Sweden, and after
that to other Rautakesko's operating
countries in the Baltics and Russia.
During 2009, the Best Practice Retail
Solution, Rautakesko's most important
project that aims to a uniform business
model, will proceed to cover besides
Norway also Russia, Sweden, Estonia and
Latvia.
Customer purchasing behaviour and
consumption habits are becoming more
and more versatile. Besides traditional
shopping in physical stores, the use of
the Internet as a channel providing
information and shopping sites will be
emphasised. New international service
providers enter the market and new
business models arise. The importance
of energy efficiency, environmental val-
ues and responsibility in consumers'
decision-making will increase.
Interior decoration, renovation and
building repair will gain more impor-
tance. Growing product groups include
above all interior decoration, yard and
garden supplies. Demand for various
services, such as design, transport and
assembly, is expected to increase further.
The new K-rauta store concept focuses
on interior decoration and gardening.
Product groups and categories are pre-
sented in a centralised display area close
to desks providing service and design
assistance. More comprehensive product
information and signage facilitate and
increase the efficiency of self-service.
Online services support the customers
looking for information and making deci-
sions in their planning and purchasing
process.
Choice for tomorrow
In March 2008, Rautakesko published
a guidebook on sustainable housing,
distributed free of charge in all
K-rauta and Rautia stores. The guide,
the theme of which is “Choice for
tomorrow”, gives practical tips and
instructions for Finnish consumers on
how to reduce their housing-related
environment impact.
On 31 March 2008, 18 K-rauta,
Rautia and K-maatalous stores
received a K-environmental store
diploma as a proof for their
environment-saving actions. The
K-rauta, Rautia and K-maatalous
chains have made a decision that all
stores in Finland will be K-environ-
mental stores by the end of 2009.
Rautakesko's Cello became the first
range of indoor paints in Finland to
be granted the M1 classification and
the Allergy Label. These safety symbols
were granted to all products of the
range: wall paints, ceiling paints and
primers. Cello interior paints are
water-soluble, solvent-free and
nearly odourless.

29Kesko’s year 2008
VV-Auto
VV-Auto imports and markets
Volkswagen, Audi and Seat pas-
senger cars and Volkswagen com-
mercial vehicles in Finland. VV-
Auto is also engaged in car retail-
ing and provides after-sales
services at its own outlets in the
Greater Helsinki area and Turku.
VV-Auto's subsidiary Auto-Span Oy
imports Seat passenger cars and
markets them in Finland, Estonia
and Latvia.
MarketIn 2008, 139,647 new passenger cars and
15,522 vans were registered in Finland.
The passenger car market increased by
11.2% over the previous year thanks to
the car tax reform which became effec-
tive in early 2008. Registrations of new
vans decreased by 8.1% over the previous
year.
The market position of passenger cars
imported by VV-Auto strengthened in
2008. Volkswagen increased its market
share and held the second place in the
registration statistics of passenger cars.
The new car tax system, which is based
on carbon dioxide emissions, boosted
sales of diesel passenger cars. Diesel pas-
senger cars accounted for nearly 50% of
all new registrations in Finland. Volkswa-
gen is one of the leading brands in diesel
passenger cars. Audi also increased its
market share and maintained its position
as the most wanted premium brand. The
introduction of new Seat models and
improved price competitiveness increased
the brand's market share.
The Volkswagen range continued to
expand in 2008. Launches included the
new Passat CC and Scirocco, and the new
Golf towards the end of the year. The
Caddy range expanded with new Maxi
models. The Audi A3, A4 and A6 ranges
were renewed during the year and com-
plemented with the new Audi Q5. The
new arrival to the Seat range was Seat
Ibiza. In 2008, the market share of
Volkswagen passenger cars in Finland
was 11.8% and that of Volkswagen vans
15.9%. Audi had a market share of 4.2%
and Seat’s share was 1.3%. Seat's market
share was 1.5% in Estonia and 0.6% in
Latvia.
Year 2008VV-Auto's net sales totalled €884 million
in 2008, up by 9.9% over the previous
year. The operating profit excluding non-
recurring items was €36.3 million, com-
pared with €26.1 million in 2007.
In terms of vehicle numbers, VV-Auto's
own outlets in the Greater Helsinki area
and Turku accounted for about one third
of all new Volkswagen and Audi retail
sales.
VV-Auto's retail sales network consists
of 40 dealer shops selling Volkswagens
and 64 service work shops. The figures for
Audis are 17 and 41. Seats are sold by 26
dealers and maintained and repaired by
44 work shops, three of which are located
in the Baltic countries.
In 2008, the customer relationship
management system was further
enhanced on a centralised basis and
the system will be gradually adopted
throughout the dealer network. The com-
pletion of the Vuosaari harbour caused
some changes in car logistics. The joint
logistics centre of VV-Auto and SE Mäkinen
Logistics Ltd in Vantaa offers import-
related transport, pre-delivery and stor-
age services for the cars imported by VV-
Auto.
In September 2008, an Audi exclusive
sales outlet serving business and private
customers was opened in connection
with the Flamingo recreational centre in
Vantaa.
ObjectivesVV-Auto aims to increase the market
share of the brands it represents during
2009 and to continue to enhance its
network of retail outlets. The focus will
be on expanding the range of services
and the use of the centralised customer
relationship management system and on
improving electronic customer communi-
cations. Special attention will be paid to
improving work productivity in the com-
pany.
The car tax reform based on environ-
mental aspects will continue in 2009.
According to the amendment presented
by the Government on 6 November 2008,
the car tax of vans will in the future be
based on the consumer price instead of
the cif price as currently. At the same
time, the tax rate will be staggered on
the basis of carbon dioxide emissions,
according to the vehicle's fuel consump-
tion. After the change, taxation of vans
will be in line with that of passenger
cars. The change will also involve abol-
ishing the current tax that is equivalent
to the VAT and paid in addition to the tax
of passenger cars and vans, and raising
the car tax rate to offset the resulting loss
of revenue. The car tax will also become
a pass-through item, which will not be
presented in the final net sales. The
changes will enter into force on 1 April
2009.
VV-Auto 9.2%
Others total 90.8%
VV-Auto 15.1%
Others total 84.9%
VV-Auto's share of
Group's net sales, %
VV-Auto's share of
Group's operating profit
excl. non-recurring items, %

30 Kesko’s year 2008
MARKET SHARES
Finland
Volkswagen cars 11.8%
Audi cars 4.2%
Seat cars 1.3%
Volkswagen vans 15.9%
Estonia
Seat cars 1.5%
Latvia
Seat cars 0.6%
2008 2007
Net sales € million 884 805
Operating profit € million 36.3 26.1
Operating profit excl. non-recurring items € million 36.3 26.1
Operating profit as % of net sales
excl. non-recurring items % 4.1 3.2
Depreciation € million 4.7 5.7
Investments € million 6.9 6.3
Return on capital employed*
excl. non-recurring items % 28.2 22.0
Personnel average 744 737
* Cumulative average
VV-Auto's financial highlights, continuing operations
Number Number
Sales*, €
million
Sales*, €
million
2008 2007 2008 2007
VV-Autotalot Helsinki and
Turun VV-Auto 6 5 496 426
* (incl. VAT)
K-Group's car stores (Finland) and their retail sales
€ million change, %
VV-Auto Group 884 9.9
VV-Auto's net sales 2008, continuing operations
2008 2007
Non-current assets 43 44
Inventories 120 130
Short-term receivables 33 31
./. Non-interest-bearing debt -45 -44
./. Provisions -12 -11
Capital employed* 139 151
* Capital employed at the end of month
VV-Auto's capital employed at 31 December, € million
The market position of passenger
cars imported by VV-Auto
strengthened in 2008. Volkswagen
Golf was the most purchased
passenger car and Volkswagen
the number one selling brand
of diesel passenger cars in Finland
in 2008.


33Kesko’s year 2008
Anttila
Anttila is the leading home and
speciality goods retailer in Finland.
Anttila serves its customers at
Anttila department stores, Kodin
Ykkönen department stores for
interior decoration and home
goods, and through NetAnttila,
which focuses on distance sales.
Centralised purchasing and logis-
tics combined with an efficient
organisation and operating prac-
tices guarantee competitive prices.
Anttila's operations are based on a
long-term strategy, multi-channel
service and competence in strong,
selected product areas.
Anttila 5.8%
Others total 94.2%
Anttila 8.2%
Others total 91.8%
Anttila's share of
Group's net sales, %
Anttila's share of
Group's operating profit
excl. non-recurring items, %
MarketIn Finland, there are 28 Anttila depart-
ment stores and two smaller speciality
stores. The eight Kodin Ykkönen depart-
ment stores for interior decoration and
home goods are complemented with the
Kodin1.com online store. NetAnttila is
engaged in distance sales and serves its
customers online and with catalogues in
Finland, Estonia and Latvia.
Anttila retails entertainment, fashion
and home goods; their total market in
Finland is estimated at €7–8 billion. The
annual growth in the market has been
3–5%.
Customers of Anttila department stores
value diversified selections of leisure
items, clothing and home goods com-
bined with a low price level and friendly
service.
Kodin Ykkönen provides a superior
selection and services for decorators of
cosy homes. Customers of Kodin Ykkönen
value diversity, interior decoration ideas,
and good design and other service.
For several years, NetAnttila has been
the best-known and most popular online
department store among Finns. Customers
of NetAnttila value its pioneering position,
easy shopping and reliability as well as
low prices and wide selections.
The TopTen department concept is the
largest retailer of music, movies and mul-
timedia in Finland, and a major seller of
information technology and electronics.
Topten.fi pages offer current information
about new products and various events.
Anttila Store is Anttila's new speciality
store which offers, in addition to the
strong TopTen and cosmetics departments,
a selection of products of current interest
that change from one season to another.
Anttila's competitors include depart-
ment stores, hypermarkets, speciality store
chains and online stores. The importance
of discounters as competitors is growing
as they form chains and expand, while
increasing the number of branded goods
in their selections.
StrengthsAnttila focuses on multi-channel home
and speciality goods retailing. Approxi-
mately 26 million customers visit Anttila
every year. There are some 2,100 employ-
ees in the customer service.
Anttila bases its comprehensive selec-
tions on customer wishes, purchasing
behaviour and over 50,000 annual items
of customer feedback. Anttila's strengths
include stores that provide ideas and
sales-oriented service.
Centralised purchasing and effective
support activities enable competitive pric-
ing and quick reactions to market
changes.
Year 2008In 2008, Anttila's net sales totalled €560
million, a decrease of 0.7%. Anttila's
operating profit excluding non-recurring
items was €19.8 million and was down by
€5.4 million.
New department stores were opened in
Pori and Rovaniemi. The store in Pori
replaced the existing outlet. A special
Anttila Store was opened in Nummela,
Vihti.
Because of the economic uncertainty,
sales slowed down during late 2008. Retail
sales of Anttila department stores totalled
€393 million in 2008, representing a
decrease of 1.3%. Sales of Kodin Ykkönen
department stores amounted to €181 mil-
lion, down by 1.9%.
Distance sales increased in Finland by
4.9% and Estonia by 1.4%, but decreased
in Latvia by 17.6%.
ObjectivesAnttila's strategic objectives include
strengthening its market position on a
profitable basis, increasing the appeal of
brands, raising the competence and pro-
ductivity to a high level and increasing
online services.
Anttila's target is healthy sales growth
and good profitability by increasing the
average purchase and the number of cus-
tomer visits. Anttila will continue training
the staff in customer service and sales.
The range of services related to home and
speciality goods will be developed and
marketed actively by leveraging the many
channels the company has at its disposal.
In 2009, a new Anttila department store
will be opened in the Skanssi shopping
centre in Turku and the second Kodin
Ykkönen in Tampere, in Lielahti.
Anttila, home and speciality goods of
K-citymarket and other home and speci-
ality goods companies of the Kesko Group
will intensify their cooperation in 2009.
Synergy benefits are sought, above all, in
goods sourcing and purchasing, manage-
ment and customer relationship manage-
ment.
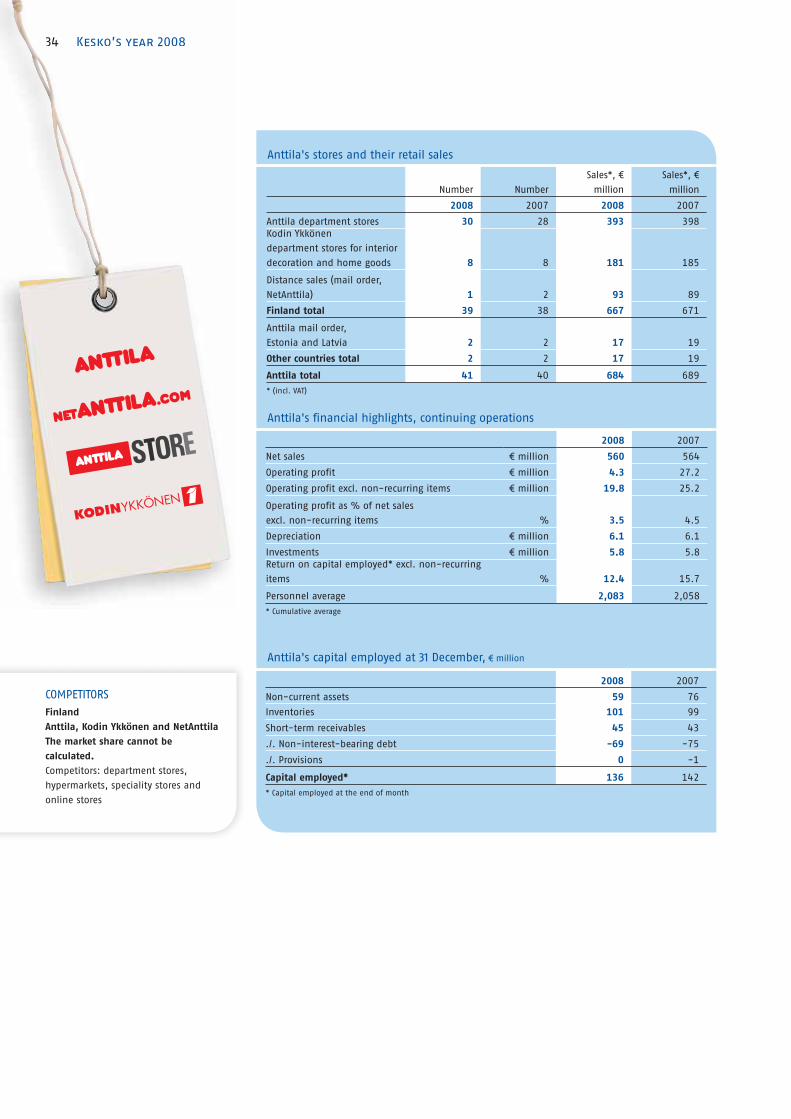
34 Kesko’s year 2008
2008 2007
Net sales € million 560 564
Operating profit € million 4.3 27.2
Operating profit excl. non-recurring items € million 19.8 25.2
Operating profit as % of net sales
excl. non-recurring items % 3.5 4.5
Depreciation € million 6.1 6.1
Investments € million 5.8 5.8
Return on capital employed* excl. non-recurring
items % 12.4 15.7
Personnel average 2,083 2,058
* Cumulative average
Anttila's financial highlights, continuing operations
Number Number
Sales*, €
million
Sales*, €
million
2008 2007 2008 2007
Anttila department stores 30 28 393 398
Kodin Ykkönen
department stores for interior
decoration and home goods 8 8 181 185
Distance sales (mail order,
NetAnttila) 1 2 93 89
Finland total 39 38 667 671
Anttila mail order,
Estonia and Latvia 2 2 17 19
Other countries total 2 2 17 19
Anttila total 41 40 684 689
* (incl. VAT)
Anttila's stores and their retail sales
2008 2007
Non-current assets 59 76
Inventories 101 99
Short-term receivables 45 43
./. Non-interest-bearing debt -69 -75
./. Provisions 0 -1
Capital employed* 136 142
* Capital employed at the end of month
Anttila's capital employed at 31 December, € million
34 Kesko’s year 2008
COMPETITORS
Finland
Anttila, Kodin Ykkönen and NetAnttila
The market share cannot be
calculated.
Competitors: department stores,
hypermarkets, speciality stores and
online stores
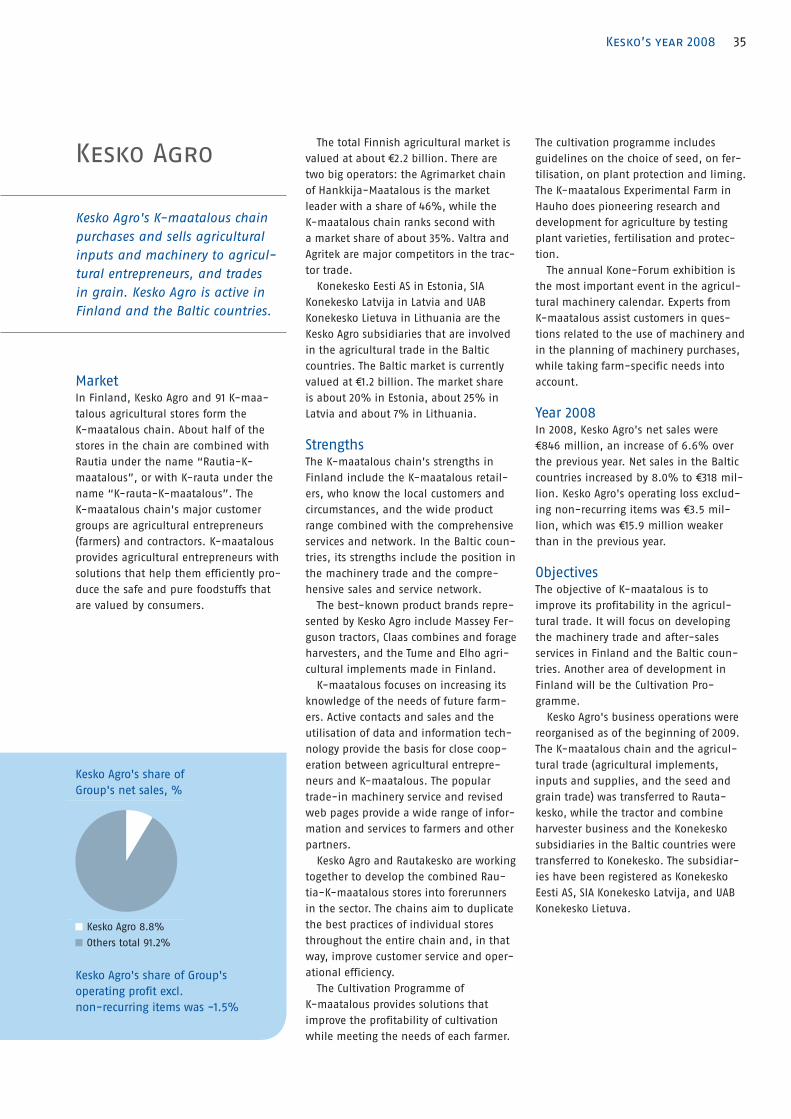
35Kesko’s year 2008
Kesko Agro 8.8%
Others total 91.2%
Kesko Agro's share of
Group's net sales, %
Kesko Agro's share of Group's
operating profit excl.
non-recurring items was -1.5%
Kesko Agro
Kesko Agro's K-maatalous chain
purchases and sells agricultural
inputs and machinery to agricul-
tural entrepreneurs, and trades
in grain. Kesko Agro is active in
Finland and the Baltic countries.
MarketIn Finland, Kesko Agro and 91 K-maa-
talous agricultural stores form the
K-maatalous chain. About half of the
stores in the chain are combined with
Rautia under the name “Rautia-K-
maatalous”, or with K-rauta under the
name “K-rauta-K-maatalous”. The
K-maatalous chain's major customer
groups are agricultural entrepreneurs
(farmers) and contractors. K-maatalous
provides agricultural entrepreneurs with
solutions that help them efficiently pro-
duce the safe and pure foodstuffs that
are valued by consumers.
The total Finnish agricultural market is
valued at about €2.2 billion. There are
two big operators: the Agrimarket chain
of Hankkija-Maatalous is the market
leader with a share of 46%, while the
K-maatalous chain ranks second with
a market share of about 35%. Valtra and
Agritek are major competitors in the trac-
tor trade.
Konekesko Eesti AS in Estonia, SIA
Konekesko Latvija in Latvia and UAB
Konekesko Lietuva in Lithuania are the
Kesko Agro subsidiaries that are involved
in the agricultural trade in the Baltic
countries. The Baltic market is currently
valued at €1.2 billion. The market share
is about 20% in Estonia, about 25% in
Latvia and about 7% in Lithuania.
StrengthsThe K-maatalous chain's strengths in
Finland include the K-maatalous retail-
ers, who know the local customers and
circumstances, and the wide product
range combined with the comprehensive
services and network. In the Baltic coun-
tries, its strengths include the position in
the machinery trade and the compre-
hensive sales and service network.
The best-known product brands repre-
sented by Kesko Agro include Massey Fer-
guson tractors, Claas combines and forage
harvesters, and the Tume and Elho agri-
cultural implements made in Finland.
K-maatalous focuses on increasing its
knowledge of the needs of future farm-
ers. Active contacts and sales and the
utilisation of data and information tech-
nology provide the basis for close coop-
eration between agricultural entrepre-
neurs and K-maatalous. The popular
trade-in machinery service and revised
web pages provide a wide range of infor-
mation and services to farmers and other
partners.
Kesko Agro and Rautakesko are working
together to develop the combined Rau-
tia-K-maatalous stores into forerunners
in the sector. The chains aim to duplicate
the best practices of individual stores
throughout the entire chain and, in that
way, improve customer service and oper-
ational efficiency.
The Cultivation Programme of
K-maatalous provides solutions that
improve the profitability of cultivation
while meeting the needs of each farmer.
The cultivation programme includes
guidelines on the choice of seed, on fer-
tilisation, on plant protection and liming.
The K-maatalous Experimental Farm in
Hauho does pioneering research and
development for agriculture by testing
plant varieties, fertilisation and protec-
tion.
The annual Kone-Forum exhibition is
the most important event in the agricul-
tural machinery calendar. Experts from
K-maatalous assist customers in ques-
tions related to the use of machinery and
in the planning of machinery purchases,
while taking farm-specific needs into
account.
Year 2008In 2008, Kesko Agro's net sales were
€846 million, an increase of 6.6% over
the previous year. Net sales in the Baltic
countries increased by 8.0% to €318 mil-
lion. Kesko Agro's operating loss exclud-
ing non-recurring items was €3.5 mil-
lion, which was €15.9 million weaker
than in the previous year.
Objectives The objective of K-maatalous is to
improve its profitability in the agricul-
tural trade. It will focus on developing
the machinery trade and after-sales
services in Finland and the Baltic coun-
tries. Another area of development in
Finland will be the Cultivation Pro-
gramme.
Kesko Agro's business operations were
reorganised as of the beginning of 2009.
The K-maatalous chain and the agricul-
tural trade (agricultural implements,
inputs and supplies, and the seed and
grain trade) was transferred to Rauta-
kesko, while the tractor and combine
harvester business and the Konekesko
subsidiaries in the Baltic countries were
transferred to Konekesko. The subsidiar-
ies have been registered as Konekesko
Eesti AS, SIA Konekesko Latvija, and UAB
Konekesko Lietuva.

36 Kesko’s year 200836 KeK sko’s year 2008
2008 2007
Net sales € million 846 793
Operating profit € million -3.5 12.9
Operating profit excl. non-recurring items € million -3.5 12.4
Operating profit as % of net sales
excl. non-recurring items % -0.4 1.6
Depreciation € million 6.0 4.3
Investments € million 2.4 7.6
Return on capital employed* excl. non-recurring
items % -2.6 9.4
Personnel average 697 797
* Cumulative average
Kesko Agro's financial highlights, continuing operations
Number Number
Sales*, €
million
Sales*, €
million
2008 2007 2008 2007
K-maatalous 91 95 714 674
Finland total 91 95 714 674
Konekesko Eesti AS, Estonia 6 6 69 81
SIA Konekesko Latvija, Latvia 4 4 152 127
UAB Konekesko Lietuva,
Lithuania 3 3 55 84
Other countries total 13 13 276 293
Agricultural stores total 104 108 990 967
* (incl. VAT)
K-Group's agricultural stores and their retail sales
€ million change, %
Kesko Agro Ltd 528 4.2
Konekesko Eesti AS, Estonia 76 -4.7
SIA Konekesko Latvija, Latvia 185 41.1
UAB Konekesko Lietuva, Lithuania 47 -37.4
Kesko Agro total 846 6.6
Kesko Agro's net sales 2008, continuing operations
2008 2007
Non-current assets 32 41
Inventories 100 136
Short-term receivables 80 69
./. Non-interest-bearing debt -59 -122
./. Provisions -2 -1
Capital employed* 151 123
* Capital employed at the end of month
Kesko Agro's capital employed at 31 December, € million
COMPETITORS
Finland, K-maatalous chain
market share 35% (own estimate)
Competitors: Agrimarket chain of
Hankkija-Maatalous and Yrittäjien
Maatalous
Tractor trade: Valtra and Agritek
Estonia, market share 20%
(own estimate)
Competitors:
Agricultural supplies:
YARA, Farm Plant and Agrochema
Agricultural machinery:
Stokker, Tatoli, Agriland and Taure
Latvia, market share 25%
(own estimate)
Competitors:
Agricultural supplies:
YARA, Farm Plant and Latagra
Agricultural machinery:
Stokker, BFSC, Preiss and Valtek
Lithuania, market share 7%
(own estimate)
Competitors:
Agricultural machinery: Olsen Baltic,
Lytagra, Rovaltra and Dotnuvos
projektai
Animal husbandry machinery: De Laval


38 Kesko’s year 2008
KonekeskoKonekesko is a service company special-
ising in the import and sales of con-
struction and environmental machinery,
trucks and buses, and recreational
machinery.
Konekesko operates in Finland, the
Baltic countries and Russia.
Konekesko arranges the manufacture
of and sells Yamarin boats in Finland
and exports them to several European
countries and Russia. Konekesko is also
engaged in the trade of construction and
environmental machinery in St. Peters-
burg.
Market
In addition to quality-conscious con-
sumers, Konekesko's most important
customer groups include construction,
materials handling, transportation and
service sector companies, and towns and
municipalities.
Konekesko's sales of recreational
machinery are based on close and long
cooperation with Yamaha Motor Co. Qual-
ity-conscious consumers are served by
the nationwide Yamaha dealer network.
The Finnish market for recreational
machinery totals about €400 million.
Export sales of Konekesko's own range
of Yamarin boats account for about 72%
of total sales. In Finland, Yamarin is
number one in the market for glass-rein-
forced plastic boats.
Yamaha outboard motors have been
market leaders in Finland for as long as
30 years. Market shares of Yamaha out-
boards, motorcycles, mopeds, ATVs and
snowmobiles vary between 7–33%
depending on the size category.
Construction and environmental
machinery and MAN trucks and buses are
marketed through Konekesko's own
dealer organisation. The Finnish market
for construction and environmental
machinery totals approximately €400
million and for trucks (weight class of
over 6 tons) about €700 million.
The Baltic market for construction,
environmental and forest machinery
totals some €300 million.
In Russia, the construction and envi-
ronmental machinery market in the St.
Petersburg area totals some €500 million.
Strengths
Konekesko offers its customers the lead-
ing machinery brands and is responsible
for their marketing and sales throughout
the marketing area. Konekesko also
offers diversified after-sales services to
its customers either through its own or a
contract service network.
Konekesko's strengths include its high-
quality products and services, compre-
hensive network, efficient operating
methods, and skilled and service-ori-
ented staff. The target is to reach a sales
growth exceeding that of the market in
selected business areas.
Year 2008
In 2008, Konekesko's net sales decreased
by 6.5% to €214.5 million. Net sales from
export operations were €33 million.
Investments in 2008 totalled €7.9 mil-
lion, with most of them in the new heavy
machinery repair workshop in Vantaa,
the new operations centre in Tampere
and in the acquisition of new business
operations.
After the summer, sales of boats took a
sharp downward turn in the most impor-
tant export markets (Norway, Sweden).
The decrease in the Finnish boat mar-
ket was more moderate than in the
export market. The new Yamarin boat
models for the 2008 season were success-
ful. In October, Konekesko acquired the
business operations of Suvi boats to
strengthen its boat business.
The growth targets set for market
shares in the MAN business in Finland
were achieved. In October, Konekesko
established a subsidiary in St. Petersburg,
Russia for the construction and environ-
mental machinery business.
The Baltic market for construction,
environmental and forest machinery
declined heavily, but Konekesko's market
position in the area strengthened.
Objectives
Konekesko's objective is to increase its
market share with the help of the strong
brands it represents and by providing
good customer service.
Other operating
activities
Other operating activities include
Konekesko, Intersport Finland,
Indoor, Musta Pörssi and
Kenkäkesko.
Other operating activities 7.3%
Others total 92.7%
Other operating activities' share of
Group's net sales, %
Other operating activities' share
of Group's operating profit
excl. non-recurring items was -0.0%
39Kesko’s year 2008

40 Kesko’s year 2008
Sports trade – Intersport FinlandIntersport Finland's retail store chains in
Finland are Intersport, Budget Sport and
Kesport. Intersport Finland is responsible
for the marketing, sourcing and logistics
services, store network and retailer
resources of the chains.
The Intersport chain is the market
leader in Finnish sports retailing. Inter-
sport's customers are quality-conscious
consumers who actively engage in sport
and physical exercise and who value
good service. Intersport stores are located
in downtown areas and shopping cen-
tres. Intersport's strengths include the
chain's high reliability and recognition
among customers, wide and diversified
selections, and its expert and service-
minded staff, whose sales and service
competence is systematically enhanced.
The Kesport stores are located in
smaller rural centres and are the leading
sports stores in their areas.
Budget Sport is Intersport International
Corporation's new sports store format.
Based on cost-effective operations and
low prices, it offers the sector's largest
selections in outdoor activity-related
product groups. Budget Sport's customers
are interested in outdoor activities and
value low prices and ease of purchasing.
There are 57 Intersport stores, 38
Kesport stores and four Budget Sport
stores in Finland, of which 93 are owned
by retailer entrepreneurs and six by
Intersport Finland.
Market
The sports trade market in Finland is
growing at the rate of about 2% per year.
People are becoming more and more
interested in maintaining their health
and increasing their wellbeing. This is
reflected in the sales growth of clothing
and shoes for various sports, fitness and
outdoor activities, for example.
The main competitors of the Intersport
Finland chains include Sportia, Top Sport,
Stadium, department stores and hyper-
markets, and other speciality stores.
Year 2008
The net sales of Intersport Finland were
€158 million in 2008, representing an
increase of 7.5%. The combined retail
sales of Intersport, Budget Sport and
Kesport stores were €289 million, up
by 5.5%.
In autumn 2008, a new Intersport
store was opened in Nummela. New
Budget Sport outlets were opened in
the spring in Friisilä, Espoo and in
Kuninkoja, Raisio.
Objectives
The chains of Intersport Finland aim at
growth exceeding the market average.
This will be achieved by enhancing the
staff's sales and service competence
and improving the store concepts.
The fifth Budget Sport store will be
opened in Oulu in spring 2009. The
Budget Sport online store to comple-
ment and diversify the network of
stores will also be opened in the
spring.
Intersport Finland is making prepa-
rations to open sports stores in the
Baltic countries.
Furniture and interior decoration trade – IndoorIndoor is a furniture and interior
decoration retailer which operates
in Finland and the Baltic countries.
Its store chains are Asko and Sotka,
and there are a total of 84 stores in
Finland, six in Latvia and seven in
Estonia. In Finland, 58 of the stores
are owned by Indoor, while 26
operate as a franchise.
Asko provides quality- and
brand-conscious home decorators
with an up-to-date and competitive
product range combined with the best
service in the sector, ease of purchasing
and delivery accuracy.
Sotka offers consumers who value low
prices with the most competitive range in
the sector, combined with high delivery
accuracy and quick and easy shopping.
Market
Interest in home furnishing and decora-
tion continued in 2008. During the
autumn, the prevailing uncertainty in
economy made consumers more prudent
in their shopping behaviour. Investments
by many chains in the sector further
intensified competition.
It is estimated that the Finnish furni-
ture market was worth about €1.3 billion.


42 Kesko’s year 2008
The Asko and Sotka chains maintained
their position as the Finnish market
leader despite greater competition, and
they increased their market share in the
Baltic countries.
Year 2008
Indoor's net sales totalled €177 million in
2008, down by 9.7%. The retail sales of
the Asko and Sotka chains in Finland
were €202 million (incl. VAT), down by
4.4%. Operations in Sweden were dis-
posed of in spring. In Finland, new Asko
and Sotka stores were opened in Tuusula
and Kotka, and refurbished Asko stores
were opened in Oulu and Varkaus. The
second Asko and Sotka stores were
opened in Tallinn, Estonia.
A design competition was arranged for
young furniture designers to celebrate
Asko's 90th anniversary. The aim was to
support the career development of young
designers and to look for new ideas for
the Asko collection. The competition win-
ners were Janne Reponen and Johanna
Laisi. The Asko jubilee collection, launched
on the market in the autumn, was
designed by interior architect, professor
h.c. Eero Aarnio.
Objectives
Indoor will continue renewing the Asko
brand and will focus strongly on enhanc-
ing both chains' sales and service com-
petence. The focal points in 2009 will
also include improvements in the cost-
efficiency of the chains and sizable
logistics projects.
Home technology trade – Musta PörssiThe Musta Pörssi chain and the Konebox.
fi online store provide home technology
products and services.
The Musta Pörssi chain of speciality
stores offers its customers home technol-
ogy products that make housework eas-
ier, enhance communications and pro-
vide entertainment. In addition, Musta
Pörssi offers a comprehensive range of
product-related services. Customers can
also choose to have all home technology
installed so that it's ready to use.
The chain consists of 53 stores special-
ising in home technology, of which 47 are
owned by retailer entrepreneurs and six
by Musta Pörssi Ltd.
On the home technology market,
Konebox competes with quality products,
their good availability and low prices.
The low prices are guaranteed by efficient
logistics and warehousing combined with
the online store's self-service. Customers
can buy products either from the store or
online and pick them up from the store
or have them delivered to their homes.
The business model of Konebox differs
clearly from that of Musta Pörssi and
together they make up a whole that
meets different customer needs. The
Musta Pörssi and Konebox.fi chains pro-
vide a reliable site for consumers who
value services and quick online shop-
ping.
Market
The Finnish total market for home tech-
nology products is about €2 billion. The
market grew in early 2008, when Finnish
cable-network households moved into
the era of digital TV broadcasts, but the
demand for home technology products
declined towards the end of the year
along with the overall economic devel-
opment.
Year 2008
The net sales of Musta Pörssi Ltd were
€123 million, representing a decrease of
16.8%. The total retail sales of the Musta
Pörssi and Konebox.fi stores were €183
million and, a decrease of 9.6% from
the previous year. Konebox.fi, which
combines the best aspects of online
shopping and a conventional store,
was opened at the end of October.
Shoe trade – KenkäkeskoKenkäkesko's retail store chains are
K-kenkä and Andiamo. K-kenkä is a shoe
store for the whole family, offering its
customers a wide selection of branded
footwear and expert service. Andiamo's
main target group is trendy and fashion-
conscious shoppers, for whom the store
offers a fashionable selection of shoes
that is constantly being updated. The
K-Group's speciality shoe outlets also
include the Kenkäexpertti stores which
operate in smaller towns.
43Kesko’s year 2008
Synergy benefits from cooperationAnttila, home and speciality goods of
K-citymarket and other home and speci-
ality goods companies of the Kesko
Group will intensify their cooperation in
2009. Synergy benefits are sought, above
all, in product sourcing and purchasing,
management and customer relationship
management.
Market
The total retail market for shoes in Fin-
land is approximately €570 million. New
operators have increased the overall sup-
ply in the sector. The retail sales growth
of Kenkäkesko's stores have exceeded the
average in the sector, and account for
about 11% of the total market. In addi-
tion to Kenkäkesko's chain stores, the
highest increase in terms of market
shares was recorded for shoe sales in
sports stores.
Year 2008
The net sales of Kenkäkesko were €26
million in 2008, an increase of 12.6%.
The sales of the Andiamo and K-kenkä
stores increased by 9.2%, and the com-
bined sales of all of the K-Group's speci-
ality shoe stores amounted to €62 mil-
lion.
There were 54 chain stores at the end
of 2008: 33 K-kenkä, 18 Andiamo and
three combined Andiamo/K-kenkä stores.
There were also 40 Kenkäexpertti stores,
which operate outside the chains. Three
of the chain stores are owned by
Kenkäkesko and the others by retailer
entrepreneurs.
In 2008, six new K-kenkä, one Andiamo
and one combined Andiamo/K-kenkä
stores were opened.
Kenkäkesko participated in the com-
munications and marketing sector's cli-
mate project and supported the WWF's
climate change opportunity project by
selling shopping bags in Andiamo shoe
stores made by the design company
Globe Hope using Andiamo's old market-
ing materials.
Objectives
The K-kenkä and Andiamo stores aim to
exceed the average sales growth in the
sector, and to achieve this by increasing
the store network and offering customers
comprehensive selections of footwear
with a competitive price/quality ratio.
The operational priorities also include
enhancing staff skills, in particular retail
sales and service competence, through-
out the whole chain and improving the
cost-efficiency of the operations chain.

44 Kesko’s year 2008
2008 2007
Net sales € million 699 743
Operating profit € million 0.8 10.0
Operating profit excl. non-recurring items € million -0.1 13.9
Operating profit as % of net sales
excl. non-recurring items % 0.0 1.9
Depreciation € million 7.4 8.5
Investments € million 15.7 7.4
Return on capital employed* excl. non-recurring
items % -0.1 8.1
Personnel average 1,470 1,577
* Cumulative average
Other operating activities, financial highlights, continuing operations
Number Number
Sales*, €
million
Sales*, €
million
2008 2007 2008 2007
Kesko's machinery stores
Yamaha Center 1 1 16 17
Finland total 1 1 16 17
K-Group's
speciality goods stores
Intersport and Budget Sport 61 58 259 245
Kesport 38 39 31 29
Asko 32 32 94 95
Sotka 52 53 109 117
Musta Pörssi and Konebox.fi 54 55 183 203
Andiamo and K-kenkä 54 49 50 46
Kenkäexpertti 40 42 12 13
Finland total 331 328 738 748
Indoor (Asko and Sotka)
Estonia and Latvia 13 13 26 47
Other countries total 13 13 26 47
Speciality stores total 344 341 764 795
Other operating activities
total 345 342 780 812
* (incl. VAT)
Other operating activities, stores and their retail sales
€ million change, %
Konekesko 214 -6.5
Intersport 158 7.5
Indoor 177 -9.7
Musta Pörssi 123 -16.8
Kenkäkesko 26 12.6
Total 699 -6.0
Other operating activities, net sales 2008, continuing operations
2008 2007
Non-current assets 126 116
Inventories 115 110
Short-term receivables 96 107
./. Non-interest-bearing debt -124 -164
./. Provisions -8 -2
Capital employed* 205 168
* Capital employed at the end of month
Other operating activities, capital employed at 31 December, € million
Other
operating
activities
COMPETITORS
Machinery trade
Finland: market share 3–33%
depending on product group
(own estimate)
Competitors: Otto Brandt, Marine
Power (Brunswick), Suzuki Finland,
SGN Group, Vator, Volvo CE Finland Oy
(Rolac), Witraktor (Caterpillar), Rotator,
Suomen Rakennuskone, Volvo, Scania,
Veho, Sisu-Auto
Estonia: market share 7–8%
(machinery trade) (own estimate)
Competitors: Baltem (Komatsu),
Stokker, Intrac, Swecon, Witractor
Lithuania: market share 12–13%
(machinery trade) (own estimate)
Competitors: Baltijos statybines
masinos (Komatsu), Intrac, Stokker,
Witractor, Technikos jega, Swecon,
Mastermann
Latvia: market share 15%
(machinery trade) (own estimate)
Competitors: Intrac, Ladur, Komatsu,
Witractor, Swecon
Speciality goods trade
Furniture trade
Finland: market share Asko and Sotka
17% (own estimate)
Competitors: furniture and interior
decoration stores
Sports trade
Market share Intersport, Budget Sport
and Kesport 33.2% (own estimate)
Competitors: Sportia, Top Sport,
Stadium, department stores and
hypermarkets, and other speciality
sports stores
Home technology trade
Market share
Musta Pörssi 9% (own estimate)
Competitors: speciality home
technology stores, hypermarkets and
online stores
Shoe trade
Market share K-kenkä, Andiamo,
Kenkäexpertti 10.9% (Association of
Textile and Footwear Importers and
Wholesalers and own estimate)
Competitors: other speciality stores,
department stores, hypermarkets and
sports stores
45Kesko’s year 2008
Real estate
operations
A store site is a strategic competi-
tive factor for Kesko. Store sites
provide opportunities for develop-
ing business operations and
increasing sales and market share.
The Kesko's division parent companies
are responsible for their own store sites
throughout their life cycles. The compa-
nies plan their own retail networks and,
on the basis of their network and busi-
ness plans, make the investments in
accordance with the Group's real estate
strategy. The division parent companies
develop their own store sites, manage
their construction, and are responsible
for maintaining, managing, leasing and
selling them.
Real estate property managementFor the management of Kesko's real
estate assets and liabilities, the retail
stores and other real estate properties
are classified as follows:
Strategic properties are large retail ●
stores which Kesko prefers to own.
Standard properties are premises ●
owned by the Kesko Group. They can
be sold and leased back for use in the
Group's business operations.
Realisation properties are those for ●
which the Group has no further use.
Development properties are those ●
needing further development for their
intended use.
InvestmentsKesko's real estate investments aim to
enable the creation of trading services
valued by customers by anticipating
changes in customer behaviour and the
operating environment and by maintain-
ing the technical condition of properties.
Kesko invests only in properties
needed in its own business operations.
As a result of Kesko's internationalisa-
tion, investments outside Finland have
become increasingly important.
Life-cycle affordable and eco-efficient real estate operationsKesko's construction activity is based on
life-cycle affordability and eco-effi-
ciency. This means optimising the costs
and environmental burden across the
entire life cycle of a store site.
The aim is to build business premises
with the lowest life-cycle costs in the
trading sector.
Further development of the eco-effi-
ciency of existing properties is focused
on monitoring energy consumption and
improving energy use. The aim is to
reduce both consumption and costs.
Kesko has received much recognition
for environmentally responsible con-
struction.
Property maintenanceProperty maintenance relies on systema-
tisation and proactivity. Repair work is
scheduled to coincide with the rebuild-
ing necessitated by business operations.
The management and maintenance
of properties owned or leased by Kesko
has been outsourced to ISS Palvelut Oy,
Ovenia Oy and YIT Kiinteistötekniikka Oy,
which carry out the work in accordance
with Kesko’s requirements. Kestra Kiin-
teistöpalvelut Oy, owned by Kesko, is
responsible for purchasing electricity for
the Group.
Kesko is participating in the Finnish economy's energy-efficiency agreement The emissions generated in the produc-
tion of electrical and heat energy for
properties account for a significant share
of the K-Group's environmental impact.
Therefore, the K-Group's environmental
policy obliges Kesko's real estate opera-
tions, in cooperation with its business
partners, to develop solutions related to
the building, repairs, concept changes,
maintenance and use of real estate
properties that reduce the consumption
of materials and energy during the life
cycle of these properties.
The Ministry of Employment and the
Economy, the Confederation of Finnish
Industries EK and the Federation of Finn-
ish Commerce have signed a framework
agreement with the intention of improv-
ing the efficiency of energy use in Finnish
economy. In autumn 2008, Kesko signed
the accession document of this energy-
efficiency agreement, according to which
it agrees to comply with the trading sec-
tor's programme and implement the
actions written into it during the years
2008–2016.


47Kesko’s year 2008
Owned properties
Leased properties
Capital, € million 2008 2007
Finland 776 739
Other Nordic countries 57 43
Baltic countries 41 47
Russia 77 26
Total 951 855
Area, m2 2008 2007
Finland 756,000 807,000
Other Nordic countries 62,000 52,000
Baltic countries 103,000 102,000
Russia 34,000 20,000
Total 955,000 981,000
Lease liabilities, € million 2008 2007
Finland 1,767 1,640
Other Nordic countries 110 148
Baltic countries 183 115
Russia 45 40
Total 2,105 1,943
Area, m2 2008 2007
Finland 2,191,000 2,091,000
Other Nordic countries 205,000 199,000
Baltic countries 431,000 335,000
Russia 25,000 26,000
Total 2,852,000 2,651,000
Strategic properties 79%
Standard properties 15%
Realisation properties 0%
Development properties 6%
Strategic properties 76%
Standard properties 18%
Realisation properties 0%
Development properties 6%
Breakdown of owned properties 2008 Breakdown of owned properties 2007
Real estate
operations
indicators
for 2008


49Kesko’s year 2008
Kesko is a good place to work
Aiming to be
the most
attractive
workplace in
the trading
sector
Kesko and its chain stores offer
motivating and rewarding jobs
with products and services valued
by customers. Kesko is a good and
responsible working community
where employees are treated
equally and fairly.
At the end of 2008, the total number of
Kesko personnel was 24,668 in eight dif-
ferent countries. Of these, 13,651 worked
in Finland and 11,017 in other countries.
The average number of personnel con-
verted into full-time employees was
21,327. The average decrease in Finland
was 95 employees, while in other coun-
tries the average increase was 902
employees.
Kesko's most international division
is Rautakesko, with 96.5% of its 10,158
employees working outside Finland.
In all, Kesko and its chains' retailer
entrepreneurs employ some 50,000
people.
Kesko's strengths include providing an
opportunity for versatile internal job
rotation and for career development.
During 2008, some 2,000 people moved
to new jobs within the Kesko Group.
In 2008, one of the major focuses in HR
management was distributing the new
guide, “Our Responsible Working Princi-
ples”, to all employees in every country
in which Kesko operates. The introduc-
tion to responsibility was supported,
among other things, by an e-learning
programme for managers and unit-spe-
cific staff events arranged by managers.
Another important area of priority was
launching the work and productivity pro-
gramme comprising Kesko and its chain
stores. The programme will continue in
2009.
Kesko was highly rated in Universum,
the Finnish employer profile survey, in
2008. Among commercial students, Kes-
ko's ranking in the list of ideal employers
improved. The ranking among young
professionals with a university degree has
risen from 28th to 13th in the space of
two years, while those with an initial
vocational education in commercial stud-
ies ranked Kesko 6th.
Kesko carries out close cooperation
with students and teachers in different
sectors. For example, the job-orientation
of Finnish teachers of commercial and
technical subjects is promoted in train-
ings arranged by Kesko.
The most competent and motivated people in the trading sectorKesko and its chain stores also offer their
employees good opportunities to develop
their competencies in a target-oriented
manner.
In Finland, Kesko's subsidiary K-instit-
uutti is the K-Group's competence devel-
opment centre. The business model of
K-instituutti was revised in 2008. It plans
competence development solutions for
chain business needs and carries out
training programmes together with its
partner network. The provision of
regional training is also increasing. In
2008, the training programmes imple-
mented by K-instituutti were attended
by about 25,000 people.
The 2008 Master Sales Assistant train-
ing, Finland's largest adult training pro-
gramme, had over 16,000 participants in
13 different product lines.
The Rautia chain was named the Mas-
ter Sales Assistants' trainer chain; 80%
of all Rautia chain store employees com-
pleted the Master Sales Assistant training.
About one hundred business colleges and
polytechnics also offered their students
an opportunity to participate in the
training, and some 6,000 students took
this opportunity.
Kesko's second K-trainee programme
ended in January 2009. Those who com-
pleted the first K-trainee training and
recruitment programme were hired for
managerial and specialist duties by dif-
ferent companies in the Group during
2008. The car salesmen who completed
VV-Auto's car salesman trainee pro-
gramme were recruited to jobs corre-
sponding to their training.
Management and leadership At Kesko, management is conducted in a
responsible manner and in compliance
with the corporate values. A developing
and motivating working community is a
prerequisite for the wellbeing and excel-
lent performance of employees.
The annual personnel survey plays a
key role in measuring the quality of
management and the internal employer
profile at Kesko. The similar survey,
revised in 2008, is conducted throughout
Kesko and its chain stores. The revised
survey provides even more concrete
information about the strengths and
development targets of working commu-
nities. Replies were received from 68.8%
of the employees of the companies
included in the survey.

50 Kesko’s year 2008
One of the key tools in efficient per-
formance management and the motivat-
ing leadership of immediate superiors is
the annual performance and develop-
ment review whose implementation is
included in the annual personnel survey.
Furthermore, the performance of the
entire Group's key personnel is assessed
separately.
Leadership skills and career progress
are supported by Kesko's own three-step
superior and management training, the
internationalisation of which is under
development.
Since 2004, Kesko has implemented a
long-term development programme for
members of the management and poten-
tial management. There are some 200
participants in the programme, whose
purpose is to ensure a sufficient supply
of managerial resources both in terms
of quality and quantity. This is comple-
mented by the chains' own training,
such as the “K2-tusen chef” programme
by K-rauta AB in Sweden, which com-
bines theory and practice for the needs
of future management. The third pro-
gramme will be launched in 2009.
Kesko's first own K-retail eMBA pro-
gramme, implemented in cooperation
with the Helsinki University of Technol-
ogy, concluded in January 2009. The pro-
gramme aims to strengthen the partici-
pants' abilities to act in international
retail management duties.
Towards the best work productivity in the trading sectorThe key objective of the ongoing work
and productivity programme is to
improve the employees' work productiv-
ity, for example by focusing on the com-
petence and wellbeing of people and on
better leadership. The programme also
involves measures related to increasing
operational efficiency and electronic
communications. The work and produc-
tivity programme applies to all of Kesko
and its chain stores.
Long-term projects focusing on well-
being at the workplace are currently
underway in several companies. The aim
is to increase work productivity by reduc-
ing sickness absences and raising the
retirement age. The monitoring of sick-
ness absences will be defined and man-
agement's intervention skills will be
improved. Improvements to work pro-
ductivity are also sought by promoting
the adoption of different working hour
models and by systematic working hours'
management.
In Finland, Kesko's Occupational Health
Service Unit focuses on operations that
maintain work capacity and promote the
wellbeing of the working community.
Currently 35–45% of the aggregate costs
of occupational health are allocated to
these activities. In other countries, occu-
pational health services have been
arranged according to the local practice
and legislation. Support for personnel's
recreational activities is provided through
joint staff clubs and in the form of com-
pany-specific contribution.
Most of Kesko's employees belong to
a bonus incentive system. The manage-
ment's incentive systems are described
on page 62.
Kesko's internal communications will
become more international and efficient
with the completion of the new intranet
that is currently under construction.
Information about HR affairs is also
available in the Corporate Responsibility
Report, to be published in spring 2009.
Self-control training
In autumn 2008, K-instituutti carried
out practical self-control training for
K-food store retailers and their staff.
The participants were trained on how
to implement the store's self-control
and electronic monitoring of self-
control activities. More than 500
food retailing professionals attended
the training.
Enjoying work at K-citymarkets
The K-citymarket chain's wellbeing
programme was launched in 2008.
The key target of the programme is
reducing sickness absences. The tools
include increasing the efficiency of
reporting and intervention, focusing
on preventive work and facilitating
the practice of notifying about
sickness as well as training
hypermarket management and shop
stewards. The programme will be
adopted throughout the whole chain
during 2009.

51Kesko’s year 2008
Path to a K-food retailer career
Competitive
advantage from
chain operations
and K-retailer
enterprise
The K-Group's principal business
model in Finland is the chain
business model, in which inde-
pendent K-retailers run retail
stores in the chains managed by
Kesko. At the end of 2008, Kesko
had 1,305 K-retailer entrepreneurs
as partners, as well as about 250
other retailer partners.
The K-retailer trainee programme offers
three alternative paths: a comprehensive
programme, an intensive programme and
the retailer entrepreneur path in poly-
technics.
Approximately 50% of those starting
the programme have a fair amount of
retailing experience, but in recent years
the number of students transferring from
other fields or having just finished their
general education has grown. Before
selection to the K-retailer trainee pro-
gramme, the applicants are evaluated
with regard to their development poten-
tial, values, work experience and educa-
tion.
After selection, would-be K-retailers
start the K-retailer trainee programme,
which consists of three parts: practical
training in a retail store under the guid-
ance of a mentor, theoretical training at
the K-instituutti training centre, and
regional K-trainee seminars.
Approximately 100 K-retailer trainees
complete the programme every year. After
completion, the trainees are ready to
start as independent K-retailer entrepre-
neurs.
The K-Group gives its retailers strong
background support and opportunities
for further training and progress in their
careers.
The obligations and rights of K-retailers
and Kesko have been specified in the
chain agreement.
Competitive edge is gained by combin-
ing systematic chain operations and the
K-retailer operations based on entrepre-
neurship. Kesko is responsible for the
constant development of the business
model and the store concepts, for chain
operations management and for sourcing
and purchasing of the products included
in the chain selections. The K-retailer
entrepreneur is responsible for his/her
store's customer satisfaction, personnel
and profitability of business.
To ensure success, it is important that
a new retailer's professional and other
skills are at as high level as possible at
the start of his/her career.
About 200 stores are affected by retailer
changes annually in the K-Group. The
annual need for new entrepreneurs,
ready to start their K-retailer careers, is
approximately 100.
The K-Group systematically trains new
retailers to ensure a sufficient supply of
people with the appropriate professional
skills. New candidates interested in a
K-retailer career are sought through dif-
ferent channels. There are about 500
contacts annually. The requirement for
new retailers is estimated for 1–3 years
ahead.
AssessmentAttitude ●
Values ●
Experience/development ●
needs
Suitability assessment ●
SelectionKey areas of self-development ●
Planning of a personal ●
training programme
Apprenticeship contract ●
assessment
K-retailer trainee programmeThe required theoretical training at ●
K-institutti (food retailer training) or
in online learning environment
On-the-job retailer work training ●
under mentor retailer
Regional training (theme days) ●
K-retailer reserve(personality, knowledge, skills) ●
K-RETAILER CAREERFurther qualification in entrepreneurship
NeedAbout 50–100 novice ●
retailers every year
ScreeningK-stores and Kesko ●
Manufacturing ●
industry
Competitors ●
Marketing
Entrepreneurs in ●
different sectors
Educational ●
institutes
Others ●
Cooperation between K-retailers and
Kesko – chain operations – is based on
the equality of both parties, their volun-
tary participation, willingness to develop
joint operations and on open coopera-
tion. The objective is improving competi-
tiveness and performance, increasing
uniform quality and lowering costs.

52 Kesko’s year 2008
Corporate responsibility at Kesko
At Kesko, the concept of corporate
responsibility is understood to
include good corporate govern-
ance, economic, social and envi-
ronmental responsibility, and all
work carried out on behalf of
product safety and consumer
protection. The international com-
mitments Kesko complies with in
its corporate responsibility work
and the corporate responsibility
policies and principles approved
by Kesko's Board of Directors or
Corporate Management Board have
been published at www.kesko.fi/
responsibility.
Responsibility is part of day-to-day workCorporate responsibility has been inte-
grated into Kesko's management system
and is implemented through normal daily
activities in the line organisation. The
corporate responsibility team that oper-
ates within the Corporate Communica-
tions and Responsibility Unit develops
and coordinates responsibility actions,
and reports on the results.
The team's work is supported by a
Corporate Responsibility Advisory Board
(appointed by the Corporate Management
Board), which consists of five members
representing the management of Kesko's
various division parent companies. The
duties of the Advisory Board include
determining the responsibility strategy
and the operating policies and systems
needed for its implementation, and mon-
itoring the implementation of objectives.
In 2008, the Corporate Responsibility
Advisory Board focused on preparing the
objectives of Kesko's responsibility pro-
gramme for the years 2008–2012. The pro-
gramme was approved by the Corporate
Management Board in late 2008.
The most important objectives for 2009
are to incorporate the responsibility pro-
gramme into the brand and marketing
strategy work, to strengthen the responsi-
bility image associated with Kesko, its
division parent companies and the vari-
ous product brands, and to bring the
results of responsibility work to the atten-
tion of customers in the stores. The
responsibility programme will be pub-
lished in full in Kesko's Corporate Respon-
sibility Report for 2008.
The Environmental Steering Group is
responsible for developing and coordinat-
ing environmental issues in different
countries. The Steering Group networked
throughout the Kesko Group during the
year in order to implement the require-
ments of REACH, the EU's new regulation
on chemicals and their safe use, through-
out the supplier chain and to perform the
first REACH pre-registrations. As a result of
another cooperative effort throughout the
Kesko Group, a collection system, based
on the supplier responsibility referred to
in the EU's Directive on Batteries and
Accumulators, was set up in the stores
and the related retailer and dealer train-
ing was organised.
A steering group consisting of repre-
sentatives from division parent compa-
nies' purchasing management coordinates
responsible purchasing. In 2008, Kesko's
major responsible purchasing projects
included the establishment of a monitor-
ing team to audit suppliers in China and
the introduction of a self-assessment
form for suppliers operating in high-risk
countries. As part of the introduction of
REACH, a list of retricted chemicals that to
some extent exceeded the requirements
of the law was also introduced.
Kesko is an Organisational Stakeholder
of the Global Reporting Initiative (GRI)
and complies, in its corporate responsi-
bility reporting, with the sustainability
guidelines drawn up by the GRI. Kesko's
Board of Directors discusses the Corpo-
rate Responsibility Report annually after
it has been published. Kesko's corpo-
rate responsibility reporting has been
assured by an independent party since
2002. The 2008 report will be assured
by PricewaterhouseCoopers Oy, Kesko's
auditors. The Corporate Responsibility
Report for 2008 will be published in
April 2009.
Full points for eco-efficiency
to Kesko
For the sixth time in succession,
Kesko was included in the Dow
Jones sustainability indexes, DJSI
World and DJSI STOXX. In the 2008
assessment, Kesko was given a full
100 points for the eco-efficiency of
its operations.
In January 2009, the World Eco-
nomic Forum listed Kesko for the
fifth time among the 100 best
companies in the world in sus-
tainable development. Moreover,
Kesko's work for responsibility quali-
fied in the silver class in the Consumer
Staples sector in the 2008 and 2009 Sus-
tainability Yearbooks. No companies in
this sector qualified in the gold class.
As in the previous year, Kesko partici-
pated in the assessment of the Carbon
Disclosure Project in 2008 and was
awarded 85 points (compared with 73 in
2007). As Kesko did not give permission
to disclose its replies, it is not included
in the 2008 CDP Leadership index. Kesko's
rankings in different indexes are available
at www.kesko.fi/responsibility.
Economic responsibilityGood financial performance makes it eas-
ier to assume environmental and social
The Kesko Group's responsibility
programme for 2008–2012 was
approved.
Kesko is the only Finnish trading
sector operator to have a monitoring
team of its own to promote
responsible purchasing in China.


54 Kesko’s year 2008
responsibility and, conversely, environ-
mental and social responsibility contrib-
ute to reducing costs and promoting job
satisfaction. In the Corporate Responsibil-
ity Report, economic performance is
viewed in more detail from the perspec-
tive of different stakeholders.
Manufacturing industry is an
important partner
Kesko's operations produce economic
benefit for many different parties. In
2008, Kesko's purchases from suppliers
of goods and services totalled about €8.1
billion. Kesko had about 31,000 active
suppliers (those annually supplying goods
and services worth over €1,000 to Kesko).
Approximately 18,000 of these operated in
Finland, accounting for 66% of the total
purchases. Kesko's investments totalled
€338.4 million, of which €240.3 million
was spent in Finland. Breakdowns of
economic benefits from Kesko's opera-
tions in Finland by stakeholder group
and region, and the breakdown of
imports by country, are given in the
Corporate Responsibility Report.
Comprehensive store network for
customers
Together with the K-retailers, Kesko is
responsible for a nationwide store net-
work in Finland. Its services are comple-
mented by a mail order business and
e-commerce.
At the end of 2008, there were 15 fewer
K-food stores than the year before, i.e.
1,055 stores located in 316 of Finland's 348
cities and municipalities (situation on 1
January 2009). 139 new K-retailers started
during the year.
In 2008, there were 144 K-Group build-
ing and home improvement stores, 81
agricultural stores, 28 Anttila department
stores, 2 Anttila Store speciality stores,
8 Kodin Ykkönen department stores for
interior decoration and home goods and
332 speciality stores in Finland. There were
31 building and home improvement
stores, 13 agricultural stores and 11 furni-
ture stores in the Baltic countries. There
were 36 building and home improvement
stores in the other Nordic countries. In
Russia, there were 9 building and home
improvement stores, of which 3 are in line
with the new K-rauta concept.
Sales to the K-retailers accounted for
nearly 49% of Kesko’s total sales. Kesko’s
own retail stores accounted for 26% of the
company's total sales.
Support for the public good
Kesko and its subsidiaries gave financial
support amounting to approximately €1.6
million to about 100 organisations and
institutions operating for the public good.
Kesko's cooperation with the Young
Finland Association has continued for over
a decade. Families with children are an
important cooperation target for the
K-Group. The purpose of the campaigns
carried out on a joint basis is to highlight
the importance of a healthy diet and
physical exercise as a way of life.
Environmental responsibilityAll of Kesko’s operations that have a
major impact on the environment are
certified by the ISO 14001 environmental
system. The ISO 14001 certification of Ant-
tila Oy was revised in spring 2008. The
system covered all of Anttila Oy's opera-
tions. The department stores in Mikkeli,
Rovaniemi, Pori and Nummela were
included in the system during the year.
VV-Autotalot Oy and Turun VV-Auto Oy
comply with the action plan of the Finn-
ish Central Organisation for Motor Trades
and Repairs. This plan, which has been
prepared for Finnish car dealers and
repair shops, fulfils the quality and envi-
ronmental management requirements of
the ISO 9001 and ISO 14001 standards, as
well as the quality requirements of the
Volkswagen Group. Business partners pro-
viding property construction, mainte-
nance and waste management services
for Kesko have corresponding systems.
Also Keslog's transport and warehouse
operations have the ISO 14001 certification.
510 K-environmental stores
At the end of the year, 423 K-food stores,
59 K-rauta and Rautia stores and 28
K-maatalous stores fulfilled the require-
ments of the K-stores' environmental
diploma. Those stores operating as a
combination of both building and home
improvement stores and agricultural
stores are included in these statistics for
K-rauta and Rautia stores. In 2008, the
K-rauta and Rautia chains set the target
of having all stores in the chains quali-
fied as K-environmental stores by the end
of 2009. The process has been faster than
expected and all of the 144 K-rauta and
45.5% of Finns live less than a
kilometre away from a K-food store.
The average distance to the nearest
K-food store is 2.3 kilometres.
With Kesko's support, the Young
Finland Association annually puts
more than half a million children and
young people on the move in sports
clubs, day-care centres, schools and
after-school clubs.
The K-stores' environmental manage-
ment concept – the K-environmental
store diploma – celebrated its 10th
anniversary in 2008.
54 Kesko’s year 2008
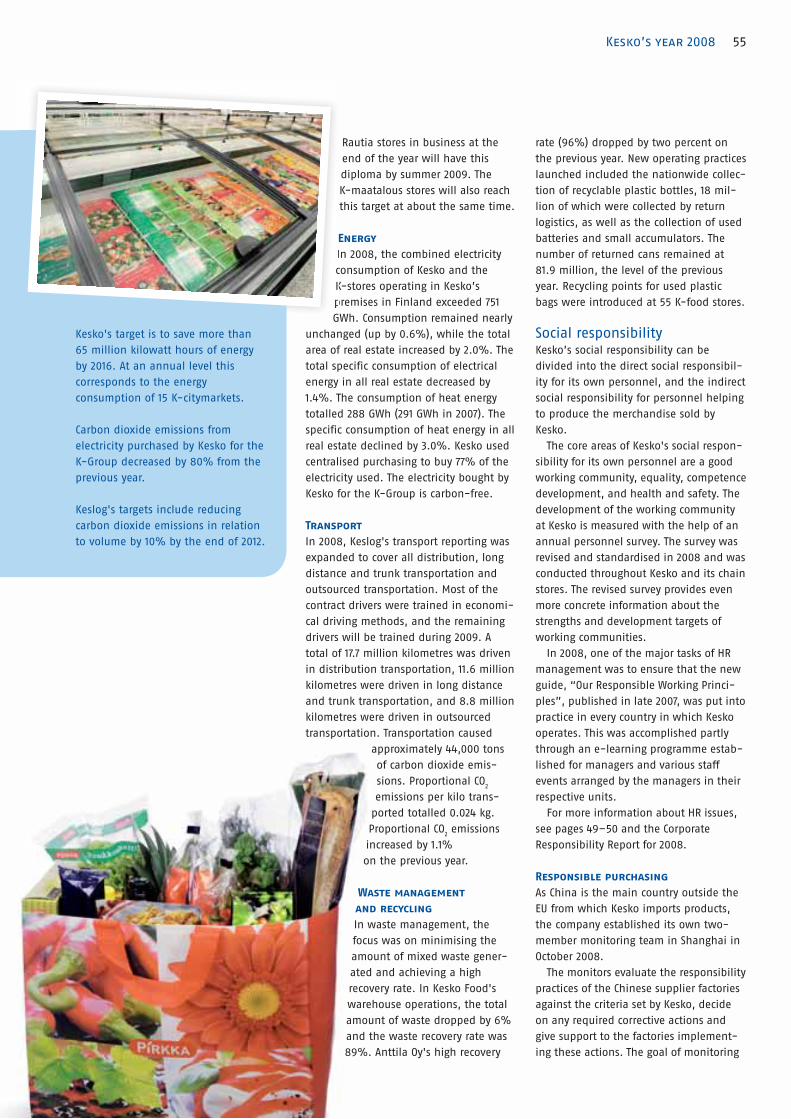
55Kesko’s year 2008
Rautia stores in business at the
end of the year will have this
diploma by summer 2009. The
K-maatalous stores will also reach
this target at about the same time.
Energy
In 2008, the combined electricity
consumption of Kesko and the
K-stores operating in Kesko’s
premises in Finland exceeded 751
GWh. Consumption remained nearly
unchanged (up by 0.6%), while the total
area of real estate increased by 2.0%. The
total specific consumption of electrical
energy in all real estate decreased by
1.4%. The consumption of heat energy
totalled 288 GWh (291 GWh in 2007). The
specific consumption of heat energy in all
real estate declined by 3.0%. Kesko used
centralised purchasing to buy 77% of the
electricity used. The electricity bought by
Kesko for the K-Group is carbon-free.
Transport
In 2008, Keslog's transport reporting was
expanded to cover all distribution, long
distance and trunk transportation and
outsourced transportation. Most of the
contract drivers were trained in economi-
cal driving methods, and the remaining
drivers will be trained during 2009. A
total of 17.7 million kilometres was driven
in distribution transportation, 11.6 million
kilometres were driven in long distance
and trunk transportation, and 8.8 million
kilometres were driven in outsourced
transportation. Transportation caused
approximately 44,000 tons
of carbon dioxide emis-
sions. Proportional CO2
emissions per kilo trans-
ported totalled 0.024 kg.
Proportional CO2 emissions
increased by 1.1%
on the previous year.
Waste management
and recycling
In waste management, the
focus was on minimising the
amount of mixed waste gener-
ated and achieving a high
recovery rate. In Kesko Food's
warehouse operations, the total
amount of waste dropped by 6%
and the waste recovery rate was
89%. Anttila Oy's high recovery
rate (96%) dropped by two percent on
the previous year. New operating practices
launched included the nationwide collec-
tion of recyclable plastic bottles, 18 mil-
lion of which were collected by return
logistics, as well as the collection of used
batteries and small accumulators. The
number of returned cans remained at
81.9 million, the level of the previous
year. Recycling points for used plastic
bags were introduced at 55 K-food stores.
Social responsibilityKesko’s social responsibility can be
divided into the direct social responsibil-
ity for its own personnel, and the indirect
social responsibility for personnel helping
to produce the merchandise sold by
Kesko.
The core areas of Kesko's social respon-
sibility for its own personnel are a good
working community, equality, competence
development, and health and safety. The
development of the working community
at Kesko is measured with the help of an
annual personnel survey. The survey was
revised and standardised in 2008 and was
conducted throughout Kesko and its chain
stores. The revised survey provides even
more concrete information about the
strengths and development targets of
working communities.
In 2008, one of the major tasks of HR
management was to ensure that the new
guide, “Our Responsible Working Princi-
ples”, published in late 2007, was put into
practice in every country in which Kesko
operates. This was accomplished partly
through an e-learning programme estab-
lished for managers and various staff
events arranged by the managers in their
respective units.
For more information about HR issues,
see pages 49–50 and the Corporate
Responsibility Report for 2008.
Responsible purchasing
As China is the main country outside the
EU from which Kesko imports products,
the company established its own two-
member monitoring team in Shanghai in
October 2008.
The monitors evaluate the responsibility
practices of the Chinese supplier factories
against the criteria set by Kesko, decide
on any required corrective actions and
give support to the factories implement-
ing these actions. The goal of monitoring
Kesko's target is to save more than
65 million kilowatt hours of energy
by 2016. At an annual level this
corresponds to the energy
consumption of 15 K-citymarkets.
Carbon dioxide emissions from
electricity purchased by Kesko for the
K-Group decreased by 80% from the
previous year.
Keslog's targets include reducing
carbon dioxide emissions in relation
to volume by 10% by the end of 2012.
I
c
K
p
G

56 Kesko’s year 2008
is always an independent audit, carried
out by auditors accredited by the BSCI or
the SAI (an independent organisation
managing the SA8000 standard). The
aim of the team is to make annually
at least 160 visits to the factories
of 50 suppliers. The suppliers
selected from different parts
of China deliver clothing,
household textiles, furni-
ture, shoes and sports
equipment to Kesko.
In spring 2008, a list of restricted
chemicals was introduced, defining
the chemicals whose use is either com-
pletely banned or restricted in the
household textiles, clothing, leather
goods and upholstered furniture supplied
to Kesko. The list forbids the use of sub-
stances of very high concern to REACH in
amounts exceeding 0.1 percent by weight.
In China, compliance with chemical regu-
lations is always verified during monitor-
ing visits.
Kesko is an active member of the Busi-
ness Social Compliance Initiative (BSCI),
a joint international organisation estab-
lished to promote social audits in the
supply chain. By the end of the year, 32
of Kesko's suppliers in high-risk countries
had been audited following the BSCI
model and seven suppliers were them-
selves members of the BSCI. Kesko also
has 21 suppliers of home and speciality
goods with SA 8000 certification, and all
the Chiquita plantations supplying
bananas to Kesko have also been audited
in compliance with the requirements of
both the SA 8000 and Rain Forest Alliance
standards.
More than 30 Kesko's suppliers partici-
pated in the training events arranged
by the BSCI in China and India. Kes-
ko's suppliers who participate in
the development project under-
way in Vietnam were reaudited
in line with the BSCI model,
and several major improve-
ments have been accomplished
in all factories.
Responsibility in the product trade
At the end of 2008, Kesko Food offered
a selection of about 600 organic or Fair-
trade products or products with environ-
mental labelling. There were 30 organic
products and 59 products with environ-
mental labelling in the Pirkka range. In
addition, individual K-retailers purchase
local organic and other foods to meet
their customers’ wishes.
The K-food stores carry the widest
selection of Fairtrade certified products in
Finland and Kesko Food doubled the
selection during 2008. At the end of the
year, the selections included over 120 Fair-
trade products, 16 of which were in the
Pirkka range. The first combination prod-
uct – the Pirkka yoghurt, which combines
Fairtrade ingredients and Finnish work
– was also introduced to the range. The
selection and marketing policies concern-
ing organic and Fairtrade products and
products with environmental labelling are
included in the K-food stores' chain con-
cepts.
During the year, several sustainable
sourcing policies concerning the origins
and production conditions of foodstuffs
were made. Since September, all Pirkka
eggs have been free-range or organic
eggs. At the same time, Pirkka Fairtrade
bananas were launched in the K-food
stores. The joint fish and shellfish state-
ment of Kesko Food and Kespro guiding
the responsible purchasing of fish and
shellfish was published in November.
The promotion of a healthy way of life
is a central part of Kesko Food's responsi-
bility work. The amount of salt was
reduced in 19, fat in 17 and sugar in six
Pirkka products. The GDA (guideline daily
amounts) information was added on the
labels of several hundreds of Pirkka prod-
ucts. A series of 69 lectures entitled “The
best choices of the day” were organised
in cooperation with Dietician Hanna Par-
tanen and K-food retailers throughout
Finland.
In August 2008, K-citymarket launched
Doogood, a clothing collection of its own
with a focus on environmental values. The
clothing is produced according to the Glo-
bal Organic Textile Standard (GOTS), and
the working conditions of employees
meet the minimum requirements set by
the International Labour Organisation. The
manufacturer of the Doogood collection
has been certified by the IMO. The K-city-
markets also sell the Excelgreen clothing
collection which is made of recycled plas-
tic bottles.
Rautakesko offers a wide selection of
products with environmental, energy or
emission category labelling. The propor-
tion of certified timber out of total timber

57Kesko’s year 2008
sales was around 90%. A total of 832 tons
of impregnated timber (753 tons in 2007)
were recycled through the K-rauta and
Rautia stores. Tropical wood and timber
accounted for under one percent of Rau-
takesko's total sales. In line with Kesko's
sourcing policy, the garden furniture sold
by all K-Group stores is either FSC-certi-
fied or made of cultivated tropical wood
species.
Rautakesko develops cost- and eco-
efficient service solutions for construction
and living. In March 2008, Rautakesko
published a guidebook on sustainable
housing, which is available for free in all
K-rauta and Rautia stores. The themes of
the guide are energy, water, indoor air,
waste management, maintenance,
repairs, safety and security.
Product safety
The Product Research Unit of Kesko Food
is responsible for ensuring the quality of
purchases, keeping abreast of food legis-
lation, maintaining and providing sup-
port for the self-control plans required by
law and for developing private label
products together with the purchasing
and marketing units. During the year, the
recipe service of the K-test kitchen of the
unit generated 859 recipes for both the
K-Group units and directly for consumers.
Kesko Food's Consumer Service answers
consumer inquiries and receives feed-
back. In 2008, there were 21,482 such
contacts.
Quality is controlled in purchasing by
auditing the operations of product manu-
facturers and analysing product composi-
tion and quality. In 2008, the Product
Research Unit audited 31 suppliers, 19 of
which were Finnish. These companies
mainly included suppliers of Kesko's pri-
vate labels. A total of 5,744 food novelties
and product development samples, and
1,341 product lot and other self-control
samples were analysed. Kesko Food's
Product Research Unit also plays a key role
in exceptional situations, when a product
launched on the market fails to meet
safety or quality requirements.
A total of 66 product recalls took
place, most of which related to
defective quality or taste, or a man-
ufacturing or packaging error. 18 of the
recall cases were Kesko Food's private
label products; in other cases the Product
Research Unit assisted manufacturing
industry. Four of the recall cases were
public recalls, involving potential health
hazards.
Among the non-public cases, the recall
of Pirkka beer gained the most media
attention. The lots in question contained
an amount of alcohol that exceeded by
0.1–0.2 volume percent the limit of 4.7
vol. percent permitted in grocery stores.
735,000 cans in all were returned to the
supplier.
In April, the national accreditation body
FINAS (the Finnish Accreditation Service)
audited the activities of Kesko Food's
Product Research Unit for the purpose of
ISO 17025 accreditation. No major devia-
tions were found during the visit and cor-
rections to the minor deviations detected
have been sent to FINAS. On completion
of the accreditation process, the labora-
tory of Kesko Food's Product Research Unit
will be the first accredited laboratory rep-
resenting the Finnish trading sector. In
2008, there were 45 laboratories with ISO
17025 accreditation in Finland. Nearly all
were run by the authorities, with the
exception of a few big food manufactur-
ers.
In May, Kesko Food and Finfood organ-
ised a joint seminar on food safety. The
results of the survey ordered by Kesko
Food from TNS Gallup, assessing Finnish
consumers' attitudes towards food safety,
were published at the seminar. The survey
was conducted in March-April and
answers were received from 1,391
respondents. According to the survey,
confidence in the Finnish production
chain has remained high and consumers
feel that Finnish food is safer than food
produced elsewhere. Young people had by
far the highest confidence in the safety of
the production chain. A healthy diet was
definitely also seen as part of product
safety.
Melamine-contaminated milk in China
and a counterfeit scandal concerning Ital-
ian cheese made it to the headlines in the
autumn, and the dioxin in Irish pork did
the same before Christmas. The Product
Research Unit kept a close eye on all such
cases, and took actions to ensure the
cleanliness of the ingredients of Pirkka
products. As far as melamine was con-
cerned, the Unit examined all the prod-
ucts included in the selection, verifying
that they did not contain any milk com-
ponents of Chinese origin.
The 2008 Fairtrade prize was awarded
to Kesko Food, whose Pirkka range
has made Fairtrade products
accessible to consumers throughout
Finland.
All Pirkka products are analysed by
Kesko Food's Product Research Unit.
In 2008, Kesko Food's Consumer
Service answered 21,482 consumer
inquiries.

58 Kesko’s year 2008
Kesko's Corporate GovernanceA more comprehensive and regularly updated description of
Kesko's Corporate Governance is presented at www.kesko.fi.
The rules and the Corporate Governance Code observed by KeskoKesko Corporation (“Kesko” or “the company”) is a Finnish
public limited company in which the duties and responsibilities
of the executive bodies are defined according to the Finnish
law. The international Kesko Group comprises the parent com-
pany, Kesko, and its subsidiaries. The company is domiciled in
Helsinki.
The highest decision-making power in Kesko is exercised by
the company's shareholders at a General Meeting. The compa-
ny's shareholders elect the company's Board of Directors and
auditor at a General Meeting. The Kesko Group is managed by
the Board of Directors and a Managing Director, who is the Pres-
ident and CEO. The company uses a so-called one-tier govern-
ance model.
Kesko's decision-making and administration comply with the
Finnish Limited Liability Companies Act, other regulations con-
cerning publicly traded companies, Kesko Corporation's Articles
of Association, and the rules of NASDAQ OMX Helsinki Ltd. In
addition, the company complies with the Finnish Corporate
Governance Code (“Corporate Governance Code”) issued by the
Reports
Elects Supervises Controls
ElectsIssues
an audit report
Kesko Group's Corporate Governance structure
Kesko Corporation
repop rt
Auditor
p
General Meeting, shareholders
Internal Audit
Elects
Corporate Management Board
Kesko Food Ltd Rautakesko LtdVV-Auto
Group OyAnttila OyKonekesko Ltd Intersport Finland Ltd
Indoor Group Ltd
Musta Pörssi Ltd
Kenkäkesko Ltd
other subsidiaries
Elects
President and CEO
Board of DirectorsAudit Committee
Remuneration Committee
Securities Market Association. The Corporate Governance Code is
available in full at www.cgfinland.fi. In accordance with the
Comply or Explain principle of the Corporate Governance Code,
the company departs from the Corporate Governance Code's rec-
ommendation concerning the terms of office of Board members
as specified hereafter.
Departure from the recommendation
of the Corporate Governance Code
The terms of the members of Kesko's Board of Directors depart
from the recommended term of one year. The term of the com-
pany's Board is defined in the company's Articles of Associa-
tion. The General Meeting makes decisions on amendments to
the Articles of Association. According to the company's Articles
of Association, the term of office of each Board member is three
(3) years with the term starting at the close of the General
Meeting electing the member and expiring at the close of the
third (3rd) Annual General Meeting after the election.
A shareholder which, together with controlled companies,
holds over 10% of all voting rights attached to Kesko's shares,
has informed the company's Board of Directors that it considers
the term of three (3) years good for the company's long-term
development and sees no need to shorten the term of office set
in the Articles of Association.

59Kesko’s year 2008
General meetingThe Annual General Meeting, which is held on a date by the
end of every June designated by the company's Board of Direc-
tors, handles the business specified for the Annual General
Meeting in the company's Articles of Association and any other
proposals that may be made to the Meeting. If needed, the
company may also hold an Extraordinary General Meeting. All
General Meetings are convened by the company's Board of
Directors. An Extraordinary General Meeting must also be con-
vened if shareholders with at least 10% of the shares so
demand in writing in order to deal with a given matter. As a
rule, General Meetings handle the matters placed on the
agenda by the company's Board of Directors. According to the
Limited Liability Companies Act, a shareholder has the right to
have a matter specified for a General Meeting handled at a
General Meeting, if he/she requests so in writing to the Board
of Directors early enough for the matter to be included in the
notice of the meeting.
Major matters subject to the decision-making power of
a General Meeting
Major matters subject to the decision-making power of a
General Meeting include:
decisions on the number of the Board members, ●
the election of the Board members, ●
decisions on the remuneration and financial benefits of the ●
members of the Board of Directors and Board Committees,
the election of the auditor and decisions of the auditor's fee, ●
the adoption of the financial statements, ●
decisions on discharging the Board and the Managing Director ●
from liability,
amendments to the Articles of Association, ●
decisions on increases in the share capital, and ●
decisions on the distribution of the company's earnings, such ●
as distribution of profit.
Convening a General Meeting
Shareholders are invited to a General Meeting by a notice pub-
lished in at least two nationwide newspapers, specifying e.g.:
the time and place, ●
the proposed agenda for the General Meeting, ●
a description of the procedures that shareholders must ●
comply with in order to participate in and cast votes at the
General Meeting,
the so-called record date that defines the right to participate ●
in and cast votes at the General Meeting,
the place where the documents and proposals for resolutions ●
of the General Meeting are available, and
the address of the company website. ●
The notice is delivered no earlier than two (2) months and no
later than one (1) week before the record date of the General
Meeting defined in the Limited Liability Companies Act. The
notice and the proposals of the company's Board to a General
Meeting are published in a stock exchange release. A proposal of
such shareholders who hold at least 10% of the votes carried by
the company shares as Board member is also published in a
stock exchange release.
Right to participate in a General Meeting
Shareholders have the right to participate in a General Meeting
if they are registered as shareholders in the company's register
of shareholders kept by Euroclear Finland Ltd at the record date
separately given by the company. Those wishing to attend a
General Meeting must notify their intention in advance by the
date announced in the notice of the General Meeting, which
date must not be earlier than ten (10) days before the meeting.
Shareholders may attend the meeting themselves or through an
authorised representative.
Kesko's aim is that all members of the company's Board of
Directors are present at the Annual General Meeting. First-time
candidates for the Board of Directors are present at the General
Meeting which decides on election, unless there is a weighty
reason for their absence.
Share series
The company has two share series, A and B, which differ as to
the votes to which they give entitlement. Each A share entitles
its holder to ten (10) votes and each B share to one (1) vote at a
General Meeting.
Kesko's Articles of Association do not include any redemption
clauses or voting restrictions. No shareholder agreements on the
use of voting rights in the company or agreements on restricting
the transfer of company shares are known to the company.
Board of Directors and Board CommitteesComposition and term of the Board of Directors and
independence of Board members
According to the Articles of Association, Kesko's Board of Direc-
tors consists of a minimum of five (5) and a maximum of eight
(8) members. The General Meeting elects all members of the
Board of Directors. The Board elects the Chair and the Deputy
Chair from among its members. All Kesko's Board members are
non-executive directors. According to the Articles of Association,
the term of office of each Board member is three (3) years with
the term starting at the close of the General Meeting electing
the member and expiring at the close of the third (3rd) Annual
General Meeting after the election.
The majority of Kesko's Board members are independent of
the company and all Board members are independent of the
company's significant shareholders. The Board of Directors eval-
uates the independence of its members on a regular basis. Each
Board member is obliged to provide the Board with sufficient
information that will allow the Board to evaluate his/her inde-
pendence.
Duties
The function of Kesko's Board of Directors is to duly arrange the
company's management, operations and accounting, and to
supervise the company's financial management. The Board of
Directors has confirmed the written rules of procedure that
specify the Board of Directors' duties, business to be handled,
meeting practice and the decision-making process. According to
the rules of procedure, the Board of Directors handles and
decides on all matters that are financially, commercially or fun-
damentally significant for the Group's operations. According to
the rules of procedure, the principal duties of the Board of
Directors include:
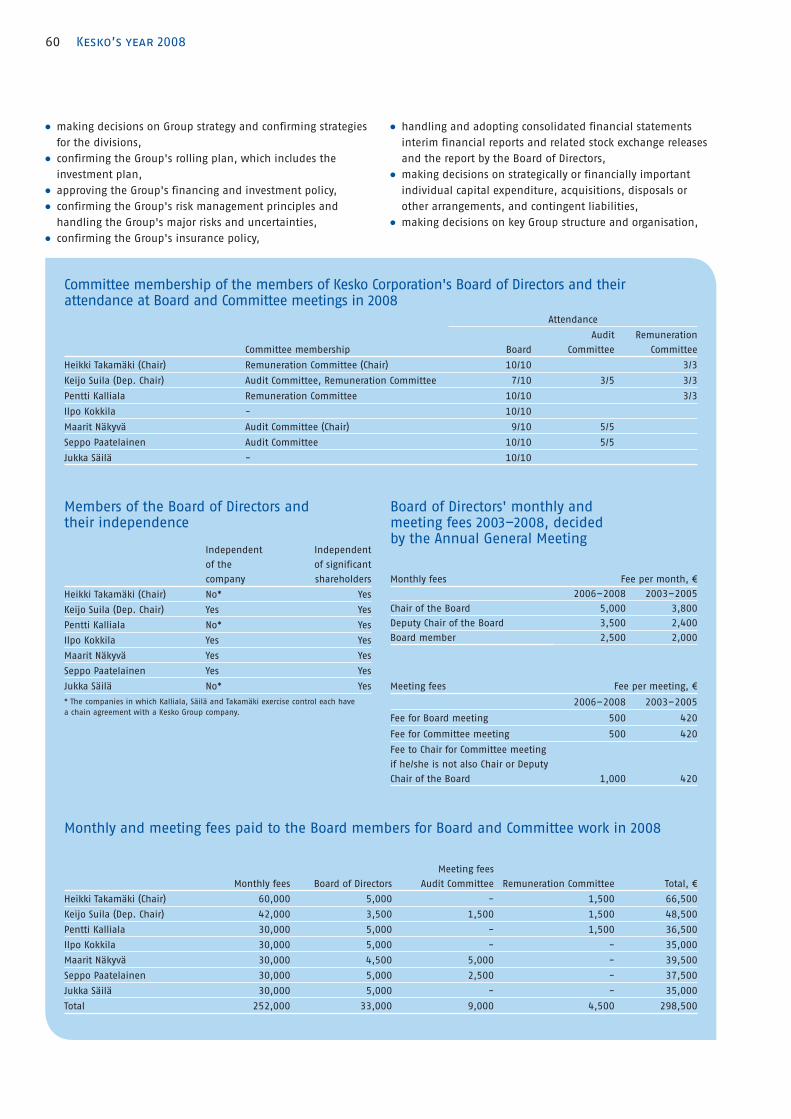
60 Kesko’s year 2008
Committee membership of the members of Kesko Corporation's Board of Directors and their attendance at Board and Committee meetings in 2008
Attendance
Committee membership Board
Audit
Committee
Remuneration
Committee
Heikki Takamäki (Chair) Remuneration Committee (Chair) 10/10 3/3
Keijo Suila (Dep. Chair) Audit Committee, Remuneration Committee 7/10 3/5 3/3
Pentti Kalliala Remuneration Committee 10/10 3/3
Ilpo Kokkila - 10/10
Maarit Näkyvä Audit Committee (Chair) 9/10 5/5
Seppo Paatelainen Audit Committee 10/10 5/5
Jukka Säilä - 10/10
Monthly and meeting fees paid to the Board members for Board and Committee work in 2008
Monthly fees Board of Directors
Meeting fees
Audit Committee
Remuneration Committee Total, €
Heikki Takamäki (Chair) 60,000 5,000 - 1,500 66,500
Keijo Suila (Dep. Chair) 42,000 3,500 1,500 1,500 48,500
Pentti Kalliala 30,000 5,000 - 1,500 36,500
Ilpo Kokkila 30,000 5,000 - - 35,000
Maarit Näkyvä 30,000 4,500 5,000 - 39,500
Seppo Paatelainen 30,000 5,000 2,500 - 37,500
Jukka Säilä 30,000 5,000 - - 35,000
Total 252,000 33,000 9,000 4,500 298,500
Members of the Board of Directors and their independence
Independent
of the
company
Independent
of significant
shareholders
Heikki Takamäki (Chair) No* Yes
Keijo Suila (Dep. Chair) Yes Yes
Pentti Kalliala No* Yes
Ilpo Kokkila Yes Yes
Maarit Näkyvä Yes Yes
Seppo Paatelainen Yes Yes
Jukka Säilä No* Yes
* The companies in which Kalliala, Säilä and Takamäki exercise control each have
a chain agreement with a Kesko Group company.
Board of Directors' monthly and meeting fees 2003–2008, decided by the Annual General Meeting
Monthly fees Fee per month, €
2006–2008 2003–2005
Chair of the Board 5,000 3,800
Deputy Chair of the Board 3,500 2,400
Board member 2,500 2,000
Meeting fees Fee per meeting, €
2006–2008 2003–2005
Fee for Board meeting 500 420
Fee for Committee meeting 500 420
Fee to Chair for Committee meeting
if he/she is not also Chair or Deputy
Chair of the Board 1,000 420
making decisions on Group strategy and confirming strategies ●
for the divisions,
confirming the Group's rolling plan, which includes the ●
investment plan,
approving the Group's financing and investment policy, ●
confirming the Group's risk management principles and ●
handling the Group's major risks and uncertainties,
confirming the Group's insurance policy, ●
handling and adopting consolidated financial statements ●
interim financial reports and related stock exchange releases
and the report by the Board of Directors,
making decisions on strategically or financially important ●
individual capital expenditure, acquisitions, disposals or
other arrangements, and contingent liabilities,
making decisions on key Group structure and organisation, ●

61Kesko’s year 2008
preparing the draft resolution concerning the election of the ●
company's auditor, and
maintaining contact with the company's auditor. ●
Remuneration Committee
The duties of the Remuneration Committee include:
the preparation of the remuneration and other financial ●
benefits of the company's President and CEO for the com-
pany's Board of Directors,
the preparation of the salaries and other financial benefits ●
of the Corporate Management Board members responsible for
the business divisions,
the preparation of the appointment matters of the President ●
and CEO and the Corporate Management Board members
responsible for the business divisions and the assessment of
their successors,
the preparation and development of the company's remu- ●
neration systems, and
the preparation of matters related to the possible granting of ●
stock options to the company's Board of Directors within the
terms and conditions decided by the General Meeting.
Further information about Kesko's Board of Directors and its
Committees is available on pages 66–67 and at www.kesko.fi.
President and CEOKesko has a Managing Director who is known as the President
and CEO. His duty is to manage the company's activities in
accordance with the company's Board of Directors' instructions
and rules and to inform the Board of Directors about the devel-
opment of the company's business and financial situation. He
is also responsible for arranging the company's day-to-day
administration and ensuring that the financial administration
of the company has been arranged reliably. The Board of Direc-
tors elects the President and CEO. The Board of Directors has
decided the terms of the President and CEO's service contract.
A managing director's service contract has been made in writ-
ing between the company and the President and CEO.
Information about the President and CEO's biographical
details, working experience and key positions of trust as well
as his holdings of securities issued by Kesko are presented on
pages 68–69 and at www.kesko.fi.
Corporate Management Board
The Kesko Group has a Corporate Management Board, the Chair
of which is Kesko's President and CEO.
The Corporate Management Board has no authority based on
legislation or the Articles of Association. The Corporate Manage-
ment Board is responsible for dealing with Group-wide devel-
opment projects and Group-level principles and practices. In
addition, the Corporate Management Board deals with the
Group's and the division parent companies' business plans,
profit performance and prepares matters that are handled by
Kesko's Board of Directors. The Corporate Management Board
meets 8–10 times a year.
Further information about Kesko's Corporate Management
Board is presented on pages 68–69 and at www.kesko.fi.
appointing and dismissing the company's President and CEO, ●
approving his/her managing director's service contract and
making decisions on his/her remuneration and other financial
benefits,
approving the appointments, remuneration and financial ●
benefits of the Corporate Management Board members
responsible for business divisions,
making decisions on Kesko's remuneration systems including ●
possible granting of stock options within the terms and con-
ditions decided by the General Meeting,
establishing a dividend policy and being responsible for the ●
development of shareholder value, and
handling the Corporate Responsibility Report. ●
Remuneration and other financial benefits of the Board
of Directors and its Committees
The Annual General Meeting makes decisions on the remunera-
tion and other financial benefits paid to the members of the
Board of Directors and its Committees annually. Fees to the
members of the Board of Directors and its Committees are paid
as monetary compensation. Board members have no share or
share-linked remuneration systems.
Committees of the Board of Directors
Kesko has the Board of Directors' Audit Committee and Remu-
neration Committee, both of which consist of three (3) Board
members. The Board of Directors elects the Chairs and the
members of the Committees from among its members for one
year at a time. All members of the Audit Committee are inde-
pendent of the company and its significant shareholders. All
members of the Remuneration Committee are independent of
the company's significant shareholders. The Committees regu-
larly assess their operations and working practices and carry out
a related self-assessment once a year. The Board of Directors
has confirmed written rules of procedure for the Committees
that lay down their key duties and operating policies.
The Committees have no independent decision-making
power, but the Board makes decisions based on the prepara-
tions made by the Committees. The Chair of the Committee
regularly reports on the work of the Committee to the Board
of Directors.
Audit Committee
The duties of the Audit Committee include:
monitoring the financial position and financing of the Kesko ●
Group,
monitoring the company's reporting process of financial ●
statements,
supervising the company's financial reporting process, ●
monitoring the efficiency of the company's internal control, ●
internal audit and risk management systems,
handling the plans and reports of the company's Internal ●
Audit Department,
monitoring the statutory audit of the financial statements ●
and consolidated financial statements,
evaluating the independence of the company's audit firm, ●
evaluating the related services provided to the Group by the ●
company's audit firm and the audit companies belonging to
the same chain,
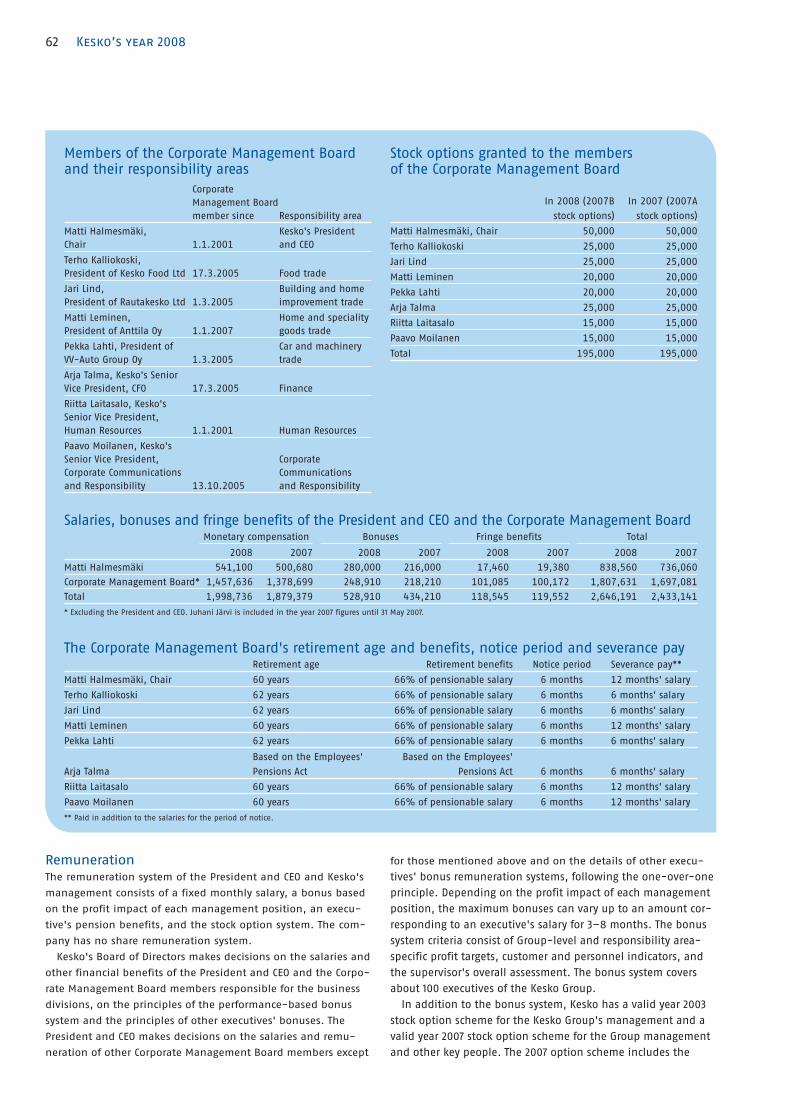
62 Kesko’s year 2008
Salaries, bonuses and fringe benefits of the President and CEO and the Corporate Management BoardMonetary compensation Bonuses Fringe benefits Total
2008 2007 2008 2007 2008 2007 2008 2007
Matti Halmesmäki 541,100 500,680 280,000 216,000 17,460 19,380 838,560 736,060
Corporate Management Board* 1,457,636 1,378,699 248,910 218,210 101,085 100,172 1,807,631 1,697,081
Total 1,998,736 1,879,379 528,910 434,210 118,545 119,552 2,646,191 2,433,141
* Excluding the President and CEO. Juhani Järvi is included in the year 2007 figures until 31 May 2007.
Members of the Corporate Management Board and their responsibility areas
Corporate
Management Board
member since Responsibility area
Matti Halmesmäki,
Chair 1.1.2001
Kesko's President
and CEO
Terho Kalliokoski,
President of Kesko Food Ltd 17.3.2005 Food trade
Jari Lind,
President of Rautakesko Ltd 1.3.2005
Building and home
improvement trade
Matti Leminen,
President of Anttila Oy 1.1.2007
Home and speciality
goods trade
Pekka Lahti, President of
VV-Auto Group Oy 1.3.2005
Car and machinery
trade
Arja Talma, Kesko's Senior
Vice President, CFO 17.3.2005 Finance
Riitta Laitasalo, Kesko's
Senior Vice President,
Human Resources 1.1.2001 Human Resources
Paavo Moilanen, Kesko's
Senior Vice President,
Corporate Communications
and Responsibility 13.10.2005
Corporate
Communications
and Responsibility
Stock options granted to the members of the Corporate Management Board
In 2008 (2007B
stock options)
In 2007 (2007A
stock options)
Matti Halmesmäki, Chair 50,000 50,000
Terho Kalliokoski 25,000 25,000
Jari Lind 25,000 25,000
Matti Leminen 20,000 20,000
Pekka Lahti 20,000 20,000
Arja Talma 25,000 25,000
Riitta Laitasalo 15,000 15,000
Paavo Moilanen 15,000 15,000
Total 195,000 195,000
The Corporate Management Board's retirement age and benefits, notice period and severance payRetirement age Retirement benefits Notice period Severance pay**
Matti Halmesmäki, Chair 60 years 66% of pensionable salary 6 months 12 months' salary
Terho Kalliokoski 62 years 66% of pensionable salary 6 months 6 months' salary
Jari Lind 62 years 66% of pensionable salary 6 months 6 months' salary
Matti Leminen 60 years 66% of pensionable salary 6 months 12 months' salary
Pekka Lahti 62 years 66% of pensionable salary 6 months 6 months' salary
Arja Talma
Based on the Employees'
Pensions Act
Based on the Employees'
Pensions Act 6 months 6 months' salary
Riitta Laitasalo 60 years 66% of pensionable salary 6 months 12 months' salary
Paavo Moilanen 60 years 66% of pensionable salary 6 months 12 months' salary
** Paid in addition to the salaries for the period of notice.
RemunerationThe remuneration system of the President and CEO and Kesko's
management consists of a fixed monthly salary, a bonus based
on the profit impact of each management position, an execu-
tive's pension benefits, and the stock option system. The com-
pany has no share remuneration system.
Kesko's Board of Directors makes decisions on the salaries and
other financial benefits of the President and CEO and the Corpo-
rate Management Board members responsible for the business
divisions, on the principles of the performance-based bonus
system and the principles of other executives' bonuses. The
President and CEO makes decisions on the salaries and remu-
neration of other Corporate Management Board members except
for those mentioned above and on the details of other execu-
tives' bonus remuneration systems, following the one-over-one
principle. Depending on the profit impact of each management
position, the maximum bonuses can vary up to an amount cor-
responding to an executive's salary for 3–8 months. The bonus
system criteria consist of Group-level and responsibility area-
specific profit targets, customer and personnel indicators, and
the supervisor's overall assessment. The bonus system covers
about 100 executives of the Kesko Group.
In addition to the bonus system, Kesko has a valid year 2003
stock option scheme for the Kesko Group's management and a
valid year 2007 stock option scheme for the Group management
and other key people. The 2007 option scheme includes the
63Kesko’s year 2008
obligation made by Kesko's Board of Directors to option recipi-
ents to use 25% of their option income to buy company shares
for permanent ownership. Kesko's Board of Directors makes
decisions on the distribution of stock options based on the pro-
posal by the Remuneration Committee and within the terms and
conditions of the stock option scheme decided by the compa-
ny's General Meeting.
The terms and conditions of the 2003 and 2007 stock option
schemes are available in full at www.kesko.fi.
Group-wide financial reporting The Group's financial performance and the achievement of
financial objectives are monitored via Group-wide financial
reporting. Monthly performance reporting includes Group-,
division- and subsidiary-specific results, progress compared to
the previous year, comparisons with financial plans, and fore-
casts for the next 12 months. The Group's short-term financial
planning is based on plans drawn up by the quarter, extending
for 15 months. The financial indicator for growth is sales
growth, while those for profitability are the accumulation of
operating profit excluding non-recurring items and the accu-
mulation of economic value added, monitored via monthly
internal reporting. When calculating economic value added,
the requirements concerning return on capital are determined
annually on market terms. In profit requirements, risk-related
division- and country-specific differences have been taken into
account. Information about the Group's financial situation is
given by interim financial reports and the financial statements
release. The Group's sales figures are published in a stock
exchange release each month.
Risk management, control and internal audit
Risk management
In the Kesko Group, risk assessment and management is con-
ducted on a comprehensive basis. Risk management is an
essential part of management and day-to-day operations. The
objective of Kesko's risk management is to ensure the delivery
of the Group's customer promises, the shareholder value, profit
performance, the ability to pay dividends and the continuity of
business. Efficient risk management is a competitive advantage
for Kesko.
In the Kesko Group, a risk has been defined as any kind of
uncertainty that may lead to:
a failure to exploit business opportunities, ●
events or reasons which prevent or hinder the attainment of ●
objectives or have other unwanted consequences.
The risk management policy approved by the Board of Directors
guides risk management in the Kesko Group. This policy is based
on the COSO ERM Integrated Framework. The policy defines the
objectives, principles, responsibilities and key practices of risk
management.
The Kesko Group's principles of risk management
Conscious and carefully evaluated risks are taken in selecting ●
strategies, e.g. in expanding business operations, in enhanc-
ing market position and power, and in creating new business.
Financial, operational and damage/loss risks are avoided or ●
reduced.
A safe shopping environment for customers and product safety ●
are ensured.
A safe working environment is created for employees. ●
Information about risks and risk management is provided to ●
stakeholders.
Opportunities for unhealthy phenomena, crime or malpractice ●
are minimised through operating principles, controls and
supervision.
The continuity of operations is ensured by safeguarding criti- ●
cal functions and essential resources.
Crisis management, disaster recovery and continuity plans are ●
prepared in case any risks are realised.
The costs and resources involved in risk management are in ●
proportion to the obtainable benefits.
Responsibilities and roles in risk management
The business management is responsible for the risk manage-
ment in practice. Persons responsible for risk management have
been appointed in the divisions to coordinate and report on
risk management activities. Kesko Food and Rautakesko also
have Risk Managers of their own, who are responsible for the
development of risk management in their divisions in coopera-
tion with the business management and supporting functions.
The Corporate Risk Management Unit is responsible for devel-
oping risk management and its tools, introducing best practices
to the Group and reporting on risk management to the Group
management. The Unit is responsible for Group-level insurance
programmes.
Kesko has a Group-level Risk Management Steering Group,
which is chaired by the President and CEO, and has representa-
tives of various divisions and Group units as members. The
Steering Group approves risk management procedures and key
policy definitions, and assesses and monitors the Group's risks
and the implementation of risk management responses.
Risks are reported to Kesko's Board of Directors' Audit Com-
mittee on a quarterly basis. Kesko's Board of Directors handles
the major risks, their management and assesses risk manage-
ment efficiency.
With respect to the management of financial risks, the Group
observes the financial policy that has been confirmed by the
Board of Directors. The Group's Treasury is responsible centrally
for Group funding, liquidity management, relations with pro-
viders of finance, and the management of financial risks. The
implementation of the policy and the Group's financing is
reported to the Audit Committee.
The Corporate Internal Audit assesses the Group's risk man-
agement annually and reports on the level of risk management
to the Audit Committee.
Risk management implementation in 2008
As a result of the global financial and real economy crisis, risk
management has become increasingly important and it has
been systematically developed in the Kesko Group. The role of
divisions' management in risk management has become
increasingly important. Risk management is part of Kesko's
management and operational activity. Risks are assessed on a
regular basis and reported quarterly in connection with finan-
cial reporting. Project-specific risk analyses are also prepared.

64 Kesko’s year 2008
The divisions assess the risks in connection with the strategy
cycle and prioritise them according to their criticality and man-
agement level. Division parent companies' risks and their man-
agement have been discussed by the companies' and the
Group's management. Separate risk analyses have been carried
out for major projects. Also the Group units, such as Corporate
Finance and Accounting, Treasury, Corporate Communications
and Responsibility, Legal Affairs and IT Management, have
assessed the risks threatening the Group objectives and their
management.
On the basis of the divisions' and Group units' risk analyses,
the Corporate Risk Management Unit has prepared summaries of
major risks and their management on a quarterly basis. The
resulting risk report has been handled by the Audit Committee.
The main risks and uncertainties have been reported in connec-
tion with the interim financial reports.
Other risk management responses in 2008
Continuity management projects progressed. ●
Shrinkage reporting was harmonised. ●
Group-level crisis plan and crisis communications guidelines ●
were updated.
Insurance policy updated by the Corporate Risk Management ●
Unit was approved by Kesko's Board of Directors.
Risk reporting to the management was increased. ●
Deviation reporting application was introduced (incl. the ●
reporting of “near miss” situations and follow-up of correc-
tive actions).
Guidelines for the safety and security of business premises ●
were harmonised.
Guidelines for handling malpractice were updated. ●
The operation of Group-level cooperation forums to support ●
the development of risk management was established (sub-
jects include corporate, premises and work safety, data secu-
rity and insurance).
Risk awareness was increased through risk management and ●
safety training, and communications.
Risk management emphases in 2009
Key development areas at the Group level include more efficient
counterparty risk and continuity management and improved
management of operational risks and loss prevention. An
assessment of job hazards will be carried out in operations in
Finland.
Major risks and uncertainties related to Kesko's business opera-
tions and risk management responses are described in Kesko's
Annual Report, in the report by the Board of Directors on pages
78–79, in notes Nos. 44 and 45 to the consolidated financial
statements on pages 122–129, and on Kesko's website at
www.kesko.fi.
Internal audit
Roles of management and the Corporate Internal Audit in
internal control
The Audit Committee of Kesko's Board of Directors has con-
firmed Kesko's internal audit policies, which are based on good
auditing principles, widely accepted internationally.
Internal control is an essential part of corporate governance
and management. The Board of Directors and the President and
CEO are responsible for organising internal control. The Board of
Directors is accountable to shareholders and the President and
CEO to the Board of Directors. The chain of responsibilities con-
tinues throughout Kesko's organisation so that the direct subor-
dinates of the President and CEO report to him, and each Kesko
employee is accountable for the internal control of his/her area
of responsibility to his/her immediate superior. The main duty of
the Corporate Internal Audit is to support Kesko's President and
CEO, the Board of Directors and management in their task of
control.
Kesko's Corporate Internal Audit is responsible for the inde-
pendent corporate assessment and assurance functions required
of a listed company that systematically evaluate and verify the
effectiveness of risk management, control, management and
governance. In addition, support is given to the management
and organisation in their work of ensuring that the Group's
goals and objectives are achieved and that the monitoring
system is developed further.
Organisation and focus of internal audit
The operating policies of Kesko's Corporate Internal Audit have
been defined in the Charter confirmed by the Audit Committee.
The unit is subject to Kesko's President and CEO and the Board's
Audit Committee, and it reports about its plans and activities to
them on a regular basis. Audit findings, recommendations and
the progress of actions are reported to the auditee manage-
ment, the President and CEO, the Audit Committee and the
external auditors.
The Corporate Internal Audit is divided into foreign audit,
group audit and IT audit. Auditing is based on risk analyses and
the control discussions carried on with Group and divisional
management. The Corporate Internal Audit cooperates with the
Corporate Risk Management and participates in the work of the
Group's Risk Management Steering Group. The Corporate Internal
Audit assesses the effectiveness of Kesko's risk management sys-
tem annually.
Auditing fees
€ thousand 2008 2007
PwC Others Total PwC Others Total
Auditing expenses 869 155 1,024 786 187 973
Other services 873 309 1,182 379 108 487
Total 1,742 464 2,206 1,165 295 1,460

65Kesko’s year 2008
Auditing evaluates the effectivity and efficiency of operations,
the reliability of financial and operational reporting, the com-
pliance with laws and regulations, and the safeguarding of
assets. Focus areas include foreign operations and retailing,
especially controls of goods and money in the supply chain,
finance and reporting, information systems and information
security.
Special attention is paid to good communications with man-
agement and providing support in adopting good audit prac-
tices. The Corporate Internal Audit communicates and consults
on good control solutions within the Group by preparing reports
and arranging events for exchanging experiences. Controls are
constantly compared with the best Finnish and international
practices with the aim to identify the most efficient solutions
from the viewpoint of Kesko.
Ensuring professional competence
According to its Charter, the Corporate Internal Audit must have
sufficient resources available and the knowledge, skills and
other competencies needed for performing its duties. The Presi-
dent and CEO and the Audit Committee approve the Corporate
Internal Audit's annual plan and decide on its resources. The
auditors' competencies are developed by systematic profes-
sional education and examinations. Kesko's Corporate Internal
Audit has five employees with the international qualification
of Certified Internal Auditor, granted by the Institute of Internal
Auditors (IIA).
The extent and competence of auditing is ensured and coor-
dinated by regular contacts and exchange of information with
the Group's other internal assurance operations and external
auditors. In addition, the department acquires external services
for occasional needs or assessment assignments that require
special competence. International guidelines of the IIA require
that an external quality assurance audit be conducted in inter-
nal audit operations every five years. According to the audit car-
ried out at Kesko in 2005, Kesko's Corporate Internal Audit
mainly complies with the international professional and ethical
IIA standards.
Insider administration
Kesko's insider regulations
Kesko complies with insider guidelines of NASDAQ OMX Helsinki
Ltd (Helsinki Stock Exchange), effective 2 June 2008. Kesko's
Board of Directors has confirmed Kesko's insider regulations for
permanent and project-specific insiders. The contents of the
regulations correspond with the insider rules of the Helsinki
Stock Exchange. Kesko's insider regulations have been distrib-
uted to all insiders.
Kesko's permanent insiders and insider registers
In accordance with the Securities Markets Act, Kesko's perma-
nent public insiders include Kesko's Board members, the Presi-
dent and CEO (Managing Director), and the auditor with princi-
pal responsibility in the audit firm. Kesko Corporation's Board
of Directors has also stipulated that, in addition to the Presi-
dent and CEO, other members of the Corporate Management
Board are regarded as the company's permanent public insid-
ers. All permanent public insiders and the statutory information
about them, their related persons and the corporations that are
controlled by related persons or in which they exercise influ-
ence, have been entered in Kesko's register of public insiders.
Other permanent insiders of Kesko include such persons
working in positions determined by the Board of Directors, who
in their duties receive insider information on a regular basis and
who are thus entered in the company's own, non-public insider
register. Kesko's company-specific insider register is divided into
individual registers that consist of permanent insiders and of
possible insider projects and persons participating in their
preparation.
Monitoring
The Group's Legal Affairs Unit monitors the compliance with
insider regulations and maintains the company's insider regis-
ters in cooperation with Euroclear Finland Ltd. Kesko's perma-
nent insiders may not acquire or transfer securities issued by
the company, including securities or derivative financial instru-
ments entitling to them, during 21 days prior to the publication
of interim financial reports and during 28 days prior to the
publication of annual financial statements.
Further information about the holdings of Kesko's permanent
public insiders is available on pages 146–147 and updated infor-
mation at www.kesko.fi.
AuditingAccording to the Articles of Association, Kesko has one (1) audi-
tor, which shall be an audit firm authorised by the Central
Chamber of Commerce. The Board of Directors' Audit Committee
prepares the proposal concerning the company's auditor for
presentation at a General Meeting. The term of an auditor is
the company’s financial period and an auditor’s duties termi-
nate at the close of the Annual General Meeting following the
election. A company belonging to the same chain as the audit
firm represented by the auditor elected by Kesko's General
Meeting mainly acts as an auditor of the Group companies out-
side Finland.
The auditor presents the audit report required by law to Kes-
ko's shareholders in connection with the handling of the com-
pany's financial statements at the General Meeting, and regu-
larly reports to the Audit Committee of Kesko's Board of Direc-
tors.
Other mattersStock exchange communications
and stock exchange releases
The Group's Senior Vice President, CFO is responsible for the
financial content of stock exchange releases as well as for
investor information. The Corporate Communications and
Responsibility Unit produces Group-level communications
material and is responsible for providing stock exchange and
financial information. The Vice President, General Counsel is
responsible for ensuring that the rules related to stock
exchange releases are observed at Kesko.
In its investor communications, Kesko follows the principle
of impartiality and publishes all investor information on its
website in Finnish, Swedish and English. Kesko observes a two-
week period of silence before publishing information on its
results.

66 Kesko’s year 2008
Board of Directors on 31.12.2008
Heikki Takamäkib. 1947.
Domicile: Tampere, Finland.
Chair(Chair of the Remuneration Commit-
tee).
Principal occupation: Retailer,
K-rauta Rauta-Otra Nekala.
Main employment history:
K-rauta retailer since 1979, Kesport-
Intersport retailer 1995–1999.
Board member since:
1 January 2001.
Main simultaneous positions of trust: -Fees in 2008: €67,500.
Kesko shares and stock options held on 1 January 2008: 104,470 A
shares and 42,120 B shares held by
him or his company. No stock
options.
On 31 December 2008: 104,470 A
shares and 68,120 B shares held by
him or his company.
No stock options.
Keijo Suilab. 1945, B.Sc. (Econ.).
Domicile: Helsinki, Finland.
Deputy Chair(member of the Audit Committee,
member of the Remuneration Com-
mittee).
Principal occupation: -
Main employment history:
Huhtamäki Oyj: President of Leaf
Europe 1985–1988, President of Leaf
Group 1988–1998, Huhtamäki Oy:
Executive Vice President 1992–1998,
Finnair Plc: President and CEO
1999–2005.
Board member since:
1 January 2001.
Main simultaneous positions of trust: The Finnish Fair Corporation:
Chair of the Board of Directors,
Nokia Corporation: member of the
Board of Directors, Solidium Oy:
Chair of the Board of Directors.
Fees in 2008: €50,000.
Kesko shares and stock options held on 1 January 2008: No shares.
No stock options.
On 31 December 2008: No shares.
No stock options.
Pentti Kallialab. 1948,
(member of the Remuneration Com-
mittee).
Domicile: Raisio, Finland.
Principal occupation: Retailer,
K-supermarket Raisio Center.
Main employment history: K-food
retailer 1980–1992, K-supermarket
retailer since 1992.
Board member since:
31 March 2003.
Main simultaneous positions of trust: Raisio plc: Supervisory Board
member.
Fees in 2008: €37,500.
Kesko shares and stock options held on 1 January 2008: 88,560 A
shares and 111,200 B shares held by
him or his company. No stock
options.
On 31 December 2008: 92,440 A
shares and 116,050 B shares held by
him or his company.
No stock options.
Ilpo Kokkilab. 1947, M.Sc. (Techn.).
Domicile: Helsinki, Finland.
Principal occupation: SRV Group
Plc: Chair of the Board of Directors.
Main employment history:
A-Betoni Oy: Constructor 1972–1974,
Perusyhtymä Oy: Director 1974–1987,
SRV Group Plc: Chair of the Board of
Directors 1987-, Pontos Ltd: Chair of
the Board of Directors 2002-.
Board member since:
27 March 2006.
Main simultaneous positions of trust: JTO School of Management:
Chair of the Board of Directors,
Finnish-Russian Chamber of Com-
merce (FRCC): Deputy Chair of the
Board of Directors.
Fees in 2008: €35,500.
Kesko shares and stock options held on 1 January 2008: 16,100 B
shares held by him. No stock
options.
On 31 December 2008: 16,100 B
shares held by him.
No stock options.
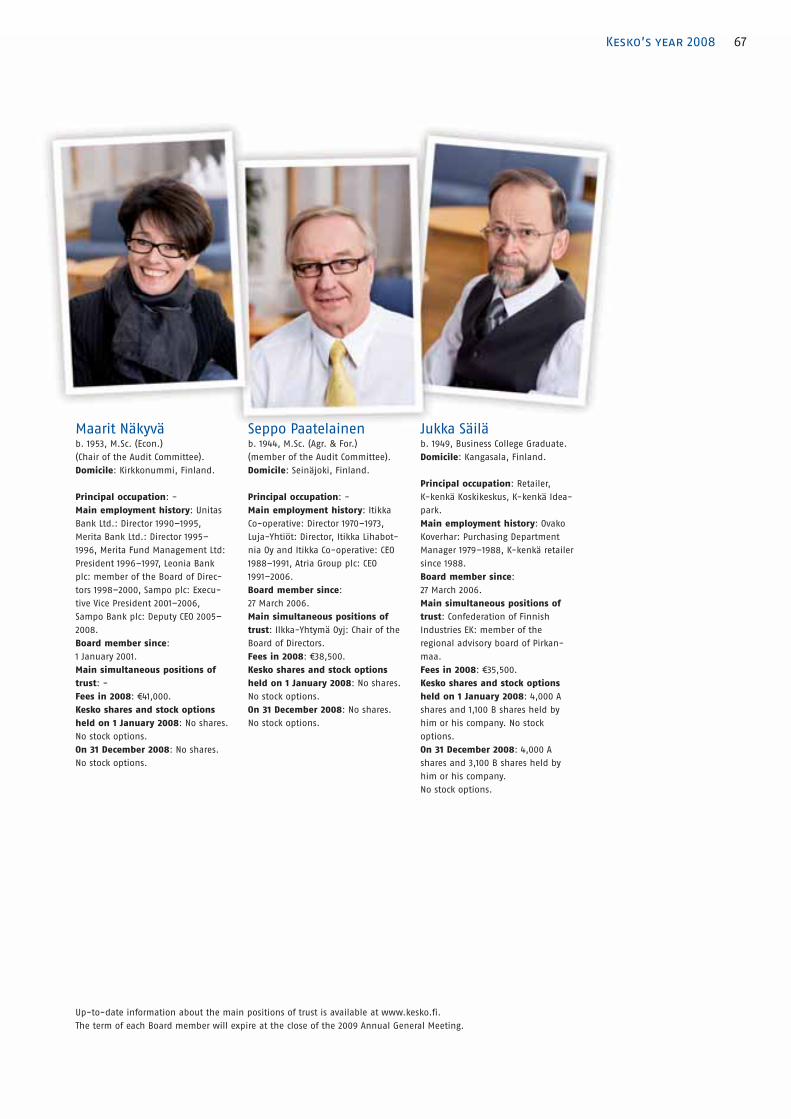
67Kesko’s year 2008
Maarit Näkyväb. 1953, M.Sc. (Econ.)
(Chair of the Audit Committee).
Domicile: Kirkkonummi, Finland.
Principal occupation: -
Main employment history: Unitas
Bank Ltd.: Director 1990–1995,
Merita Bank Ltd.: Director 1995–
1996, Merita Fund Management Ltd:
President 1996–1997, Leonia Bank
plc: member of the Board of Direc-
tors 1998–2000, Sampo plc: Execu-
tive Vice President 2001–2006,
Sampo Bank plc: Deputy CEO 2005–
2008.
Board member since:
1 January 2001.
Main simultaneous positions of trust: -Fees in 2008: €41,000.
Kesko shares and stock options held on 1 January 2008: No shares.
No stock options.
On 31 December 2008: No shares.
No stock options.
Seppo Paatelainenb. 1944, M.Sc. (Agr. & For.)
(member of the Audit Committee).
Domicile: Seinäjoki, Finland.
Principal occupation: -
Main employment history: Itikka
Co-operative: Director 1970–1973,
Luja-Yhtiöt: Director, Itikka Lihabot-
nia Oy and Itikka Co-operative: CEO
1988–1991, Atria Group plc: CEO
1991–2006.
Board member since:
27 March 2006.
Main simultaneous positions of trust: Ilkka-Yhtymä Oyj: Chair of the
Board of Directors.
Fees in 2008: €38,500.
Kesko shares and stock options held on 1 January 2008: No shares.
No stock options.
On 31 December 2008: No shares.
No stock options.
Jukka Säiläb. 1949, Business College Graduate.
Domicile: Kangasala, Finland.
Principal occupation: Retailer,
K-kenkä Koskikeskus, K-kenkä Idea-
park.
Main employment history: Ovako
Koverhar: Purchasing Department
Manager 1979–1988, K-kenkä retailer
since 1988.
Board member since:
27 March 2006.
Main simultaneous positions of trust: Confederation of Finnish
Industries EK: member of the
regional advisory board of Pirkan-
maa.
Fees in 2008: €35,500.
Kesko shares and stock options held on 1 January 2008: 4,000 A
shares and 1,100 B shares held by
him or his company. No stock
options.
On 31 December 2008: 4,000 A
shares and 3,100 B shares held by
him or his company.
No stock options.
Up-to-date information about the main positions of trust is available at www.kesko.fi.
The term of each Board member will expire at the close of the 2009 Annual General Meeting.
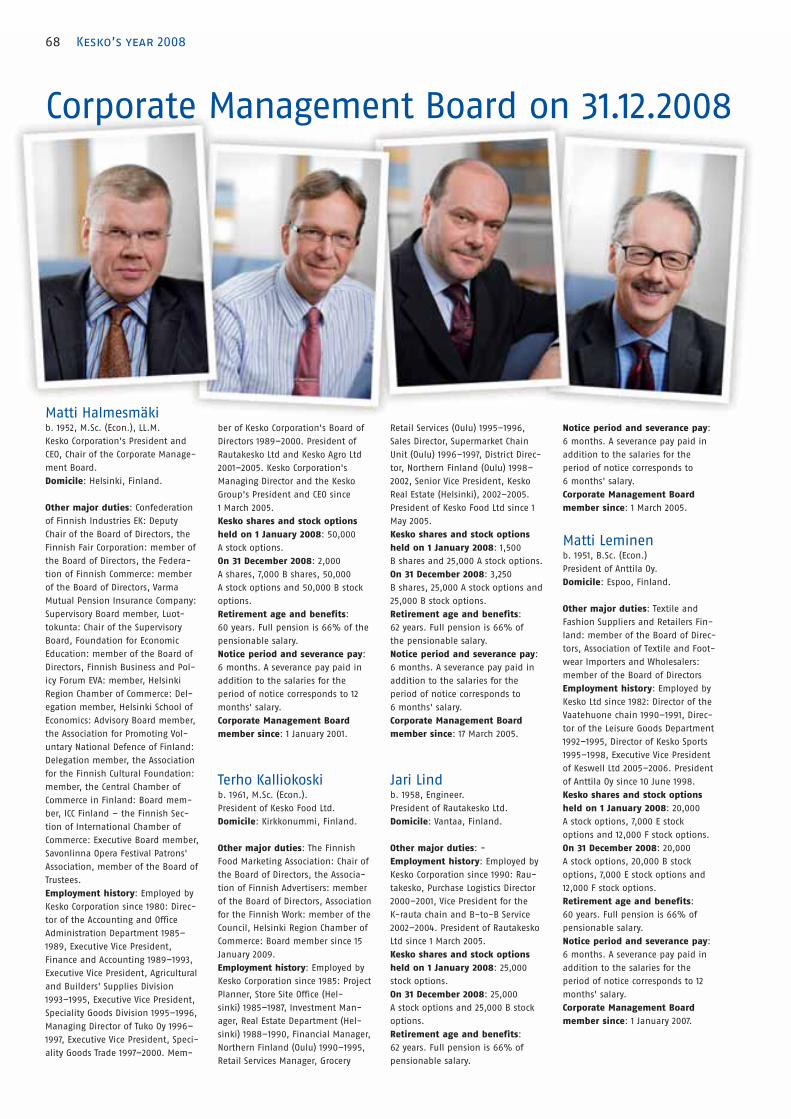
68 Kesko’s year 2008
Corporate Management Board on 31.12.2008
Matti Halmesmäkib. 1952, M.Sc. (Econ.), LL.M.
Kesko Corporation's President and
CEO, Chair of the Corporate Manage-
ment Board.
Domicile: Helsinki, Finland.
Other major duties: Confederation
of Finnish Industries EK: Deputy
Chair of the Board of Directors, the
Finnish Fair Corporation: member of
the Board of Directors, the Federa-
tion of Finnish Commerce: member
of the Board of Directors, Varma
Mutual Pension Insurance Company:
Supervisory Board member, Luot-
tokunta: Chair of the Supervisory
Board, Foundation for Economic
Education: member of the Board of
Directors, Finnish Business and Pol-
icy Forum EVA: member, Helsinki
Region Chamber of Commerce: Del-
egation member, Helsinki School of
Economics: Advisory Board member,
the Association for Promoting Vol-
untary National Defence of Finland:
Delegation member, the Association
for the Finnish Cultural Foundation:
member, the Central Chamber of
Commerce in Finland: Board mem-
ber, ICC Finland – the Finnish Sec-
tion of International Chamber of
Commerce: Executive Board member,
Savonlinna Opera Festival Patrons'
Association, member of the Board of
Trustees.
Employment history: Employed by
Kesko Corporation since 1980: Direc-
tor of the Accounting and Office
Administration Department 1985–
1989, Executive Vice President,
Finance and Accounting 1989–1993,
Executive Vice President, Agricultural
and Builders' Supplies Division
1993–1995, Executive Vice President,
Speciality Goods Division 1995–1996,
Managing Director of Tuko Oy 1996–
1997, Executive Vice President, Speci-
ality Goods Trade 1997–2000. Mem-
ber of Kesko Corporation's Board of
Directors 1989–2000. President of
Rautakesko Ltd and Kesko Agro Ltd
2001–2005. Kesko Corporation's
Managing Director and the Kesko
Group's President and CEO since
1 March 2005.
Kesko shares and stock options held on 1 January 2008: 50,000
A stock options.
On 31 December 2008: 2,000
A shares, 7,000 B shares, 50,000
A stock options and 50,000 B stock
options.
Retirement age and benefits:
60 years. Full pension is 66% of the
pensionable salary.
Notice period and severance pay:
6 months. A severance pay paid in
addition to the salaries for the
period of notice corresponds to 12
months' salary.
Corporate Management Board member since: 1 January 2001.
Terho Kalliokoskib. 1961, M.Sc. (Econ.).
President of Kesko Food Ltd.
Domicile: Kirkkonummi, Finland.
Other major duties: The Finnish
Food Marketing Association: Chair of
the Board of Directors, the Associa-
tion of Finnish Advertisers: member
of the Board of Directors, Association
for the Finnish Work: member of the
Council, Helsinki Region Chamber of
Commerce: Board member since 15
January 2009.
Employment history: Employed by
Kesko Corporation since 1985: Project
Planner, Store Site Office (Hel-
sinki) 1985–1987, Investment Man-
ager, Real Estate Department (Hel-
sinki) 1988–1990, Financial Manager,
Northern Finland (Oulu) 1990–1995,
Retail Services Manager, Grocery
Retail Services (Oulu) 1995–1996,
Sales Director, Supermarket Chain
Unit (Oulu) 1996–1997, District Direc-
tor, Northern Finland (Oulu) 1998–
2002, Senior Vice President, Kesko
Real Estate (Helsinki), 2002–2005.
President of Kesko Food Ltd since 1
May 2005.
Kesko shares and stock options held on 1 January 2008: 1,500
B shares and 25,000 A stock options.
On 31 December 2008: 3,250
B shares, 25,000 A stock options and
25,000 B stock options.
Retirement age and benefits:
62 years. Full pension is 66% of
the pensionable salary.
Notice period and severance pay:
6 months. A severance pay paid in
addition to the salaries for the
period of notice corresponds to
6 months' salary.
Corporate Management Board member since: 17 March 2005.
Jari Lindb. 1958, Engineer.
President of Rautakesko Ltd.
Domicile: Vantaa, Finland.
Other major duties: -
Employment history: Employed by
Kesko Corporation since 1990: Rau-
takesko, Purchase Logistics Director
2000–2001, Vice President for the
K-rauta chain and B-to-B Service
2002–2004. President of Rautakesko
Ltd since 1 March 2005.
Kesko shares and stock options held on 1 January 2008: 25,000
stock options.
On 31 December 2008: 25,000
A stock options and 25,000 B stock
options.
Retirement age and benefits:
62 years. Full pension is 66% of
pensionable salary.
Notice period and severance pay:
6 months. A severance pay paid in
addition to the salaries for the
period of notice corresponds to
6 months' salary.
Corporate Management Board member since: 1 March 2005.
Matti Leminenb. 1951, B.Sc. (Econ.)
President of Anttila Oy.
Domicile: Espoo, Finland.
Other major duties: Textile and
Fashion Suppliers and Retailers Fin-
land: member of the Board of Direc-
tors, Association of Textile and Foot-
wear Importers and Wholesalers:
member of the Board of Directors
Employment history: Employed by
Kesko Ltd since 1982: Director of the
Vaatehuone chain 1990–1991, Direc-
tor of the Leisure Goods Department
1992–1995, Director of Kesko Sports
1995–1998, Executive Vice President
of Keswell Ltd 2005–2006. President
of Anttila Oy since 10 June 1998.
Kesko shares and stock options held on 1 January 2008: 20,000
A stock options, 7,000 E stock
options and 12,000 F stock options.
On 31 December 2008: 20,000
A stock options, 20,000 B stock
options, 7,000 E stock options and
12,000 F stock options.
Retirement age and benefits:
60 years. Full pension is 66% of
pensionable salary.
Notice period and severance pay:
6 months. A severance pay paid in
addition to the salaries for the
period of notice corresponds to 12
months' salary.
Corporate Management Board member since: 1 January 2007.

69Kesko’s year 2008
Pekka Lahtib. 1955, M.Sc. (Agr.).
President of VV-Auto Group Oy.
Domicile: Vantaa, Finland.
Other major duties: -
Employment history: Employed by
Kesko Corporation since 1981: Vice
President, Kesko Machinery 2000,
Managing Director of Konekesko Ltd
since 2001 and President of Kesko
Agro Ltd 2005–2008. Chair of the
Board of Konekesko Ltd since
1 November 2005. President of
VV-Auto Group Oy since 1 February
2006.
Kesko shares and stock options held on 1 January 2008: 20,000
A stock options and 23,500 F stock
options.
On 31 December 2008: 20,000
A stock options, 20,000 B stock
options and 23,500 F stock options.
Retirement age and benefits:
62 years. Full pension is 66% of
pensionable salary.
Notice period and severance pay:
6 months. A severance pay paid in
addition to the salaries for the
period of notice corresponds to
6 months' salary.
Corporate Management Board member since: 1 March 2005.
Riitta Laitasalob. 1955, M.Sc. (Econ.).
Senior Vice President, Human
Resources.
Domicile: Espoo, Finland.
Other major duties: Edita Plc:
member of the Board of Directors,
JTO School of Management: member
of the Board of Directors, the Finn-
ish Institute for International Trade
Fintra: member of the Board of
Directors.
Employment history: Employed
by Kesko Corporation since 1979:
Personnel Director 1995–1997, Vice
President, Accounting and Finance
Division 1997–1998, Vice President,
Finance and Administration Division
1998–1999, Senior Vice President,
Administration 2000–2005. Senior
Vice President, Human
Resources since 30 March 2005.
Kesko shares and stock options held on 1 January 2008: 15,000
A stock options, 5,000 E stock
options and 21,000 F stock options.
On 31 December 2008: 5,000
B shares, 15,000 A stock options,
15,000 B stock options and 21,000
F stock options.
Retirement age and benefits:
60 years. Full pension is 66% of
the pensionable salary.
Notice period and severance pay:
6 months. A severance pay paid in
addition to the salaries for the
period of notice corresponds
to 12 months' salary.
Corporate Management Board member since: 1 January 2001.
Arja Talmab. 1962, M.Sc. (Econ.), eMBA.
Senior Vice President, CFO.
Domicile: Helsinki, Finland.
Other major duties: Sponda Plc:
member of the Board of Directors
and Chair of the Audit Committee,
VR-Group Ltd: member of the Board
of Directors and Chair of the Audit
Committee, Luottokunta: member of
the Board of Directors.
Employment history: KPMG Wideri
Oy Ab: APA 1992–2001, partner 2000–
2001, Oy Radiolinja Ab: Executive
Vice President, Finance and Admin-
istration 2001–2003. Employed by
Kesko Corporation since 2004: Vice
President, Corporate Controller
2004–2005. Senior Vice President,
CFO since 17 March 2005.
Kesko shares and stock options held on 1 January 2008: 25,000
A stock options.
On 31 December 2008: 1,000
B shares, 25,000 A stock options
and 25,000 B stock options.
Retirement age and benefits:
General retirement age and pen-
sionable salary based on the
Employees' Pensions Act (TyEL).
Notice period and severance pay:
6 months. A severance pay paid in
addition to the salaries for the
period of notice corresponds to
6 months' salary.
Corporate Management Board member since: 17 March 2005.
Paavo Moilanenb. 1951, Business College Graduate.
Senior Vice President, Corporate
Communications and Responsibility.
Domicile: Espoo, Finland.
Other major duties: Kaleva Mutual
Insurance Company: Supervisory
Board member.
Employment history: Employed by
Kesko Corporation since 1974:
Kajaani District Director 1986–1989,
Jyväskylä District Director 1989–1991,
Seinäjoki District Director 1991–1995,
Director of the Neighbourhood Store
Chain Unit 1995–1996, Director of
the Speciality Goods Division 1996–
1997, Vice President, Builders' and
Agricultural Supplies Division 1998–
2000, Managing Director of the
K-Retailers' Association 2000–2005.
Kesko Group's Senior Vice President,
Corporate Communications and
Responsibility since 13 October 2005.
Kesko shares and stock options held on 1 January 2008: 500
A shares, 15,000 A stock options and
1,000 E stock options.
On 31 December 2008: 500
A shares, 1,312 B shares, 15,000
A stock options and 15,000 B stock
options.
Retirement age and benefits:
Retirement age 60 years. Full
pension is 66% of the pensionable
salary.
Notice period and severance pay:
6 months. A severance pay paid in
addition to the salaries for the
period of notice corresponds to
12 months' salary.
Corporate Management Board member since: 13 October 2005.

70 Kesko financial statements 2008
Report by the Board of Directors
71 Report by the Board of Directors
79 Proposal for profit distribution
Financial Statements
82 Consolidated financial statements (IFRS)
82 Consolidated income statement
83 Consolidated balance sheet
84 Consolidated cash flow statement
85 Consolidated statement of changes in equity
86 Notes to the consolidated financial statements
86 Note 1, Accounting policies for the consolidated
financial statements
94 Note 2, Segment information
97 Note 3, Acquisitions
97 Note 4, Discontinued operations and
disposal of other assets
98 Note 5, Other operating income
98 Note 6, Other operating expenses
98 Note 7, Non-recurring items
99 Note 8, Staff cost, number of employees and
management's salaries
99 Note 9, Financial income and expenses
100 Note 10, Income taxes
100 Note 11, Earnings per share
101 Note 12, Intangible assets
103 Note 13, Tangible assets
104 Note 14, Interests in associates
105 Note 15, Long-term available-for-sale
financial assets
105 Note 16, Long-term receivables
106 Note 17, Finance lease receivables
106 Note 18, Deferred taxes
108 Note 19, Pension assets
109 Note 20, Inventories
109 Note 21, Trade receivables and other short-term
non-interest-bearing receivables
110 Note 22, Short-term interest-bearing receivables
110 Note 23, Financial assets at fair value through
profit or loss
110 Note 24, Available-for-sale financial assets
110 Note 25, Cash and cash equivalents
110 Note 26, Assets classified as held-for-sale and
related liabilities
111 Note 27, Notes relating to equity
Report by the Board of Directors and Financial Statements
112 Note 28, Maturities of interest-bearing liabilities
113 Note 29, Carrying amounts of financial assets and
liabilities by measurement group
115 Note 30, Finance lease liabilities
115 Note 31, Provisions
116 Note 32, Trade payables and other current
non-interest-bearing liabilities
116 Note 33, Major subsidiaries owned directly by
parent
116 Note 34, Jointly controlled assets
117 Note 35, Contingent liabilities
117 Note 36, Operating leases
117 Note 37, Share-based payments
120 Note 38, Non-cash flow investments
120 Note 39, Adjustments to cash flows from operating
activities
121 Note 40, Subsidiary disposals
121 Note 41, Associate disposals
121 Note 42, Proceeds from available-for-sale
financial assets
121 Note 43, Cash and cash equivalents and current
available-for-sale financial assets
122 Note 44, Financial risk management
127 Note 45, Risk management
129 Note 46, Related party transactions
130 Note 47, Other notes
131 Note 48, Financial statement indicators
134 Note 49, Analysis of shareholding
135 Note 50, Subsidiaries and associates
137 Parent's financial statements (FAS)
137 Parent's income statement
138 Parent's balance sheet
139 Parent's cash flow statement
140 Notes to the parent's financial statements
145 Signatures
145 Auditors' report

71Kesko financial statements 2008
Report by the Board of DirectorsJanuary-December 2008
Continuing operations
Net sales and profit
The Group’s net sales in January-December 2008 were €9,600
million, which is 3.4% up on the corresponding period of the
previous year (€9,287 million). The net sales increased by 4.4%
in Finland and decreased by 0.2% abroad. Exports and foreign
operations accounted for 21.4% (22.2%) of net sales. The trend
in the Group's net sales was significantly affected by the weak-
ening construction market especially in the Nordic and Baltic
countries towards the end of 2008. Grocery sales grew steadily
throughout 2008.
Continuing operations 2008 2007 10–12/2008 10–12/2007
Net sales, € million 9,600 9,287 2,336 2,390
Operating profit, € million 285.6 321.5 6.9 68.3
Operating profit, excl.
non-recurring items, € million 217.0 315.0 27.3 71.9
Group's profit before tax,
€ million 288.5 357.8 7.7 66.1
Earnings/share, €
(continuing operations) 1.81 2.52 -0.05 0.39
Earnings per share, €
(whole Group) 2.24 2.90 -0.04 0.41
Investments, € million 338 228 105 69
Whole group 2008 2007
Equity ratio, % 52.4 48.5
Return on equity, % 12.1 16.4
Return on investment, % 14.2 17.4
Equity/share, € 20.09 19.53
Dividend/share, € ) 1.00* 1.60
* Board of Directors' proposal to the Annual General Meeting
In January-December, the K-Group’s (i.e. Kesko’s and the chain
stores’) retail sales (incl. VAT) were €11,916 million, an increase
of 3.4% on the previous year.
The Group’s profit before taxes for January-December was
€288.5 million (€357.8 million). The operating profit was €285.6
million (€321.5 million). Non-recurring items excluded, the
operating profit was €217.0 million (€315.0 million), accounting
for 2.3% (3.4%) of net sales. The most significant amounts
included in non-recurring income are the €103.2 million gain on
property lease and sale arrangements between Kesko and Nord-
isk Renting Oy, the €16.3 million gain on a property transaction
between Kesko and Aberdeen Property Fund Finland 1 Ky, and
the €10.3 million gain on the sale of K-Rahoitus Oy shares. Non-
recurring expenses include a €45.6 million impairment charge
on the consolidated goodwill and trademark of Byggmakker
Norge, a Rautakesko subsidiary, based on a weakened outlook
for the business. The non-recurring expenses also include a
€15.5 million impairment charge on Anttila's logistics centre in
Vantaa to be replaced by the new logistics centre in Kerava in
2011. The financial items of the comparative period included a
€37.1 million non-recurring gain on the sale of SATO Corporation
shares.
The smaller year-on-year operating profit excluding non-
recurring items was mainly due to a decreased demand in the
construction market in the Nordic and Baltic countries, and the
expansion and renovation of the networks of building and
home improvement stores and food stores. Owing to the dra-
matic deterioration of the economic situation, the measurement
principles of inventories and trade receivables have been tight-
ened further. There is a €25 million year-on-year increase in the
impairment charges on inventories and trade receivables recog-
nised in 2008.
The Group's earnings per share from continuing operations
were €1.81 (€2.52). Equity per share was €20.09 (€19.53).
Investments
In January-December 2008, the Group's investments totalled
€338.4 million (€227.7 million), which is 3.5% (2.5%) of net
sales. Investments in store sites were 279.0 million (€188.2 mil-
lion) and other investments €59.5 million (€39.5 million).
Investments in foreign operations represented 29.0% of total
investments.
Finance
In January-December, the cash flow from operating activities
was €134.0 million (€248.4 million) and the cash flow from
investing activities was €-45.8 million (€-84.7 million). The
cash flow from investing activities included €281.4 million
(€146.1 million) of proceeds received from the disposal of fixed
assets.
At the end of the period, liquid assets totalled €443 million
(€351 million). The amount was increased by the about €44 mil-
lion real estate transaction between Kesko and Aberdeen Prop-
erty Fund Finland 1 Ky, and the property and lease arrangement
between Kesko and Nordisk Renting Oy, which contributed €82
million to the cash flow. In addition, the amount of liquid
assets was increased by the debt-free selling price of about €77
million received from the disposal of Kauko-Telko, and by the
disposal of K-Rahoitus Oy, which contributed about €240 million
to liquid assets in finance receivables paid to Kesko. At the end
of the reporting period, the interest-bearing net debt was €47
million (€275 million). Equity ratio was 52.4% (48.5%) and gear-
ing 2.3% (14.0%) at the end of the period.
In January-December, the Group's net financial income was
€1.0 million (€36.1 million). Net financial income was increased
by an increase in the amount of liquid assets and in the interest
rate level. Towards the end of the year, net financial income was
decreased by an increase in the currency interest rate spreads.
The income for the comparative period included a €37.1 million
gain on the sale of SATO Corporation shares.
Taxes
In January-December, the Group's taxes were €89.4 million
(€87.1 million). The effective tax rate was 30.9% (24.4%),
increased by the non-deductible impairment charge on Bygg-
makker Norge's consolidated goodwill recognised for the
reporting period.

72 Kesko financial statements 2008
In January-December, prices increased at an average monthly
rate of about 7.6% compared with the previous year (Statistics
Finland).
In January-December, Kesko Food's operating profit excluding
non-recurring items was €135.2 million (3.3% of net sales), i.e.
€16.2 million, or 0.6 percentage points, lower than in the previ-
ous year. The operating profit excluding non-recurring items
was negatively impacted by the expansions and renovations
carried out in the store site network, and the weaker year-on-
year sales growth in the home and speciality goods trade. The
operating profit was €245.0 million (€151.3 million). The operat-
ing profit was increased by a €103.2 million non-recurring gain
on the property and lease arrangement between Kesko and Nor-
disk Renting, and by a €10.7 million non-recurring gain on the
property transaction between Kesko and Aberdeen Property
Fund Finland 1 Ky.
In January-December, Kesko Food's investments totalled
€185.9 million (€117.6 million), of which investments in store
sites were €161.7 million (€104.8 million).
Rautakesko
In January-December, Rautakesko's net sales amounted to
€2,518 million (€2,537 million), a decrease of 0.8%. Sales growth
declined dramatically especially in sales to professional cus-
tomers. The contribution of business acquisitions and disposals
excluded, the change in net sales was -1.4%. Net sales in
Finland were €882 million (€909 million), a decrease of 3.0%.
Foreign operations' contribution to net sales was €1,636 million
(€1,628 million), up 0.5%. Foreign operations accounted for
65.0% (64.0%) of Rautakesko’s net sales.
In January-December, the retail sales (incl. VAT) of the K-rauta
and Rautia chains in Finland increased by 2.1% and were €1,225
million. The sales of Rautakesko B-to-B Service decreased by
11.7%.
During 2008, two new and six replacement stores were
opened in Finland. 12 new and one replacement store were
opened abroad.
In Sweden, the net sales increased by 1.0% to €186 million in
January-December. In Norway, the net sales decreased by 7.7%
and were €570 million. In Estonia, the net sales were down by
11.6% to €81 million. In Latvia, the net sales decreased by 15.8%
and were €71 million. In Lithuania, Senukai's net sales decreased
by 0.9% to €449 million. In Russia, Stroymaster's net sales grew
by 34.9% to €203 million. The net sales of the Belarusian OMA
were €71 million.
In January-December, Rautakesko's operating profit excluding
non-recurring items was €53.3 million (2.1% of net sales), i.e.
€62.6 million, or 2.5 percentage points, lower than in the previ-
ous year. In addition to the decreasing demand in the construc-
tion market, the profitability was impacted by the expansion of
the store site network, and the tightening of the measurement
principles of trade receivables and inventories. There is an
approximately €14 million year-on-year increase in the impair-
ment charges on inventories and trade receivables recognised in
2008. Rautakesko’s operating profit for January-December was
€16.3 million (€117.8 million). The operating profit includes a
€45.6 million non-recurring impairment charge on Byggmakker
Norge's intangible assets. In addition, the operating profit
includes a €5.4 million non-recurring gain on the property
Personnel
In January-December, the average number of personnel in the
Kesko Group was 21,327 (20,520) converted into full-time
employees. In Finland, the average decrease was 95 employees,
while outside Finland, the increase was 902. The number of
personnel was significantly increased by the Belarusian subsidi-
ary OMA, acquired in July 2007.
At the end of December 2008, the total number of personnel
was 24,668 (25,228), of whom 13,651 (13,762) worked in Finland
and 11,017 (11,466) outside Finland. Compared with the end of
2007, there was a decrease of 111 employees in Finland and 449
outside Finland. As a result of the decline in consumer demand,
several measures aimed at staff cost adjustment were initiated
during 2008 in different operations of the Group.
Market review
According to the data from Statistics Finland, in January-
November 2008, the Finnish retail trade sales increased by 7.6%
compared with the previous year. In January-November, the
wholesale trade sales were up by 9.1%. Towards the end of
2008, however, both retail and wholesale trade sales slowed
down significantly, and in November 2008, the retail trade
dropped by 0.5% and the wholesale trade by 11.4%. The aver-
age inflation rate for 2008, calculated by Statistics Finland, was
4.1%.
According to Statistics Finland’s consumer survey of January
2009, consumers' confidence in the economy was weak. Con-
sumers considered their own financial situation and saving
possibilities to be good, although the possibility of becoming
unemployed was considered to be more likely than before.
Their views of Finland's economy and the economic develop-
ment continued to be gloomy.
The economic development and consumer demand in Kesko's
operating area are subject to significant uncertainties resulting
from aggravated problems in the international financial market
and weakened general economic development. Therefore the
report by the Board of Directors does not make separate for-
ward-looking statements concerning the divisions.
Seasonal nature of operations
The Group’s operating activities are affected by seasonal fluc-
tuations. The net sales and operating profits of its business
segments are not earned evenly throughout the year. Instead
they vary by quarter depending on the characteristics of each
business segment.
Divisions' performances in January-December
Kesko Food
In January-December, Kesko Food's net sales were €4,110 mil-
lion (€3,871 million), up 6.2%. The retail sales of K-food stores
(incl. VAT) increased by 6.0%, totalling €5,351 million. Especially
the K-food stores' own Pirkka products saw good sales growth
of 14.6%. During 2008, 37 new K-food stores were opened. The
number of K-citymarkets opened was eight, two of which were
expansions from K-supermarkets into K-citymarkets. The
number of new K-supermarket food stores opened was 13.
The growth rate of the total grocery trade market in Finland
for 2008 is estimated at about 9% up on the previous year.
73Kesko financial statements 2008
transaction between Kesko and Aberdeen Property Fund Finland
1 Ky.
In January-December, Rautakesko's investments were €121.1
million (€77.0 million). Investments abroad accounted for 80.1%
(59.3%) of total investments.
VV-Auto
In January-December, VV-Auto's net sales were €884 million
(€805 million), up 9.9%. The aggregate number of registrations
of passenger cars and vans imported by VV-Auto increased by
23.6% in Finland. This development is attributable to the car
tax change enacted at the beginning of 2008, and the good
competitiveness of Volkswagen and Audi. In 2008, the com-
bined market share of passenger cars and vans imported by
VV-Auto was 17.1% (15.1%). The restrained trend in net sales
was attributable to the average car prices, fallen as a result
of the car tax change, by a slowdown in the Baltic car sales,
and a decrease in van sales.
In January-December, the number of first registrations of new
passenger cars totalled 139,647 in Finland, up 11.2% on the pre-
vious year. Compared with the year before, first registrations of
vans were down by 8.1% to 15,522.
In January-December, first registrations of passenger cars
imported by VV-Auto increased by 30.6%. First registrations of
Volkswagen passenger cars in January-December were 16,493
and the market share was 11.8% (10.2%). In January-December,
first registrations of Audis were 5,836 and the market share was
4.2% (3.3%). The registrations of new Seat passenger cars
totalled 1,832 in Finland and the market share was 1.3% (1.2%).
The number of Volkswagen vans registered was 2,463 and their
market share was 15.9% (18.0%).
In January-December, the operating profit was €36.3 million
(4.1% of net sales), which was up €10.3 million, or 0.9 percent-
age points, compared with the corresponding period of the pre-
vious year. The profitability was improved by the good sales
performance of the brands represented by VV-Auto.
Investments totalled €6.9 million (€6.3 million) in January-
December.
Anttila
In January-December, Anttila's net sales were €560 million
(€564 million), down 0.7%. As the economic outlook worsened,
consumers became more cautious, which had an impact on the
demand for home decoration products and consumer electron-
ics in particular.
In January-December, the retail sales (incl. VAT) of the Anttila
department stores were €393 million, down 1.3%. The retail
sales of the Kodin Ykkönen department stores for home goods
and interior decoration were €181 million, down 1.9%. The dis-
tance retail sales of Net Anttila in Finland were €93 million, up
4.9%. In Estonia, NetAnttila's sales were €9 million, showing a
growth of 1.4%. In Latvia, NetAnttila's sales were €8 million,
representing a decrease of 17.6%.
In January-December, Anttila's operating profit excluding
non-recurring items was €19.8 million (3.5% of net sales), i.e.
€5.4 million, or 0.9 percentage points, lower than in the corre-
sponding period of the previous year. Anttila’s operating profit
was €4.3 million (€27.2 million). The non-recurring items include
an impairment charge of €15.5 million on the logistics centre
property in Vantaa. Anttila is having a new logistics centre built
in Kerava to be completed in 2011.
Anttila's investments totalled €5.8 million (€5.8 million), the
most significant of which were made in the new department
stores in Pori and Rovaniemi.
Kesko Agro
In January-December, Kesko Agro's net sales were €846 million
(€793 million), an increase of 6.6%. The net sales from foreign
operations were €318 million (€295 million), accounting for
37.6% of total net sales.
In January-December, Kesko Agro's net sales in Finland were
€527 million, up 5.7%, which was significantly affected by the
increase in the price levels of agricultural inputs and fuels. The
net sales from foreign operations increased by 8.0%, which is
attributable to an increase in the grain and agricultural inputs
trade. The Baltic construction machinery trade clearly declined
over the previous year.
The sales of the K-maatalous chain in Finland increased by
6.0% to €714 million (incl. VAT) in January-December.
In January-December, Kesko Agro's operating loss excluding
non-recurring items was €3.5 million (-0.4% of net sales), i.e.
€15.9 million lower than in the corresponding period of the pre-
vious year. The profit performance was significantly affected by
the weakening of the Baltic agricultural and machinery markets
towards the end of 2008, as a result of which the impairment
charges on Kesko Agro's inventories and trade receivables
increased by about €7 million over the previous year.
In January-December, investments were €2.4 million
(€7.6 million).
Other operating activities
Other operating activities comprise the reporting for Konekesko,
Intersport Finland, Indoor, Musta Pörssi and Kenkäkesko.
In January-December, the aggregate net sales of other oper-
ating activities were €699 million (€743 million), a decrease of
6.0%. The net sales from foreign operations totalled €56 mil-
lion, accounting for 8.0% of total net sales.
In January-December, the aggregate operating loss of other
operating activities excluding non-recurring items was €0.1 mil-
lion (0.0% of net sales), i.e. €14.0 million down on the corre-
sponding period of the previous year. The decline in profitability
was attributable to the weaker profit performance of the recrea-
tional machinery trade, the furniture trade and home technol-
ogy compared with the previous year. In January-December, the
operating profit was €0.8 million (€10.0 million).
In January-December, investments were €15.7 million
(€7.4 million).
In January-December, Konekesko's net sales were €214 million
(€229 million), down 6.5% on the previous year. Sales and prof-
itability weakened especially in the recreational machinery
trade.
In January-December, Intersport Finland's net sales were €158
million (€147 million), an increase of 7.5%. In March, Budget
Sport stores were opened in Espoo and Raisio.
Indoor's net sales in January-December were €177 million
(€197 million), down 9.7%. Sales and profitability were weakened
by consumers' cautiousness and the decline in the housing
74 Kesko financial statements 2008
trade. Indoor's operating activities in Sweden were discontinued
in March 2008.
Musta Pörssi Ltd's net sales in January-December were €123
million (€148 million), down 16.8%. The sales trend was affected
by changes in the store site network, coupled with a lower year-
on-year demand for consumer electronics since households had
gone digital in the comparative year. The Konebox.fi online store
was opened at the end of 2008.
In January-December, Kenkäkesko Ltd's net sales were €26
million (€23 million), up 12.6%.
Discontinued operations
In January-December, the Group's profit from discontinued
operations was €41.5 million (€36.6 million). Discontinued
operations comprise the reporting for Kauko-Telko Ltd and the
€31 million gain on its disposal, and TähtiOptikko Group Oy,
with the about €8.5 million gain on its disposal. In the com-
parative year, discontinued operations included a €28.2 million
gain on the disposal of food store properties leased to Rimi
Baltic AB.
October-December 2008
Continuing operations
Net sales and profit
The Group’s net sales in October-December 2008 were €2,336
million, which is 2.3% down on the corresponding period of
the previous year (€2,390 million). The Group's net sales
increased by 1.8% in Finland and decreased by 16.0% abroad.
Exports and foreign operations accounted for 19.4% (22.6%) of
net sales.
In October-December, the K-Group’s (i.e. Kesko’s and the
chain stores’) retail sales (incl. VAT) were €3,016 million, a
decrease of 2.0% on the corresponding period of the previous
year.
The Group’s profit before tax for October-December was €7.7
million (€66.1 million). The operating profit was €6.9 million
(€68.3 million). The operating profit included a net total of
€-20.4 million (€-3.7 million) of non-recurring gains and losses
on the disposal of fixed assets, and impairment charges. The
non-recurring expenses include a €15.5 million impairment
charge on Anttila's logistics centre in Vantaa to be replaced by
the new logistics centre in Kerava in 2011.
The operating profit excluding non-recurring items was €27.3
million (€71.9 million). It represented 1.2% of net sales (3.0%).
The smaller year-on-year operating profit excluding non-recur-
ring items was mainly due to a decreased demand in the Nordic
and Baltic construction markets. Owing to the dramatic deterio-
ration of the economic situation, the measurement principles of
inventories and trade receivables have been tightened further.
There is an approximately €17 million year-on-year increase in
the impairment charges on inventories and trade receivables
recognised in October-December.
The smaller year-on-year operating profit excluding non-
recurring items was due to a decreased demand in the con-
struction market and the home and speciality goods trade,
and the expansion and renovation of the store site network.
The Group's earnings per share from continuing operations
were €-0.05 (€0.39). Equity per share was €20.09 (€19.53).
Investments
The Group’s investments in October-December totalled €105.2
million (€68.8 million), which is 4.5% (2.9%) of net sales.
Investments in store sites were €84.1 million (€61.9 million).
The Group’s other investments were €21.1 million (€6.9 million).
Investments in foreign operations represented 37.8% of total
investments.
Finance
In October-December, the cash flow from operating activities
was €15.7 million (€70.2 million) and the cash flow from invest-
ing activities was €-95.7 million (€-71.0 million). The cash flow
from investing activities included €3.7 million (€5.1 million) of
proceeds received from the disposal of fixed assets.
At the end of the period, liquid assets totalled €443 million
(€351 million). The assets have been invested in a diversified
manner, within counterparty specific limits, across the debt
instruments of enterprises (€203 million) and banks (€141 mil-
lion), in funds (€9 million), Finnish Government bonds (€32 mil-
lion) and bank deposits (€58 million).
In October-December, the Group’s net financial income was
€0.8 million (€-2.1 million).
Taxes
In October-December, the Group’s taxes were €5.5 million
(€20.6 million). The effective tax rate was 71.2% (31.1%),
increased by foreign companies' loss-making performances
in the reporting period.
Personnel
In October-December, the average number of personnel in the
Kesko Group was 20,921 (21,376) converted into full-time
employees. There was a decrease of 455 employees compared
with the corresponding period of the previous year. In Finland,
the average decrease was 397 employees, while outside Finland,
it was 58 employees.
Divisions' performances in October-December
Kesko Food
In October-December, Kesko Food's net sales totalled €1,122 mil-
lion (€1,046 million), up 7.3%. The retail sales of K-food stores
in October-December totalled €1,456 million (incl. VAT), repre-
senting a growth of 6.5%, and their grocery sales increased by
7.8%. At the end of December, there were a total of 1,055
K-food stores (mobile stores excluded).
In October-December, Kesko Food’s operating profit excluding
non-recurring items was €43.3 million (3.9% of net sales), i.e.
€3.5 million, or 0.1 percentage points, higher than in the previ-
ous year. Kesko Food's operating profit was €39.0 million (€40.0
million).
In October-December, Kesko Food's investments totalled €48.5
million (€37.8 million), of which investments in store sites were
€38.5 million (€36.7 million).
Kesko Food continued the intensive development of the
K-food store network. In October-December, a K-citymarket was
75Kesko financial statements 2008
opened in Tornio, in Mikkola, Pori, in Ylivieska, Jämsä and in
Klaukkala, Nurmijärvi. K-supermarkets were expanded into
K-citymarkets in Rusko, Oulu and in Kemi. New K-supermarkets
were opened in Konala, Helsinki, in Liminka, Suomussalmi and
Rovaniemi. Other renovations and expansions were also
implemented.
The most important store sites being built are the K-citymar-
kets in Turku, Ylöjärvi, Kirkkonummi, in Linnainmaa, Tampere,
in Koivukylä, Vantaa, the expansion of K-citymarket Mikkeli,
and the new K-supermarkets being built in Kempele, Porvoo,
Järvenpää and Eurajoki.
Rautakesko
Compared with the previous year, the market situation in the
Nordic and Baltic building and home improvement trade weak-
ened clearly during the last quarter. In October-December, Rau-
takesko’s net sales amounted to €518 million (€622 million), a
decrease of 16.7%. Net sales in Finland were €166 million (€195
million), a decrease of 15.1%. Foreign operations contributed
€352 million (€427 million) to the net sales, a decrease of 17.5%.
In addition to the decline in demand, the sales development of
foreign operations was affected by the weakening of the Swed-
ish krona, the Norwegian krone and the Russian rouble. Foreign
operations accounted for 68.0% of Rautakesko’s net sales.
In Sweden, the net sales of K-rauta AB decreased by 13.1% to
€37 million in October-December. In local currency terms,
K-rauta AB's net sales dropped by 2.3%. In Norway, Bygg-
makker's net sales decreased by 30.9% and were €107 million.
In local currency terms, Byggmakker's net sales dropped by
18.9%. In Estonia, Rautakesko's net sales were down by 19.4%
to €18 million. In Latvia, Rautakesko's net sales decreased by
29.0% and were €15 million. In Lithuania, Senukai's net sales
decreased by 16.5% to €104 million. In Russia, Stroymaster's net
sales grew by 28.1% to €54 million. The net sales of the Belaru-
sian OMA were €19 million.
In October-December, Rautakesko’s operating loss excluding
non-recurring items was €6.2 million (-1.2% of net sales), i.e.
€28.2 million lower than in the corresponding period of the pre-
vious year. The profit performance was affected by a decreasing
demand in the Nordic and Baltic construction markets, and by
the expansion of the store site network. In addition, the profit-
ability was affected by the tightening of the measurement prin-
ciples of trade receivables and inventories. There is an approxi-
mately €9 million year-on-year increase in the impairment
charges on inventories and trade receivables recognised in Octo-
ber-December. Rautakesko’s operating loss for October-Decem-
ber was €5.3 million (operating profit €22.1 million).
In October-December, Rautakesko’s investments totalled €44.7
million (€21.2 million). Investments abroad accounted for 88.0%
(75.5%) of total investments.
In October-December, the retail sales (incl. VAT) of the K-rauta
and Rautia chains in Finland decreased by 4.2% to €266 million.
The sales of Rautakesko B-to-B Service decreased by 24.5%. At
the end of December, the K-rauta and Rautia chains in Finland
comprised 42 and 102 stores respectively.
In Sweden, there are 19 K-rauta stores, one of which is owned
by the retailer. In Estonia, there are eight K-rauta stores. In Nor-
way, the Byggmakker chain comprises 120 stores, 18 of which are
owned by Byggmakker.
Three new stores were opened in October-December. In St.
Petersburg, Russia, the ninth K-rauta store was opened at the
end of November. Five of the K-rauta stores in St. Petersburg
operate in conformity with the new K-rauta concept. In Latvia,
Rautakesko opened a new K-rauta store in Rezekne in October.
There are eight K-rauta stores and two K-rauta partner stores in
Latvia. In Lithuania, Senukai opened a new store in Klaipeda in
October. Senukai has 15 stores of its own and 76 partnershop
stores.
VV-Auto
In October-December, VV-Auto's net sales totalled €161 million
(€144 million), up 12.2%. The net sales of the comparative
period were decreased by the car tax change published in
November 2007, which postponed a significant part of sales to
2008. During the last quarter, the aggregate market share of
passenger cars and vans imported by VV-Auto was 18.3%
(15.6%).
In October-December, the operating profit excluding non-
recurring items was €1.9 million (1.2% of net sales), i.e. €2.5
million, or 1.6 percentage points, higher than in the corre-
sponding period of the previous year.
Investments totalled €1.9 million (€1.3 million) in October-
December.
Anttila
In October-December, Anttila's net sales totalled €184 million
(€189 million), down 3.1%.
In October-December, the retail sales (incl. VAT) of the Anttila
department stores were €137 million, down 3.6%. The retail
sales of the Kodin Ykkönen department stores for home goods
and interior decoration were €56 million, a decrease of 7.4%.
Distance retail sales in Finland were €28 million, up 3.5%. Espe-
cially in interior decoration and home technology, the sales
trend was heavily impacted by an increase in the overall eco-
nomic uncertainty and the slowdown in the housing trade.
In October-December, Anttila’s operating profit excluding
non-recurring items was €20.0 million (10.9% of net sales), i.e.
€1.6 million, or 0.5 percentage points, lower than for the cor-
responding period of the previous year. Anttila’s operating profit
was €4.6 million (€21.6 million). The non-recurring items
include a €15.5 million impairment charge on the logistics cen-
tre property in Vantaa. Anttila is having a new logistics centre
built in Kerava, which will be completed in 2011.
Anttila's investments were €2.3 million (€1.5 million).
At the end of December, there were 28 Anttila department
stores and two specialist stores, eight Kodin Ykkönen depart-
ment stores, and one Kodin1.com online department store for
home goods and interior decoration. NetAnttila engages in dis-
tance sales and operates in Finland, Estonia and Latvia.
In October, a new department store was opened in Pori in
replacement of the old department store. In November, a new
department store was opened in Rovaniemi and a specialist
Anttila Store in Nummela, Vihti.
In 2009, a new department store will be opened in the
Skanssi shopping centre in Turku, and a new Kodin Ykkönen
store in Lielahti, Tampere.

76 Kesko financial statements 2008
Kesko Agro
In October-December, Kesko Agro's net sales were €202 million
(€213 million), a decrease of 5.2%. Kesko Agro's net sales in Fin-
land were €118 million, down 9.6% in October-December. The
net sales from the Baltic agricultural and machinery trade were
€84 million (€83 million), an increase of 1.8% in October-
December.
In October-December, Kesko Agro's operating loss excluding
non-recurring items was €15.8 million (-7.8% of net sales), i.e.
€17.9 million lower than in the corresponding period of the pre-
vious year. The profit performance was significantly affected by
the weakening of the Baltic construction and agricultural mar-
kets towards the end of 2008, as a result of which a total of €9
million higher impairment charges and provisions on trade
receivables and inventories was recognised for October-Decem-
ber compared with the previous year. Approximately half of the
amount relates to financial difficulties found in the activities of
a Latvian warehouse operator.
At the end of the reporting period, the K-maatalous chain
comprised 91 agricultural stores in Finland. Kesko Agro has six
stores in Estonia, four in Latvia and three in Lithuania.
Other operating activities
Other operating activities comprise the reporting for Konekesko,
Intersport Finland, Indoor, Musta Pörssi and Kenkäkesko.
In October-December, the aggregate net sales of other operat-
ing activities were €152 million (€182 million), down 16.1%.
In October-December, the aggregate operating loss of other
operating activities, non-recurring items excluded, was €7.9
million (-5.2% of net sales), i.e. €3.4 million lower than in the
corresponding period of the previous year. In October-December,
the operating loss was €9.5 million (€8.4 million).
In October-December, investments were €4.9 million (€3.7
million).
Konekesko's net sales in October-December were €32 million
(€43 million), a decrease of 26.0% compared with the previous
year. In Finland, sales were €29 million, down 19.2%.
Konekesko’s export sales totalled €2 million, a decrease of
73.5%.
Intersport Finland's net sales in October-December were €40
million (€41 million), down 1.6%.
Indoor's net sales in October-December were €42 million (€51
million), down 17.8%. In October-December, the net sales of the
furniture trade in foreign operations were €6 million, a decrease
of 50.5%. Indoor's operating activities in Sweden were discon-
tinued in March 2008.
Musta Pörssi Ltd's net sales in October-December were €35
million (€42 million), down 17.3%.
Kenkäkesko Ltd's net sales in October-December were €4 mil-
lion (€5 million), a decrease of 21.3%.
Changes in the Group compositionK-Rahoitus Oy and its subsidiaries were sold and the transac-
tion was completed on 31 January 2008. Tähti Optikko Group Oy
was sold and the transaction was completed on 31 March 2008.
Kauko-Telko Ltd was sold and the transaction was completed
on 30 April 2008.
Resolutions of the 2008 Annual General Meeting and the Board's organisational meetingKesko Corporation’s Annual General Meeting held on 31 March
2008 adopted the financial statements for 2007 and discharged
the members of the Board of Directors and the Managing Direc-
tor from liability. The Annual General Meeting also resolved to
distribute a dividend of €1.60 per share, as proposed by the
Board of Directors, or total dividends of €156,428,592. The divi-
dend payment date was 10 April 2008.
The Annual General Meeting resolved to leave the number of
Board members unchanged at seven. The members of the Board
of Directors elected by the Annual General Meeting of 27 March
2006 are Pentti Kalliala, Ilpo Kokkila, Maarit Näkyvä, Seppo
Paatelainen, Keijo Suila, Jukka Säilä and Heikki Takamäki. The
Chair of the Board is Heikki Takamäki and the Deputy Chair is
Keijo Suila. The term of office of each Board member, in accord-
ance with the Articles of Association, is three years, with the
term starting at the close of the General Meeting electing the
member and expiring at the close of the third Annual General
Meeting after the election. The terms of office of all current
Board members will expire at the close of the 2009 Annual Gen-
eral Meeting.
The Annual General Meeting elected PricewaterhouseCoopers
Oy, Authorised Public Accountants, as the auditor of the com-
pany. The firm has announced Johan Kronberg, APA, to be their
auditor with principal responsibility.
The resolutions of the Annual General Meeting were published
in more detail in a stock exchange release on 31 March 2008.
The organisational meeting of Kesko Corporation's Board of
Directors held after the Annual General Meeting on 31 March
2008 decided to leave the compositions of its committees
unchanged. The Board elected Maarit Näkyvä as the Chair of its
Audit Committee, and Seppo Paatelainen and Keijo Suila as its
members. The Board elected Heikki Takamäki as the Chair of its
Remuneration Committee, and Pentti Kalliala and Keijo Suila as
its members. The committees' terms of office expire at the close
of the Annual General Meeting. The decisions of the organisa-
tional meeting of the Board of Directors were published in a
stock exchange release on 31 March 2008.
Kesko Food Ltd and Rautakesko Ltd, major subsidiaries fully
owned by Kesko Corporation, elected the members of their
Boards of Directors at their Annual General Meetings held on 28
March 2008. The compositions of the Boards were announced in
a stock exchange release on 28 March 2008.
Shares, securities market and Board authorisationsAt the end of the reporting period, Kesko Corporation's share
capital totalled €195,649,708. Of all shares 31,737,007 or 32.4%
are A shares and 66,087,847 or 67.6% are B shares. The aggre-
gate number of shares was 97,824,854. Each A share entitles to
ten (10) votes and each B share to one (1) vote. During the
reporting period, the share capital was increased seven times as
a result of share subscriptions with the stock options of the year
2003 option scheme. The increases were made on 11 February
2008 (€210), 28 April 2008 (€38,168), 9 June 2008 (€42,200), 28
July 2008 (€8,600), 1 October 2008 (€4,000), 27 October 2008
(€6,000) and 18 December 2008 (€15,000), and announced in
stock exchange notifications on the same days. The subscribed

77Kesko financial statements 2008
shares were included on the main list of the Helsinki Stock
Exchange for public trading with the old B shares on 12 Febru-
ary 2008, 29 April 2008, 10 June 2008, 29 July 2008, 2 October
2008, 28 October 2008, and 19 December 2008.
The price of a Kesko A share was €37.85 at the end of 2007,
and €22.00 at the end of 2008, representing a decrease of
41.9%. The price of a B share was €37.72 at the end of 2007, and
€17.80 at the end of 2008, representing a decrease of 52.8%.
During the reporting period, the highest A share quotation was
€38.20 and the lowest was €21.33. For B shares, they were €38.12
and €15.31 respectively. During 2008, the NASDAQ OMX Helsinki
Stock Exchange All Share index (NASDAQ OMX Helsinki) fell by
53.4%, the weighted NASDAQ OMX Helsinki CAP index by 50.1%,
while the Consumer Staples Index dropped by 57.1% during the
same period.
At the end of the reporting period, the market capitalisation
of A shares was €698 million, while that of B shares was €1,176
million. Their combined market capitalisation was €1,875 mil-
lion, a decrease of €1,817 million from the end of 2007. During
2008, 1,427,575 A shares were traded on the Helsinki Stock
Exchange at a total value of €41.0 million, while 121.1 million
B shares were traded at a total value of €2,859 million.
The listed 2003E and 2003F stock options of the year 2003
option scheme were available for trading and a total of 179,000
options were traded at a total value of €1,570,000 during 2008.
The Board of Directors was authorised by the Annual General
Meeting of 26 March 2007 to issue a maximum of 20,000,000
new B shares against payment. The authorisation also includes
a right to deviate, for a weighty financial reason, from the
shareholders’ pre-emptive right with a rights issue so that the
issued shares can be used as consideration in possible company
acquisitions, other arrangements concerning the company’s
operations, or to finance investments. The authorisation is valid
for two years from the resolution of the Annual General Meeting.
The authorisation has not been used.
At the end of 2008, the number of shareholders was 38,080,
showing an increase of 9,155 shareholders during the year. For-
eign ownership interest decreased from 34% to 20% of the
share capital during the year.
Flagging notificationsKesko Corporation did not receive any flagging notifications
during the reporting period.
Main events during the reporting periodOn 31 January 2008, K-Rahoitus Oy's share capital was trans-
ferred to OKO Bank plc (Pohjola Bank plc from 1 March 2008). An
agreement to this effect was signed between OKO and Kesko
Corporation on 21 December 2007. The price paid was about €30
million (stock exchange releases on 21 December 2007 and 31
January 2008).
Kesko Corporation waived the purchase option included in the
lease agreements made with Nordisk Renting Oy in 2001 and
2002, for which RBS Nordisk Renting paid Kesko €74.2 million in
compensation. The previous agreements were finance leases
and the non-recurring gain resulting from the cancellation was
€26.5 million. The lease arrangement and the property sale con-
tributed a total of €103 million to Kesko Food's and the Kesko
Group's operating profits for the first quarter, which was
reported as a non-recurring item (stock exchange release on 11
February 2008).
On 31 March 2008, Kesko Corporation sold the shares of Tähti
Optikko Group Oy to the Specsavers optical chain. The debt-free
selling price was about €15 million. The disposal contributed a
non-recurring gain of €8.5 million to Kesko's profit from dis-
continued operations (release on 1 April 2008).
Kesko Corporation sold the share capital of Kauko-Telko Ltd to
Aspo plc on 30 April 2008. Based on Kauko-Telko's end-of-April
balance sheet, the debt-free selling price was about €77 million.
A non-recurring gain on the disposal of about €30 million has
been recognised in Kesko's profit from discontinued operations
(stock exchange releases on 23 May 2007, 28 February 2008 and
30 April 2008).
On 28 May 2008, Kesko announced that it would strengthen
the competitiveness of the K-maatalous and Rautia chains by
demerging Kesko Agro Ltd on 1 January 2009, so that the agricul-
tural trade activities in Finland become part of Rautakesko Ltd
and the trade of tractors and combines, as well as the agricul-
tural and machinery trade companies in the Baltic countries
became part of Konekesko Ltd. It is estimated that the arrange-
ment will result in an annual benefit of approximately €3 mil-
lion to Kesko (stock exchange release on 28 May 2008).
On 30 September 2008, the Kesko Group, the Kesko Pension
Fund and Valluga-sijoitus Oy sold 23 of their store properties in
different parts of Finland to Aberdeen Property Fund Finland 1
Ky. The selling price was about 56 million euros, of which the
Kesko Group's share was about 44 million euros. The Kesko
Group's gain on the sale was about 16 million euros, which was
treated as a non-recurring item in Kesko's third quarter operat-
ing profit (stock exchange release on 30 September 2008).
Kesko announced that Anttila Oy, K-citymarket Oy (home and
speciality goods) and the other Kesko Group home and special-
ity goods companies were intensifying their cooperation. They
seek synergy benefits especially in goods purchasing, manage-
ment and customer relationship management. At the same
time, it was announced that Kesko's reporting system would be
changed so that the primary reportable segments are the food
trade, the home and speciality goods trade, the building and
home improvement trade, and the car and machinery trade
with effect from 1 January 2009. During the first quarter of 2009,
Kesko will publish the comparative information in accordance
with its new segment reporting structure (stock exchange release
on 12 December 2008).
Events after the end of the reporting period On 1 January 2009, Kesko Agro Ltd demerged so that the agri-
cultural trade activities in Finland became part of Rautakesko
Ltd. In addition, the trade of tractors and combines, as well as
the agricultural and machinery trade companies in the Baltic
countries became part of Konekesko Ltd (stock exchange release
on 28 May 2008).
Anttila Oy, K-citymarket Oy (home and speciality goods) and
the other Kesko Group home and speciality goods companies
intensify their cooperation. As of 1 January 2009, the Kesko
Group's primary reportable segments are the food trade, the
home and speciality goods trade, the building and home
improvement trade, and the car and machinery trade (stock
exchange release on 12 December 2008).

78 Kesko financial statements 2008
Information contained in the notes to the financial statementsInformation on the Group's personnel is disclosed in note 8.
The Group's financial and share performance indicators with
calculation formulas are disclosed in note 48.
Information on share ownership structure, major shareholders
and management's shareholdings is disclosed in note 49.
Information on options, shares under options and voting
rights is disclosed in note 37.
Related party transactions are disclosed in note 46.
The Kesko Group is not engaged in significant research and
development activities.
In April 2009, Kesko will publish a separate corporate respon-
sibility report which analyses the Group's performance in eco-
nomic, social and environmental responsibility. An assurance
statement will be provided by an independent external party.
Risk managementThe Kesko Group has established a risk management process
based on the risk management policy approved by the Board of
Directors. The divisions assess the risks in connection with the
strategy cycle and prioritise them according to their criticality
and management level. Risk assessments are updated on a
quarterly basis. Also Group units have assessed the risks threat-
ening the Group objectives and the risk management. Risks
and their management has been discussed by the division par-
ent companies' and the Group's management. Separate risk
analyses have been carried out for major projects.
On the basis of the Divisions' and Group units' risk analyses,
the Corporate Risk Management Unit has prepared summaries
of major risks and their management on a quarterly basis. The
resulting risk report has been handled by Kesko Corporation's
Board of Directors' Audit Committee. The main risks and uncer-
tainties have been reported in the interim financial reports.
The effects of the recession
The international financial crisis and its impact on economic
development, consumer confidence, availability of finance and
investment readiness have greatly added to uncertainties in
Kesko's operating environment, especially in the building
materials, car and machinery, and home and speciality goods
trade in Kesko's operating countries. Consumer demand has
weakened especially in Latvia and Estonia. With regard to con-
sumer demand in Russia, the crude oil price trend is a key
factor.
The recession has caused consumers' confidence about their
own finances to fall. Consumers are increasingly price conscious
and careful about buying, especially more expensive products.
In addition, risks relating to the profitability and financing of
business customers and retailers grow as consumer demand
weakens. All of this has a negative effect on Kesko's sales devel-
opment and increases default risks.
Currency risks and counterparty risks relating to financial
instruments have increased. Among Kesko's operating countries,
only Finland belongs to the euro area. The currencies of Norway,
Sweden and Russia have weakened against the euro. The risk of
devaluation has increased in the Baltic countries. As a result of
the financial crisis, profitable low-risk investment of liquid
assets has become more difficult.
Other risks
Considerable amounts of capital and lease liabilities are tied •
up in store properties for years. Failures in ongoing store site
investments, international expansion projects or programmes
aimed at more efficient operations, or their delayed imple-
mentation can put growth and profitability at risk.
Suppliers' choices for product selections and distribution •
channels, bankruptcies or business restructurings can influ-
ence the availability of products in stores.
The trading sector is characterised by increasingly complicated •
and long supply chains and a dependency on information
systems, telecommunications and external service providers.
Disturbances in the supply chain can cause major losses in
sales and profit.
Failure in the protection of personal information and card •
payments could cause losses, claims for damages and the
degrading of reputation.
A failure in the quality assurance of the supply chain or in •
product control may result in financial losses, the loss of cus-
tomer confidence or, in the worst case, a health hazard to
customers.
Shrinkage causes significant financial losses for the retail •
trade. Shrinkage results, for example, from spoiled or dam-
aged goods, theft or other malpractice, and unsuccessful
purchasing. Recession entails a growing risk of financial
malpractice.
Implementation of strategies requires competent and moti-•
vated personnel. There is a risk that the trading sector will
not attract the most skilled people. The recession is likely to
temporarily improve the availability of labour.
Non-compliance with legislation, agreements and Kesko's •
ethical principles can result in fines, compensation for dam-
ages and other financial losses, and a loss of confidence or
reputation.
The goal of Kesko's communications is to produce and pub-•
lish reliable information at the right time. If some informa-
tion published by Kesko proves to be incorrect or a release
fails to meet regulations, this may result in investors and
other stakeholder groups losing confidence and in possible
sanctions.
More information about Kesko's business risks and uncertainties
and their management responses, as well as Kesko's risk man-
agement system and principles is given in notes 44 and 45 and
Kesko's website at www.kesko.fi.
Other risks and uncertainties relating to profit performance
are described in the Group's future outlook.
Future outlookEstimates of the future outlook for the Kesko Group's net sales
and operating profit excluding non-recurring items are given
for the 12 months following the reporting period (1/2009–
12/2009) in comparison with the 12 months preceding the
reporting period (1/2008–12/2008).
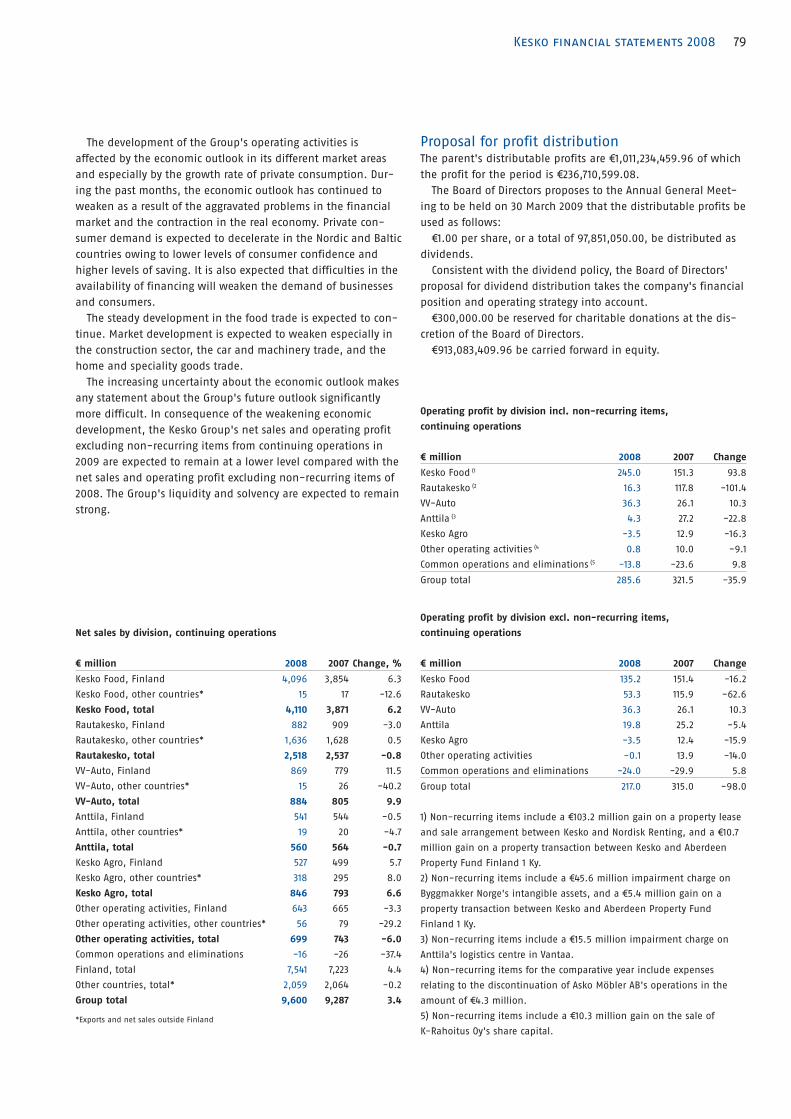
79Kesko financial statements 2008
Net sales by division, continuing operations
€ million 2008 2007 Change, %
Kesko Food, Finland 4,096 3,854 6.3
Kesko Food, other countries* 15 17 -12.6
Kesko Food, total 4,110 3,871 6.2
Rautakesko, Finland 882 909 -3.0
Rautakesko, other countries* 1,636 1,628 0.5
Rautakesko, total 2,518 2,537 -0.8
VV-Auto, Finland 869 779 11.5
VV-Auto, other countries* 15 26 -40.2
VV-Auto, total 884 805 9.9
Anttila, Finland 541 544 -0.5
Anttila, other countries* 19 20 -4.7
Anttila, total 560 564 -0.7
Kesko Agro, Finland 527 499 5.7
Kesko Agro, other countries* 318 295 8.0
Kesko Agro, total 846 793 6.6
Other operating activities, Finland 643 665 -3.3
Other operating activities, other countries* 56 79 -29.2
Other operating activities, total 699 743 -6.0
Common operations and eliminations -16 -26 -37.4
Finland, total 7,541 7,223 4.4
Other countries, total* 2,059 2,064 -0.2
Group total 9,600 9,287 3.4
*Exports and net sales outside Finland
The development of the Group's operating activities is
affected by the economic outlook in its different market areas
and especially by the growth rate of private consumption. Dur-
ing the past months, the economic outlook has continued to
weaken as a result of the aggravated problems in the financial
market and the contraction in the real economy. Private con-
sumer demand is expected to decelerate in the Nordic and Baltic
countries owing to lower levels of consumer confidence and
higher levels of saving. It is also expected that difficulties in the
availability of financing will weaken the demand of businesses
and consumers.
The steady development in the food trade is expected to con-
tinue. Market development is expected to weaken especially in
the construction sector, the car and machinery trade, and the
home and speciality goods trade.
The increasing uncertainty about the economic outlook makes
any statement about the Group's future outlook significantly
more difficult. In consequence of the weakening economic
development, the Kesko Group's net sales and operating profit
excluding non-recurring items from continuing operations in
2009 are expected to remain at a lower level compared with the
net sales and operating profit excluding non-recurring items of
2008. The Group's liquidity and solvency are expected to remain
strong.
Proposal for profit distributionThe parent's distributable profits are €1,011,234,459.96 of which
the profit for the period is €236,710,599.08.
The Board of Directors proposes to the Annual General Meet-
ing to be held on 30 March 2009 that the distributable profits be
used as follows:
€1.00 per share, or a total of 97,851,050.00, be distributed as
dividends.
Consistent with the dividend policy, the Board of Directors'
proposal for dividend distribution takes the company's financial
position and operating strategy into account.
€300,000.00 be reserved for charitable donations at the dis-
cretion of the Board of Directors.
€913,083,409.96 be carried forward in equity.
Operating profit by division incl. non-recurring items,
continuing operations
€ million 2008 2007 Change
Kesko Food (1 245.0 151.3 93.8
Rautakesko (2 16.3 117.8 -101.4
VV-Auto 36.3 26.1 10.3
Anttila (3 4.3 27.2 -22.8
Kesko Agro -3.5 12.9 -16.3
Other operating activities (4 0.8 10.0 -9.1
Common operations and eliminations (5 -13.8 -23.6 9.8
Group total 285.6 321.5 -35.9
Operating profit by division excl. non-recurring items,
continuing operations
€ million 2008 2007 Change
Kesko Food 135.2 151.4 -16.2
Rautakesko 53.3 115.9 -62.6
VV-Auto 36.3 26.1 10.3
Anttila 19.8 25.2 -5.4
Kesko Agro -3.5 12.4 -15.9
Other operating activities -0.1 13.9 -14.0
Common operations and eliminations -24.0 -29.9 5.8
Group total 217.0 315.0 -98.0
1) Non-recurring items include a €103.2 million gain on a property lease
and sale arrangement between Kesko and Nordisk Renting, and a €10.7
million gain on a property transaction between Kesko and Aberdeen
Property Fund Finland 1 Ky.
2) Non-recurring items include a €45.6 million impairment charge on
Byggmakker Norge's intangible assets, and a €5.4 million gain on a
property transaction between Kesko and Aberdeen Property Fund
Finland 1 Ky.
3) Non-recurring items include a €15.5 million impairment charge on
Anttila's logistics centre in Vantaa.
4) Non-recurring items for the comparative year include expenses
relating to the discontinuation of Asko Möbler AB's operations in the
amount of €4.3 million.
5) Non-recurring items include a €10.3 million gain on the sale of
K-Rahoitus Oy's share capital.
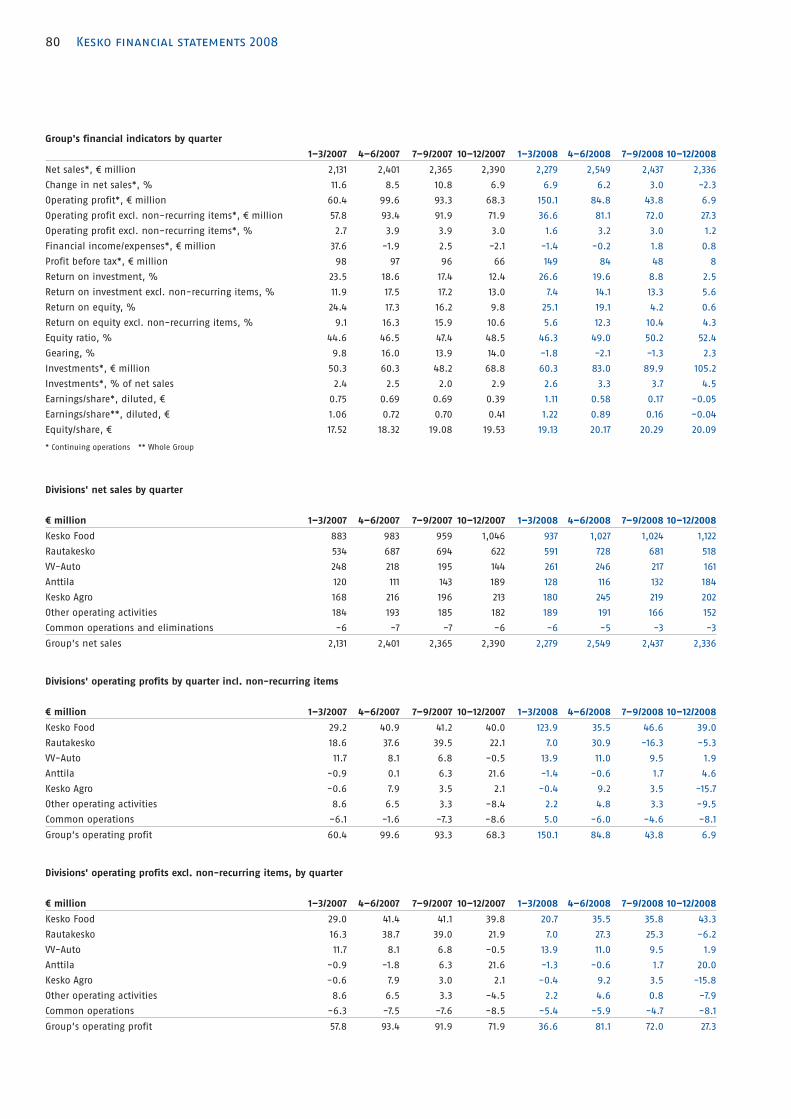
80 Kesko financial statements 2008
Group's financial indicators by quarter
1–3/2007 4–6/2007 7–9/2007 10–12/2007 1–3/2008 4–6/2008 7–9/2008 10–12/2008
Net sales*, € million 2,131 2,401 2,365 2,390 2,279 2,549 2,437 2,336
Change in net sales*, % 11.6 8.5 10.8 6.9 6.9 6.2 3.0 -2.3
Operating profit*, € million 60.4 99.6 93.3 68.3 150.1 84.8 43.8 6.9
Operating profit excl. non-recurring items*, € million 57.8 93.4 91.9 71.9 36.6 81.1 72.0 27.3
Operating profit excl. non-recurring items*, % 2.7 3.9 3.9 3.0 1.6 3.2 3.0 1.2
Financial income/expenses*, € million 37.6 -1.9 2.5 -2.1 -1.4 -0.2 1.8 0.8
Profit before tax*, € million 98 97 96 66 149 84 48 8
Return on investment, % 23.5 18.6 17.4 12.4 26.6 19.6 8.8 2.5
Return on investment excl. non-recurring items, % 11.9 17.5 17.2 13.0 7.4 14.1 13.3 5.6
Return on equity, % 24.4 17.3 16.2 9.8 25.1 19.1 4.2 0.6
Return on equity excl. non-recurring items, % 9.1 16.3 15.9 10.6 5.6 12.3 10.4 4.3
Equity ratio, % 44.6 46.5 47.4 48.5 46.3 49.0 50.2 52.4
Gearing, % 9.8 16.0 13.9 14.0 -1.8 -2.1 -1.3 2.3
Investments*, € million 50.3 60.3 48.2 68.8 60.3 83.0 89.9 105.2
Investments*, % of net sales 2.4 2.5 2.0 2.9 2.6 3.3 3.7 4.5
Earnings/share*, diluted, € 0.75 0.69 0.69 0.39 1.11 0.58 0.17 -0.05
Earnings/share**, diluted, € 1.06 0.72 0.70 0.41 1.22 0.89 0.16 -0.04
Equity/share, € 17.52 18.32 19.08 19.53 19.13 20.17 20.29 20.09
* Continuing operations ** Whole Group
Divisions' net sales by quarter
€ million 1–3/2007 4–6/2007 7–9/2007 10–12/2007 1–3/2008 4–6/2008 7–9/2008 10–12/2008
Kesko Food 883 983 959 1,046 937 1,027 1,024 1,122
Rautakesko 534 687 694 622 591 728 681 518
VV-Auto 248 218 195 144 261 246 217 161
Anttila 120 111 143 189 128 116 132 184
Kesko Agro 168 216 196 213 180 245 219 202
Other operating activities 184 193 185 182 189 191 166 152
Common operations and eliminations -6 -7 -7 -6 -6 -5 -3 -3
Group’s net sales 2,131 2,401 2,365 2,390 2,279 2,549 2,437 2,336
Divisions' operating profits by quarter incl. non-recurring items
€ million 1–3/2007 4–6/2007 7–9/2007 10–12/2007 1–3/2008 4–6/2008 7–9/2008 10–12/2008
Kesko Food 29.2 40.9 41.2 40.0 123.9 35.5 46.6 39.0
Rautakesko 18.6 37.6 39.5 22.1 7.0 30.9 -16.3 -5.3
VV-Auto 11.7 8.1 6.8 -0.5 13.9 11.0 9.5 1.9
Anttila -0.9 0.1 6.3 21.6 -1.4 -0.6 1.7 4.6
Kesko Agro -0.6 7.9 3.5 2.1 -0.4 9.2 3.5 -15.7
Other operating activities 8.6 6.5 3.3 -8.4 2.2 4.8 3.3 -9.5
Common operations -6.1 -1.6 -7.3 -8.6 5.0 -6.0 -4.6 -8.1
Group’s operating profit 60.4 99.6 93.3 68.3 150.1 84.8 43.8 6.9
Divisions' operating profits excl. non-recurring items, by quarter
€ million 1–3/2007 4–6/2007 7–9/2007 10–12/2007 1–3/2008 4–6/2008 7–9/2008 10–12/2008
Kesko Food 29.0 41.4 41.1 39.8 20.7 35.5 35.8 43.3
Rautakesko 16.3 38.7 39.0 21.9 7.0 27.3 25.3 -6.2
VV-Auto 11.7 8.1 6.8 -0.5 13.9 11.0 9.5 1.9
Anttila -0.9 -1.8 6.3 21.6 -1.3 -0.6 1.7 20.0
Kesko Agro -0.6 7.9 3.0 2.1 -0.4 9.2 3.5 -15.8
Other operating activities 8.6 6.5 3.3 -4.5 2.2 4.6 0.8 -7.9
Common operations -6.3 -7.5 -7.6 -8.5 -5.4 -5.9 -4.7 -8.1
Group’s operating profit 57.8 93.4 91.9 71.9 36.6 81.1 72.0 27.3
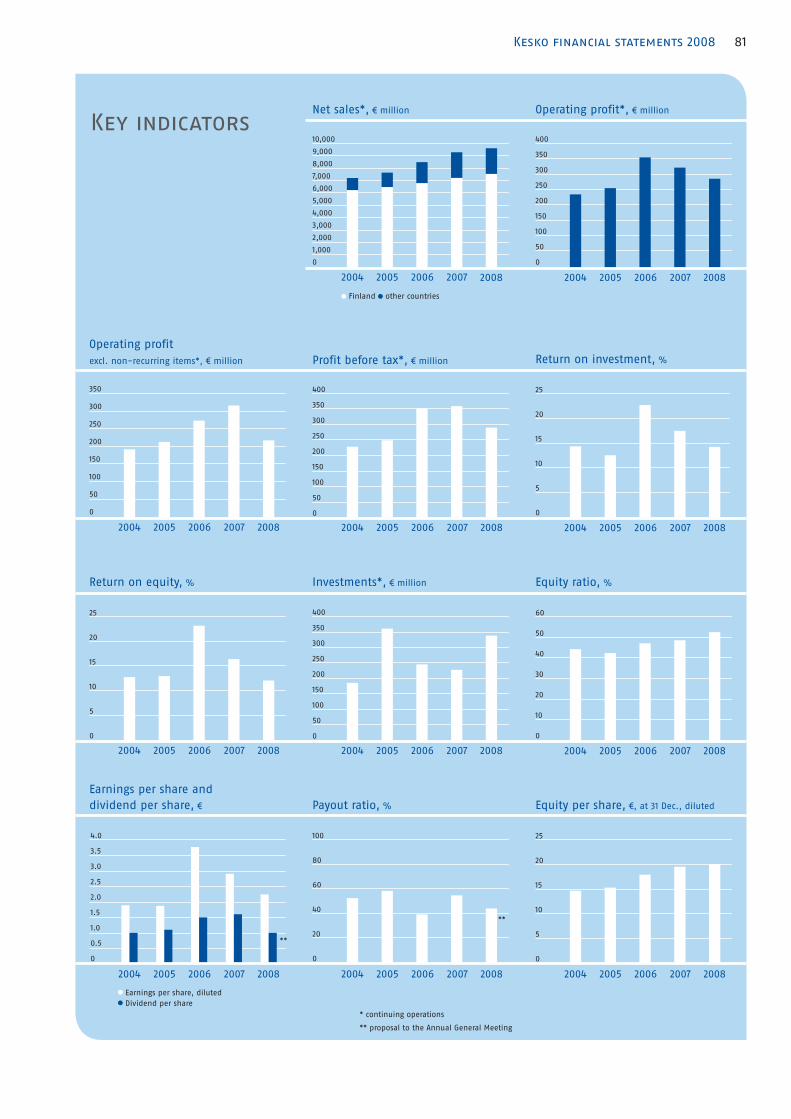
81Kesko financial statements 2008
Key indicators
Return on equity, %
2004 20082006 20072005
25
20
15
10
5
0
Investments*, € million
400
350
300
250
200
150
100
50
0
2004 20082006 20072005
Equity ratio, %
2004 20082006 20072005
60
50
40
30
20
10
0
Finland other countries
Net sales*, € million
2004 2006 2007
10,000
9,000
8,000
7,000
6,000
5,000
4,000
3,000
2,000
1,000
0
2005
Operating profit*, € million
400
350
300
250
200
150
100
50
0
2008 2004 20082006 20072005
Operating profit
excl. non-recurring items*, € million
350
300
250
200
150
100
50
0
2004 20082006 20072005
Profit before tax*, € million
2004 20082006 2007
400
350
300
250
200
150
100
50
0
2005
Return on investment, %
2004 20082006 2007
25
20
15
10
5
0
2005
* continuing operations
** proposal to the Annual General Meeting
Earnings per share, diluted
Dividend per share
Earnings per share and
dividend per share, €
4.0
3.5
3.0
2.5
2.0
1.5
1.0
0.5
0
Payout ratio, %
100
80
60
40
20
0
2004 20082006 200720052004 20082006 20072005 2004 20082006 20072005
Equity per share, €, at 31 Dec., diluted
25
20
15
10
5
0
**
**

82 Kesko financial statements 2008
Consolidated financial statementsConsolidated income statement, IFRS
€ million Note 1 Jan.–31 Dec. 2008 % 1 Jan.–31 Dec. 2007 %
Continuing operations
Net sales 2 9,600.4 100.0 9,287.2 100.0
Cost of sales -8,292.7 -86.4 -7,957.0 -85.7
Gross profit 1,307.7 13.6 1,330.1 14.3
Other operating income 5, 7 730.3 7.6 576.8 6.2
Staff cost 8, 37 -578.2 -6.0 -546.9 -5.9
Depreciation and impairment charges 12, 13 -178.1 -1.9 -116.0 -1.2
Other operating expenses 6, 7 -996.0 -10.4 -922.5 -9.9
Operating profit 285.6 3.0 321.5 3.5
Financial income 9 73.3 0.8 86.9 0.9
Financial expenses 9 -72.3 -0.8 -50.8 -0.5
Total financial income and expenses 9 1.0 0.0 36.1 0.4
Income from associates 1.9 0.0 0.2 0.0
Profit before tax 288.5 3.0 357.8 3.9
Income tax 10 -89.4 -0.9 -87.1 -0.9
Net profit from continuing operations 199.1 2.1 270.8 2.9
Net profit from discontinued operations 4 41.5 0.4 36.6 0.4
Net profit 240.6 2.5 307.4 3.3
Attributable to
Equity holders of the parent company 219.7 285.0
Minority interest 20.9 22.4
240.6 307.4
Earnings per share for profit attributable to the equity
holders of the parent company
Continuing operations
Basic, € 11 1.82 2.54
Diluted, € 11 1.81 2.52
Discontinued operations
Basic, € 11 0.43 0.38
Diluted, € 11 0.43 0.38
Kesko total
Basic, € 11 2.25 2.92
Diluted, € 11 2.24 2.90

83Kesko financial statements 2008
Consolidated balance sheet, IFRS
€ million Note 31 Dec. 2008 % 31 Dec. 2007 %
ASSETS
Non-current assets
Intangible assets 12 169.6 252.2
Tangible assets 13 1,209.5 1,153.1
Interests in associates 14, 50 31.2 27.0
Available-for-sale financial assets 15 3.0 4.0
Long-term receivables 16, 17 69.2 36.9
Deferred tax assets 18 6.5 7.7
Pension assets 19 300.3 261.6
Total non-current assets 1,789.3 46.0 1,742.5 42.6
Current assets
Inventories 20 871.0 922.3
Trade receivables and other non-interest-bearing receivables 21 770.5 823.8
Interest-bearing receivables 22 14.9 16.3
Financial assets at fair value through profit or loss 23 94.4 105.5
Available-for-sale financial assets 24 291.0 155.6
Cash and cash equivalents 25 57.8 89.7
Total current assets 2,099.6 53.9 2,113.3 51.6
Assets held for sale 4, 26 3.0 0.1 236.9 5.8
Total assets 3,891.9 100.0 4,092.7 100.0
EQUITY AND LIABILITIES
Equity attributable to parent's equity holders
Share capital 27 195.6 195.5
Share issue 27 0.1
Share premium 27 205.8 200.3
Other reserves 27 242.9 247.1
Translation differences -15.1 -3.4
Revaluation surplus 27 1.6 9.5
Retained earnings 1,334.8 1,260.0
1,965.7 50.5 1,909.0 46.6
Minority interest 60.7 1.6 55.3 1.4
Total equity 2,026.4 52.1 1,964.4 48.0
Non-current liabilities
Pension obligations 19 1.8 4.1
Interest-bearing long-term borrowings 28, 29, 30 196.9 314.2
Non-interest-bearing long-term borrowings 11.8 11.5
Deferred tax liabilities 18 132.0 125.5
Provisions 31 20.1 15.5
Total non-current liabilities 362.7 9.3 470.8 11.5
Current liabilities
Interest-bearing short-term borrowings 293.6 311.2
Trade payables 32 755.6 837.8
Other non-interest-bearing liabilities 32 181.6 191.6
Tax liabilities 32 2.9 13.4
Accrued liabilities 32 245.5 277.2
Provisions 31 23.5 23.0
Total current liabilities 1,502.9 38.6 1,654.2 40.4
Liabilities relating to assets held for sale 4, 26 0.0 3.3
Total liabilities 1,865.5 47.9 2,128.3 52.0
Total equity and liabilities 3,891.9 100.0 4,092.7 100.0

84 Kesko financial statements 2008
Consolidated cash flow statement, IFRS
€ million Note 2008 2007
Cash flow from operating activities
Profit before tax, continuing operations 288.9 357.8
Profit before tax, discontinued operations 42.3 39.7
Adjustments:
Planned depreciation 118.1 118.7
Financial income and expenses -1.1 -37.0
Other adjustments 39 -130.1 -75.2
-13.2 6.5
Change in working capital
Current non-interest-bearing receivables, increase (-)/decrease (+) -10.3 -37.3
Inventories increase (-)/decrease (+) 2.3 -123.1
Current non-interest-bearing liabilities, increase (+)/decrease (-) -78.4 95.5
-86.4 -65.0
Interest paid -30.0 -31.1
Interest received 31.6 33.2
Dividends received 0.1 0.1
Tax paid -99.0 -92.9
Net cash from operating activities 134.4 248.3
Cash flow from investing activities
Acquisition of subsidiary, net of cash acquired -35.0 -21.9
Investments in available-for-sale investments -0.3 -1.2
Investments in tangible and intangible assets -284.7 -214.0
Disposal of subsidiary, net of cash disposed of 4, 40 121.3 1.5
Disposal of associate 41 1.5 0.6
Proceeds from available-for-sale financial assets 42 0.2 46.9
Proceeds from tangible and intangible assets 158.4 97.1
Increase in long-term loan receivables -7.3 0.0
Decrease in long-term loan receivables 0.0 6.3
Net cash used in investing activities -45.8 -84.7
Cash flow from financing activities
Increase in current liabilities 0.0 15.7
Decrease in current liabilities -10.0 0.0
Decrease in non-current liabilities -37.0 -5.2
Repayments of finance lease liabilities -5.6 -14.5
Current interest-bearing receivables, increase (-) / decrease (+) 216.5 -52.1
Dividends paid -172.5 -155.6
Share capital increase 0.4 2.6
Short-term money market investments -17.3 35.2
Others 8.7 0.7
Net cash used in financing activities -16.9 -173.1
Change in cash and cash equivalents and current available-for-sale financial assets 71.4 -9.5
Cash and cash equivalents and available-for-sale financial assets at 1 January 245.3 256.9
Translation difference and value adjustments -0.7 -0.4
Cash and cash equivalents relating to available-for-sale assets -1.8 1.8
Cash and cash equivalents and current available-for-sale financial assets at 31 December 43 319.3 245.3

85Kesko financial statements 2008
Consolidated statement of changes in equity
Attributable to equity holders of the parent company
€ million
Share
capital
Issue
of share
capital
Share
premium
Other
reserves
Currency
transla-
tion dif-
ferences
Revalua-
tion
surplus
Retained
earnings Total
Minority
interest
Total
equity
Balance at 1 January 2007 195.0 0.0 195.9 246.3 -5.7 -0.7 1,119.2 1,750.0 27.1 1,777.1
Currency translation differences 2.2 0.8 3.0 3.0
Cost of options granted 2.3 2.3 2.3
Revaluation amortised to equity
Net investment hegde 0.1 0.1 0.1
Cash flow hedge 13.8 13.8 13.8
Taxes recognised in equity -3.6 -3.6 -3.6
Items recognised directly in equity 2.3 2.3 10.2 0.8 15.6 15.6
Net profit 285.1 285.1 22.4 307.5
Total recognised income and
expenses for the period 2.3 2.3 10.2 285.9 300.7 22.4 323.1
Dividend -146.3 -146.3 -9.3 -155.6
Shares subscribed for with options 0.5 0.0 2.1 2.6 2.6
Other changes 0.8 1.3 2.1 15.1 17.2
Balance at 31 December 2007 195.5 0.0 200.3 247.1 -3.4 9.5 1,260.1 1,909.1 55.3 1,964.4
Balance at 1 January 2008 195.5 0.0 200.3 247.1 -3.4 9.5 1,260.1 1,909.1 55.3 1,964.4
Currency translation differences -0.3 -4.2 -18.2 9.4 -13.3 0.5 -12.8
Cost of options granted 5.6 5.6 5.6
Revaluation amortised to equity
Net investment hedge 6.5 6.5 6.5
Cash flow hedge -12.8 -12.8 -12.8
Fair value change 2.2 2.2 2.2
Taxes recognised in equity 2.8 2.8 2.8
Items recognised directly in equity 5.3 -4.2 -11.7 -7.9 9.4 -9.1 0.5 -8.6
Net profit 219.7 219.7 20.9 240.5
Total recognised income and
expenses for the period 5.3 -4.2 -11.7 -7.9 229.0 210.5 21.4 231.9
Dividend -156.4 -156.4 -16.1 -172.5
Shares subscribed for with options 0.1 0.1 0.2 0.0 0.4 0.4
Other changes 2.3 2.3 0.0 2.3
Balance at 31 December 2008 195.6 0.1 205.8 242.9 -15.1 1.6 1,334.8 1,965.7 60.7 2,026.4
Further information about share capital and reserves is given in note 27.

86 Kesko financial statements 2008
note 1
Accounting policies for the consolidated financial statements
Basic information about the company
Kesko is the leading provider of trading sector services and a
highly valued listed company. Through its stores, Kesko offers
quality to the daily lives of consumers by providing products
and services at competitive prices. Kesko has about 2,000 stores
engaged in chain operations in the Nordic and Baltic countries,
Russia and Belarus.
Kesko's operations are divided into five reportable business
segments and other operating activities. The business segments
are Kesko Food operating in the grocery market, Rautakesko
engaged in the building and home improvement trade, VV-Auto
engaged in car importing, marketing and retailing, Anttila con-
centrating on the department store trade, and Kesko Agro
engaged in the agricultural trade. In addition, other operating
activities comprise the reporting for Konekesko, engaged in the
machinery trade, Indoor engaged in the furniture and interior
decoration trade, Intersport Finland concentrating on the sports
trade, Musta Pörssi specialising in the home technology trade,
and Kenkäkesko engaged in the shoe trade.
The Group's parent company, Kesko Corporation, is a Finnish
public limited company constituted in accordance with the laws
of Finland. The company's business ID is 0109862–8, it is domi-
ciled in Helsinki, and its registered address is Satamakatu 3,
FI-00016 Kesko. Copies of Kesko Corporation's financial state-
ments and the consolidated financial statements are available
from Kesko Corporation, Satamakatu 3, FI-00016 Kesko, and from
the Internet, at www.kesko.fi.
General information
Kesko's consolidated financial statements have been prepared
in accordance with the International Financial Reporting Stand-
ards (IFRSs) and International Accounting Standards (IASs), IFRS
standards and their IFRIC and SIC Interpretations valid at 31
December 2008 approved for adoption by the European Union
have been applied. The International Reporting Standards refer
to standards and their interpretations approved for adoption
within the EU in accordance with the procedure enacted in EC
regulation 1606/2002, included in the Finnish Accounting Stand-
ards and regulations based on them. Accounting standards not
yet effective have not been adopted voluntarily.
The notes to the consolidated financial statements also
include compliance with the Finnish accounting and corporate
legislation.
All amounts in the consolidated financial statements are in
millions of euros and are based on original cost, with the
exception of items identified separately, which have been
measured at fair value in compliance with the standards.
With effect from 1 January 2008, the Group has adopted the
following new and revised standards:
Notes to the consolidated financial statements
IAS 39 Amendment: Reclassification of Financial Assets, and •
IFRS 7 Amendment: Reclassification of Financial Assets, effec-
tive 1 July 2008. The amendment permits certain financial
assets to be reclassified out of the financial assets held for
trading, or the available-for-sale financial assets categories
in particular circumstances. The amendments have no effect
on the company's financial statements.
The following interpretations have become effective during •
the financial period but have no effect on the company's
financial statements: IFRIC 11 IFRS 2: Group and Treasury Share
Transactions, IFRIC 12: Service Concession Arrangements.
Use of estimates
The preparation of consolidated financial statements in con-
formity with IFRS requires the use of certain estimates and
assumptions about the future that affect the reported amounts
of assets and liabilities, contingent liabilities, and income and
expense. The actual results may differ from these estimates and
assumptions. Furthermore, the application of accounting poli-
cies is based on the management's judgements, for example, in
the classification of assets and in determining whether risks
and rewards incident to ownership of financial assets and
leased assets have substantially transferred to the other party.
The most significant estimates relate to the following.
Allocation of cost of acquisition
Assets and liabilities acquired in business combinations are
measured at their fair values at the date of acquisition. The fair
values on which cost allocation is based are determined by ref-
erence to market values to the extent they are available. If
market values are not available, the measurement is based on
the estimated earnings-generating capacity of the asset and its
future use in Kesko's operating activities. The measurement of
intangible assets, in particular, is based on the present values
of future cash flows and requires management estimates
regarding future cash flows and the use of assets.
Impairment test
The amounts recoverable from cash generating units' operating
activities are determined based on value-in-use calculations.
In the calculations, forecast cash flows are based on financial
plans approved by the management, covering a period of 3–4
years (note 12).
Employee benefits
The Group operates both defined contribution pension plans
and defined benefit pension plans. The calculation of items
relating to employee benefits requires the consideration of sev-
eral factors. Pension calculations under defined benefit plans
in compliance with IAS 19 include the following factors that rely
on management estimates (note 19):
expected return on plan assets•
discount rate used in calculating pension expenses and •
obligations for the period
future salary level•
employee service life•

87Kesko financial statements 2008
Consolidation principles
Subsidiaries
The consolidated financial statements combine the financial
statements of Kesko Corporation and all subsidiaries controlled
by the Group. Control exists when the Group owns more than
50% of the voting rights of a subsidiary or otherwise exerts
control. Control refers to the power to govern the financial and
operating policies of an enterprise so as to obtain benefits from
its activities. Acquired subsidiaries are consolidated from the
date on which the Group gains control until the date on which
control ceases. When assessing whether an enterprise controls
another enterprise, the potential voting rights that are currently
exercisable have been taken into account. The main subsidiar-
ies are listed in note 33.
Internal shareholdings are eliminated by using the acquisition
cost method. The cost of acquisition is determined on the basis
of the fair value of the acquired assets as on the date of acqui-
sition, the issued equity instruments and liabilities resulting
from or assumed on the date of the exchange transaction, plus
the direct expenses relating to the acquisition. The identifiable
assets, liabilities and contingent liabilities of the acquiree are
measured at the fair value on the date of acquisition, gross of
minority interest.
All intra-group transactions, receivables and payables, unre-
alised gains and internal distribution of profits are eliminated
when preparing the consolidated financial statements. Unreal-
ised losses are not eliminated, if the loss is due to the impair-
ment of an asset. Minority interests in the net income are dis-
closed in the income statement and the amount of equity
attributable to minority interest is disclosed separately in the
Group's equity.
Associates
Associates are enterprises in which the Group has significant
influence but not control. Significant influence mainly arises in
cases where the Group holds 20–50% of the company's voting
power, or otherwise has significant influence, but not control.
Associates are consolidated by using the equity method. A share
of an associate's net profit for the period corresponding to the
Group’s ownership interest is disclosed separately in the con-
solidated financial statements. The Group's share of an associ-
ate's post-acquisition net profit is added to the acquisition cost
of the associate's shares in the consolidated balance sheet.
Conversely, the Group’s share of an associate's net losses is
deducted from the acquisition cost of the shares. If the Group's
share of an associate's losses is in excess of the carrying
amount, the part in excess is not deducted unless the Group
has undertaken to fulfil the associate's obligations.
Unrealised gains between the Group and associates are elimi-
nated in proportion to the Group's ownership interest. Divi-
dends received from associates are deducted from the Group's
result and the cost of the shares. An investment in an associate
includes the goodwill generated by the acquisition. Goodwill is
not amortised. The associates are listed in note 50.
Joint ventures
Joint ventures are enterprises in which the Group and another
party exercise joint control by virtue of contractual arrange-
ments. The Group's interests in joint ventures are consolidated
proportionally on a line-by-line basis. The consolidated finan-
cial statements disclose the Group's share of a joint venture's
assets, liabilities, income and expenses. At the end of the
accounting period, the Group has no joint ventures.
Mutual real estate companies
In compliance with IAS 31, mutual real estate companies are
consolidated as assets under joint control on a line-by-line
basis in proportion to ownership interest.
Foreign currency items
The consolidated financial statements are presented in euros,
which is both the functional currency of the Group’s parent
company and the reporting currency. On initial recognition,
the figures relating to the result and financial position of Group
entities located outside the euro zone are recorded in the func-
tional currency of their operating environment. The euro has
been adopted as the functional currency of the real estate
companies in St. Petersburg and Moscow in Russia, which is
why no significant exchange differences are realised from their
balance sheets for the Group.
Foreign currency transactions are recorded in euros by apply-
ing the exchange rate at the date of the transaction. Foreign
currency receivables and liabilities are translated into euros
using the closing rate. Gains and losses from foreign currency
transactions, and from receivables and liabilities are recognised
in the income statement with the exception of those loan
exchange rate movements designated to provide a hedge
against foreign net investments and regarded as effective. These
exchange differences are recognised in equity, in compliance
with the rules of hedge accounting. Foreign exchange gains and
losses from operating activities are included in the respective
items above operating profit. Gains and losses from forward
exchange contracts and options used to hedge financial trans-
actions, and from foreign currency loans are included in finan-
cial income and expenses.
The income statements of Group entities operating outside
the euro zone have been translated into euros at the average
rate of the reporting period, and the balance sheets at the clos-
ing rate. The translation difference resulting from the use of dif-
ferent rates is recognised in equity. The translation differences
arising from the elimination of the acquisition cost of subsidiar-
ies outside the euro zone, and the hedging result of net invest-
ments made in them, are recognised in equity. In connection
with the disposal of a subsidiary, currency translation differ-
ences are disclosed in the income statement as part of the gains
or losses on the disposal.
As of 1 January 2004, the goodwill arising from the acquisition
of foreign operations and the fair value adjustments of assets
and liabilities made upon their acquisition have been treated

88 Kesko financial statements 2008
as assets and liabilities of these foreign operations and trans-
lated into euros at the closing rate. The goodwill and fair value
adjustments of acquisitions made prior to 1 January 2004 have
been recorded in euros.
Financial assets
The Group classifies financial assets in the following categories:
1) financial assets at fair value through profit or loss, 2) availa-
ble-for-sale financial assets, and 3) loans and receivables. The
classification of financial assets is determined on the basis of
why they were originally acquired. Purchases and sales of
financial assets are recognised using the settlement date
method. Financial assets are classified as non-current assets if
they have a maturity date greater than twelve months after the
balance sheet date. If financial assets are going to be held for
less than 12 months, they are classified as current assets.
Financial assets at fair value through profit or loss are classified
as current assets. Financial assets are derecognised when the
contractual rights to the cash flow of the financial asset expire
or have been transferred to another party, and when the risks
and rewards of ownership have been transferred.
At each reporting date, the Group assesses whether there is
any indication that a financial asset may be impaired. If any
such indication exists, the recoverable amount of the asset is
estimated. The recoverable amount is the fair value based on
the market price or the present value of cash flows. The fair
value of investment instruments is determined on the basis of
a maturity-based interest rate quotation. The rates of commer-
cial papers include a maturity-based margin, which equals the
amount expected to be received from the sale of the commercial
papers in current market conditions. An impairment loss is rec-
ognised if the carrying amount of a financial asset exceeds its
recoverable amount. The impairment loss is disclosed in the
financial expenses of the income statement, net of interest
income.
Financial assets at fair value through profit or loss
Financial assets at fair value through profit or loss include
instruments initially classified as financial assets at fair value
through profit or loss (the Fair Value Option). These instruments
are accounted for based on fair value and they include invest-
ments in bond and hedge funds, as defined by the Group's
treasury policy, as well as investments in other interest-bearing
papers with over 3-month maturities. The interest income and
fair value changes of these financial assets, as well as any com-
missions returned by funds are presented on a net basis in the
income statement in the interest income of the class in ques-
tion. In addition, financial assets at fair value through profit or
loss include all derivatives that do not qualify for hedge
accounting in compliance with IAS 39. Derivatives are carried at
fair value using prices quoted in active markets. The results of
derivatives hedging purchases and sales are recognised in other
operating income or expenses. The results of derivatives used to
hedge financial items are recognised in financial items, unless
the derivative has been designated as a hedging instrument.
Available-for-sale financial assets
Available-for-sale financial assets include non-derivative assets
designated as available for sale at the date of initial recogni-
tion. Available-for-sale financial assets are measured at fair
value at the balance sheet date and their fair value changes are
recognised in equity. The fair value of publicly quoted financial
assets is determined based on their market value. Financial
assets not quoted publicly are measured at cost if their fair val-
ues cannot be measured reliably. The dividends from equity
investments included in available-for-sale financial assets are
recognised in financial items in the income statement. The
interest income from available-for-sale financial assets is rec-
ognised in the financial items of the relevant class.
Loans and receivables
Loans and receivables are non-derivative assets with fixed or
measurable payments, and they are not quoted in active mar-
kets. The Group's loans and other receivables include trade
receivables. They are recognised at amortised cost using the
effective interest method.
Cash and cash equivalents
Cash and cash equivalents are carried at cost. Cash and cash
equivalents include cash on hand and balances with banks.
The cash and cash equivalents in the consolidated balance
sheet also include amounts relating to the retail operations
of division parent companies, used as cash floats in stores,
or amounts being transferred to the respective companies.
Financial liabilities
Financial liabilities have initially been recognised at their cost,
net of transaction costs. In the financial statements, financial
liabilities are measured at amortised cost using the effective
interest rate method. The arrangement fees related to lines of
credit are amortised over the validity period of the credit.
Financial liabilities having a maturity period of over 12 months
after the balance sheet date are classified as non-current lia-
bilities. Those having a maturity period of less than 12 months
after the balance sheet date are classified as current liabilities.
Derivative financial instruments and hedge accounting
When acquired, derivative financial instruments are carried at
fair value and subsequently measured at fair value at the bal-
ance sheet date. The recognition of changes in the fair value of
derivatives depends on whether the derivative instrument
qualifies for hedge accounting, and if so, on the hedged item.
When entered into, derivative contracts are treated either as
fair value hedges of receivables or liabilities, or in the case of
interest rate risk and electricity price risk, as cash flow hedges,
as hedges of net investments in a stand-alone foreign entity,
or as derivative contracts that do not meet the hedge account-
ing criteria. The results of instruments hedging commercial cur-
rency risks, in other words, the derivatives that do not meet the
hedge accounting criteria, are recognised in profit or loss in
other operating income or expenses. The portion of derivatives
hedging financial transactions to be recognised in the income
statement is included in financial items.

89Kesko financial statements 2008
When a hedging arrangement is entered into, the relationship
between the item being hedged and the hedging instrument,
as well as the objectives of the Group's risk management are
documented. The effectiveness of the hedging relationship is
tested regularly and the effective portion is recognised, against
the change in the fair value of the hedged item, in translation
differences in equity, or in the revaluation surplus. The ineffec-
tive portion is recognised in financial items or other operating
income and expenses depending on its nature. The effective
portion of the fair value change of instruments hedging cash
flow, such as a long-term credit facility, is recognised in the
equity hedging reserve. The value change of currency derivative
instruments relating to the credit facility is recognised in the
loan account, and the fair value changes of interest rate deriva-
tive instruments in other non-interest-bearing receivables or
debt.
Hedge accounting is discontinued when the hedging instru-
ment expires or is sold, the contract is terminated or exercised.
Any cumulative gain or loss existing in equity remains in equity
until the forecast transaction has occurred.
Measurement principles
The fair value of forward agreements is determined by reference
to the market price of the balance sheet date. The fair value of
interest rate swaps is calculated on the basis of the present
value of future cash flows using the market prices at the bal-
ance sheet date. The fair value of forward exchanges is deter-
mined by measuring the forward contracts at the forward rate
of the balance sheet date. Currency options are measured by
using the counterparty's price quotation, but the Group verifies
the price with the help of the Black-Scholes method. Electricity
and grain derivatives are measured at fair value using the mar-
ket quotations of the balance sheet date.
Hedging a net investment in a stand-alone foreign entity
The Group applies hedge accounting in accordance with IAS 39
to hedge foreign currency net investments in foreign opera-
tions. Forward exchanges or foreign currency loans are used as
hedging instruments. Spot price changes in forward exchanges
are recognised as translation differences under equity, and
changes in the interest rate difference are recognised as income
under financial items. The exchange differences of foreign cur-
rency loans are stated as translation differences under equity.
When a foreign entity is disposed of partially or wholly or
wound up, the accumulated gains or losses from hedging
instruments are recognised in profit or loss.
Embedded derivatives
The Group has prepared process descriptions to identify embed-
ded derivatives and applies fair value measurement. Fair value
is determined using the market prices of the measurement date
and the value change is recognised in the income statement.
In the Kesko Group, embedded derivatives are included in firm
commercial contracts denominated in a currency which is not
the functional currency of either party and not commonly used
in the economic environment in which the transaction takes
place.
Goodwill and other intangible assets
Goodwill represents the excess of the cost of an acquisition over
the fair value of the Group's share of the net assets and liabili-
ties of an enterprise at the date of the acquisition. The good-
will of companies acquired prior to 1 January 2004 corresponds
to their carrying amounts reported in accordance with the pre-
vious accounting practices, and the carrying amount is used as
the deemed cost. The classification and accounting treatment of
business combinations entered into prior to 1 January 2004
were not adjusted in preparing the consolidated IFRS opening
balance sheet.
Goodwill is not amortised but tested annually for impairment
and whenever there is an indication of impairment. For testing
purposes goodwill is allocated to the cash generating units.
Goodwill is measured at original cost and the share acquired
prior to 1 January 2004 at deemed cost net of impairment. Any
negative goodwill is immediately recognised as income in
accordance with IFRS 3.
Intangible assets with indefinite useful lives are not amor-
tised. They are tested for impairment annually and whenever
there is an indication of impairment. These intangible assets
include trademarks capitalised upon acquisition.
The costs of intangible assets with definite useful lives are
stated in the balance sheet and recognised as expenses during
their useful lives. Such intangible assets include software
licences and customer relationships to which acquisition cost
has been allocated upon acquisition, and leasehold interests
that are amortised during their probable terms. The estimated
useful lives are:
computer software and licences 3–5 years
customer and supplier relationships 10 years
Research and development expenses
The Group has not had such development expenses which,
under certain conditions, should be recognised as assets and
written off during their useful lives in accordance with IAS 38.
Therefore the cost of research and development activities has
been expensed as incurred.
Computer software
The labour costs and other direct expenditure of persons
employed by the Group, working on development projects
related to the acquisition of new computer software, are capi-
talised as part of the software cost. In the balance sheet, com-
puter software is included in intangible assets and its cost is
written off during the useful life of the software. Software
maintenance expenditure is recognised as an expense as
incurred.
Tangible assets
Tangible assets mainly comprise land, buildings, machinery and
equipment. Tangible assets are carried at original cost net of
planned depreciation and any impairment. The tangible assets
of acquired subsidiaries are measured at fair value at the date
of acquisition.

90 Kesko financial statements 2008
The machinery and equipment of buildings are treated as
separate assets and any significant expenditure related to their
replacement is capitalised. Subsequent expenditure relating to
a tangible asset is only added to the carrying amount of the
asset when it is probable that future economic benefits relating
to the asset will flow to the enterprise and that the cost of the
asset can be reliably measured. Other repair, service and main-
tenance expenditure of fixed assets is recognised as an expense
as incurred.
Tangible assets are written off on a straight-line basis during
their estimated useful lives.
The most common estimated useful lives are:
Buildings 10–40 years
Components of buildings 8–10 years
Machinery and equipment 3–8 years
Cars and transport equipment 5 years
The residual values, useful lives and depreciation methods
applied to tangible assets are reviewed at least at the end of
each accounting period. If the estimates of useful life and the
expected pattern of economic benefits are different from previ-
ous estimates, the change in the estimate is accounted for in
accordance with IAS 8.
The depreciation of a tangible asset ceases when the asset is
classified as held for sale in accordance with IFRS 5. Lands are
not depreciated.
Gains and losses from sales and disposals of tangible assets
are recognised in the income statement and presented as other
operating income and expenses.
Investment properties
Investment properties are properties held by the enterprise
mainly to earn rentals or for capital appreciation. The Group
does not hold real estate classified as investment properties.
Impairment
At each reporting date, the Group assesses whether there is any
indication that an asset may be impaired. If any such indica-
tion exists, the recoverable amount of the asset is estimated.
The recoverable amount of goodwill and intangible assets with
indefinite useful lives is assessed every year whether or not
there is an indication of impairment. In addition, an impair-
ment test is performed whenever there is an indication of
impairment.
The recoverable amount is the higher rate of an asset's fair
value less the costs of disposal, and its value in use. Often it is
not possible to assess the recoverable amount for an individual
asset. Then, as in the case of goodwill, the recoverable amount
is determined for the cash generating unit to which the good-
will or asset belongs. The recoverable amount of available-for-
sale financial assets is the fair value based on either the market
price or the present value of cash flows.
An impairment loss is recognised if the carrying amount of an
asset exceeds its recoverable amount. The impairment loss is
disclosed in the income statement. An impairment loss recog-
nised for an asset in prior years is reversed if there has been
an increase in the reassessed recoverable amount. The reversal
of an impairment loss of an asset should not exceed the carry-
ing amount of the asset without an impairment loss recogni-
tion. For goodwill, a recognised impairment loss is not reversed
under any circumstances.
Leases
In accordance with IAS 17, leases that substantially transfer all
the risks and rewards incident to ownership to the Group are
classified as finance leases. An asset leased under a finance
lease is recognised in the balance sheet at the lower rate of its
fair value at the inception date and the present value of mini-
mum lease payments. The rental obligations of finance leases
are recorded in interest-bearing liabilities in the balance sheet.
Lease payments are allocated between the interest expense and
the liability. Finance lease assets are amortised over the shorter
period of the useful life and the lease term.
Leases in which assets are leased out by the Group, and sub-
stantially all the risks and rewards incident to ownership are
transferred to the lessee, are also classified as finance leases.
Assets leased under such contracts are recognised as receivables
in the balance sheet and are stated at present value. The finan-
cial income from finance leases is determined so as to achieve
a constant periodic rate of return on the remaining net invest-
ment for the lease term.
Leases in which risks and rewards incident to ownership are
not transferred to the lessee are classified as operating leases.
Lease payments related to them are recognised in the income
statement on a straight-line basis over the lease term.
In sale and leaseback transactions the sale price and the
future lease payments are usually interdependent. If a sale and
leaseback transaction results in a finance lease, any excess of
sales proceeds over the carrying amount is not immediately rec-
ognised as income. Instead it is deferred and amortised over the
lease term. If a sale and leaseback transaction results in an
operating lease and the transaction is established at fair value,
any profit or loss is recognised immediately.
If the sale price is below fair value, any profit or loss is recog-
nised immediately unless the loss is compensated by future
lease payments at below market price, in which case the loss is
deferred and amortised over the period for which the asset is
expected to be used. If the sale price is above fair value, the
excess over fair value is deferred and amortised over the period
for which the asset is expected to be used. If the fair value at
the time of a sale and leaseback transaction is less than the car-
rying amount of the asset, a loss equal to the amount of the
difference between the carrying amount and fair value is recog-
nised immediately.
Inventories
Inventories are measured at the lower rate of cost and net real-
isable value. Net realisable value is the estimated selling price
in the ordinary course of business less the estimated costs to
sell. The cost is primarily assigned by using the weighted aver-
age cost formula. The cost of certain classifications of inventory
is assigned by using the FIFO formula. The cost of finished
goods comprises all costs of purchase including freight. The cost

91Kesko financial statements 2008
of self-constructed goods comprise all costs of conversion
including direct costs and allocations of variable and fixed
production overheads.
Trade receivables
Trade receivables are recognised at the original invoice amount.
Impairment is recognised when there is objective evidence of
impairment loss. The Group has established a uniform basis for
the determination of impairment of trade receivables based on
the time receivables have been outstanding. In addition,
impairment is recognised if there is other evidence of a debt-
or's insolvency, bankruptcy or liquidation. Losses on loans and
advances are recognised as an expense in the income
statement.
Assets held for sale and discontinued operations
Assets (or a disposal group) and assets and liabilities relating
to discontinued operations are classified as held for sale, if
their carrying amount will be recovered principally through the
disposal of the assets rather than through continuing use. For
this to be the case, the sale must be highly probable, the asset
(or disposal group) must be available for immediate sale in its
present condition subject only to terms that are usual and cus-
tomary, the management must be committed to selling and the
sale should be expected to qualify for recognition as a com-
pleted sale within one year from the date of classification.
Non-current assets held for sale (or assets included in the
disposal group) and assets and liabilities linked to a discontinu-
ing operation are measured at the lower rate of the carrying
amount and fair value net of costs to sell. After an asset has
been classified as held for sale, or if it is included in the dis-
posal group, it is not depreciated. If the classification criterion
is not met, the classification is reversed and the asset is meas-
ured at the lower rate of the carrying amount prior to the clas-
sification less depreciation and impairment, and recoverable
amount. A non-current asset held for sale and assets included
in the disposal group classified as held for sale are disclosed
separately in the balance sheet. Liabilities included in the dis-
posal group of assets held for sale are also disclosed separately
in the balance sheet. The profit from discontinued operations
is disclosed as a separate line item in the income statement.
The comparative information in the income statement has
been adjusted for operations classified as discontinued during
the latest financial period being reported. Consequently, the
profit from discontinued operations is presented as a separate
line item also for the comparatives.
Provisions
A provision is recognised when the Group has a present legal
or constructive obligation as a result of a past event, and it is
probable that an outflow of resources embodying economic
benefits will be required to settle the obligation, and that a
reliable estimate can be made of the amount of the obligation.
Provision amounts are reviewed at each balance sheet date and
adjusted to reflect the current best estimate. Changes in provi-
sions are recorded in the income statement in the same item in
which the provision was originally recognised. The most signifi-
cant part of the Group's provisions relates to warranties given
to products sold by the Group, and to onerous leases.
A warranty provision is recognised when a product fulfilling
the terms is sold. The provision amount is based on historical
experience about the level of warranty expenses. Leases become
onerous if the leased premises become vacant, or if they are
subleased at a rate lower than the original. A provision is recog-
nised for an estimated loss from vacant lease premises over the
remaining lease term, and for losses from subleased premises.
Pension plans
The Group operates both defined contribution plans and
defined benefit plans. The contributions payable under defined
contribution plans are recognised as expenses in the income
statement of the period to which the payments relate. In
defined contribution plans, the Group does not have a legal
or constructive obligation to make additional payments, in case
the payment recipient is unable to pay the retirement benefits.
In defined benefit plans, after the Group has paid the amount
for the period, an excess or deficit may result. The pension obli-
gation represents the present value of future cash flows from
payable benefits. The present value of pension obligations has
been calculated using the Project Unit Credit Method. The assets
corresponding to the pension obligation of the retirement ben-
efit plan are carried at fair values at the balance sheet date.
Actuarial gains and losses are recognised in the income state-
ment for the average remaining service lives of the employees
participating in the plan to the extent that they exceed 10 per-
cent of the higher rate of the present value of the defined ben-
efit plans and the fair value of assets belonging to the plan.
Relating to the arrangements taken care of by the Kesko Pen-
sion Fund, the funded portion and the disability portion under
the Finnish Employees' Pension Act are treated as defined ben-
efit plans. In addition, the Group operates a pension plan in
Norway which is treated as a defined benefit plan.
Share-based payments
The share options issued as part of the Group management's
incentive and commitment programme are measured at fair
value at the grant date and expensed on a straight-line basis
over the option's vesting period. The expenditure determined
at the issue date is based on the Group's estimate of the
number of options expected to vest at the end of the vesting
period. The fair value of the options has been calculated using
the Black-Scholes option pricing model.
Revenue recognition policies
Net sales include the sale of products, services and energy. The
sale of services and energy account for an insignificant portion
of net sales. For net sales, sales revenue is adjusted by indirect
taxes, sales adjustment items and the exchange differences of
foreign currency sales.
Revenue from the sale of goods is recognised when the sig-
nificant risks of ownership of the goods have transferred to the
buyer, and it is probable that the economic benefits associated
with the transaction will flow to the Group. Normally revenue
from the sale of goods can be recognised at the time of delivery

92 Kesko financial statements 2008
of the goods. Revenue from the rendering of services is recog-
nised after the service has been rendered and when a flow of
economic benefits associated with the service is probable.
Interest is recognised as revenue on a time proportion basis.
Dividends are recognised as revenue when the right to receive
payment is established.
Other operating income and expenses
Other operating income includes income other than that asso-
ciated with the sale of goods or services, such as rent income,
store site and chain fees and various other service fees and
commissions. Profits and losses from the sale and disposal of
tangible assets are recognised in the income statement and
disclosed in other operating income and expenses. Other oper-
ating income and expenses also include realised and unrealised
profits and losses from derivatives used to hedge currency risks
of trade.
Borrowing costs
Borrowing costs are recognised as an expense in the period in
which they are incurred. Borrowing costs are not capitalised as
part of asset costs. Directly attributable transaction costs clearly
associated with a certain borrowing are included in the origi-
nal amortised cost of the borrowing and amortised to interest
expense by using the effective interest method.
Income taxes
The taxes disclosed in the consolidated income statement rec-
ognise the Group companies' taxes on current net profits on an
accrual basis, prior period tax adjustments and changes in
deferred taxes. The Group companies' taxes are calculated from
the taxable profit of each company determined by local juris-
diction.
Deferred tax assets and liabilities are recognised for all tempo-
rary differences between the tax bases and carrying amounts of
assets and liabilities. Deferred tax has not been calculated on
goodwill insofar as goodwill is not tax deductible. Deferred tax
on subsidiaries' undistributed earnings is not recognised unless
a distribution of earnings is probable, causing tax consequences.
Deferred tax is calculated using tax rates enacted by the bal-
ance sheet date, and if the rates change, at the new rate
expected to apply. A deferred tax asset is recognised to the
extent that it is probable that it can be utilised against future
profit. The Group's deferred tax assets and liabilities are offset
when they relate to income taxes levied by the same taxation
authority.
The most significant temporary differences arise from defined
benefit plans, tangible assets (depreciation difference, finance
lease) and measurement at fair value of asset items in connec-
tion with business acquisitions.
Dividend distribution
The dividend proposed by the Board to the Annual General
Meeting has not been deducted from equity. Instead dividends
are recognised on the basis of the resolution of the Annual
General Meeting.
New IFRS standards and interpretations
The IASB (International Accounting Standards Board) published
the following standards, amendments to standards, and inter-
pretations whose application will become mandatory in 2009.
They will be adopted by the Group as they become effective.
IAS 1 (Amendment): Presentation of Financial Statements
(effective from accounting periods beginning after 1 January
2009). The amendment of the standard will have an impact on
the face of financial statements as it, for example, separates
changes in a company's equity relating to transactions with
owners from non-owner changes. Non-owner changes are pre-
sented in a statement of comprehensive income. The Group's
management assesses that the amendment of the standard will
have its main impact on the presentation of the income state-
ment and the statement of changes in equity. The amendment
has been endorsed by the European Union.
IAS 23 (Amendment): Borrowing Costs (effective from account-
ing periods beginning after 1 January 2009). The amendment of
the standard removes the option of immediately expensing bor-
rowing costs attributable to the acquisition, construction or
production of a qualifying asset as part of the cost of that asset.
These borrowing costs are eligible for capitalisation as part of
the cost of the asset. The Group presently recognises, as previ-
ously permitted, borrowing costs for the accounting period in
which they incur. The Group's management assesses that the
amendment will not have a significant impact on the Group's
profit. The amendment has been endorsed by the European
Union.
IAS 32 (Amendment): Financial Instruments: Presentation, and
IAS 1 (Amendment) Presentation of Financial Statements (effec-
tive from accounting periods beginning after 1 January 2009):
Puttable Financial Instruments and Obligations Arising on Liqui-
dation. The Group's management assesses that the amendment
will not have an impact on the consolidated financial state-
ments. The amendments have been endorsed by the European
Union.
IFRS 1 (Amendment): First-Time adoption of IFRS, and IAS 27
(Amendment) Consolidated and Separate Financial Statements.
The amendments will not have an impact on the consolidated
financial statements. The amendments have not yet been
endorsed by the European Union.
IFRS 2 (Amendment): Share-based Payments. The amendment
clarifies that vesting conditions are service conditions and per-
formance conditions only. All other features shall be included in
the grant date fair value. The amendment also provides for the
treatment of cancellations in different situations. The Group's
management assesses that the amendment will not have a
material impact on the consolidated financial statements. The
amendment has been endorsed by the European Union.
IFRS 8 Operating Segments (effective from accounting periods
beginning after 1 January 2009). The revised IFRS 8 supersedes
IAS 14 Segment Reporting. The standard requires the 'manage-
ment approach' in the sense that segment information shall be
reported on the same principles as those used internally by the
management for monitoring segment performance. The Group's
management assesses that the standard will not change the
present segment reporting in any material way, because the

93Kesko financial statements 2008
business segments determined in accordance with internal
reporting are the Group's primary reporting format. The stand-
ard has been endorsed by the European Union.
IFRIC 13 Customer Loyalty Programmes (effective from account-
ing periods beginning after 1 July 2008). The interpretation is
applied to the recognition and measurement of refunds linked
to customer loyalty systems. Presently the Group recognises the
expenditure of customer loyalty programmes in other operating
expenses. The Group's management assesses that the interpre-
tation will impact the Group's net sales, but the impact will not
be material. The interpretation will not impact the Group's
operating profit. The interpretation has been endorsed by the
European Union.
IFRIC 14 IAS 19 The Limit on a Defined Benefit Asset, Minimum
Funding Requirements and their Interaction. The interpretation
is applied to post-employment defined benefit plans according
to IAS 19, and to other long-term defined employee benefits
when there is a minimum funding requirement. The interpreta-
tion also limits the measurement of the defined benefit asset to
the present value of economic benefits available in the form of
refunds from the plan or reductions in future contributions to
the plan. The Group's management assesses that the interpreta-
tion will not have a material impact on the consolidated finan-
cial statements. The interpretation has been endorsed by the
European Union.
IFRIC 15 Agreements for the Construction of Real Estate. The
interpretation provides guidance on how to determine whether
an agreement for the construction of real estate is within the
scope of IAS 11 Construction Contracts or IAS 18 Revenue and,
accordingly, when revenue from the construction should be rec-
ognised. The interpretation will not have an impact on the con-
solidated financial statements. The interpretation has not yet
been endorsed by the European Union.
IFRIC 16 Hedges of a Net Investment in a Foreign Operation.
The interpretation clarifies the accounting treatment of hedges
of net investments in foreign operations. This means that a
hedge of a net investment in a foreign operation relates to dif-
ferences in the functional currency, not in the presentation cur-
rency. In addition, the hedging instrument can be held by any
entity within a Group. The Group's management assesses that
the interpretation will not have a material impact on the con-
solidated financial statements. The interpretation has not yet
been endorsed by the European Union.
In addition, the IASB published improvements to standard 34
as part of its annual improvements to the IFRSs. The following
is a summary of the changes which, according to the Group
management's assessment, can have an impact on the Group's
financial statements:
IAS 1 (Amendment): Presentation of Financial Statements. The
amendment clarifies that only part of the financial assets classi-
fied as held for trading in compliance with IAS 39 belong to cur-
rent assets. The Group's management assesses that the amend-
ment will not have a material impact on the Group's financial
statements. The amendment has not yet been endorsed by the
European Union.
IAS 16 (Amendment): Property, Plant and Equipment. Enter-
prises whose ordinary activities include leasing out assets and
subsequent disposal shall present the revenue from such assets
in net sales and transfer the carrying amounts of the assets to
inventories when the asset is made available for sale. The
Group's management assesses that the interpretation will not
have a material impact on the Group's financial statements. The
amendment has not yet been endorsed by the European Union.
IAS 19 (Amendment): Employee Benefits. The amendments
clarify, among other things, that when a plan amendment
reduces benefits for future service, the reduction relating to
future service is a curtailment and any reduction relating to past
service is negative past service cost, if it reduces the present
value of defined benefit plan obligation. The Group's manage-
ment assesses that the amendment will not have a material
impact on the Group's financial statements. The amendment
has not yet been endorsed by the European Union.
IAS 28 (Amendment): Investments in Associates (and conse-
quent amendments to IAS 32 Financial Instruments: Disclosure
and Presentation, and IFRS 7 Financial Instruments: Disclosures).
For impairment testing, an investment in an associate is treated
as an individual asset, and impairment losses are not allocated
to individual assets included in the investment, for example,
goodwill. Impairment reversals are recognised as adjustments
to the carrying amount of the investment to the extent that the
recoverable amount of the associate increases. The Group's
management assesses that the amendment will not have a
material impact on the Group's financial statements. The
amendment has not yet been endorsed by the European Union.
IAS 38 (Amendment): Intangible Assets. A prepayment can
only be recognised as an asset when the payment has been
made before receiving the related goods or services. This means
that an expense arising from mail order catalogues is recognised
when the Group has received them and not when they are
delivered to customers. The Group's management assesses
that the amendment will not have a material impact on the
Group's financial statements. The amendment has not yet been
endorsed by the European Union.
IAS 39 (Amendment): Financial Instruments: Recognition and
Measurement. The amendments clarify, among other things, the
classification of derivatives in situations involving changes in
hedge accounting, the definition for instruments held for trad-
ing, and provide for the use of the effective interest method in
re-measuring the carrying amount of a debt instrument when
hedge accounting is discontinued. The Group's management
assesses that the amendment will not have a material impact
on the Group's financial statements. The amendment has not
yet been endorsed by the European Union.
In 2010, the Group will adopt the following standards and
interpretations published by the IASB:
IFRS 3 (revised): Business Combinations. The revised standard
continues to apply the acquisition method to business combi-
nations, with some significant changes. For example, all pay-
ments to purchase a business are to be recorded at fair value
at the acquisition date, with some contingent payments subse-
quently re-measured at fair value through income. Goodwill
may be calculated based on the parent’s share of net assets or it
may include goodwill related to the minority interest. All trans-
action costs will be expensed. The Group's management

94 Kesko financial statements 2008
assesses that the change will affect the accounting for business
acquisitions. The revised standard has not yet been endorsed for
application in the EU.
IAS 27 (revised): Consolidated and Separate Financial State-
ments. The revised standard requires that all transactions with
non-controlling interests be recorded in equity if there is no
change in control. Consequently, minority transactions will no
longer result in goodwill or profits and losses. The standard also
specifies the accounting for transactions when control is trans-
ferred. The Group's management assesses that the change will
have an impact in possible business arrangement situations.
The revised standard has not yet been adopted by the European
Union.
IAS 39 (Amendment): Financial Instruments: Recognition and
Measurement Eligible Hedged Items. According to the amend-
ment, inflation cannot be separately designated as a hedged
item in a fixed-interest loan. The Group's management assesses
that the amendment will not have an impact on the Group's
financial statements. The change has not yet been endorsed by
the European Union.
IFRS 5 (Amendment): Non-current Assets Held for Sale and
Discontinued Operations. The amendment clarifies that if a plan
for a partial disposal involves lost control, the related subsidi-
ary's total assets and liabilities are classified as held for sale,
and when the criteria for a discontinued operation are met,
appropriate information shall be disclosed. The Group's man-
agement assesses that the amendment will not have a material
impact on the Group's financial statements. The change has not
yet been endorsed by the European Union.
IFRIC 17 Distributions of Non-Cash Assets to Owners. The inter-
pretation clarifies the measurement of asset distributions in a
situation where the company distributes assets other than divi-
dends to its shareholders. The Group's management assesses
that the interpretation will not have a material impact on the
Group's financial statements. The interpretation has not yet
been endorsed by the European Union.
note 2
Segment information
In segment reporting, a business segment has been determined
as the primary reporting format and a geographical segment as
the secondary reporting format. Business segments are based
on the Group's internal business divisions and internal finan-
cial reporting.
The basis of inter-segment pricing is fair market price.
The segment income statement is disclosed down to operating
profit. Segment assets and liabilities consist of items used by
the segment in its operating activities, or items justifiably allo-
cated to segments. Segment assets comprise intangible assets
including goodwill, tangible assets, inventories, trade receiva-
bles and deferred revenue and other accruals linked to operat-
ing activities. Segment liabilities consist of trade payables,
accrued liabilities and provisions linked to operating activities.
The Group's real estate assets and their revenue and costs have
been allocated to the segments. The division parent companies
have profit responsibility for properties during their whole
lifecycles.
Business segments
Business segments are composed of the Group's business
divisions.
Kesko Food operates in the Finnish grocery market and its retail
chains are K-citymarket, K-supermarket, K-market and K-extra.
Kesko Food manages the K-food store chains and combines
their purchasing power, arranges efficient logistics, acquires
store sites and guarantees strong marketing and development
support. Kesko Food’s subsidiary Kespro Ltd offers delivery sales
and wholesale services to business customers.
Rautakesko is engaged in the building and home improvement
trade in the Nordic and Baltic countries, Russia and Belarus.
The retail chains are K-rauta, Rautia, Byggmakker and Senukai.
Rautakesko manages its chains, combines their purchasing
power, arranges efficient logistics, acquires store sites and
guarantees strong marketing and development support.
Rautakesko B-to-B Service serves building firms, industry and
other professional customers.
VV-Auto imports and markets Volkswagen, Audi and Seat pas-
senger cars and Volkswagen commercial vehicles in Finland.
VV-Auto is also engaged in car retailing and provides after-
sales services at its own retail outlets.
Anttila is a company concentrating on the department store
trade. Anttila operates Anttila department stores, Kodin
Ykkönen department stores for interior decoration and home
goods, Anttila Mail Order and the NetAnttila online department
store.
Kesko Agro's K-maatalous chain purchases and sells agricultural
inputs and machinery to agricultural entrepreneurs, and trades
in grain with them. Kesko Agro is active in Finland and the
Baltic countries.
Other operating activities comprise the reporting for
Konekesko, engaging in the machinery trade, Indoor in the
furniture and interior decoration trade, Intersport Finland in
the sports trade, Musta Pörssi in the home technology trade,
and Kenkäkesko in the shoe trade.
Common operations include shared Group support functions.
Geographical segments
The geographical segments are composed of the four geograph-
ical areas with different economic situations in which the
Group is active, namely Finland, the other Nordic countries,
the Baltic countries and other countries.
The net sales of the geographical segments are disclosed
based on the location of the customers and assets are disclosed
based on their location.

95Kesko financial statements 2008
Business segments 2008, continuing operations
€ million
Kesko
Food
Rauta-
kesko VV-Auto Anttila
Kesko
Agro
Other
operating
activities
Common
operations Eliminations Total
External sales 4,137.5 2,557.0 898.3 559.6 850.5 708.7 22.9 9,734.7
Inter-segment sales 29.1 5.2 1.3 1.3 0.8 3.8 130.8 -172.3 0.0
Adjustment items -56.4 -44.1 -15.6 -1.1 -5.8 -13.8 0.0 2.4 -134.3
Net sales 4,110.2 2,518.2 884.1 559.9 845.6 698.6 153.7 -169.9 9,600.4
Other operating income, external 513.2 109.7 0.8 8.3 8.4 62.3 27.0 729.7
Other inter-segment income 3.8 1.5 4.6 1.8 0.9 1.3 -13.4 0.6
Total other operating income 517.0 111.3 0.8 12.9 10.2 63.2 28.3 -13.4 730.3
Operating profit 245.0 16.3 36.3 4.3 -3.5 0.8 -13.9 0.1 285.6
Operating profit
excl. non-recurring items 135.2 53.3 36.3 19.8 -3.5 -0.1 -24.2 0.1 217.0
Financial income and expenses 1.0
Income from associates 1.9
Income tax expense -89.4
Net profit from discontinued operations 41.5
Net profit 240.6
Other information
Segment assets 1,444.1 867.7 196.5 182.9 208.4 331.3 96.9 -0.2 3,327.6
Assets held for sale 1.9 1.0 3.0
Interests in associates 31.2
Unallocated assets 530.3
Total assets 1,444.1 869.6 196.5 182.9 208.4 331.3 97.9 -0.2 3,891.9
Segment liabilities 570.4 272.3 56.7 69.4 65.8 131.5 79.6 -24.3 1,221.5
Liabilities related to assets held for sale
Unallocated liabilities 644.0
Total liabilities 570.4 272.3 56.7 69.4 65.8 131.5 79.6 -24.3 1,865.5
Investments 185.9 121.1 6.9 5.8 2.4 15.7 4.4 -3.7 338.4
Depreciation -57.8 -31.6 -4.7 -6.1 -6.0 -7.4 -3.8 0.3 -117.0
Impairment -45.6 -15.5 -61.1
Segment information in 2009
As of 1 January 2009, the Kesko Group's primary reportable seg-
ments are the food trade, the home and speciality goods trade,
the building and home improvement trade, and the car and
machinery trade.
On 1 January 2009, Kesko Agro Ltd demerged so that the agri-
cultural trade activities in Finland became part of Rautakesko
Ltd and will be reported as part of the building and home
improvement segment. The trade of tractors and combines,
as well as the agricultural and machinery trade companies in
the Baltic countries became part of Konekesko Ltd and will be
reported as part of the car and machinery trade segment.
Starting from 1 January 2009, Anttila Oy, K-citymarket Oy
(home and speciality goods) and the other Kesko Group home
and speciality goods companies intensify their cooperation, and
will be jointly reported as the home and speciality goods trade
segment.

96 Kesko financial statements 2008
Business segments 2007, continuing operations
€ million
Kesko
Food
Rauta-
kesko VV-Auto Anttila
Kesko
Agro
Other
operating
activities
Common
operations Eliminations Total
External sales 3,890.1 2,573.8 819.4 564.4 783.7 750.5 31.0 9,413.0
Inter-segment sales 30.8 6.3 0.9 1.2 14.1 6.3 120.5 -180.1 0.0
Adjustment items -50.1 -42.8 -15.5 -1.9 -4.5 -13.4 0.0 2.3 -125.9
Net sales 3,870.8 2,537.3 804.8 563.7 793.3 743.4 151.5 -177.8 9,287.2
Other operating income, external 375.0 103.8 0.6 9.7 5.6 60.0 22.0 576.9
Other inter-segment income 3.7 0.9 3.7 1.6 0.4 4.3 -14.7 -0.1
Total other operating income 378.7 104.7 0.6 13.4 7.3 60.5 26.4 -14.7 576.8
Operating profit 151.3 117.8 26.1 27.2 12.9 10.0 -37.0 13.4 321.5
Operating profit
excl. non-recurring items 151.4 115.9 26.1 25.2 12.4 13.9 -30.1 0.3 315.0
Financial income and expenses 36.1
Income from associates 0.2
Income tax expense -87.1
Net profit from discontinued operations 36.6
Net profit 307.4
Other information
Segment assets 1,355.3 901.3 205.9 195.5 244.2 326.2 83.1 -3.9 3,307.7
Assets held for sale 236.9 236.9
Interests in associates 26.9
Unallocated assets 521.2
Total assets 1,355.3 901.3 205.9 195.5 244.2 326.2 320.0 -3.9 4,092.7
Segment liabilities 521.8 290.4 54.7 75.6 129.9 200.2 80.7 -28.4 1,324.9
Liabilities related to assets held for sale 3.3 3.3
Unallocated liabilities 800.1
Total liabilities 521.8 290.4 54.7 75.6 129.9 200.2 84.0 -28.4 2,128.3
Investments 117.6 77.0 6.3 5.8 7.6 7.4 9.7 -3.8 227.6
Depreciation -60.1 -25.7 -5.7 -6.1 -4.3 -8.5 -5.4 0.3 -115.5
Impairment -0.5 -0.5

97Kesko financial statements 2008
Geographical segments 2008
€ million Finland
Other Nordic
countries
Baltic
countries
Other
countries
Eliminations,
unallocated Total
Net sales 7,643.1 758.7 945.7 278.2 -25.3 9,600.4
Segment assets 2,629.7 231.2 316.2 113.4 37.1 3,327.6
Assets held for sale 1.0 2.0 3.0
Investments 241.5 31.1 11.5 55.5 -1.2 338.4
Geographical segments 2007
€ million Finland
Other Nordic
countries
Baltic
countries
Other
countries
Eliminations,
unallocated Total
Net sales 7,349.1 819.9 957.6 192.9 -32.4 9,287.2
Segment assets 2,559.0 260.3 353.4 77.8 57.1 3,307.7
Assets held for sale 102.8 134.1 236.9
Investments 173.2 27.6 20.5 6.3 0.0 227.7
note 3
Acquisitions
Acquisitions in 2008
In 2008, the Kesko Group's acquisitions mainly comprised real
estate companies. Their acquisition cost totalled €30.0 million
and the cash outflow, additional purchase prices included, was
€35.0 million.
Acquisitions in 2007
In 2007, the Kesko Group acquired companies at insignificant
cost. Their acquisition cost totalled €6.0 million and the cash
outflow, additional purchase prices included, was €21.9 million.
note 4
Discontinued operations and disposal of other assets
Discontinued operations in 2008
In March 2008, Kesko Corporation sold the share capital of Tähti
Optikko Group Oy. The debt-free selling price was about €15
million, which contributed a non-recurring gain of about €8.5
million.
In April 2008, Kesko Corporation sold the share capital of
Kauko-Telko Ltd engaged in technical trade. The debt-free price
was about €77 million, which contributed a non-recurring gain
of about €31 million.
Net assets of discontinued operations at date of disposal
€ million 2008
Cash 21.0
Intangible assets 22.8
Property, plant and equipment 10.0
Inventories 26.6
Receivables 31.3
Non-interest-bearing debt -35.9
Interest-bearing debt -13.4
Deferred tax liabilities (net) -3.1
59.2
Group eliminations 1.9
Gains/losses on disposal 39.4
Total consideration 100.6
Received in cash 100.6
Received in shares
Cash and cash equivalents in disposed entity -21.0
Cash inflow on disposal 79.6
Income statement for discontinued operations
€ million 2008 2007
Net sales 83.1 246.6
Expenses -80.3 -235.1
Profit before tax 2.8 11.5
Income tax -0.8 -3.1
Profit after tax 2.0 8.4
Profit before tax on disposal of operations 39.5 28.2
Net profit on the disposal of operations 41.5 36.6

98 Kesko financial statements 2008
Audit fees
€ million 2008 2007
Authorised Public Accountants PricewaterhouseCoopers
Audit fees 0.9 0.8
Tax consultation 0.2 0.2
Other services 0.7 0.2
Total 1.7 1.2
Other auditing firms 0.4 0.3
note 7
Non-recurring items
€ million 2008 2007
Gains on disposal of real estate and shares 139.0 13.6
Losses on disposal of real estate and shares -1.0 -1.4
Impairment losses -61.1 -0.5
Others -8.2 -5.1
Total 68.7 6.5
Extraordinary transactions that are not related to ordinary oper-
ating activities are treated as non-recurring items and allocated
to segments. The Group classifies gains and losses on the dis-
posal of real estate, shares, operating activities and impair-
note 5
Other operating income
€ million 2008 2007
Services fees 460.0 433.1
Rent income 37.3 36.5
Gains on disposal of tangible and
intangible assets 140.0 13.4
Gains from derivatives *) 4.9 2.2
Others 88.0 91.6
Total 730.3 576.8
Sales of services mainly consist of chain and store site fees paid
for chain concepts by chain companies.
note 6
Other operating expenses
€ million 2008 2007
Rent expenses -349.9 -313.4
Marketing costs -262.9 -256.9
Property and store site occupancy costs -125.3 -111.3
Data communication costs -65.5 -61.6
Other trading expenses -186.1 -175.6
Losses on disposal of tangible assets -1.3 -1.5
Losses on derivatives *) -4.9 -2.1
Total -996.0 -922.5
*) Includes revaluations of embedded derivatives.
Notes to the consolidated income statement
Cash flow statement for discontinued operations
€ million 2008 2007
Cash flow from operating activities 1.7 9.3
Cash flow from investing activities -3.0 16.0
Cash flow from financing activities -6.7 -23.8
Cash flow from discontinued operations -8.0 1.5
The cash flows do not include the contribution of business
disposals.
Disposal group 2008
In January 2008, Kesko Corporation sold K-Rahoitus Oy, one of
its wholly-owned subsidiaries. In the 2007 financial statements,
K-Rahoitus Oy's assets were reported in available-for-sale
assets and in liabilities relating to available-for-sale assets.
The transaction contributed a non-recurring gain of about €10.3
million.
Discontinued operations in 2007
In 2006, Kesko Food Ltd sold its 50% ownership interest in Rimi
Baltic AB. The properties included in the transaction were sold
in January 2007. The €28.2 million gain on the property disposal
was reported in the profit from discontinued operations.
Disposal group 2007
In December 2007, Kesko Corporation signed an agreement by
which it would sell the share capital of K-Rahoitus Oy, a sub-
sidiary wholly owned by it. K-Rahoitus Oy provided financing
services to business customers, mainly to professional custom-
ers of Kesko Agro, Konekesko and the agricultural retailers in
Finland, Estonia, Latvia and Lithuania. The company had 7
employees in Finland and 15 in the Baltic countries. The whole
personnel transferred to the new employer. The transaction was
concluded after clearance from the authorities during the first
part of 2008. When the deal was concluded, Kesko recognised a
non-recurring gain on the disposal of €10.3 million. K-Rahoitus
Oy's on-balance-sheet items were presented as assets held for
sale and liabilities relating to available-for-sale assets (note 26).

99Kesko financial statements 2008
note 9
Financial income and expenses
€ million 2008 2007
Financial income
Dividend income from available-for-sale
financial assets 0.1 0.1
Interest income from loans and
receivables 15.1 26.9
Interest income from financial assets
carried at fair value through profit or loss 6.3 4.1
Interest income from available-for-sale
financial assets 13.8 7.6
Interest income 35.3 38.6
Exchange differences and fair value changes
of derivative financial instruments and
currency-denominated loans and bank
accounts not qualified for hedge accounting 37.9 11.0
Gains from disposals of available-for-sale
financial assets 0.0 37.1
Total 73.3 86.9
Financial expenses
Interest expenses on financial liabilities
carried at amortised cost -30.5 -33.9
Exchange differences and fair value changes
of derivative financial instruments and
currency-denominated loans and bank
accounts not qualified for hedge accounting -40.3 -15.6
Other financial expenses -1.5 -1.2
Total -72.3 -50.8
Total financial income and expenses 1.0 36.1
The gains on disposal of available-for-sale financial assets for
the comparative year include a €37.1 million gain on the sale of
SATO shares.
Financial expenses include €5.8 (€10.8 million) in interest on
finance leases recognised as expenses for the period. Financial
income includes €2.5 million (€1.6 milion) in interest on finance
leases reported as income for the period.
The profit from the realised interest rate derivative instrument
used to hedge the USD-denominated private placement loan is
recognised in net terms in interest expenses with the loan
interest.
Exchange differences recognised in the income statement
€ million 2008 2007
Other income 3.8 2.0
Purchases and other expenses -0.7 -2.7
Financial income and expenses -3.0 -4.7
Total 0.1 -5.4
ment, and discontinuation costs of significant operating activi-
ties as non-recurring items. The gains on disposal are pre-
sented in the income statement in other operating income, and
the losses on disposal in other operating expenses.
In addition to the above, discontinued operations include
non-recurring gains on disposal in the amount of €39.5 milllion
(€28.5 million).
Impairment losses
During the period, a total amount of €61.1 million (€0.5million)
in impairment losses was recognised as an expense in the
income statement. An impairment charge of €45.6 million was
made on the consolidated goodwill and trademark of Rauta-
kesko's subsidiary, Byggmakker Norge. In addition, the non-
recurring expenses include an impairment charge of €15.5 mil-
lion on Anttila's logistics centre in Vantaa to be replaced in 2011
by a new logistics centre in Kerava.
Impairment losses or their reversals have not been recognised
directly in equity.
note 8
Staff cost, number of employees and management's salaries
Staff cost
€ million 2008 2007
Salaries and fees -496.6 -477.5
Social security costs -47.3 -46.2
Pension costs -28.8 -21.0
Defined benefit plans 20.5 26.5
Defined contribution plans -49.3 -47.5
Share options granted -5.5 -2.3
Total -578.2 -546.9
The employee benefits of the Group's management are dis-
closed in note 46. Related party transactions and information
concerning stock option plans are presented in note 37.
Salaries and fees of the Group companies' managing
directors and boards of directors
€ million 2008 2007
Salaries of managing directors
(incl. fringe benefits) 5,8 5,6
Fees of board members 0,3 0,3
Total 6,1 5,9
Average number of the Group employees 2008 2007
Kesko Food 5,939 5,964
Rautakesko 10,158 9,111
VV-Auto 744 737
Anttila 2,083 2,058
Kesko Agro 697 797
Other operating activities 1,470 1,577
Other entities 236 276
Total 21,327 20,520

100 Kesko financial statements 2008
note 11
Earnings per share
Basic earnings per share is calculated by dividing the net profit
attributable to the parent's equity holders by the weighted
average number of shares outstanding during the period.
Diluted earnings per share is calculated by adjusting the
weighted average number of all shares to assume conversion
of all potentially dilutive shares. The Group operates a share
option scheme with a dilutive effect, which increases the
number of shares. The share options have a dilutive effect
when their exercise price is lower than the fair value of a share.
The dilutive effect is the number of shares which has to be
issued without consideration, because the Group could not use
the assets received from the exercise of the share options to
issue an equal number of shares at fair value. The fair value of
a share is based on the average share price during the period.
2008 2007
Profit for the period attributable to
equity holders of the parent
Continuing operations, € million 178.2 248.4
Discontinued operations, € million 41.5 36.6
Kesko total, € million 219.7 285.0
Number of shares
Weighted average number of shares
outstanding 97,795,685 97,665,884
Effect of options granted 460,550 729,435
Diluted weighted average number
of shares outstanding 98,256,234 98,395,319
Earnings per share from profit
attributable to equity holders
of the parent
Continuing operations
Basic, € 1.82 2.54
Diluted, € 1.81 2.52
Discontinued operations
Basic, € 0.43 0.38
Diluted, € 0.43 0.38
Kesko total
Basic, € 2.25 2.92
Diluted, € 2.24 2.90
note 10
Income taxes
Income taxes in the income statement
€ million 2008 2007
Current tax -83.2 -75.4
Tax for prior periods 2.2 -7.6
Deferred taxes -8.4 -4.0
Total -89.4 -87.1
Reconciliation between tax expense recognised in the income statement
and tax calculated at domestic rate:
Profit before tax 288.5 358.1
Tax at parent's rate (26%) -75.0 -93.1
Effect of foreign subsidiaries' different tax
rates 3.4 5.0
Effect of income not subject to tax 9.8 12.8
Effect of expenses not deductible for tax
purposes -10.0 -11.0
Effect of tax losses -12.1 -0.7
Effect of consolidation and elimination -6.8 2.2
Taxes for prior periods 2.2 -7.5
Adjustment of prior period deferred taxes -3.9 2.4
Others 3.0 2.8
Taxes in the income statement -89.4 -87.1
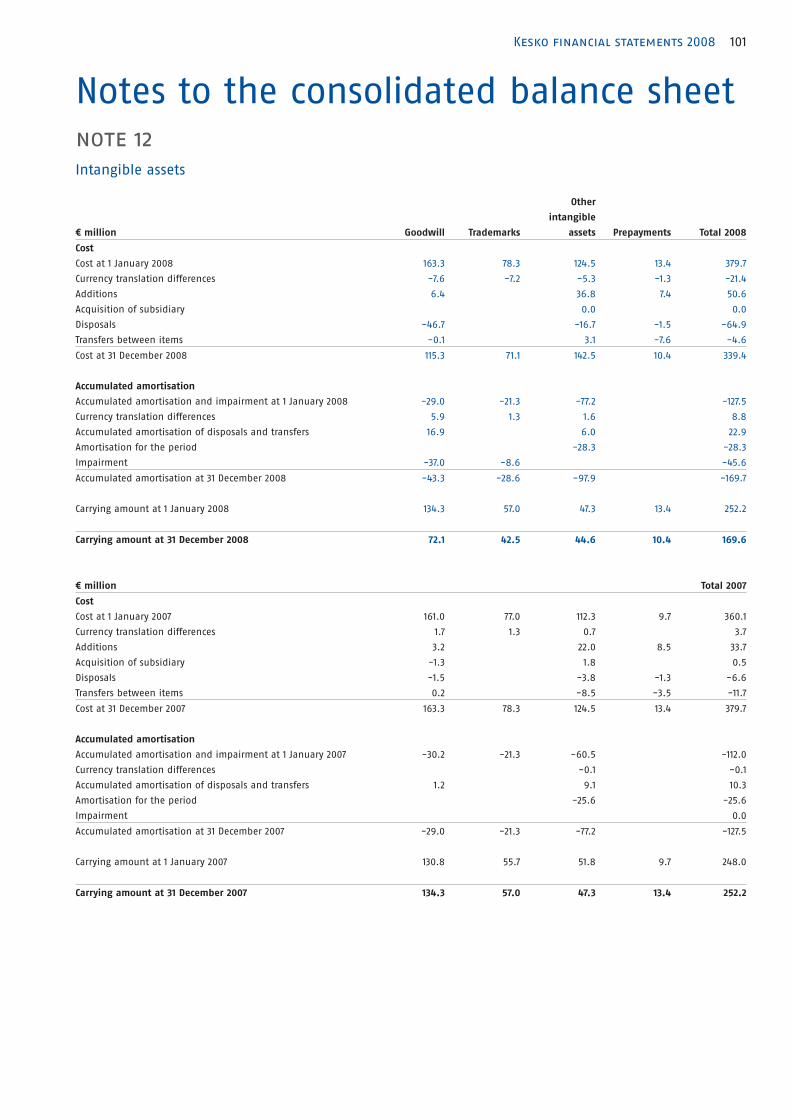
101Kesko financial statements 2008
note 12Intangible assets
€ million Goodwill Trademarks
Other
intangible
assets Prepayments Total 2008
Cost
Cost at 1 January 2008 163.3 78.3 124.5 13.4 379.7
Currency translation differences -7.6 -7.2 -5.3 -1.3 -21.4
Additions 6.4 36.8 7.4 50.6
Acquisition of subsidiary 0.0 0.0
Disposals -46.7 -16.7 -1.5 -64.9
Transfers between items -0.1 3.1 -7.6 -4.6
Cost at 31 December 2008 115.3 71.1 142.5 10.4 339.4
Accumulated amortisation
Accumulated amortisation and impairment at 1 January 2008 -29.0 -21.3 -77.2 -127.5
Currency translation differences 5.9 1.3 1.6 8.8
Accumulated amortisation of disposals and transfers 16.9 6.0 22.9
Amortisation for the period -28.3 -28.3
Impairment -37.0 -8.6 -45.6
Accumulated amortisation at 31 December 2008 -43.3 -28.6 -97.9 -169.7
Carrying amount at 1 January 2008 134.3 57.0 47.3 13.4 252.2
Carrying amount at 31 December 2008 72.1 42.5 44.6 10.4 169.6
€ million Total 2007
Cost
Cost at 1 January 2007 161.0 77.0 112.3 9.7 360.1
Currency translation differences 1.7 1.3 0.7 3.7
Additions 3.2 22.0 8.5 33.7
Acquisition of subsidiary -1.3 1.8 0.5
Disposals -1.5 -3.8 -1.3 -6.6
Transfers between items 0.2 -8.5 -3.5 -11.7
Cost at 31 December 2007 163.3 78.3 124.5 13.4 379.7
Accumulated amortisation
Accumulated amortisation and impairment at 1 January 2007 -30.2 -21.3 -60.5 -112.0
Currency translation differences -0.1 -0.1
Accumulated amortisation of disposals and transfers 1.2 9.1 10.3
Amortisation for the period -25.6 -25.6
Impairment 0.0
Accumulated amortisation at 31 December 2007 -29.0 -21.3 -77.2 -127.5
Carrying amount at 1 January 2007 130.8 55.7 51.8 9.7 248.0
Carrying amount at 31 December 2007 134.3 57.0 47.3 13.4 252.2
Notes to the consolidated balance sheet

102 Kesko financial statements 2008
The useful lives of trademarks (brands) included in intangible
assets have been classified as indefinite because it has been
estimated that they will affect the generation of cash flows over
an indefinite period. This is because no foreseeable limit to the
period over which they are expected to generate net cash
inflows for the Group can be seen. Trademarks are part of
assets purchased in connection with acquisitions.
Intangible assets with indefinite lives are tested annually for
possible impairment and whenever there is an indication of
impairment.
During the period, Byggsenteret, part of the Norwegian Bygg-
makker group, was sold, and the allocated goodwill was €9.5
million.
Impairment test for goodwill and intangible assets
The recoverable amount of a cash-generating unit is deter-
mined based on value-in-use calculations. These calculations
use cash flow projections based on financial plans approved by
the management covering a period of 3–4 years. The key
assumptions used for the plans are total market development
and profitability, changes in store network, product and service
selection and pricing. Cash flows beyond the period are extrap-
olated using mainly 1–4% growth rates. The discount rate used
is the WACC, specifed for each division and country after tax,
which is adjusted by tax effects in connection with the test. The
WACC formula inputs are risk-free rate of return, market risk
premium, industry-specific beta factor, target capital structure,
borrowing cost and country risks.
Impairment losses
For the 2008 accounting period, an impairment charge of €45.6
million was made against Byggmakker Norge's (Rautakesko)
intangible assets. Of this amount €37.0 million was allocated to
goodwill and €8.6 million to the trademark, with both amounts
reported as non-recurring items. The impairment loss was due
to weaker-than-expected profitability development. In addi-
tion, it was estimated that revenue expectations concerning
Byggmakker had declined. Byggmakker Norge constitutes a sep-
arate cash-generating unit and it belongs to the Rautakesko
segment.
During the 2007 accounting period, impairment was not allo-
cated to goodwill and trademarks with indefinite useful lives.
Sensitivity analysis
The key variables used in the impairment test are EBITDA per-
centage and discount rate.
The intangible assets relating to the business operations of
Byggmakker and Indoor are the most sensitive to changes in
assumptions. After the impairment recognised on Byggmakker
for 2008, the carrying amount of its assets equals the reassessed
recoverable amount. For Indoor, the reduction of residual EBITDA
of over 0.3%, as well as the 0.4 pp discount rate increase would
cause a need for impairment recognition.
When cash generating units are estimated according to the
management's assumptions, a foreseeable change in any key
variable would not create a situation in which the recoverable
amounts of cash generating units wold be less than their carry-
ing amounts.
Goodwill and intangible assets by segment
Intangible
assets * Goodwill
Discount rate
(WACC) **
Intangible
assets * Goodwill
Discount rate
(WACC) **
€ million 2008 2008 2008 2007 2007 2007
Rautakesko
Other Nordic countries 24.7 8.0% 39.2 48.9 7.5%
Baltic countries 18.3 11.0–12.5% 18.3 9.0–11.0%
Others 19.1 12.0% 14.0 12.0%
Anttila
Finland 23.4 7.0% 23.4 7.0%
Other operating activities
Finland 17.8 9.0 7.0% 17.8 28.2 7.0–7.5%
Others 3.3 1.5
Total 42.5 72.1 57.0 134.3
* intangible assets with indefinite useful lives ** after tax
Cash-generating units have mainly been identified at a level lower than business segments. The units have been identified by
chain/country, which susbstantially corresponds to the legal structure.

103Kesko financial statements 2008
note 13Tangible assets
€ million
Land and
waters Buildings
Machinery and
equipment
Other
tangible
assets
Prepayments
and purchases
in progress Total 2008
Cost
Cost at 1 January 2008 223.2 1,140.7 481.4 36.2 29.9 1,911.3
Currency translation differences -3.3 -4.1 -8.0 -1.1 -1.3 -17.8
Additions 54.4 69.5 97.9 7.1 70.6 299.5
Acquisition of subsidiary 2.6 9.6 0.0 12.2
Disposals -11.1 -174.7 -90.5 -4.0 -0.2 -280.5
Transfers between items 5.9 18.9 5.7 0.1 -16.5 14.1
Cost at 31 December 2008 271.7 1,059.9 486.5 38.3 82.4 1,938.8
Accumulated depreciation
Accumulated depreciation and impairment
at 1 January 2008 -3.7 -414.1 -326.3 -14.1 -758.2
Currency translation differences 0.0 1.1 4.2 0.5 5.8
Accumulated depreciation of disposals and
transfers 1.3 76.5 48.6 1.9 128.3
Depreciation for the period -37.6 -49.1 -3.1 -89.5
Impairment -15.5 -15.5
Accumulated depreciation at 31 December 2008 -2.4 -389.6 -322.6 -14.8 -729.3
Carrying amount at 1 January 2008 219.5 726.6 155.2 22.2 29.9 1,153.1
Carrying amount at 31 December 2008 269.3 670.3 164.0 23.6 82.4 1,209.5
Total 2007
Cost
Cost at 1 January 2007 212.7 1,079.4 465.8 25.7 25.1 1,808.6
Currency translation differences -0.8 -1.4 -0.6 -0.1 -0.2 -3.1
Additions 22.6 56.6 82.5 6.1 29.9 197.7
Acquisition of subsidiary 1.6 6.6 2.5 0.0 1.8 12.5
Disposals -7.7 -27.0 -67.7 -0.4 -1.2 -104.0
Transfers between items -5.2 26.3 -1.1 4.9 -25.5 -0.6
Cost at 31 December 2007 223.2 1,140.7 481.4 36.2 29.9 1,911.3
Accumulated depreciation
Accumulated depreciation and impairment
at 1 January 2007 -2.4 -376.8 -305.5 -9.0 -693.8
Currency translation differences 0.3 0.3 0.6
Accumulated depreciation of disposals and
transfers -1.3 3.8 28.4 -2.4 28.5
Depreciation for the period -41.4 -48.9 -2.7 -92.8
Impairment -0.5 -0.5
Accumulated depreciation at 31 December 2007 -3.7 -414.1 -326.3 -14.1 -758.2
Carrying amount at 1 January 2008 210.3 702.6 160.3 16.7 25.1 1,114.7
Carrying amount at 31 December 2007 219.5 726.5 155.1 22.1 29.9 1,153.1

104 Kesko financial statements 2008
Tangible assets include assets leased under finance leases as follows:
€ million Buildings
Machinery and
equipment
Other
tangible assets Total
2008
Cost 38.7 47.6 0.1 86.4
Accumulated depreciation -23.7 -36.4 -0.1 -60.2
Carrying amount 15.0 11.2 0.0 26.2
2007
Cost 150.8 69.8 0.1 220.7
Accumulated depreciation -67.0 -42.0 -0.1 -109.1
Carrying amount 83.8 27.8 0.0 111.6
note 14
Interests in associates
€ million 2008 2007
Carrying amount at 1 Jan. 27.0 25.5
Share of income for the period 1.9 0.4
Additions 2.4 2.2
Disposals -0.1 -1.1
Carrying amount at 31 Dec. 31.2 27.0
Price quotations of associates have not been published.
The Group's associates, their aggregate assets, liabilities, net sales and profits/losses
€ million Assets Liabilities Net sales Profit/loss
Ownership
interest, %
2008
Valluga-sijoitus Oy, Helsinki 34.5 2.3 0.7 9.1 39.0
Vähittäiskaupan Takaus Oy, Helsinki 52.9 0.2 1.1 2.2 34.4
Vähittäiskaupan Tilipalvelu VTP Oy, Helsinki 3.4 2.2 10.0 -0.3 30.0
Others 4.6 3.2 0.5 0.0
Total 95.3 7.9 12.3 11.0
2007
Valluga-sijoitus Oy, Helsinki 23.2 0.1 1.0 0.7 39.0
Vähittäiskaupan Takaus Oy, Helsinki 50.8 0.2 1.1 3.9 34.4
Vähittäiskaupan Tilipalvelu VTP Oy, Helsinki 3.7 2.7 9.3 0.1 30.0
Others 3.9 2.2 3.0 -0.1
Total 81.6 5.2 14.4 4.6

105Kesko financial statements 2008
note 15
Long-term available-for-sale financial assets
€ million 2008 2007
Carrying amount at 1 January 4.0 12.0
Additions 0.0 1.2
Disposals -1.0 -9.2
Carrying amount at 31 December 3.0 4.0
The available-for-sale financial assets include unquoted shares primarily measured at cost because their fair values cannot be
reliably measured.
In 2007, €37.1 million of gains on disposal of available-for-sale financial assets were recognised in financial items.
note 16
Long-term receivables
€ million 2008 2007
Non-interest-bearing long-term receivables 10.9 8.8
Finance lease receivables 51.3 27.0
Loan receivables from associates 1.5 0.9
Other long-term receivables 5.5 0.2
Total 69.2 36.9
The non-interest-bearing long-term receivables include €10.3 million in derivative value changes, the balance sheet value of which
corresponds to their fair values. The fair values of finance lease receivables cannot be reliably measured.
Maturities of long-term receivables at 31 Dec. 2008
€ million 2010 2011 2012 2013 2014- Total
Non-interest-bearing long-term receivables 0.6 10.3 10.9
Finance lease receivables 12.6 10.7 8.3 6.8 12.8 51.3
Loan receivables from associates 1.5 1.5
Other long-term receivables 0.9 1.0 1.0 0.9 1.6 5.5
Total 14.1 11.8 9.3 7.7 26.2 69.2

106 Kesko financial statements 2008
note 17
Finance lease receivables
€ million 2008 2007
Finance lease receivables fall due as follows:
Not later than one year 15.9 8.9
Later than one year and not later than five years 44.0 25.5
Later than five years 13.5 4.2
Gross investment in finance leases 73.5 38.6
Present value of minimum lease receivables:
Not later than one year 13.1 7.4
Later than one year and not later than five years 38.5 23.0
Later than five years 12.8 4.0
Finance lease receivables 64.3 34.4
Unearned financial income 9.1 4.2
The finance lease receivables comprise store fixtures leased by Kesko Food Ltd from finance companies and subleased to chain com-
panies. During the lease term, the lease item is used as collateral. After the actual lease term, the lessee may extend the lease over
low-cost extension periods. The agreement with the finance company includes a lease limit of €100 million. The lease terms are
3–8 years.
note 18
Deferred taxes
Changes in deferred taxes during 2008
€ million 31 Dec. 2007
Charged/
credited
to the income
statement
Charged
to equity
Exchange rate
differences
Subsidiaries
acquired/
disposed of 31 Dec. 2008
Deferred tax assets
Margin included in inventories 2.2 -1.2 0.0 0.0 1.0
Finance lease assets 5.5 -5.3 0.0 0.0 0.2
Provisions 6.2 2.8 -0.1 9.1
Pensions 1.0 0.0 0.0 -0.1 0.9
Confirmed losses 3.9 -0.8 -0.4 0.0 2.8
Others 19.3 0.4 2.6 -0.6 -1.0 20.7
Total 38.0 -4.1 2.6 -1.0 -1.2 34.5
Deferred tax liabilities
Accumulated depreciation differences 55.3 -5.0 0.0 -0.9 49.5
Changes in Group composition 21.6 -1.8 -2.4 5.5 22.9
Pensions 68.1 10.8 0.1 79.0
Others 11.0 0.1 -0.2 -0.1 -2.3 8.5
Total 156.0 4.1 -0.2 -2.5 2.4 159.9
Net deferred tax liability 117.8 125.5

107Kesko financial statements 2008
Balance sheet division:
€ million 2008 2007
Deferred tax assets 6.5 7.7
Deferred tax liabilities 132.0 125.5
The 'Others' group of deferred tax assets includes, e.g. timing differences relating to depreciation, deferred tax assets resulting from
individual Group companies' application of the Group's accounting principles, and during the comparative period, also deferred tax
assets recognised on the amortisation of gains on sale and leaseback transactions. The finance lease properties governed by the
sale and leaseback contract were sold during the 2008 accounting period.
Changes in deferred taxes during 2007
€ million 31 Dec. 2006
Charged/
credited
to the income
statement
Charged
to equity
Exchange rate
differences
Subsidiaries
acquired/
disposed of 31 Dec. 2007
Deferred tax assets
Margin included in inventories 2.3 -0.1 2.2
Finance lease assets 5.2 0.3 5.5
Provisions 5.9 0.3 6.2
Pensions 1.6 -0.6 1.0
Confirmed losses 3.3 0.8 -0.1 -0.1 3.9
Others 16.7 3.1 -0.5 19.3
Total 34.9 3.8 -0.5 -0.1 -0.1 38.0
Deferred tax liabilities
Accumulated depreciation differences 57.3 -1.7 -0.3 55.3
Change in Group composition 21.5 -2.0 0.5 1.6 21.6
Pensions 57.1 11.1 -0.1 68.1
Others 6.1 1.2 3.1 0.5 11.0
Total 142.0 8.6 3.1 0.5 1.7 156.0
Net deferred tax liability 107.1 118.0
Balance sheet division:
€ million 2007 2006
Deferred tax assets 7.7 5.8
Deferred tax liabilities 125.5 112.8
At 31 December 2008, the Group had €26.0 million of carryforward of unused tax losses not recognised as deferred tax assets,
because it is probable that the Group will not be able to accumulate an equivalent taxable profit against which the losses could be
used.
Carryforward of unused tax losses not
recognised as deferred tax assets expire as
follows: 2009 2010 2011 2012 2013 2014- Total
1.0 2.4 0.9 2.4 0.1 19.2 26.0
The consolidated financial statements do not recognise deferred tax liabilities for the undistributed earnings of subsidiaries,
because their profit distributions are at the discretion of the Group, and resulting in a tax effect a distribution of profits is not
probable in the near future.

108 Kesko financial statements 2008
note 19
Pension assetsThe Group operates several retirement plans. In Finland, employees' pension insurance is partly arranged with insurance companies
and partly with the Kesko Pension Fund, whose department A granting additional benefits was closed on 9 May 1998. The pension
plan arranged with the Kesko Pension Fund is classified as a defined benefit plan.
As regards foreign subsidiaries, the plan adopted in the Norwegian subsidiary is the only pension plan classified as a defined
benefit plan. The nature of the pension plan in Norway and Norwegian legislation have changed during the 2008 accounting period
to the effect that a significant number of the company's employees have transferred from the defined benefit plan. At 31 December
2008, the net debt relating to the defined benefit plan in Norway was €0.5 million (€2.9 million).
Pension plans in other foreign subsidiaries are arranged in accordance with local regulations and practices. They do not contain
significant defined benefit plans.
The defined benefit liability recognised in the balance sheet in respect of the Kesko Pension Fund is determined as follows:
€ million 2008 2007
Present value of funded obligations -530.4 -560.6
Fair value of assets 819.5 897.0
Deficit/surplus 289.1 336.4
Unrecognised actuarial gains (-)/losses (+) 11.1 -74.3
Net assets (+) / liabilities (-) recognised in the balance sheet 300.3 262.1
Changes in the present value of obligation
Plan obligation at 1 Jan. 560.6 440.9
Current service cost 15.1 12.0
Interest cost 28.8 24.8
Benefits paid -27.2 -26.7
Actuarial gains (-)/losses (+) -47.0 68.5
Others 41.1
Plan obligation at 31 December 530.4 560.6
Fair value changes of the plan assets
Plan assets at 1 January 897.0 794.8
Expected return on plan assets 63.2 56.2
Contributions to plan 17.8 16.1
Benefits paid -27.3 -26.7
Actuarial gains (+)/(losses (-) -131.2 11.8
Others 44.8
Plan assets at 31 December 819.5 897.0
Expense recognised in the income statement
Current service cost -15.1 -12.0
Interest cost -28.8 -24.8
Expected return on plan assets 63.2 56.2
Change 3.8
Actuarial gains (+) and losses (-) 1.2 3.3
Total expense recognised in the income statement 20.5 26.5
Change in net assets recognised in the balance sheet
Beginning of the period 262.1 219.5
Income/expenses recognised in the income statement 20.5 26.5
Contributions to plan 17.8 16.1
End of the period 300.3 262.1

109Kesko financial statements 2008
note 20
Inventories
€ million 2008 2007
Goods 864.2 913.7
Prepayments 6.9 8.6
Total 871.0 922.3
At the end of the period, inventories have
been written down to correspond to their
net realisable value 46.6 29.5
note 21
Trade receivables and other short-term non-interest-bearing receivables
€ million 2008 2007
Trade receivables 633.1 682.1
Other non-interest-bearing receivables
Non-interest-bearing loan and other
receivables 27.3 26.8
Deferred revenue and other accruals 110.1 114.9
Total other non-interest-bearing
receivables 137.4 141.7
Total short-term non-interest-bearing
receivables 770.5 823.8
Finland 2008 2007 2006 2005 2004
Present value of plan obligation -530.4 -560.6 -440.9 -426.8 -420.6
Fair value of plan assets 819.5 897.0 794.8 628.7 608.2
Surplus/deficit 289.1 336.4 353.9 201.8 187.5
Experience adjustments on plan assets -130.9 11.5 113.1 41.6
Experience adjustments on plan liabilities -15.6 23.2 4.8 5.9
The actual return on plan assets (Finland) was €-71.6 million (€68.0 million).
In 2009, the Group expects to pay €52.5 million in contributions to defined benefit plans.
Analysis of plan assets by group of assets, % of fair values of plan assets 2008 2007
Real estate 39.7% 34.7%
Shares 19.4% 33.6%
Long-term interest investments 20.6% 17.6%
Short-term interest investments 18.5% 8.8%
Alternative investments 1.8% 5.3%
Total 100.0% 100.0%
Plan assets, € million
Kesko Corporation shares included in fair value 93.5 130.2
Real estate leased and primarily subleased to retailers
by the Kesko Group, included in fair value 359.5 341.5
Principal actuarial assumptions used: 2008 2007
Discount rate 5.25% 5.00%
Expected return on plan assets 6.60% 6.60%
Future salary increase assumption 3.50% 3.50%
Inflation 2.00% 2.00%
Expected average remaining service life, years 15–20 15–20
In calculating the IAS 19 pension obligation of the Kesko Pension Fund's department B, the funded amounts of retirement pensions
have only been increased by the fund interest rate (3%) for 2008 and 2009.
In calculating the Pension Fund's expected income, the invested assets are divided into five categories. The total expected income
from the investment portfolio (6.6%) is composed of the combined income from these assets. The income expected from different
assets is based on the parameters of an investment portfolio analysis model widely used in employee pension schemes, and calcu-
lated from long-term historical data. The most significant type of assets affecting the total income is shares, further divided into
nine geographical subgroups with expected income ranging between 8.5%–12.3%.
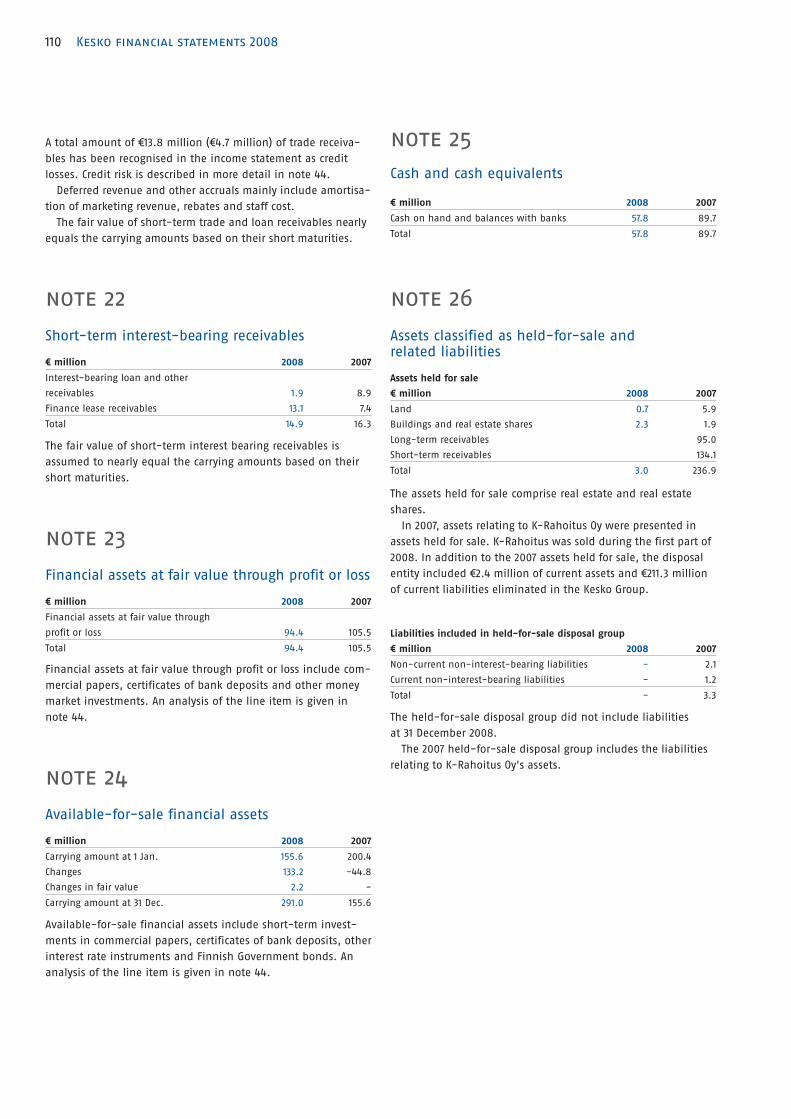
110 Kesko financial statements 2008
A total amount of €13.8 million (€4.7 million) of trade receiva-
bles has been recognised in the income statement as credit
losses. Credit risk is described in more detail in note 44.
Deferred revenue and other accruals mainly include amortisa-
tion of marketing revenue, rebates and staff cost.
The fair value of short-term trade and loan receivables nearly
equals the carrying amounts based on their short maturities.
note 22
Short-term interest-bearing receivables
€ million 2008 2007
Interest-bearing loan and other
receivables 1.9 8.9
Finance lease receivables 13.1 7.4
Total 14.9 16.3
The fair value of short-term interest bearing receivables is
assumed to nearly equal the carrying amounts based on their
short maturities.
note 23
Financial assets at fair value through profit or loss
€ million 2008 2007
Financial assets at fair value through
profit or loss 94.4 105.5
Total 94.4 105.5
Financial assets at fair value through profit or loss include com-
mercial papers, certificates of bank deposits and other money
market investments. An analysis of the line item is given in
note 44.
note 24
Available-for-sale financial assets
€ million 2008 2007
Carrying amount at 1 Jan. 155.6 200.4
Changes 133.2 -44.8
Changes in fair value 2.2 -
Carrying amount at 31 Dec. 291.0 155.6
Available-for-sale financial assets include short-term invest-
ments in commercial papers, certificates of bank deposits, other
interest rate instruments and Finnish Government bonds. An
analysis of the line item is given in note 44.
note 25
Cash and cash equivalents
€ million 2008 2007
Cash on hand and balances with banks 57.8 89.7
Total 57.8 89.7
note 26
Assets classified as held-for-sale and related liabilities
Assets held for sale
€ million 2008 2007
Land 0.7 5.9
Buildings and real estate shares 2.3 1.9
Long-term receivables 95.0
Short-term receivables 134.1
Total 3.0 236.9
The assets held for sale comprise real estate and real estate
shares.
In 2007, assets relating to K-Rahoitus Oy were presented in
assets held for sale. K-Rahoitus was sold during the first part of
2008. In addition to the 2007 assets held for sale, the disposal
entity included €2.4 million of current assets and €211.3 million
of current liabilities eliminated in the Kesko Group.
Liabilities included in held-for-sale disposal group
€ million 2008 2007
Non-current non-interest-bearing liabilities - 2.1
Current non-interest-bearing liabilities - 1.2
Total - 3.3
The held-for-sale disposal group did not include liabilities
at 31 December 2008.
The 2007 held-for-sale disposal group includes the liabilities
relating to K-Rahoitus Oy's assets.

111Kesko financial statements 2008
note 27
Notes relating to equity
Changes in share capital Share
capital
€ million
Share
premium
€ million
Total
€ million
Number of shares
Share capital A B Total
At 1 January 2007 31,737,007 65,782,918 97,519,925 195.0 195.9 390.9
Exercise of share options - 247,840 247,840 0.5 4.4 4.9
At 31 December 2007 31,737,007 66,030,758 97,767,765 195.5 200.3 395.8
Exercise of share options - 57,089 57,089 0.1 5.5 5.6
At 31 December 2008 31,737,007 66,087,847 97,824,854 195.6 205.8 401.4
Number of votes 317,370,070 66,087,847 383,957,917
During the reporting period, the share capital was increased seven times as a result of share subscriptions with the stock options
of the year 2003 option scheme. The increases were made on 11 February 2008 (€210), 28 April 2008 (€38,168), 9 June 2008 (€42,200),
28 July 2008 (€8,600), 1 October 2008 (€4,000), 27 October 2008 (€6,000) and 18 December 2008 (€15,000), and announced in stock
exchange notifications on the same days. The subscribed shares were included on the main list of the Helsinki Stock Exchange for
public trading with the old B shares on 12 February 2008, 29 April 2008, 10 June 2008, 29 July 2008, 2 October 2008, 28 October
2008, and 19 December 2008.
All issued shares have been fully paid. The maximum number of A shares is 250 million and the maximum number of B shares is
also 250 million, provided that the total number of shares is at maximum 400 million. One A share entitles the holder to 10 votes
and one B share to 1 vote.
An analysis of share-based payments is given in note 37.
Dividends
After the balance sheet date, the Board has proposed that €1.00 per share be distributed as dividends.
Equity and reserves
Restricted and non-restricted equity
Restricted equity is made up of share capital and share premium, and non-restricted equity is made up of other reserves, asset
revaluation reserve and retained earnings. Non-restricted equity also includes the accumulated depreciation difference and
untaxed reserves less deferred tax liabilities.
Share premium
The amount exceeding the par value of shares received by the enterprise in connection with share subscription, and in some cases
amounts not withdrawn from the sale of unregistered shares are recognised in the share premium account. The share premium
includes the premium received on exercise of share options.
Other reserves
The other reserves have mainly been created and accumulated as a result of resolutions by the Annual General Meeting.
Revaluation surplus
The revaluation surplus includes the effective portion of fair value based on hedge accounting applied to electricity derivatives and
a private placement bond, and the fair value change of available-for-sale financial instruments.
Currency translation differences
Currency translation differences arise from the consolidation of the results of foreign operations. Also gains and losses arising from
net investment hedges in foreign entities are included in currency translation differences provided that hedge accounting require-
ments are fulfilled.

112 Kesko financial statements 2008
Cash flow hedge result
Hedge accounting is applied to hedging exposure to electricity price risk. As a result, an amount of €5.4 million (€-2.2 million) has
been removed from equity and included in the income statement as purchase cost adjustment, and correspondingly €-12.5 million
(€4.9 million) has been included in equity. Their combined effect on the revaluation surplus for the period was €-17.9 million
(€7.1 million) prior to deferred tax assets recognition.
A fair value change of €5.1 million (€6.6 million) has been recognised in equity for the USD-denominated private placement
arrangement, and €-0.1 million (€-0.1 million) in the financial items of the income statement.
note 28
Maturities of interest-bearing liabilities
€ million
At 31 Dec.
2008 Available Total 2009 2010 2011 2012
2013
and later
Loans from financial institutions 47.1 47.1 20.2 0.8 1.0 0.8 24.3
Private placement bonds (USD) 100.0 100.0 100.0
Pension loans 0.0 0.0
Finance lease liabilities 92.7 92.7 22.7 11.8 23.4 10.8 24.0
Debt to K-retailers 114.1 114.1 114.1
Other interest-bearing liabilities 88.9 88.9 88.9
Binding credit limits * 246.5 247.7 75.0 21.5 150.0
Commercial papers 47.7 401.3 449.0 47.7
Total 490.5 647.8 1,139.6 293.6 87.6 45.9 161.6 148.3
* The amount withdrawn from binding credit limits is included in loans from financial institutions.
€ million
At 31 Dec.
2007 Available Total 2008 2009 2010 2011
2012
and later
Loans from financial institutions 67.8 67.8 2.8 33.8 0.6 0.9 29.7
Private placement bonds (USD) 99.9 99.9 99.9
Pension loans 2.8 2.8 0.8 0.8 0.8 0.4
Finance lease liabilities 166.1 166.1 18.8 24.2 16.5 26.8 79.8
Debt to K-retailers 122.2 122.2 122.2
Other interest-bearing liabilities 68.5 68.5 68.5
Binding credit limits 225.0 225.0 75.0 150.0
Commercial papers 98.1 443.6 541.7 98.1
Total 625.4 668.7 1,294.0 311.2 58.8 92.9 28.1 359.4
Debt to K-retailers consist of two types of interest-bearing receivables payable by the Kesko Group companies to K-retailers: retail-
ers' prepayments to Kesko and retailers' chain rebates. Chain rebates are subsequent discounts given to retailers and the terms vary
from one chain to another. The private placement bonds include the fair value change of currency derivative instruments.
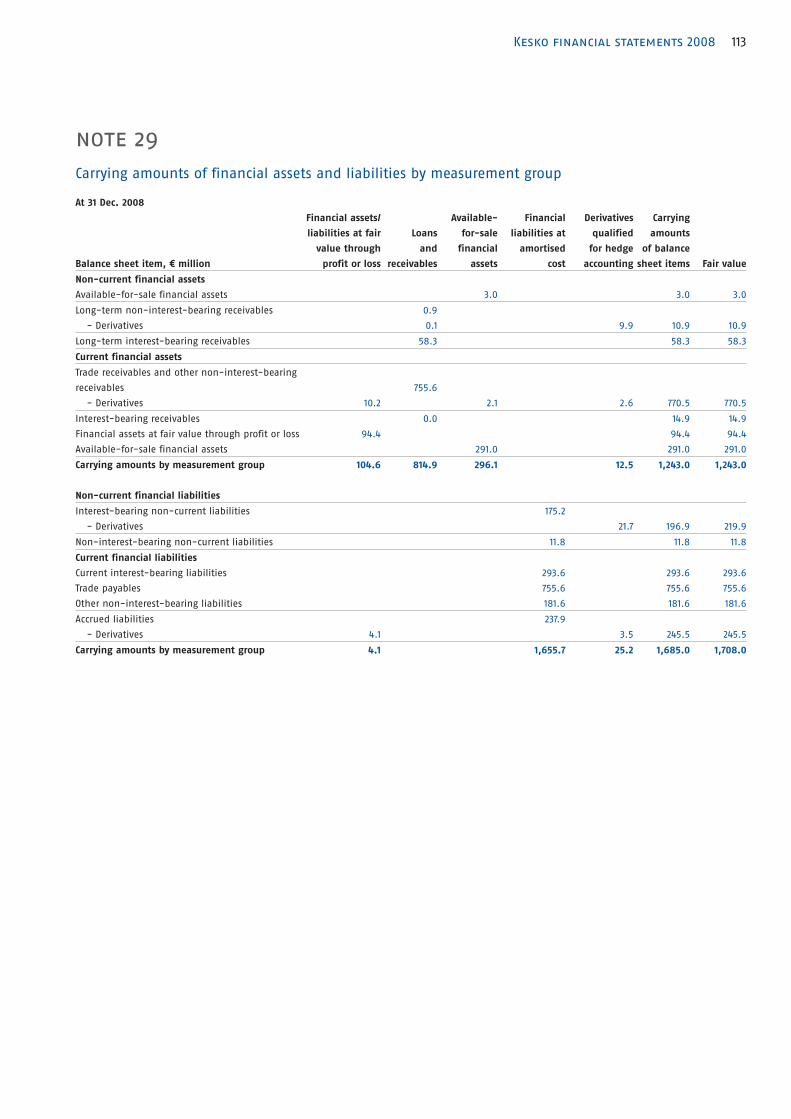
113Kesko financial statements 2008
note 29
Carrying amounts of financial assets and liabilities by measurement group
At 31 Dec. 2008
Balance sheet item, € million
Financial assets/
liabilities at fair
value through
profit or loss
Loans
and
receivables
Available-
for-sale
financial
assets
Financial
liabilities at
amortised
cost
Derivatives
qualified
for hedge
accounting
Carrying
amounts
of balance
sheet items Fair value
Non-current financial assets
Available-for-sale financial assets 3.0 3.0 3.0
Long-term non-interest-bearing receivables 0.9
- Derivatives 0.1 9.9 10.9 10.9
Long-term interest-bearing receivables 58.3 58.3 58.3
Current financial assets
Trade receivables and other non-interest-bearing
receivables 755.6
- Derivatives 10.2 2.1 2.6 770.5 770.5
Interest-bearing receivables 0.0 14.9 14.9
Financial assets at fair value through profit or loss 94.4 94.4 94.4
Available-for-sale financial assets 291.0 291.0 291.0
Carrying amounts by measurement group 104.6 814.9 296.1 12.5 1,243.0 1,243.0
Non-current financial liabilities
Interest-bearing non-current liabilities 175.2
- Derivatives 21.7 196.9 219.9
Non-interest-bearing non-current liabilities 11.8 11.8 11.8
Current financial liabilities
Current interest-bearing liabilities 293.6 293.6 293.6
Trade payables 755.6 755.6 755.6
Other non-interest-bearing liabilities 181.6 181.6 181.6
Accrued liabilities 237.9
- Derivatives 4.1 3.5 245.5 245.5
Carrying amounts by measurement group 4.1 1,655.7 25.2 1,685.0 1,708.0

114 Kesko financial statements 2008
At 31 Dec. 2007
Balance sheet item, € million
Financial assets/
liabilities at fair
value through
profit or loss
Loans
and
receivables
Available-
for-sale
financial
assets
Financial
liabilities
at amortised
cost
Derivatives
qualified
for hedge
accounting
Carrying
amounts of
balance
sheet items Fair value
Non-current financial assets
Available-for-sale financial assets 4.0 4.0 4.0
Long-term non-interest-bearing receivables 0.8
- Derivatives 8.0 8.8 8.8
Long-term interest-bearing receivables 28.1 28.1 28.1
Current financial assets
Trade receivables and other non-interest-bearing
receivables 817.4
- Derivatives 1.4 4.9 823.7 823.7
Interest-bearing receivables 16.4 16.4 16.4
Financial assets at fair value through profit or loss 105.5 105.5 105.5
Available-for-sale financial assets 155.6 155.6 155.6
Carrying amounts by measurement group 106.9 862.7 159.6 12.9 1,142.1 1,142.1
Non-current financial liabilities
Interest-bearing non-current liabilities 295.3
- Derivatives 18.9 314.2 324.1
Non-interest-bearing non-current liabilities 11.5 11.5 11.5
Current financial liabilities
Current interest-bearing liabilities 311.2 311.2 311.2
Trade payables 837.8 837.8 837.8
Other non-interest-bearing liabilities 191.6 191.6 191.6
Accrued liabilities 275.5
- Derivatives 1.5 0.2 277.2 277.2
Carrying amounts by measurement group 1.5 1,922.9 19.1 1,943.5 1,953.4
The fair values of loans have been calculated based on the present value of future cash flows using the 2.2%–6.1% market rates of
interest at the balance sheet date. The fair value of current interest-bearing liabilities is estimated to nearly equal their balance
sheet value.
The maturity schedule of long-term loans is presented in note 28.

115Kesko financial statements 2008
note 30
Finance lease liabilities
€ million 2008 2007
The maturities of finance lease payments are as follows:
Not later than 1 year 27.2 27.8
Later than 1 year and not later than 5 years 64.0 103.4
Later than 5 years 14.1 86.1
Total minimum lease payments 105.3 217.3
Present values of minimum lease payments:
Not later than 1 year 22.6 18.8
Later than 1 year and not later than 5 years 56.6 78.8
Later than 5 years 13.4 68.5
Total finance lease liabilities 92.7 166.1
Accumulating financial expenses 12.6 51.2
Contingent rents recognised for the period 1.5 1.5
Expected sublease rentals 64.4 33.2
Finance lease liabilities relate to real estate, machinery and equipment leases. The Kesko Group has leased large retail outlets
under long-term leases. Most of the lease payments are tied to interest rates and property leases include a call option.
note 31
Provisions
€ million Onerous leases
Warranty
provisions Other provisions Total
Provisions at 1 Jan. 2008 9.0 12.9 16.6 38.4
Exchange rate effects -0.5 0.0 -0.1 -0.6
Additional provisions 8.8 3.3 13.3 25.4
Unused amounts reversed -1.2 -0.2 -14.3 -15.7
Business arrangements -0.1 -0.3 -0.4
Expensed in income statement 16.1 15.9 15.2 47.1
Used amounts -2.0 -0.4 -1.1 -3.5
Provisions at 31 Dec. 2008 14.1 15.5 14.1 43.6
Analysis of total provisions
Non-current 6.7 9.5 3.9 20.1
Current 7.4 6.0 10.2 23.5
Provisions for onerous leases mainly relate to lease liabilities of premises vacated from the Group operations, and to net losses
on rent of subleased premises. Warranty provisions have been recorded for vehicles and machines sold by the Group companies.
The provision amount is based on experience from realised warranty obligations in previous years. Other provisions mainly relate
to pensions and residual taxes.

116 Kesko financial statements 2008
note 32
Trade payables and other current non-interest-bearing liabilities
€ million 2008 2007
Trade payables 755.6 837.8
Other current non-interest-bearing liabilities 181.6 191.6
Tax liabilities 2.9 13.4
Accrued liabilities 245.5 277.2
Total current non-interest-bearing liabilities 1,185.7 1,320.0
Accrued liabilities are mainly due to the timing of purchases and staff costs.
note 33
Major subsidiaries owned directly by parent
Name
State of
registration
Ownership
interest, %
Voting
power, %
Anttila Oy Finland 100.0 100.0
Indoor Group Ltd Finland 100.0 100.0
Intersport Finland Ltd Finland 100.0 100.0
Kenkäkesko Ltd Finland 100.0 100.0
Keslog Ltd * Finland 45.1 100.0
Kesko Agro Ltd Finland 100.0 100.0
Musta Pörssi Ltd Finland 100.0 100.0
Kesko Food Ltd Finland 100.0 100.0
Rautakesko Ltd Finland 100.0 100.0
VV-Auto Group Oy Finland 100.0 100.0
* The Group's ownership interest is 100%
A complete analysis of Group companies is included in note 50.
note 34
Jointly controlled assets
Jointly controlled assets (mutual real estate companies)
These figures represent the Group's share of jointly controlled
assets and liabilities and income and profit included in the
consolidated balance sheet and income statement.
€ million 2008 2007
Non-current assets 62.4 73.6
Current assets 3.0 4.2
65.5 77.8
Non-current liabilities 21.0 25.0
Current liabilities 11.7 10.5
32.7 35.5
Net assets 32.8 42.3
Income 7.7 10.0
Expenses 7.7 9.2
Profit 0.0 0.8

117Kesko financial statements 2008
note 35
Contingent liabilities
Commitments
€ million 2008 2007
Collateral given for own commitments
Pledges 40 38
Mortgages 17 26
Guarantees 93 101
Other commitments and
contingent liabilities 55 50
Collateral given for shareholders
Guarantees 0 1
Collateral given for others
Other commitments and contingent
liabilities 8 6
Guarantees 0 3
note 36
Operating leases
Group as the lessee
Minimum lease payments under non-cancellable
operating lease agreements:
€ million 2008 2007
Not later than 1 year 322.5 285.3
Later than 1 year and not later than 5
years 955.0 830.5
Later than 5 years 823.7 675.8
Total 2,101.1 1,791.5
Expected future minimum lease payments
under non-cancellable sublease
agreements 61.5 46.4
Lease and sublease payments recognised
for the period:
Minimum lease expenses 305.3 262.6
Contingent lease expenses 0.7 0.3
Sublease payments (-income/+expense) -21.8 -16.4
The 2008 income statement includes net rent and maintenance
rent payments in a total amount of €349.9 million (€313.4
million).
Kesko leases retail and logistics premises for its operating
activities. Most of the leases are index-linked and in conformity
with local market practice.
Group as the lessor
Minimum lease payments based on non-cancellable operating leases:
€ million 2008 2007
Not later than 1 year 8.8 8.9
Later than 1 year and not later than 5 years 15.2 15.1
Later than 5 years 13.1 20.0
Total 37.1 44.1
Aggregate contingent rents charged
to the income statement 0.1 0.7
Kesko leases premises to entrepreneurs other than K-retailers in
order that the total service offer of a store site support its profit
generation potential. Such premises typically include so-called
store entrance stores at large retail outlets.
note 37
Share-based payments
The Group operates option plans as part of the management's
incentive and commitment arrangements. Each option gives its
holder the right to subscribe for one Kesko Corporation B share
at a price and during the period specified in the terms of the
option scheme. The options are forfeit if the employee leaves
the company before the end of the vesting period, unless, in
an individual case, the Board decides that the option recipient
may keep all or some of the options under offering obligation.
Year 2003 option plan
On 31 March 2003, the Annual General Meeting resolved to grant
a total of 1,800,000 options with no consideration to the man-
agement of the Kesko Group as well as to a wholly-owned sub-
sidiary of Kesko Corporation. A deviation was made from the
shareholders' pre-emptive subscription rights, since the share
options form a part of the incentive and commitment pro-
gramme for the management. Each option entitles its holder to
subscribe for one new Kesko Corporation B share. The options
are marked with the symbols 2003D (KESBVEW103), 2003E
(KESBVEW203) and 2003F (KESBVEW303) in units of 600,000
options each. The share subscription periods of options are:
2003D 1 April 2005–30 April 2008 (subscription period •
has expired)
2003E 1 April 2006–30 April 2009 and•
2003F 1 April 2007–30 April 2010.•
The original exercise price per share of option 2003D was equal
to the volume weighted average price of a Kesko Corporation
B share on the Helsinki Stock Exchange between 1 April-30 April
2003 (€9.63), that of option 2003E between 1 April-30 April 2004
(€15.19) and that of option 2003F between 1 April-30 April 2005
(€19.08). From the share subscription price of share options
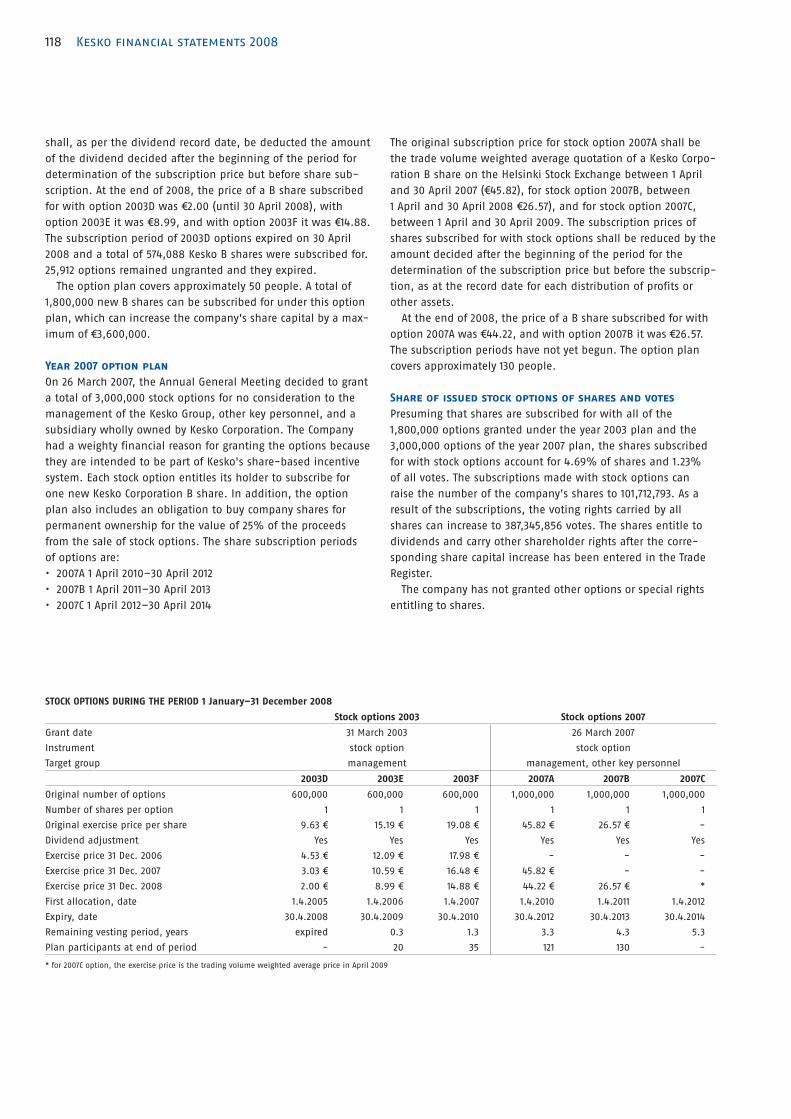
118 Kesko financial statements 2008
shall, as per the dividend record date, be deducted the amount
of the dividend decided after the beginning of the period for
determination of the subscription price but before share sub-
scription. At the end of 2008, the price of a B share subscribed
for with option 2003D was €2.00 (until 30 April 2008), with
option 2003E it was €8.99, and with option 2003F it was €14.88.
The subscription period of 2003D options expired on 30 April
2008 and a total of 574,088 Kesko B shares were subscribed for.
25,912 options remained ungranted and they expired.
The option plan covers approximately 50 people. A total of
1,800,000 new B shares can be subscribed for under this option
plan, which can increase the company's share capital by a max-
imum of €3,600,000.
Year 2007 option plan
On 26 March 2007, the Annual General Meeting decided to grant
a total of 3,000,000 stock options for no consideration to the
management of the Kesko Group, other key personnel, and a
subsidiary wholly owned by Kesko Corporation. The Company
had a weighty financial reason for granting the options because
they are intended to be part of Kesko's share-based incentive
system. Each stock option entitles its holder to subscribe for
one new Kesko Corporation B share. In addition, the option
plan also includes an obligation to buy company shares for
permanent ownership for the value of 25% of the proceeds
from the sale of stock options. The share subscription periods
of options are:
2007A 1 April 2010–30 April 2012•
2007B 1 April 2011–30 April 2013•
2007C 1 April 2012–30 April 2014•
The original subscription price for stock option 2007A shall be
the trade volume weighted average quotation of a Kesko Corpo-
ration B share on the Helsinki Stock Exchange between 1 April
and 30 April 2007 (€45.82), for stock option 2007B, between
1 April and 30 April 2008 €26.57), and for stock option 2007C,
between 1 April and 30 April 2009. The subscription prices of
shares subscribed for with stock options shall be reduced by the
amount decided after the beginning of the period for the
determination of the subscription price but before the subscrip-
tion, as at the record date for each distribution of profits or
other assets.
At the end of 2008, the price of a B share subscribed for with
option 2007A was €44.22, and with option 2007B it was €26.57.
The subscription periods have not yet begun. The option plan
covers approximately 130 people.
Share of issued stock options of shares and votes
Presuming that shares are subscribed for with all of the
1,800,000 options granted under the year 2003 plan and the
3,000,000 options of the year 2007 plan, the shares subscribed
for with stock options account for 4.69% of shares and 1.23%
of all votes. The subscriptions made with stock options can
raise the number of the company's shares to 101,712,793. As a
result of the subscriptions, the voting rights carried by all
shares can increase to 387,345,856 votes. The shares entitle to
dividends and carry other shareholder rights after the corre-
sponding share capital increase has been entered in the Trade
Register.
The company has not granted other options or special rights
entitling to shares.
STOCK OPTIONS DURING THE PERIOD 1 January–31 December 2008
Stock options 2003 Stock options 2007
Grant date 31 March 2003 26 March 2007
Instrument stock option stock option
Target group management management, other key personnel
2003D 2003E 2003F 2007A 2007B 2007C
Original number of options 600,000 600,000 600,000 1,000,000 1,000,000 1,000,000
Number of shares per option 1 1 1 1 1 1
Original exercise price per share 9.63 € 15.19 € 19.08 € 45.82 € 26.57 € -
Dividend adjustment Yes Yes Yes Yes Yes Yes
Exercise price 31 Dec. 2006 4.53 € 12.09 € 17.98 € - - -
Exercise price 31 Dec. 2007 3.03 € 10.59 € 16.48 € 45.82 € - -
Exercise price 31 Dec. 2008 2.00 € 8.99 € 14.88 € 44.22 € 26.57 € *
First allocation, date 1.4.2005 1.4.2006 1.4.2007 1.4.2010 1.4.2011 1.4.2012
Expiry, date 30.4.2008 30.4.2009 30.4.2010 30.4.2012 30.4.2013 30.4.2014
Remaining vesting period, years expired 0.3 1.3 3.3 4.3 5.3
Plan participants at end of period - 20 35 121 130 -
* for 2007C option, the exercise price is the trading volume weighted average price in April 2009

119Kesko financial statements 2008
Stock options 2003 Stock options 2007
Subscription
price
2008 2003D 2003E 2003F 2007A 2007B 2007C Total (weighted)
At 1 Jan. 2008
Options granted at beginning of period 574,088 576,000 552,500 789,000 2,491,588 €21.31
Options available for grant at beginning
of period 25,912 24,000 47,500 214,000 1,000,000 1,000,000 2,311,412 €35.07
Shares subscribed for with options
at beginning of period 540,938 169,867 118,255 0 829,060 €6.50
Options outstanding at beginning of period 33,150 406,133 434,245 786,000 1,659,528 €28.67
Movements during period
Options granted during period 776,000 776,000 €26.57
Options returned during period 25,000 2,000 27,000 €42.91
Shares subscribed for with options during
period 33,150 22,739 1,200 57,089 €5.05
Average price weighted by grant date
trading volume *) 30.87 € 23.61 € 23.61 €
Options lapsed during period 25,912
At 31 Dec. 2008
Options granted at end of period 574,088 576,000 552,500 789,000 774,000 3,265,588 €21.44
Options expected to vest 0 0 0 789,000 774,000 1,563,000 €35.48
Number of granted options sold
(by original holder) 544,288 401,049 225,200 0 1,170,537 €6.87
Options available for grant at end of period 0 24,000 47,500 239,000 226,000 1,000,000 1,536,500 €32.61
Shares subscribed for with options
at end of period 574,088 192,606 119,455 0 886,149 €5.26
Options outstanding at end of period 0 383,394 433,045 761,000 774,000 2,351,439 €27.26
* for 2003D, the trade volume weighted average price of a B share in January-April 2008, and for 2003E and 2003F: the trade volume weighted average price of a B share in 2008
Stock options 2003 Stock options 2007
Subscription
price
2007 2003D 2003E 2003F 2007A 2007B 2007C Total (weighted)
At 1 Jan. 2007
Options granted at beginning of period 574,088 576,000 552,500 1,702,588 €11.45
Options available for grant at beginning
of period 25,912 24,000 47,500 97,412 €12.95
Shares subscribed for with options
at beginning of period 446,300 134,920 581,220 €6.28
Options outstanding at beginning of period 127,788 441,080 552,500 1,121,368 €14.13
Movements during period
Options granted during period 789,000 789,000 €45.82
Options returned during period 3,000 3,000 €45.82
Shares subscribed for with options
during period 94,638 34,947 118,255 247,840 €10.51
Average price weighted by grant date
trading volume *) 42.92 € 42.92 € 43.99 €
Options lapsed during period
At 31 Dec. 2007
Options granted at end of period 574,088 576,000 552,500 789,000 2,491,588 €21.31
Options expected to vest 0 0 0 789,000 789,000 €45.82
Number of granted options sold
(by original holder) 448,800 216,500 0 0 665,300 -
Options available for grant at end of period 25,912 24,000 47,500 214,000 1,000,000 1,000,000 2,311,412 €35.07
Shares subscribed for with options
at end of period 540,938 169,867 118,255 0 829,060 €6.50
Options outstanding at end of period 33,150 406,133 434,245 786,000 1,659,528 €28.67
* for 2003D and 2003E: the trade volume weighted average price of a B share in 2007, for 2003F: the trade volume weighted average price of a B share in April-December 2007.

120 Kesko financial statements 2008
note 38
Non-cash flow investments
€ million 2008 2007
Total purchases of fixed assets, 339.6 233.9
of which settlement in cash 319.9 238.3
Settlement of prior period investments -13.8 -35.4
Investments financed by finance lease
or other borrowing 33.4 31.0
note 39
Adjustments to cash flows from operating activities
€ million 2008 2007
Adjustment of non-cash transactions in
the income statement or items presented
elsewhere in the cash flow statement:
Change in provisions 6.9 1.7
Income from associates -1.9 -0.4
Impairment 61.1 0.5
Losses on loans and advances 13.8 5.0
Non-recurring gains on disposal of
fixed assets -181.9 -43.8
Non-recurring losses on disposal of
fixed assets 1.5 1.7
Option expenses 5.6 2.3
Defined benefit pensions -43.4 -43.1
Others 8.2 0.9
Total -130.1 -75.2
Notes to the cash flow statement
Fair value measurement
For fair value measurement Kesko Corporation has consulted Alexander Corporate Finance Oy. The fair value of options has been
calculated using the Black-Scholes share pricing model. The fair value of options determined on the date of the grant has been
expensed over their vesting period.
During the financial period 1 January-31 December 2008, the options contributed €5.5 million (€2.3 million) to the Group's profit.
Black-Scholes model assumption Granted in 2008 Granted in 2007 All options
Number of options granted, pcs 776,000 789,000 1,565,000
B share average (weighted) price 26.47 € 49.37 € 38.02 €
Average (weighted) subscription price 26.57 € 45.82 € 36.27 €
Expected average (weighted) volatility 27.4% 21.7% 24.5%
Average (weighted) term of option 4.9 y 4.8 y 4.8 y
Average (weighted) risk-free interest rate 4.4% 4.5% 4.5%
Returned options (weighted average) 5.0% 9.2% 7.7%
Total fair value, € 6,335,589 11,312,665 17,648,253
The expected volatility of a Kesko B share has been estimated on historic volatility using weekly changes over a period of time
corresponding to the option's exercise period. The risk-free interest rate is the government zero coupon bond interest rate at
the measurement date with a maturity equalling the option exercise period.

121Kesko financial statements 2008
note 40
Subsidiary disposals
2008Kesko Corporation sold K-Rahoitus Oy and the transaction was •
completed on 31 January 2008.
Kesko Corporation sold Tähti Optikko Group Oy and the trans-•
action was completed on 31 March 2008.
Kesko Corporation sold Kauko-Telko Ltd and the transaction •
was completed on 30 April 2008.
The Kesko Group, the Kesko Pension Fund and Valluga-sijoi-•
tus Oy sold 23 of their retail store properties in different parts
of Finland to Aberdeen Property Fund Finland 1 Ky on 30
September 2008.
The subsidiary disposals contributed an aggregate amount of •
€121.3 million to the cash flow.
2007Kauko-Telko Ltd sold its ownership interests in Glastech Oy, •
Glastech Eesti AS and UAB Glastech on 20 February 2007.
note 41
Associate disposals
€ million 2008 2007
Cash flow from disposals
Proceeds other associates 1.5 0.6
Net cash inflow 1.5 0.6
note 42
Proceeds from available-for-sale financial assets
2008In 2008, the proceeds from available-for-sale financial assets
totalled €0.2 million.
2007In 2007, the proceeds from available-for-sale assets totalled
€46.9 million, of which €46.0 million is attributable to SATO
Corporation shares sold by Kesko Corporation to Varma Mutual
Pension Insurance Company.
note 43
Cash and cash equivalents and current available-for-sale financial assets
€ million 2008 2007
Available-for-sale financial assets 261.5 155.6
Cash and cash equivalents 57.8 89.7
Total 319.3 245.3
In the cash flow statement, the change in cash and cash equiv-
alents and current available-for-sale financial assets only dis-
closes the amounts of available-for-sale financial assets whose
maturities are less than three months. The available-for-sale
financial assets (€291.0 million) also include bonds in the
amount of €29.5 million.

122 Kesko financial statements 2008
note 44
Financial risk managementWith respect to financial risks, the Group observes a uniform
funding policy that has been approved by the company Board
of Directors. Compliance with this policy and developments in
the Group's financial situation are monitored by the Board of
Directors' Audit Committee. The Group's Treasury is centrally
responsible for the Group funding, liquidity management, rela-
tions with providers of finance, and the management of finan-
cial risks. In the main, the Group's funding is arranged through
the parent company, and the Group's Treasury arranges intra-
Group loans for the funding of subsidiaries in their functional
currencies. For companies with significant external ownership,
the Group has not guaranteed financial liabilities in excess of
its ownership interest.
Currency risk and sensitivity analysis
The Group's balance sheet is exposed to translation risks in
connection with investments in subsidiaries outside the euro
area. This balance sheet exposure has been hedged by using
currency-denominated loans and forward rate agreements if
the translation risk is in excess of €1 million. The most signifi-
cant balance sheet exposure positions are in Estonian kroon,
Norwegian krone, Swedish krona, Russian ruble, Lithuanian lit
and Latvian lat.
The Group has not hedged foreign-currency-denominated
goodwill (incl. allocated goodwill), whose countervalue was
€55.5 million (€112.4 million) at 31 December 2008.
The currency risk exposed to translation risk, excluding for-
eign-currency-denominated goodwill, is small in proportion to
the volume of operations and the balance sheet total. A simul-
taneous 20% weakening of the six central currencies (NOK, EEK,
LTL, RUB, LVL, SEK) against the euro would result in a €5.6 mil-
lion (€9.1 million) negative change in equity at 31 December
2008.
The euro has been adopted as the functional currency of the
real estate companies in St. Petersburg and Moscow in Russia,
Translation risk and hedging at 31 December 2008
€ million Latvia Norway Estonia Sweden Russia Lithuania Others Total
Equity exposed to translation risk*) 4.9 22.5 63.1 5.0 22.0 37.0 2.6 157.1
Hedging derivatives 0.0 0.0 40.6 1.4 17.0 31.9 90.9
Hedging loans 4.9 17.4 15.7 0.0 0.0 0.0 0.0 38.0
Open position 0.0 5.1 6.8 3.6 5.0 5.1 2.6 28.2
*) equity excl. allocated goodwill
Translation risk and hedging at 31 December 2007
€ million Latvia Norway Estonia Sweden Russia Lithuania Others Total
Equity exposed to translation risk*) 7.9 27.2 78.6 3.0 21.0 39.8 7.9 185.4
Hedging derivatives 3.6 37.7 5.3 18.9 13.8 79.3
Hedging loans 2.2 22.6 25.9 9.8 60.5
Open position 2.1 4.6 15.0 -2.3 2.1 16.2 7.9 45.6
*) equity excl. allocated goodwill
which is why no significant exchange differences are realised
from their balance sheets for the Group.
Kesko Corporation's USD-denominated private placement loan
has been hedged against currency risk and interest rate risk
applying hedge accounting. Currency and interest rate swaps in
the same amount and maturity as the loan have been desig-
nated as the hedging instruments. Consequently, the loan is
entirely hedged against currency and interest rate risk. During
the period, no amount of ineffectiveness has been recognised in
the income statement relating to this credit facility.
International purchasing activity exposes the Group to trans-
action risks relating to several foreign currencies. The subsidiar-
ies report their foreign currency positions to the Group's Treas-
ury, in other words, the currency risk is monitored at the Group
level on a monthly basis. The risk can be managed by using cur-
rency derivative instruments to hedge open positions, by modi-
fying selling prices, or by changing suppliers. The percentage of
hedging is decided separately by each relevant subsidiary and
business unit. Transaction risk exposures mainly concern the US
dollar. The subsidiaries carry out their hedging operations
together with the Group's Treasury, which hedges risk positions
using market transactions within the limits confirmed for each
currency. Intra-Group derivatives have been allocated to seg-
ments in segment reporting.
48% of foreign currencies bought for commercial purchases
are USD-denominated, which makes other currencies insignifi-
cant with regard to sensitivity analysis. A sensitivity analysis
for the currency risk relating to the USD would have contributed
a pre-tax profit of €+/-1.0 million (€+/-0.4 million) at the bal-
ance sheet date of 31 December 2008, had the USD rate change
been +/-10%. It is assumed that the other variables remain
unchanged. The calculation includes foreign currency denomi-
nated trade payables, trade receivables and currency derivatives
recognised in the balance sheet. Their combined net position
totals €15.1 million (€6.4 million). The analysis does not consider
the foreign currency denominated orders, some of which are
also hedged.

123Kesko financial statements 2008
The Group's foreign subsidiaries also buy currency independ-
ently for commercial purchases. Such purchases do not, how-
ever, constitute a significant part of total purchases.
The Group does not apply hedge accounting in accordance
with IAS 39 to hedging commercial currency risks. In initial
recognition, derivative instruments are recorded at cost and
at subsequent measurement they are recognised at fair value.
Value changes of currency derivatives used to hedge purchases
and sales are recognised in other operating income or expenses.
The Group companies' financing is arranged in their func-
tional currencies, which means that the parent company bears
the currency risk relating to financing and hedges the exposure
using derivatives or foreign-currency-denominated loans. Most
of the currency position has been hedged and during the 2008
financial period, the cost of hedge arising from them and equity
hedging was €4.6 million. The hedging cost is the interest rate
difference between the euro and the currency being hedged.
These interest rate differences increased sharply towards the
end of 2008.
Loan interest rate risk and sensitivity analysis
Changes in interest rate level affect the Group's interest
expenses. The interest rate level correlates negatively with pri-
vate consumer demand and investment demand, which is why
financial results in a rising interest rate environment are
affected by higher interest expenses, while the demand for
products and services slackens. Interest rate hedging is used to
equalise the effects of interest rate movements on the profits
for different financial periods.
Interest rate risks are centrally managed by the Group's Treas-
ury, which adjusts loan duration using interest rate derivative
instruments. The target duration is three years and it is allowed
to vary between one and a half and four years. The realised
duration during the period was 3.2 (3.0) years on average.
Cash flows from financial liabilities and related financial expenses at 31 Dec. 2008
€ million 2009 2010 2011 2012 2013 2014- Total
Loans from financial institutions 20.0 0.8 1.0 0.8 0.7 23.6 46.9
financial expenses 2.6 1.2 1.2 1.1 1.1 2.4 9.5
Private placement bonds (USD) 0.0 0.0 86.2 86.2
financial expenses 5.4 5.4 5.4 5.4 5.4 11.5 38.2
Pension loans 0.0
financial expenses 0.0
Finance lease liabilities 22.7 11.8 23.4 10.8 10.6 13.4 92.7
financial expenses 4.5 2.5 1.8 1.5 1.5 0.7 12.5
Liabilities to K-retailers 114.1 114.1
financial expenses 4.9 4.9
Other interest-bearing liabilities 83.4 83.4
financial expenses 0.6 0.6
Commercial papers 47.7 47.7
financial expenses 4.0 4.0
Non-current non-interest-bearing liabilities 0.1 0.0 0.1
Current non-interest-bearing liabilities
Trade payables 755.6 755.6
Accruals and deferred income 241.5 241.5
Other non-interest-bearing liabilities 165.7 165.7
A sensitivity analysis for commercial paper liabilities realised
during the period uses average balance values. At the balance
sheet date of 31 December 2008, the interest-bearing variable
rate liabilities and interest rate derivative instruments hedging
loans from financial institutions would have contributed
€-/+3.8 million to the pre-tax profit, had the interest rate level
risen or fallen by 1 percentage point (€-/+4.6 million).
Liabilities to K-retailers consist of two types of interest-bear-
ing receivables payable by the Kesko Group companies to
K-retailers: retailers' prepayments to Kesko, and retailers' chain
rebates. Chain rebates are subsequent discounts granted to
retailers and their terms vary from one store chain to another.
Private placement bonds and the amount of €120.5 million of
loans from financial institutions have fixed rates and the effec-
tive interest cost is 5.3%. At the end of period, the average rate
of loans from financial institutions with variable interest rates,
liabilities to retailers and other interest-bearing liabilities was
5.5%. Some of the loans are euro-denominated, private place-
ment bonds are USD-denominated, and loans from financial
institutions and commercial paper liabilities include NOK-
denominated loans corresponding to €20.5 million (€25.1 mil-
lion), EEK-denominated loans corresponding to €17.9 million
(€26.0 million), LVL-denominated loans corresponding to €29.8
million (€47.6 million) and LTL-denominated loans correspond-
ing to €0 million (€24.4 million).
Liquidity risk and sensitivity analysis
for interest-bearing receivables
Liquidity risk management aims at maintaining sufficient liquid
assets and credit lines in order to guarantee the availability of
sufficient funding for the Group's business activities at all
times.
The aim is to invest liquidity consisting of cash and cash
equivalents in the money market by using efficient combina-

124 Kesko financial statements 2008
Cash flows from derivative instruments at 31 Dec. 2008
€ million 2009 2010 2011 2012 2013 2014- Total
Payables
Forward foreign exchange contracts hedging
net investment 89.6 89.6
Forward foreign exchange contracts outside hedge
accounting 239.8 239.8
Net settlement of payables
Interest rate derivatives
Electricity derivatives 3.0 4.4 3.0 0.8 0.1 0.0 11.3
Grain derivatives 0.0 0.0
Derivatives relating to private placement bonds*
Foreign currency derivatives 0.9 0.9 0.9 0.9 0.9 16.1 20.5
Receivables
Net investment hedging instruments 91.3 91.3
Forward foreign exchange contracts outside hedge
accounting 244.7 244.7
Net settlement of receivables
Interest rate derivatives 0.0 0.0 0.0 0.0 0.1
Electricity derivatives 0.0 0.0
Grain derivatives 0.0 0.0
Derivatives relating to private placement bonds* 0.0
Interest rate derivatives 0.9 0.9 0.9 0.9 0.9 1.9 6.3
Cash flows from financial liabilities and related financial expenses at 31 Dec. 2007
€ million 2008 2009 2010 2011 2012 2013- Total
Loans from financial institutions 17.4 19.3 0.6 0.9 0.7 28.9 67.8
financial expenses 3.7 2.9 1.4 1.4 1.3 4.1 14.8
Private placement bonds (USD) 81.5 81.5
financial expenses 5.1 5.1 5.1 5.1 5.1 15.9 41.2
Pension loans 0.8 0.8 0.8 0.4 2.8
financial expenses 0.1 0.1 0.0 0.0 0.3
Finance lease liabilities 18.8 24.2 16.5 26.8 11.2 68.6 166.1
financial expenses 8.9 8.1 7.3 6.0 5.2 18.2 53.6
Liabilities to K-retailers 122.2 122.2
financial expenses 4.3 4.3
Other interest-bearing liabilities 62.4 0.0 0.0 62.4
financial expenses 1.4 1.4
Commercial papers 98.1 98.1
financial expenses 3.8 3.8
Non-current non-interest-bearing liabilities 0.0 0.0 0.1 0.1
Current non-interest-bearing liabilities
Trade payables 837.8 837.8
Accruals and deferred income 272.1 272.1
Other non-interest-bearing liabilities 159.2 159.2
tions of return and risk. At regular intervals, the Group's man-
agement approves the instruments and limits for each invest-
ment among those analysed by the Group's Treasury. The risks
and actual returns of investments are monitored regularly.
The Group's liquid assets have mainly been invested in debt
instruments of major Finnish companies, in certificates of
deposit and deposits in banks operating in Kesko's market area,
and in Finnish government bonds. At 31 December 2008, invest-
ments in commercial papers totalled €203.4 million (€176.6 mil-
lion), in bank certificates of deposit and deposits €140.9 million
(€17.5 million), in bond funds €9.4 million (€66.9 million) and in
Finnish government bonds €31.7 million (-). For 2008, the return
on these investments was 4.9%. The maximum credit risk is the
above fair value of these investments in the balance sheet at
the balance sheet date.

125Kesko financial statements 2008
Cash flows from derivative instruments at 31 Dec. 2007
€ million 2008 2009 2010 2011 2012 2013- Total
Payables
Forward foreign exchange contracts hedging
net investment 79.0 79.0
Forward foreign exchange contracts outside
hedge accounting 265.6 7.2 272.7
Net settlement of payables
Interest rate derivatives 0.1 0.1
Electricity derivatives
Grain derivatives 0.4 0.4
Derivatives relating to private placement bonds*
Foreign currency derivatives 1.2 1.2 1.2 1.2 1.1 22.6 28.5
Receivables
Net investment hedging instruments 78.8 78.8
Forward foreign exchange contracts outside hedge
accounting 265.7 7.5 273.1
Net settlement of receivables
Interest rate derivatives 0.0 0.0 0.0 0.0 0.0 0.1
Electricity derivatives 4.8 2.9 0.7 0.0 8.4
Grain derivatives 0.0 0.0
Derivatives relating to private placement bonds*
Interest rate derivatives 0.9 0.9 0.9 0.9 0.9 2.8 7.1
*The cash flows of private placement bonds and relating foreign currency and interest rate derivatives are settled on net basis.
A sensitivity analysis for variable rate receivables uses average
annual balance values of invested assets. The receivables
include customer financing receivables, finance lease receiva-
bles, other interest-bearing receivables, and investments in
commercial papers and bond funds. The sensitivity of bond
funds has been determined based on duration. These items
would have contributed €+/-4.4 million (€+/-4.4 million) to the
pre-tax profit at the balance sheet date, had the interest rate
level changed by +/-1 percentage point.
At the balance sheet date, the counter value of undrawn
committed long-term credit facilities was €247 million (€225
million). The committed credit limits mature at the end of 2010,
2011 and 2012 and are expected to be renegotiable. In addition,
the Group's euro-denominated uncommitted credit lines avail-
able contain commercial paper programmes denominated in
Estonian kroon, Lithuanian lit and Latvian lat to a total counter
value of €449 million (€541.7 million).
The terms and conditions of the private placement credit
facility and the committed limit include financial covenants. The
requirements of these covenants have been met.
Credit risk
The business companies of the Group's divisions are responsible
for the credit risk related to receivables from customers. The
company has a credit policy and compliance with it is moni-
tored. Receivables are secured by carefully assessing customers'
creditworthiness, by reviewing customer credit terms and col-
lateral requirements, by effective credit control and credit
insurances as applicable. In Finland, the main part of the
Group's business activities is carried out in cooperation with
retailers. According to the retailer agreements, retailers lodge
bank overdrafts as collateral against their trade payables to the
relevant Kesko subsidiaries.
Group companies apply a uniform practice to measuring over-
due receivables. A receivable is written down when there is
objective evidence of impairment.
Breakdown by maturity of trade receivables
€ million 2008 2007
Trade receivables not matured 567.7 613.2
1–7 days mature 18.4 17.1
8–30 days mature 20.0 27.8
31–60 days mature 6.8 11.2
over 60 days mature 20.2 13.0
Total 633.1 682.1
Of trade receivables, €298.1 million (€276.9 million) were from
chain retailers and €21.4 million (€27.4 million) were credit card
receivables. The collateral for chain retailer receivables is an
overdraft facility granted by a Kesko associate, Vähittäiskaupan
Takaus Oy, with the maximum always limited to the realisation
value of the counter collateral given by the K-retail company
and entrepreneur to Vähittäiskaupan Takaus. At the end of
period, the total value of the counterparty collateral was €164.5
million. In addition, the collateral for receivables includes other
collateral, such as business mortgages and other pledged
assets.
The amount of trade receivables with renegotiated terms
included in financial assets is insignificant.

126 Kesko financial statements 2008
Financial credit risk
Financial instruments involve the risk of counterparties failing
to settle their obligations. Kesko only makes currency and
interest rate derivative contracts with banks that have good
creditworthiness. Liquid funds are invested annually, within
the limits confirmed for each counterparty, in instruments with
good creditworthiness.
Borrowing agreements at change of control
(over 50% interest)
According to the terms of Kesko Corporation's USD-denominated
private placement loan, in a situation involving a change of
control, Kesko is obligated to offer a repayment of the whole
loan capital to all noteholders. The noteholders have the right
to accept or refuse the repayment.
According to the terms of Kesko Corporation's syndicated loan,
the syndicate has the right to call in the loan and any with-
drawn loan amounts.
According to the terms of either loan agreement, a transfer of
ownership to retailers or a retailers' association shall not be
considered a change of control.
Credit ratings
For the present, Kesko Corporation has not applied for a credit
rating, because it has not been considered necessary in the
company's present financial situation.
Commodity risks and their sensitivity analysis
The Group uses electricity derivatives to level out energy costs.
The electricity price risk is evaluated for five-year periods. The
value changes of derivatives hedging the price of electricity
supplied during the period are included in the adjustment
items of purchases. Hedge accounting is applied to contracts
hedging future purchases. The effective portion of derivatives
that meet hedge accounting criteria are recognised in the
revaluation reserve of equity and the ineffective portion in the
income statement in other operating income or expenses.
At the end of the year, the ineffective portion was €-0.9
million.
At the balance sheet date, a total quantity of 1,174,056 MWH
(853,044 MWH) of electricity had been purchased with electricity
derivatives and the 1–12 month hedging rate was 75.4% (75.8%),
the 13–24 month rate 62.3% (47.2%), the 25–36 month rate
34.1% (20.2%), the 37–48 month rate 12.6% (-) and the 49–60
month rate 9.6% (-).
A sensitivity analysis for electricity derivatives assumes that
derivatives maturing within less than 12 months have an impact
on profit. If the market price of electricity derivatives changed
by +/-20 percentage points from the balance sheet date 31
December 2008, it would contribute €+/-3.5 million (€(+/-3.1
million) to the 2009 profit and €+/-5.3 million (€+/-3.8 million)
to equity. The impact has been calculated before tax.
The Group's agricultural division uses an insignificant amount
of grain derivatives to hedge against grain price risk.
Capital structure management
Due to the global financial crisis and the consequent weaken-
ing of the real economy, the importance of capital structure
management was increasingly emphasized in 2008. The Kesko
Group's capital management objectives include targets set for
the Group's solvency and liquidity, as well as its capital
productivity.
The objectives for the Group's solvency and liquidity are set
with the purpose of securing the Group's liquidity in all market
Fair values of derivative financial instruments
2008 2008 2008 2007
€ million
Positive fair value
(balance sheet value)
Negative fair value
(balance sheet value) Net fair value Net fair value
Interest rate derivatives 9.9 ** 0.0 9.9 4.8
Forward exchanges 10.8 */** -18.4 */** -7.6 -18.7
Currency options (bought) - - - -
Electricity derivatives 0.0 -10.8 -10.8 7.9
Grain derivatives 0.0 0.0 0.0 -0.4
Nominal values of derivative financial instruments
31.12.2008 31.12.2007
€ million Nominal amount Nominal amount
Interest rate derivatives 204.9 ** 240.7
Forward exchanges 433.0 */** 466.3
Currency options (bought) - -
Electricity derivatives 45.9 36.6
Grain derivatives 0.7 5.0
*) Derivative financial instruments also include forward exchanges used to hedge net investments in stand-alone foreign entities, with a fair value of €1.6 million (€-0.2 million)
and a nominal value of €90.8 million (€79.3 million).
**) Derivative financial instruments include interest rate swaps relating to a currency-denominated loan arrangement with a nominal gross value of €200.8 million and a fair value
of €9.9 million (€4.9 million), and currency swaps with a nominal value of €100.4 million and a fair value of €-14.2 million (€-18.9 million).
The maximum credit risk of derivatives is the fair value of the balance sheet at the reporting date.

127Kesko financial statements 2008
situations, enabling the implementation of investment pro-
grammes based on the Group's strategy and maintaining the
shareholder value. Objectives have been set to equity ratio and
interest-bearing net debt/EBITDA. The calculation formulas for
these indicators are presented in the financial statements, on
page 133. The Group's interest-bearing debt include covenants,
whose terms and conditions have been taken into account in
the above target levels. The Group does not have a credit rating
given by any external credit rating institution.
The purpose of setting objectives for the Group's capital pro-
ductivity is to steer the operating activities in increasing share-
holder value on a long-term basis. The objectives of capital pro-
ductivity excluding non-recurring items have been set to the
Group's equity and capital employed. The calculation formulas
for the indicators 'return on equity' and 'return on capital
employed' are presented in the financial statements, p. 133. The
Group's capital structure (equity-to-debt ratio) is only optimised
at the Group level, which is why at the lower levels of divisions
and companies, the targets relating to the productivity of capital
have been set to the indicators 'economic value added' and
'return on capital employed'.
Economic value added formula:
Operating profit excluding non-recurring items
- operational taxes
- return requirement for average capital employed
+/- other adjustment items
The above target levels set for the Group's financial indicators
are submitted for approval by the Board of Directors. On 4 Feb-
ruary 2009, the Board approved the following values for the
Group's medium term objectives.
Target level
Return on equity 12%
Return on capital employed 14%
Equity ratio 40–50%
Interest-bearing net debt /EBITDA < 3
note 45
Risk management
Kesko's risk management
Risk management in the Group is guided by the risk manage-
ment policy approved by the Board of Directors. The divisions
assess the risks in connection with the strategy cycle and pri-
oritise them according to their criticality and management
level. Risk assessments are updated quarterly. Also Group units
have assessed the risks threatening the Group objectives and
the risk management. Risks and their management responses
have been discussed by the division parent companies' and the
Group's management. Separate risk analyses have been made
for major projects.
On the basis of the Divisions' and Group units' risk analyses,
the Corporate Risk Management Unit has prepared summaries
of major risks and their management on a quarterly basis. The
resulting risk report has been handled by Kesko Corporation's
Board of Directors' Audit Committee. Based of the divisions' and
Group units' risk assessments, Kesko's Corporate Management
Board has assessed and prioritised the most significant risks
faced by the Group. The resulting Group-level risk map has been
handled by the Board of Directors.
The main risks and uncertainties have been reported in the
interim financial reports.
Main risks and uncertainties and
risk management responses
The international financial crisis and its impact on economic
development, consumer confidence, and availability of finance
and investment readiness have greatly added to uncertainties
in Kesko's operating environment, especially in the building
materials, car and machinery and home and speciality goods
trade in Kesko's operating countries. Consumer demand has
weakened especially in Latvia and Estonia. With regard to con-
sumer demand in Russia, the price of crude oil is a key factor.
The effects of the recession on Kesko
The recession has caused consumers' confidence about their
own finances to fall. Consumers are increasingly careful about
buying especially more expensive products. This is also
impacted by difficulties in the availability of finance. As the
recession continues and consumers' buying power weakens,
price becomes an increasingly important factor when buying
decisions are made.
In addition, risks relating to the profitability and financing
possibilities of business customers and retailers increase as con-
sumer demand weakens. This affects negatively on Kesko's sales
development and adds to the default risks.
The keynote issues with respect securing the profitability level
and financial position are the adaptation of business operations
to the market situation by more efficient operations and capital
turnover and by adapting costs and investments. Kesko has
launched several initiatives to lower the cost level and improve
working capital management in addition to a Group-level work
and productivity programme. In a weakened market situation,
Kesko's strengths are its strong balance sheet and multi-sector
operations, which help mitigate the impact of the recession.
International growth
Kesko also aims to achieve growth through international
expansion. Failures related to these projects may jeopardise
growth. In the present economic situation all risks involved in
investments are examined extremely carefully. On the other
hand, given the prevailing market situation, acquisitions of
businesses and store sites from abroad may be easier to com-
plete and under better terms.

128 Kesko financial statements 2008
Price competitiveness
Price plays an important role in customers' decision-making,
especially in recession. The use of the Internet has also made
customers more price conscious. The price-quality ratio is a key
competitive factor. If Kesko does not succeed in this competi-
tion, it will not achieve the sales targets. Enhancing price com-
petitiveness calls for improvements in the efficiency of opera-
tions throughout the supply chain from the supplier to the
store shelf. In order for an improved cost-efficiency of the chain
of operations and the overall control, several programmes are
being implemented for the purpose of better price competitive-
ness and customers' satisfaction with the stores' offer and
service.
Store sites
Store sites are a strategic competitive factor. Considerable
amounts of capital or lease liabilities are tied up in store prop-
erties for years. The coincidence of Kesko's ongoing extensive
investment programme with a cyclical depression can endanger
the planned return on the investments. On the other hand, it is
possible to make more advantageous store site investments
when the economic cycle is weak.
As a result of the recession or changes in local competitive sit-
uations, the operations in a store site can run risk of becoming
unprofitable. Such risks are managed by long-term store net-
work planning, careful preparation of each store site investment
decision and the sale-leaseback system. In cases where Kesko
manages the construction, the aim is to design a store site that
can be modified for different uses. In the case of leased
premises, the flexibility requirement is taken into account in the
lease agreements.
The acquisition of good store sites can be slowed by scarcity of
plots, zoning and permit procedures and trends in plot prices.
In addition, each operating country has its special characteristics
with respect to, for example, legislation and the authorities.
Suppliers and distribution channels
In business divisions that are strongly dependent on individual
principals and suppliers, changes in a principal's or supplier's
strategy concerning the product selection, pricing and distribu-
tion channel solutions can mean a reduction in competitiveness
or sales or loss of business. Good market shares, growing sales
and development of operations create a basis for long-term
cooperation.
Suppliers can have increasing difficulties of delivery as a result
of the recession. There is also a growing possibility of bankrupt-
cies. In order that substitute products can be offered to custom-
ers, it is increasingly important that the financial situation and
delivery accuracy of the major suppliers be monitored and sub-
stitute suppliers be examined.
Continuity of operations and information security
The trading sector is characterised by increasingly complicated
and long supply chains and their dependency on information
systems, telecommunications and external service providers.
Disturbances in the supply chain can cause major losses in sales
and profit. These problems may be reflected to the customer in
that there are no products available in the store or the store is
closed. Kesko has prioritised the most critical information sys-
tems with regard to business operations, and the continuity
management projects underway are aimed to secure undis-
turbed critical operations and a sufficiently fast recovery after
a serious disturbance.
The importance of information in business operations is
increasing all the time. The requirements of stakeholders and
the legislation to safeguard the handling of information in case
of accidents and misuse have grown especially in connection
with personal data and card payments. Confidentiality of cus-
tomer and employee information, payment transactions and
business secrets is protected with appropriate practices and
information security solutions.
Product safety and quality of the supply chain
Kesko's goal is to provide safe products for its customers. A fail-
ure in the quality assurance of the supply chain or in product
control may result in financial losses, the loss of customer con-
fidence or, in the worst case, a health hazard. Product research,
the trading sector's self-control, efficient product recall practice
and manufacturer audits ensure the quality and safety and
ethicality of the products sold.
Shrinkage
The retail trade involves a high risk of shrinkage. Shrinkage can
result, for example, from spoilage or breakage of goods, theft
or other malpractice, and unsuccessful purchasing. Shrinkage
management actions and the development of reporting were
the key issues in 2008. The Group continuously examines and
develops new methods and tools for more efficient shrinkage
management.
Recession entails a growing risk of financial malpractice. Pre-
ventive measures have included communications, controls and
guidelines. Information technology is also being increasingly
used to prevent and reveal malpractices.
Personnel
Implementation of strategies requires competent and motivated
personnel. There is a risk that the trading sector will not attract
the most skilled people. The recession is likely to temporarily
improve the availability of labour. Specialisation increases
dependence on the competence of individuals. In updating
strategies, the competencies required to implement the strategy
are identified, and personnel plans are drawn up. The effi-
ciency and flexibility of retail operations can be improved by
investing on employees' multiple skills. Personnel surveys play
a central role in the development of HR management. Kesko's
employer image is redefined by systematic internal and exter-
nal communications and stakeholder cooperation.
Legislation, agreements and ethical principles
Compliance with legislation, agreements and Kesko's ethical
principles is an important basic value. Non-compliance may
result in fines, compensation for damages and other financial
losses, and a loss of confidence or reputation. The Group has
specific Compliance programmes to avoid this. Self-assessments
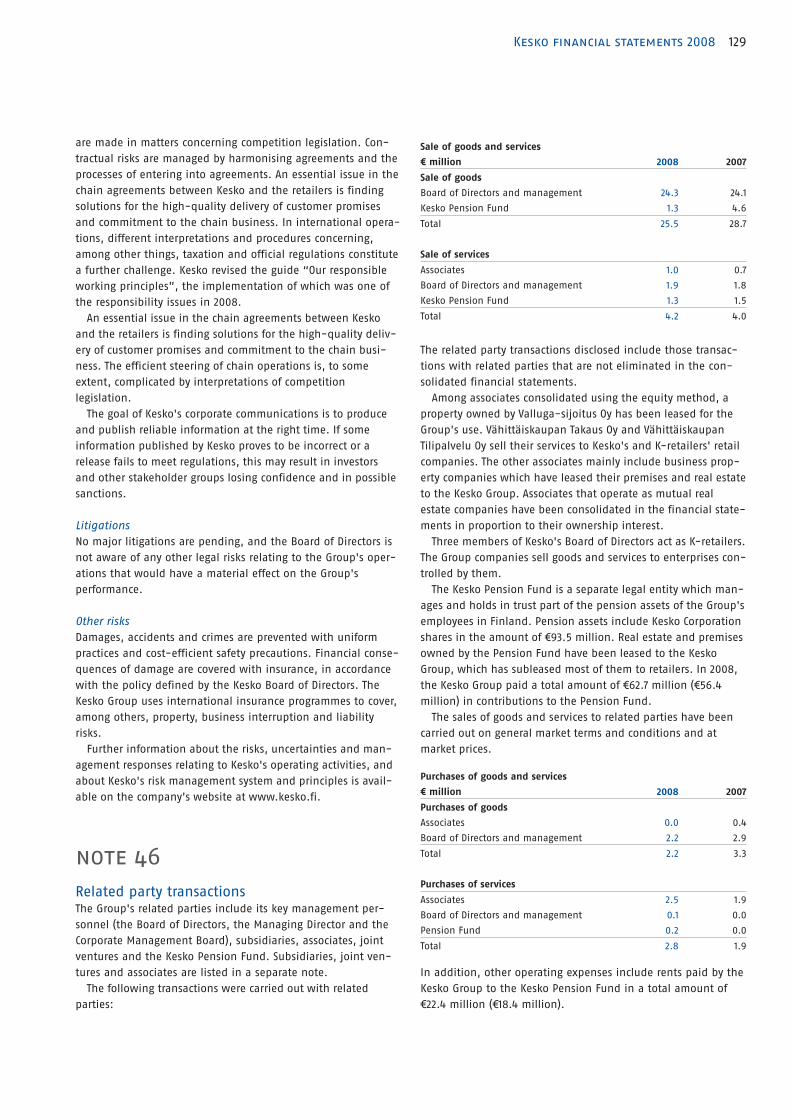
129Kesko financial statements 2008
are made in matters concerning competition legislation. Con-
tractual risks are managed by harmonising agreements and the
processes of entering into agreements. An essential issue in the
chain agreements between Kesko and the retailers is finding
solutions for the high-quality delivery of customer promises
and commitment to the chain business. In international opera-
tions, different interpretations and procedures concerning,
among other things, taxation and official regulations constitute
a further challenge. Kesko revised the guide “Our responsible
working principles”, the implementation of which was one of
the responsibility issues in 2008.
An essential issue in the chain agreements between Kesko
and the retailers is finding solutions for the high-quality deliv-
ery of customer promises and commitment to the chain busi-
ness. The efficient steering of chain operations is, to some
extent, complicated by interpretations of competition
legislation.
The goal of Kesko's corporate communications is to produce
and publish reliable information at the right time. If some
information published by Kesko proves to be incorrect or a
release fails to meet regulations, this may result in investors
and other stakeholder groups losing confidence and in possible
sanctions.
Litigations
No major litigations are pending, and the Board of Directors is
not aware of any other legal risks relating to the Group's oper-
ations that would have a material effect on the Group's
performance.
Other risks
Damages, accidents and crimes are prevented with uniform
practices and cost-efficient safety precautions. Financial conse-
quences of damage are covered with insurance, in accordance
with the policy defined by the Kesko Board of Directors. The
Kesko Group uses international insurance programmes to cover,
among others, property, business interruption and liability
risks.
Further information about the risks, uncertainties and man-
agement responses relating to Kesko's operating activities, and
about Kesko's risk management system and principles is avail-
able on the company's website at www.kesko.fi.
note 46
Related party transactionsThe Group's related parties include its key management per-
sonnel (the Board of Directors, the Managing Director and the
Corporate Management Board), subsidiaries, associates, joint
ventures and the Kesko Pension Fund. Subsidiaries, joint ven-
tures and associates are listed in a separate note.
The following transactions were carried out with related
parties:
Sale of goods and services
€ million 2008 2007
Sale of goods
Board of Directors and management 24.3 24.1
Kesko Pension Fund 1.3 4.6
Total 25.5 28.7
Sale of services
Associates 1.0 0.7
Board of Directors and management 1.9 1.8
Kesko Pension Fund 1.3 1.5
Total 4.2 4.0
The related party transactions disclosed include those transac-
tions with related parties that are not eliminated in the con-
solidated financial statements.
Among associates consolidated using the equity method, a
property owned by Valluga-sijoitus Oy has been leased for the
Group's use. Vähittäiskaupan Takaus Oy and Vähittäiskaupan
Tilipalvelu Oy sell their services to Kesko's and K-retailers' retail
companies. The other associates mainly include business prop-
erty companies which have leased their premises and real estate
to the Kesko Group. Associates that operate as mutual real
estate companies have been consolidated in the financial state-
ments in proportion to their ownership interest.
Three members of Kesko's Board of Directors act as K-retailers.
The Group companies sell goods and services to enterprises con-
trolled by them.
The Kesko Pension Fund is a separate legal entity which man-
ages and holds in trust part of the pension assets of the Group's
employees in Finland. Pension assets include Kesko Corporation
shares in the amount of €93.5 million. Real estate and premises
owned by the Pension Fund have been leased to the Kesko
Group, which has subleased most of them to retailers. In 2008,
the Kesko Group paid a total amount of €62.7 million (€56.4
million) in contributions to the Pension Fund.
The sales of goods and services to related parties have been
carried out on general market terms and conditions and at
market prices.
Purchases of goods and services
€ million 2008 2007
Purchases of goods
Associates 0.0 0.4
Board of Directors and management 2.2 2.9
Total 2.2 3.3
Purchases of services
Associates 2.5 1.9
Board of Directors and management 0.1 0.0
Pension Fund 0.2 0.0
Total 2.8 1.9
In addition, other operating expenses include rents paid by the
Kesko Group to the Kesko Pension Fund in a total amount of
€22.4 million (€18.4 million).

130 Kesko financial statements 2008
Board of Directors' remunerations
€ thousand 2008 2007
Members of the Board of Directors
Heikki Takamäki, Chair 67.5 65.5
Keijo Suila, Deputy Chair 50.0 49.5
Pentti Kalliala 37.5 35.0
Ilpo Kokkila 35.5 34.0
Maarit Näkyvä 41.0 37.5
Seppo Paatelainen 38.5 36.0
Jukka Säilä 35.5 34.0
Salaries and fees of the President and CEO, Deputy Managing Director
and Corporate Management Board
€ thousand 2008 2007
Matti Halmesmäki, President and CEO 838.6 736.1
Juhani Järvi, Deputy Managing Director
(17 March 2005–31 May 2007) 0.0 124.6
Corporate Management Board (other members) 1,706.5 1,697.1
Other top management employee benefits
Share-based payments
At 31 December 2008, the Managing Director held 100,000 stock
options, 50,000 of which were 2007B options granted in 2008.
Presuming that shares are subscribed for with the Managing
Director's options, the options represent 0.1% of the share cap-
ital and 0.03% of all voting rights. The other Corporate Man-
agement Board members held a total of 353,500 share options
granted on 31 December 2008. In 2008, the other Corporate
Management Board members were granted a total of 145,000
2007B options. The options held by the Corporate Management
Board members have equal rules and vesting periods with the
other options included in the management's option plans.
Retirement benefits
The retirement age of the President and CEO is 60 years and his
full retirement benefit is 66% of his pensionable salary. The
retirement benefits of the other Corporate Management Board
members are determined on the basis of the Employees' Pen-
sions Act (TyEL), or based on a separate agreement, in which
case the retirement age varies between 60 and 62, and the full
retirement benefit is 66% of the pensionable salary.
Termination benefits
The notice period of the President and CEO is 6 months. Sever-
ance compensation paid in addition to the salaries for the
notice period corresponds to 12 months' salary. The notice
period of the other Corporate Management Board members is 6
months and severance compensation paid in addition to the
salaries for the notice period corresponds to 6–12 months'
salary.
Financial expenses
€ million 2008 2007
Associates 1.6 1.2
Board of Directors and management 0.0 0.0
Pension Fund 0.2 0.1
Total 1.8 1.3
Trade receivables
€ million 2008 2007
Associates 0.0 0.1
Board of Directors and management 1.7 1.7
Pension Fund 0.2 0.5
Total 1.9 2.3
Three members of Kesko's Board of Directors act as K-retailers.
At the balance sheet date, the receivables resulting from sales
by Kesko to enterprises controlled by them totalled €1.7 million
(€1.7 million). The receivables are covered by the commercial
credit collateral granted by Vähittäiskaupan Takaus Oy, a Kesko
associate. The maximum amount of the collateral is always lim-
ited to the realisable value of the counter-guarantee granted by
the K-retailer's enterprise and the K-retailer entrepreneur to
Vähittäiskaupan Takaus. At the end of the period, the value of
the counter-guarantee was €3.5 million (€5.9 million).
Other current liabilities
€ million 2008 2007
Associates 37.4 24.1
Board of Directors 0.6 0.9
Pension Fund 2.6 1.9
Total 40.6 26.9
Other current liabilities include, among other things, chain
rebate liabilities payable to enterprises controlled by the three
Kesko Board members acting as K-retailers. Chain rebates are
paid in arrears on criteria related to the amount of realised
annual sales and the quality of operations.
In addition, Kesko's long-term receivables from a real estate
associate total €1.6 million.
note 47
Other notes
Events after the balance sheet date
On 1 January 2009, Kesko Agro Ltd demerged so that the agri-
cultural trade activities in Finland became part of Rautakesko
Ltd. In addition, the trade of tractors and combines, as well as
the agricultural and machinery trade companies in the Baltic
countries became part of Konekesko Ltd (stock exchange release
on 28 May 2008).
Anttila Oy, K-citymarket Oy (home and speciality goods) and
the other Kesko Group home and speciality goods companies
intensify their cooperation. As of 1 January 2009, the Kesko
Group's primary reportable segments are the food trade, the
home and speciality goods trade, the building and home
improvement trade, and the car and machinery trade (stock
exchange release on 12 December 2008).
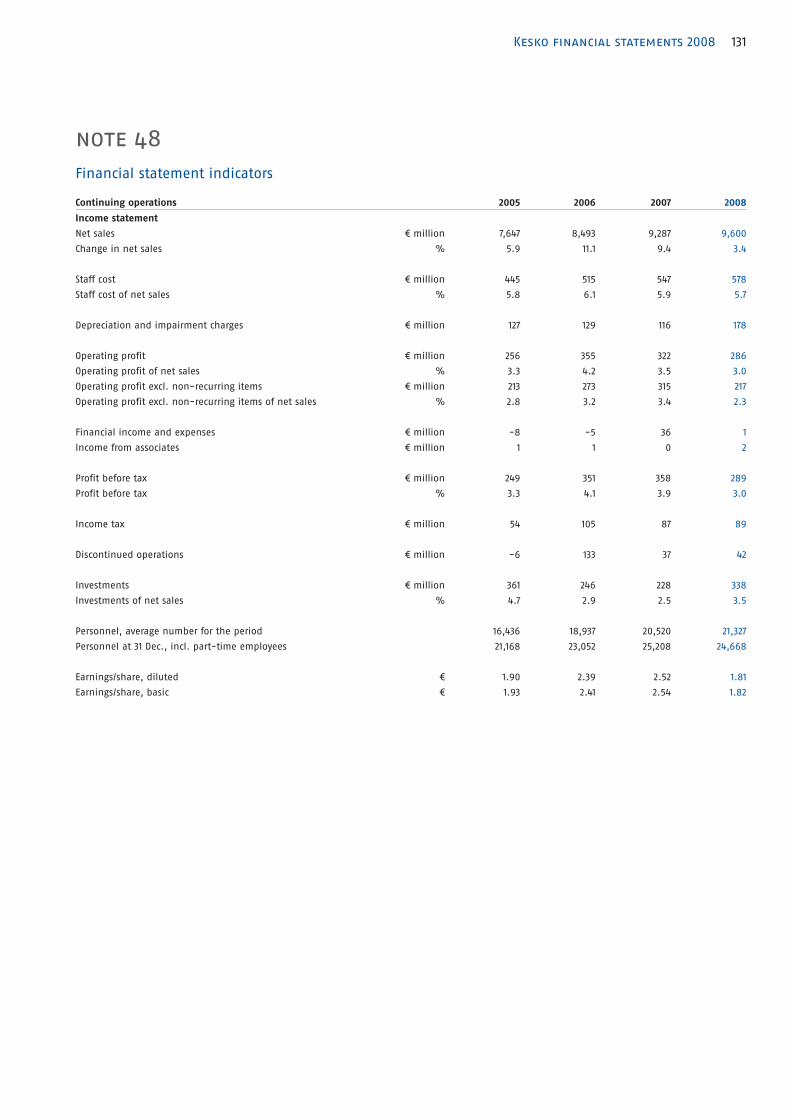
131Kesko financial statements 2008
note 48
Financial statement indicators
Continuing operations 2005 2006 2007 2008
Income statement
Net sales € million 7,647 8,493 9,287 9,600
Change in net sales % 5.9 11.1 9.4 3.4
Staff cost € million 445 515 547 578
Staff cost of net sales % 5.8 6.1 5.9 5.7
Depreciation and impairment charges € million 127 129 116 178
Operating profit € million 256 355 322 286
Operating profit of net sales % 3.3 4.2 3.5 3.0
Operating profit excl. non-recurring items € million 213 273 315 217
Operating profit excl. non-recurring items of net sales % 2.8 3.2 3.4 2.3
Financial income and expenses € million -8 -5 36 1
Income from associates € million 1 1 0 2
Profit before tax € million 249 351 358 289
Profit before tax % 3.3 4.1 3.9 3.0
Income tax € million 54 105 87 89
Discontinued operations € million -6 133 37 42
Investments € million 361 246 228 338
Investments of net sales % 4.7 2.9 2.5 3.5
Personnel, average number for the period 16,436 18,937 20,520 21,327
Personnel at 31 Dec., incl. part-time employees 21,168 23,052 25,208 24,668
Earnings/share, diluted € 1.90 2.39 2.52 1.81
Earnings/share, basic € 1.93 2.41 2.54 1.82

132 Kesko financial statements 2008
Whole Group 2005 2006 2007 2008
Profit for the period (incl. minority interest) € million 189 379 307 241
Profit for the period of net sales % 2.3 4.2 3.2 2.5
Attributable to equity holders of the parent € million 181 369 285 220
Attributable to minority interest € million 8 10 22 21
Profitability
Return on equity % 13.0 23.1 16.4 12.1
Return on equity excl. non-recurring items % 11.4 12.7 8.1
Return on investment % 12.5 22.6 17.4 14.2
Return on investment excl. non-recurring items % 13.3 14.5 10.0
Return on capital employed excl. non-recurring items % 9.5 12.3 14.7 10.3
Interest-bearing net debt/EBITDA 1.6 0.3 0.6 0.1
Finance and financial position
Gearing % 42.4 11.9 14.0 2.3
Equity ratio % 42.3 47.0 48.5 52.4
Other indicators
Invetments € million 454 282 228 339
Investments of net sales % 5.4 3.1 2.5 3.5
Personnel, average number for the period 21,305 23,756 20,520 21,327
Personnel at 31 Dec., incl. part-time employees 26,608 23,755 25,890 24,668
Share performance indicators
Whole Group
Earnings/share, diluted € 1.87 3.76 2.90 2.24
Earnings/share, basic € 1.89 3.80 2.92 2.25
Equity/share, adjusted € 15.35 17.94 19.53 20.09
Dividend/share € 1.10 1.50 1.60 1.00*
Payout ratio % 58.8 39.9 55.2 44.7*
Cash flow from operating activities/share, adjusted € 3.07 3.35 2.52 1.37
Price/earnings ratio, (P/E), A share, adjusted 11.86 10.22 13.07 9.84
Price/earnings ratio, (P/E), B share, adjusted 11.74 10.64 13.02 7.96
Effective dividend yield, A share % 4.6 3.9 4.2 4.6*
Effective dividend yield, B share % 4.6 3.8 4.2 5.6*
Share price at 31 Dec.
A share € 24.19 38.43 37.85 22.00
B share € 23.95 40.02 37.72 17.80
Average share price
A share € 21.93 30.10 43.85 28.30
B share € 21.04 31.34 43.36 23.51
Market capitalisation, A share € million 768 1,220 1,201 698
Market capitalisation, B share € million 1,551 2,632 2,491 1,176
Turnover
A share million pcs 1 2 4 1
B share million pcs 66 77 122 121
Turnover rate
A share % 4.1 6.4 11.5 4.5
B share % 101.5 117.1 185.3 183.3
Adjusted number of shares at 31 Dec. million pcs 97 98 98 98
Yield of A share % 15.4 29.3 26.6 10.9
Yield of B share
For the last five periods % 29.2 42.8 36.1 12.9
For the last ten periods % 18.6 22.7 18.7 11.7
* proposal to the Annual General Meeting

133Kesko financial statements 2008
Calculation of financial indicators
Profitability
Return on equity, % =Profit/loss before tax – income tax
x 100Shareholders' equity
Return on equity
excluding non-recurring items, %=
Profit/loss adjusted for non-recurring items before tax – income tax adjusted
for the tax effect of non-recurring itemsx 100
Shareholders' equity
Return on investment, % =Profit/loss before tax + financial expenses
x 100Shareholders' equity + interest-bearing liabilities
Return on investment
excluding non-recurring items, % =
Profit/loss adjusted for non-recurring items before tax + financial expensesx 100
Shareholders' equity + interest-bearing liabilities
Return on capital employed
excluding non-recurring items, %=
Operating profit excluding non-recurring itemsx 100
(Non-current assets + inventories + receivables + other current assets – non-interest-bearing
liabilities) for a 12 month average
EBITDA = Operating profit + depreciation + impairment charges
Finance and financial position
Equity ratio, % =Shareholders' equity
x 100Balance sheet total – prepayments received
Gearing, % =Interest-bearing net debt
x 100Shareholders' equity
Interest-bearing net debt/EBITDA =Interest-bearing net debt
EBITDA
Share performance indicators
Earnings/share, diluted =Profit/loss – minority interest
Average number of shares adjusted for the dilutive effect of options
Earnings/share, basic =Profit/loss – minority interest
Average number of shares
Equity/share =Equity attributable to equity holders of the parent
Basic number of shares at balance sheet date
Payout ratio, % =Dividend/share
x 100Earnings/share
Price/earnings ratio, (P/E) =Share price at balance sheet date
Earnings/share
Effective dividend yield, % =Dividend/share
x 100Share price at balance sheet date
Market capitalisation = Share price at balance sheet date × number of shares
Cash flow from operating activities/share =Cash flow from operating activities
Average number of shares
Yields of A share and B share = Change in share price + annual dividend yield
Others
Cash flow from operating activities =Operating profit + depreciation, amortisation and impairment charges ± change in net working
capital ± financial income and expenses – income tax

134 Kesko financial statements 2008
note 49
Analysis of shareholding
Breakdown of shareholding by shareholder category at 31 Dec. 2008
All shares
Number
of shares, pcs
Percentage
of all shares, %
Non-financial corporations and housing corporations 25,959,020 26.54
Financial and insurance corporations 6,325,086 6.47
General Government 11,166,916 11.42
Households 28,725,937 29.36
Non-profit institutions 6,136,081 6.27
Rest of the world 602,227 0.62
Nominee registered 18,909,587 19.33
Total 97,824,854 100.00
10 largest shareholders by number of shares at 31 Dec. 2008
Number
of shares, pcs
Percentage
of shares, %
Number
of votes
Percentage
of votes, %
1. Kesko Pension Fund 4,438,885 4.54 35,388,850 9.23
2. K-Retailers' Association 3,348,433 3.42 33,116,680 8.64
3. Vähittäiskaupan Takaus Oy 2,802,533 2.86 26,459,330 6.90
4. Ilmarinen Mutual Pension Insurance Company 2,113,608 2.16 4,583,649 1.20
5. Valluga-sijoitus Oy 1,340,439 1.37 13,404,390 3.50
6. Varma Mutual Pension Insurance Company 1,310,986 1.34 1,310,986 0.34
7. Oy The English Tearoom Ab 1,008,400 1.03 1,008,400 0.26
8. State Pension Fund 950,000 0.97 950,000 0.25
9. Foundation for Vocational Training in the Retail Trade 917,913 0.94 7,808,178 2.04
10. Tapiola Mutual Pension Insurance Company 674,500 0.69 674,500 0.18
10 largest shareholders by number of votes at 31 Dec. 2008
Number
of shares, pcs
Percentage
of shares, %
Number
of votes
Percentage
of votes, %
1. Kesko Pension Fund 4,438,885 4.54 35,388,850 9.23
2. K-Retailers' Association 3,348,433 3.42 33,116,680 8.64
3. Vähittäiskaupan Takaus Oy 2,802,533 2.86 26,459,330 6.90
4. Valluga-sijoitus Oy 1,340,439 1.37 13,404,390 3.50
5. Foundation for Vocational Training in the Retail Trade 917,913 0.94 7,808,178 2.04
6. Ilmarinen Mutual Pension Insurance Company 2,113,608 2.16 4,583,649 1.20
7. Ruokacity Myyrmäki Oy 389,541 0.40 3,895,410 1.02
8. K-Food Retailers' Club 337,605 0.35 3,376,050 0.88
9. Heimo Välinen Oy 300,000 0.31 2,824,500 0.74
10. Svenska litteratursällskapet i Finland r.f. 329,000 0.34 2,129,000 0.56
Management's shareholdings
At the end of December 2008, the members of Kesko Corporation's Board of Directors, the Managing Director and the corporations
under their control held 202,910 Kesko Corporation A shares and 210,370 Kesko Corporation B shares, i.e. a total of 413,280 shares
representing 0.42% of the company's share capital and 0.58% of its voting rights.
At 31 December 2008, the Managing Director held 2,000 Kesko Corporation A shares and 7,000 Kesko Corporation B shares, which
represent 0.01% of the company's share capital and 0.01% of its voting rights. In addition, the Managing Director holds 100,000
share options, which comprise 50,000 2007B options granted in 2008. Supposing that shares have been subscribed for with the
Managing Director's options, the options represent 0.1% of the share capital and 0.03% of the voting rights.

135Kesko financial statements 2008
INTERESTS IN GROUP COMPANIES Group's
ownership
interest %
Parent's
ownership
interest %Owned by the parent Domicile
Anttila Oy Helsinki 100.00 100.00
Indoor Group Ltd Lahti 100.00 100.00
Intersport Finland Ltd Helsinki 100.00 100.00
K-instituutti Oy Helsinki 72.00 72.00
K-Plus Oy Helsinki 100.00 100.00
Kenkäkesko Ltd Helsinki 100.00 100.00
Keru Kiinteistöt Oy Helsinki 100.00 100.00
Kesko Real Estate Latvia SIA Riga, Latvia 100.00 100.00
Keslog Ltd Helsinki 100.00 45.05
Kestra Kiinteistöpalvelut Oy Helsinki 100.00 100.00
Kiinteistö Oy Kangasalan
Palvelukeskus Kangasala 82.50 82.50
Kiinteistö Oy Kemin Asemakatu 4 Kemi 66.50 66.50
Kiinteistö Oy Lahden Lyhytkatu 1 LahtI 50.00 50.00
Kiinteistö Oy Pontsonkulma Helsinki 94.57 94.57
Kiinteistö Oy Porin
Hyväntuulentie 2 Pori 70.80 70.82
Kiinteistö Oy Sunan Hallitalo Espoo 100.00 100.00
Kiinteistö Oy Turvesuonkatu 10 Tampere 100.00 100.00
Kiinteistö Oy Voisalmen Liiketalo Lappeenranta 100.00 100.00
Kiinteistö Oy Välivainion
Ostoskeskus Oulu 65.97 65.97
Klintcenter Ab Mariehamn 100.00 100.00
K-talouspalvelukeskus Oy Helsinki 100.00 100.00
Kesko Agro Ltd Helsinki 100.00 100.00
Malmintorin Pysäköintitalo Oy Helsinki 99.91 99.91
Musta Pörssi Ltd Helsinki 100.00 100.00
Plussa Oü Tallinn, Estonia 100.00 100.00
Rautakesko Ltd Helsinki 100.00 100.00
Kesko Food Ltd Helsinki 100.00 100.00
Sincera Oy Helsinki 100.00 100.00
Variston Liikekeskus Oy Vantaa 75.00 75.00
VV-Auto Group Oy Helsinki 100.00 100.00
Owned by other
Group companies Domicile
Group's
ownership
interest %
Parent's
ownership
interest %
Agro Trade Latvija SIA Riga, Latvia 100.00
Antti SIA Riga, Latvia 100.00
Anttila AS Viljandi, Estonia 100.00
Ap Real Estate SIA Riga, Latvia 100.00
Asko Möbler AB
Huddinge,
Sweden 100.00
Auto-Span Oy Helsinki 100.00
Barker-Littoinen Oy Espoo 100.00
Bruland Bygg AS Förde, Norway 66.30
Byggmakker Distribution AS Ski, Norway 100.00
Byggmakker Norge AS Oslo, Norway 99.92
Cassa Oy Helsinki 100.00
Daugavkrasts M SIA Riga, Latvia 100.00
Fiesta Real Estate AS Tallinn, Estonia 100.00
Hauhon Kiinteistö- ja
Kauppakeskus Oy Hauho 100.00
Hasti-Ari AS Ski, Norway 100.00
Ikosen Oü Tallinn, Estonia 100.00
Indoor Group AS Tallinn, Estonia 100.00
Indoor Group SIA Riga, Latvia 100.00
Indoor Group UAB Vilnius, Lithuania 100.00
Indoorpalvelu Oy Lahti 100.00
Insofa Oy Lahti 100.00
Interstroy OOO Russia 100.00
Ka Jelgava SIA Jelgava, Latvia 100.00
K-citymarket Oy Helsinki 100.00
Konekesko Eesti AS Tallinn, Estonia 100.00
Kesko Agro Lietuva UAB Vilnius, Lithuania 100.00
Kesko Agro Latvija SIA Riga, Latvia 100.00
Kesko Real Estate OOO
St. Petersburg,
Russia 100.00
Kesko Real Estate Services OOO
St. Petersburg,
Russia 100.00
Keslog AS Tallinn, Estonia 100.00
Kespro Ltd Helsinki 100.00
Kestroy 1 ZAO Moscow, Russia 100.00
Kiinteistö Oy Ahtialan Liiketalo Lahti 100.00
Kiinteistö Oy Arolan Risteys Elimäki 100.00
Kiinteistö Oy Hannunhelmi Kirkkonummi 100.00
Kiinteistö Oy Imatran
Lappeentie 44 Imatra 100.00
Kiinteistö Oy Kotkan
Kauppahuone Kotka 100.00
Kiinteistö Oy Länsi-Kaisla Espoo 100.00
Kiinteistö Mesta Oy Helsinki 100.00
Kiinteistö Oy Pälkäneen
Liikekeskus Kangasala 79.98
Kiinteistö Oy Sarviniitynkatu 4 Kerava 100.00
Kiinteistö Oy Tampuri Helsinki 100.00
Kiinteistö Oy Tarkkaiikka Oulu 100.00
Kiinteistö Oy Vantaan
Kiitoradantie 2 Vantaa 100.00
note 50
Subsidiaries and associates at 31 dec. 2008

136 Kesko financial statements 2008
Owned by other
Group companies Domicile
Group's
ownership
interest %
Parent's
ownership
interest %
K-Maatalouskaupat Oy Helsinki 100.00
Knuto AS Norway 100.00
Konekesko Ltd Helsinki 100.00
Konekesko OOO
St. Petersburg,
Russia 100.00
Konekesko Holding Oy Helsinki 100.00
K Prof SIA Riga, Latvia 100.00
K Rauta SIA Riga, Latvia 100.00
K-Rauta AB Stockholm, Sweden 100.00
Kr Fastigheter AB Sollentuna, Sweden 100.00
Kr Fastigheter i Eskilstuna AB Sollentuna, Sweden 100.00
Kr Fastigheter i Järfalla AB Sollentuna, Sweden 100.00
Kr Fastigheter i Halmstad AB Sollentuna, Sweden 100.00
Kr Fastigheter i Umeå AB Sollentuna, Sweden 100.00
Kr Fastigheter i Täby AB Sollentuna, Sweden 100.00
Kr Fastigheter Servicekontor AB Sollentuna, Sweden 100.00
Kr Fastigheter i Sundsvall AB Sollentuna, Sweden 100.00
Kr Fastigheter i Uppland AB Sollentuna, Sweden 100.00
K-Rauta Fastigheter i Malmö AB Sollentuna, Sweden 100.00
Lakalaivan Autokorjaamo Oy Tampere 100.00
Limingan Portti Liminka 100.00
Loimaan Maatalous- ja
Rautakauppa Oy Helsinki 100.00
Match-Point OOO Kaluga, Russia 100.00
Masterstroypof ZAO
St. Petersburg,
Russia 100.00
Mezciems Real Estate SIA Riga, Latvia 100.00
Norgros Handel AS
Lilleström,
Norway 100.00
Oma OOO Minsk, Belarus 6.05
Polo Ls SIA Riga, Latvia 100.00
Pikoil Oy Espoo 100.00
Rake Bergen AS Oslo, Norway 100.00
Rake Eiendom AS Oslo, Norway 100.00
Rautakesko AS Tallinn, Estonia 100.00
Rautakesko A/S Riga, Latvia 100.00
Ruokakeskon Kiinteistöt Oy Helsinki 100.00
Romos Holdingas UAB Kaunas, Lithuania 12.11
Senukai UAB Kaunas, Lithuania 99.20
Senuku Prekybos Centras UAB Vilnius, Lithuania 50.00
Senuku Tirdzniecibas Centras SIA Riga, Latvia 100.00
Sotka Eesti Oü Estonia 100.00
Spc Holding UAB Kaunas, Lithuania 100.00
Stroymaster Holding Finland Oy Helsinki 100.00
Stroymaster ZAO St. Petersburg,
Russia
100.00
Sunretail ZAO Moscow, Russia 100.00
Tampereen Länsikeskus Oy Tampere 94.43
Teploschit OOO Yaroslavi, Russia 100.00
Tp Real Estate SIA Riga, Latvia 100.00
Trögstadveien 13 AS Ski, Norway 100.00
Turun VV-Auto Oy Turku 100.00
Verdal Eiendom AS Ski, Norway 100.00
VV-Autotalot Oy Helsinki 100.00
ASSOCIATES
Owned by the parent Domicile
Group's
ownership
interest %
Parent's
ownership
interest %
Graanin Liikekeskus Oy Mikkeli 50.00 50.00
Itäkeskuksen Pysäköintitalo Oy Helsinki 44.49 44.49
Kiinteistö Oy Janakkalan
Linnatuuli Janakkala 29.86 29.86
Kiinteistö Oy Itäaukio Lahti 26.20 26.20
Kiinteistö Oy Joensuun
Kaupunginportti Joensuu 22.77 22.77
Kiinteistö Oy Lentokentän
Palvelutalo Vantaa 32.59 32.59
Kiinteistö Oy Mellunmäen Liike-
ja Toimintakeskus Helsinki 23.42 23.42
Kiinteistö Oy Ulvilan Hansa Ulvila 42.41 42.41
Kiinteistö Oy Vantaanportin
Liikekeskus Vantaa 27.87 27.87
Levin Aquahovi Kiinteistöt Oy Kittilä 25.00 25.00
Raksilan Paikoitus Oy Oulu 33.33 33.33
Valluga-Sijoitus Oy Helsinki 39.00 39.00
Vähittäiskaupan Takaus Oy Helsinki 34.35 34.35
Vähittäiskaupan Tilipalvelu VTP Oy Helsinki 30.00 30.00
Owned by other Group companies
Kiinteistö Oy Meri-Pietari Helsinki 23.12
Kiinteistö Oy Lahden
Teollisuuskeskus Lahti 48.32

137Kesko financial statements 2008
Parent's financial statements 2008Parent's income statement (FAS)
€ 1 Jan.–31 Dec. 2008 1 Jan.–31 Dec. 2007
Net sales 18,193,914.32 16,761,333.00
Other operating income 299,019,437.07 249,816,297.07
Materials and services -454.51 -274.98
Staff expenses -12,971,150.41 -13,651,741.54
Depreciation and reduction in value -37,541,067.49 -24,045,119.06
Other operating expenses -129,245,796.46 -172,452,664.52
Operating profit 137,454,882.52 56,427,829.97
Financial income and expenses 37,555,785.57 47,808,921.74
Profit before extraordinary items 175,010,668.09 104,236,751.71
Extraordinary items 99,866,000.00 138,632,000.00
Profit before appropriations and taxes 274,876,668.09 242,868,751.71
Appropriations 26,513,831.22 5,797,754.74
Profit before taxes 301,390,499.31 248,666,506.45
Income taxes -64,679,900.23 -54,392,730.23
Profit for the financial year 236,710,599.08 194,273,776.22

138 Kesko financial statements 2008
Parent's balance sheet (FAS)
€ 31 Dec. 2008 31 Dec. 2007
ASSETS
NON-CURRENT ASSETS
INTANGIBLE ASSETS
Other capitalised long-term
expenditure 6,455,877.43 7,714,791.78
Advance payments and
construction in progress 1,641,853.61 2,451,132.91
8,097,731.04 10,165,924.69
TANGIBLE ASSETS
Land and waters 111,379,744.40 112,152,662.59
Buildings 309,366,678.87 331,402,014.49
Machinery and equipment 4,980,270.93 5,972,140.83
Other tangible assets 8,158,495.25 7,205,486.53
Advance payments and
construction in progress 7,094,125.24 5,410,734.59
440,979,314.69 462,143,039.03
INVESTMENTS
Holdings in Group companies 273,535,019.71 402,270,848.48
Participating interests 18,657,266.58 19,761,572.65
Other shares and similar rights of
ownership 7,295,881.70 7,284,058.60
299,488,167.99 429,316,479.73
CURRENT ASSETS
DEBTORS
Long-term
Amounts owed by Group
companies 399,439,059.07 384,426,543.03
Amounts owed by participating
interests 1,546,010.01 891,396.01
Other long-term loan receivables 3,310,137.35 0.00
404,295,206.43 385,317,939.04
Short-term
Trade debtors 184,033.61 1,752,057.86
Amounts owed by Group
companies 546,643,021.41 589,954,855.91
Amounts owed by participating
interests 3,104,920.53 4,175,243.23
Other receivables 243,510.35 220,795.53
Prepayments and accrued income 25,382,155.33 30,012,572.21
575,557,641.23 626,115,524.74
INVESTMENTS
Other investments 383,152,895.82 261,072,406.31
CASH IN HAND AND AT BANKS 22,785,663.82 25,554,085.64
TOTAL ASSETS 2,134,356,621.02 2,199,685,399.18
€ 31 Dec. 2008 31 Dec. 2007
LIABILITIES
CAPITAL ANDB RESERVES
Share capital 195,649,708.00 195,535,530.00
Share issue 89,900.00 733.95
Share premium account 190,255,218.02 190,079,543.91
Other reserves 243,415,795.55 243,415,795.55
Retained earnings 531,108,065.33 493,562,881.11
Profit for the financial year 236,710,599.08 194,273,776.22
1,397,229,285.98 1,316,868,260.74
APPROPRIATIONS
Depreciation reserve 131,171,455.93 157,685,287.15
PROVISIONS
Other provisions 8,266,027.48 7,210,259.65
CREDITORS
Non-current
Private placement bonds 100,418,410.04 100,418,410.04
Loans from credit institutions 20,512,820.51 25,131,942.70
Trade creditors 279.45
120,931,510.00 125,550,352.74
Current
Loans from credit institutions
Advances received 90,883.83 2,570.85
Trade creditors 3,068,581.11 5,340,301.42
Amounts owed to Group
companies 352,147,751.01 437,093,346.44
Amounts owed to
participating interests 37,212,846.36 23,966,613.67
Other debt 69,526,049.14 113,939,237.49
Accruals and deferred income 14,712,230.18 12,029,169.03
476,758,341.63 592,371,238.90
TOTAL LIABILITIES 2,134,356,621.02 2,199,685,399.18
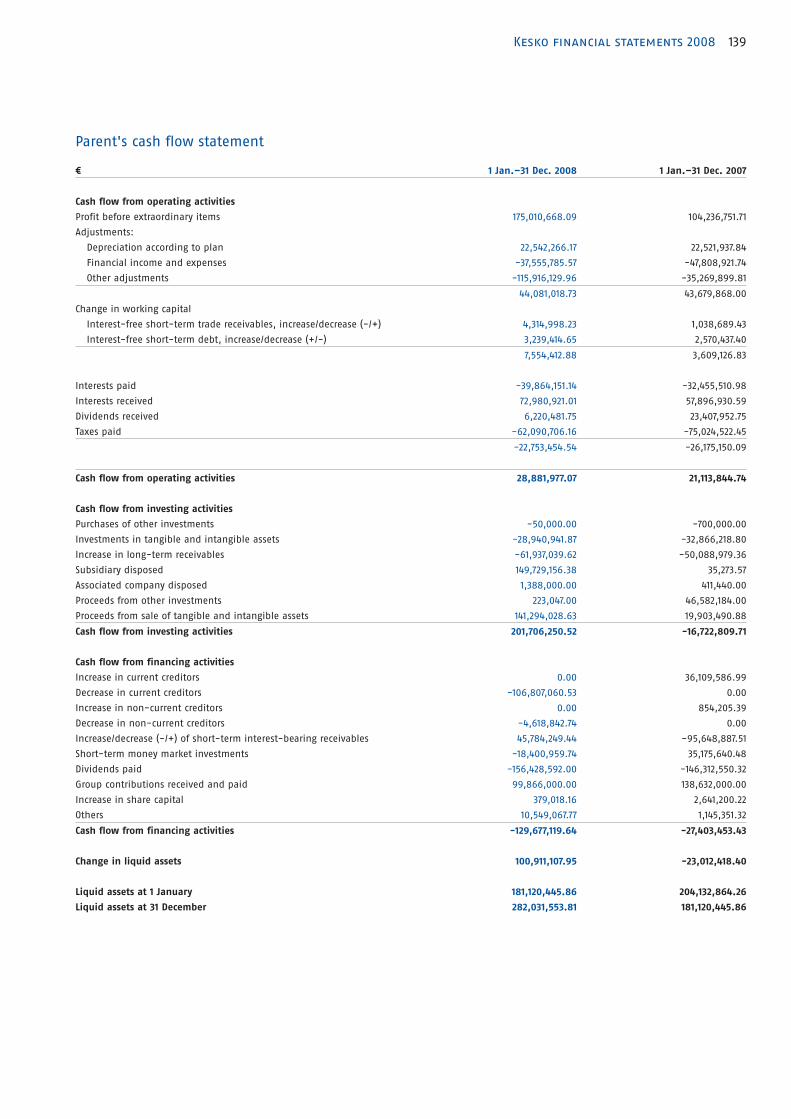
139Kesko financial statements 2008
Parent's cash flow statement
€ 1 Jan.–31 Dec. 2008 1 Jan.–31 Dec. 2007
Cash flow from operating activities
Profit before extraordinary items 175,010,668.09 104,236,751.71
Adjustments:
Depreciation according to plan 22,542,266.17 22,521,937.84
Financial income and expenses -37,555,785.57 -47,808,921.74
Other adjustments -115,916,129.96 -35,269,899.81
44,081,018.73 43,679,868.00
Change in working capital
Interest-free short-term trade receivables, increase/decrease (-/+) 4,314,998.23 1,038,689.43
Interest-free short-term debt, increase/decrease (+/-) 3,239,414.65 2,570,437.40
7,554,412.88 3,609,126.83
Interests paid -39,864,151.14 -32,455,510.98
Interests received 72,980,921.01 57,896,930.59
Dividends received 6,220,481.75 23,407,952.75
Taxes paid -62,090,706.16 -75,024,522.45
-22,753,454.54 -26,175,150.09
Cash flow from operating activities 28,881,977.07 21,113,844.74
Cash flow from investing activities
Purchases of other investments -50,000.00 -700,000.00
Investments in tangible and intangible assets -28,940,941.87 -32,866,218.80
Increase in long-term receivables -61,937,039.62 -50,088,979.36
Subsidiary disposed 149,729,156.38 35,273.57
Associated company disposed 1,388,000.00 411,440.00
Proceeds from other investments 223,047.00 46,582,184.00
Proceeds from sale of tangible and intangible assets 141,294,028.63 19,903,490.88
Cash flow from investing activities 201,706,250.52 -16,722,809.71
Cash flow from financing activities
Increase in current creditors 0.00 36,109,586.99
Decrease in current creditors -106,807,060.53 0.00
Increase in non-current creditors 0.00 854,205.39
Decrease in non-current creditors -4,618,842.74 0.00
Increase/decrease (-/+) of short-term interest-bearing receivables 45,784,249.44 -95,648,887.51
Short-term money market investments -18,400,959.74 35,175,640.48
Dividends paid -156,428,592.00 -146,312,550.32
Group contributions received and paid 99,866,000.00 138,632,000.00
Increase in share capital 379,018.16 2,641,200.22
Others 10,549,067.77 1,145,351.32
Cash flow from financing activities -129,677,119.64 -27,403,453.43
Change in liquid assets 100,911,107.95 -23,012,418.40
Liquid assets at 1 January 181,120,445.86 204,132,864.26
Liquid assets at 31 December 282,031,553.81 181,120,445.86

140 Kesko financial statements 2008
Notes to the parent's financial statementsPrinciples used for preparing the parent's financial statementsKesko Corporation's financial statements have been prepared in
compliance with the Finnish Accounting Standards (FAS).
Non-current assets
Intangible assets
Intangible assets are stated in the balance sheet at cost less
depreciation according to plan.
Depreciation plan
Other capitalised expenditure 5–14 years
Tangible assets
Tangible assets are stated in the balance sheet at cost less
depreciation according to plan.
Depreciation plan
Depreciation according to plan is calculated on a straight line
basis so as to write off the cost of tangible assets over their
estimated useful lives.
The periods adopted for depreciation are as follows:
Buildings 15–33 years
Fixtures and fittings 8 years
Machinery and equipment 8 years
or machinery and equipment
purchased since 1999 25% reducing balance method
Transportation fleet 5 years
Information technology equipment 3–5 years
Other tangible assets 5–14 years
Land has not been depreciated. The total of depreciation
according to plan and the change in depreciation reserve com-
ply with the Finnish tax legislation. The change in depreciation
reserve has been treated as appropriations in the parent
company.
Valuation of financial assets
Marketable securities have been valued at lower of cost or net
realisable value.
Foreign currencies
Items denominated in foreign currencies have been translated
into Finnish currency at the average exchange rate of the Euro-
pean Central Bank at the balance sheet date. If a receivable or
a debt is tied to a fixed rate of exchange, it has been used for
translation. Exchange rate differences have been recognised in
profit or loss.
Derivative financial instruments
Interest rate derivative contracts
Interest rate derivatives are used to modify loan durations. The
target duration is three years and it is allowed to vary between
one and a half and four years. Cash flows arising from interest
rate derivative contracts are recognised during the financial
year as interest income or expenses, according to the maturity
date. In the financial statements, open forward agreements,
futures, options and swaps are stated at market values. Unreal-
ised revaluation is not stated as income. Any valuation losses
are included in interest expenses.
Currency derivative contracts
Currency derivative instruments are used for hedging against
translation and transaction risks. Forward exchange contracts
are valued at the exchange rate of the balance sheet date. The
rate differences arising from open derivative contracts are
reported in financial items. If a derivative instrument has been
used to hedge a foreign-currency-denominated asset, the
value change has been recognised against that of the asset
item. The premiums of option contracts are included in the
balance sheet accruals until they expire, or if a value change at
the balance sheet date so requires, recognition in profit or loss.
Commodity derivatives
Kestra Kiinteistöpalvelut Oy, a Kesko Corporation subsidiary, uses
electricity derivatives to balance the energy costs of the Group
and its retailers. Kesko's subsidiaries engaged in the agricul-
tural trade use grain derivatives to hedge against the grain
price risk. Kesko Corporation is an external counterparty in
electricity and grain derivative contracts made with the bank,
and internally hedges the corresponding price with the sub-
sidiary. At no stage does Kesko Corporation have derivative
positions, and thus there are no effects on profit or loss. The
electricity price risk is reviewed on a 5-year time span. With
respect to derivative contracts hedging the price of electricity
supplied during the financial year, changes in value are recog-
nised in Kesko under interest income and expenses. The unre-
alised gains and losses of contracts hedging future purchases
are not recognised through profit or loss. With respect to grain
derivative contracts, the open contracts in the income state-
ment are recognised at market prices. Valuation differences
related to open contracts are recognised in Kesko under finan-
cial items.
Pension plans
The pension insurances of Kesko Corporation's personnel are
arranged through the Kesko Pension Fund. The Fund's A
department, which provides supplementary pension benefits,
was closed on 9 May 1998. The job-based retirement age
agreed for a number of directors and other superiors in the
Group is 60 or 62 years.
Provisions
Provisions stated in the balance sheet include items bound to
by agreements or otherwise, but remain unrealised. Changes in
provisions are included in the income statement. Rent liabili-
ties for vacant rented premises no longer used for the Group
business operations, as well as the losses resulting from renting
the premises to outsiders, are included in provisions.
Income tax
Income tax includes the income tax payments for the period
based on the profit for the period, and taxes payable for prior
periods, or tax refunds. Deferred taxes are not included in the
parent's income statement and balance sheet.

141Kesko financial statements 2008
Notes to the income statement
€ million 2008 2007
1. Other operating income
Profits on sales of real estate and shares 128.1 51.9
Rent income 169.8 197.4
Merger profit 0.8 -
Others 0.3 0.5
Total 299.0 249.8
Sales profits are related to property lease and sale arrange-
ments between Kesko and Nordisk Renting Oy.
2. Average number of personnel
Kesko Corporation 160 174
Total 160 174
3. Personnel expenses
Salaries and fees 10.0 10.6
Social security expenses
Pension expenses 2.1 2.1
Other social security expenses 0.9 1.0
Total 13.0 13.7
Salaries and fees to the management
Managing Director and his deputy 0.8 0.7
Board of Directors' members 0.3 0.3
Total 1.1 1.0
An analysis of the management's salaries and fees is included
in the notes to the consolidated financial statements.
4. Depreciation and reduction in value
Depreciation according to plan 22.5 22.5
Reduction in value, non-current assets 15.0 1.5
Total 37.5 24.0
The reduction in value is related to the Hämeenkylä distribution
centre property in Vantaa, which will be replaced by a new
logistics centre in 2011.
5. Other operating expenses
Rent expenses 87.6 117.1
Marketing expenses 2.2 3.0
Maintenance of real estate and store sites 15.6 17.1
Data communications expenses 12.2 11.1
Losses on sales of real estate and shares 1.0 0.1
Merger losses 2.7 16.2
Other operating expenses 8.6 8.0
Total 129.9 172.5
PricewaterhouseCoopers, Authorised
Public Accountants
Auditor's fees 0.1 0.1
Tax consultation 0.1 0.1
Other fees 0.1 0.0
Total 0.3 0.2
€ million 2008 2007
6. Financial income and expenses
Dividend income
From Group companies 6.2 23.4
Dividend income, total 6.2 23.4
Other interest and financial income
From Group companies 50.7 47.9
From others 67.2 26.4
Interest income, total 117.9 74.3
Interest and other financial expenses
To Group companies -27.8 -21.4
To others -58.8 -28.5
Interest expenses, total -86.6 -49.9
Total 37.6 47.8
7. Items included in extraordinary
income and expenses
Contributions from Group companies 153.7 171.3
Contributions to Group companies -53.9 -32.7
Total 99.8 138.6
8. Appropriations
Difference between depreciation
according to plan
and depreciation in taxation 26.5 5.8
Total 26.5 5.8
9. Changes in provisions
Future rent expenses for vacant business
premises -2.0 -1.1
Other changes 3.1 0.0
Total 1.1 -1.1
10. Income taxes
Income taxes on extraordinary items -26.0 -36.0
Income taxes on operating activities -38.6 -18.3
Total -64.7 -54.4
Deferred taxes
Deferred tax liabilities and assets have not been included in the
balance sheet. Their total amount is immaterial.
Notes to the balance sheet
€ million 2008 2007
11. Other capitalised long-term expenditure
Acquisition cost at 1 January 38.3 39.7
Increases 0.7 0.1
Decreases -0.9 -1.5
Transfers between items 1.0 0.0
Acquisition cost at 31 December 39.1 38.3

142 Kesko financial statements 2008
€ million 2008 2007
Accumulated depreciation at 1 January 30.6 29.3
Accumulated depreciation on decreases
and transfers -0.4 -0.9
Depreciation for the financial year 2.4 2.2
Accumulated depreciation at 31 December 32.6 30.6
Book value at 31 December 6.5 7.7
Advance payments
Acquisition cost at 1 January 2.5 2.2
Increases 0.6 1.6
Decreases -0.4 -1.3
Transfers between items -1.0 0.0
Acquisition cost at 31 December 1.7 2.5
Book value at 31 December 1.7 2.5
12. Tangible assets
Land and waters
Acquisition cost at 1 January 112.2 114.5
Increases 8.3 4.3
Decreases -9.1 -6.7
Transfers between items 0.0 0.0
Acquisition cost at 31 December 111.4 112.2
Book value at 31 December 111.4 112.2
Buildings
Acquisition cost at 1 January 513.2 503.9
Increases 24.2 19.1
Decreases -26.9 -13.6
Transfers between items 4.4 3.9
Acquisition cost at 31 December 514.9 513.2
Accumulated depreciation at 1 January 181.8 166.2
Accumulated depreciation on decreases
and transfers -8.6 -1.7
Value adjustment 15.0 0.0
Depreciation and value adjustments for
the financial year 17.3 17.4
Accumulated depreciation at 31 December 205.5 181.8
Book value at 31 December 309.4 331.4
Machinery and equipment
Acquisition cost at 1 January 25.5 25.1
Increases 1.0 1.0
Decreases -1.9 -0.8
Transfers between items 0.1 0.2
Acquisition cost at 31 December 24.7 25.5
Accumulated depreciation at 1 January 19.6 18.4
Accumulated depreciation on decreases
and transfers -1.3 -0.6
Depreciation for the financial year 1.5 1.8
Accumulated depreciation at 31 December 19.7 19.6
Book value at 31 December 5.0 6.0
Other tangible assets
Acquisition cost at 1 January 13.7 12.5
Increases 2.8 1.1
Decreases -1.4 -0.3
Transfers between items 0.1 0.4
Acquisition cost at 31 December 15.2 13.7
€ million 2008 2007
Accumulated depreciation at 1 January 6.5 5.4
Accumulated depreciation on decreases
and transfers -0.7 0.0
Depreciation for the financial year 1.2 1.1
Accumulated depreciation at 31 December 7.0 6.5
Book value at 31 December 8.2 7.2
Advance payments and construction in
progress
Acquisition cost at 1 January 5.4 5.2
Increases 6.3 4.7
Transfers between items -4.6 -4.5
Acquisition cost at 31 December 7.1 5.4
Book value at 31 December 7.1 5.4
Revaluation of non-current assets
At the end of the financial year, Kesko Corporation's balance sheet did
not contain revaluations.
13. Investments
Holdings in Group companies
Acquisition cost at 1 January 404.0 388.0
Increases 3.2 109.7
Decreases -133.6 -93.7
Acquisition cost at 31 December 273.6 404.0
Accumulated depreciation at 1 January 1.7 0.2
Value adjustments -1.7 1.5
Accumulated depreciation at 31 December 0.0 1.7
Book value at 31 December 273.6 402.3
Participating interests
Acquisition cost at 1 January 19.8 20.0
Increases 0.1 -
Decreases -1.2 -0.2
Acquisition cost at 31 December 18.7 19.8
Book value at 31 December 18.7 19.8
Other shares and similar rights of
ownership
Acquisition cost at 1 January 7.3 16.3
Increases 0.0 0.7
Decreases 0.0 -9.7
Acquisition cost at 31 December 7.3 7.3
Book value at 31 December 7.3 7.3
Kesko Corporation's ownership interests in other companies as
at 31 December 2008 are presented in the notes to the consoli-
dated financial statements.
During the period, Kesko Corporation sold its wholly-owned
subsidiaries Kauko-Telko Ltd, Tähti Optikko Group Oy and
K-Rahoitus Oy. In addition, the company founded a new sub-
sidiary, K-talouspalvelukeskus Oy. Among subsidiaries directly
owned by Kesko Corporation, other changes took place in real
estate companies only. During the 2007 financial year, Keswell
Ltd, a company wholly owned by Kesko Corporation merged into
Kesko Corporation.

143Kesko financial statements 2008
€ million 2008 2007
14. Debtors
Amounts owed by Group companies
Long-term
Loan receivables 389.4 374.4
Subordinated loans 10.0 10.0
Long-term receivables, total 399.4 384.4
Short-term
Trade debtors 1.0 1.4
Loan receivables 541.2 586.0
Other debtors 0.0 -
Prepayments and accrued income 4.4 2.6
Short-term receivables, total 546.6 590.0
Total 946.0 974.4
Amounts owed by participating interests
Long-term
Loan receivables 1.5 0.9
Short-term
Trade debtors 0.0 0.0
Loan receivables 3.1 4.1
Short-term receivables, total 3.1 4.2
Total 4.6 5.1
Prepayments and accrued income
Taxes 7.3 8.7
Others 18.1 21.3
Total 25.4 30.0
15. Capital and reserves
Share capital at 1 January 195.5 195.0
Subscriptions with options 0.1 0.5
Share capital at 31 December 195.6 195.5
Share issue, exercise of options at 1 January
Increase 0.4 2.6
Transfer to share capital -0.1 -0.5
Transfer to share premium account -0.2 -2.1
Share issue, exercise of options at 31 December 0.1 0.0
Share premium account at 1 January 190.1 187.9
Subscriptions with options 0.2 2.1
Share premium account at 31 December 190.3 190.1
Revaluation reserve at 1 January - -
Change in revaluation reserve - -
Revaluation reserve at 31 December - -
Other reserves at 1 January 243.4 243.4
Other reserves at 31 December 243.4 243.4
Retained earnings at 1 January 687.8 639.9
Distribution of dividends -156.4 -146.3
Transfer to donations -0.3 -0.3
Expired dividends 1997–2001 0.3
Retained earnings at 31 December 531.1 493.6
Profit for the financial year 236.7 194.3
Capital and reserves, total 1 397.2 1 316.9
Increase in share capital
During the reporting period, the share capital was increased
seven times as a result of share subscriptions with the stock
options of the year 2003 option scheme. The increases were
made on 11 February 2008 (€210), 28 April 2008 (€38,168), 9 June
2008 (€42,200), 28 July 2008 (€8,600), 1 October 2008 (€4,000),
27 October 2008 (€6,000) and 18 December 2008 (€15,000), and
announced in stock exchange notifications on the same days.
The subscribed shares were included on the main list of the
Helsinki Stock Exchange for public trading with the old B shares
on 12 February 2008, 29 April 2008, 10 June 2008, 29 July 2008,
2 October 2008, 28 October 2008, and 19 December 2008.
Distributable reserves
Other reserves 243.4 243.4
Retained earnings 531.1 493.6
Profit for the financial year 236.7 194.3
Total 1,011.2 931.3
Breakdown of the parent company's share capital
pcs
counter
value, € € million
A shares 31,737,007 2 63.5
B shares 66,087,847 2 132.2
Total 97,824,854 195.6
Voting rights carried by shares number of votes
A share 10
B share 1
Year 2003 and 2007 stock option plans
On 31 March 2003, the Annual General Meeting resolved to gra-
tuitously issue a total of 1,800,000 share options to the man-
agement of the Kesko Group as well as to a wholly-owned sub-
sidiary of Kesko Corporation. A deviation was made from the
shareholders' pre-emptive right to subscription since the
options form a part of the incentive and commitment pro-
gramme for the management. Each option entitles the holder
to subscribe for one new Kesko Corporation B share. The options
are marked with symbols 2003D (KESBVEW103), 2003E
(KESBVEW203) and 2003F (KESBVEW303) in units of 600,000
options each.
The Annual General Meeting of 26 March 2007 decided to grant
a total of 3,000,000 stock options for no consideration to the
Kesko Group management and the management of the other
Group companies, to the rest of the key Kesko personnel, and
to Sincera Oy, a subsidiary wholly owned by Kesko Corporation.
A deviation was made from the shareholders' pre-emptive right
to subscription since the options form a part of the incentive
and commitment programme for the management. Each stock
option entitles its holder to subscribe for one new Kesko Corpo-
ration B share. The stock options shall be marked with symbols
2007A, 2007B and 2007C in units of 1,000,000 options each.
Share of granted options of share capital and votes
Presuming that shares are subscribed for with all of the
1,800,000 options issued under the year 2003 plan, and with all
of the 3,000,000 options issued under the year 2007 plan, the
shares subscribed for with options account for 4.69% of shares

144 Kesko financial statements 2008
and 1.23% of all votes. The subscriptions made with stock
options may raise the number of the company's shares to
101,712,793, and the voting rights of all shares to 387,345,856
votes. The company has no other options or other special rights
entitling to shares.
Authorisations of the Board of Directors
Kesko's Annual General Meeting of 26 March 2007 authorised
the Board to decide about the issuance of new B shares.
B shares can be issued against payment to the company's
existing shareholders in proportion to their existing sharehold-
ings regardless of whether they consist of A or B shares, or,
deviating from shareholders' pre-emptive rights in order for the
issued shares to be used as consideration in possible company
acquisitions, other company business arrangements, or to
finance investments. The maximum number of new shares
issued is 20,000,000.
The Board of Directors was also authorised to decide about
the subscription price of the shares, to issue shares against
non-cash consideration, and to make decisions concerning any
other matters relating to share issues. The authorisation is valid
for two (2) years after the decision by the Annual General
Meeting.
The Board of Directors has no other authorisation concerning
an issue of rights, convertible bonds or options valid at the
moment.
€ million 2008 2007
16. Appropriations
Depreciation reserve 131.2 157.7
Total 131.2 157.7
17. Provisions
Future rent expenses for vacant business
premises 5.2 7.1
Other provisions 3.1 0.1
Total 8.3 7.2
18. Non-current creditors
Debt falling due later than within five
years
Private placement bonds 100.4 100.4
Loans from credit institutions 20.5 25.1
Total 120.9 125.6
On 10 June 2004, Kesko Corporation issued a private placement
of USD 120 million in the US. The arrangement consists of three
bullet loans: a 10-year loan (USD 60 million), a 12-year loan
(USD 36 million) and a 15-year loan (USD 24 million). Kesko has
hedged the loan by using currency and interest rate swaps,
as a result of which the loan capital totals €100.4 million and
the fixed capital-weighted average interest rate is 5.4%.
19. Current creditors
Debt to Group companies
Trade creditors 0.6 2.0
Other creditors 349.8 433.6
Accruals and deferred income 1.7 1.5
Total 352.1 437.1
Amounts owed to participating interests
Trade creditors 0.0 0.0
Other creditors 37.2 24.0
Accruals and deferred income 0.0 -
Total 37.2 24.0
Accruals and deferred income
Staff expenses 2.6 2.5
Taxes 0.0 -
Others 12.1 9.6
Total 14.7 12.0
20. Interest-free debt
Current creditors 21.3 21.5
Total 21.3 21.5
Other notes
€ million 2008 2007
21. Guarantees and contingent liabilities
Debt for the security of which real estate
mortgages have been given
Other short-term debt 1 1
Mortgages given 6 6
Debt for the security of which shares
have been given
Other short-term debt 2
Pledged shares 14 14
Other contingent liabilities
Real estate mortgages
For own debt 1
For Group companies 10 10
Guarantees
For Group companies 58 101
For shareholders 0 1
For others 1 0
Other contingent liabilities
For own debt 10 11
Leasing liabilities
Falling due within a year 1 0
Falling due later 0 1
Liabilities arising from derivative instruments
€ million 2008
Fair
value 2007
Fair
value
Value of underlying instruments at
31 Dec.
Interest rate derivatives
Forward and future contracts - 34 -0.1
Interest rate swaps 201 9.9 201 4.9
Currency derivatives
Forward and future contracts 333 6.6 366 0.2
Option agreements
Bought - - - -
Written - - - -
Currency swaps 100 -14.2 100 -18.9
Commodity derivatives
Electricity derivatives 46 -10.8 37 7.9
Grain derivatives 1 0.0 5 -0.4

145Kesko financial statements 2008
To the Annual General Meeting of Kesko Corporation
We have audited the accounting records, the financial state-
ments, the report of the Board of Directors and the administra-
tion of Kesko Corporation for the year ended on 31 December,
2008. The financial statements comprise the consolidated bal-
ance sheet, income statement, cash flow statement, statement
of changes in equity and notes to the consolidated financial
statements, as well as the parent company's balance sheet,
income statement, cash flow statement and notes to the finan-
cial statements.
Responsibility of the Board of Directors and
the Managing Director
The Board of Directors and the Managing Director are responsible
for the preparation of the financial statements and the report of
the Board of Directors and for the fair presentation of the con-
solidated financial statements in accordance with International
Financial Reporting Standards (IFRS) as adopted by the EU, as
well as for the fair presentation of the parent company’s finan-
cial statements and the report of the Board of Directors in
accordance with laws and regulations governing the preparation
of the financial statements and the report of the Board of Direc-
tors in Finland. The Board of Directors is responsible for the
appropriate arrangement of the control of the company’s
accounts and finances, and the Managing Director shall see to it
that the accounts of the company are in compliance with the
law and that its financial affairs have been arranged in a reli-
able manner.
Auditors' Responsibility
Our responsibility is to perform an audit in accordance with
good auditing practice in Finland, and to express an opinion on
the parent company’s financial statements, on the consolidated
financial statements and on the report of the Board of Directors
based on our audit. Good auditing practice requires that we
comply with ethical requirements and plan and perform the
audit to obtain reasonable assurance whether the financial
statements and the report of the Board of Directors are free from
material misstatement and whether the members of the Board
of Directors of the parent company and the Managing Director
have complied with the Limited Liability Companies Act.
An audit involves performing procedures to obtain audit evi-
dence about the amounts and disclosures in the financial state-
ments and the report of the Board of Directors. The procedures
selected depend on the auditors' judgment, including the
assessment of the risks of material misstatement of the financial
statements, whether due to fraud or error. In making those risk
assessments, the auditor considers internal control relevant to
the entity’s preparation and fair presentation of the financial
statements in order to design audit procedures that are appro-
priate in the circumstances. An audit also includes evaluating
the appropriateness of accounting policies used and the reason-
ableness of accounting estimates made by management, as well
as evaluating the overall presentation of the financial statements
and the report of the Board of Directors.
The audit was performed in accordance with good auditing
practice in Finland. We believe that the audit evidence we have
obtained is sufficient and appropriate to provide a basis for our
audit opinion.
Opinion on the Consolidated Financial Statements
In our opinion, the consolidated financial statements give a true
and fair view of the financial position, financial performance,
and cash flows of the group in accordance with International
Financial Reporting Standards (IFRS) as adopted by the EU.
Opinion on the Company’s Financial Statements and
the Report of the Board of Directors
In our opinion, the financial statements and the report of the
Board of Directors give a true and fair view of both the consoli-
dated and the parent company's financial performance and
financial position in accordance with the laws and regulations
governing the preparation of the financial statements and the
report of the Board of Directors in Finland. The information in
the report of the Board of Directors is consistent with the infor-
mation in the financial statements.
We recommend that the financial statements should be
adopted. The proposal by the Board of Directors regarding the
use of the profit shown at the balance sheet and the distribution
of other unrestricted equity is in compliance with the Limited
Liability Companies Act. We recommend that the Members of the
Board of Directors and the Managing Director should be dis-
charged from liability for the financial period audited by us.
Helsinki, 9 February 2009
PricewaterhouseCoopers Oy, Authorised Public Accountants
Johan Kronberg, Authorised Public Accountant
SignaturesSignatures
Helsinki, 4 February 2009
Heikki Takamäki Keijo Suila
Pentti Kalliala Ilpo Kokkila Maarit Näkyvä
Seppo Paatelainen Jukka Säilä Matti Halmesmäki
Managing Director
Auditors' report
The auditors' note
Our auditors' report has been issued today.
Helsinki, 9 February 2009
PricewaterhouseCoopers Oy
Authorised Public Accountants
Johan Kronberg
APA

146 Kesko financial statements 2008
Dividend policy
On 4 February 2009, Kesko's Board of Directors decided to revise
Kesko's dividend policy published on 6 April 2005. In addition to
the financial position and the operating strategy, the new policy
takes account of the nature of non-recurring items. According to
Kesko Corporation's revised dividend policy, Kesko Corporation
distributes at least 50% of its earnings per share excluding non-
recurring items as dividends, taking however the company's
financial position and operating strategy into account (stock
exchange release 5 February 2009).
The financial objectives are presented on page 12.
Proposed dividends for the year 2008Kesko Corporation's Board of Directors proposes to the Annual
General Meeting that €97,851,050.00 or €1.00 per share, be dis-
tributed as dividends from the net profit for the year 2008, rep-
resenting 44.7% of earnings per share and 69.6% of earnings per
share excluding non-recurring items. During the past five years,
71.5% of earnings per share, on the average, has been distrib-
uted as dividends.
Basic information on the shares at 31 December 2008
A share
shortname: KESAV (OMX)•
ISIN code: FI0009007900•
voting rights per share: 10 votes•
number of shares: 31,737,007•
market capitalisation: €698 million•
B share
shortname: KESBV (OMX)•
ISIN code: FI0009000202•
voting rights per share: 1 vote•
number of shares: 66,087,847•
market capitalisation: €1,176 million•
Trading unit of both share series: 1 share
Total share capital: €195,649,708
Total number of shares: 97,824,854
Voting rights carried by all shares: 383,457,917
Market capitalisation: €1,875 million
Share series and share capital
Kesko Corporation's share capital is divided into A share series
and B share series. The company's share capital was
€195,649,708.
The minimum number of A shares is one (1) and the maximum
number two hundred and fifty million (250,000,000) and the
minimum number of B shares is one (1) and the maximum
number two hundred and fifty million (250,000,000), provided
that the total number of shares is at minimum two (2) and at
maximum four hundred million (400,000,000).
The total number of shares is 97,824,854, of which 31,737,007
(32.4%) are A shares and 66,087,847 (67.6%) are B shares.
Each A share entitles the holder to 10 votes and each B share to
1 vote. Both shares give the same dividend rights. The number of
votes entitled by A shares is 83% and the number of votes enti-
tled by B shares 17% of the total voting rights.
The shares are included in the book-entry securities system
held by the Euroclear Finland Ltd.
The right to receive distributions from the company and the
right to subscribe for shares when the share capital is increased
belongs only to those:
who are registered as shareholders in the shareholder register •
on the record date
whose right to receive funds has been entered by the record •
date into the book-entry securities account of the shareholder
registered in the shareholder register, and registered in the
shareholder register, and
if a share has been registered in a nominee name, into •
whose book-entry securities account the share has been
entered by the record date, and whose custodian has been
registered in the shareholder register as the custodian of the
shares by the record date.
Authorisations of the Board of Directors
and treasury shares
The Kesko Annual General Meeting, held on 26 March 2007,
authorised the company's Board of Directors to decide about the
issuance of new B shares. The new B shares can be issued
against payment either to the company's shareholders in pro-
portion to their existing shareholdings, regardless of whether
they consist of A or B shares, or in a directed issue deviating from
shareholders' pre-emptive rights in order for the issued shares to
be used as consideration in possible company acquisitions, other
company business arrangements, or financial investments. The
company must have a weighty financial reason for deviating from
pre-emptive rights. The maximum number of new shares issued
shall be 20,000,000.
The authorisation also includes an authorisation given by the
Board of Directors to decide on the subscription price of the
issued shares, the right to issue shares against non-cash consid-
eration and the right to make decisions concerning any other
matters relating to share issues.
The authorisation shall be valid for two (2) years after the deci-
sion in the General Meeting.
The Board of Directors had no other valid authorisation to issue
shares, to increase the share capital, or to acquire or assign treas-
ury shares.
Kesko Corporation or any of its subsidiaries held no Kesko
Corporation shares.
Shareholders
According to the register of Kesko's shareholders kept by the
Euroclear Finland Ltd, there were 38,080 shareholders at the end
of 2008 (28,925 at the end of 2007). The total number of shares
registered in a nominee name was 18,909,587, accounting for
19.33% of the shares (33,170,238 and 33.93% respectively at the
end of 2007). The number of votes entitled by these shares was
19,535,132, or 5.09% of the total voting rights (33,733,485 or 8.8%
respectively at the end of 2007). A list of Kesko's largest share-
holders, updated monthly, is available at www.kesko.fi/
investors.
Year 2003 stock option scheme
On 31 March 2003, the Annual General Meeting resolved to gra-
tuitously issue a total of 1,800,000 stock options to the manage-
ment of the Kesko Group as well as to a wholly-owned subsidi-
ary of Kesko Corporation. A deviation was made from the share-
holders' pre-emptive right to subscription since the stock options
form a part of the incentive and commitment programme for the
management. The scheme comprises approximately 60 persons.
Each stock option entitles its owner to subscribe for one Kesko
Corporation B share. The stock options have been marked with
shortnames 2003D (KESBVEW103, ISIN code FI0009609317), 2003E
Shares and shareholders

147Kesko financial statements 2008
(KESBVEW203, ISIN code FI0009609325), and 2003F (KESBVEW303,
ISIN code FI0009609333), in units of 600,000 stock options each.
The share subscription periods are:
for stock option 2003D 1 April 2005–30 April 2008,•
for stock option 2003E 1 April 2006–30 April 2009, and•
for stock option 2003F 1 April 2007–30 April 2010.•
The original share subscription price for stock option 2003D was
the trade volume weighted average price of a Kesko Corporation
B share on the Helsinki Stock Exchange between 1 to 30 April
2003 (€9.63), for stock option 2003E, the corresponding price
between 1 to 30 April 2004 (€15.19) and for stock option 2003F,
the corresponding price between 1 to 30 April 2005 (€19.08). From
the prices of shares subscribed for with stock options shall be
deducted the amount of the dividend per share distributed after
the above period for the determination of the subscription price
has ended but before the date of subscription for shares.
At the end of 2008, the subscription price of a B share sub-
scribed for with stock option 2003E was €8.99, with stock option
2003F €14.88. The subscription period for stock option 2003D
ended on 30 April 2008. Dividend rights and other shareholder
rights of the share subscribed for with options take effect when
the share capital increase has been entered in the Trade Register.
The 2003D stock options were listed on the Helsinki Stock
Exchange on 1 April 2005, the 2003E stock options on 1 April 2006
and the 2003F stock options on 1 April 2007.
Year 2007 stock option scheme
The Annual General Meeting of 26 March 2007 decided to grant
a total of 3,000,000 stock options for no consideration to the
Kesko Group management and other key Kesko personnel, and
to a subsidiary wholly owned by Kesko Corporation. The company
had a weighty financial reason for granting stock options because
they are intended to be part of Kesko's share-based incentive
system.
Each stock option entitles its holder to subscribe for one new
Kesko Corporation B share. The stock options shall be marked
with symbols 2007A, 2007B and 2007C in units of 1,000,000
options each.
The exercise periods of the options shall be:
for stock option 2007A, from 1 April 2010 until 30 April 2012, •
for stock option 2007B, from 1 April 2011 until 30 April 2013 and •
for stock option 2007C, from 1 April 2012 until 30 April 2014.•
The original subscription price for stock option 2007A shall be the
trade volume weighted average quotation of a Kesko Corporation
B share on the Helsinki Stock Exchange between 1 April and 30
April 2007 (€45.82), for stock option 2007B between 1 April and 30
April 2008 (€26.57), and for stock option 2007C between 1 April
and 30 April 2009. The subscription prices of shares subscribed
for with stock options shall be reduced by the amount decided
after the beginning of the period for the determination of the
subscription price but before the subscription as at the record
date for each dividend distribution or other distribution of funds.
Presuming that shares are subscribed for with all of the
1,800,000 stock options granted under the year 2003 plan and all
of the 3,000,000 stock options granted under the year 2007 plan,
the shares subscribed for with stock options account for 4.69% of
shares and 1.23% of all votes. The subscriptions made with stock
options may raise the number of the company's shares to
101,712,793, and the voting rights of all shares to 387,345,856 votes.
Share subscriptions made with stock options
In 2008, the share capital was raised seven times corresponding
to share subscriptions made with stock options granted under
the year 2003 plan: on 11 February (by €210), on 28 April (by
€38,168), on 9 June (by €42,200), on 28 July (by €8,600), on 1
October (by €4,000), on 27 October (by €6,000) and on 18 Decem-
ber (by €15,000). The total share capital increase in 2008 was
€114,178 (57,089 shares).
By the end of 2008, 574,088 B shares had been subscribed for
with the 2003D options (subscription period has ended), 192,606
B shares with the 2003E options and 119,455 B shares with the
2003F options, or 886,149 B shares in aggregate. The subscribed
shares have been included in the main list of the NASDAQ OMX
Helsinki Stock Exchange for public trading.
Other special shareholding rights
The company has not issued other stock options, convertible
bonds, bonds with warrants or other special rights to company
shares.
Shares and stock options held by the management
At the end of 2008, the members of Kesko Corporation's Board of
Directors, the President and CEO and the corporations under their
control held 202,910 Kesko A shares (197,030 A shares at the end
of 2007) and 210,370 Kesko B shares (170,520), i.e. a total of
413,280 shares (367,550), which represented 0.42% (0.38%) of the
company's total share capital and 0.58% (0.56%) of its voting
rights.
At the end of 2007, the company's Managing Director held a
total of 100,000 Kesko stock options (50,000 at the end of 2007),
which represented 0.10% (0.05%) of the company's total share
capital and 0.03% (0.01%) of voting rights, presuming that shares
have been subscribed for with all of these options. No Board
members held stock options at the end of 2008 (nor at the end of
2007).
Detailed information on shares and stock options held by the
management at the beginning and at the end of 2008 is given on
pages 66–69.
Trading in Kesko's shares and stock options in 2008
Kesko Corporation's shares are listed on the NASDAQ OMX Helsinki
Stock Exchange. Key information about share trading in 2008 is
given in the tables and graphs on this double page spread. The
price trends of both shares closely followed the general trend.
The prices of liquid B shares dropped by 53 percent and those of
less liquid A shares by 42 percent, while the NASDAQ OMX Helsinki
All Share Index was down 53 percent. The trading in B shares was
lively, nearly matching the high level of the previous year.
Instead the value traded almost halved. The number of A shares
traded remained at about 40% compared with the previous year,
and the value traded represented only about one quarter of last
year's level. At the end of the year, the market capitalisation of
A shares was €698 million and that of B shares €1,176 million.
The total market capitalisation of the company was €1,875 mil-
lion, a decrease of €1,817 million, or 49% during the year.
Flagging notifications
Kesko Corporation did not receive any flagging notification during
2008.
The company has not been informed of any agreements relat-
ing to its share ownership or the exercising of its voting rights.

148 Kesko financial statements 2008
Key share
performance
indicators
Equity per share, €, at 31 Dec., diluted
2004 20072006 20082005
16
14
12
10
8
6
4
2
0
Number of shareholders, at 31 Dec.
2004 20072006 20082005
25
20
15
10
5
0
Earnings per share and
dividend per share, €
2004 2005 2007 20082006
40,000
35,000
30,000
25,000
20,000
15,000
10,000
5,000
0
A share B share Earnings per share, diluted Dividend per share
* proposal to the Annual General Meeting
Share price per earnings, P/E ratio,
at 31 Dec., diluted
B share B
NASDAQ OMX Helsinki CAP N
NASDAQ OMX Helsinki
Trading volume of Kesko B share
1/2004 12/20081/2006 1/20071/2005
18,000,000
15,000,000
12,000,000
9,000,000
6,000,000
3,000,000
0
60
50
40
30
20
10
0
Share trading by month, pcs Average share price, €
2004 2005 2007 20082006
4.0
3.5
3.0
2.5
2.0
1.5
1.0
0.5
0
Market capitalisation of Kesko shares
A shareA
B share
1/2004 1/2005 1/2007 12/20081/2006
Kesko € million
6,000
5,000
4,000
3,000
2,000
1,000
0
*
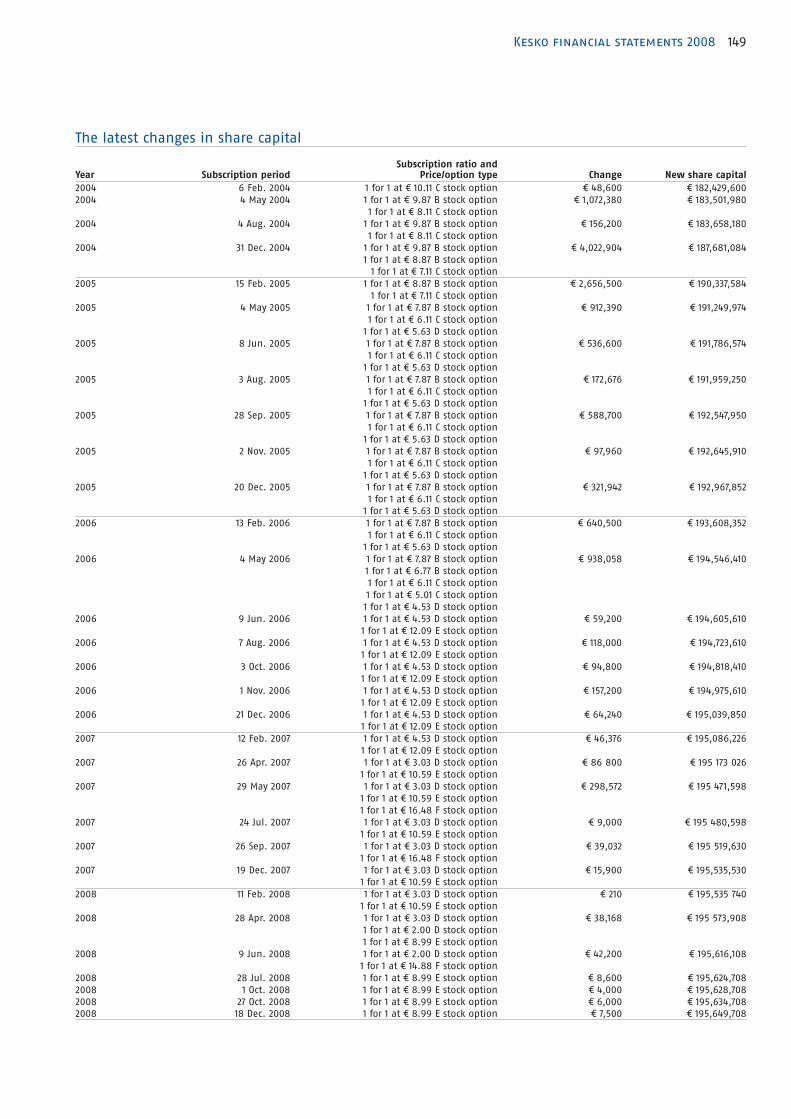
149Kesko financial statements 2008
The latest changes in share capital
Year Subscription period Subscription ratio and
Price/option type Change New share capital
2004 6 Feb. 2004 1 for 1 at € 10.11 C stock option € 48,600 € 182,429,600
2004 4 May 2004 1 for 1 at € 9.87 B stock option € 1,072,380 € 183,501,980
1 for 1 at € 8.11 C stock option
2004 4 Aug. 2004 1 for 1 at € 9.87 B stock option € 156,200 € 183,658,180
1 for 1 at € 8.11 C stock option
2004 31 Dec. 2004 1 for 1 at € 9.87 B stock option € 4,022,904 € 187,681,084
1 for 1 at € 8.87 B stock option1 for 1 at € 7.11 C stock option
2005 15 Feb. 2005 1 for 1 at € 8.87 B stock option € 2,656,500 € 190,337,584
1 for 1 at € 7.11 C stock option
2005 4 May 2005 1 for 1 at € 7.87 B stock option € 912,390 € 191,249,974
1 for 1 at € 6.11 C stock option
1 for 1 at € 5.63 D stock option
2005 8 Jun. 2005 1 for 1 at € 7.87 B stock option € 536,600 € 191,786,574
1 for 1 at € 6.11 C stock option
1 for 1 at € 5.63 D stock option
2005 3 Aug. 2005 1 for 1 at € 7.87 B stock option € 172,676 € 191,959,250
1 for 1 at € 6.11 C stock option
1 for 1 at € 5.63 D stock option
2005 28 Sep. 2005 1 for 1 at € 7.87 B stock option € 588,700 € 192,547,950
1 for 1 at € 6.11 C stock option
1 for 1 at € 5.63 D stock option
2005 2 Nov. 2005 1 for 1 at € 7.87 B stock option € 97,960 € 192,645,910
1 for 1 at € 6.11 C stock option
1 for 1 at € 5.63 D stock option
2005 20 Dec. 2005 1 for 1 at € 7.87 B stock option € 321,942 € 192,967,852
1 for 1 at € 6.11 C stock option1 for 1 at € 5.63 D stock option
2006 13 Feb. 2006 1 for 1 at € 7.87 B stock option € 640,500 € 193,608,352
1 for 1 at € 6.11 C stock option
1 for 1 at € 5.63 D stock option
2006 4 May 2006 1 for 1 at € 7.87 B stock option € 938,058 € 194,546,410
1 for 1 at € 6.77 B stock option
1 for 1 at € 6.11 C stock option
1 for 1 at € 5.01 C stock option
1 for 1 at € 4.53 D stock option
2006 9 Jun. 2006 1 for 1 at € 4.53 D stock option € 59,200 € 194,605,610
1 for 1 at € 12.09 E stock option
2006 7 Aug. 2006 1 for 1 at € 4.53 D stock option € 118,000 € 194,723,610
1 for 1 at € 12.09 E stock option
2006 3 Oct. 2006 1 for 1 at € 4.53 D stock option € 94,800 € 194,818,410
1 for 1 at € 12.09 E stock option
2006 1 Nov. 2006 1 for 1 at € 4.53 D stock option € 157,200 € 194,975,610
1 for 1 at € 12.09 E stock option
2006 21 Dec. 2006 1 for 1 at € 4.53 D stock option € 64,240 € 195,039,8501 for 1 at € 12.09 E stock option
2007 12 Feb. 2007 1 for 1 at € 4.53 D stock option € 46,376 € 195,086,226
1 for 1 at € 12.09 E stock option
2007 26 Apr. 2007 1 for 1 at € 3.03 D stock option € 86 800 € 195 173 026
1 for 1 at € 10.59 E stock option
2007 29 May 2007 1 for 1 at € 3.03 D stock option € 298,572 € 195 471,598
1 for 1 at € 10.59 E stock option
1 for 1 at € 16.48 F stock option
2007 24 Jul. 2007 1 for 1 at € 3.03 D stock option € 9,000 € 195 480,598
1 for 1 at € 10.59 E stock option
2007 26 Sep. 2007 1 for 1 at € 3.03 D stock option € 39,032 € 195 519,630
1 for 1 at € 16.48 F stock option
2007 19 Dec. 2007 1 for 1 at € 3.03 D stock option € 15,900 € 195,535,5301 for 1 at € 10.59 E stock option
2008 11 Feb. 2008 1 for 1 at € 3.03 D stock option € 210 € 195,535 740
1 for 1 at € 10.59 E stock option
2008 28 Apr. 2008 1 for 1 at € 3.03 D stock option € 38,168 € 195 573,908
1 for 1 at € 2.00 D stock option
1 for 1 at € 8.99 E stock option
2008 9 Jun. 2008 1 for 1 at € 2.00 D stock option € 42,200 € 195,616,108
1 for 1 at € 14.88 F stock option
2008 28 Jul. 2008 1 for 1 at € 8.99 E stock option € 8,600 € 195,624,708
2008 1 Oct. 2008 1 for 1 at € 8.99 E stock option € 4,000 € 195,628,708
2008 27 Oct. 2008 1 for 1 at € 8.99 E stock option € 6,000 € 195,634,7082008 18 Dec. 2008 1 for 1 at € 8.99 E stock option € 7,500 € 195,649,708

150 Kesko financial statements 2008
Prices and trading of Kesko A and B shares on the NASDAQ OMX Helsinki Stock Exchange in 2008
Share
Share price, €
31 Dec. 2007
Share price, €
31 Dec. 2008 Change,% Lowest price, € Highest price, €
Trading volume,
1,000 pcs
Total value traded,
€ thousand
A share 37.85 22.00 - 41.9 21.33 38.20 1,427 40,977
B share 37.72 17.80 - 52.8 15.31 38.12 121,109 2,859,234
During the year, the NASDAQ OMX Helsinki All Share Index dropped by 53.4% and the NASDAQ OMX HelsinkiCAP Index by 50.1%, while
the Helsinki Stock Exchange Consumer Staples Index fell by 57.1%. Up-to-date information on shares and shareholders is available
at www.kesko.fi.
10 largest shareholders by number of shares (A and B series) at 31.12.2008
Number of shares, pcs % of shares Number of votes % of votes
1 Kesko Pension Fund 4,438,885 4.54 35,388,850 9.23
2 The K-Retailers´ Association 3,348,433 3.42 33,116,680 8.64
3 Vähittäiskaupan Takaus Oy 2,802,533 2.86 26,459,330 6.90
4 Ilmarinen Mutual Pension Insurance Company 2,113,608 2.16 4,583,649 1.20
5 Valluga-sijoitus Oy 1,340,439 1.37 13,404,390 3.50
6 Varma Mutual Pension Insurance Company 1,310,986 1.34 1,310,986 0.34
7 Oy The English Tearoom Ab 1,008,400 1.03 1,008,400 0.26
8 The State Pension Fund 950,000 0.97 950,000 0.25
9 Foundation for Vocational Training in the Retail Trade 917,913 0.94 7,808,178 2.04
10 Tapiola Mutual Pension Insurance Company 674,500 0.69 674,500 0.18
10 largest, total 18,905,697 19.32 124,704,963 32.54
Ownership structure at 31.12.2008
All shares Number of shares % of all shares
Non-financial corporations and housing corporations 25,959,020 26.54
Financial and insurance corporations 6,325,086 6.47
General Government* 11,166,916 11.42
Households 28,725,937 29.36
Non-profit institutions serving households** 6,136,081 6.27
Rest of the world 602,227 0.62
Nominee registered 18,909,587 19.33
Total 97,824,854 100.00
A shares Number of shares % of A shares % of all shares
Non-financial corporations and housing corporations 18,346,462 57.81 18.75
Financial and insurance corporations 1,380,444 4.35 1.41
General Government* 3,717,534 11.71 3.80
Households 6,648,273 20.95 6.80
Non-profit institutions serving households** 1,570,174 4.95 1.61
Rest of the world 4,615 0.01 0.00
Nominee registered 69,505 0.22 0.07
Total 31,737,007 100.00 32.44
B shares Number of shares % of B shares % of all shares
Non-financial corporations and housing corporations 7,612,558 11.52 7.78
Financial and insurance corporations 4,944,642 7.48 5.05
General Government* 7,449,382 11.27 7.62
Households 22,077,664 33.41 22.57
Non-profit institutions serving households** 4,565,907 6.91 4.67
Rest of the world 597,612 0.90 0.61
Nominee registered 18,840,082 28.51 19.26
Total 66,087,847 100.00 67.56
* General government includes municipalities, the provincial administration of Åland, employment pension institutions and social security funds.
** Non-profit institutions include foundations awarding scholarships, organisations safeguarding certain interests, charitable associations.

151Kesko financial statements 2008
10 largest shareholders by number of votes at 31.12.2008
Number of shares, pcs % of shares Number of votes % of votes
1 Kesko Pension Fund 4,438,885 4.54 35,388,850 9.23
2 The K-Retailers´ Association 3,348,433 3.42 33,116,680 8.64
3 Vähittäiskaupan Takaus Oy 2,802,533 2.86 26,459,330 6.90
4 Valluga-sijoitus Oy 1,340,439 1.37 13,404,390 3.50
5 Foundation for Vocational Training in the Retail Trade 917,913 0.94 7,808,178 2.04
6 Ilmarinen Mutual Pension Insurance Company 2,113,608 2.16 4,583,649 1.20
7 Ruokacity Myyrmäki Oy 389,541 0.40 3,895,410 1.02
8 The K-Food Retailers´ Club 337,605 0.35 3,376,050 0.88
9 Heimo Välinen Oy 300,000 0.31 2,824,500 0.74
10 Svenska litteratursällskapet i Finland r.f. 329,000 0.34 2,129,000 0.56
10 largest, total 16,317,957 16.69 132,986,037 34.71
Distribution of share ownership at 31.12.2008
All shares
Number of shares
Number
of shareholders % of shareholders Shares total % of shares
1–100 10,626 27.90 631,146 0.65
101–500 14,158 37.18 3,938,334 4.03
501–1,000 5,567 14.62 4,398,590 4.50
1,001–5,000 5,910 15.52 13,244,056 13.54
5,001–10,000 944 2.48 6,755,357 6.91
10,001–50,000 719 1.89 14,922,743 15.25
50,001–100,000 95 0.25 6,625,994 6.77
100,001–500,000 47 0.12 10,066,836 10.29
500,001– 14 0.04 37,241,798 38.07
Total 38,080 100.00 97,824,854 100.00
A shares
Number of shares
Number
of shareholders
% of holders
of A shares A shares total % of A shares
1–100 1,475 24.44 74,605 0.24
101–500 1,254 20.78 338,466 1.07
501–1,000 913 15.13 782,534 2.47
1,001–5,000 1,596 26.45 3,949,939 12.45
5,001–10,000 401 6.65 2,851,593 8.99
10,001–50,000 343 5.68 7,285,258 22.96
50,001–100,000 35 0.58 2,487,290 7.84
100,001–500,000 12 0.20 2,486,297 7.83
500,001– 5 0.08 11,481,025 36.18
Total 6,034 100.00 31,737,007 100.00
B shares
Number of shares
Number
of shareholders
% of holders
of B shares B shares total % of B shares
1–100 10,007 29.12 601,702 0.91
101–500 13,719 39.92 3,812,374 5.77
501–1,000 4,909 14.29 3,819,874 5.78
1,001–5,000 4,682 13.63 10,156,487 15.37
5,001–10,000 561 1.63 4,085,083 6.18
10,001–50,000 394 1.15 8,089,973 12.24
50,001–100,000 47 0.14 3,240,455 4.90
100,001–500,000 33 0.10 7,230,826 10.94
500,001– 10 0.03 25,051,073 37.91
Total 34,362 100.00 66,087,847 100.00

152 Kesko financial statements 2008
Share capital and shares
2004 2005 2006 2007 2008
Share capital € million 188 193 195 196 196
Number of shares at 31 Dec. 1,000 pcs 93,840.5 96,483.9 97,519.9 97,767.8 97,824.9
Adjusted number of shares at 31 Dec. 1,000 pcs 93,840.5 96,483.9 97,519.9 97,767.8 97,824.9
Adjusted average number of shares during the year 1,000 pcs 93,134.9 97,215.5 98,027.0 98,395.3 98,256.2
of which A shares % 34 33 32 32 32
of which B shares % 66 67 68 68 68
Market capitalisation, A shares € million 600 768 1,220 1,201 698
Market capitalisation, B shares € million 1,115 1,551 2,632 2,491 1,176
Number of shareholders at 31 Dec. pcs 29,801 29,339 28,414 28,925 38,080
Share turnover
A share € million 23 29 61 161 41
B share € million 1,368 1,383 2,410 5,294 2,859
Share turnover
A share million pcs 1 1 2 4 1
B share million pcs 83 66 77 122 121
Turnover rate
A share % 3.8 4.1 6.4 11.5 4.5
B share % 133.6 101.5 117.1 185.3 183.3
Change in share turnover
A share % -3.5 7.6 57.2 78.8 -61.0
B share % 158.5 -24.0 15.4 58.8 -1.0
Share price at 31 Dec.
A share € 18.90 24.19 38.43 37.85 22.00
B share € 17.95 23.95 40.02 37.72 17.80
Average share price
A share € 19.12 21.93 30.10 43.85 28.30
B share € 16.49 21.04 31.34 43.36 23.51
Highest share price during the year
A share € 21.50 24.60 38.99 53.44 38.20
B share € 18.27 24.44 40.48 54.85 38.12
Lowest share price during the year
A share € 15.70 18.61 23.72 34.52 21.33
B share € 13.58 17.80 23.80 34.40 15.31
Earnings per share, diluted € 1.89 1.87 3.76 2.90 2.24
Earnings per share,basic € 1.92 1.89 3.80 2.92 2.25
Equity per share, diluted € 14.73 15.35 17.94 19.53 20.09
Dividend per share € 1.00 1.10 1.50 1.60 1.00*
Payout ratio % 52.9 58.8 39.9 55.2 44.7*
Cash flow from operating activities per share, diluted € 2.29 3.07 3.35 2.52 1.37
Price per earnings ratio (P/E), A share, diluted 10.12 11.86 10.22 13.07 9.84
Price per earnings ratio (P/E), B share, diluted 9.50 11.74 10.64 13.02 7.96
Dividend yield, A share % 5.3 4.6 3.9 4.2 4.6*
Dividend yield, B share % 5.6 4.6 3.8 4.2 5.6*
Effective dividend yield of A share % 15.7 15.4 29.3 26.6 10.9
Effective dividend yield of B share
for the last five periods % 19.8 29.2 42.8 36.1 12.9
for the last ten periods % 14.9 18.6 22.7 18.7 11.7
* Proposal to the Annual General Meeting

153Kesko financial statements 2008
Financial reporting calendar and key dates in 2009
Year 2008 financial statements release 5 February 2009
Year 2008 Annual Report and
audited financial statements Week 11
Year 2009 Annual General Meeting 30 March 2009
Interim financial report for
the first 3 months of the year 28 April 2009
Interim financial report for
the first 6 months of the year 24 July 2009
Interim financial report for
the first 9 months of the year 22 October 2009
In addition, the Kesko Group's sales figures are published
monthly and the K-Group's retail sales figures are published in
connection with the interim financial reports.
Annual General Meeting
The Annual General Meeting of Kesko Corporation will be held
in the Helsinki Fair Centre's congress wing, Messuaukio 1 (con-
gress wing entrance), Helsinki, on 30 March 2009 at 13.00.
All shareholders entered in the register of Kesko Corporation
shareholders kept by Euroclear Finland Ltd on 20 March 2009
(Annual General Meeting record date) are entitled to attend the
Annual General Meeting.
Shareholders wishing to attend the meeting should notify,
not later than 23 March 2009 at 16.00, to Kesko Corporation/Legal
Affairs, FI-00016 Kesko, by fax to +358 1053 23421, by telephone
to +358 1053 23211, by e-mail to [email protected], or
through the Internet at www.kesko.fi/investors. The notifica-
tions must be received by the end of the registration period.
Any proxies authorising the holders to attend the Annual Gen-
eral Meeting shall be sent to the above mailing address by the
end of the registration period. Shareholders may use the proxy
form at www.kesko.fi/investors in giving the authorisation.
More information about the Annual General Meeting, attend-
ance and decision-making is given under the heading “Corpo-
rate Governance” on pages 58–65.
The resolutions of the Annual General Meeting are published
without delay after the meeting in a stock exchange release.
Payment of dividends
The Board of Directors has decided to propose to the Annual
General Meeting that a dividend of €1.00 per share be paid for
2008. The dividend will be paid to all shareholders entered in
the register of Kesko Corporation shareholders kept by Euroclear
Finland Ltd on 2 April 2009 (record date for the payment of div-
idend). Registration practice takes three banking days, so the
dividends are paid to those who hold the shares at the close of
the date of the Annual General Meeting on 30 March 2009. Div-
idends of the shares traded on the date of the Annual General
Meeting are paid to buyers.
According to the Board of Directors' proposal the payment of
dividends starts on 9 April 2009.
Financial publications
Kesko publishes its Annual Report as a printed publication in
Finnish, Swedish and English. The company maintains a mail-
ing list of persons to whom the Annual Report is sent. Those
who wish to be included on the mailing list may fill in the form
on the Internet pages www.kesko.fi/Material.
The financial statements release, the three interim financial
reports, monthly sales figures and other key releases are pub-
lished on the Internet pages at www.kesko.fi/Media.
Kesko publishes a Corporate Responsibility Report as a printed
publication in Finnish and English.
Publications may be ordered from
Kesko Corporation/Corporate Communications and Responsibility
Satamakatu 3
FI-00016 Kesko
Tel. +358 1053 22404
Fax +358 9 174 398
Internet: www.kesko.fi/material
Changes of address
Shareholders should notify changes of address to the bank,
brokerage firms or other account operator with which they have
a book-entry securities account.
Information for shareholders

154 Kesko financial statements 2008
Communications policy and principles
The purpose of Kesko's communications is to promote the busi-
ness of the Group and its business partners by taking the ini-
tiative in providing stakeholders with correct information on
Group objectives and operations. The general principles fol-
lowed in providing communications also include openness,
topicality and truthfulness. No comments are made on confi-
dential or unfinished business, nor on competitors' affairs.
The primary objective of communications is to describe what
added value Kesko and its cooperation partners generate to
consumers and other customers, whose impressions and behav-
iour ultimately decide Kesko's success.
Investor communications
In line with its IR strategy, Kesko continually produces correct
and up-to-date information for the markets as a basis for the
formation of Kesko Corporation's share price. The aim is to
make Kesko's activities better known and to increase the trans-
parency of investor information and, therefore, the attraction of
Kesko as an investment target.
In its investor communications, Kesko follows the principle of
impartiality and publishes all investor information on the Inter-
net pages in Finnish, Swedish and English.
Kesko publishes its Annual Report as a printed publication in
Finnish, Swedish and English. The financial statements release
and three interim financial reports are available on Kesko's
Internet pages. The company maintains a mailing list of persons
to whom the Annual Report is sent. Those who wish to be
included on the mailing list may fill in the form on the Internet
at www.kesko.fi/Material. Kesko's stock exchange and press
releases sent by e-mail can be ordered through the material
service on the Internet pages www.kesko.fi/Material.
Information about Kesko for investors
Carnegie Investment Bank AB,
Finland Branch, Helsinki
Tia Lehto
Tel. +358 9 6187 1236
Cheuvreux, Stockholm
Daniel Ovin
Tel. +46 8 723 5175
Danske Markets Equities, Helsinki
Kalle Karppinen
Tel. +358 1023 64794
Deutsche Bank, Helsinki
Manu Rimpelä
Tel. +358 9 2525 2550
EQ Pankki Oy, Helsinki
Jarkko Soikkeli
Tel. +358 9 6817 8654
Evli Pankki Oyj, Helsinki
Mika Karppinen
Tel. +358 9 476 690
Fim Pankki Oy, Helsinki
Jonas Spohr
Tel. +358 9 6134 6508
Goldman Sachs, London
Bhavna Bhana
Tel. +44 20 7774 8535
Handelsbanken Capital Markets,
Helsinki
Maria Wikström
Tel. +358 1044 42425
Icecapital Securities Oy, Helsinki
Robin Santavirta
Tel. +358 40 566 4341
JP Morgan Securities Ltd, London
Alastair Johnston
Tel. +44 20 7325 4523
Nordea Markets, Helsinki
Hanna-Maria Heikkinen
Tel. +358 9 1655 9926
Pohjola Bank plc., Helsinki
Jari Räisänen
Tel. +358 1025 24504
SEB Enskilda, Helsinki
Jutta Rahikainen
Tel. +358 9 6162 8713
Sofia Capital Oyj, Helsinki
Martin Sundman
Tel. +358 10 241 5166
Standard & Poor's Equity
Research, London
James Monro
Tel. +44 20 7176 7798
UBS Equity Research, Stockholm
Olof Cederholm
Tel. +46 8 453 7306
E. Öhman J:or Securities
Finland Ltd, Helsinki
Elina Pennala
Tel. +358 9 8866 6043
Kesko arranges press conferences for analysts and the media
at the time of publishing financial statements or other signifi-
cant news, and holds Capital Market Days on various themes 1–2
times a year.
Kesko observes a two-week period of silence before publish-
ing its results releases. At other times, we are happy to answer
the enquiries of analysts and investors by phone or e-mail, or
at the investor meetings arranged.
IR contacts
Riikka Toivonen, Investor Relations Manager
Tel. +358 1053 23495
Mobile +358 500 708 337
Fax +358 9 174 398
Arja Talma, Senior Vice President, CFO
Tel. +358 1053 22113
Fax +358 9 657 465
Jukka Pokki, Investor Relations Manager
Tel. +358 1053 22645
Mobile +358 50 65 632
Fax +358 9 174 398
E-mail: [email protected]
Corporate Communications and Responsibility
Paavo Moilanen, Senior Vice President
Tel. +358 1053 22764
Fax +358 9 174 398
E-mail: [email protected]
Brokerage firms analysing Kesko:

155Kesko financial statements 2008
Kesko Corporation's Board of Directors and
Corporate Management Board are pre-
sented on pages 66–67 and 68–69.
Kesko CorporationSatamakatu 3, Helsinki, FI-00016 Kesko
Tel. +358 10 5311, fax +358 9 174 398
E-mail (unless otherwise stated):
President and CEO Matti Halmesmäki
Finance: Senior Vice President, CFO Arja Talma
Corporate Accounting: Vice President,
Corporate Controller Jukka Erlund
Treasury: Vice President, Group Treasurer
Heikki Ala-Seppälä
Finance and Accounting Services:
Vice President Eija Jantunen
IT Management:
Vice President, CIO Arto Hiltunen
Human Resources:
Senior Vice President Riitta Laitasalo
Legal Affairs, Risk Management and
Internal Audit: Vice President, General
Counsel Anne Leppälä-Nilsson
Corporate Communications and Responsi-
bility: Senior Vice President Paavo Moilanen
Corporate Responsibility:
Assistant Vice President Ulla Rehell
Brand Management:
Brand Director Anne Laakso
Subsidiaries
K-instituutti Oy
Siikajärventie 88–90, FI-02860 Espoo
Tel. customer service +358 1053 37370,
reception +358 1053 37271,
fax +358 9 863 8571
www.k-instituutti.fi
Managing Director Juha Dahlman
K-Plus Oy
Satamakatu 3, Helsinki, FI-00016 Kesko
Tel. +358 10 53020, fax +358 9 698 6952
www.plussa.com
Managing Director Niina Ryynänen
K-talouspalvelukeskus Oy
P.O.B. 330, FI-33101 Tampere
Tel. +358 10 5311, fax +358 1053 25555
Managing Director Eija Jantunen
District operationsThe Greater Helsinki area, Helsinki
Satamakatu 3, Helsinki, FI-00016 Kesko
Tel. +358 10 5311, fax +358 1053 23494
District Director Antti Palomäki
Uusimaa, Helsinki
Satamakatu 3, Helsinki, FI-00016 Kesko
Tel. +358 10 5311, fax +358 9 655 473
District Director Timo Huurtola
Eastern Finland, Kuopio
Siunauskappelintie 2, P.O.B. 46,
FI-70701 Kuopio
Tel. +358 10 5311, fax +358 1053 29020
District Director Pertti Rusanen
The Finnish Lakeland, Jyväskylä
c/o K-citymarket Seppälä
Vasarakatu 29, FI-40320 Jyväskylä
Tel. +358 10 5311
District Director Merja Haverinen
Southeastern Finland, Lahti
c/o K-citymarket Lahti Laune
Ajokatu 53, FI-15500 Lahti
Tel. +358 10 5311, fax +358 20 720 3318
District Director Timo Heikkilä
Southwestern Finland, Turku
Rydönnotko 1, P.O.B. 116, FI-20101 Turku
Tel. +358 10 5311, fax +358 1053 21309
District Director Olli Setänen
Pirkanmaa, Tampere
Jokipohjantie 28, P.O.B. 330,
FI-33101 Tampere
Tel. +358 10 5311, fax +358 1053 25448
District Director Jari Alanen
Ostrobothnia, Seinäjoki
c/o K-maatalous Seinäjoki
Hautomonkatu 2, FI-60100 Seinäjoki
Tel. +358 10 5311, fax +358 1053 26333
District Director Heikki Tynjälä
Northern Finland, Oulu
Äimäkuja 6, P.O.B. 16, FI-90401 Oulu
Tel. +358 10 5311, fax +358 1053 30227
District Director Jari Saarinen
Kesko Food LtdSatamakatu 3, Helsinki, FI-00016 Kesko
Tel. +358 10 53030, fax +358 1053 23467
President Terho Kalliokoski
K-citymarket, Food:
Vice President Mika Rautiainen
K-supermarket:
Vice President Jaana Hertsberg
K-market (K-market, K-extra):
Vice President Ari Svensk
Commerce: Vice President Minna Kurunsaari
Customer relationship:
Vice President Niina Ryynänen
Retail services: Vice President Kari Heiskanen
(e-mail: [email protected])
Logistics and finance:
Vice President Petteri Niemi
Subsidiaries
Kespro Ltd
Sähkötie 1, Vantaa, P.O.B. 15, FI-00016 Kesko
Tel. +358 10 53040, fax +358 9 851 4452
www.kespro.com
Managing Director Jorma Rauhala
Pikoil Oy
Satamakatu 3, Helsinki, FI-00016 Kesko
Tel. +358 20 742 2000, fax +358 20 742 2099
www.pikoil.fi
Managing Director Harri Ojala
Keslog Ltd
Jokiniementie 31, P.O.B. 47, FI-01301 Vantaa
Tel. +358 10 53050, fax +358 1053 27021
www.keslog.fi
Managing Director Mika Salmijärvi
Rautakesko LtdTikkurilantie 10, P.O.B. 75, FI-01301 Vantaa
Tel. +358 1053 032, fax +358 9 857 4783
E-mail: [email protected]
www.rautakesko.com
President Jari Lind
Executive Vice President Seppo Hämäläinen
Human Resources: HR Director Anu Wiikeri
Concepts:
Concept Director Jaakko-Pekka Vehmas
Business support:
Vice President Jouko Björkman
K-rauta chain: Vice President Jani Karotie
Rautia chain, K-maatalous chain and
K-customer contract stores:
Vice President Kimmo Vilppula
Agricultural trade: Vice President Antti Ollila
Commerce: Vice President Sakari Malka
B-to-B sales: Vice President Olli Honkasaari
International projects:
Vice President Juhani Järvi
Norway and Sweden:
Region Director Jarmo Turunen
Baltics and Russia:
Region Director Raul Kadaru
Country Director for Russia: Mikko Pasanen
K-maatalous Experimental Farm
Hahkialantie 57, FI-14700 Hauho
Tel. +358 10 53032, fax +358 1053 38130
www.k-koetila.fi
Subsidiaries
Norway
Byggmakker Norge AS
Snipetjenveien 7, Postboks 650,
NO-1401 Ski, Norway
Tel. +47 6491 4000, fax +47 6491 4090
E-mail: [email protected]
www.byggmakker.no
Managing Director Espen Hoff
Sweden
K-rauta AB
Bagarbyvägen 61, SE-19134 Sollentuna,
Sweden
Tel. +46 8 588 18900, fax +46 8 588 18998
E-mail: [email protected]
www.k-rauta.se
Managing Director Jani Jylhä
Organisation, management and contact information

156 Kesko financial statements 2008
Estonia
Rautakesko AS
Tähetorni 100a, EE-11625 Tallinn, Estonia
Tel. +372 6 257 501, fax +372 6 257 563
E-mail: [email protected]
www.rautakesko.ee
Managing Director Alo Ivask
Latvia
AS Rautakesko
Rencenu iela 21, LV-1073 Riga, Latvia
Tel. +371 7 810 090, fax +371 7 810 178
E-mail: [email protected]
www.k-rauta.lv
Managing Director Peteris Stupans
Lithuania
UAB Senuku prekybos centras
Pramones pr. 6, LT-51500 Kaunas-31,
Lithuania
Tel. +370 37 304 999, fax +370 37 304 605
E-mail: [email protected]
www.senukai.lt
President Arturas Rakauskas
Russia
ZAO Stroymaster
Bolshoi Sampsonievskiey Prospekt 68,
lit N, RU-194100 St. Petersburg, Russia
Tel. +7 812 326 9231, fax +7 812 326 9231
E-mail: [email protected]
www.k-rauta.ru
Managing Director Aleksandr Rudenko
Belarus
OOO OMA
Office 36, Per. Promyshlenny 12a
Minsk 220075, Belarus
Tel. +375 17 244 9303
E-mail: [email protected]
Managing Director Oleg Glazunov
VV-Auto Group Oy Hitsaajankatu 7 B, P.O.B. 80,
FI-00811 Helsinki
Tel. +358 9 75 831, fax +358 9 758 3267
www.audi.fi, www.volkswagen.fi
President Pekka Lahti
Audi: Brand Manager Esko Kiesi
Volkswagen passenger cars:
Brand Manager Lauri Haapala
Volkswagen commercial vehicles:
Brand Manager Carl-Gustaf Sergejeff
After-sales services: Director Jarmo Toivanen
Business support:
Financial Director Arto Manninen
Dealer network and business develop-
ment: Director Mia Miettinen
Subsidiaries
Auto-Span Oy
Hitsaajankatu 7 B, P.O.B. 80,
FI-00811 Helsinki
Tel. +358 9 75 831, fax +358 9 758 3356
www.seat.fi
Managing Director Veikko Ålander
VV-Autotalot Oy
Mekaanikonkatu 10, FI-00880 Helsinki
Tel. +358 1053 33200, fax +358 1053 33300
www.vv-auto.fi
Managing Director Timo Virtanen
Turun VV-Auto Oy
Rieskalähteentie 89, FI-20300 Turku
Tel. +358 2 338 881, fax +358 2 338 8880
www.vv-auto.fi
Managing Director Timo Virtanen
Konekesko Ltd Vanha Porvoontie 245, P.O.B. 145,
FI-01301 Vantaa
Tel. +358 10 53034, fax +358 1053 20505
www.konekesko.com
President Aatos Kivelä
Subsidiaries
Estonia
Konekesko Eesti AS
Põrguvälja tee 3 a, Pildiküla, Rae vald,
EE-75301 Harju mk, Estonia
Tel. +372 605 9100, fax +372 605 9101
www.keskoagro.com
Managing Director Tõnu Kelder
Latvia
Konekesko Latvija SIA
Tiraines iela 15, LV-1058 Riga, Latvia
Tel. +371 7 6706 4300, fax +371 7 6706 4301
www.keskoagro.com
Managing Director Antra Spickus
Lithuania
UAB Konekesko Lietuva
Savanoriu pr. 191, LT-02300 Vilnius,
Lithuania
Tel. +370 5 247 7400, fax +370 5 247 7420
www.keskoagro.com
Managing Director Paulius Kibisa
Anttila OyValimotie 17, Helsinki, P.O.B. 1060,
FI-00016 Kesko
Tel. +358 10 5343, fax +358 1053 40199
www.anttila.fi
President Matti Leminen
Subsidiaries
Estonia
Anttila AS
Uus 33, EE-71033 Viljandi, Estonia
Tel. +372 43 53 360, fax +372 43 33 334
E-mail: [email protected]
www.anttila.ee
Managing Director Tauno Tuula
Latvia
SIA Antti
Jersikas iela 12/14, LV-1003 Riga, Latvia
Tel. +371 703 3301, fax +371 703 3334
E-mail: [email protected]
www.anttila.lv
Director Kalle Lill
K-citymarket Oy
Satamakatu 3, Helsinki, FI-00016 Kesko
Tel. +358 10 53030, fax +358 1053 23492
www.citymarket.fi
Managing Director Ari Akseli
Indoor Group LtdIso-Paavolankatu 2, P.O.B. 200, FI-15101 Lahti
Tel. +358 3 554 11, fax +358 3 554 2400
E-mail:
www.indoorgroup.fi, www.asko.fi,
www.sotka.fi
President Pasi Mäkinen
Intersport Finland LtdKutojantie 4, FI-02630 Espoo
Tel. +358 10 53031, fax +358 9 176 780
www.intersport.fi, www.budgetsport.fi
President Juha Nurminen
Musta Pörssi LtdKutojantie 4, FI-02630 Espoo
Tel. +358 10 53031, fax +358 1053 40929
www.mustaporssi.fi, www.konebox.fi
President Jussi Mikkola
Kenkäkesko LtdKutojantie 4, FI-02630 Espoo
Tel. +358 10 53031, fax +358 1053 39286
www.andiamo.fi, www.k-kenka.fi
President Martti Toivanen
Service numbers Plussa customer service
Mon-Fri 8.00–18.00
Tel. +358 800–0–5588
E-mail: [email protected]
Kesko Food's customer service
Mon-Fri 9.00–13.00
Tel. +358 800–0–1000
E-mail:

157Kesko financial statements 2008
After-sales marketing refers in the car
and machinery trade in particular to
after-sales activities, such as mainte-
nance, repairs, sales of spare parts,
accessories and equipment.
AMS is an abbreviation of AMS Sourcing
BV. Kesko Food works in cooperation
with the leading European food chains
in AMS, and is a partner in the World-
Wide Retail Exchange. The WWRE is a
business-to-business web marketplace.
Brand is a trademark, logo or branded
product. It is an embodiment of all
information relating to the company
product or service. A brand is an image,
created by the way of doing things, by
quality and the willingness to reach the
set destination.
Certification of goods sold by stores is
an audit carried out by an independent
third to verify the compliance of operat-
ing systems with certain criteria (e.g.
with an ISO standard).
Chain agreement is a contract between
the retailer and Kesko that enables the
retailer join one of Kesko’s retail store
chains. Under the terms of the chain
agreement, the retailer and Kesko agree
on their rights and responsibilities
regarding chain operations.
Chain concept is a comprehensive
description of retail business operations
and guidelines for their similar imple-
mentation in all stores of the chain.
Chain selection in the K-Group is that
part of a selection which is the same in
all stores of the chain. The chain unit
makes decisions concerning the
selection.
Chain unit is the Kesko unit responsible
for store chain operations and chain
concept development in the K-Group. It
has decision-making power in matters
concerning the chain.
Corporate responsibility refers to volun-
tary responsibility towards key stake-
holders. It is measurable, based on the
company’s values and objectives, and is
divided into economic, social and envi-
ronmental responsibility.
Customer value refers to the chain’s way
of defining and communicating the ben-
efits or values that it generates to the
customer.
Dealer, for instance in the car trade, is a
company authorised by the importer to
sell and service branded products. The
dealer meets the quality standards set
by the manufacturer and the importer.
Department store is a retail store that
sells a wide variety of goods. Its sales
area is at least 2,500 m2. In a department
store, no product category accounts for
over half of the total sales area.
Discounter (discount store) is a store type
that relies on low prices as competitive
tools. Typical features of a discounter
also include a varying selection of home
and speciality goods, self-service, and
warehouse-type displays.
Distance sales refers to trading activities
where customers do not visit store
premises, but instead trade through the
Internet, other electronic media or mail
order.
Fair trade is a form of international
trade, illustrated by a formalised parrot
logo. The logo indicates that business is
carried out directly with small producers
of the third world without intermediar-
ies. Producers receive a guaranteed price
for their products that is usually signifi-
cantly higher that the world market
price. They are also given guarantees
of long contracts and opportunities for
advance financing.
Groceries refer to food and other every-
day products that people are used to
buying when they shop for food. Grocer-
ies include food, beverages, tobacco,
home chemical products, household
papers, magazines and cosmetics.
Grocery store is, in most cases, a self-
service food store that sells the full range
of the above groceries. Food accounts for
about 80% of grocery stores’ total sales.
Home and speciality goods stores
include clothing, shoe, sports, home
technology, home goods, furniture and
interior decoration stores.
HoReCa is a category consisting of large
customers in the food trade, including
hotels, restaurants and other catering
companies.
Hypermarket is a retail store selling a
wide variety of goods mainly on the self-
service principle. Its sales area exceeds
2,500 m². In a hypermarket, food
accounts for about half of the total area,
but sales focus on groceries (food and
other everyday items).
K-Group consists of the K-retailers, the
K-Retailers’ Association and the Kesko
Group.
K-retailer is an independent chain
entrepreneur who, through good service,
competence and local expertise, provides
additional strength for chain operations.
The K-retailer entrepreneurs are respon-
sible for their stores’ customer satisfac-
tion, personnel and profitable business
operations.
K-Retailers’ Association is a body that
looks after the interests of the K-retail-
ers. Its key function is to promote and
strengthen the conditions for the entre-
preneurial activities of K-retailers. All the
K-retailers – about 1,305– are members
of the K-Retailers’ Association.
Logistics is a process in which informa-
tion management is used to direct the
goods flow and related services through-
out the entire supply chain. Logistics
help optimise the quality and cost-effi-
ciency of operations.
Neighbourhood store is usually a small
grocery store, located close to consumers
and easily accessible by foot. It is usually
a self-service store of less than 400 m².
In Finland they have unrestricted open-
ing hours even in town plan areas.
Glossary In this glossary we have compiled a list of some key terms used in the Annual Report.
158 Kesko financial statements 2008
New establishment (greenfielding) refers
to new store sites or business premises.
Operations control system (ERP Enter-
prise Resource Planning system) is an
information system that supports the
planning and control of business opera-
tions. It includes the information systems
supporting the core processes of the
company, such as category management
and purchasing logistics in the trading
sector, e.g. SAP R3.
Organic product is, according to the EU
regulation on organic production, a
product in which at least 95% of the raw
materials of agricultural origin have been
organically produced.
Private label (own brand, house brand)
product is a branded product made for
the trading company by a manufacturer
and marketed as part of a larger product
family under one brand name. A com-
pany markets its private label products
through its own network.
Retail trade refers to sales to consumer
customers.
Sales area refers to the store area
reserved for sales, such as goods areas,
aisles, service counters, checkout areas
and air lock entrances.
Selection is the range of products sold
for the same purpose, for instance a
selection of bread. Speciality stores carry
a deep selection in the category.
Self-control is an entrepreneur’s own
control system, the purpose of which is
to prevent problems arising in food
hygiene. In compliance with legislation,
self-control is based on HACCP (Hazard
Analysis and Critical Control Points) prin-
ciples. The hazards related to products
are assessed, the critical control points
needed for hazard monitoring are iden-
tified and then controlled. The system is
applied to the hygiene of manufacturing
plants’ machinery and equipment, the
quality of raw materials and products,
the effectiveness of manufacturing proc-
esses, and transportation and warehous-
ing conditions.
Service company is an enterprise that
offers all the products and services
wanted or expected by customers at the
same time. The service company provides
customers with a combination of prod-
ucts and related services, taking care of
product assemblies and other user func-
tions that may be required.
Shopping centre houses many trading
companies, but has joint management
and marketing. A shopping centre has
one or more main companies, but no
individual store accounts for over 50% of
the total business premises. A shopping
centre has a minimum of 10 stores, in
most cases joined by a common mall.
Store-specific selection in the K-Group is
that part of the selection of a store that
is adapted for the special needs of the
local market.
Store site is a business property or
premises where the chain concept and
related auxiliary services are carried out.
Store site fee is the term used for the
payment made by the retailer to Kesko as
a compensation for the use of the store
site under the chain agreement and the
related services offered by Kesko. The
store site fee is, as a rule, calculated as a
percentage of the retailer’s gross profit or
net sales.
Strategy is a comprehensive plan of the
means the organisation intends to use in
order to achieve its visions and goals.
Supermarket is a grocery store that
focuses on food sales and works on a
self-service principle. Its sales area is at
least 400 m², with food accounting for
over half of the total sales area.
Value chain is used to define the combi-
nation of all the activities and resources
needed for generating products and
services. The value chain often consists
of several operators (manufacturing
industry, wholesale trade, retail trade,
customer, etc.). The value chain ends
with the customer.
Wholesale trade is purchasing from sup-
pliers in large quantities and then selling
to enterprises engaged in the retail
trade.

Designand layout: Incognito
Photos: Mikko Harma and Patrik Raski/KUSTOM, Mats Vuorenjuuri/Unikuva
Printed by: Libris Oy

Kesk
o’s ye
ar 2
008
www.kesko.fi
Bu
siness ID
010
98
62-
8
Kesko
’s ye
ar