Embed Size (px)
Citation preview

380VDC Data Center At Duke Energy
Dennis P. Symanski EPRI - Senior Project Manager Curtis Watkins Duke Energy - Senior Project Manager
Emerging Technology (ET) Summit November 9, 2010 – Sacramento, CA

2 © 2010 Electric Power Research Institute, Inc. All rights reserved.
From Dept of Energy Secretary Steven Chu
• As Energy Secretary Steven Chu has noted, “America cannot build a 21st Century energy economy with a mid-20th Century electricity system.”
• Transforming the current grid into a dynamic, resilient, and adaptable Smart Grid will be one of the biggest technological challenges of our times. The rewards, however, may be dramatic, enabling consumers to better control their electricity use, integrating the next generation of plug-in electric vehicles, increasing efficiency, and better harnessing renewable energy.
Source: Department of Energy, Communications Requirement Of Smart Grid Technologies, October 5, 2010

3 © 2010 Electric Power Research Institute, Inc. All rights reserved.
Smart Grid to Smart Buildings
Source: EMerge Alliance Overview

4 © 2010 Electric Power Research Institute, Inc. All rights reserved.
DC Microgrids Throughout Buildings
24 VDC 380 VDC
380 VDC 24 & 380 VDC
Source: EMerge Alliance Overview
5 © 2010 Electric Power Research Institute, Inc. All rights reserved.
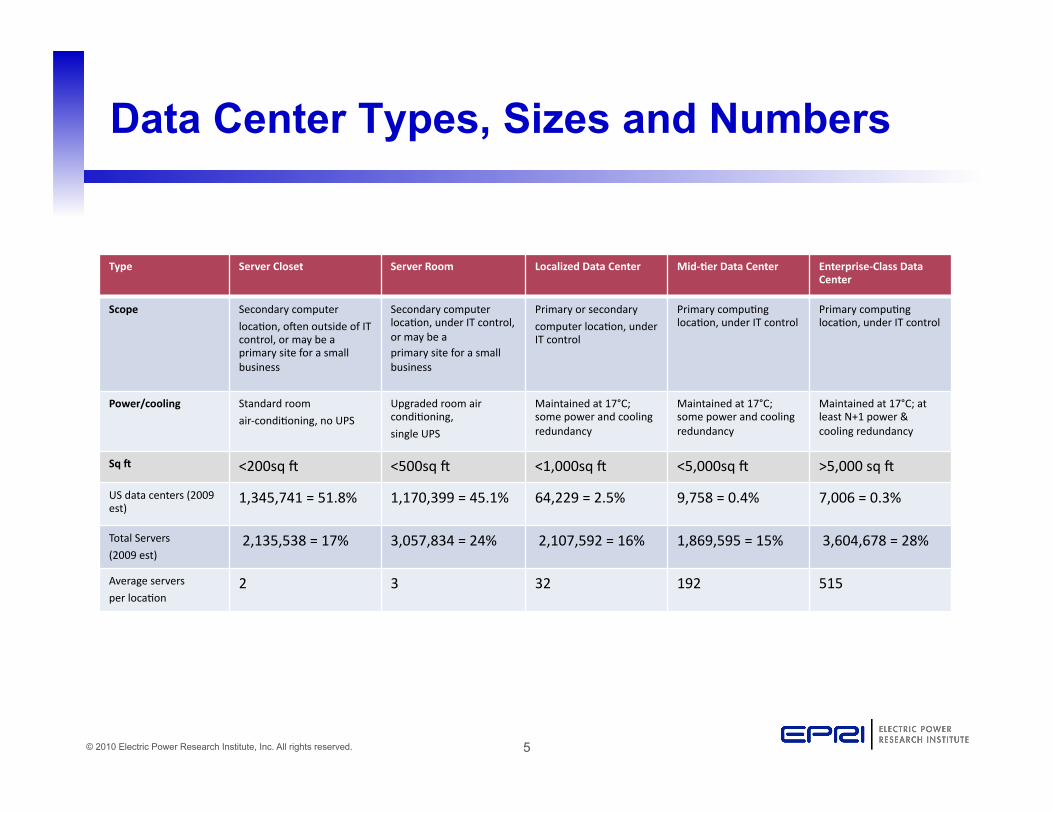
Data Center Types, Sizes and Numbers
Type Server Closet Server Room Localized Data Center Mid‐Aer Data Center Enterprise‐Class Data Center
Scope Secondary computer
loca0on, o2en outside of IT control, or may be a primary site for a small business
Secondary computer loca0on, under IT control, or may be a primary site for a small business
Primary or secondary
computer loca0on, under IT control
Primary compu0ng loca0on, under IT control
Primary compu0ng loca0on, under IT control
Power/cooling Standard room
air‐condi0oning, no UPS
Upgraded room air condi0oning,
single UPS
Maintained at 17°C; some power and cooling redundancy
Maintained at 17°C; some power and cooling redundancy
Maintained at 17°C; at least N+1 power & cooling redundancy
Sq H <200sq 2 <500sq 2 <1,000sq 2 <5,000sq 2 >5,000 sq 2
US data centers (2009 est)
1,345,741 = 51.8% 1,170,399 = 45.1% 64,229 = 2.5% 9,758 = 0.4% 7,006 = 0.3%
Total Servers
(2009 est) 2,135,538 = 17% 3,057,834 = 24% 2,107,592 = 16% 1,869,595 = 15% 3,604,678 = 28%
Average servers
per loca0on 2 3 32 192 515
6 © 2010 Electric Power Research Institute, Inc. All rights reserved.
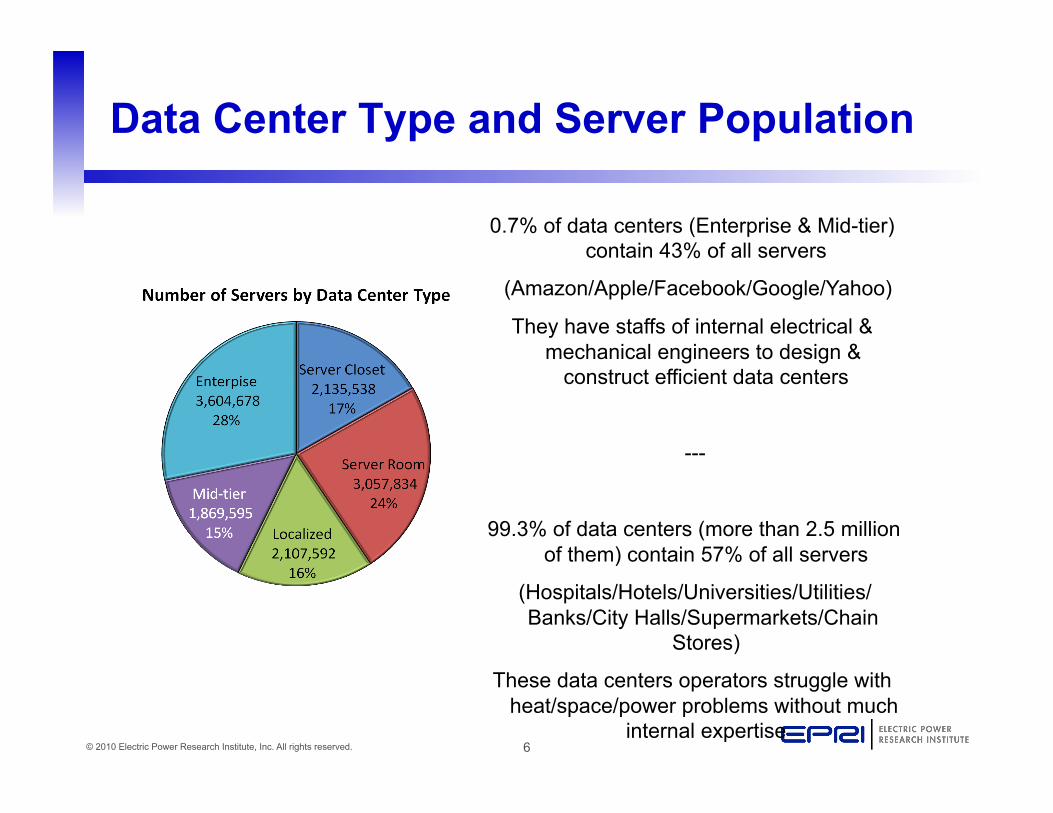
Data Center Type and Server Population
0.7% of data centers (Enterprise & Mid-tier) contain 43% of all servers
(Amazon/Apple/Facebook/Google/Yahoo)
They have staffs of internal electrical & mechanical engineers to design &
construct efficient data centers
---
99.3% of data centers (more than 2.5 million of them) contain 57% of all servers
(Hospitals/Hotels/Universities/Utilities/Banks/City Halls/Supermarkets/Chain
Stores)
These data centers operators struggle with heat/space/power problems without much
internal expertise
7 © 2010 Electric Power Research Institute, Inc. All rights reserved.
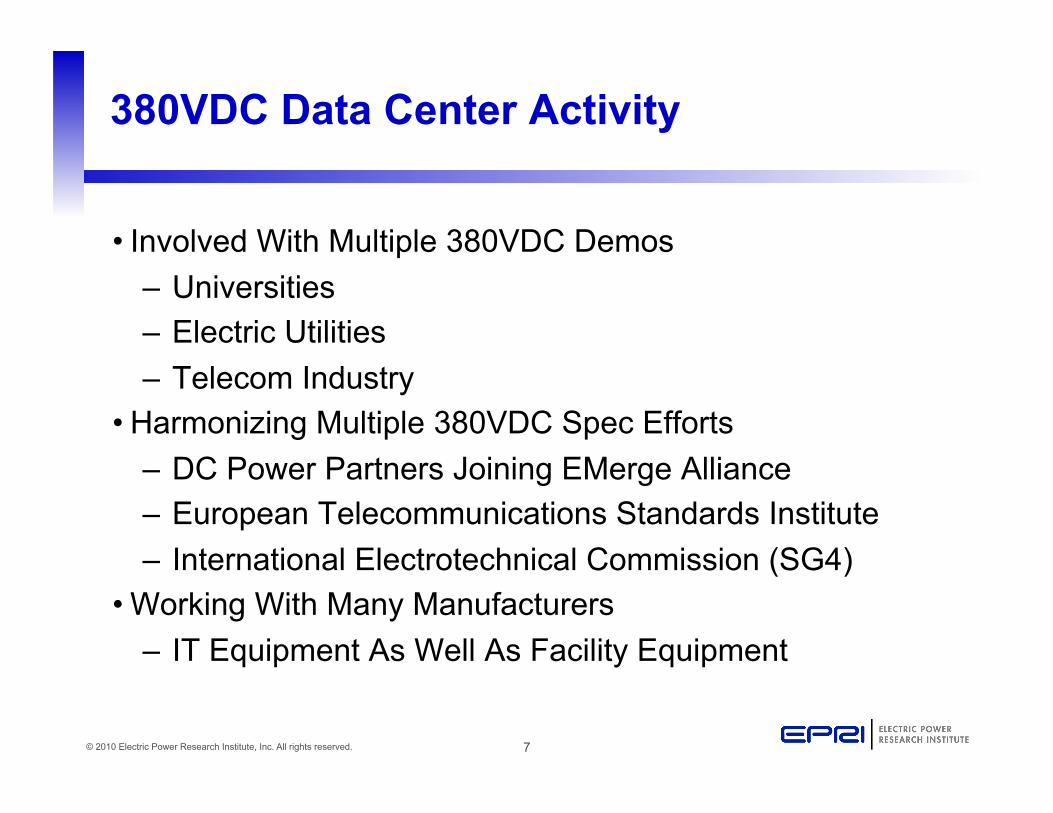
380VDC Data Center Activity
• Involved With Multiple 380VDC Demos – Universities – Electric Utilities – Telecom Industry
• Harmonizing Multiple 380VDC Spec Efforts – DC Power Partners Joining EMerge Alliance – European Telecommunications Standards Institute – International Electrotechnical Commission (SG4)
• Working With Many Manufacturers – IT Equipment As Well As Facility Equipment
8 © 2010 Electric Power Research Institute, Inc. All rights reserved.
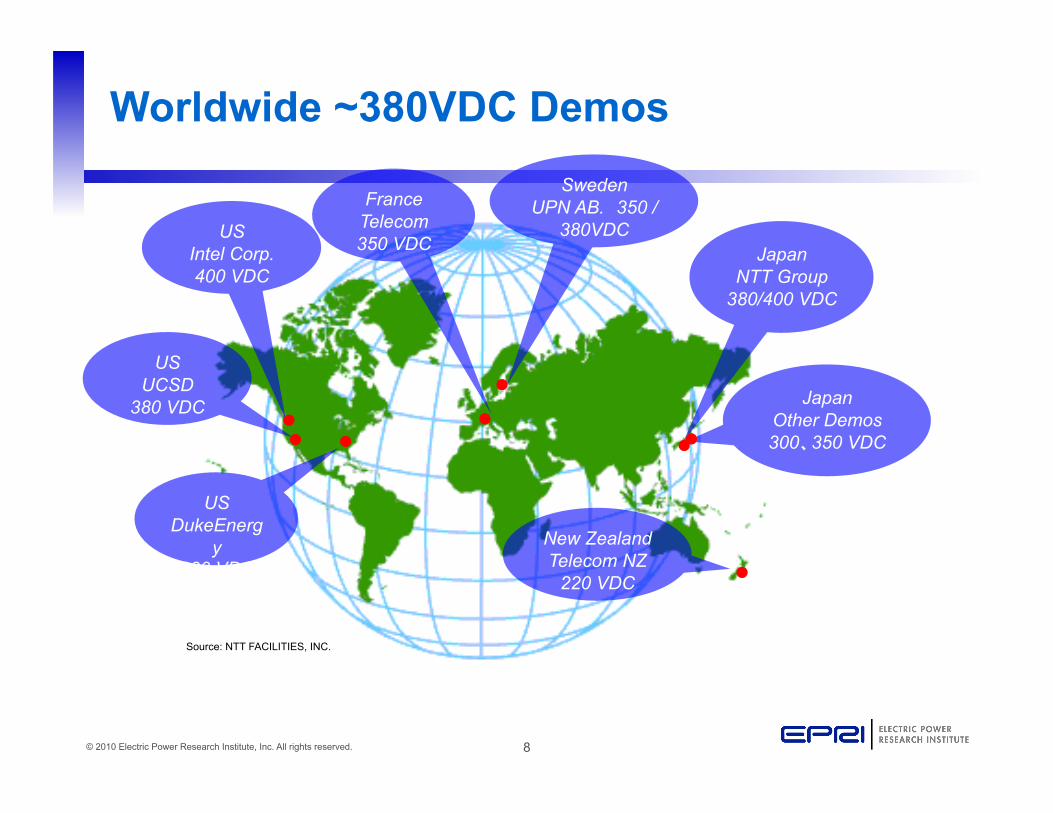
US DukeEnerg
y 380 VDC
Sweden UPN AB. 350 /
380VDC Japan
NTT Group 380/400 VDC
Japan Other Demos 300、350 VDC
France Telecom 350 VDC
New Zealand Telecom NZ
220 VDC
US Intel Corp. 400 VDC
US UCSD
380 VDC
Worldwide ~380VDC Demos
Source: NTT FACILITIES, INC.

9 © 2010 Electric Power Research Institute, Inc. All rights reserved.
Duke Energy 380VDC Data Center Demo
HP Servers
IBM Servers
EMC Storage Arrays
Delta Rectifiers
StarLine Busway
Dranetz-BMI Metering
10 © 2010 Electric Power Research Institute, Inc. All rights reserved.
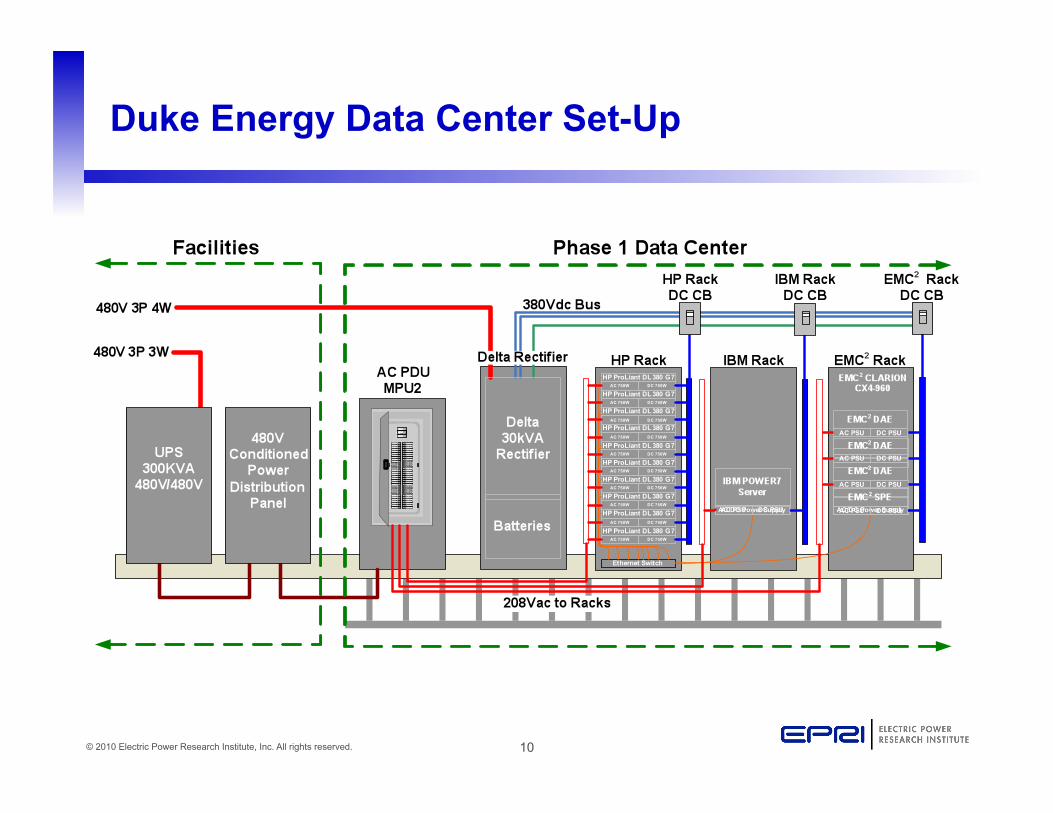
Duke Energy Data Center Set-Up

11 © 2010 Electric Power Research Institute, Inc. All rights reserved.
Edited from source: NTT FACILITIES, INC.
300 NEDO PJ. (Sendai)
380 US DC Demo
575 [to 48] Validus 428 (192cell)
600 NEC(U.S.)
900 BS (U.K.)
750 Ordinance (JPN)
1500 IEC
Law, Regulation, Code, and
Stds.
Telecom (Number of
Cells)
Rating voltage of parts and
elements
Distr. Gen.
374 (168cell)
321 (144cell)
Dis
trib
utio
n ef
ficie
ncy
Cab
le D
ista
nce
High
450
300
Demos (Reference)
0
200
600
800
1000
DC
Vol
tage
311(JPN)
354(EU) 373(U.K.)
320
405
350
Benefit of HVDC system
AC ICT input
voltages ( Peak )
Operating bulk - voltage
380
Short
Long
ETSI Std. (draft)
420
260
380
324V (US
Why 380VDC? – “Sweet Spot”
Low
Server PS
12 © 2010 Electric Power Research Institute, Inc. All rights reserved.
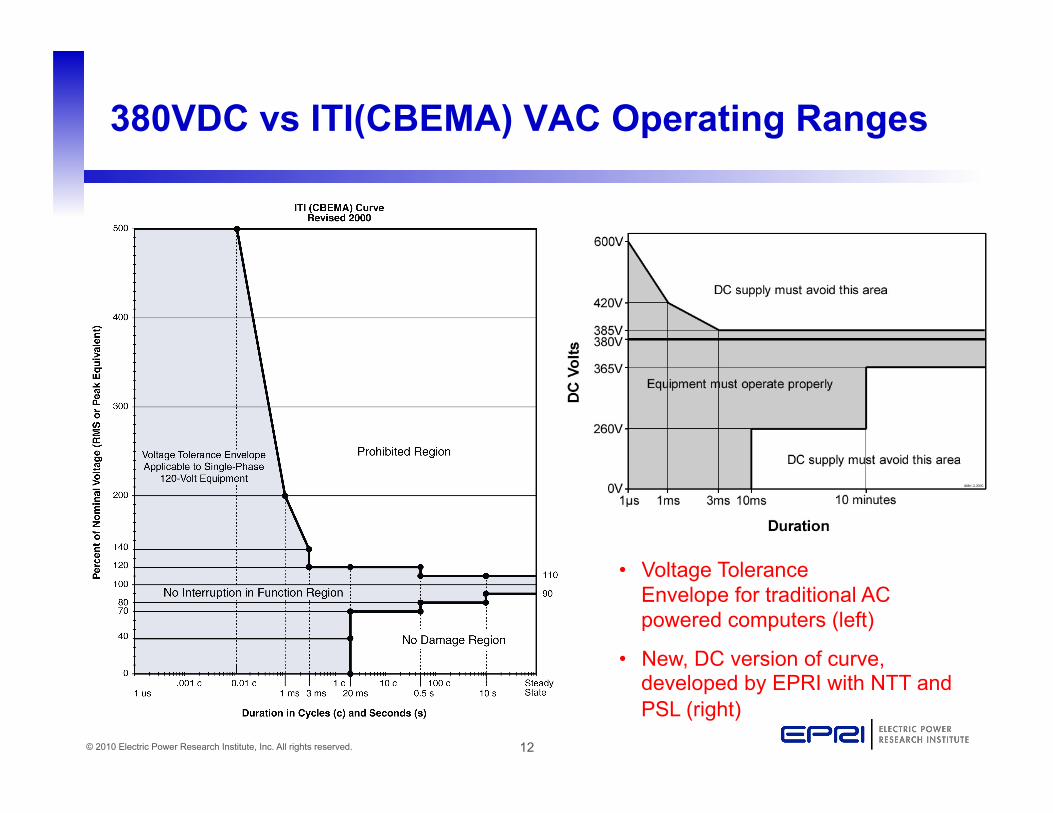
380VDC vs ITI(CBEMA) VAC Operating Ranges
• Voltage Tolerance Envelope for traditional AC powered computers (left)
• New, DC version of curve, developed by EPRI with NTT and PSL (right)

13 © 2010 Electric Power Research Institute, Inc. All rights reserved.
380VDC Power Distribution
NOTE: All loads are to be connected between L(+) and L(-). PE is not a power conductor.

14 © 2010 Electric Power Research Institute, Inc. All rights reserved.
Easier Integration Of Renewables

15 © 2010 Electric Power Research Institute, Inc. All rights reserved.
Benefits Summary Of 380VDC
• Higher Reliability – Fewer Conversions/Fewer Points Of Failure
• Higher Efficiency – Higher Efficiency Power Supplies & UPS – No PDU Transformer Needed
• Smaller Size • Better Power Quality • Easier Integration Of Renewable Energy

16 © 2010 Electric Power Research Institute, Inc. All rights reserved.
Other DC Applications
• 380VDC Uses – Telecom Central Offices (Operating Today At 48VDC) – Variable Speed Drives (Washers/Dryers/Air Cond) – Other Home Appliances (Stoves/Ovens) – “Rapid Charger” For Plug-in Electric Vehicles
• 24VDC Uses – Lighting – Consumer Electronics (TVs, PCs, Projectors)
• EMerge Alliance Members Working On Both Voltages

17 © 2010 Electric Power Research Institute, Inc. All rights reserved.
DC Challenges
• Safety Agency Approval/Listing (e.g. UL) – DC & AC Products Both Need These Approvals
• Paradigm Shift – Back To Some Of Thomas Edison’s DC Ideas – We Are Used To The “AC” World Today
• Vendor Selection – Many AC Vendors To Choose From – Fewer DC Vendors Available --- At Least For Now

18 © 2010 Electric Power Research Institute, Inc. All rights reserved.
Utility Opportunities
• Possible new revenue opportunities • Energy efficiency for new data center customers
– Reduce electrical costs anywhere from 10 – 30% – DC O&M costs are on average 65% less than AC
• Conversion opportunities for existing data center customers – Approximately 2.5 million small to medium data centers
in the U.S. – Component “swap out”, not a complete “rip & replace”

19 © 2010 Electric Power Research Institute, Inc. All rights reserved.
Utility Challenges
• Getting data center customers on board – Faced it with our test (decided to test our own facility) – Getting commitments
• Technology has to be proven, both in concept and financial feasibility – Able to preliminarily show test results in the Duke
Energy facility – Conversions for brownfield sites key aspect of potential
success

20 © 2010 Electric Power Research Institute, Inc. All rights reserved.
Potential Outcomes
• Based on preliminary results in the Duke Energy facility (which showed over 15% increase in efficiency) – Average small to medium data center consumes
approximately 0.5 to 5 MW – Reduction possibilities of 10 to 30% – Major impact for these data centers that are not
“enterprise” sized • Reinforces commitments to energy efficiency • Provides new opportunities to interact with customers to
provide wider range of products/services

21 © 2010 Electric Power Research Institute, Inc. All rights reserved.
Together…Shaping the Future of Electricity

EPRI Data Center Energy Efficiency Research
Dennis P. SymanskiSenior Project ManagerPower Delivery & Utilization Sector
Emerging Technologies (ET) SummitNovember 9, 2010 – Sacramento, CA

2© 2010 Electric Power Research Institute, Inc. All rights reserved.
Why do electric utilities care about data centers?!?
Great CustomersSteady load (24 hours/day – 7 days/week)
Constant & predictable revenue stream
High-tech exposure
Challenging CustomersComplaining about not getting enough power
Complaining about too much heat
Complaining about high cost of power

3© 2010 Electric Power Research Institute, Inc. All rights reserved.
Data Center Types, Sizes and Numbers
Type Server Closet Server Room Localized Data Center Mid‐tier Data Center Enterprise‐Class Data Center
Scope Secondary computer
location, often outside of IT control, or may be a primary site for a small business
Secondary computer location, under IT control, or may be a
primary site for a small business
Primary or secondary
computer location, under IT control
Primary computing location, under IT control
Primary computing location, under IT control
Power/cooling Standard room
air‐conditioning, no UPS
Upgraded room air conditioning,
single UPS
Maintained at 17°C; some power and cooling redundancy
Maintained at 17°C; some power and cooling redundancy
Maintained at 17°C; at least N+1 power & cooling redundancy
Sq ft <200sq ft <500sq ft <1,000sq ft <5,000sq ft >5,000 sq ft
US data centers (2009 est)
1,345,741 = 51.8% 1,170,399 = 45.1% 64,229 = 2.5% 9,758 = 0.4% 7,006 = 0.3%
Total Servers
(2009 est)2,135,538 = 17% 3,057,834 = 24% 2,107,592 = 16% 1,869,595 = 15% 3,604,678 = 28%
Average servers
per location 2 3 32 192 515

4© 2010 Electric Power Research Institute, Inc. All rights reserved.
Data Center Type and Server Population
0.7% of data centers (Enterprise & Mid-tier) contain 43% of all servers
(Amazon/Apple/Facebook/Google/Yahoo)
They have staffs of internal electrical & mechanical engineers to design &
construct efficient data centers
---
99.3% of data centers (more than 2.5 million of them) contain 57% of all servers
(Hospitals/Hotels/Universities/Utilities/Banks/City Halls/Chain Stores)
These data centers operators struggle with heat/space/power problems without much
internal expertise

5© 2010 Electric Power Research Institute, Inc. All rights reserved.
Telecom Central Offices Are Consuming More Than 1% Of Total Worldwide Electrical Energy
0.6%1.42 TWhTelefonica 2006Spain
0.4%2 TWhFrance Telecom-Orange 2006
France
0.24%8.9 TWhVerizon 2006USA
1%5.54 TWhNTT Group 2007Japan
2 TWh
Energy Energy ConsumptionConsumption
1%Telecom Italia 2005Italy
% of Country Total % of Country Total Energy ConsumptionEnergy Consumption
NetworkNetworkCountryCountry
Global electricity consumption of telecom industry estimated at 1%: 164 billion kWh
More than the total electricity consumption of Iran, Turkey or Sweden
Enough to power 1.6 million homes
110.7 million tons of CO2 (equivalent to the annual emissions of 29 million cars !)

6© 2010 Electric Power Research Institute, Inc. All rights reserved.
SimilaritiesBoth installing lots of computer equipmentBoth adding new services & capabilities
(Central Offices looking more & more like Data Centers) Both are running out of power & cooling & space
Differences
Data Centers versus Telecom Central Offices
Old/Downtown SitesNew/Modern Sites
Telecom-certified EquipCommercial Grade Equip
48 VDC200-240 VAC
Telecom Central OfficesData Centers
7© 2010 Electric Power Research Institute, Inc. All rights reserved.
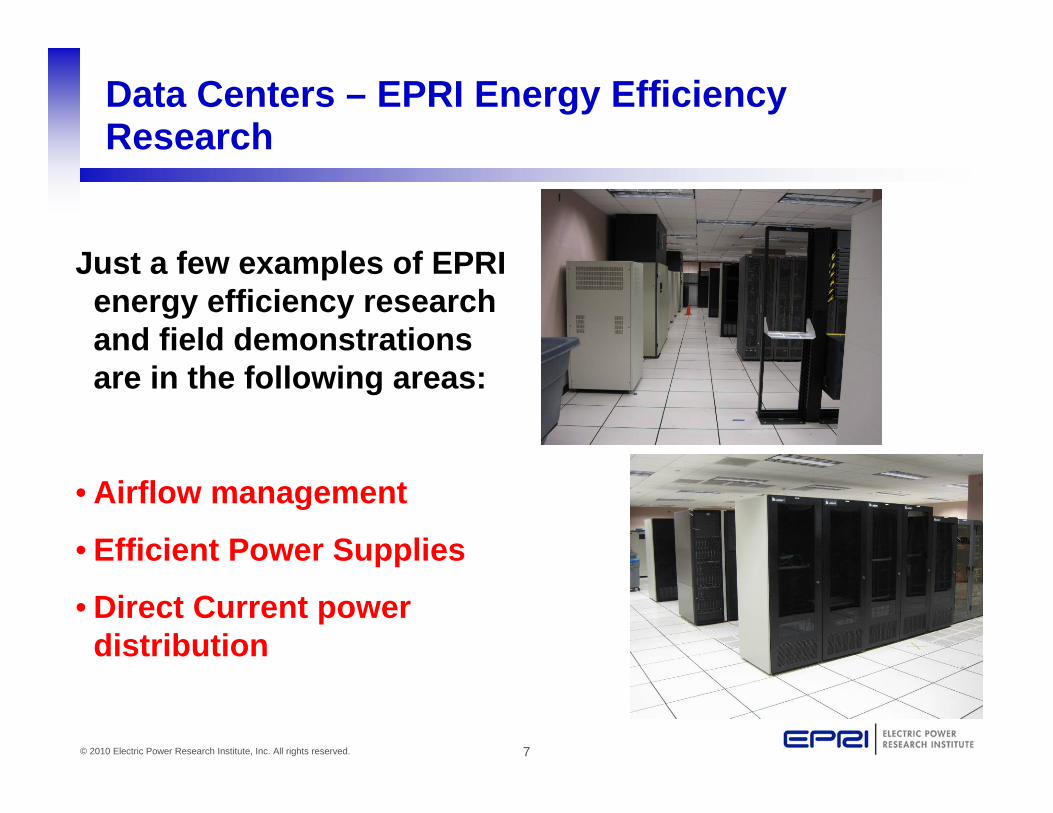
Data Centers – EPRI Energy Efficiency Research
Just a few examples of EPRI energy efficiency research and field demonstrations are in the following areas:
• Airflow management
• Efficient Power Supplies
• Direct Current power distribution

8© 2010 Electric Power Research Institute, Inc. All rights reserved.
Data Centers – Air Flow Management
• This technology uses adaptive software to control heating, ventilation and air conditioning (HVAC) based on temperature.
• This avoids overcooling that is common in today’s data centers
• Wireless temperature sensors make the installation fast and simple
Franchise Tax Board, Sacramento, CA

9© 2010 Electric Power Research Institute, Inc. All rights reserved.
Data Centers – Air Flow Management
Significant Savings Possible:
• Reduced fan energy 66%• Lowered total energy 21.3%• Saved 475,000 kWh/yr• Eliminated > 400 tons CO2/yr• Payback in 3.1 years• Bottom-line: $42,722 per year
saved
0
10
20
30
40
50
60
1/31 2/5 2/10 2/15date/time
Mai
n br
eake
r, kW
BEFORE
AFTER
DASH™ software started
manual control
Balancing Heat and Fan Load

10© 2010 Electric Power Research Institute, Inc. All rights reserved.
Data Centers – Power Supply Retrofits
The Cascade Effect - Power Supply Retrofits Provide the most Bang for the Buck

11© 2010 Electric Power Research Institute, Inc. All rights reserved.
Data Centers – Power Supply Retrofits
• Only EPRI tests efficient power supplies in support of the ECOS 80 PLUS program
• Field demonstrations are ongoing to verify savings
• EPA’s Energy Star program adopted the “same” limits as 80 PLUS
Not Compliant Compliant

12© 2010 Electric Power Research Institute, Inc. All rights reserved.
Data Centers - Power Supply Swap
Power Supplies are tested and certified at our lab –vendors are ready to ship
Six Hot-Swappable Power Supplies will be replaced

13© 2010 Electric Power Research Institute, Inc. All rights reserved.
380VDC Data Centers?!? REALLY???
~28% facility energy savings, incl. cooling compared to “typical” AC system
~7% facility energy savings, incl. cooling compared to “best-in-class” AC system
~33% space savings
200% to 1000% reliability improvement
15% electrical facility capital cost savings
Overall heat load reduction reduces overall cooling requirement
Using fewer of the earth’s resources (15% component reduction)

14© 2010 Electric Power Research Institute, Inc. All rights reserved.
Data Centers – 380VDC Power Distribution
EPRI participated in this 380VDC data center demonstration in 2006 showing:
7% efficiency improvement over “state-of-the-art” AC power distribution
28% efficiency improvement over “typical” AC power distribution
http://hightech.lbl.gov/documents/DATA_CENTERS/DCDemoFinalReport.pdf

15© 2010 Electric Power Research Institute, Inc. All rights reserved.
Standard 208VAC vs 380VDC Data Center

16© 2010 Electric Power Research Institute, Inc. All rights reserved.
300NEDO PJ.(Sendai)
380DC Demo(Sun)
575Validus428 (192cell)
600 NEC(U.S.)
900 BS (U.K.)
750 Ordinance (JPN)
1500 IEC
Law, Regulation,Code, and Stds.
Telecom trends(Number of Cell)
Rating voltage of parts and elements
DistributedGen.
374 (168cell)
321 (144cell)
Dis
tribu
tion
effic
ienc
y
Cab
le D
ista
nce
small
large
450
300
Demos(Reference)
420
0
200
600
800
1000
DC
Vol
tage
186(U.S.)
311(JPN)
354(EU)373(U.K.)
320
405
350
Benefit of HVDC system
AC system voltages( Peak )
Operatingbulk - voltage
260
Why “380” VDC ??? (Sweet Spot)
From NTT-Facilities Survey

17© 2010 Electric Power Research Institute, Inc. All rights reserved.
380VDC vs ITI(CBEMA) VAC Operating Ranges
• Voltage Tolerance Envelope for traditional AC powered computers (left)
• New, DC version of curve, developed by EPRI with NTT and PSL (right)

18© 2010 Electric Power Research Institute, Inc. All rights reserved.
Why Should EPRI Care About Data Centers???
Data Centers are:• Getting bigger
• Getting more numerous
• Using more power
•Jaguar-World’s fastest Supercomputer
•8 MW Electrical Load
•4 MW Cooling Load
• Causing more utility problems
• Causing more customer problems
• Increasing their “Carbon Footprint”

19© 2010 Electric Power Research Institute, Inc. All rights reserved.
Together…Shaping the Future of Electricity