Embed Size (px)
Citation preview

3.8 Calculation of NPSH Available
3.8.1 Containment Overpressure Licensing Basis
The licensing bases for North Anna and Suny both allow credit for containment overpressure in calculation of NPSH available (NPSHa) for the RS and LHSI pumps. The overpressure is explicitly included in the SWEC LOCTIC containment analysis methodology, which performs a transient calculation of NPSHa. This methodology was reviewed recently by the NRC as part of Generic Letter 97-04. The following excerpt is from a letter from Virginia Power to the NRC dated October 29, 1998 [38]:
Virginia Power summarized the analysis methodology concerning the use of containment overpressure for the determination of NPSH for the emergency core cooling and containment heat removal pumps in the previous response to Generic Letter 97-04 noted above. Furthermore, we have concluded from a review of the relevant correspondence that the methodology to credit containment overpressure is part of the licensing bases for both Suny and North Anna. A specific value for containment overpressure credit in the determination of NPSH for the emergency core cooling and containment heat removal pumps has not been previously provided to the NRC for review and approval. Rather, NRC approval has been directed at verification of the adequacy of the methodology used to determine that the available NPSH is greater than the required NPSH for these pumps.
Attachment 1 to Reference 38 provided additional detds on the specific analysis methodology that was used to maximize sump temperature and minimize containment pressure for calculating NpSHa for the RS and LHSI pumps. The NRC agreed with the licensing basis for this transient methodology for calculating NPSHa in Reference 39 for North Anna and Reference 40 for Suny. Using the same approach as the current LOCTIC transient methodology, Dominion will use GOTHIC to predict conservatively the containment conditions following a LOCA in order to determine the NPSHa for the LHSI and RS pumps at Surry and North Anna. An overall conservative calculation is performed to minimize containment pressure and maximize containment sump temperature.
Currently, the other Dominion plants (Millstone Point 2, Millstone Point 3, and Kewaunee) do not credit containment overpressure in the calculation of NPSH available. The methodology in Section 3.8.2 is intended for use at North Anna and Surry. However, the methodology is applicable to large, dry PWR containments and may be used in future licensing applications for other plants.
Topical Report DOM-NAF-3 Page 41

3.8.2 GOTHIC Analysis of NPSH Available
NPSHa is the difference between the fluid stagnation pressure and the saturation pressure at the pump intake. To calculate NPSHa for a given pump, the GOTHIC containment model includes a separate small volume for the pump suction. The volume elevation and height are set so that the mid-elevation of the volume is at the elevation of the pump first-stage impeller centerline. The volume pressure (with some adjustments for sump depth) can then be used in the NPSHa calculation. The temperature in the suction volume provides the saturation pressure. The junction representing piping between the sump and the suction volume reflects the friction and form pressure drop between the sump and the pump suction. The pump suction volume also allows accurate modeling of the mixing of cold water that is injected into the suction of the RS pumps at Surry and North Anna.
The single volume GOTHIC model does not account for geometry details of the sump or the liquid that is held up in other parts of the containment. GOTHIC does calculate the total amount of liquid in the containment. A correlation is used to define the sump depth or liquid level as a function of the water volume in the containment. The correlation accounts for the sump geometry variation with water depth and accounts for the holdup of water in other parts of the containment, as discussed in Section 3.8.3. This correlation is installed in a GOTHIC control variable for use in the NPSHa calculation.
With the above modeling features in place, the NPSHa is calculated via control variables as
Equation 16
where P, is the GOTHIC calculated pressure in the pump suction volume, p, is the liquid density
in the sump, E, is the elevation of the sump surface obtained from the installed correlation or table as a function of V, (the water volume in the containment), E, is the elevation of the containment
volume, H is the height of the containment volume, al the liquid volume fraction in the
containment, P,,,(Ts) is the saturation pressure at the pump suction temperature, p, is the rated
density for the pump (density of the fluid for which the required NPSH is specified).
Worst case conditions for NPSHa depend on the time that the pumps take suction from the sump. Therefore, the parameter settings that minimize NPSHa may vary depending on the timing for the operation of the pumps. In general, settings that reduce containment pressure and increase the sump water temperature reduce the NPSHa. Section 4.7 lists the input parameter studies that provide the limiting set of conditions for Surry.
Topical Report DOM-NAF-3 Page 42

The water in the sump comes from three sources: direct deposit of mass from the break, condensate from the conductors, and spray drops. The drops from the blowdown will be very small and at the saturation temperature at the containment steam partial pressure when they enter the sump. After the blowdown, the spillage water from the vessel is directly put in the sump with no heat transfer to the atmosphere or walls and equipment in the containment. This is a conservative approach for NPSH analysis. The condensate is generated at the saturation temperature at the steam partial pressure and added directly to the sump. The heat transfer between the conductors and the condensate on the way to the sump is conservatively neglected. If the spray drops are modeled as recommended below, the drops will enter the sump at the maximum possible temperature. Heat and mass transfer at the sump surface is allowed. GOTHIC’S model for heat and mass transfer at a pool is in good agreement with experimental data (e.g., the Grout Mold evaporation experiments [3]). For NPSH analysis, the liquid temperature is greater than the vapor temperature for most of the event, so a minimum pool area is specified to minimize evaporation. With this overall approach, the predicted sump temperature is conservatively high for the duration of the simulation.
The following adjustments are made to ensure a conservative calculation of NPSHa:
The heat and mass transfer to the containment heat sinks are expected to be under- predicted using the Direct heat transfer model. This is non-conservative for NPSH analysis. A multiplier of 1.2 applied to the heat transfer coefficient was shown to provide adequate conservatism in the calculation.
All of the spray water is injected as droplets into the containment atmosphere (nozzle spray flow fraction of 1) and the Sauter droplet size is reduced by a factor of 10. These assumptions ensure that the maximum heat is absorbed by the drops and the effect of sprays on reducing the containment pressure is maximized. Smaller drop size will increase the drop holdup in the atmosphere, which will further reduce the containment pressure.
A conservative water holdup volume is subtracted from the containment liquid volume to reduce the sump water height. See Section 3.8.3.
The upper limit on containment free volume is used.
The minimum containment air pressure is used.
Conservative assumptions for spray and other system parameters are used in accordance with plant-specific sensitivity studies (Surry results are summarized in Section 4.7).
Topical Report DOM-NAF-3 Page 43

The NPSHa result from GOTHIC is based on the conditions at the pump first-stage impeller elevation. The difference in elevation between the pump intake and the containment floor is included. Also, the pump suction friction and form losses (including the clean strainer) are specified in the junction between the containment and the pump. Therefore, the margin between the GOTHIC-calculated NPSHa and the required NPSH includes all essential elements of the problem except for strainer bed debris head loss, which is calculated external to GOTHIC and compared to the available margin between NPSHa and required NPSH.
3.8.3 Water Holdup
A conservative containment water holdup volume is subtracted from the GOTHIC-calculated containment liquid volume to reduce the sump water height. The holdup volume includes the following items:
1 ) water added to the spray system piping, 2) water trapped from transport to the containment sump in volumes (e.g., refueling canal
and reactor cavity), 3) condensed films on heat structures, 4) films on platforms and equipment that form after spray is initiated, and 5 ) other losses (e.g., water absorbed in insulation).
Some of the parameters are taken as constant penalties against the water level early in the event. Other items, such as filling the refueling canal, are dependent on spray actuation times and coverage. Control variables are used to calculate the total decrement to the GOTHIC containment liquid volume fraction as a function of time. The corrected liquid volume fraction is then entered into a table of containment water level versus volume to determine the sump level to be used in the NPSHa calculation.
GOTHIC has a droplet field in each control volume. This droplet field explicitly models water drops in the atmosphere separately from the continuous liquid field. Thus, the mass of water droplets is not included in the containment liquid volume fraction that is used to determine the containment water level. No level correction is required for the water drops in the atmosphere.
Topical Report DOM-NAF-3 Page 44

3.9 Time Steps
Calculations are divided into a number of time domains to adequately control the output and time steps for the various phases of the transient. Small time steps and frequent graphics output is needed to accurately track the transient during the blowdown phase and to capture the peak temperature and pressure. Larger time steps and longer graphics intervals can be used for the long term analysis.
There are numerous internal controls on the time step based on numerical stability requirements and limits on the incremental change in key variables. These limits generally provide a good solution with a minimum number of time steps. However, user guidelines instruct the analyst to demonstrate that the automatically selected time step provides a converged solution or to impose additional time step limits to achieve a converged solution.
The recommended approach for time step sensitivity studies is to first allow GOTHIC to select its own time step limits based on the internal controls. Plot the time step and then rerun the calculation with imposed limits that approximate the automatically selected time steps. Reduce the imposed limits by a factor of two and compare results. Repeat until there are no significant changes in key parameters (e.g., peak temperature and pressure). Alternate methods for time step sensitivity may be followed as long as time step convergence is demonstrated.
Topical Report DOM-NAF-3 Page 45

4.0 GOTHIC Demonstration Analyses for Surry Power Station
This section documents GOTHIC containment analyses for Surry Power Station that demonstrate the acceptability of the analysis methodology described in Section 3. Analyses were performed for LOCA peak pressure and temperature, MSLB peak pressure and temperature, containment depressurization, and NPSH available for the LHSI pumps. Comparisons were made to the SWEC LOCTIC analyses described in the Surry UFSAR. Two types of benchmarks were performed:
1. GOTHIC models were adjusted to provide the same physical behavior as LOCTIC. For example, the GOTHIC droplet phase was effectively disabled to compare to the LOCTIC equilibrium flash model and the containment volume liquidvapor interface area was set to zero. These benchmarks used long-term mass and energy data calculated by LOCTIC. The objective was to demonstrate adequate modeling of containment components, nodalization of piping systems, and modeling of spray systems, with respect to another containment response code. These benchmarks showed a successful comparison of the containment response.
2. GOTHIC models were changed to implement the methodology in Section 3 and were run using the same plant design inputs (e.g., initial conditions, ECCS and spray flow rates, heat sinks) as in the LOCTIC analyses of record. The post-reflood mass and energy release is calculated using the GOTHIC RCS model. These comparisons show the modehg benefits from GOTHIC whtle demonstrating similar transient behavior to LOCTIC.
The second set of analyses is included in this section to demonstrate the GOTHIC analytical methodology. Each analysis includes a comparison to the LOCTIC containment response and the mass and energy release rates to justify the GOTHIC simplified RCS model for DEPSG and DEHLG breaks. Surry does not have a MSLB containment response analysis in the UFSAR. Analyses were performed using North Anna mass and energy data with the Suny containment model.
4.1 Surry Power Station Description
Surry Power Station is a three-loop Westinghouse PWR with a subatmospheric containment design. The following plant description is taken from Chapters 5 and 6 of the Surry UFSAR [28]. Suny’s engineered safeguards features (ESF) that mitigate a LOCA or MSLB event include:
1. A safety injection (SI) system that injects borated water into the cold legs of all three reactor coolant loops.
2. Two separate low-head safety injection (LHSI) subsystems, either of which provides long- term removal of decay heat from the reactor core.
3. Two separate subsystems of the spray system-containment spray (CS) and recirculation spray (RS)-that operate together to reduce the containment temperature, return the containment pressure to subatmospheric, and remove heat from the containment. The RS
Topical Report DOM-NAF-3 Page 46

subsystem maintains the containment subatmospheric and transfers heat from the containment to the service water (SW) system.
The CS system consists of two pumps that start on a Consequence Limiting Safeguards (CLS) containment pressure htgh high signal and draw suction from the RWST until the tank is empty. The RS system consists of four independent trains, each with one pump that takes suction from the containment sump. The RS pumps are started currently using delay timers that are initiated on the CLS signal. The delay time allows for sufficient water to accumulate in the sump. Each RS train has a recirculation spray heat exchanger (RSHX) that is cooled by SW (on the tube side) for long-term containment heat removal. The SI system consists of two LHSI and three HHSI pumps that draw from the RWST and inject into the RCS cold legs. The SI pumps take suction from the RWST until a low- low level is reached. Then the LHSI pumps swap suction to the containment sump and the HHSI pumps swap suction to the LHSI pump discharge.
4.2 Suny Power Station GOTHIC Model Overview
This section contains a detailed discussion of plant-specific modeling details for Surry that are not the same for all GOTHIC containment models covered by this report. Differences between plant systems may require different model approaches for volumes, flow paths, trips, etc. For example, Surry and North Anna have slight differences in the recirculation spray systems that require a different number of volumes and flow paths. In addition, the modeling of other elements, such as piping fill times, pump start ramps, and pump heat addition, may vary between models without affecting GOTHIC results. Therefore, these model differences do not represent a change in the methodology, because the treatment does not affect the GOTHIC results.
4.2.1 Geometry
The Surry containment is represented by a lumped volume. Other volumes model the RWST and piping for the spray and safety injection systems. Ten volumes are used to model the primary system and secondary side of the SGs in accordance with Section 3.3.3. Separate conductors model the core, primary metal, SG tubes, and SG secondary metal. Twenty thermal conductors model the containment passive heat sinks. Flow paths model the break through the end of reflood using the vendor’s mass and enthalpy data. At the end of reflood, the GOTHIC simplified RCS model is activated. The release from the first set of flow paths is stopped and different flow paths are activated from the RCS. For a DEPSG break, different flow paths model the release from the broken loop cold leg and the broken loop pump suction during post-reflood. For a DEHLG break, different flow paths model the broken hot leg release from the vessel and the broken hot leg connection to the SG
The design inputs for the physical plant (e.g., containment fiee volume and diameter, RWST available volume, piping volumes, RS timer setpoints) are consistent with the LOCTIC analyses of record in the Surry UFSAR (41. The sump level in both codes is based on a 126-ft diameter cylindrical containment.
Topical Report DOM-NAF-3 Page 47

4.2.2 Engineered Safeguards Features
The GOTHIC model includes a flow boundary condition to model the CS pumps. Flow is variable as a function of the RWST level and downstream pressure. Pump heat is added via a coupled boundary condition. Pipe fill time and pump start delays are incorporated into a delay time that passes before the CS pumps deliver flow to the containment headers. A fraction of CS pump flow is diverted to the suction of the ORS pumps using boundary conditions.
Each RS pump is modeled with a flow boundary condition. Constant flow rates are assumed to bound the minimum and maximum delivered flow rates calculated from system analyses. RS pump heat is added with a coupled boundary condition. Trips are used to start the pumps after the required time delay has passed, including uncertainties and pump start delays. Control volumes model the f i h g of the RS pump discharge piping. Control volumes are used for the RS pump suctions to allow the mixing of bleed flow and the accurate calculation of NPSHa at the pump first-stage impeller. Suction friction and form losses are consistent with the LOCTIC analyses.
Each of the four recirculation spray h e s contains a single-pass, shell-and-tube heat exchanger located inside containment between the RS pump and the spray header. Heat exchanger performance must be modeled correctly to ensure a conservative prediction of heat removal from the sump for long-term accident analysis. The RSHXs model selections in GOTHIC were benchmarked to a detailed heat exchanger design code over the range of accident flow rates and temperatures in the RS and SW systems. The models include tube plugging and fouling for analyses where it is conservative.
Safety injection is modeled with flow boundary conditions that draw from the RWST and the containment sump. Before the end of reflood, slnk boundary conditions remove mass from the RWST consistent with the vendor mass and energy calculation. At the end of reflood, the GOTHIC mass and energy model is activated and boundary conditions inject RWST water into the primary system. When the RWST reaches a low-low level, the boundary conditions are terminated and another boundary condition directs water from the containment sump to the pnmary system.
Section 3.4.2 specifies a nozzle spray flow fraction of 1 with a reduced containment height. To get a sump level comparable to LOCTIC in the benchmark analyses, the containment height was calculated from the free volume and pool area and a spray flow fraction of 0.9 was used. This preserved the sump level and was shown to be more conservative than the methodology in Section 3.4.2. Plant design analyses will implement the methodology in Section 3.4.2 and use a spray flow fraction of 1.0.
Topical Report DOM-NAF-3 Page 48

4.2.3 Mass and Energy Model
LOCA break mass and energy release data up to the end of reflood is obtained from WCAP-14083 [16], which is the current Surry licensing basis LOCA data. Two flow boundary conditions represent the two sides of the broken pipe through the end of reflood. Mass and enthalpy is specified for each break side based on the Westinghouse data. Accumulator nitrogen is injected to the containment with another boundary condition. During the post-reflood phase, the GOTHIC simplified RCS model described in Section 3.5 calculates mass and energy releases out of both sides of the break for the rest of the transient. The vessel and downcomer are initialized (pressure, temperature, liquid fraction) consistent with the WCAP-14083 data at end of reflood. Volumes are used for the secondary side of the intact loops and broken loop SG, respectively.
Surry does not have plant-specific mass and energy release data for MSLB containment response. Instead, North Anna MSLB data was used after it was determined to be conservative for Surry. The North Anna data was obtained from WCAP-11431 [32], which is the North Anna licensing basis MSLB mass and energy data using WCAP-8822-A [33] methods.
4.2.4 Containment Heat Sinks
The containment passive heat sinks geometry and thermal properties were set the same as the LOCTIC input. The modeling guidelines for nodalization of each conductor from Section 3.3 was applied. The MSLB analysis model includes the accumulator tanks filled with water as an additional heat sink. The containment heat sinks are grouped into the following categories.
Containment structure shell below grade Containment structure shell above grade Containment structure dome and liner Containment structure floor above floor liner Containment structure mat below floor liner Internal concrete slabs Carbon steel inside the containment Stainless steel inside the containment Accumulator tanks filled with water (MSLB only)
Heat transfer options were set consistent with Section 3.3.2. The Direct heat transfer option with DLM condensation was applied to all containment heat sinks except the sump floor. The Split option was used for the floor to switch the heat transfer from vapor to liquid as the liquid level builds in the basement. The containment walls above grade and the containment dome used a specified external temperature of 95 F with a heat transfer coefficient of 2.0 Btu/hr-ft’-F, which is consistent with the current LOCTIC analyses. For the LHSI pump NPSHa analysis, a multiplier of 1.2 is applied to the Direct heat transfer coefficient (see Section 3.8.2).
Topical Report DOM-NAF-3 Page 49

4.3 GOTHIC Analysis of LOCA Peak Pressure
4.3.1 Containment Response
The containment peak pressure is obtained from a DEHLG break. Table 4.3-1 compares the key results of a GOTHIC benchmark analysis to the LOCTIC containment peak pressure analysis from the Surry UFSAR. Plant design inputs for containment initial conditions (12.5 psia, 125 F, and 100% humidity) and passive heat sinks are the same. The only differences are related to the GOTHIC methodology selections described in Section 3 (e.g. , 100-micron break droplet size).
Figures 4.3- 1 through 4.3-6 compare the GOTHIC containment pressure, vapor temperature, liquid temperature, sump level, RSHX heat rate, and four conductor heat transfer coefficients to LOCTIC values shown as discrete points. The GOTHIC containment temperature and pressure profiles exhibit the same behavior as LOCTIC but with different magnitudes. The lower peak pressure from GOTHIC is attributed to the droplet phase and the DLM condensation model. The droplets provide more heat transfer area and tend to produce smaller pressures than a liquid release from LOCTIC. Figure 4.3-6 compares the DirectDLM heat transfer coefficients for four different GOTHIC heat sinks to the Tagami-Uchida model used on all LOCTIC heat sinks.
As expected, GOTHIC provides margin in containment peak pressure and temperature but produces a higher containment liquid temperature than LOCTIC. In the long-term, the GOTHIC RSHXs have higher heat rates to remove the energy from the sump, such that the liquid temperature and RSHX heat rates converge at 1200 seconds.
4.3.2 DEHLG Mass and Energy Release
The methodology in Section 3.5.3.3.3 was used. Westinghouse mass and energy release data is used up to 115.8 seconds, the end of reflood for the DEHLG break. At that time, the GOTHIC simplified RCS model is activated with initial conditions that are consistent with the Westinghouse mass and energy distribution from WCAP-14083 [15]. At this time, the break release is SI flow heated by the core and primary metal conductors. Figures 4.3-7 and 4.3-8 compare the integral energy release and integral mass release, respectively, to the LOCTIC output (which uses the Westinghouse data without adjustment). The integral mass release matches closely. The GOTHIC integral energy release to the containment is about 6% higher at 1200 seconds. Table 4.3-2 compares the GOTHIC integral energy addition to the primary coolant from the core and primary metal conductors to the difference in Westinghouse energy over this period [15]. The energy difference is based on two modeling differences.
Topical Report DOM-NAF-3 Page 50

For conservatism, the GOTHIC model was initialized with the core conductor at the primary system liquid temperature (235 F). In contrast, the Westinghouse methodology in WCAP-8264-P- A removes all of the core stored energy before the end of reflood. The GOTHIC assumption adds a small amount of additional stored energy to the primary system.
The second difference is due to the ability of GOTHIC to calculate realistically the vessel liquid subcooling in response to more than adequate SI flow that is available to remove the core and metal energy. At 1500 seconds, the GOTHIC vessel liquid temperature is 137 F. This is about 100 F less than the vendor value of 235 F at the end of reflood. The lower value is expected from 3300 gpm SI flow removing core and metal energy. In contrast, the Westinghouse methodology applied in WCAP-14083 reduces the primary system liquid from 235 F at the end of reflood to 212 F at 1500 seconds. During this phase, the Westinghouse method does not remove any thin metal energy but the thick metal releases -10 MBtu. Over the same period, the GOTHIC primary metal conductor (thin and thick metal) has added almost 20 MBtus to the break fluid.
4.3.3 Summary of DEHLG Peak Pressure Comparison
The GOTHIC containment temperature and pressure profiles exhibit the same behavior as LOCTIC but with different magnitudes. GOTHIC produces a lower blowdown peak pressure because of the break droplet model and the DirectDLM condensation model. In the long-term, containment pressure and liquid temperature results converge as the RS heat exchangers remove the excess energy in the GOTHIC sump liquid. The GOTHIC simplified RCS model for post- reflood mass and energy release from DEHLG breaks has been shown to be more conservative than the Westinghouse methodology in Reference 14. The model removes primary system energy in accordance with the calculated subcooling of the RCS liquid in the form of higher SI spillage temperatures as the vessel depressurizes.
Topical Report DOM-NAF-3 Page 5 1
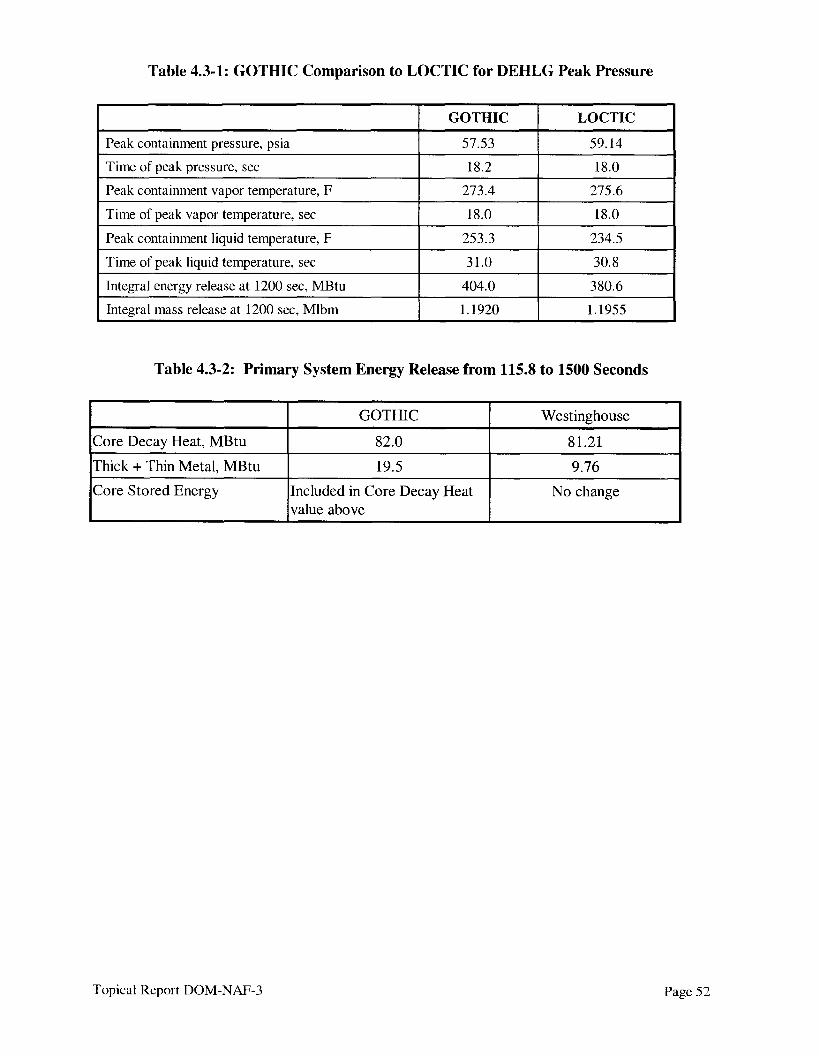
Table 4.3-1: GOTHIC Comparison to LOCTIC for DEHLG Peak Pressure
GOTHIC
Peak containment pressure, psia 57.53
Time of peak pressure, sec 18.2
Peak containment vapor temperature, F 273.4
Time of peak vapor temperature, sec 18.0
Peak containment liquid temperature, F 253.3
Time of peak liquid temperature, sec 31.0
Integral energy release at 1200 sec, MBtu 404.0
Integral mass release at 1200 sec, Mlbm 1.1920
LOCTIC
59.14
18.0
275.6
18.0
234.5
30.8
380.6
1.1955
Table 4.3-2: Primary System Energy Release from 115.8 to 1500 Seconds
Core Decay Heat, MBtu
GOTHIC Westinghouse
82.0 81.21 Thick + Thin Metal, MBtu
Core Stored Energy
Topical Report DOM-NAF-3
~ ~ ~~~
19.5 9.76 Included in Core Decay Heat value above
No change
Page 52

Figure 4.3-1: DEHLG Containment Pressure Comparison to LOCTIC
Containment Pressure PRI DC25T
Figure 4.3-2: DEHLG Containment Vapor Temperature Comparison to LOCTIC
h
k.
P
m 3
m Q
>^ ..-,
t I-
Containment Vapor Temperature TV? DCET
0- %--* 8 7
I
k ?
.............................. . ..... ......,.. " . ,
Topical Report DOM-NAF-3 Page 53

Figure 4.3-3: DEHLG Containment Liquid Temperature Comparison to LOCTIC
Containment Lqoid Temperature TL1 DC26T
0 *----* " t
Figure 4.3-4: DEHLG Containment Sump Level Comparison to LOCTIC
Topical Report DOM-NAF-3 Page 54

Figure 4.3-5: DEHLG RSHX Total Heat Rate Comparison to LOCTIC
#
0.3 0.8 03 1.2 1.5 x1 e3 Time (sec)
Figure 4.3-6: GOTHIC Conductor Heat Transfer Coefficients Comparison to LOCTIC
:I a I I I 1 1 1 1 1 I I I I I I11 '&-A
0.1 1 10 100 M
Topical Report DOM-NAF-3 Page 55

Figure 4.3-7: DEHLG Integrated Energy Release Comparison to LOCTIC
52
3 .* k-5 E? x
a, E: w 24 m 2 m
Figure 4.3-8: DEHLG Integrated Mass Release Compared to LOCTIC
....................... A. ....................... ; ........................ : ........................
....................... j ......................... ..........
Topical Report DOM-NAF-3 Page 56
4.4 GOTHIC Analysis of Containment Depressurization
Containment depressurization is analyzed for subatmospheric containment designs to demonstrate that the containment pressure becomes subatmospheric within the time that is assumed for containment leakage in the dose consequences analyses. The maximum containment depressurization time occurs for a DEPSG break with minimum safeguards and minimum flow rates for the safety injection and spray systems. The LOCTIC analysis of record from the Surry UFSAR was repeated using the same design inputs and the GOTHIC methodology selections described in Section 3. The GOTHIC simplified RCS model for mass and energy release is consistent with Section 3.5.3.3.2. The vessel volume is subdivided with two axial nodes to activate the Yeh model for two-phase level swell and liquid entrainment into the SG tubes.
4.4.1 Containment Response
Table 4.4-1 compares the time sequence of events from the GOTHIC and LOCTIC analyses. Figures 4.4- 1 through 4.4-3 compare the containment pressure, vapor temperature, and liquid temperature to LOCTIC results (shown as a dashed line). During the early part of the transient, GOTHIC predicts lower containment pressure and vapor temperature than LOCTIC, but the sump temperature is higher. The RSHX duty increases and the sump temperatures converge after 1000 seconds. This containment response is consistent with the DEHLG model comparison in Section 4.3. However, the GOTHIC depressurization time is shorter and the subatmospheric peak pressure is less than LOCTIC. The difference in long-term containment pressure is explained by the GOTHIC post-reflood break energy distribution in Section 4.4.2.
4.4.2 DEPSG Mass and Energy Release
Westinghouse mass and energy release data is used up to 200 seconds, the end of reflood for the DEPSG break with minimum SI flow. At that time, the GOTHIC RCS model is activated with initial conditions that are consistent with the Westinghouse mass and energy distribution in WCAP-14083 [15], which used the NRC-approved FROTH analysis methodology [14, 161 to calculate the post-reflood mass and energy release rates. The LOCTIC analysis modifies the FROTH mass flow rat6 by adjusting for differences in the SI flow rates versus those assumed by Westinghouse (bounding maximum flow rates are used so that the FROTH analysis does not have to be repeated if system improvements are realized). Thus, the FROTWLOCTIC methodology for DEPSG breaks is the comparison standard in this section.
Figures 4.4-4 and 4.4-5 compare the GOTHIC integral mass and energy releases to LOCTIC. Table 4.4-2 shows that the GOTHIC integral energy release to the containment is about 1% larger and the integral mass is very close to LOCTIC at 1 hour. Table 4.4-2 also compares the integral energy at the end of reflood and at the time that GOTHIC predicts subatmospheric conditions (2201 seconds). Figure 4.4-6 shows the SG secondary liquid temperatures drop quickly with the
Topical Report DOM-NAF-3 Page 57

containment depressurization. The GOTHIC primary system energy release is more conservative but the distribution of the energy requires further discussion.
The GOTHIC depressurization time is less than LOCTIC because of difference in modeling the core exit steam distribution, which in turn affects the break energy distribution between liquid and vapor. The FROTH analysis methodology that generated the post-reflood data for LOCTIC assumes 95% of the core exit steam enters the broken loop SG [14]. This non-mechanistic assumption results in a higher mass release of superheated steam from the broken loop SG than GOTHIC. FROTH still removes all of the intact loop SG secondary energy in 1 hour, effectively maintaining a large amount of liquid entrainment into the intact SGs with only 5% of the core exit steam flow. As a result, the LOCTIC containment response using the FROTH inputs takes longer to deposit the additional superheat mass in the sump and depressurize the containment.
In contrast, the GOTHIC simplified RCS model is mechanistic, using hydraulics to determine the steam flow split to the intact and broken SG loops. The GOTHIC steam velocity determines the amount of liquid entrainment into the SG tubes. While biasing the loss coefficients in the intact loop hot legs to force more steam into the broken loop SG will increase the superheated steam release, the reduced liquid entrainment into the intact loop SGs will slow the secondary energy removal rate. In the aggregate, the total break energy from this bias is less than the amount when GOTHIC calculates the flow split and carries liquid into the intact loop SG tubes. A GOTHIC sensitivity case with a large loss coefficient in the intact hot legs confirmed this conclusion. The secondary side temperature on the intact loop SGs decreases very slowly. The integral energy release at 3600 seconds is 640.1 MBtu (compared to 683.3 MBtu) and the containment becomes subatmospheric 200 seconds earlier (-2000 seconds). In conclusion, it is conservative to use the GOTHIC hydraulic model (i.e., no bias on the steam flow), such that the secondary energy is quickly removed from all of the SGs during the system depressurization.
The GOTHIC subatmospheric peak pressure occurs after the CS pump, which sprays 45 F water, is stopped on low RWST level at 4324 seconds. The RS system continues to spray warmer water (sump water passed through the RS heat exchangers) and the containment pressure increases until a peak occurs and the RS system reaches an equilibrium with the core decay heat that is spilled to the sump. The GOTHIC subatmospheric peak pressure is less severe than LOCTIC for two reasons. First, the containment pressure when the CS pumps stop is about 2 psi lower than LOCTIC because of the aforementioned distribution of break energy between liquid and vapor. Second, as the containment pressure begins to rise after CS termination, the thermal conductors in the primary and secondary systems can absorb energy. In contrast, LOCTIC only discharges energy from the primary and secondary systems if pressure is decreasing during the post-reflood phase. Once the CS system stops and containment pressure starts to rise, LOCTIC does not have a mechanism to add energy into the primary system (i.e., no thermal conductors). Adding this energy back to the primary system is physically realistic and therefore appropriate.
Topical Report DOM-NAF-3 Page 58
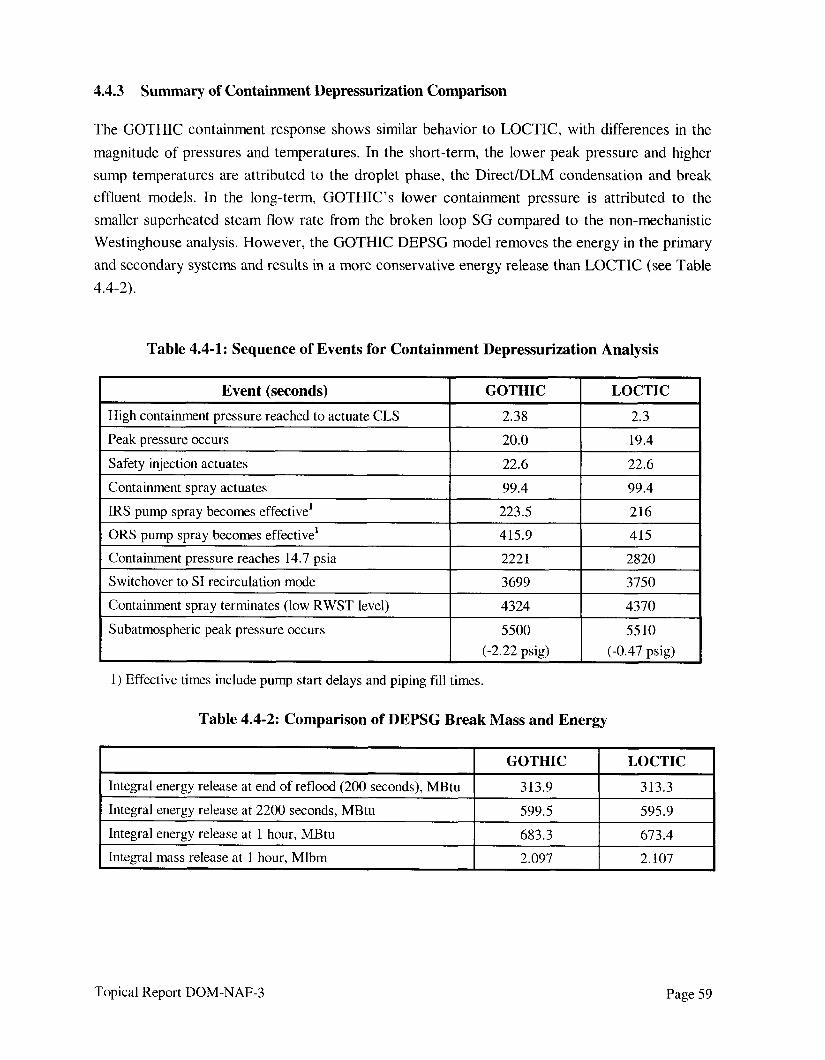
4.4.3 Summary of Containment Depressurization Comparison
High containment pressure reached to actuate CLS Peak pressure occurs
The GOTHIC containment response shows similar behavior to LOCTIC, with differences in the magnitude of pressures and temperatures. In the short-term, the lower peak pressure and higher sump temperatures are attributed to the droplet phase, the Direct/DLM condensation and break effluent models. In the long-term, GOTHIC'S lower containment pressure is attributed to the smaller superheated steam flow rate from the broken loop SG compared to the non-mechanistic Westinghouse analysis. However, the GOTHIC DEPSG model removes the energy in the primary and secondary systems and results in a more conservative energy release than LOCTIC (see Table 4.4-2).
~ ~~
2.38 2.3
20.0 19.4
Table 4.4- 1 : Sequence of Events for Containment Depressurization Analysis
Safety injection actuates Containment spray actuates IRS pump spray becomes effective'
I Event (seconds) I GOTHIC I LOCTIC
22.6 22.6
99.4 99.4
223.5 216
ORS pump spray becomes effective' Containment pressure reaches 14.7 psia
415.9 415
222 1 2820
Switchover to SI recirculation mode Containment spray terminates (low RWST level)
Subatmospheric peak pressure occurs
~ _____ ~~
3699 3750
4324 4370
5500 55 10 (-2.22 psig) (-0.47 psig)
1) Effective times include pump start delays and piping fill times.
Integral energy release at end of reflood (200 seconds), MBtu Integral energy release at 2200 seconds, MBtu Integral energy release at 1 hour, MBtu Integral mass release at 1 hour, Mlbm
Table 4.4-2: Comparison of DEPSG Break Mass and Energy
GOTHIC LOCTIC
313.9 313.3
599.5 595.9
683.3 673.4
2.097 2.107
Topical Report DOM-NAF-3 Page 59

Figure 4.4- 1: Containment Pressure for Containment Depressurization
04
Figure 4.4-2: Containment Vapor Temperature for Containment Depressurization
Containment Vapor Temperature TVl D627'T
--7 '
0 ..I.... - ........... I ..... ...... .... . .. ..L ..... ." ..... ".. ,.
0.1 1 10 100 1000 1
Time (sec)
Topical Report DOM-NAF-3 Page 60

Figure 4.4-3: Containment Liquid Temperature for Containment Depressurization
Containment Liquid Temperature TL1 DC26T
~ - ~ - ~ ~ " q- ---
Figure 4.4-4: DEPSG Integrated Mass for Containment Depressurization
Total Break Mass cv50C D C l n % ~ . - - -
.- .d.
m
T i m (sec)
Topical Report DOM-NAF-3 Page 61

Figure 4.4-5: DEPSG Integrated Energy for Containment Depressurization
2 Total Break Energy
h
+ 3
m f U1 Y (D
P m
.....................................
............. ....*......... ..........
............
................
0.1 1 10 100 1000
Time (sec) GOTHIC 7 Pdom(QA) SeflSnaaS 15 5129
Figure 4.4-6: DEPSG SG Secondary Temperatures for Containment Depressurization
3 S.G. Secondary Side Temperatures TL18 TI21 TVl8 lV21 3 - - - ..................
~ ~--------
Time (sac) Xle3 iOTHIA: 7 26om(UAJ %p!2#2005 15 51 29
Topical Report DOM-NAF-3 Page 62

4.5 GOTHIC Analysis of LHSI Pump NPSH Available
A GOTHIC calculation of LHSI pump NPSHa is compared to the LOCTIC analysis from the Suny UFSAR for a DEPSG break with one train of safeguards and maximum SI flow. The minimum NPSHa occurs at recirculation mode transfer (RMT), when the LHSI pump swaps suction from the RWST to the containment sump. After FWT, NPSHa increases as the containment pressure stabihzes and the sump temperature decreases from the RS heat exchangers removing energy. Thus, it is important that the primary and secondary system energy be removed at a high rate to maximize the sump temperature before RMT. The DEPSG model for containment depressurization from Section 4.4 was biased in accordance with Section 3.8.2 to minimize NPSHa. Specifically, the spray nozzle droplet diameter was reduced by a factor of 10, the nozzle spray flow fraction was set to 1.0, a multiplier of 1.2 was applied to the conductor heat transfer coefficients, and the upper limit on the containment free volume was used. The containment initial conditions and design inputs were the same as the LOCTIC analysis. Water holdup was excluded because it was not part of the LOCTIC analysis.
4.5.1 Containment Response
Table 4.5-1 compares the sequence of events and Table 4.5-2 compares the results at the time of minimum NPSHa. Figures 4.5- 1 through 4.5-4 compare the containment pressure, vapor temperature, liquid temperature, and sump level to LOCTIC results shown as discrete points. The distribution of the energy release into containment is indicated by the containment pressure and temperature response. During the early part of the event (<lo00 sec), the GOTHIC sump liquid temperature is considerably less than LOCTIC, the vapor temperature is slightly higher, and the pressure is higher. The LOCTIC pressure flash option models the break liquid as a continuous liquid addition to the sump. GOTHIC break modeling using droplets results in a different containment energy distribution. In general, the LOCTIC pressure flash option causes a very conservative amount of energy to be retained in the sump liquid with less vapor flashed into the air space. This is evident from the very high (> 250 F) LOCTIC sump temperatures that are maintained until almost 1000 seconds even while the RS heat exchangers are removing sump energy. The vapor temperature is slightly less than the GOTHIC values. LOCTIC assumes no interfacial heat transfer between the sump pool and containment atmosphere, which also explains the high liquid temperatures.
For the first few seconds, the LOCTIC vapor temperatures are much higher than GOTHIC. This is due to the lack of a droplet model in LOCTIC, which results in a brief period of superheat. Once the IRS and ORS pumps become effective (200-400 seconds into the event) and the sump liquid is sprayed into the containment, the difference between the model responses becomes less noticeable. At the time of RMT, the GOTHIC sump liquid temperature is about 1 F higher than LOCTIC and the pressure is about 0.7 psi higher. The higher sump temperature provides a relative adverse effect on NPSHa while the increased pressure is a benefit. The sump levels in
Topical Report DOM-NAF-3 Page 63

Figure 4.5-4 is very close, with GOTHIC slightly lower (4.12 ft vs. 4.2 ft) at RMT. The net result is that the GOTHIC minimum NPSHa is about 1.4 ft higher than the LOCTIC value.
4.5.2 DEPSG Mass and Energy Release
The DEPSG model from Section 4.4.2 is used with thermal equilibrium in the broken loop cold leg using a liquidvapor interface area of 1E+08 ft’- consistent with Section 3.5.3.3.1. This promotes thermal equilibrium between any vapor from the downcomer and the SI added to that cold leg, which produces elevated sump temperatures. The SI flow is split based on the plant configuration for flow to the downcomer (for the intact cold legs) and the broken loop cold leg.
Figures 4.5-5 and 4.5-6 show a good comparison of the integral mass and energy releases over the entire transient, with GOTHIC values about 0.5% higher at the time of RMT (Table 4.5-2). The SG secondary fluid temperatures in Figure 4.5-7 decrease rapidly early in the event as the vessel level swell model causes liquid to rise into the SG tubes, drawing energy from the SG secondary side fluid. At RMT, the SG secondary side temperatures are approximately 200 F. Similarly, the primary side metal in Figure 4.5-8 follows the reactor vessel fluid temperature to a minimum of about 213 F at RMT before increasing from the increases in containment pressure and temperature after CS termination. The effect of the large liquidvapor interface area in the downcomer and broken cold leg volumes is seen in Figure 4.5-9. Although superheated steam is delivered to the downcomer (volume 23) from the intact cold legs (volume 22), the downcomer liquid and vapor phases are in equilibrium. A similar effect occurs in the broken loop cold leg volume, except the temperatures are lower due to mixing with additional SI flow. In conclusion, the simplified RCS model appropriately and conservatively removes the primary and secondary stored energy before RMT. In addition, the complete mixing that occurs in the downcomer and broken cold leg volumes ensures that the liquid discharged to containment is at the highest (most conservative) temperature.
Some of the primary system volumes demonstrate oscillatory behavior, such as the temperatures shown in Figures 4.5-8 and 4.5-9. Oscillations in liquid flow are caused by oscillatory phase change, most likely in the steam generators, which causes pressure perturbations throughout the primary system and corresponding flow oscillation. The oscillations are similar to those observed in the FLECHT SEASET tests, which had similar system depressurization and cooling [36]. Liquid temperatures exhibit this type of behavior as a result of primary system conductors going in and out of boiling heat transfer mode in response to fluctuating pressures. The result is swings in the heat transfer coefficient and heat flux, which affect both the conductor surface and liquid temperatures.
Topical Report DOM-NAF-3 Page 64

4.5.3 Summary of LHSI Pump NPSHa Comparison
The GOTHIC comparison case shows good agreement with the corresponding LOCTIC case. The simplified RCS model has removed all of the SG secondary side energy when the vessel and SGs are fully depressurized. The GOTHIC integrated mass and energy release into containment at the time of minimum NPSH is actually slightly higher. The primary difference between the two cases is due to the LOCTIC pressure flash option, which determines how break energy is partitioned between the containment liquid and vapor regions. The LOCTIC treatment of the break liquid as a continuous liquid forces more of the break liquid energy to be deposited in the containment sump with less flashing of vapor into the air space. GOTHIC uses more realistic models for the treatment of the break releases with some of the liquid being dispersed as droplets in the vapor space. It also allows for mass and heat transfer between the sump pool and air space. These differences are much more pronounced early in the event, but become less noticeable as the vapor and liquid regions are mixed via the operation of sprays. The more realistic GOTHIC modeling of the RCS and SGs results in slightly more energy being transferred to the containment at the time the LHSI pumps take suction from the sump. At the time of minimum NPSHa, the GOTHIC sump temperature is actually slightly higher than the LOCTIC value; however, the GOTHIC pressure is also higher, yielding a small, net increase in NPSHa. The higher sump temperature and containment pressure than LOCTIC is consistent with the additional energy addition from the RCS model, and is considered to be a reasonable and more accurate system response.
Topical Report DOM-NAF-3 Page 65

Table 4.5-1: Sequence of Events for LHSI Pump NPSHa Analysis
Peak pressure occurs
Safety injection actuates
Containment spray actuation
Event (seconds)
19.8 19.4
22.6 22.6
99.7 99.3
I GOTHIC I LOCTIC
IRS pump spray becomes effective'
ORS pump spray becomes effective'
Switchover to SI recirculation mode transfer (RMT)
High containment pressure reached to actuate CLS ~ I 2 . 7 --I 2.3
223.6 214.3
420.8 41 1.3
3230 3240
GOTHIC LOCTIC
Table 4.5-2: GOTHIC Comparison to LOCTIC for LHSI Pump NPSHa
Time of SI recirculation mode transfer (RMT), sec
LHSI pump NPSH available, ft
3230 3240
18.4 17.0
Sump liquid temperature, F
Containment vapor temperature, F
Containment pressure, psia I 10.57 I 9.89
161.1 160.1
11 1.3 98.1
Sump liquid level, ft 4.12 4.2
Integral energy release at RMT, MBtu I 674.2 I 670.7
Integral mass release at RMT, Mlbm 2.134 2.120
Topical Report DOM-NAF-3 Page 66

Figure 4.5-1: Containment Pressure - LHSI Pump NPSH
.....................
1 100 1000
Time e c
4-04
Figure 4.5-2: Containment Vapor Temperature - LHSI Pump NPSH
........ ..............................................
........................
Topical Report DOM-NAF-3 Page 67

Figure 4.5-3: Containment Liquid Temperature - LHSI Pump NPSH
TL1 DC26T ... ~
8- *-* 07
t I
. . . ._. . ..I. . . . .
5: ............................. ”.,.,..*.‘.~.. l...__...._..._ ’.........---..~‘... v-
8 ?-
Q. 1 1 10 100 1000
Time (Sec)
Figure 4.5-4: Containment Sump Level - LHSI Pump NPSH
L.L1 DC42T *---* - In
Topical Report DOM-NAF-3 Page 68

Figure 4.5-5: Integral Break Mass to Containment - LHSI Pump NPSH
0.1 1 10 100 18-1.04
Time (see)
Figure 4.5-6: Integral Break Energy to Containment - LHSI Pump NPSH
Time (sec)
Topical Report DOM-NAF-3 Page 69

Figure 4.5-7: SG Secondary Side Liquid and Vapor Temperatures - LHSI Pump NPSH (Volume 18 = Intact Loops, Volume 21 = Broken Loop)
IL18 PL21 TV18 TV2I 0- - _ - ............ 8 ^.~lll_. .....
.........................
1 2 3 4
......................
......................
......................
Time rsecl Xte3
Figure 4.5-8: Primary Metal (TA22) and Reactor Vessel Liquid Temperatures (TLlSsl) - LHSI Pump NPSH
0.001 1.007 2.001 3 4 XlE13 Time (secf
Topical Report DOM-NAF-3 Page 70

Figure 4.5-9: Intact Cold Legs (Volume 22) and Downcomer (Volume 23) Temperatures LHSI Pump NPSH
T E 3 TV23 TV22 II 1 - ~
1.0 2.4 3.2 4 x1e3 Time (sec)
Topical Report DOM-NAF-3 Page 7 1

4.6 GOTHIC Analysis of MSLB Event
Surry does not have an explicit MSLB containment response analysis in the UFSAR. However, an explicit analysis will be performed for Surry as part of the plant-specific implementation of this topical report. The North Anna UFSAR includes MSLB containment response analyses using LOCTIC. The North Anna MSLB mass and energy release data from Reference 32 was confirmed to be conservative for Surry. Ths section describes MSLB containment response analyses performed with the Suny GOTHIC containment model and North Anna mass and enthalpy data.
Two cases were analyzed using data from a 1.4 ft’ break at 102% power because this break produces a superheated containment atmosphere and the benefits of the GOTHIC DLM condensation option can be demonstrated. The first case demonstrates the use of the GOTHIC modeling assumptions in Section 3. Figures 4.6-1 and 4.6-2 show the containment pressure and temperature predictions for this case. The atmosphere remains superheated for a very short time, returning to saturation within 10 seconds from the time of the break. The containment pressure peaks -200 seconds when the faulted SG reaches dryout and the mass release rate matches the AFW addition rate.
The second case incorporated two changes to GOTHIC to mimic LOCTIC and compares the Surry containment response to a North Anna UFSAR LOCTIC analysis. First, the droplet diameter was set to none for the break boundary condition to mimic the LOCTIC pressure flash model and force all break liquid to enter containment in the continuous liquid phase. Second, the condensation option was changed from DLM to UCHIDA for the containment heat sinks. North Anna has a larger containment free volume and a core power (2893 MWt versus 2546 MWt) than Surry. Because the Surry GOTHIC model (with different heat sinks, free volume, and spray flows compared to North Anna) was used, the mass release was reduced by the ratio of core power. The intent was to compare behavior to a North Anna LOCTIC analysis. Figures 4.6-3 and 4.6-4 compare the containment pressure and temperature to the LOCTIC data shown with points. Simulating the LOCTIC pressure flash model allows the atmosphere to remain superheated longer (-200 seconds) and to reach a much higher peak temperature.
Once this difference between the codes was understood, the Surry GOTHIC model was run with North Anna mass and energy release data from seven different combinations of break size and initial power level. Break size ranged from split breaks to the maximum 1.4 ft’ applicable to Surry and North Anna. Power level ranged from 0% (limiting for peak pressure due to the larger SG liquid mass) to 102% power (limiting for superheat). The comparison was done to validate the GOTHIC response to the range of break conditions. Figures 4.6-5 and 4.6-6 compare the containment pressure and temperature for all seven cases. The trends are consistent with the North Anna LOCTIC analysis results. As described in Section 3, GOTHIC MSLB analyses will use the DLM condensation option and the break droplet model. This section demonstrates that the GOTHIC modeling over the range of MSLB conditions is acceptable.
Topical Report DOM-NAF-3 Page 72

Figure 4.6-1: MSLB Containment Pressure with GOTHIC Models
0
g
g
g
g
0-
....................
- ....................
...................
-. .....................
Figure 4.6-2: MSLB Containment Vapor Temperature with GOTHIC Models
Containment Vapor Temperature TV1 ST1
0- -- 10 m
~
0.1 1 10 100 1000 1 e+004
Time (sec) iOTHlC 7 2dom(QA) Jan/31/2005 11 M 23
Topical Report DOM-NAF-3 Page 73
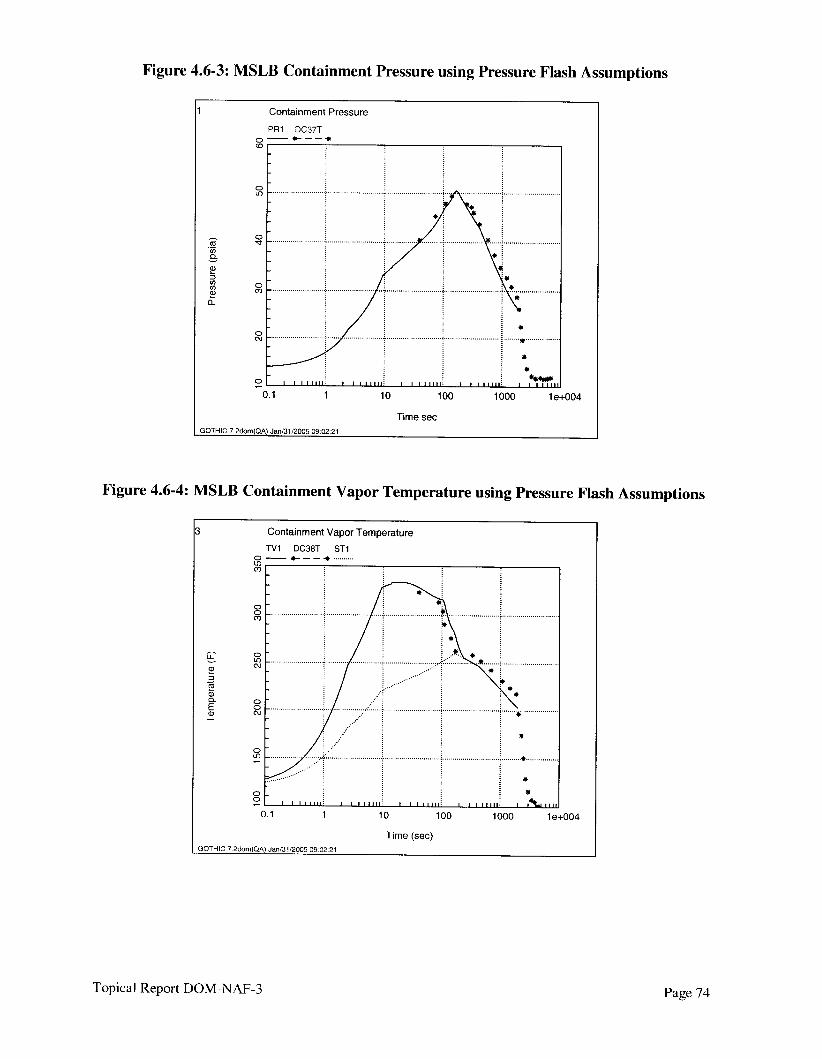
Figure 4.6-3: MSLB Containment Pressure using Pressure Flash Assumptions
Containment Pressure
PR1 DC37T
0.1 1 10 100 1000 1 e+004
Time sec SOTHIC 7 Pdom(QA) Jan/31/2005 09 02 21
Figure 4.6-4: MSLB Containment Vapor Temperature using Pressure Flash Assumptions
3 Containment Vapor Temperature
Time (sec) GOTHIC 7 2dom(QA) Jani3112005 09 02 21
Topical Report DOM-NAF-3 Page 74

d 2 40
M v)
a"
30
20
10 t,,,
Figure 4.6-5: Comparison of Containment Pressure for MSLB Spectrum
> - - - -- - "- -
early and 0%) P I S
Smaller breaks peak later than
~ 14ft2,102%P
-0.6 ft2, 102% P
0 50 I00 150 200 250 300 350 400 450 500
Time, sec
Topical Report DOM-NAF-3 Page 75

Figure 4.6-6: Comparison of Containment Vapor Temperature for MSLB Spectrum
320
300
280
260
200
180
160
140
"--x_ ~ ~ ~ - ~ _ _ _ ---- ~ I ~ ~" ___ ~ ~ - - " " _ _ ~ . ~ I _ " ~ - - Breaks smaller than 1.4 ti2 peak earlier from superheat
1.4 ft2 cases peak later but show superheat In first 5 seconds before pressure returns to the saturation line This behavior I S a function of the break
-
1.4 ft2, O%P 1.4 ft2, 70% P 1.4 ft2, 102%P
__I_
- . -_
- 0.6 ft2, 102% P 0.681 ft2 split, 70% P
0 so 100 150 200 250 300 350 400 450 SO0
Time, sec
Topical Report DOM-NAF-3 Page 76

4.7 Sensitivity Studies
The conservative assumption for a particular analysis depends on the design requirement that is being verified. Sensitivity studies will be performed for break locations, single failures, and design inputs for each plant-specific GOTHIC containment analysis. Table 4.7-1 documents the results of the studies for Surry’s containment analysis criteria. The conclusions are consistent with the current LOCTIC analyses with the exception of the limiting single failure for the calculation of NPSHa for the ORS and IRS pumps. The LOCTIC assumption is full safeguards, whtle the GOTHIC analysis concluded that the limiting failure is one train of emergency power. Ths change is d y because of the LOCTIC NPSHa analysis assumptions for pressure flash model and no interface heat transfer between the sump pool and the atmosphere, which creates lower containment pressures than GOTHIC for NPSH calculations. This difference between the codes is accentuated when all six spray pumps are running.
Table 4.7-1 illustrates the breadth of sensitivity analyses that were performed for Surry to confirm the luniting assumptions for the current plant configuration. The results are speclfic to Suny’s current configuration and are not intended to cover all Dominion PWRs, since each station has specrfic design criteria and engineered safety features that require sensitivity studies. Dominion will perform slmilar sensitivity studies to define the set of conservative assumptions for each PWR application.
4.8 Summary of Demonstration Analyses
Based on the comparison to LOCTIC, it is concluded that the GOTHIC model selections identified in Section 3 appropriately model the containment response for LOCA and MSLB events. GOTHIC shows similar behavior for containment pressure and temperature to the SWEC LOCTIC code for a DEHLG break with maximum safeguards and a DEPSG break for containment depressurization and LHSI pump NPSHa. GOTHIC predicts lower peak containment pressures because of the DLM condensation model and the break droplet model. The GOTHIC liquid temperature is lugher in the short-term, but the RS heat exchangers and the interfacial heat and mass transfer in GOTHIC bring the vapor and liquid phase temperatures close together.
GOTHIC predicts shorter depressurization times because of the simplified RCS model that mechanistically removes energy from all steam generators, while the FROTH methodology non- mechanistically biases superheated steam flow through the broken loop steam generator. For the LHSI pump NE’SHa analysis, GOTHIC predicts a slightly lugher sump temperature and containment pressure at the time of minimum of NPSHa. Overall, the long-term containment response is comparable to LOCTIC. The analyses also demonstrate that the simplified RCS model is conservative for calculating post-reflood mass and energy release rates for both DEPSG and DEHLG breaks.
Topical Report DOM-NAF-3 Page 77

Table 4.7-1 : Matrix of Conservative Inputs for Surry Demonstration GOTHIC Containment Analyses
LOCA Peak MSLB Peak Containment Subatmospheric Pressure* Pressurerremp # Depressurization Peak Pressure
Note: This table is based on the current plant configuration. Plant modifications can change these results.
LHSI Pump ORS Pump IRS Pump NPSH NPSH NPSH
Table Key (also refer to the List of Acronyms and Abbreviations) Min = Assume the minimum value for the range of the design input Max = Assume the maximum value for the range of the design input N/A = Not Applicable: the key analysis result occurs after this parameter becomes effective or the component is not part of the containment response (e.g., accumulator nitrogen does not discharge for MSLB). N/S = Not Sensitive: the key analysis result is not sensitive to changes in this input parameter.
General
Break Type
Reactor Power
Single Failure
Containment
Air Pressure
Temperature
Relative Humidity
Free Volume
Heat Sink Surface Area
DEHLG 1.4 ft2 for pressure DEPSG DEPSG DEPSG DEHLG DEHLG 0.6 ft’ for temp ##
102% 0% for pressure 102% 102% 102% 102% 102% 102% for temp #
NIA 1 emergency bus 1 emergency bus 1 emergency bus 1 emergency 1 emergency 1 emergency bus bus bus
Max Max I Min # Max Max Min Min Min
Max Max Max Min Max Max Max
100% 100% 10% ## 100% 100% 100% 100% 100%
Min Min Min Min Max Max Max
Min Min Min Max Min Min Min ~ ~~ ~
Topical Report DOM-NAF-3 Page 78

I I
Safety Injection
HHSI Injection Flow Rate
LHSI Injection Flow Rate
LHSI Recirc Flow Rate
LHSI Suction Piping Friction Loss
Accumulator Nitrogen Pressure
Accumulator Nitrogen Volume
Accumulator Nitrogen Temperature
RWST Temperature
Initial RWST Level
SI Recirc Mode Transfer
Containment Spray
CS Flow Rate
CS Start Time
Bleed Flow to ORS Pump Suction
LOCA Peak MSLB Peak Containment Subatmospheric LHSI Pump ORS Pump IRS Pump Pressure* Pressure/Temp # Depressurization Peak Pressure NPSH NPSH NPSH
N/A NIS Min Max Max Min Min
NIA NIS Min Max Max Min Min
NIA NIA Min Max Max NIA NIA
NIA NIA NIS NIS Max NIS NIS
NIA N/A Max Max Min Min Min
NIA NIA Max Max Min Min Min
NIA NIA Min Min Max Max Max
NIA Max Max Max Max Max Max
NIA NIS Min Min Min Min Min
NIA NIA Late Late Early NIA NIA
NIA Min M in Min Max Max Max
NIA Max Max Max Max Min Min
NIA NIS NIS N/S NIS Min Min
Topical Report DOM-NAF-3 Page 79

Service Water
SW Flow Rate N/A NIS Min Min Min Max Max
* LOCA peak pressure and temperature assumptions are the same since a saturated containment environment is maintained.
SW Temperature
HX Tube PluggingIFouling
#/ MSLB peak temperature occurs for small breaks and the spectrum is reviewed for any plant operating parameter changes. The peak temperature is obtained by using minimum air pressure and 0% humidity (peak pressure cases assume maximum air pressure and 100% humidity).
N/A NIS Max Max Min Min Min
N/A NIS Max Max Max 0 0
Topical Report DOM-NAF-3 Page 80

5.0 Conclusions
Dominion has developed a containment analysis methodology using the GOTHIC computer code for application to large, dry PWR containments. The GOTHIC model selections and techniques for the containment parameters (e.g., DLM condensation, lumped containment volume) have been approved previously by the NRC for containment analysis licensing calculations [8-131 and are specified in Section 3. Section 4 demonstrates that the GOTHIC containment modeling selections provide a reasonable comparison to the LOCTIC analyses for Surry Power Station and that some margin in containment peak pressure is gained with justrfication.
Dominion has developed a mass and energy release model for the post-reflood phase that couples the primary system and secondary system stored energy depletion to the containment pressure response. The DEHLG break model for Suny was shown to provide more conservative energy releases than the NRC-approved Westinghouse methodology in WCAP-8264-P-A [ 141. The DEPSG break model for Surry was compared to the NRC-approved Westinghouse FROTH methodology [14, 161 and was shown to provide as conservative mass and energy release rates. In addition, the timing of the GOTHIC energy release was consistent with the need to remove the SG secondary side energy in order to maximize containment depressurization or sump temperature, depending on the accident acceptance criteria of concern. Because of the complex model and plant-specific inputs requirements, Dominion will benchmark each new plant application of the post-reflood mass and energy methodology to ensure that the mass and energy release is as conservative as the plant’s existing NRC- approved calculation.
In conclusion, the GOTHIC containment analysis methodology described in thts report ensures a conservative calculation of the containment response for the containment analysis acceptance criteria listed in Section 2. Dominion plans to reference this analysis methodology for plant-specific license amendments starting in December 2005.
Topical Report DOM-NAF-3 Page 81
6.0 References
1.
2.
3.
4.
5.
6.
7.
8.
9.
NAI 8907-06, Revision 15, “GOTHIC Containment Analysis Package Technical Manual, Version 7.2,” published by EPRI, September 2004.
NAI 8907-02, Revision 16, “GOTHIC Containment Analysis Package User Manual, Version 7.2,” published by EPRI, September 2004.
NAI 8907-09, Revision 8, “GOTHIC Containment Analysis Package Qualification Report, Version 7.2,” published by EPRI, September 2004.
NRC Generic Letter 83- 1 1 , Supplement 1, “Licensee Qualifications for Performing Safety Analysis,” June 24, 1999.
Letter from David A. Christian (VEPCO) to NRC, “Virginia Electric and Power, North Anna Power Station Units 1 and 2, Surry Power Station Units 1 and 2, Qualifications for Performing Safety Analyses, Generic Letter 83-1 1, Supplement 1,” Serial No. 00-087, March 15,2000.
Letter from David A. Chnstian (VEPCO) to NRC, “Virginia Electric and Power, North Anna Power Station Units 1 and 2, Surry Power Station Units 1 and 2, Response to Request for Additional Information, Dominion’s Reload Nuclear Design Methodology Topical Report,” Serial No. 02-280, May 13,2002.
Letter from Scott Moore (NRC) to David A. Christian (VEPCO), “Virginia Electric and Power Company - Acceptance of Topical Report VEP-FRD-42, Revision 2, ‘Reload Nuclear Design Methodology,’ North Anna and Surry Power Stations, Units 1 and 2,” June 11,2003.
Letter from Anthony C. McMurtray (NRC) to Thomas Coutu (NMC), “Kewaunee Nuclear Power Plant - Issuance of Amendment (TAC NO. MB6408),” September 29,2003.
Letter from John G. Lamb (NRC) to Thomas Coutu (NMC), “Kewaunee Nuclear Power Plant - Issuance of Amendment Regarding Stretch Power Uprate (TAC NO. MB9031),” February 27, 2004.
10. Letter from Alan B. Wang (NRC) to R.T. Ridenoure (OPPD), “Fort Calhoun Station, Unit No. 1 - Issuance of Amendment (TAC NO. Ml37496),” November 5,2003.
Topical Report DOM-NAF-3 Page 82

11. Letter from L. Mark Padovan (NRC) to D.N. Morey (Southern Nuclear Operating Company), “Joseph M. Farley Nuclear Plant, Units 1 and 2 - Issuance of Amendments re: Steam Generator Replacements (TAC Nos. MA4393 AND MA4394),” December 29, 1999.
12. Letter from Frank Rinaldi (NRC) to J.T. Gasser (Southern Nuclear Operating Company), “Vogtle Electric Generating Plant, Units 1 and 2 Re; Issuance of Amendments (TAC Nos. MI35046 AND M€5047),” June 4,2003.
13. Letter from M.S. Tuckman (Duke Power Company) to the NRC transmitting approved version of Topical Report DPC-NE-3004-P-A, Revision 1, “Mass and Energy Release and Containment Response Methodology,” dated December 18,2000.
14. WCAP-8264-P-A, Rev. 1, ‘Westinghouse Mass and Energy Release Data for Containment Design,” August 1975. (WCAP-83 12-A is the Non-Proprietary version).
15. WCAP-14083, Revision 0, “Virginia Power Surry Power Station Units 1 and 2 Containment LOCA Mass and Energy Release Analyses for Core Uprating Engineering Report,” May 1994.
16. WCAP-10325-P-A, “Westinghouse LOCA Mass and Energy Release Model for Containment Design - March 1979 Version,” May 1983. (WCAP-10326-A is the Non-Proprietary version.)
17. Schlunder, E. (Ed.), “Heat Exchanger Design Handbook,” Hemisphere Publishing, 1983.
18. Marx, K. D., “Air Currents Driven by Sprays in Reactor Containment Buildings”, Sandia Report SAND84-8258, NUREG/CR-4102, May 1986.
19. Brown, R., and York, J.L., “Sprays Formed by Flashing Liquid Jets”, ATChE Journal Volume 8, Number 2, May 1962.
20. Letter from L. William Pearce (FENOC) to NRC, “Beaver Valley Power Station, Unit No. 1 and No. 2, BV- 1 Docket No. 50-334, License No. DPR-66, BV-2 Docket No. 50-412, License No. NPF-73, License Amendment Request Nos. 317 and 190,” June 2,2004. (Enclosure 2 documents the MAAP topical report and analyses).
2 1. WCAP-16219-NP, “Development and Qualttication of a GOTHC Containment Evaluation Model for the Prairie Island Nuclear Generating Plants,” March 2004, submitted as Exhibit D in letter Serial No. L-PI-04-017 from Joseph M. Solymossy (Nuclear Management Company) to NRC, “License Amendment Request (LAR), Request for Use of GOTHIC 7 in Containment Response Analyses.” September 1, 2004.
Topical Report DOM-NAF-3 Page 83

22. NUREG-0588, Revision 1, “Interim Staff Position on Environmental Qualification of Safety Related Electrical Equipment”, November 1980.
23. lshii, M. , “One-Dimensional Drift-Flux Model and Constitutive Equations for Relative Motion Between Phases in Various Two-Phase Flow Regimes”, ANL-77-47, October 1977.
24. Spillman, J. J., “Evaporation from Free F h g Droplets”, Aeronautical J, 1200:5, pp. 181-185, 1984.
25. Parsly, L. F. “Design Considerations of Reactor Containment Spray Systems - Part VI, The Heating of Spray Drops in Air-Steam Atmospheres,” ORNL-TM-2412, January 1970.
26. Pruppacher, H. R., and Klett, J. D., “Microphysics of Clouds and Precipitation”, D. Reidel Publishing Co., Boston, 1978.
27. North Anna Power Station Updated Final Safety Analysis Report.
28. Suny Power Station Updated Final Safety Analysis Report.
29. ANSVANS-5.1-1979, “American National Standard for Decay Heat Power in Light-Water Reactors,” August 1979.
30. Abdelghany, J. M., et al., “Analysis of Containment Response to Postulated Pipe Ruptures Using GOTHIC,” Framatome ANP report BAW-l0252(NP), Revision 0, July 2004.
3 1. Letter from Herbert N. Berkow (NRC) to Ronnie L. Gardner (Framatome), “Final Safety Evaluation for Framatome ANP Topical Report BAW-l0252(P), Revision 0, ‘Analysis of Containment Response to Postulated Pipe Ruptures Using GOTHIC,’ (TAC No. MC3783),” August 3 I , 2005.
32. WCAP-11431, Revision 0, “Mass and Energy Releases Following a Steam Line Rupture for North Anna Units 1 and 2,” February 1987.
33. WCAP-8822, Revision 0, “Mass and Energy Releases Following a Steam Line Rupture,” September 1976, with Supplements 1 and 2 dated September 1986.
34. Cunningham, J. P. and Yeh, H. C., “Experiments and Void Correlation for PWR Small Break LOCA Conditions”, ANS Transactions, Vol. 17, 1973, pp. 369-70.
Topical Report DOM-NAF-3 Page 84

35. Lilly, G.P. and Hochreiter, L.E., ‘‘Mwng of Emergency Core Cooling Water with Steam: 1/3 Scale Test and Summary,” EPRI 294-2, Electric Power Research Institute, June 1975.
36. Hochreiter, L.E., et al., “PWR F’LECHT SEASET Systems-Effects Natural Circulation and Reflux Condensation Data Evaluation and Analysis Report,” WCAP- 10415, FLECHT SEASET Program Report No. 14, February 1985.
37. NUREG-0800, “Standard Review Plan for the Review of Safety Analysis Reports for Nuclear Power Plants,” US Nuclear Regulatory Commission.
38. Letter from J. P. O’Hanlon (VEPCO) to USNRC, “Virginia Electric and Power Company, North Anna and Suny Power Stations Units 1 and 2, Generic Letter 97-04 - Assurance of Net Positive Suction Head for Emergency Core Cooling and Containment Heat Removal Pumps; Response to a Request for Additional Information,” Serial No. 98-546, October 29, 1998.
39. Letter from N. Kalyanam (USNRC) to J. P. O’Hanlon (VEPCO), “Completion of Licensing Action for Generic Letter 97-04, ‘Assurance of Sufficient Net Positive Suction Head for Emergency Core Cooling and Containment Heat Removal Pumps’; North Anna Power Station, Unit Nos. 1 and 2 (TAC Nos. MA0015 and MA0016),” February 25, 1999.
40. Letter from G. E. Edison (USNRC) to J. P. O’Hanlon (VEPCO), “Completion of Licensing Action for Generic Letter 97-04, ‘Assurance of Sufficient Net Positive Suction Head for Emergency Core Cooling and Containment Heat Removal Pumps’; Suny Power Station, Unit Nos. 1 and 2 (TAC Nos. MA0050 and MA0051),” April 1, 1999.
Topical Report DOM-NAF-3 Page 85