Embed Size (px)
Citation preview
3/7/05 A. Semenov Batch-by-Batch Intensity Monitor
1
Two-Channel Batch by Batch Intensity Monitor for Main Injector
BBI
3/7/05 A. Semenov Batch-by-Batch Intensity Monitor
2
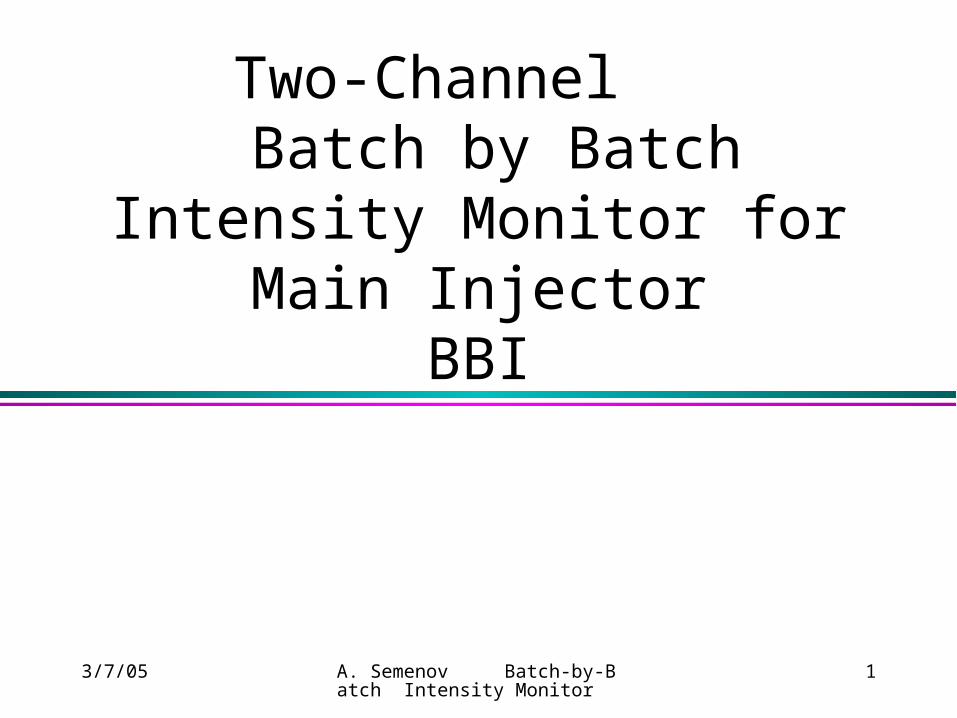
Two-Channel BBI Device
BNC Input # 1 From Wall Current
BNC Input # 2 From Wall Current
Beam/No Beam Output signal #1
Analog output #1
Analog output #2 Beam/No Beam
Output signal #2
TCLK
MDAT
EXT RF CLOCK
EXT SYNC
#AA Marker
3/7/05 A. Semenov Batch-by-Batch Intensity Monitor
3
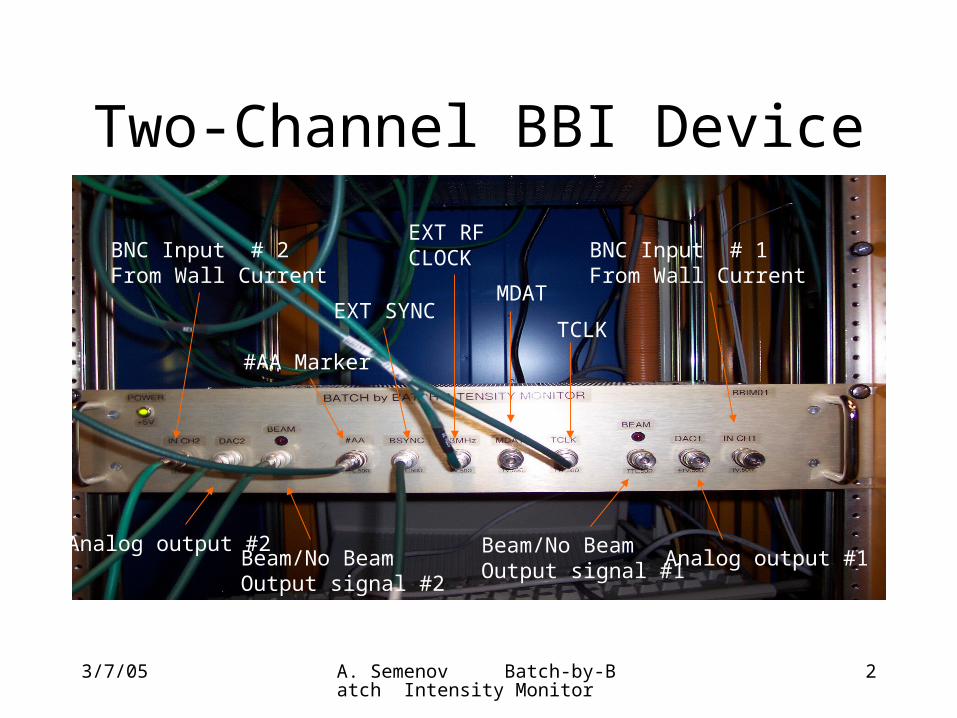
BBI device location – MI60
BBI
WCM fanout
MI60004
3/7/05 A. Semenov Batch-by-Batch Intensity Monitor
4
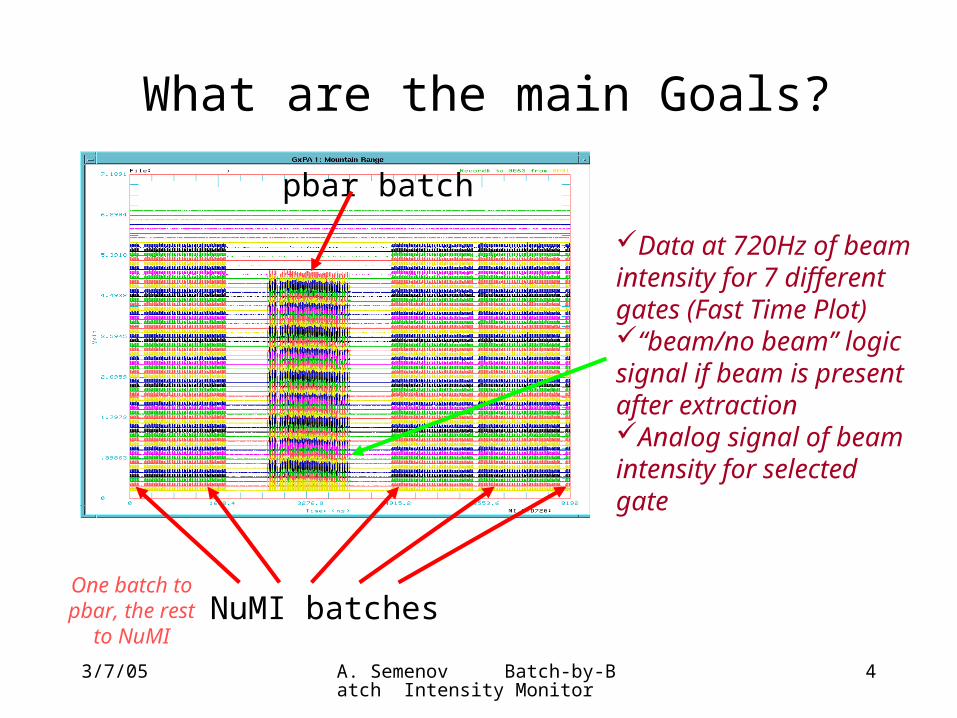
NuMI batches
pbar batch
What are the main Goals?
One batch to pbar, the rest
to NuMI
Data at 720Hz of beam intensity for 7 different gates (Fast Time Plot)“beam/no beam” logic signal if beam is present after extractionAnalog signal of beam intensity for selected gate
3/7/05 A. Semenov Batch-by-Batch Intensity Monitor
5
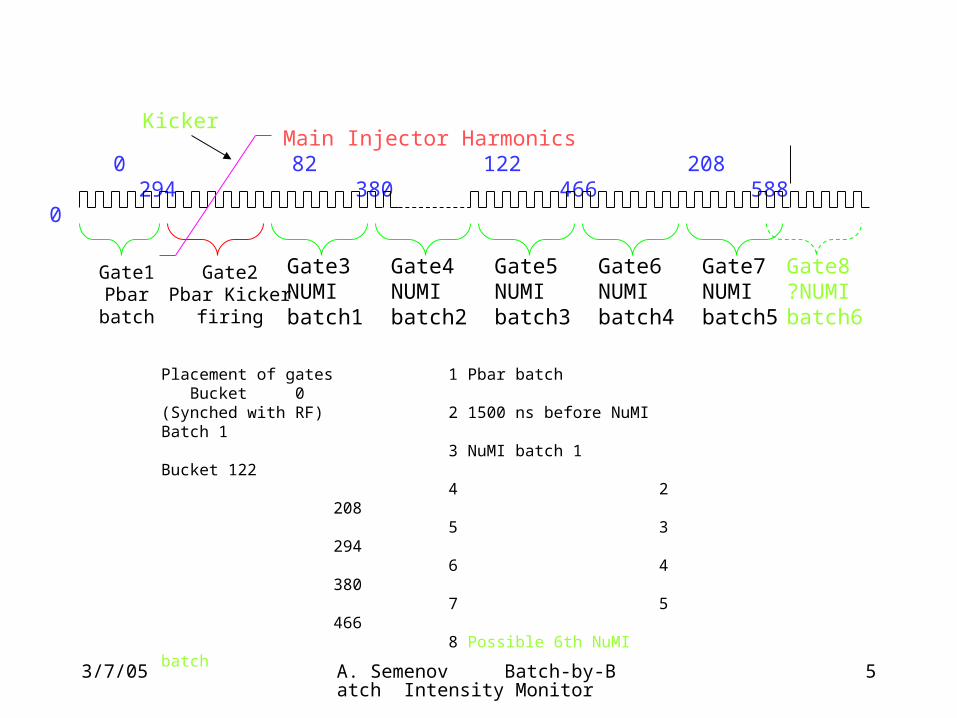
Main Injector Harmonics 0 82 122 208 294 380 466 588 0
Placement of gates 1 Pbar batch Bucket 0(Synched with RF) 2 1500 ns before NuMI Batch 1 3 NuMI batch 1 Bucket 122 4 2 208 5 3 294 6 4 380 7 5 466 8 Possible 6th NuMI batch
Gate1Pbar batch
Gate2Pbar Kicker
firing
Gate3NUMIbatch1
Gate4NUMIbatch2
Gate5NUMIbatch3
Gate6NUMIbatch4
Gate7NUMIbatch5
Gate8?NUMIbatch6
Kicker
3/7/05 A. Semenov Batch-by-Batch Intensity Monitor
6
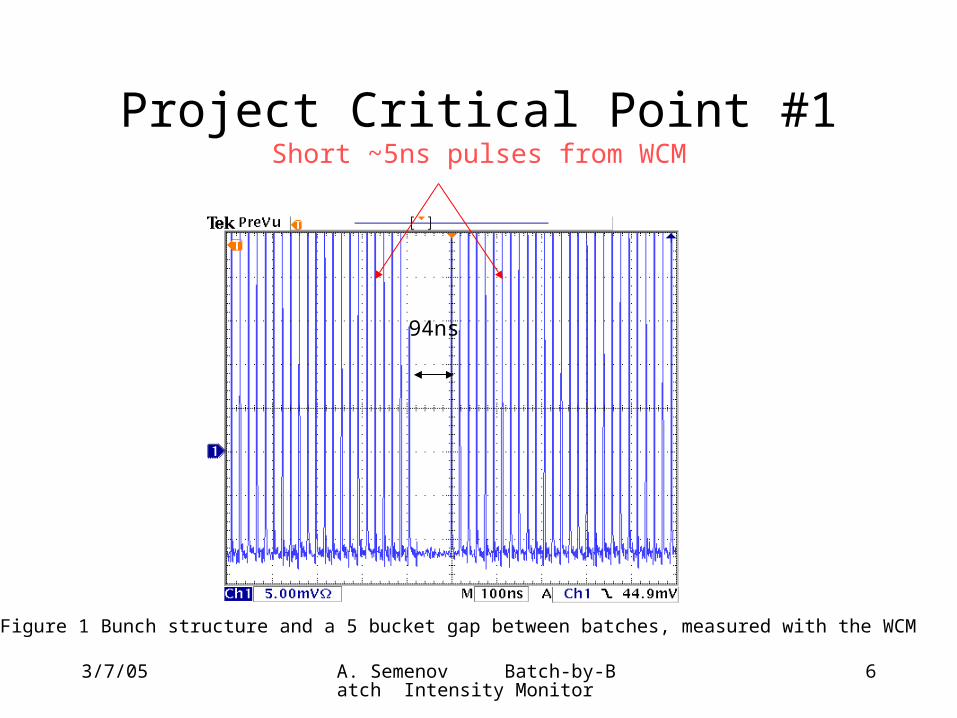
Project Critical Point #1Short ~5ns pulses from WCM
Figure 1 Bunch structure and a 5 bucket gap between batches, measured with the WCM
94ns
3/7/05 A. Semenov Batch-by-Batch Intensity Monitor
7
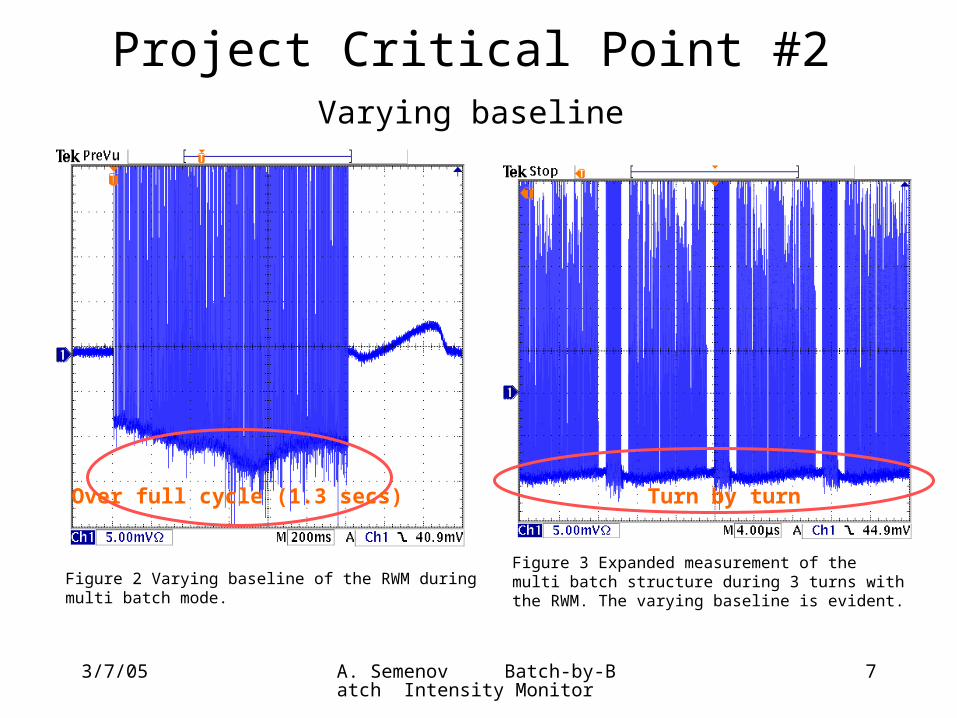
Project Critical Point #2 Varying baseline
Figure 2 Varying baseline of the RWM during multi batch mode. Figure 3 Expanded measurement of the multi batch structure during 3 turns with the RWM. The varying baseline is evident.
Over full cycle (1.3 secs) Turn by turn
3/7/05 A. Semenov Batch-by-Batch Intensity Monitor
8
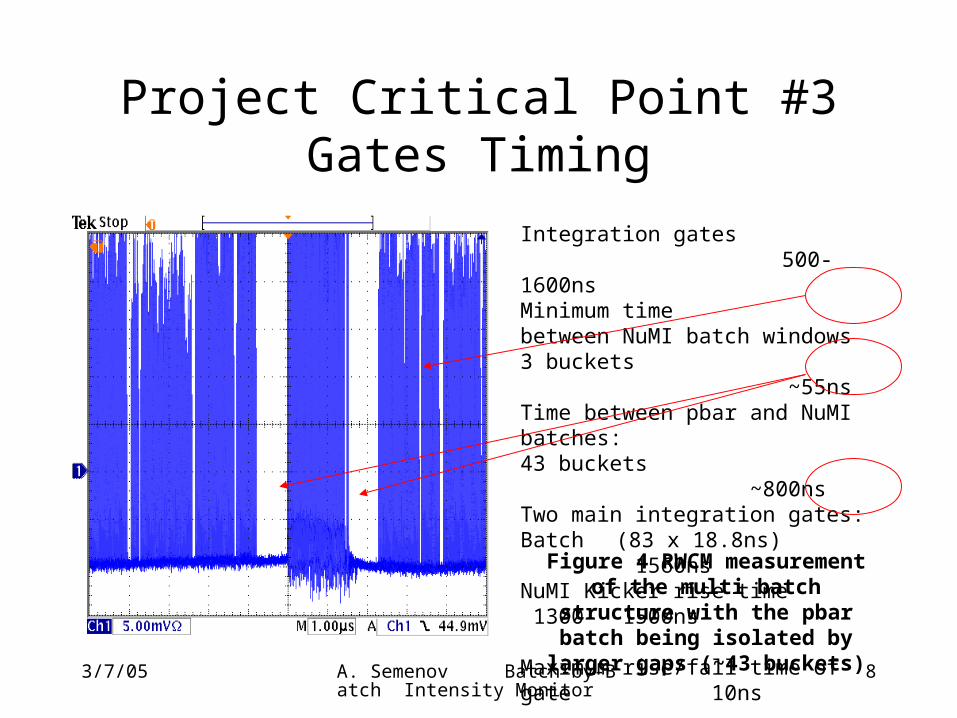
Project Critical Point #3Gates Timing
Figure 4 RWСM measurement of the multi batch structure with the pbar batch being isolated by larger gaps
(~43 buckets)
Integration gates 500-1600nsMinimum timebetween NuMI batch windows3 buckets ~55nsTime between pbar and NuMI batches:43 buckets ~800nsTwo main integration gates:Batch (83 x 18.8ns) 1560ns NuMI Kicker rise time 1300 - 1500ns Maximum rise/fall time of gate 10ns
3/7/05 A. Semenov Batch-by-Batch Intensity Monitor
9
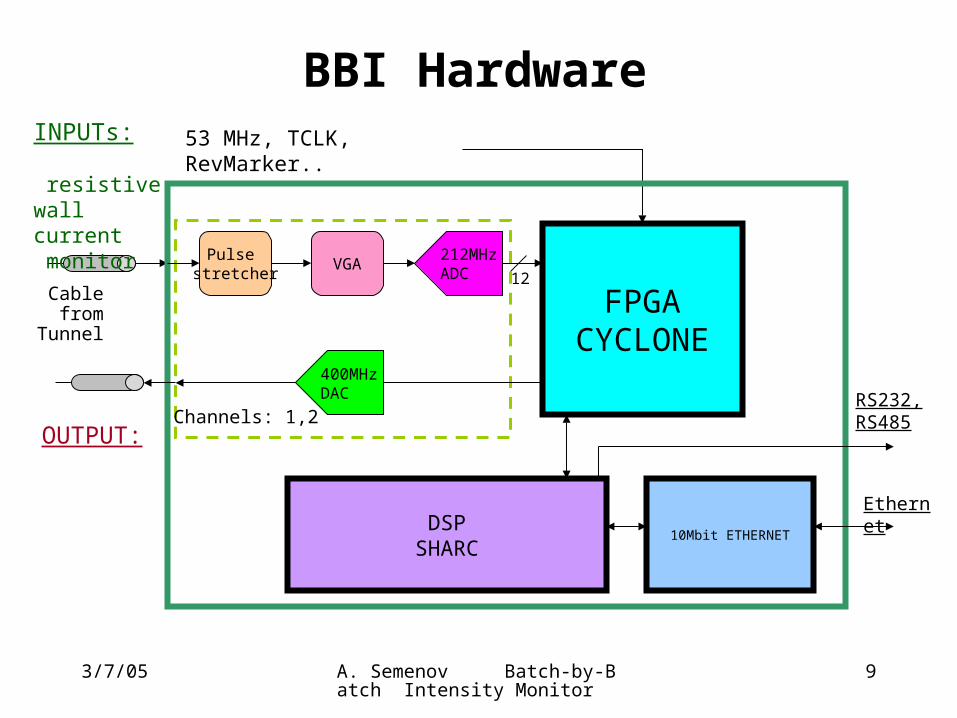
BBI Hardware
FPGACYCLONE
53 MHz, TCLK, RevMarker..
VGA212MHzADC
Cable from Tunnel
400MHzDAC
12
Ethernet
INPUTs: resistive wall current monitor
OUTPUT:
Pulse stretcher
DSPSHARC
10Mbit ETHERNET
RS232,RS485Channels: 1,2
3/7/05 A. Semenov Batch-by-Batch Intensity Monitor
10
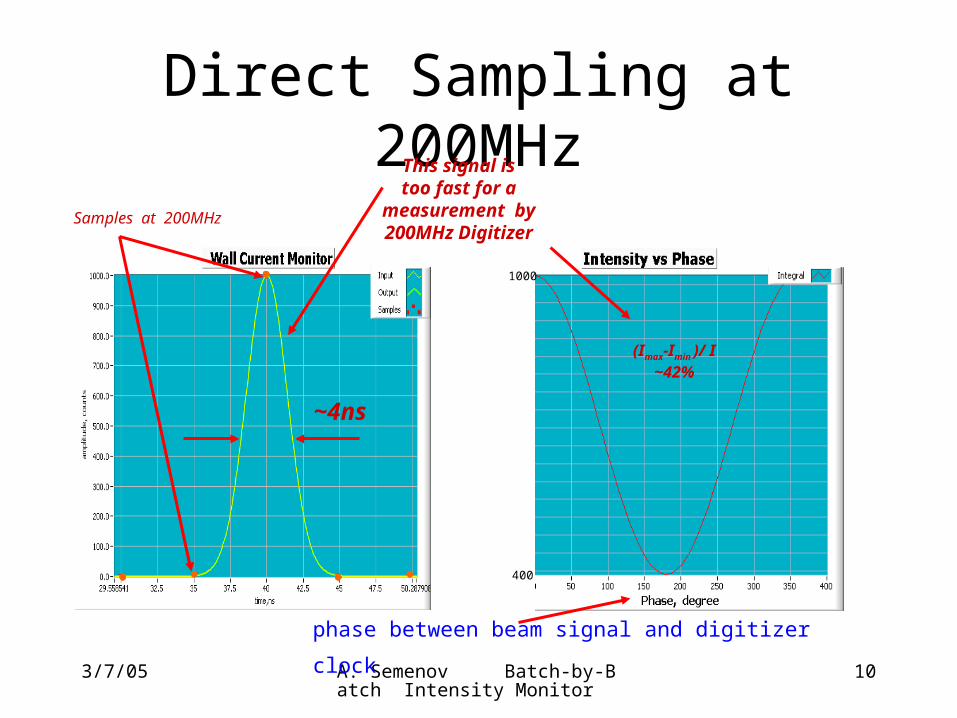
Direct Sampling at 200MHzThis signal istoo fast for a
measurement by200MHz Digitizer
~4ns
(Imax-Imin )/ I ~42%
1000
400
Samples at 200MHz
phase between beam signal and digitizer clock
3/7/05 A. Semenov Batch-by-Batch Intensity Monitor
11
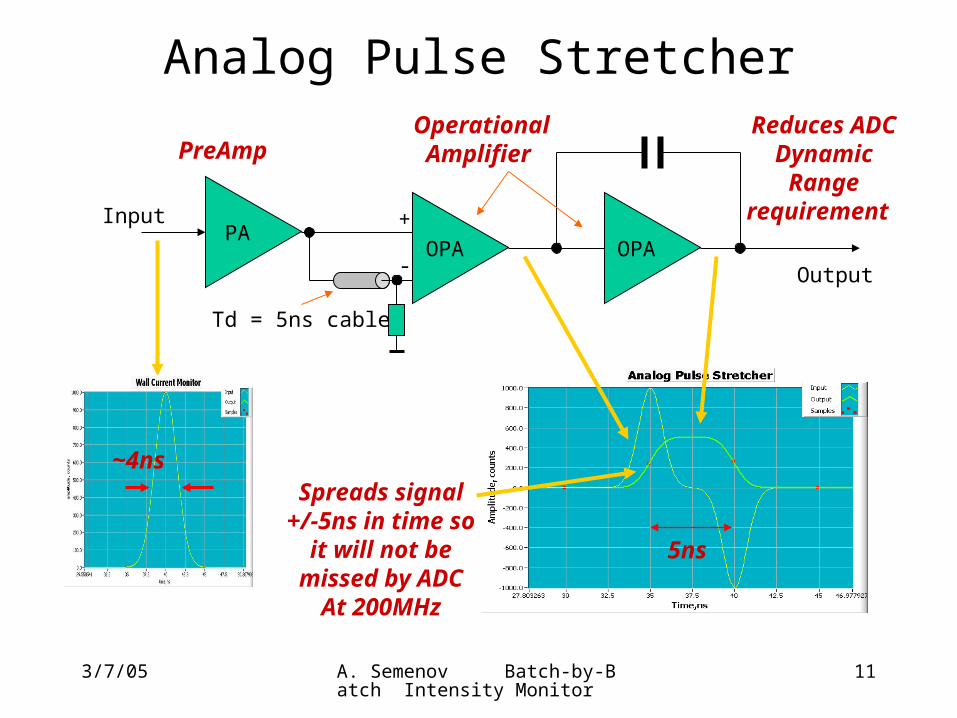
Analog Pulse Stretcher
OPA OPAPA
+
-
Td = 5ns cable
Input
Output
Spreads signal +/-5ns in time so it will not be missed by
ADCAt 200MHz
Reduces ADC
Dynamic Range
requirement
~4ns
5ns
PreAmp
Operational
Amplifier
3/7/05 A. Semenov Batch-by-Batch Intensity Monitor
12
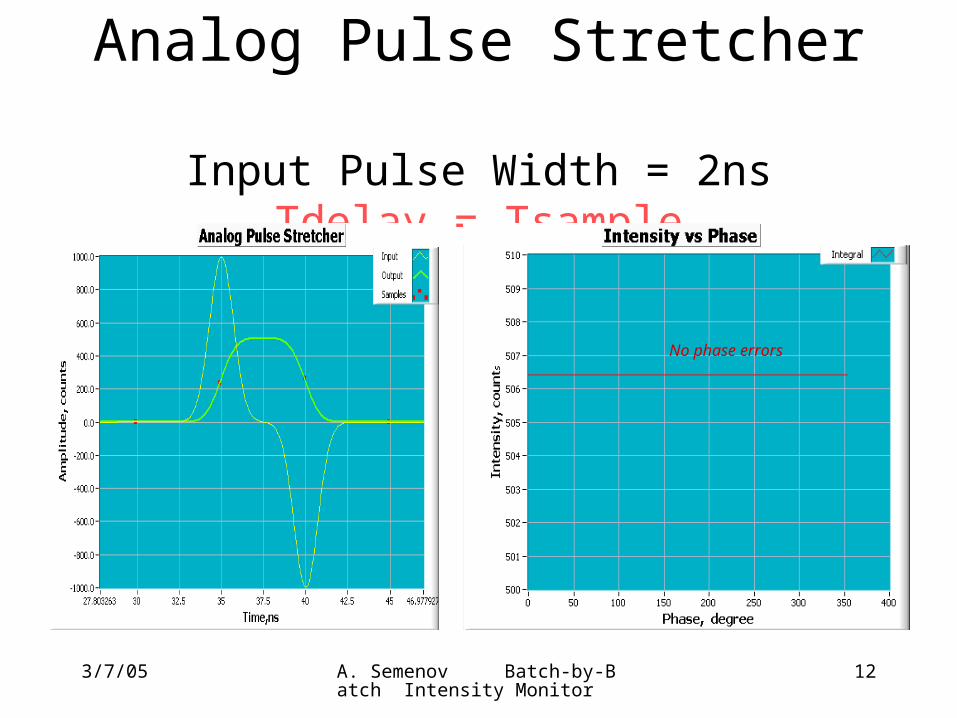
Analog Pulse Stretcher Input Pulse Width = 2ns
Tdelay = Tsample
No phase errors
3/7/05 A. Semenov Batch-by-Batch Intensity Monitor
13
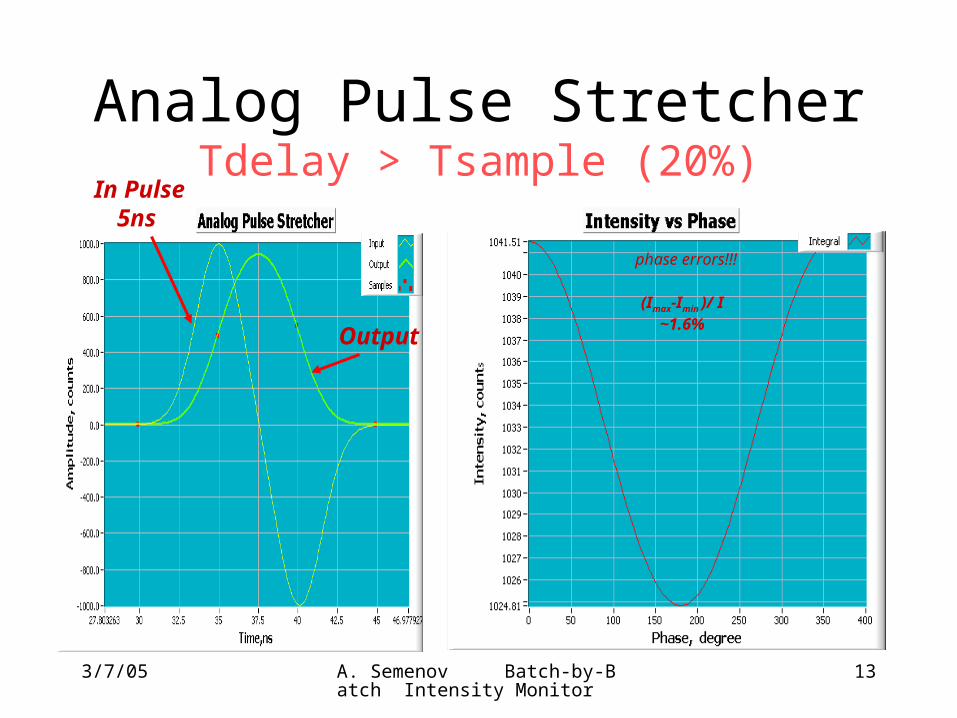
Analog Pulse StretcherTdelay > Tsample (20%)
(Imax-Imin )/ I ~1.6%
In Pulse 5ns
Output
phase errors!!!
3/7/05 A. Semenov Batch-by-Batch Intensity Monitor
14
FPGA Baseline CorrectionHow define baseline?
• it is natural for our case to define "baseline" as a line “not containing peaks"
• It means that for base line correction algorithm we should use at list 2 parameters – threshold (to detect a peak amplitude above baseline) and window ( to separate a slow fluctuation of base line signal and peak signal in time domain region)
3/7/05 A. Semenov Batch-by-Batch Intensity Monitor
15
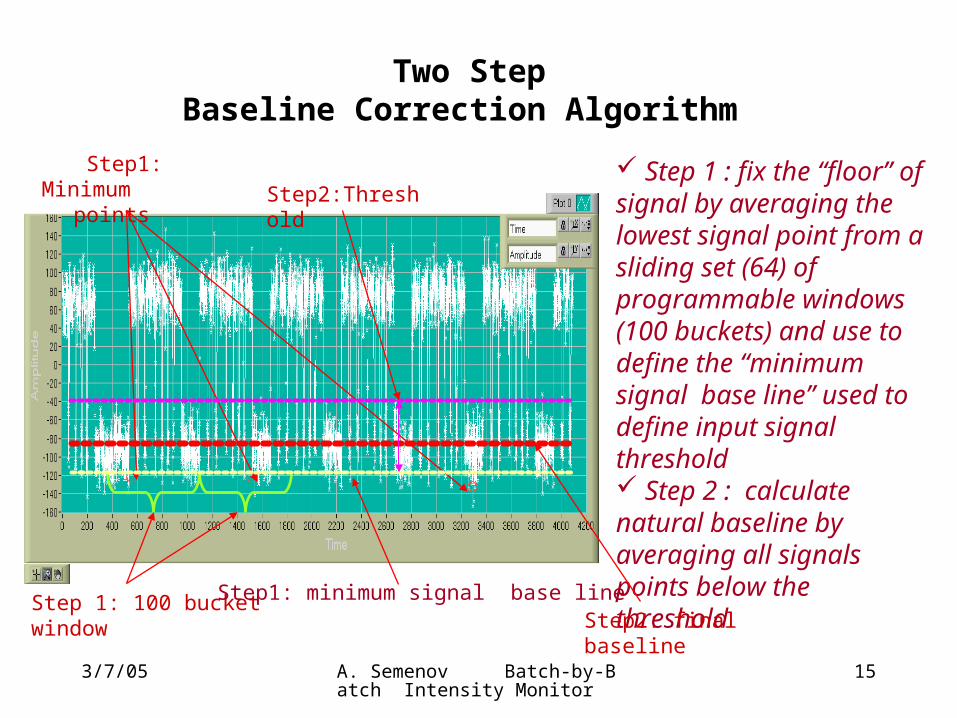
Two Step Baseline Correction Algorithm
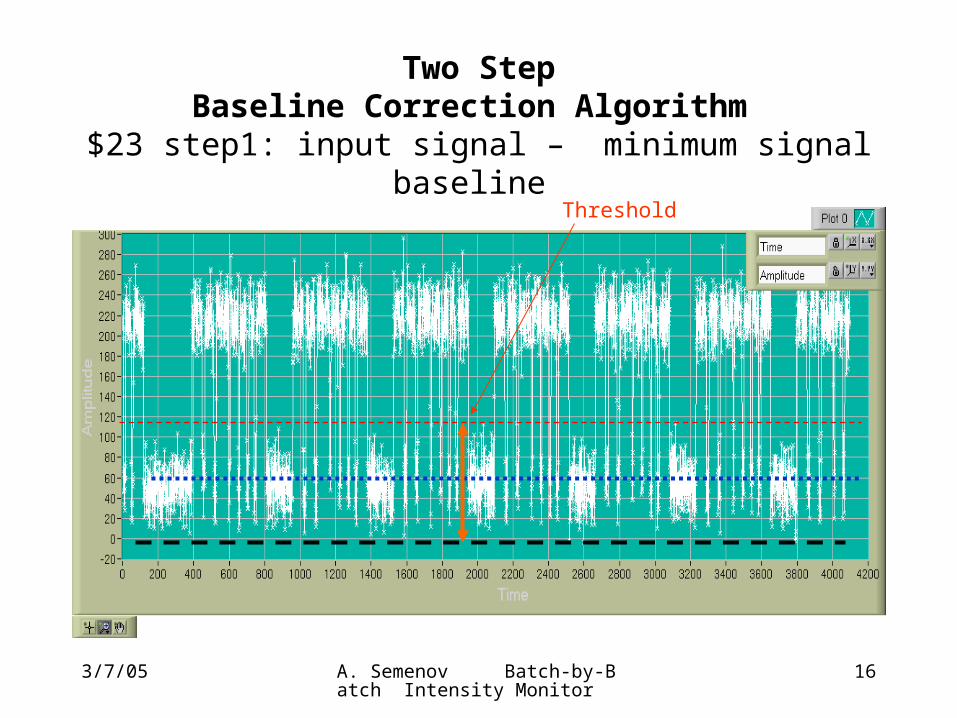
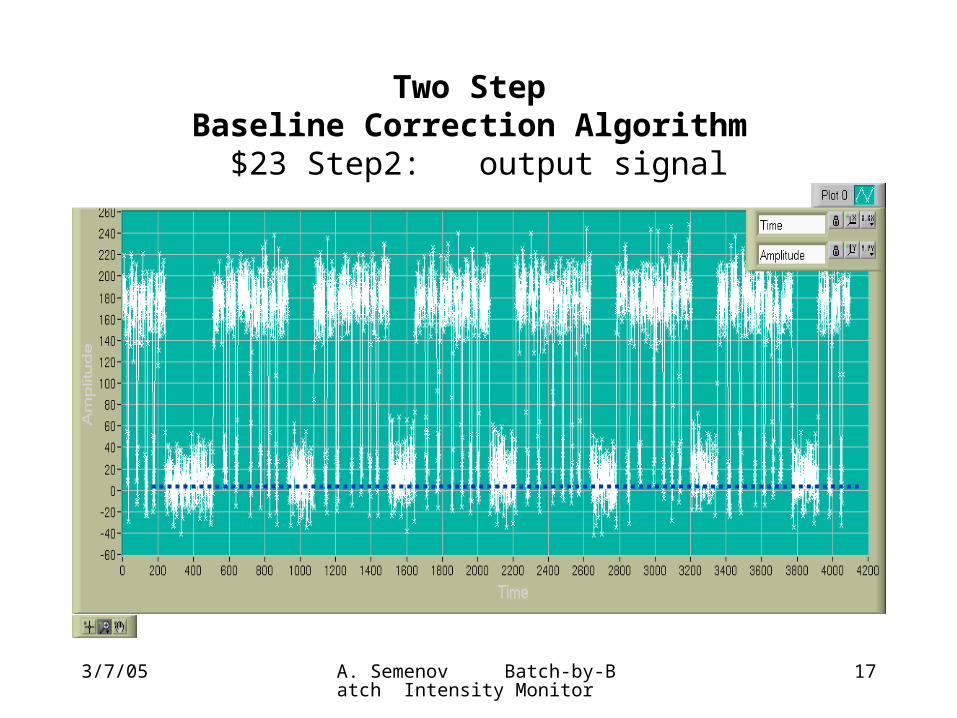
Step 1 : fix the “floor” of signal by averaging the lowest signal point from a sliding set (64) of programmable windows (100 buckets) and use to define the “minimum signal base line” used to define input signal threshold Step 2 : calculate natural baseline by averaging all signals points below the threshold
Step 1: 100 bucket window
Step1: Minimum points
Step1: minimum signal base line
Step2:Threshold
Step2: final baseline
3/7/05 A. Semenov Batch-by-Batch Intensity Monitor
16
Two Step Baseline Correction Algorithm
$23 step1: input signal – minimum signal baseline Threshold
3/7/05 A. Semenov Batch-by-Batch Intensity Monitor
17
Two Step Baseline Correction Algorithm
$23 Step2: output signal
3/7/05 A. Semenov Batch-by-Batch Intensity Monitor
18
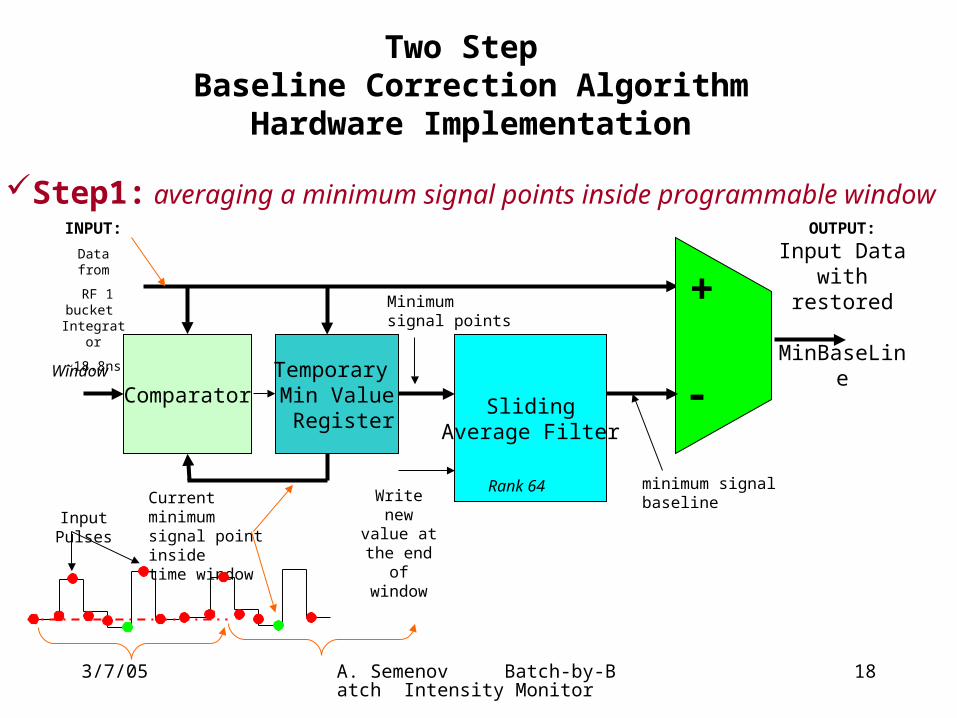
Two Step Baseline Correction Algorithm
Hardware Implementation
ComparatorTemporary Min Value Register
SlidingAverage Filter
Write new value at the
end of window
Window
INPUT:
Data from
RF 1 bucket Integrator
~18.8ns
Rank 64
-
+ Minimumsignal points
Current minimumsignal point inside time window
minimum signal baseline
Step1: averaging a minimum signal points inside programmable windowOUTPUT:
Input Data with restored MinBaseLine
Input Pulses
3/7/05 A. Semenov Batch-by-Batch Intensity Monitor
19
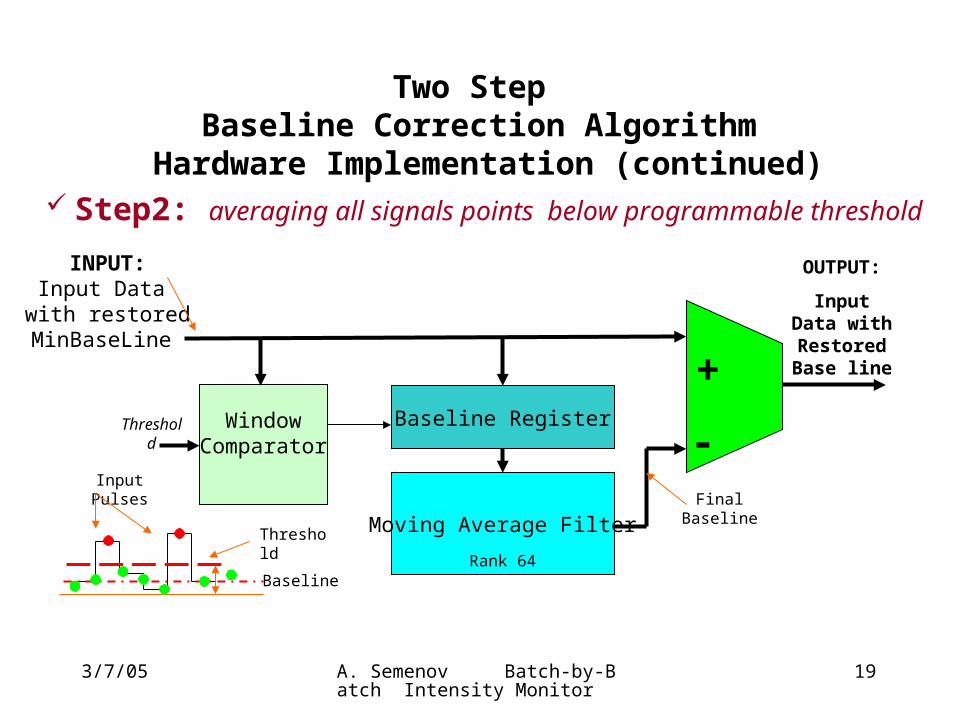
Two Step Baseline Correction Algorithm
Hardware Implementation (continued)
WindowComparator
Baseline Register
Moving Average FilterFinal
Baseline
Threshold
-
+
OUTPUT:
Input Data with
Restored Base line
Rank 64
INPUT:Input Data
with restored MinBaseLine
Input Pulses
Threshold
Baseline
Step2: averaging all signals points below programmable threshold
3/7/05 A. Semenov Batch-by-Batch Intensity Monitor
20
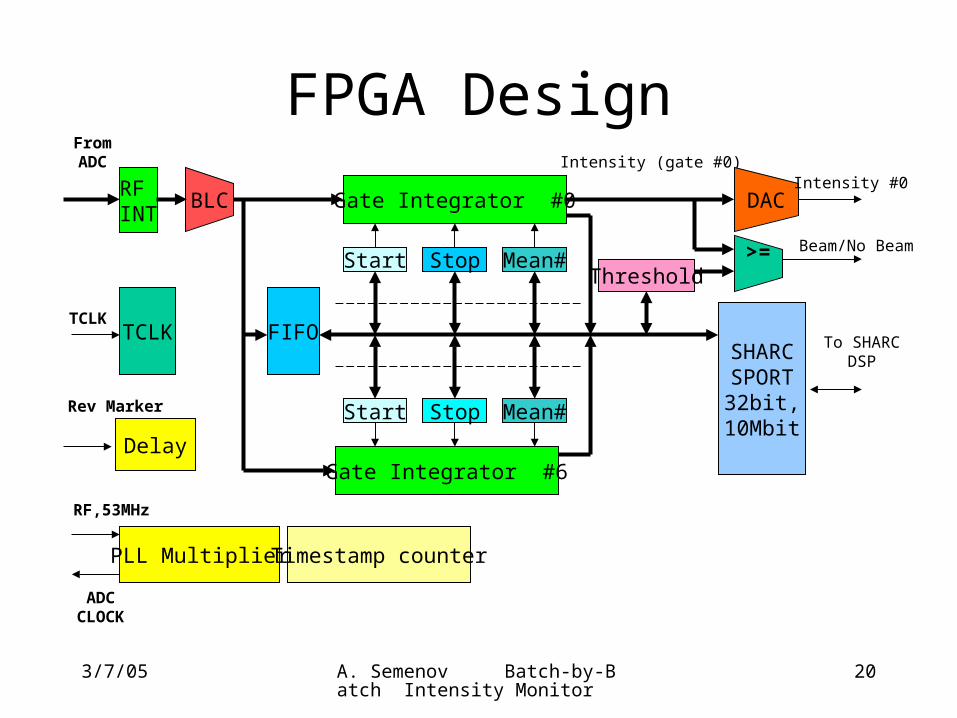
FPGA Design
BLC Gate Integrator #0
Start Stop Mean#
SHARCSPORT32bit,
10Mbit
Gate Integrator #6
Start Stop Mean#
Threshold>= Beam/No Beam
TCLK
RF,53MHz
TCLK
FromADC
Rev Marker
PLL Multiplier
ADCCLOCK
Timestamp counter
Intensity (gate #0)
DACIntensity #0
FIFO
Delay
RF INT
To SHARCDSP
3/7/05 A. Semenov Batch-by-Batch Intensity Monitor
21
FPGA FUNCTIONS
What we do in the “CYCLONE”:1) Base Line Corrections
2) Beam Intensity calculation - Multi-Turn Averaging
3) Generate the correct position of the batch gates. It is possible to program the position of the gates and the beam threshold for NuMI gate through ACNET
4) A FPGA PLL multiplier (x4) is used to synchronize the digitizer with the external RF or internal (53MHz) clock
3/7/05 A. Semenov Batch-by-Batch Intensity Monitor
22
FPGA FUTURES
What we do in the “CYCLONE” (continued):5) Ability to trigger on TCLK events
6) Multi-Turn “Scope Trace” buffer to analyze input and post-processing signals (4K samples)
7) 10 Mbit,32bit serial interface to SHARC DSP
3/7/05 A. Semenov Batch-by-Batch Intensity Monitor
23
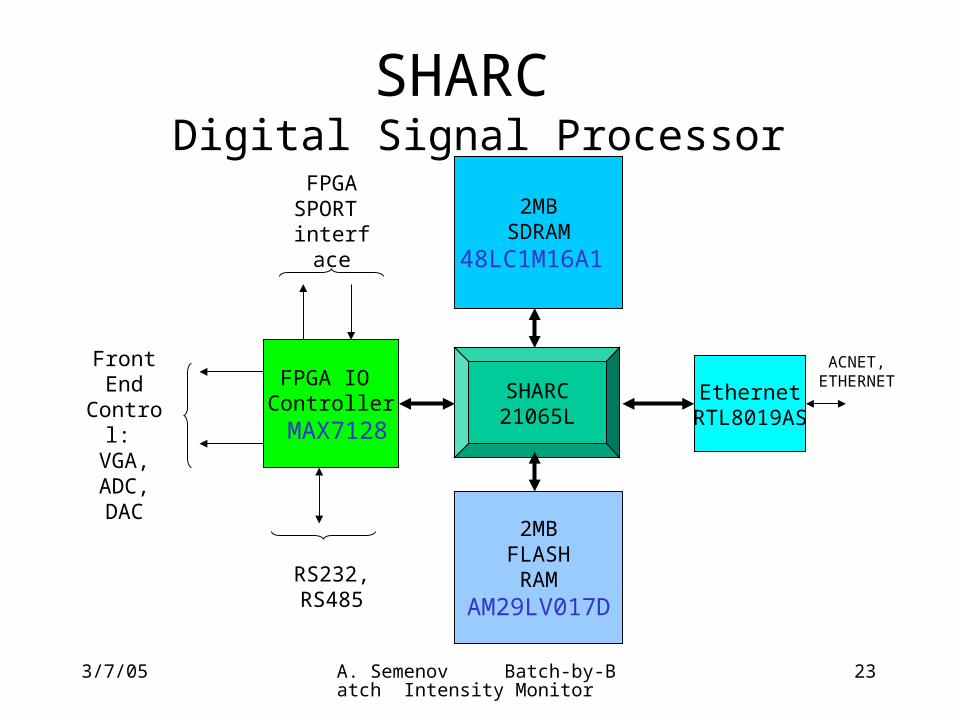
SHARC Digital Signal Processor
SHARC21065L
EthernetRTL8019AS
2MBFLASHRAM
AM29LV017D
2MBSDRAM
48LC1M16A1
FPGA IO Controller
MAX7128
Front EndControl:
VGA, ADC, DAC
FPGASPORT interface
RS232,RS485
ACNET,ETHERNET
3/7/05 A. Semenov Batch-by-Batch Intensity Monitor
24
SHARC’s role on BBI board
• Interface board to ACNET (OAC) via TCP/IP– Includes remote firmware/software update
• Read/write BBI CYCLONE “control” registers, so that BBI processing can be controlled and monitored via network
• additional “offline” data processing and filtering ( fast time plots, base line corrections, FE dynamic range control by VGA,…)
3/7/05 A. Semenov Batch-by-Batch Intensity Monitor
25
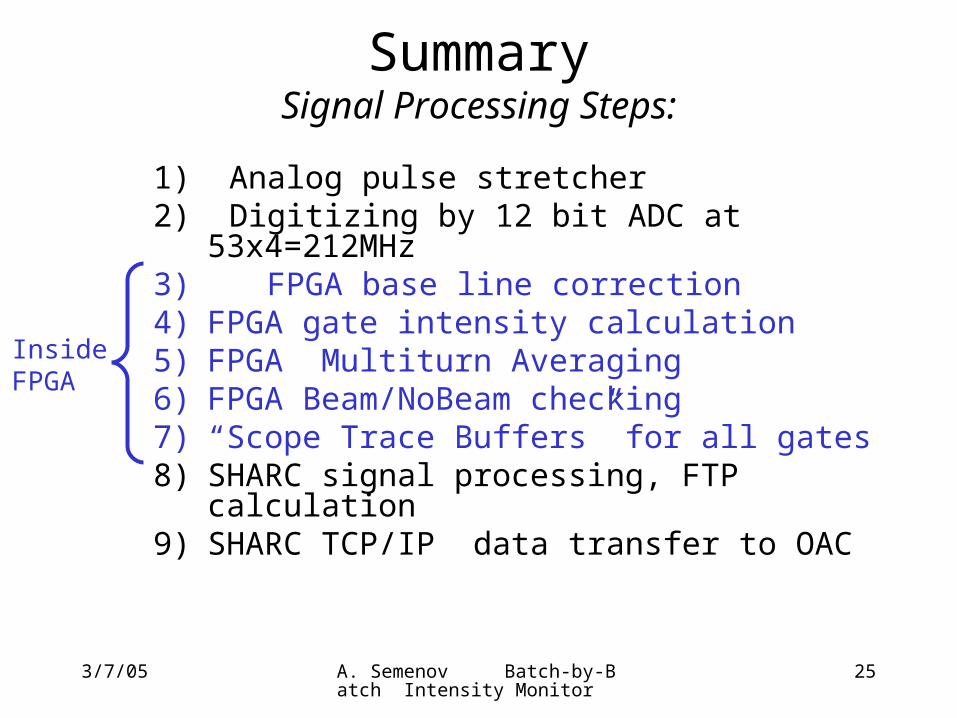
SummarySignal Processing Steps:
1) Analog pulse stretcher 2) Digitizing by 12 bit ADC at 53x4=212MHz3) FPGA base line correction4) FPGA gate intensity calculation5) FPGA Multiturn Averaging 6) FPGA Beam/NoBeam checking7) “Scope Trace Buffers” for all gates8) SHARC signal processing, FTP calculation9) SHARC TCP/IP data transfer to OAC
InsideFPGA
3/7/05 A. Semenov Batch-by-Batch Intensity Monitor
26
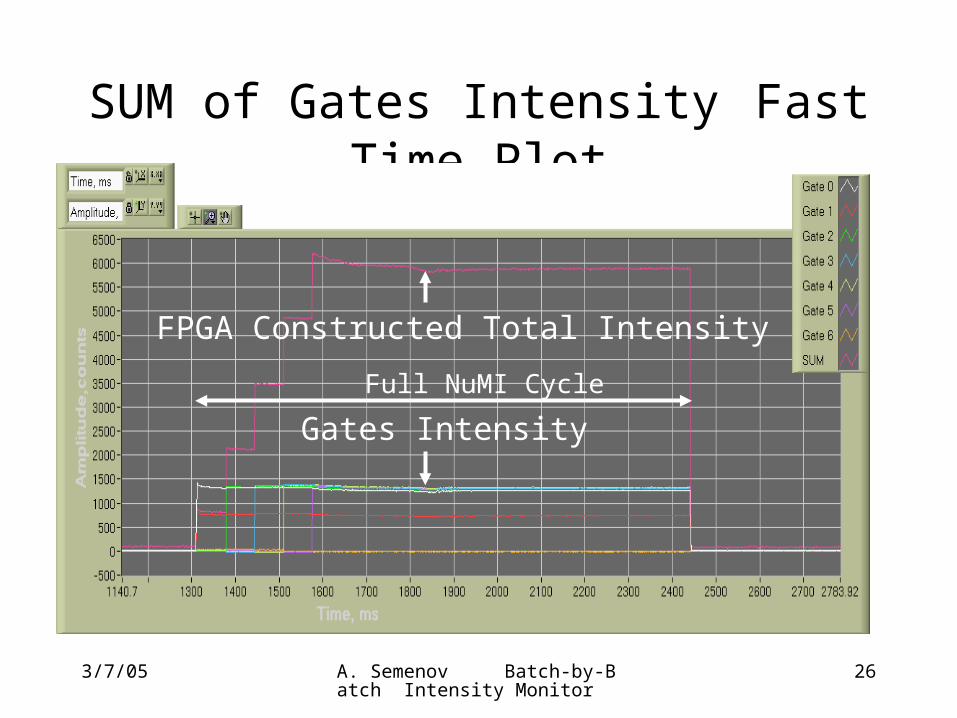
SUM of Gates Intensity Fast Time Plot
FPGA Constructed Total Intensity
Full NuMI Cycle
Gates Intensity
3/7/05 A. Semenov Batch-by-Batch Intensity Monitor
27
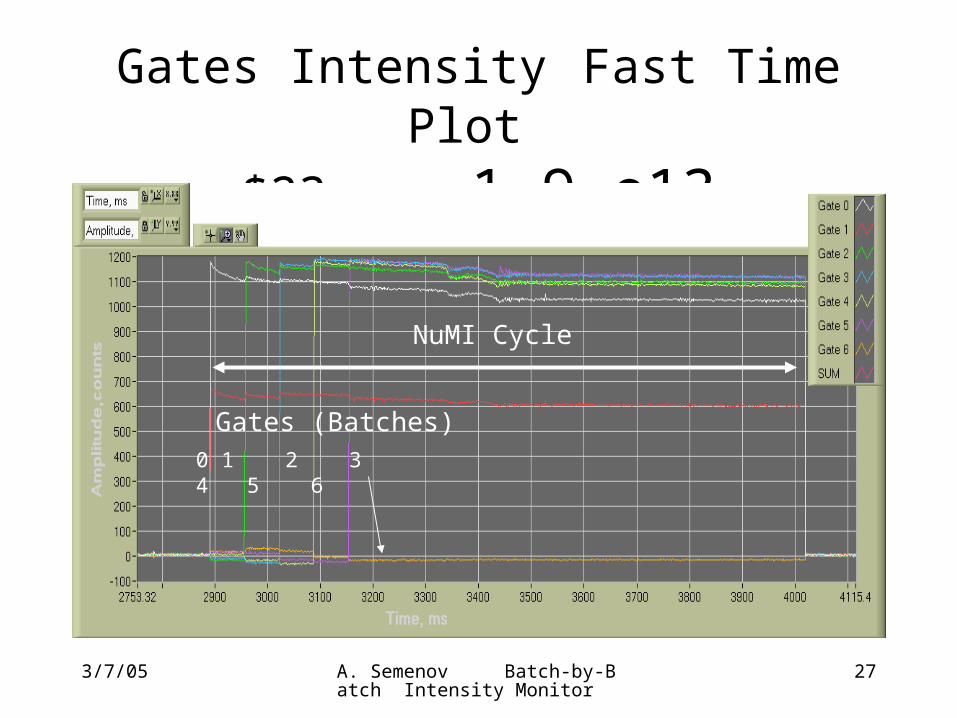
Gates Intensity Fast Time Plot
$23 1.9 e13
NuMI Cycle
0 1 2 3 4 5 6
Gates (Batches)
3/7/05 A. Semenov Batch-by-Batch Intensity Monitor
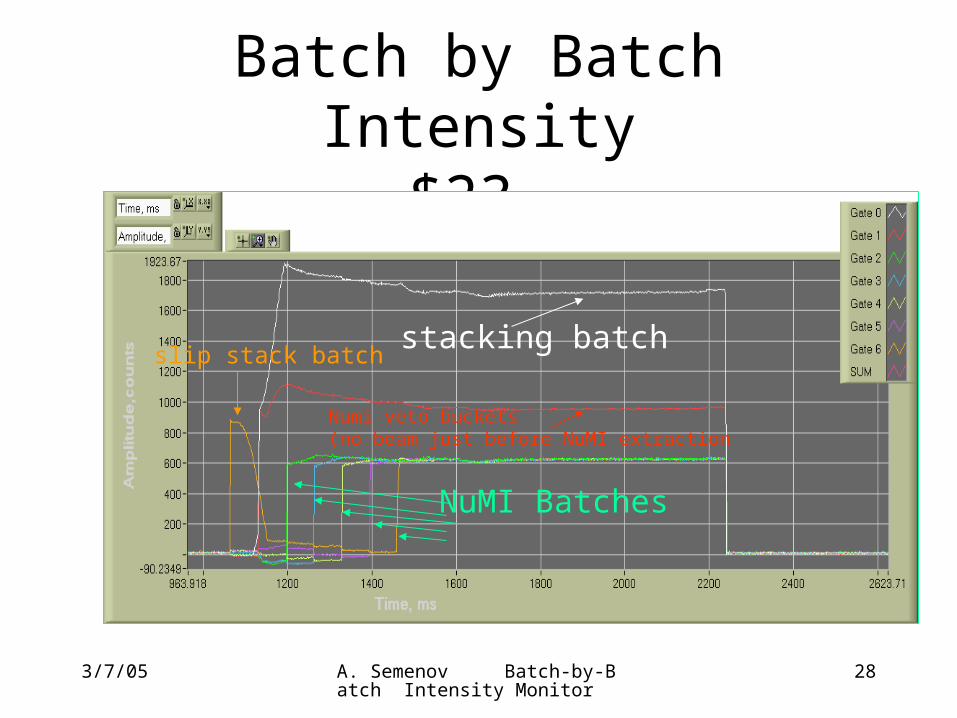
28
Batch by Batch Intensity $23
stacking batch
Numi veto buckets(no beam just before NuMI extraction
NuMI Batches
slip stack batch
3/7/05 A. Semenov Batch-by-Batch Intensity Monitor
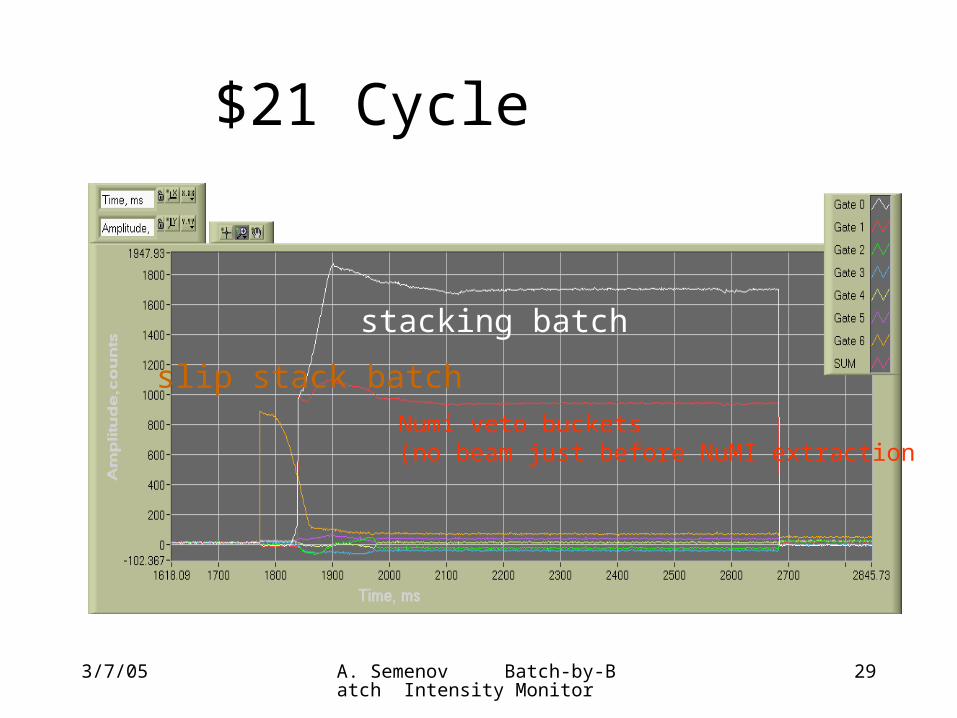
29
$21 Cycle
stacking batch
Numi veto buckets(no beam just before NuMI extraction
slip stack batch
3/7/05 A. Semenov Batch-by-Batch Intensity Monitor
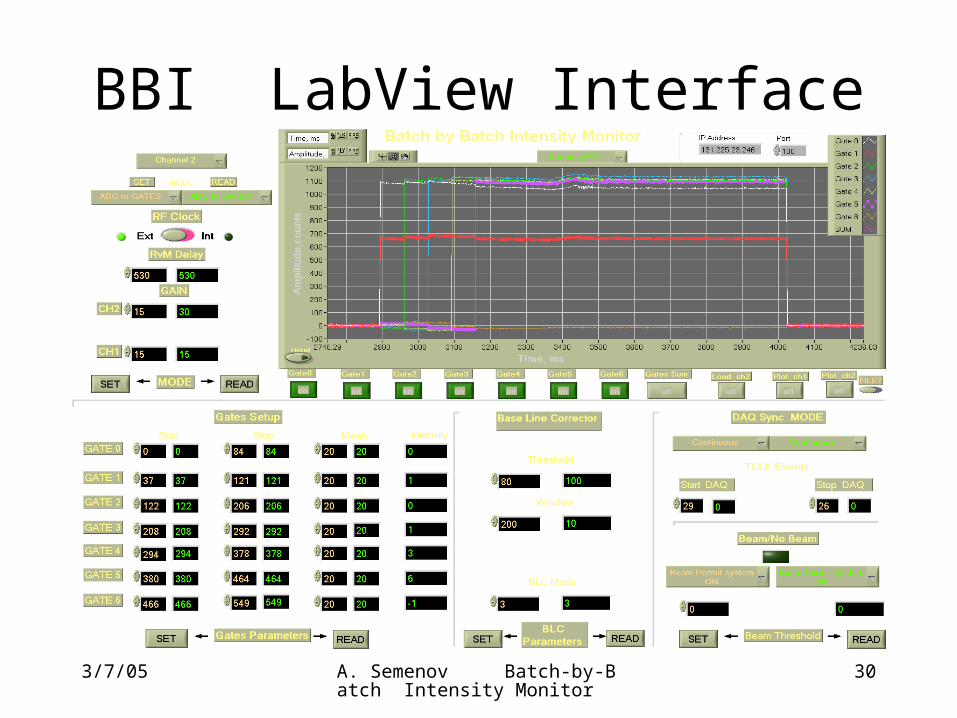
30
BBI LabView Interface
3/7/05 A. Semenov Batch-by-Batch Intensity Monitor
31
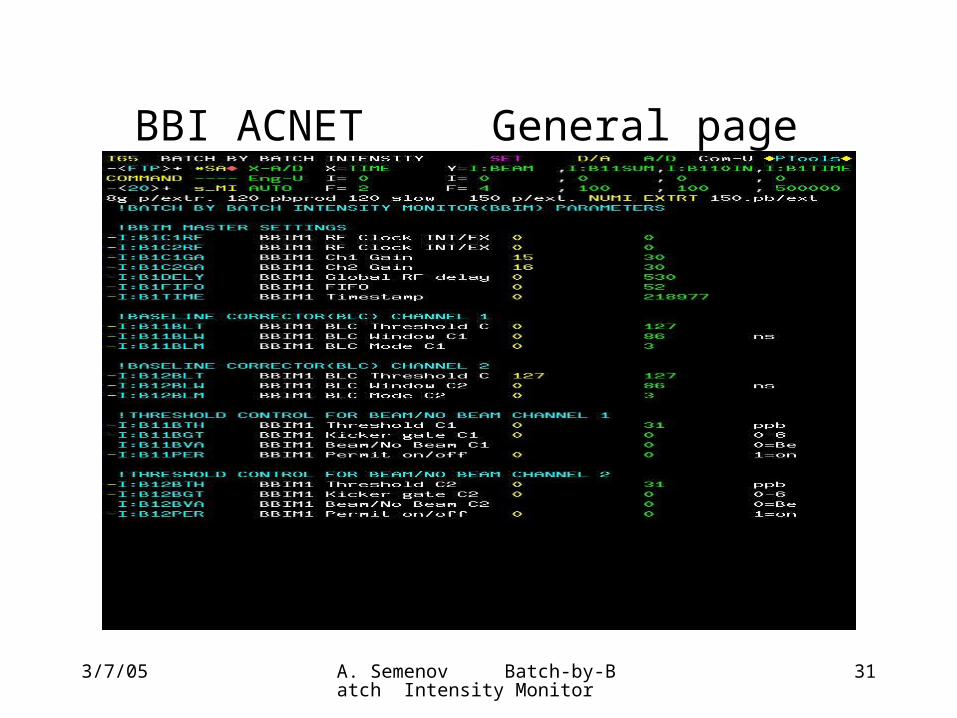
BBI ACNET General page
3/7/05 A. Semenov Batch-by-Batch Intensity Monitor
32
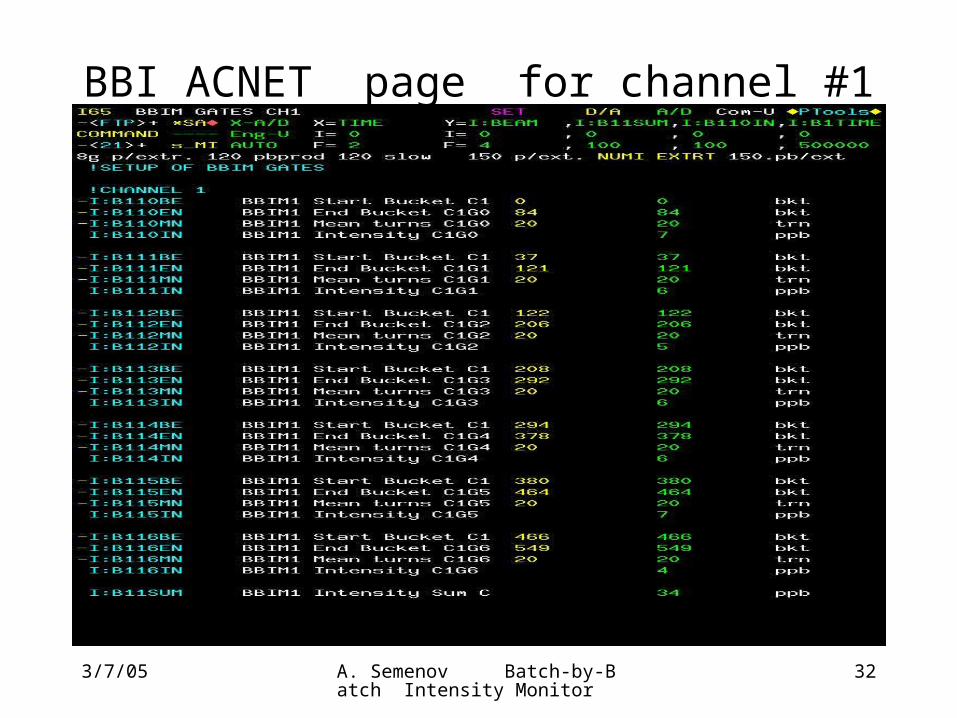
BBI ACNET page for channel #1
3/7/05 A. Semenov Batch-by-Batch Intensity Monitor
33
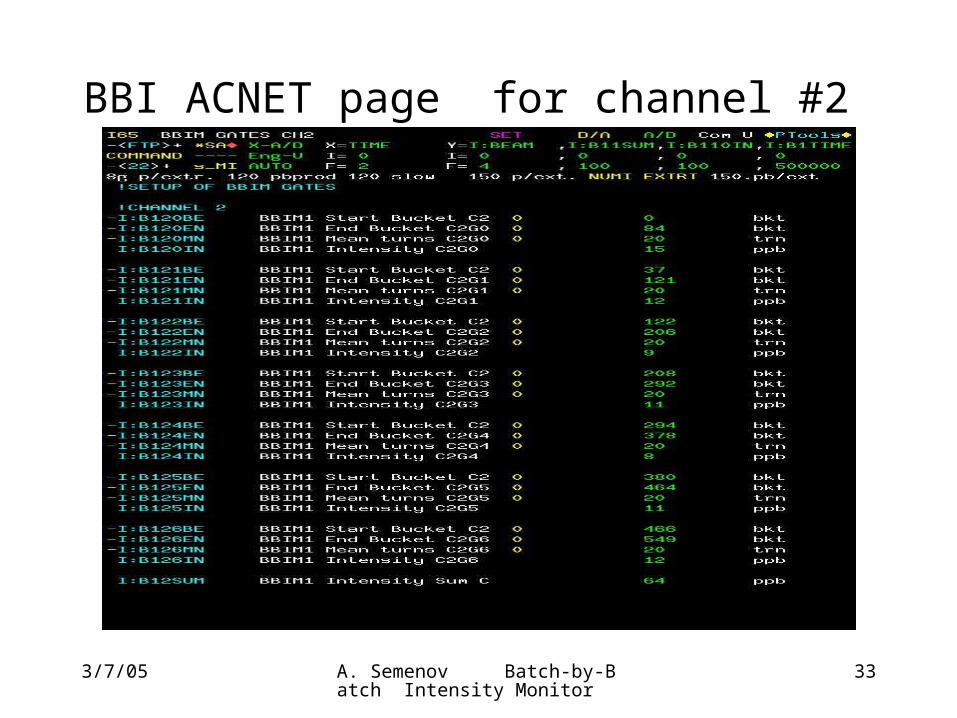
BBI ACNET page for channel #2


![Batch 7 - Monitor and Control of Greenhouse Environment Green Bee] Final Documentation](https://img.pdfslide.us/doc/110x75/5536c1d95503467c7a8b4ac5/batch-7-monitor-and-control-of-greenhouse-environment-green-bee-final-documentation.jpg)