Embed Size (px)
Citation preview
-=-=-1
_j
;
'i =
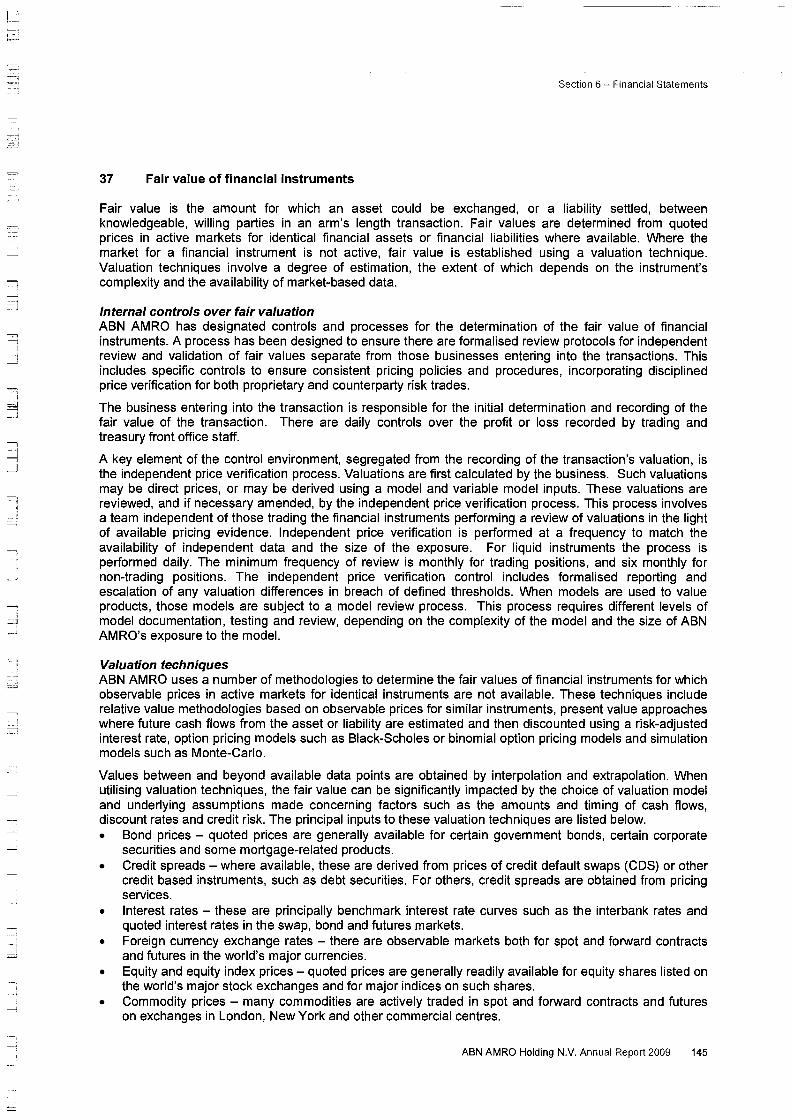
Section 6- Financial Statements
37 Fair value of financial instruments
Fair value is the amount for which an asset could be exchanged, or a liability settled, between knowledgeable, willing parties in an arm's length transaction. Fair values are determined from quoted prices in active markets for identical financial assets or financial liabilities where available. Where the market for a financial instrument is not active, fair value is established using a valuation technique. Valuation techniques involve a degree of estimation, the extent of which depends on the instrument's complexity and the availability of market-based data.
Internal controls over fair valuation ABN AMRO has designated controls and processes for the determination of the fair value of financial instruments. A process has been designed to ensure there are formalised review protocols for independent review and validation of fair values separate from those businesses entering into the transactions. This includes specific controls to ensure consistent pricing policies and procedures, incorporating disciplined price verification for both proprietary and counterparty risk trades.
The business entering into the transaction is responsible for the initial determination and recording of the fair value of the transaction. There are daily controls over the profit or loss recorded by trading and treasury front office staff.
A key element of the control environment, segregated from the recording of the transaction's valuation, is the independent price verification process. Valuations are first calculated by the business. Such valuations may be direct prices, or may be derived using a model and variable model inputs. These valuations are reviewed, and if necessary amended, by the independent price verification process. This process involves a team independent of those trading the financial instruments performing a review of valuations in the light of available pricing evidence. Independent price verification is performed at a frequency to match the availability of independent data and the size of the exposure. For liquid instruments the process is performed daily. The minimum frequency of review is monthly for trading positions, and six monthly for non-trading positions. The independent price verification control includes formalised reporting and escalation of any valuation differences in breach of defined thresholds. When models are used to value products, those models are subject to a model review process. This process requires different levels of model documentation, testing and review, depending on the complexity of the model and the size of ABN AMRO's exposure to the model.
Valuation techniques ABN AMRO uses a number of methodologies to determine the fair values of financial instruments for which observable prices in active markets for identical instruments are not available. These techniques include relative value methodologies based on observable prices for similar instruments, present value approaches where future cash flows from the asset or liability are estimated and then discounted using a risk-adjusted interest rate, option pricing models such as Black-Scholes or binomial option pricing models and simulation models such as Monte-Carlo.
Values between and beyond available data points are obtained by interpolation and extrapolation. When utilising valuation techniques, the fair value can be significantly impacted by the choice of valuation model and underlying assumptions made concerning factors such as the amounts and timing of cash flows, discount rates and credit risk. The principal inputs to these valuation techniques are listed below. • Bond prices - quoted prices are generally available for certain government bonds, certain corporate
securities and some mortgage-related products. • Credit spreads - where available, these are derived from prices of credit default swaps (CDS) or other
credit based instruments, such as debt securities. For others, credit spreads are obtained from pricing services.
• Interest rates - these are principally benchmark interest rate curves such as the interbank rates and quoted interest rates in the swap, bond and futures markets.
• Foreign currency exchange rates -there are observable markets both for spot and forward contracts and futures in the world's major currencies.
• Equity and equity index prices - quoted prices are generally readily available for equity shares listed on the world's major stock exchanges and for major indices on such shares.
• Commodity prices - many commodities are actively traded in spot and forward contracts and futures on exchanges in London, New York and other commercial centres.
ABN AMRO Holding N.V. Annual Report 2009 145
Section 6 - Financial Statements
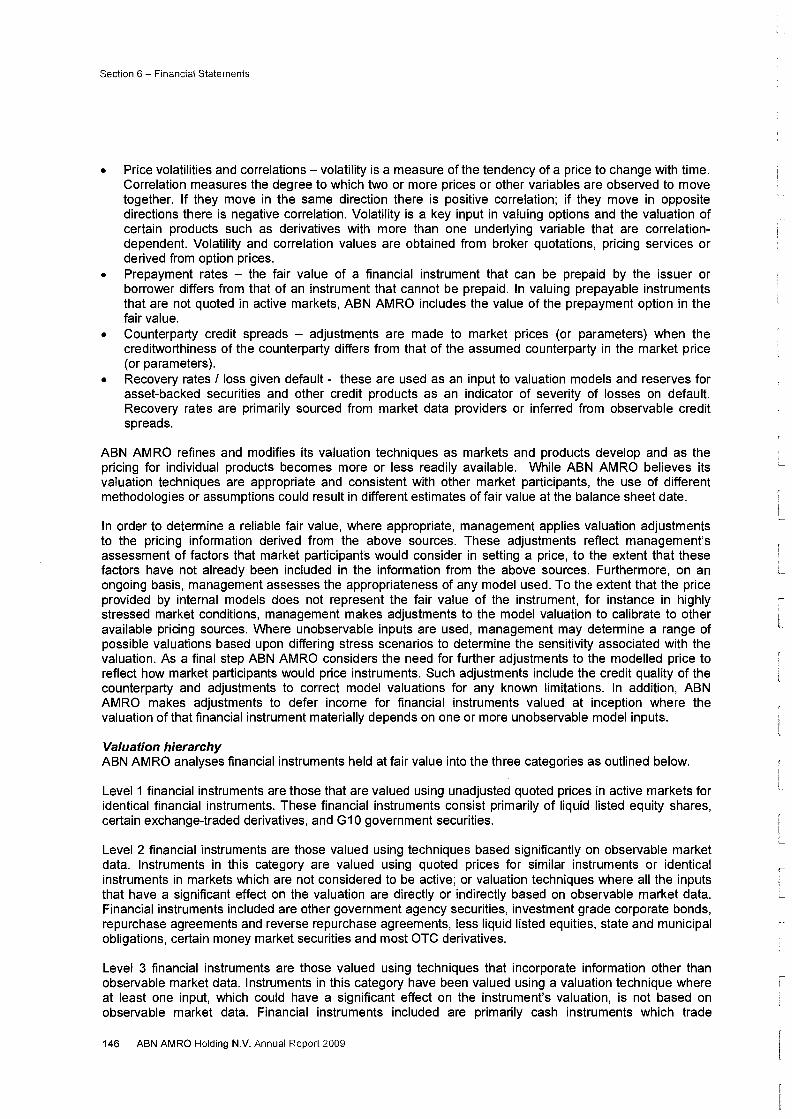
• Price volatilities and correlations -volatility is a measure of the tendency of a price to change with time. Correlation measures the degree to which two or more prices or other variables are observed to move together. If they move in the same direction there is positive correlation; if they move in opposite directions there is negative correlation. Volatility is a key input in valuing options and the valuation of certain products such as derivatives with more than one underlying variable that are correlationdependent. Volatility and correlation values are obtained from broker quotations, pricing services or derived from option prices.
• Prepayment rates - the fair value of a financial instrument that can be prepaid by the issuer or borrower differs from that of an instrument that cannot be prepaid. In valuing prepayable instruments that are not quoted in active markets, ABN AMRO includes the value of the prepayment option in the fair value.
• Counterparty credit spreads - adjustments are made to market prices (or parameters) when the creditworthiness of the counterparty differs from that of the assumed counterparty in the market price (or parameters).
• Recovery rates I loss given default - these are used as an input to valuation models and reserves for asset-backed securities and other credit products as an indicator of severity of losses on default. Recovery rates are primarily sourced from market data providers or inferred from observable credit spreads.
ABN AMRO refines and modifies its valuation techniques as markets and products develop and as the pricing for individual products becomes more or less readily available. While ABN AMRO believes its valuation techniques are appropriate and consistent with other market participants, the use of different methodologies or assumptions could result in different estimates of fair value at the balance sheet date.
In order to determine a reliable fair value, where appropriate, management applies valuation adjustments to the pricing information derived from the above sources. These adjustments reflect management's assessment of factors that market participants would consider in setting a price, to the extent that these factors have not already been included in the information from the above sources. Furthermore, on an ongoing basis, management assesses the appropriateness of any model used. To the extent that the price provided by internal models does not represent the fair value of the instrument, for instance in highly stressed market conditions, management makes adjustments to the model valuation to calibrate to other available pricing sources. Where unobservable inputs are used, management may determine a range of possible valuations based upon differing stress scenarios to determine the sensitivity associated with the valuation. As a final step ABN AMRO considers the need for further adjustments to the modelled price to reflect how market participants would price instruments. Such adjustments include the credit quality of the counterparty and adjustments to correct model valuations for any known limitations. In addition, ABN AMRO makes adjustments to defer income for financial instruments valued at inception where the valuation of that financial instrument materially depends on one or more unobservable model inputs.
Valuation hierarchy ABN AMRO analyses financial instruments held at fair value into the three categories as outlined below.
Level 1 financial instruments are those that are valued using unadjusted quoted prices in active markets for identical financial instruments. These financial instruments consist primarily of liquid listed equity shares, certain exchange-traded derivatives, and G1 0 government securities.
Level 2 financial instruments are those valued using techniques based significantly on observable market data. Instruments in this category are valued using quoted prices for similar instruments or identical instruments in markets which are not considered to be active; or valuation techniques where all the inputs that have a significant effect on the valuation are directly or indirectly based on observable market data. Financial instruments included are other government agency securities, investment grade corporate bonds, repurchase agreements and reverse repurchase agreements, less liquid listed equities, state and municipal obligations, certain money market securities and most OTC derivatives.
Level 3 financial instruments are those valued using techniques that incorporate information other than observable market data. Instruments in this category have been valued using a valuation technique where at least one input, which could have a significant effect on the instrument's valuation, is not based on observable market data. Financial instruments included are primarily cash instruments which trade
146 ABN AMRO Holding N.V. Annual Report 2009
' I L_
,--i
'--
L
I I I L_
fi t::
r--: lJ
Section 6- Financial Statements
infrequently, unlisted equity shares, super senior tranches of high grade and mezzanine COOs, and other less liquid debt securities. Also included are certain structured issued debt securities, OTC derivatives where valuation depends upon unobservable exotic and credit derivatives including those with Credit Derivative Product Company counterparties.
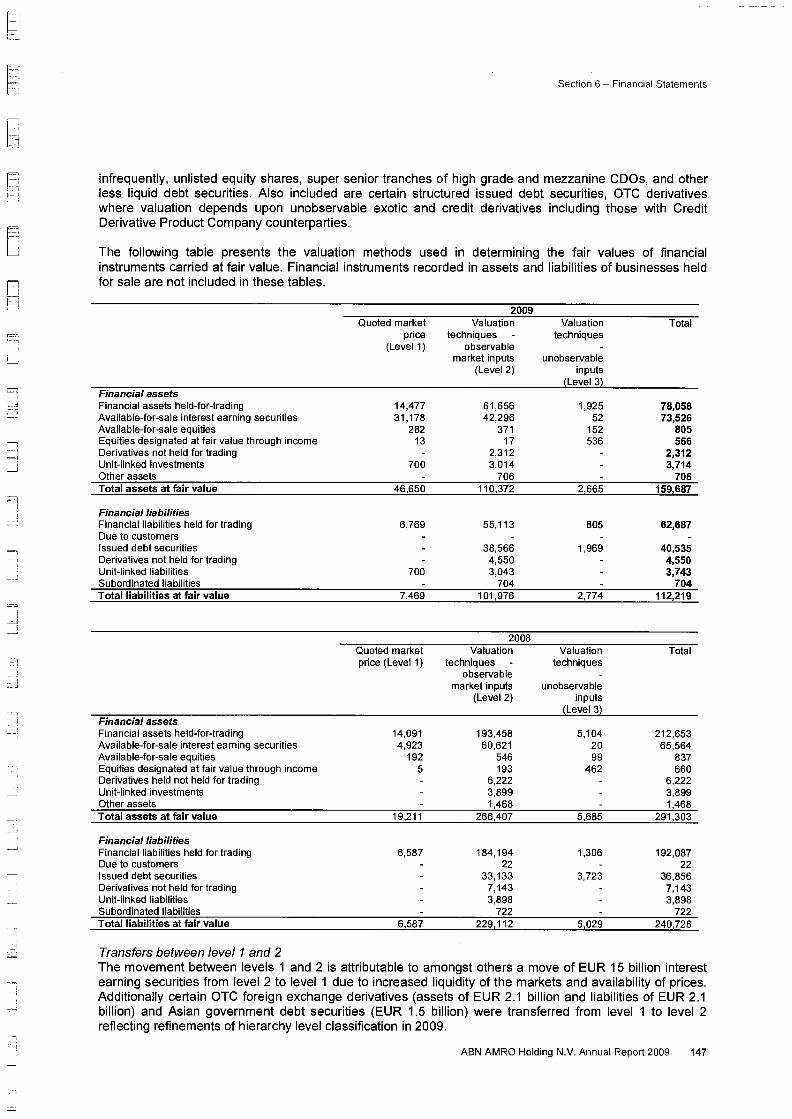
The following table presents the valuation methods used in determining the fair values of financial instruments carried at fair value. Financial instruments recorded in assets and liabilities of businesses held for sale are not included in these tables.
Section 6- Financial Statements
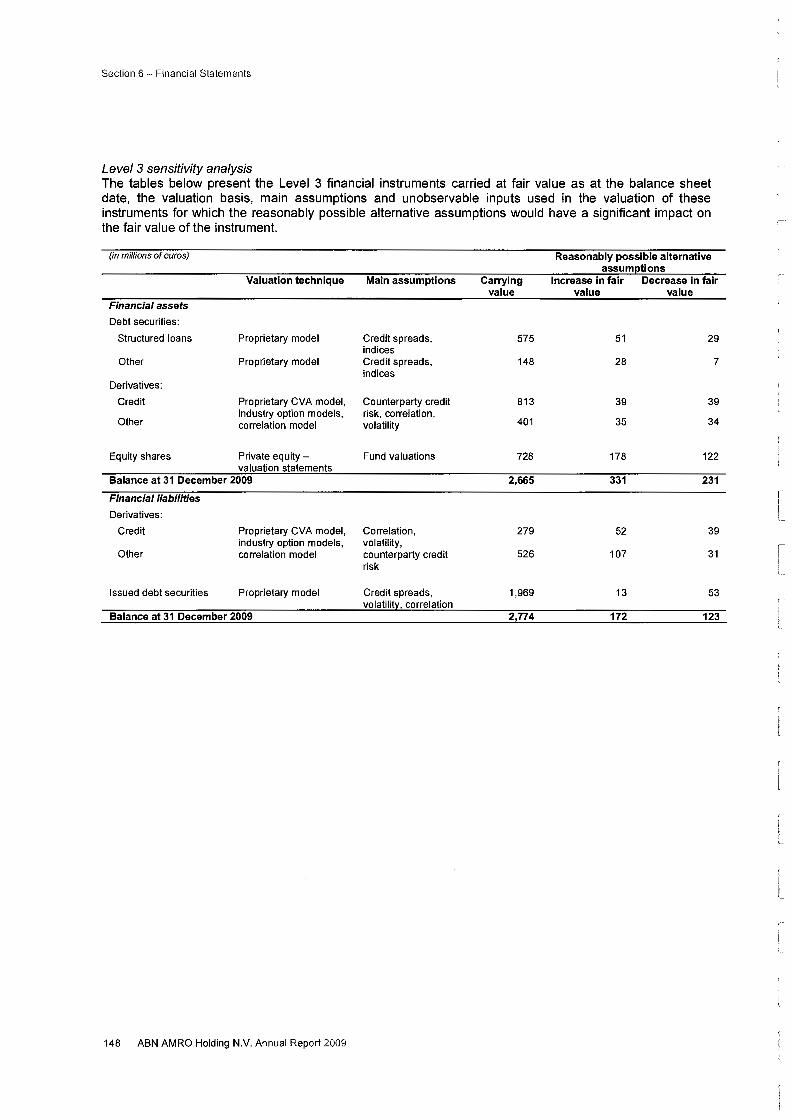
Level 3 sensitivity analysis The tables below present the Level 3 financial instruments carried at fair value as at the balance sheet date, the valuation basis, main assumptions and unobservable inputs used in the valuation of these instruments for which the reasonably possible alternative assumptions would have a significant impact on the fair value of the instrument.
(in millions of euros)
Financial assets
Debt securities:
Structured loans
other
Derivatives:
Credit
Other
Valuation technique
Proprietary model
Proprietary model
Proprietary CVA model, industry option models, correlation model
Equity shares Private equityvaluation statements
Balance at 31 December 2009
Financial liabilities
Derivatives:
Credit
Other
Issued debt securities
Proprietary CVA model, industry option models, correlation model
Proprietary model
Balance at 31 December 2009
148 ABN AMRO Holding N.V. Annual Report 2009
Main assumptions
Credit spreads, indices Credit spreads, indices
Counterparty credit risk, correlation, volatility
Fund valuations
Correlation, volatility, counterparty credit risk
Credit spreads, volatility, correlation
Carrying value
575
148
813
401
728
2,665
279
526
1,969
2,774
Reasonably possible alternative assumptions
Increase in fair Decrease in fair value value
51
28
39
35
178
331
52
107
13
172
29
7
39
34
122
231
39
31
53
123
' L_
i L_
--
_j
I
_____:_:__;
--~
- ' ~ ----;
--, --:- 1
=={ _j
::::] ---j
--·
;
=l l
_j
__j
___j
Section 6 - Financial Statements
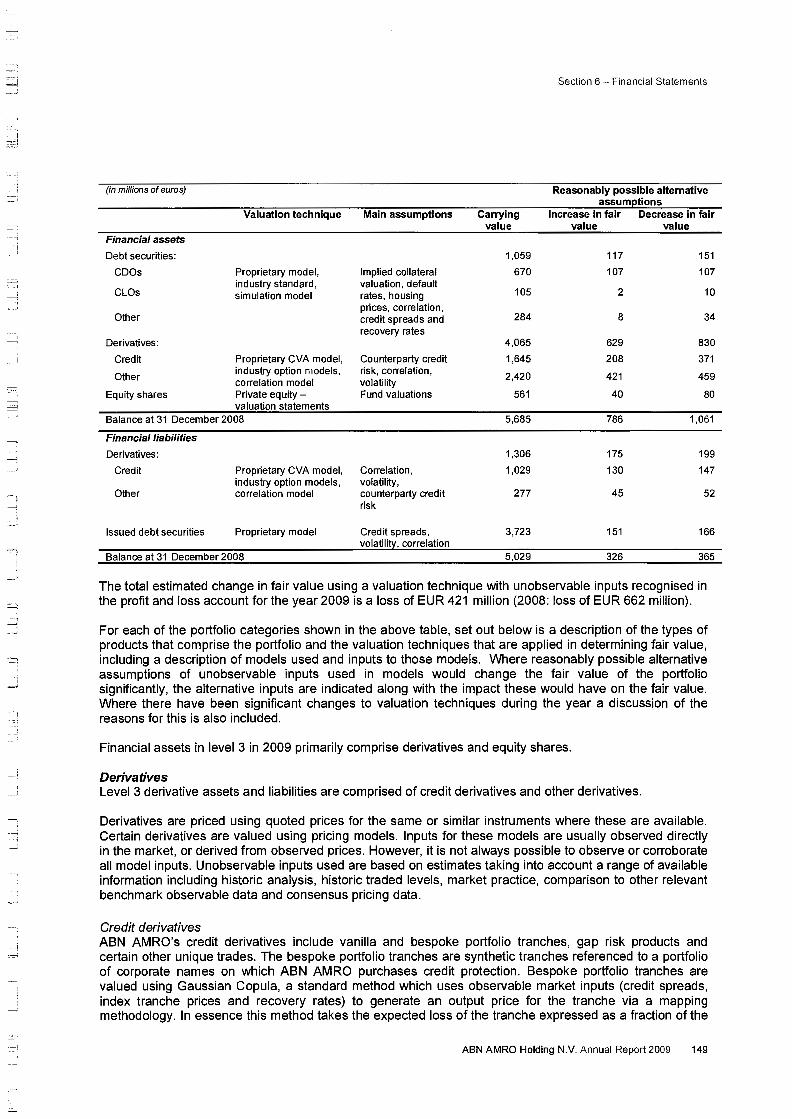
(in millions of euros) Reasonably possible alternative assum~tions
Valuation technique Main assumptions Carrying Increase in fair Decrease in fair value value value
Financial assets
Debt securities: 1,059 117 151
COOs Proprietary model, Implied collateral 670 107 107
CLOs industry standard, valuation, default
105 2 10 simulation model rates, housing prices, correlation,
Other credit spreads and 284 8 34 recovery rates
Derivatives: 4,065 629 830
Credit Proprietary CVA model, Counterparty credit 1,645 208 371
Other industry option models, risk, correlation, 2,420 421 459 correlation model volatility
Equity shares Private equity- Fund valuations 561 40 80 valuation statements
Balance at 31 December 2008 5,685 786 1,061
Financial liabilities
Derivatives: 1,306 175 199
Credit Proprietary CVA model, Correlation, 1,029 130 147 industry option models, volatility,
Other correlation model counterparty credit 277 45 52 risk
Issued debt securities Proprietary model Credit spreads, 3,723 151 166 volatilit~. correlation
Balance at 31 December 2008 5,029 326 365
The total estimated change in fair value using a valuation technique with unobservable inputs recognised in the profit and loss account for the year 2009 is a loss of EUR 421 million (2008: loss of EUR 662 million).
For each of the portfolio categories shown in the above table, set out below is a description of the types of products that comprise the portfolio and the valuation techniques that are applied in determining fair value, including a description of models used and inputs to those models. Where reasonably possible alternative assumptions of unobservable inputs used in models would change the fair value of the portfolio significantly, the alternative inputs are indicated along with the impact these would have on the fair value. Where there have been significant changes to valuation techniques during the year a discussion of the reasons for this is also included.
Financial assets in level 3 in 2009 primarily comprise derivatives and equity shares.
Derivatives Level 3 derivative assets and liabilities are comprised of credit derivatives and other derivatives.
Derivatives are priced using quoted prices for the same or similar instruments where these are available. Certain derivatives are valued using pricing models. Inputs for these models are usually observed directly in the market, or derived from observed prices. However, it is not always possible to observe or corroborate all model inputs. Unobservable inputs used are based on estimates taking into account a range of available information including historic analysis, historic traded levels, market practice, comparison to other relevant benchmark observable data and consensus pricing data.
Credit derivatives ABN AMRO's credit derivatives include vanilla and bespoke portfolio tranches, gap risk products and certain other unique trades. The bespoke portfolio tranches are synthetic tranches referenced to a portfolio of corporate names on which ABN AMRO purchases credit protection. Bespoke portfolio tranches are valued using Gaussian Copula, a standard method which uses observable market inputs (credit spreads, index tranche prices and recovery rates) to generate an output price for the tranche via a mapping methodology. In essence this method takes the expected loss of the tranche expressed as a fraction of the
ABN AMRO Holding N.V. Annual Report 2009 149
Section 6- Financial Statements
expected loss of the whole underlying portfolio and calculates which detachment point on the liquid index, and hence which correlation level, coincides with this expected loss fraction. Where the inputs into the valuation technique used are observable in the market, bespoke tranches are considered to be level 2 assets. Where inputs are not observable, bespoke tranches are considered to be level 3 assets.
Gap risk products are leveraged trades with the counterparty's potential loss capped at the amount of the initial principal invested. Gap risk is the probability that the market will move discontinuously too quickly to exit a portfolio and return the principal to the counterparty without incurring losses, should an unwind event be triggered. This optionality is embedded within these portfolio structures and is very rarely traded outright in the market. Gap risk is not observable in the markets and, as such, these structures are deemed to be level 3 instruments.
Other unique trades are valued using a specialised model for each instrument and the same market data inputs as all other trades where applicable. By their nature, the valuation is also driven by a variety of other model inputs, many of which are unobservable in the market. Where these instruments have embedded optionality it is valued using a variation of the Black-Scholes option pricing formula, and where they have correlation exposure it is valued using a variant of the Gaussian Copula model. The volatility or unique correlation inputs required to value these products are generally unobservable and the instruments are therefore deemed to be level 3 instruments.
Equity derivatives Equity derivative products are split into equity exotic derivatives and equity hybrids. Equity exotic derivatives have payouts based on the performance of one or more stocks, equity funds or indices. Most payouts are based on the performance of a single asset and are valued using observable market option data. Unobservable equity derivative trades are typically complex basket options on stocks. Such basket option payouts depend on the performance of more than one equity asset and require correlations for their valuation. Valuation is then performed using industry standard valuation models, with unobservable correlation inputs calculated by reference to correlations observed between similar underlyings.
Equity hybrids have payouts based on the performance of a basket of underlyings where the underlyings are from different asset classes. Correlations between these different underlyings are typically unobservable with no market information for closely related assets available. Where no market for the correlation input exists, these inputs are based on historical time series.
Interest rate, commodity and foreign exchange derivatives Interest rate, commodity and foreign exchange options provide a payout (or series of payouts) linked to the performance of one or more underlying, including interest rates, foreign exchange rates and commodities. Exotic options do not trade in active markets except in a small number of cases. Consequently, ABN AMRO uses models to determine fair value using valuation techniques typical for the industry. These techniques can be divided, firstly, into modelling approaches and, secondly, into methods of assessing appropriate levels for model inputs. ABN AMRO uses a variety of proprietary models for valuing exotic trades.
Exotic valuation inputs include correlation between interest rates, foreign exchange rates and commodity prices. Correlations for more liquid rate pairs are valued using independently sourced consensus pricing levels. Where a consensus pricing benchmark is unavailable, these instruments are categorised as level 3.
Reasonably possible alternative assumptions For all level 3 derivatives, unobservable inputs are principally comprised of correlations, volatilities and counterparty credit risks. Where a derivative valuation relies significantly on an unobservable input, the valuation is shown in level 3. It is usual for such derivative valuations to depend on several observable, and one or few unobservable model inputs. In determining reasonably possible alternative assumptions, the relative impact of unobservable inputs as compared to those which may be observed was considered within a certain range.
Equities designated at fair value through income Equities designated at fair value through income classified as level 3 include mainly private equity investments. In general private equity investments cannot be valued directly from quoted market prices or
150 ABN AMRO Holding N.V. Annual Report 2009
' L
l l_
' '
=> _ _j _J __ _j
=
Section 6- Financial Statements
by using valuation techniques supported by observable market prices or other market data. The fair value is determined using a valuation technique applied in accordance with the European Private Equity and Venture Capitalist Association guidelines (EVCA). Reasonably possible alternative assumptions relate mainly to terminal and explicit growth rates, as well as a range of observable price multiples.
Other assets Other level 3 financial instruments comprise mainly trading customer structured debt securities. Where observable market prices for a particular debt security are not available, the fair value will typically be determined with reference to observable market transactions in other related products, such as similar debt securities or credit derivatives.These loans are primarily traded alongside a CDS hedge to eliminate the credit risk and valued at the traded spread over LIBOR using standard discounted cashflow methodology. In determining reasonable possible alternative assumptions ABN AMRO considered spreads from available market prices in determining the inputs to the valuation methodology applied.
Issued debt securities Issued debt securities classified as level 3 are valued using independent quotes from market participants for the debt issuance spreads above average interbank rates (at a range of tenors) which the market would demand when purchasing new senior or sub-debt issuances from ABN AMRO. Where necessary, these quotes are interpolated using a curve shape derived from CDS prices.
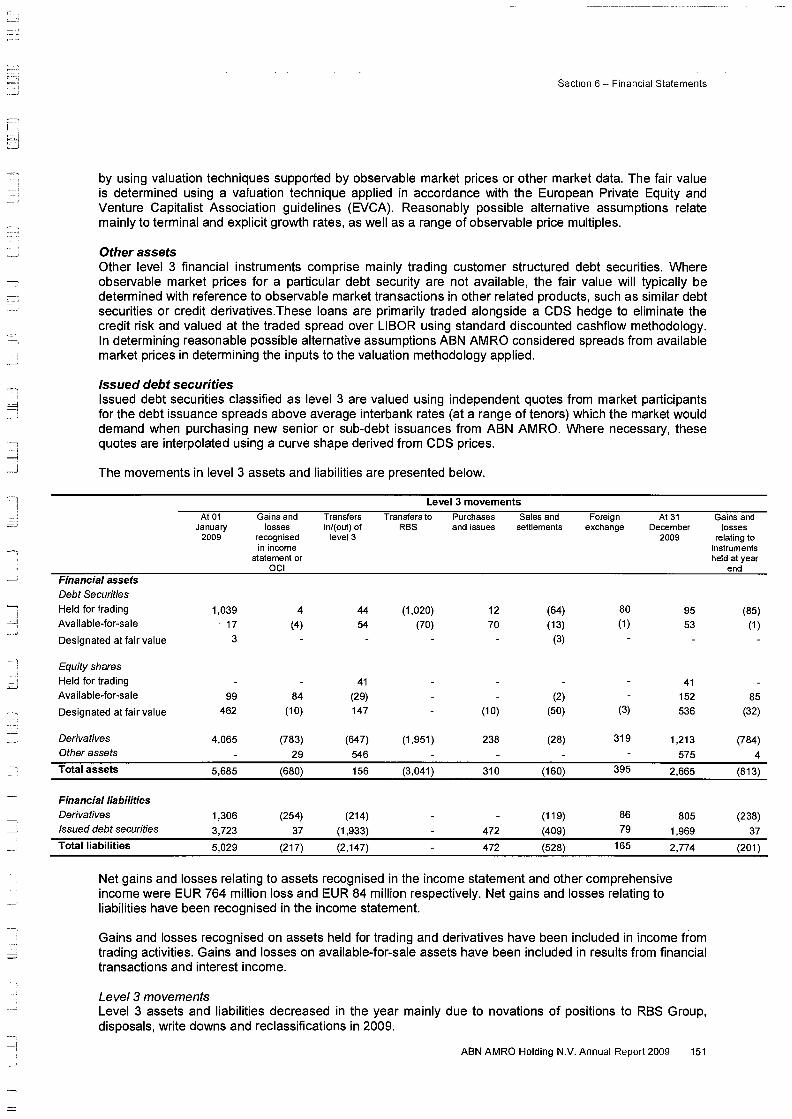
The movements in level 3 assets and liabilities are presented below.
Financial assets Debt Securities
Held for trading
Available-for-sale
Designated at fair value
Equity shares Held for trading
Available-for-sale
Designated at fair value
Derivatives Other assets
Total assets
Financial liabilities Derivatives Issued debt securities
Total liabilities
At01 January
2009
1,Q3g
17 3
99
462
4,065
5,685
1,306
3,723
5,029
Gains and Transfers losses in/( out) of
recognised level3 in income
statement or OCI
4 44
(4) 54
41
84 (29)
(10) 147
(783) (647)
29 546
(680) 156
(254) (214)
37 (1 ,933)
(217) (2,147)
Level 3 movements Transfers to Purchases Sales and Foreign At31
RBS and issues settlements exchange December 2009
(1,020) 12 (64) 80 95
(70) 70 (13) (1) 53
(3)
41
(2) 152
(1 0) (50) (3) 536
(1 ,951) 238 (28) 319 1,213
575
(3,041) 310 (160) 395 2,665
(119) 86 805
472 (409) 79 1,969
472 (528) 165 2,774
Net gains and losses relating to assets recognised in the income statement and other comprehensive income were EUR 764 million loss and EUR 84 million respectively. Net gains and losses relating to liabilities have been recognised in the income statement.
Gains and losses recognised on assets held for trading and derivatives have been included in income from trading activities. Gains and losses on available-for-sale assets have been included in results from financial transactions and interest income.
Leve/3 movements Level 3 assets and liabilities decreased in the year mainly due to novations of positions to RBS Group, disposals, write downs and reclassifications in 2009.
ABN AMRO Holding N.V. Annual Report 2009 151
Gains and losses
relating to instruments held at year
end
(85)
(1)
85
(32)
(784)
4
(813)
(238)
37
(201)
Section 6 - Financial Statements
The decrease in debt securities and derivatives of respectively EUR 0.9 billion and EUR 2.9 billion was primarily due to novations to RBS Group of portfolios that are not part of the RBS acquired businesses included in ABN AMRO in the future.
Issued debt securities show a decrease of EUR 1.9 billion mainly due to a transfer from level 3 to level 2 of constant proportion portfolio insurance notes reflecting the expiration of the derivatives embedded in these notes in 2009.
In addition refinements of hierarchy levels resulted in transfers to level 2 of derivative assets and liabilities as well as from level 2 to level 3 of trading book loans.
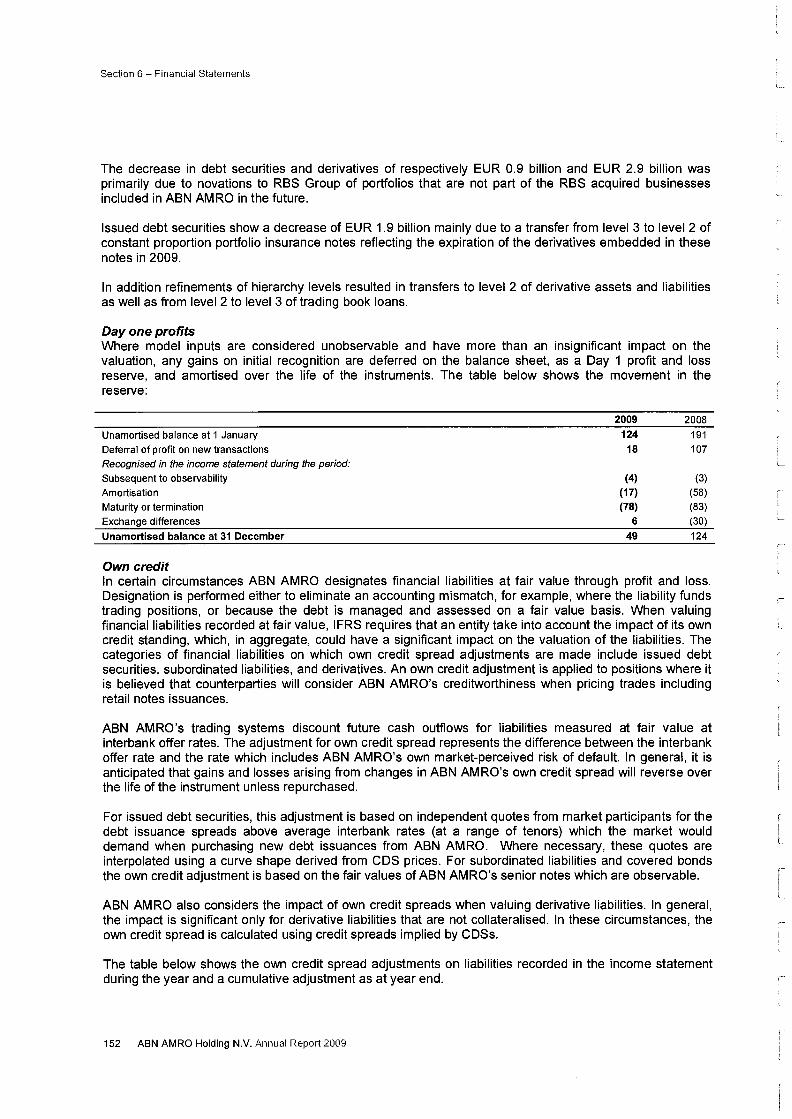
Day one profits Where model inputs are considered unobservable and have more than an insignificant impact on the valuation, any gains on initial recognition are deferred on the balance sheet, as a Day 1 profit and loss reserve, and amortised over the life of the instruments. The table below shows the movement in the reserve:
Unamortised balance at 1 January Deferral of profit on new transactions Recognised in the income statement during the period:
Subsequent to observability Amortisation Maturity or termination Exchange differences
Unamortised balance at 31 December
Own credit
2009 2008
124 191 18 107
(4) (3) (17) (58) (78) (83)
6 (30)
49 124
In certain circumstances ABN AMRO designates financial liabilities at fair value through profit and loss. Designation is performed either to eliminate an accounting mismatch, for example, where the liability funds trading positions, or because the debt is managed and assessed on a fair value basis. When valuing financial liabilities recorded at fair value, I FRS requires that an entity take into account the impact of its own credit standing, which, in aggregate, could have a significant impact on the valuation of the liabilities. The categories of financial liabilities on which own credit spread adjustments are made include issued debt securities, subordinated liabilities, and derivatives. An own credit adjustment is applied to positions where it is believed that counterparties will consider ABN AMRO's creditworthiness when pricing trades including retail notes issuances.
ABN AMRO's trading systems discount future cash outflows for liabilities measured at fair value at interbank offer rates. The adjustment for own credit spread represents the difference between the interbank offer rate and the rate which includes ABN AMRO's own market-perceived risk of default. In general, it is anticipated that gains and losses arising from changes in ABN AMRO's own credit spread will reverse over the life of the instrument unless repurchased.
For issued debt securities, this adjustment is based on independent quotes from market participants for the debt issuance spreads above average interbank rates (at a range of tenors) which the market would demand when purchasing new debt issuances from ABN AMRO. Where necessary, these quotes are interpolated using a curve shape derived from CDS prices. For subordinated liabilities and covered bonds the own credit adjustment is based on the fair values of ABN AMRO's senior notes which are observable.
ABN AMRO also considers the impact of own credit spreads when valuing derivative liabilities. In general, the impact is significant only for derivative liabilities that are not collateralised. In these circumstances, the own credit spread is calculated using credit spreads implied by CDSs.
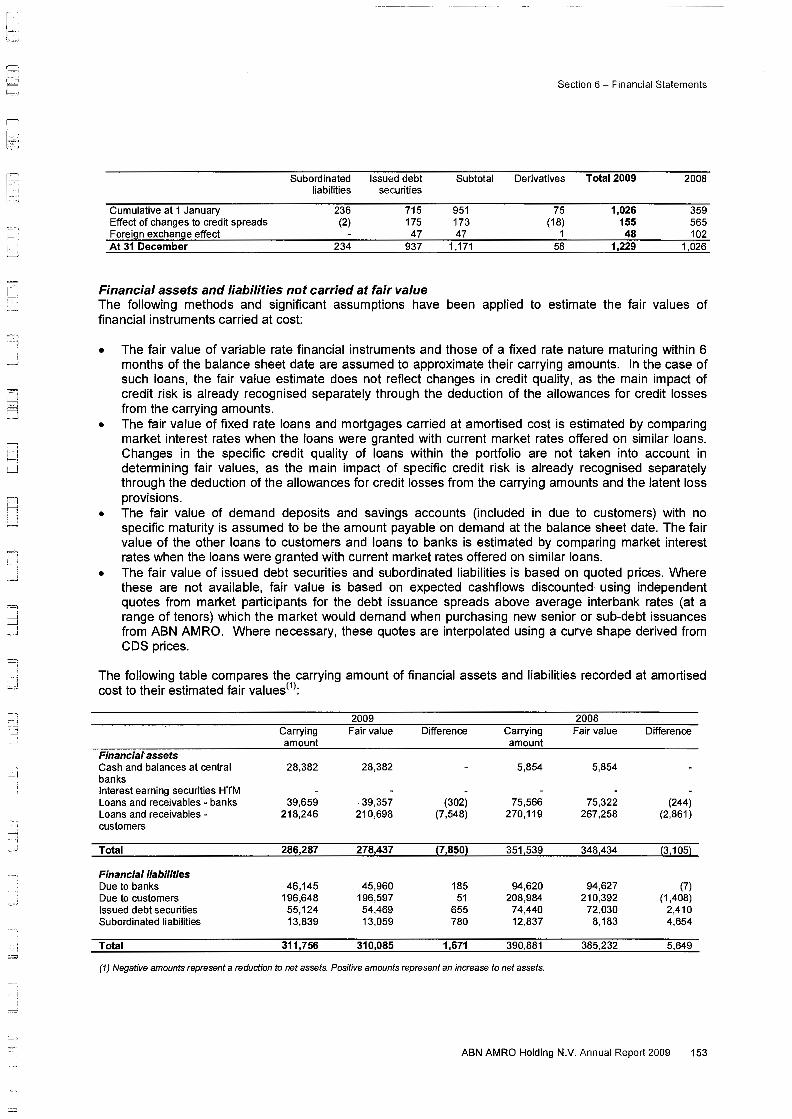
The table below shows the own credit spread adjustments on liabilities recorded in the income statement during the year and a cumulative adjustment as at year end.
152 ABN AMRO Holding N.V. Annual Report 2009
I
l.
l_
L
r L
If=
~ j I
I i =:1 r-----=--1
: ; - j
_j
- -~
·-·, _,
=
--::_!
Section 6 - Financial Statements
Subordinated Issued debt Subtotal Derivatives Total2009 2008 liabilities securities
Cumulative at 1 January 236 715 951 75 1,026 359 Effect of changes to credit spreads (2) 175 173 (18) 155 565 Forei9n exchan9e effect 47 47 1 48 102 At 31 December 234 937 1,171 58 1,229 1,026
Financial assets and liabilities not carried at fair value The following methods and significant assumptions have been applied to estimate the fair values of financial instruments carried at cost:
• The fair value of variable rate financial instruments and those of a fixed rate nature maturing within 6 months of the balance sheet date are assumed to approximate their carrying amounts. In the case of such loans, the fair value estimate does not reflect changes in credit quality, as the main impact of credit risk is already recognised separately through the deduction of the allowances for credit losses from the carrying amounts.
• The fair value of fixed rate loans and mortgages carried at amortised cost is estimated by comparing market interest rates when the loans were granted with current market rates offered on similar loans. Changes in the specific credit quality of loans within the portfolio are not taken into account in determining fair values, as the main impact of specific credit risk is already recognised separately through the deduction of the allowances for credit losses from the carrying amounts and the latent loss provisions.
• The fair value of demand deposits and savings accounts (included in due to customers) with no specific maturity is assumed to be the amount payable on demand at the balance sheet date. The fair value of the other loans to customers and loans to banks is estimated by comparing market interest rates when the loans were granted with current market rates offered on similar loans.
• The fair value of issued debt securities and subordinated liabilities is based on quoted prices. Where these are not available, fair value is based on expected cashflows discounted using independent quotes from market participants for the debt issuance spreads above average interbank rates (at a range of tenors) which the market would demand when purchasing new senior or sub-debt issuances from ABN AMRO. Where necessary, these quotes are interpolated using a curve shape derived from CDS prices.
The following table compares the carrying amount of financial assets and liabilities recorded at amortised cost to their estimated fair values<1>:
2009 Carrying Fair value amount
Financial assets Cash and balances at central 28,382 28,382 banks Interest earning securities HTM Loans and receivables - banks 39,659 39,357 Loans and receivables - 218,246 210,698 customers
Total 286,287 278,437
Financial liabilities Due to banks 46,145 45,960 Due to customers 196,648 196,597 Issued debt securities 55,124 54,469 Subordinated liabilities 13,839 13,059
Total 311,756 310,085
Difference Carrying amount
5,854
(302) 75,566 (7,548) 270,119
(7,850) 351,539
185 94,620 51 208,984
655 74,440 780 12,837
1,671 390,881
2008 Fair value
5,854
75,322 267,258
348,434
94,627 210,392
72,030 8,183
385,232
Difference
(244) (2,861)
(3,105)
(7) (1,408)
2,410 4,654
5,649
(1) Negative amounts represent a reduction to net assets. Positive amounts represent an increase to net assets.
ABN AMRO Holding N.V. Annual Report 2009 153
Section 6- Financial Statements
38 Financial risk management
Financial instrument risk disclosures This section provides details of the exposure to risk arising from financial instruments and how those risks are managed. In addition, this note includes a discussion on the extent to which financial instruments are used, the associated risks and the business purpose served.
The most important types of risk associated with financial instruments are: • Credit risk and country event risk; • Liquidity risk; • Interest rate risk (banking book positions); and • Market risk (trading portfolio) including liquidity risk, currency risk, interest rate risk, equity price risk
and commodity risk of the trading book.
Below is a short description of credit, liquidity, interest rate and market risk within ABN AMRO's financial instruments portfolio and their impact on ABN AMRO's financial position and performance as shown in the quantitative tables.
Credit risk
Measurement and control ABN AMRO is subject to credit risk through its lending, trading, hedging and investing activities as well as in cases where it acts as an intermediary on behalf of customers or other third parties or issues guarantees.
Senior management is responsible for establishing the credit policies and the mechanisms, organisation and procedures required to analyse, manage and control credit risk. In this respect, counterparty limits are set and an internal system of credit ratings is applied.
The primary exposure to credit risk arises through loans, credit facilities and guarantees issued, financial assets held for trading (interest earning securities and derivatives) and derivatives used for hedging.
The risk that counterparties might default on their obligations is monitored on an ongoing basis. For each transaction it is evaluated whether collateral or a master netting agreement is required to help mitigate the credit risk.
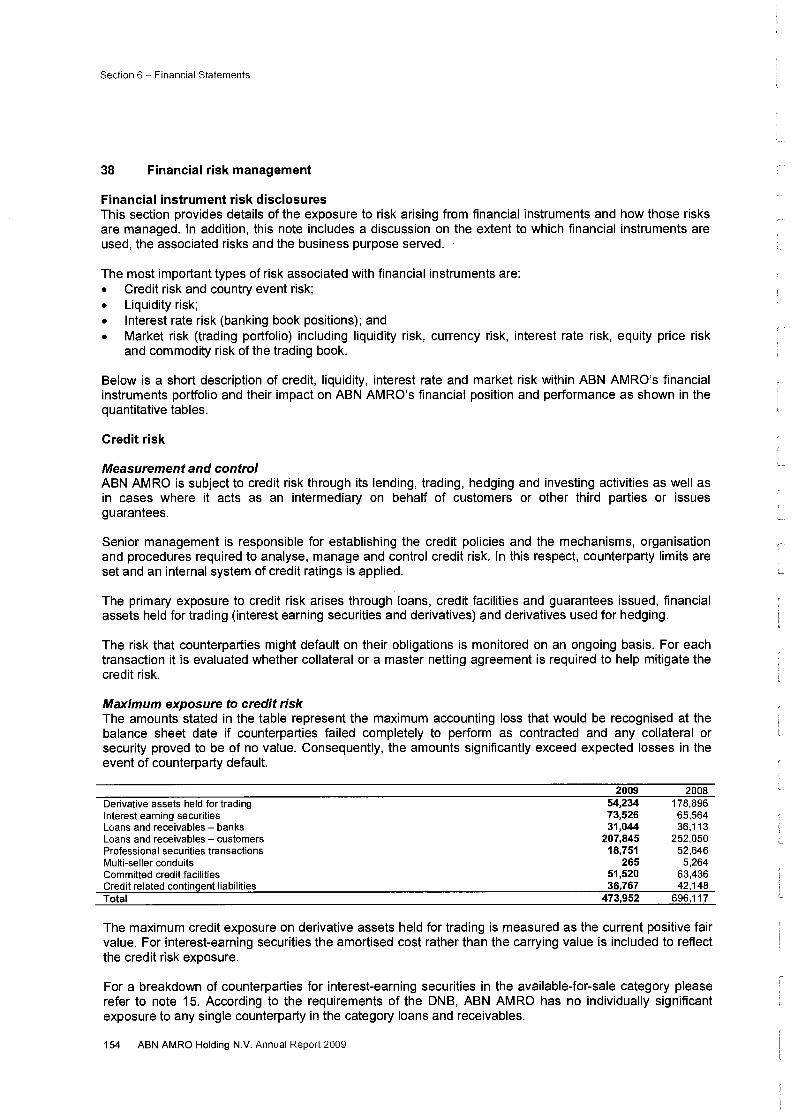
Maximum exposure to credit risk The amounts stated in the table represent the maximum accounting loss that would be recognised at the balance sheet date if counterparties failed completely to perform as contracted and any collateral or security proved to be of no value. Consequently, the amounts significantly exceed expected losses in the event of counterparty default.
Derivative assets held for trading Interest earning securities Loans and receivables - banks Loans and receivables - customers Professional securities transactions Multi-seller conduits Committed credit facilities Credit related contingent liabilities Total
2009 54,234 73,526 31,044
207,845 18,751
265 51,520 36,767
473,952
2008 178,896 65,564 36,113
252,050 52,646
5,264 63,436 42,148
696,117
The maximum credit exposure on derivative assets held for trading is measured as the current positive fair value. For interest-earning securities the amortised cost rather than the carrying value is included to reflect the credit risk exposure.
For a breakdown of counterparties for interest-earning securities in the available-for-sale category please refer to note 15. According to the requirements of the DNB, ABN AMRO has no individually significant exposure to any single counterparty in the category loans and receivables.
154 ABN AMRO Holding N.V. Annual Report 2009
' L
I
-~-j
i _j
Section 6- Financial Statements
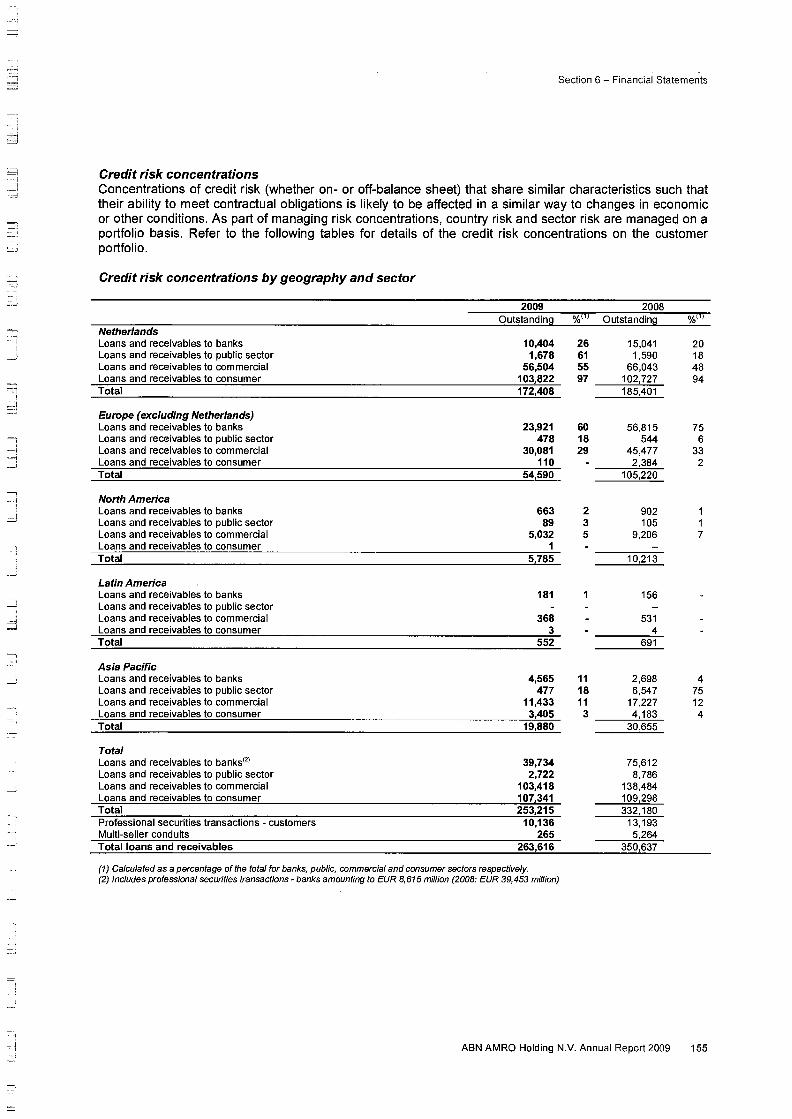
Credit risk concentrations Concentrations of credit risk (whether on- or off-balance sheet) that share similar characteristics such that their ability to meet contractual obligations is likely to be affected in a similar way to changes in economic or other conditions. As part of managing risk concentrations, country risk and sector risk are managed on a portfolio basis. Refer to the following tables for details of the credit risk concentrations on the customer portfolio.
Credit risk concentrations by geography and sector
2009 2008 Outstanding %!1! Outstanding %Ill
Netherlands Loans and receivables to banks 10,404 26 15,041 20 Loans and receivables to public sector 1,678 61 1,590 18 Loans and receivables to commercial 56,504 55 66,Q43 48 Loans and receivables to consumer 103,822 97 102,727 94 Total 172,408 185,401
Europe (excluding Netherlands) Loans and receivables to banks 23,921 60 56,815 75 Loans and receivables to public sector 478 18 544 6 Loans and receivables to commercial 30,081 29 45,477 33 Loans and receivables to consumer 110 2,384 2 Total 54,590 105,220
North America Loans and receivables to banks 663 2 902 1 Loans and receivables to public sector 89 3 105 1 Loans and receivables to commercial 5,032 5 9,206 7 Loans and receivables to consumer 1 Total 5 785 10,213
Latin America Loans and receivables to banks 181 156 Loans and receivables to public sector Loans and receivables to commercial 368 531 Loans and receivables to consumer 3 4 Total 552 691
Asia Pacific Loans and receivables to banks 4,565 11 2,698 4 Loans and receivables to public sector 477 18 6,547 75 Loans and receivables to commercial 11,433 11 17,227 12 Loans and receivables to consumer 3,405 3 4,183 4 Total 19,880 30,655
Total Loans and receivables to banks<21 39,734 75,612 Loans and receivables to public sector 2,722 8,786 Loans and receivables to commercial 103,418 138,484 Loans and receivables to consumer 107,341 109,298 Total 253,215 332,180 Professional securities transactions - customers 10,136 13,193 Multi-seller conduits 265 5,264 Total loans and receivables 263,616 350,637
(1) Calculated as a percentage of the total for banks, public, commercial and consumer sectors respectively. (2) Includes professional securities transactions- banks amounting to EUR 8,615 million (2008: EUR 39,453 million)
ABN AMRO Holding N.V. Annual Report 2009 155
Section 6- Financial Statements
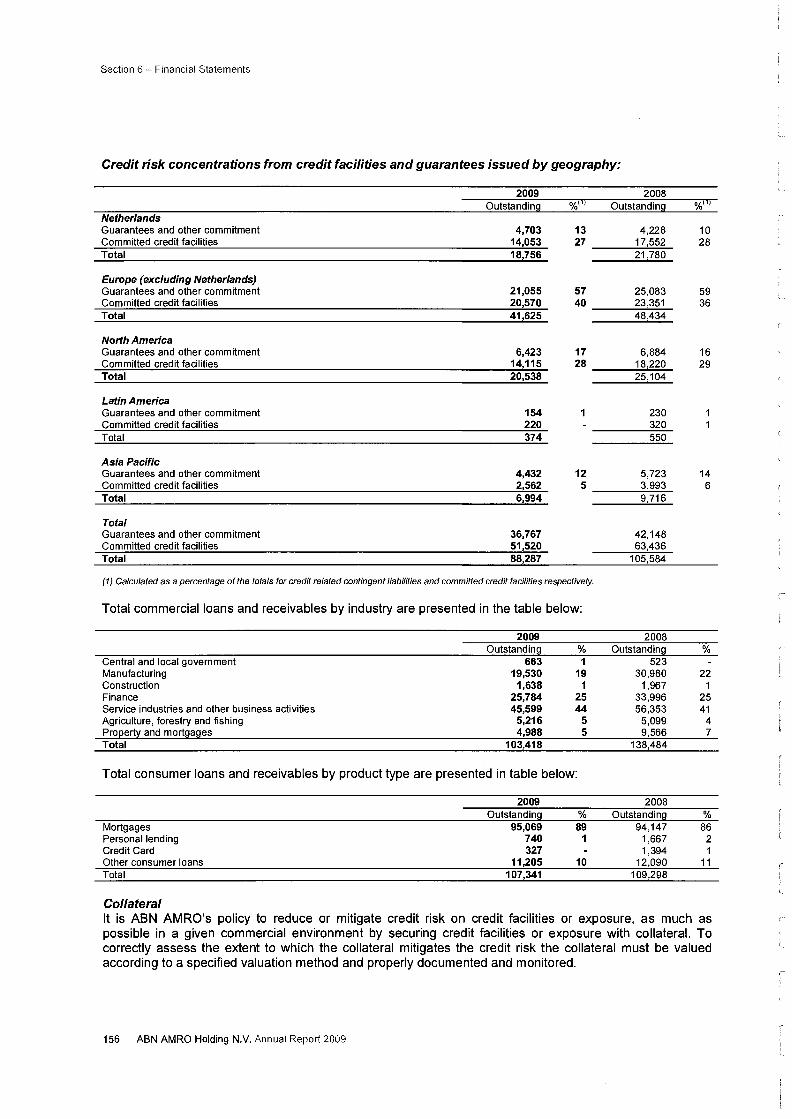
Credit risk concentrations from credit facilities and guarantees issued by geography:
2009 2008 Outstanding %m Outstanding %11)
Netherlands Guarantees and other commitment 4,703 13 4,228 10 Committed credit facilities 14,053 27 17,552 28 Total 18,756 21,780
Europe (excluding Netherlands) Guarantees and other commitment 21,055 57 25,083 59 Committed credit facilities 20,570 40 23,351 36 Total 41,625 48,434
North America Guarantees and other commitment 6,423 17 6,884 16 Committed credit facilities 14,115 28 18,220 29 Total 20,538 25,104
Latin America Guarantees and other commitment 154 230 Committed credit facilities 220 320 Total 374 550
Asia Pacific Guarantees and other commitment 4,432 12 5,723 14 Committed credit facilities 2,562 5 3,993 6 Total 6,994 9,716
Total Guarantees and other commitment 36,767 42,148 Committed credit facilities 51,520 63,436 Total 88,287 105,584
(1) Calculated as a percentage of the totals for credit related contingent liabilities and committed credit facilities respectively.
Total commercial loans and receivables by industry are presented in the table below:
2009 2008 Outstandin9 % Outstandin9 %
Central and local government 663 1 523 Manufacturing 19,530 19 30,980 22 Construction 1,638 1 1,967 1 Finance 25,784 25 33,996 25 Service industries and other business activities 45,599 44 56,353 41 Agriculture, forestry and fishing 5,216 5 5,099 4 Pro~ert:t and mort9a9es 4,988 5 9,566 7 Total 103,418 138,484
Total consumer loans and receivables by product type are presented in table below:
2009 2008 Outstandin9 % Outstandin9 %
Mortgages 95,069 89 94,147 86 Personal lending 740 1 1,667 2 Credit Card 327 1,394 1 Other consumer loans 11,205 10 12,090 11 Total 107,341 109,298
Collateral It is ABN AMRO's policy to reduce or mitigate credit risk on credit facilities or exposure, as much as possible in a given commercial environment by securing credit facilities or exposure with collateral. To correctly assess the extent to which the collateral mitigates the credit risk the collateral must be valued according to a specified valuation method and properly documented and monitored.
156 ABN AMRO Holding N.V. Annual Report 2009
L
c-
=\
' ' -J
_j
---i
Section 6- Financial Statements
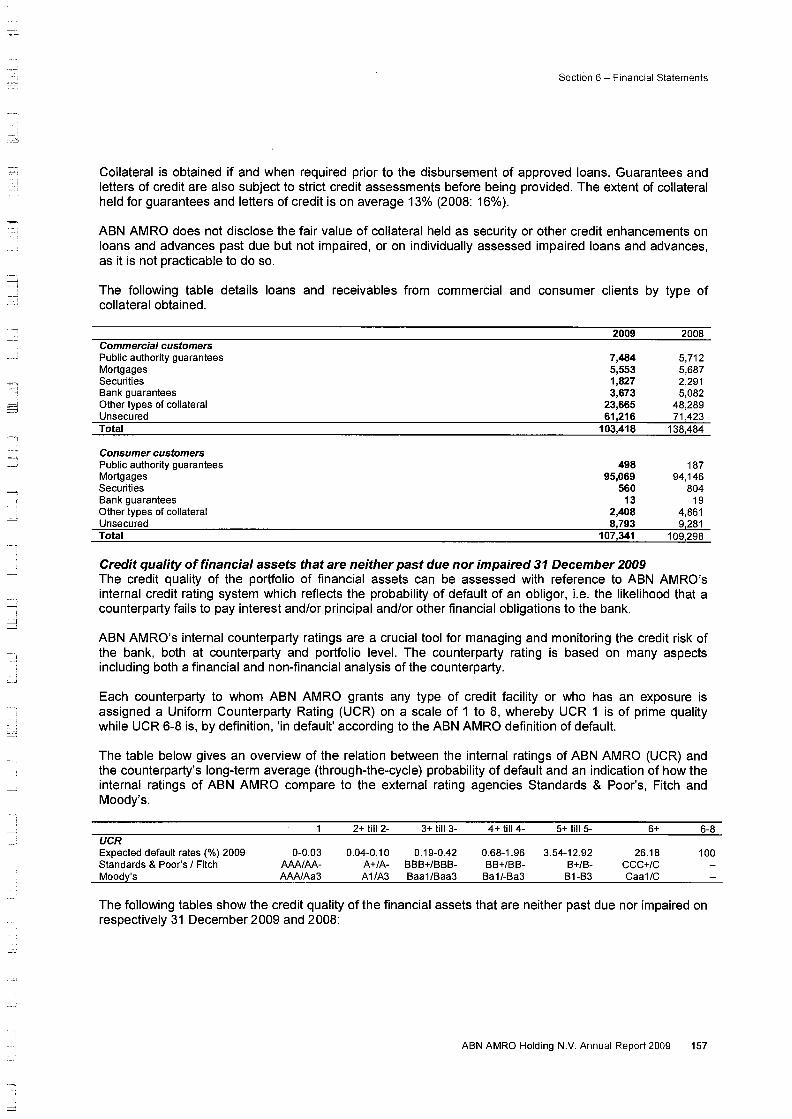
Collateral is obtained if and when required prior to the disbursement of approved loans. Guarantees and letters of credit are also subject to strict credit assessments before being provided. The extent of collateral held for guarantees and letters of credit is on average 13% (2008: 16% ).
ABN AMRO does not disclose the fair value of collateral held as security or other credit enhancements on loans and advances past due but not impaired, or on individually assessed impaired loans and advances, as it is not practicable to do so.
The following table details loans and receivables from commercial and consumer clients by type of collateral obtained.
Commercial customers Public authority guarantees Mortgages Securities Bank guarantees Other types of collateral Unsecured Total
Consumer customers Public authority guarantees Mortgages Securities Bank guarantees Other types of collateral Unsecured Total
2009
7,484 5,553 1,827 3,673
23,665 61,216
103,418
498 95,069
560 13
2,408 8 793
107,341
2008
5,712 5,687 2,291 5,082
48,289 71,423
138,484
187 94,146
804 19
4,861 9,281
109,298
Credit quality of financial assets that are neither past due nor impaired 31 December 2009 The credit quality of the portfolio of financial assets can be assessed with reference to ABN AMRO's internal credit rating system which reflects the probability of default of an obligor, i.e. the likelihood that a counterparty fails to pay interest and/or principal and/or other financial obligations to the bank.
ABN AMRO's internal counterparty ratings are a crucial tool for managing and monitoring the credit risk of the bank, both at counterparty and portfolio level. The counterparty rating is based on many aspects including both a financial and non-financial analysis of the counterparty.
Each counterparty to whom ABN AMRO grants any type of credit facility or who has an exposure is assigned a Uniform Counterparty Rating (UCR) on a scale of 1 to 8, whereby UCR 1 is of prime quality while UCR 6-8 is, by definition, 'in default' according to the ABN AMRO definition of default.
The table below gives an overview of the relation between the internal ratings of ABN AMRO (UCR) and the counterparty's long-term average (through-the-cycle) probability of default and an indication of how the internal ratings of ABN AMRO compare to the external rating agencies Standards & Poor's, Fitch and Moody's.
2+ till 2- 3+ till3- 4+ till4- 5+ tillS- 6+ 6-8 UCR Expected default rates(%) 2009 0-0.03 0.04-0.10 0.19-0.42 0.68-1.96 3.54-12.92 26.18 100 Standards & Poor's I Fitch AAA/AA- A+/A- BBB+/BBB- BB+/BB- B+/B- CCC+/C Moody's AAA/Aa3 A1/A3 Baa1/Baa3 Ba1/-Ba3 B1-B3 Caa1/C
The following tables show the credit quality of the financial assets that are neither past due nor impaired on respectively 31 December 2009 and 2008:
ABN AMRO Holding N.V. Annual Report 2009 157
Section 6- Financial Statements
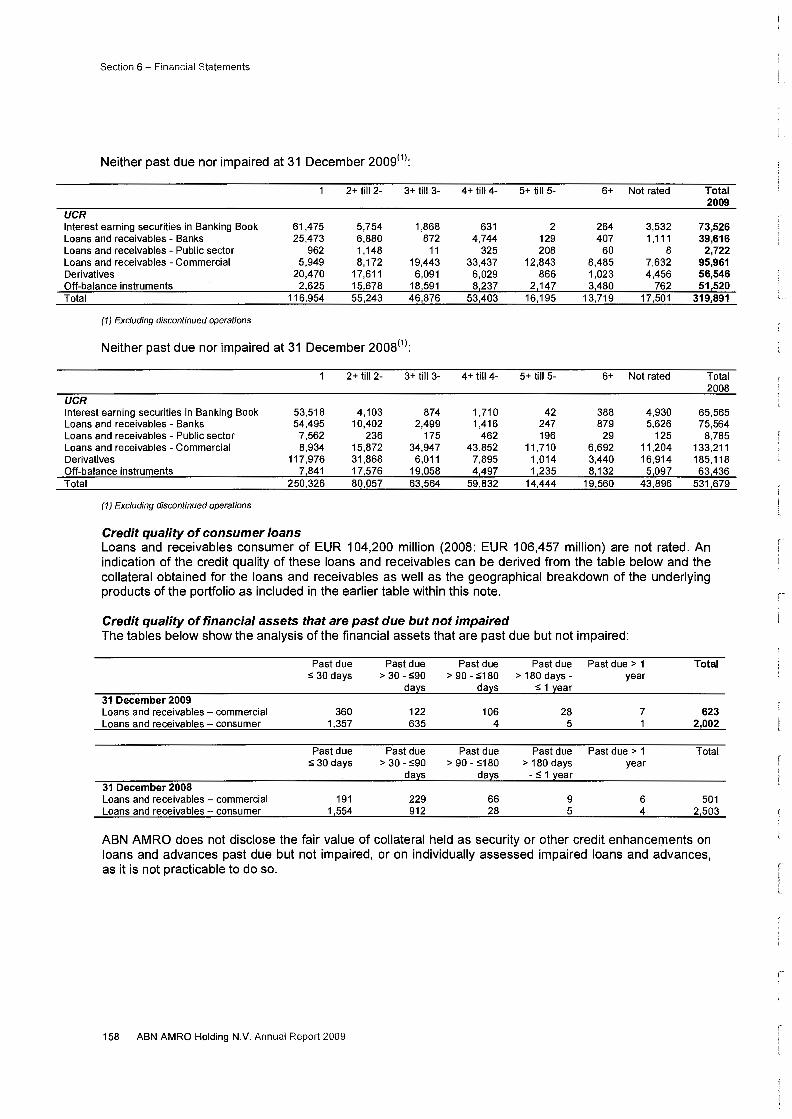
Neither past due nor impaired at 31 December 2009(1>:
2+ till 2- 3+ till 3- 4+ till4- 5+ till 5- 6+ Not rated Total 2009
UCR Interest earning securities in Banking Book 61,475 5,754 1,868 631 2 264 3,532 73,526 Loans and receivables - Banks 25,473 6,880 872 4,744 129 407 1 ,111 39,616 Loans and receivables - Public sector 962 1,148 11 325 208 60 8 2,722 Loans and receivables - Commercial 5,949 8,172 19,443 33,437 12,843 8,485 7,632 95,961 Derivatives 20,470 17,611 6,091 6,029 866 1,023 4,456 56,546 Off-balance instruments 2,625 15,678 18,591 8,237 2,147 3,480 762 51,520 Total 116,954 55,243 46,876 53,403 16,195 13,719 17,501 319,891
(1) Excluding discontinued operations
Neither past due nor impaired at 31 December 2008(1>:
2+ till 2- 3+ till3- 4+ till4- 5+ till 5- 6+ Not rated Total 2008
UCR Interest earning securities in Banking Book 53,518 4,103 874 1,710 42 388 4,930 65,565 Loans and receivables - Banks 54,495 10,402 2,499 1,416 247 879 5,626 75,564 Loans and receivables - Public sector 7,562 236 175 462 196 29 125 8,785 Loans and receivables - Commercial 8,934 15,872 34,947 43,852 11,710 6,692 11,204 133,211 Derivatives 117,976 31,868 6,011 7,895 1,014 3,440 16,914 185,118 Off-balance instruments 7,841 17,576 19,058 4,497 1,235 8,132 5,097 63,436 Total 250,326 80,057 63,564 59,832 14,444 19,560 43,896 531,679
(1) Excluding discontinued operations
Credit quality of consumer loans Loans and receivables consumer of EUR 104,200 million (2008: EUR 106,457 million) are not rated. An indication of the credit quality of these loans and receivables can be derived from the table below and the collateral obtained for the loans and receivables as well as the geographical breakdown of the underlying products of the portfolio as included in the earlier table within this note.
Credit quality of financial assets that are past due but not impaired The tables below show the analysis of the financial assets that are past due but not impaired:
31 December 2009 Loans and receivables - commercial Loans and receivables - consumer
31 December 2008 Loans and receivables - commercial Loans and receivables- consumer
Past due s 30 days
360 1,357
Past due s 30 days
191 1,554
Past due > 30- S90
122 635
Past due > 3o- sgo
da s
229 912
Past due Past due> 1 > 180 days- year
::; 1 ear
106 28 7 4 5 1
Past due Past due Past due> 1 > 90- :5180 > 180 days year
- s 1 ear
66 9 6 28 5 4
Total
623 2,002
Total
501 2,503
ABN AMRO does not disclose the fair value of collateral held as security or other credit enhancements on loans and advances past due but not impaired, or on individually assessed impaired loans and advances, as it is not practicable to do so.
158 ABN AMRO Holding N.V. Annual Report 2009
l_
r !
L
f: l~_·
-~
=
Section 6 - Financial Statements
Credit structuring ABN AMRO structures investments to provide specific risk profiles to investors. This may involve the sale of credit exposures, often by way of credit derivatives, to an entity which subsequently funds the credit exposures by issuing securities. These securities may initially be held by ABN AMRO prior to a sale to external parties.
Liquidity risk
Measurement and control Liquidity risk arises in any bank's general funding of its activities. For example, a bank may be unable to fund its portfolio of assets at appropriate maturities and rates, or may find itself unable to liquidate a position in a timely manner at a reasonable price. ABN AMRO holds capital to absorb unexpected losses, and manages liquidity to ensure that sufficient funds are available to meet not only the known cash funding requirements, but also any unanticipated ones that may arise. At all times, ABN AMRO maintains what we believe to be adequate levels of liquidity on a group-wide basis to meet deposit withdrawals, repay borrowings and fund new loans, even under stressed conditions.
ABN AMRO manages liquidity on a daily basis in all the countries in which it operates. Each national market is unique in terms of the scope and depth of its financial markets, competitive environment, products and customer profile. Therefore local line management is responsible for managing our local liquidity requirements under the supervision of Group Asset and Liability Management on behalf of the Group Asset and Liability Committee.
On a day-to-day basis ABN AMRO's liquidity management depends on, among other things, the effective functioning of local and international financial markets. As this is not always the case, group-wide contingency funding plans are in place. These plans are put into effect in the event of a dramatic change in the normal business activities or in the stability of the local or international financial markets. As part of this liquidity management contingency planning, ABN AMRO continually assess potential trends, demands, commitments, events and uncertainties that could reasonably result in increases or decreases in our liquidity. More specifically, ABN AMRO considers the impact of these potential changes on its sources of short-term funding and long-term liquidity planning.
As ABN AMRO has entered into committed credit facilities, the liquidity management process also involves assessing the potential effect of the contingencies inherent in these types of transactions on normal sources of liquidity and finance.
During the year the remainder of the multiseller conduits were transferred to RBS Group with only one own asset conduit remaining within ABN AMRO. The outstanding of this program as at 31 December 2009 was approximately EUR 8.7 billon (2008: EUR 17.8 billion)
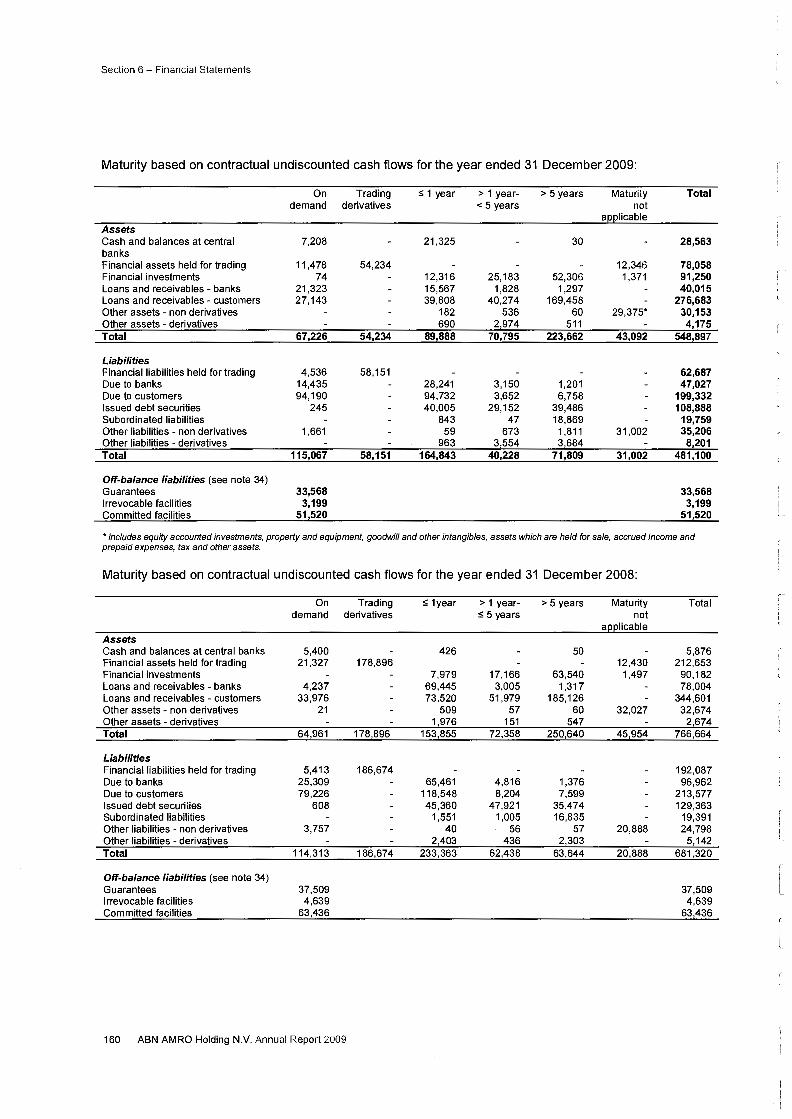
Maturity analysis of assets and liabilities The table below summarises the maturity profile of ABN AMRO's financial assets and liabilities as at 31 December. Trading derivatives are shown at fair value in a separate column. All derivatives used for hedging purposes are shown by maturity, based on their contractual remaining undiscounted cash flows. This is not consistent with how ABN AMRO looks at liquidity as the models used also take into account the expected behaviour of customers and other factors.
ABN AMRO Holding N.V. Annual Report 2009 159
Section 6- Financial Statements
Maturity based on contractual undiscounted cash flows for the year ended 31 December 2009:
On Trading :51 year > 1 year- > 5 years Maturity Total demand derivatives < 5 years not
a licable Assets Cash and balances at central 7,208 21,325 30 28,563 banks Financial assets held for trading 11,478 54,234 12,346 78,058 Financial investments 74 12,316 25,183 52,306 1,371 91,250 Loans and receivables - banks 21,323 15,567 1,828 1,297 40,015 Loans and receivables - customers 27,143 39,808 40,274 169,458 276,683 Other assets - non derivatives 182 536 60 29,375* 30,153 Other assets - derivatives 690 2,974 511 4,175 Total 67,226 54,234 89,888 70,795 223,662 43,092 548,897
Liabilities Financial liabilities held for trading 4,536 58,151 62,687 Due to banks 14,435 28,241 3,150 1,201 47,027 Due to customers 94,190 94,732 3,652 6,758 199,332 Issued debt securities 245 40,005 29,152 39,486 108,888 Subordinated liabilities 843 47 18,869 19,759 Other liabilities - non derivatives 1,661 59 673 1,811 31,002 35,206 Other liabilities - derivatives 963 3,554 3,684 8,201 Total 115,067 58,151 164,843 40,228 71,809 31,002 481,100
Off-balance liabilities (see note 34) Guarantees 33,568 33,568 Irrevocable facilities 3,199 3,199 Committed facilities 51,520 51,520 '-
• includes equity accounted investments, property and equipment, goodwill and other intangibles, assets which are held for sale, accrued income and prepaid expenses, tax and other assets.
Maturity based on contractual undiscounted cash flows for the year ended 31 December 2008:
On Trading :5 1year > 1 year- > 5 years Maturity Total demand derivatives ::; 5 years not
a licable Assets Cash and balances at central banks 5,400 426 50 5,876 Financial assets held for trading 21,327 178,896 12,430 212,653 Financial investments 7,979 17,166 63,540 1,497 90,182 Loans and receivables - banks 4,237 69,445 3,005 1,317 78,004 Loans and receivables - customers 33,976 73,520 51,979 185,126 344,601 Other assets - non derivatives 21 509 57 60 32,027 32,674 Other assets - derivatives 1,976 151 547 2,674 Total 64,961 178,896 153,855 72,358 250,640 45,954 766,664
Liabilities Financial liabilities held for trading 5,413 186,674 192,087 Due to banks 25,309 65,461 4,816 1,376 96,962 Due to customers 79,226 118,548 8,204 7,599 213,577 Issued debt securities 608 45,360 47,921 35,474 129,363 Subordinated liabilities 1,551 1,005 16,835 19,391 Other liabilities - non derivatives 3,757 40 56 57 20,888 24,798 Other liabilities - derivatives 2,403 436 2,303 5,142 Total 114,313 186,674 233,363 62,438 63,644 20,888 681,320
Off-balance liabilities (see note 34) Guarantees 37,509 37,509 Irrevocable facilities 4,639 4,639 Committed facilities 63,436 63,436
L
r
160 ABN AMRO Holding N.V. Annual Report 2009
f .. 1 l~·
F L
'"""' - j _,
' _j _J
=-!
=
Section 6- Financial Statements
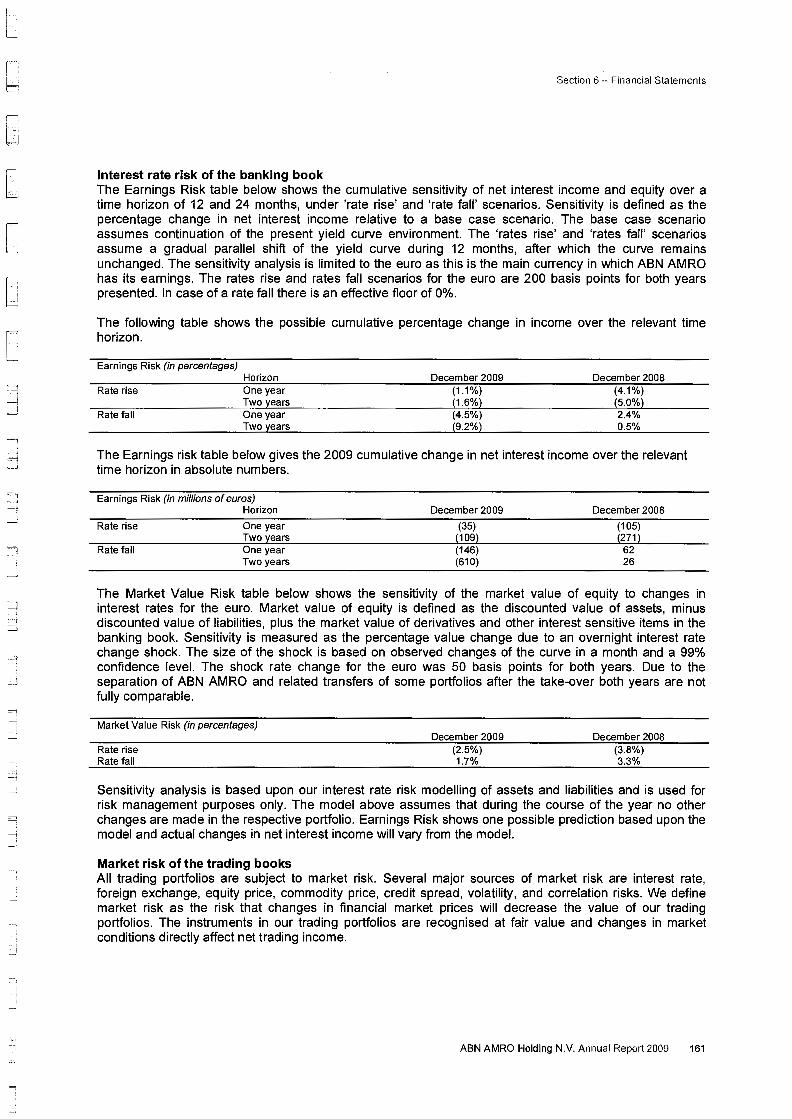
Interest rate risk of the banking book The Earnings Risk table below shows the cumulative sensitivity of net interest income and equity over a time horizon of 12 and 24 months, under 'rate rise' and 'rate fall' scenarios. Sensitivity is defined as the percentage change in net interest income relative to a base case scenario. The base case scenario assumes continuation of the present yield curve environment. The 'rates rise' and 'rates fall' scenarios assume a gradual parallel shift of the yield curve during 12 months, after which the curve remains unchanged. The sensitivity analysis is limited to the euro as this is the main currency in which ABN AMRO has its earnings. The rates rise and rates fall scenarios for the euro are 200 basis points for both years presented. In case of a rate fall there is an effective floor of 0%.
The following table shows the possible cumulative percentage change in income over the relevant time horizon.
Earnings Risk (in percentages)
Rate rise
Rate fall
Horizon One year Two years One year Two years
December 2009 (1.1%) (1.6%) (4.5%) (9.2%)
December 2008 (4.1%) (5.0%) 2.4% 0.5%
The Earnings risk table below gives the 2009 cumulative change in net interest income over the relevant time horizon in absolute numbers.
Earnings Risk (in millions of euros) Horizon
Rate rise
Rate fall
One year Two years One year Two years
December 2009
(35) (109) (146) (610)
December 2008
(105) (271)
62 26
The Market Value Risk table below shows the sensitivity of the market value of equity to changes in interest rates for the euro. Market value of equity is defined as the discounted value of assets, minus discounted value of liabilities, plus the market value of derivatives and other interest sensitive items in the banking book. Sensitivity is measured as the percentage value change due to an overnight interest rate change shock. The size of the shock is based on observed changes of the curve in a month and a 99% confidence level. The shock rate change for the euro was 50 basis points for both years. Due to the separation of ABN AMRO and related transfers of some portfolios after the take-over both years are not fully comparable.
Market Value Risk (in percentages)
Rate rise Rate fall
December 2009 (2.5%) 1.7%
December 2008 (3.8%) 3.3%
Sensitivity analysis is based upon our interest rate risk modelling of assets and liabilities and is used for risk management purposes only. The model above assumes that during the course of the year no other changes are made in the respective portfolio. Earnings Risk shows one possible prediction based upon the model and actual changes in net interest income will vary from the model.
Market risk of the trading books All trading portfolios are subject to market risk. Several major sources of market risk are interest rate, foreign exchange, equity price, commodity price, credit spread, volatility, and correlation risks. We define market risk as the risk that changes in financial market prices will decrease the value of our trading portfolios. The instruments in our trading portfolios are recognised at fair value and changes in market conditions directly affect net trading income.
ABN AMRO Holding N.V. Annual Report 2009 161
Section 6- Financial Statements
Measurement and control ABN AMRO applies a Value-at-Risk (VaR) methodology to estimate the market risk of its trading portfolios. ABN AMRO uses VaR as its primary tool for the day-to-day monitoring of market risks. The Group Asset and Liability Committee sets limits on the maximum level of VaR at an aggregate level. The risk committees may set VaR limits on lower aggregation levels.
Other control measures used in the market risk management process include historical and stress scenarios, limits on net open positions, interest rate sensitivity per basis point, spread sensitivities, option parameters, position concentrations, and position ageing.
Value-at-Risk VaR is a methodology for assessing market risk exposure in a single number. VaR is a statistical measure that estimates potential losses and is defined as the predicted loss that might be caused by changes in risk factors under normal circumstances, over a specified period of time, and at a specified level of statistical confidence. ABN AMRO uses a proprietary VaR model that has been approved by the DNB.
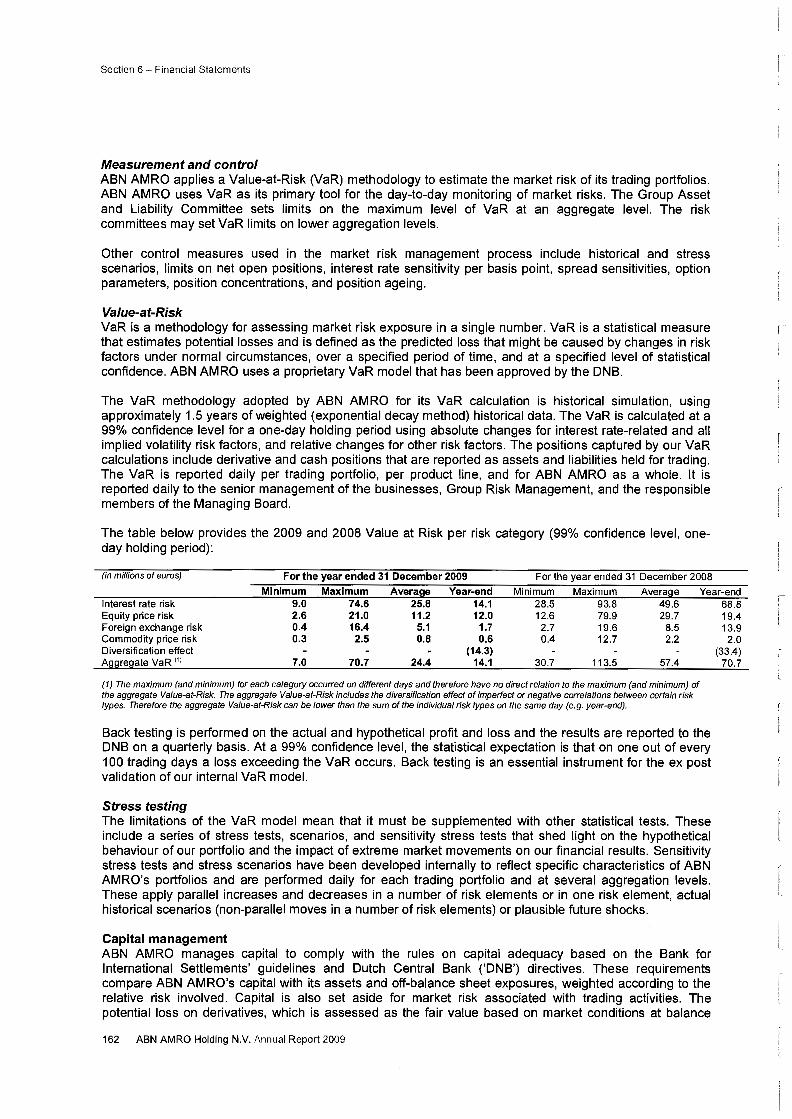
The VaR methodology adopted by ABN AMRO for its VaR calculation is historical simulation, using approximately 1.5 years of weighted (exponential decay method) historical data. The VaR is calculated at a 99% confidence level for a one-day holding period using absolute changes for interest rate-related and all implied volatility risk factors, and relative changes for other risk factors. The positions captured by our VaR calculations include derivative and cash positions that are reported as assets and liabilities held for trading. The VaR is reported daily per trading portfolio, per product line, and for ABN AMRO as a whole. It is reported daily to the senior management of the businesses, Group Risk Management, and the responsible members of the Managing Board.
The table below provides the 2009 and 2008 Value at Risk per risk category (99% confidence level, oneday holding period):
(in millions of euros) For the year ended 31 December 2009 For the year ended 31 December 2008
Minimum Maximum Average Year-end Minimum Maximum Avera~:~e Year-end Interest rate risk 9.0 74.6 25.8 14.1 28.5 93.8 49.6 Equity price risk 2.6 21.0 11.2 12.0 12.6 79.9 29.7 Foreign exchange risk 0.4 16.4 5.1 1.7 2.7 19.6 8.5 Commodity price risk 0.3 2.5 0.8 0.6 0.4 12.7 2.2 Diversification effect (14.3) A~:~~:~re~:~ate VaR <'> 7.0 70.7 24.4 14.1 30.7 113.5 57.4
(1) The maximum (and minimum) for each category occurred on different days and therefore have no direct relation to the maximum (and minimum) of the aggregate Value-at-Risk. The aggregate Value-at-Risk includes the diversification effect of imperfect or negative correlations between certain risk types. Therefore the aggregate Value-at-Risk can be lower than the sum of the individual risk types on the same day (e.g. year-end).
Back testing is performed on the actual and hypothetical profit and loss and the results are reported to the DNB on a quarterly basis. At a 99% confidence level, the statistical expectation is that on one out of every 1 00 trading days a loss exceeding the VaR occurs. Back testing is an essential instrument for the ex post validation of our internal VaR model.
Stress testing The limitations of the VaR model mean that it must be supplemented with other statistical tests. These include a series of stress tests, scenarios, and sensitivity stress tests that shed light on the hypothetical behaviour of our portfolio and the impact of extreme market movements on our financial results. Sensitivity stress tests and stress scenarios have been developed internally to reflect specific characteristics of ABN AMRO's portfolios and are performed daily for each trading portfolio and at several aggregation levels. These apply parallel increases and decreases in a number of risk elements or in one risk element, actual historical scenarios (non-parallel moves in a number of risk elements) or plausible future shocks.
Capital management ABN AMRO manages capital to comply with the rules on capital adequacy based on the Bank for International Settlements' guidelines and Dutch Central Bank ('DNB') directives. These requirements compare ABN AMRO's capital with its assets and off-balance sheet exposures, weighted according to the relative risk involved. Capital is also set aside for market risk associated with trading activities. The potential loss on derivatives, which is assessed as the fair value based on market conditions at balance
162 ABN AMRO Holding N.V. Annual Report 2009
68.8 19.4 13.9
2.0 (33.4)
70.7
r-
I
I
~-_]
_j
Section 6 - Financial Statements
sheet date, is increased by a percentage of the relevant notional amounts, depending on the nature and remaining term of the contract. This method takes into account the possible adverse development of the fair value during the remaining term of the contract.
The primary capital measure, referred to as Tier 1 capital' consists of shareholders' equity (net of gains/losses not recognised in income) and qualifying subordinated liabilities less goodwill and capital deductions. Tier 2 capital represents additional qualifying subordinated liabilities, taking into account the remaining maturities. Core tier 1 capital is tier 1 capital excluding qualifying subordinated liabilities.
Subsequent to its acquisition by RFS Holdings, ABN AMRO received approval for a transitional period from the DNB to report figures on the basis of Basel I until legal separation. In accordance with this, specific minimal requirements have been set for the tier 1 and total capital ratios, including a requirement to treat capital deductions in the same manner as required by Basel II.
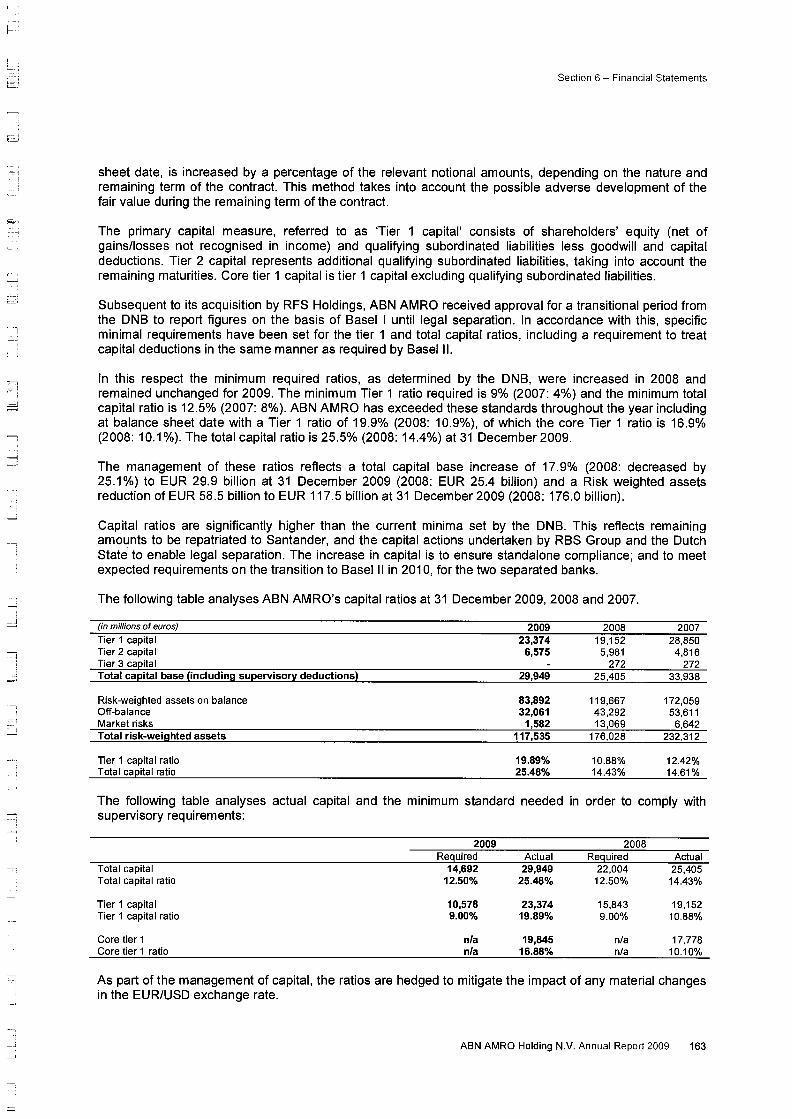
In this respect the minimum required ratios, as determined by the DNB, were increased in 2008 and remained unchanged for 2009. The minimum Tier 1 ratio required is 9% (2007: 4%) and the minimum total capital ratio is 12.5% (2007: 8%). ABN AMRO has exceeded these standards throughout the year including at balance sheet date with a Tier 1 ratio of 19.9% (2008: 1 0.9%), of which the core Tier 1 ratio is 16.9% (2008: 10.1 %). The total capital ratio is 25.5% (2008: 14.4%) at 31 December 2009.
The management of these ratios reflects a total capital base increase of 17.9% (2008: decreased by 25.1%) to EUR 29.9 billion at 31 December 2009 (2008: EUR 25.4 billion) and a Risk weighted assets reduction of EUR 58.5 billion to EUR 117.5 billion at 31 December 2009 (2008: 176.0 billion).
Capital ratios are significantly higher than the current minima set by the DNB. This reflects remaining amounts to be repatriated to Santander, and the capital actions undertaken by RBS Group and the Dutch State to enable legal separation. The increase in capital is to ensure standalone compliance; and to meet expected requirements on the transition to Basel II in 2010, for the two separated banks.
The following table analyses ABN AMRO's capital ratios at 31 December 2009, 2008 and 2007.
(in millions of euros) 2009 2008 2007 Tier 1 capital 23,374 19,152 28,850 Tier 2 capital 6,575 5,981 4,816 Tier 3 ca[!ital 272 272 Total capital base (including superviso~ deductions) 29,949 25,405 33,938
Risk-weighted assets on balance 83,892 119,667 172,059 Off-balance 32,061 43,292 53,611 Market risks 1,582 13,069 6,642 Total risk-weighted assets 117,535 176,028 232,312
Tier 1 capital ratio 19.89% 10.88% 12.42% Total ca[!ital ratio 25.48% 14.43% 14.61%
The following table analyses actual capital and the minimum standard needed in order to comply with supervisory requirements:
2009 2008 Reguired Actual Reguired Actual
Total capital 14,692 29,949 22,004 25,405 Total capital ratio 12.50% 25.48% 12.50% 14.43%
Tier 1 capital 10,578 23,374 15,843 19,152 Tier 1 capital ratio 9.00% 19.89% 9.00% 10.88%
Core tier 1 n/a 19,845 n/a 17,778 Core tier 1 ratio n/a 16.88% n/a 10.10%
As part of the management of capital, the ratios are hedged to mitigate the impact of any material changes in the EUR/USD exchange rate.
ABN AMRO Holding N.V. Annual Report 2009 163
Section 6- Financial Statements
ABN AMRO's investments in foreign operations in currencies other than the USD are hedged on a selective basis. Hedging is considered in cases where the expected currency loss is larger than the interest rate differential between the two currencies that represents the cost of the hedge.
The table shows the sensitivity of our equity capital to a 10% appreciation and 10% depreciation, respectively, in the euro against all foreign currencies.
(in millions of euros)
Euro appreciates 10% Euro depreciates 10%
39 Use of derivatives
Derivative instruments
2009 (259)
259
2008 312
(312)
ABN AMRO uses derivative instruments (a) to provide risk management solutions to its clients, (b) to manage ABN AMRO's own exposure to various risks (including interest, currency and credit risks) and (c) for proprietary trading purposes. A derivative is a financial instrument that is settled at a future date and requires little or no initial net investment, and whose value varies in response to changes in the price of another financial instrument, an index or some other variable.
The majority of derivative contracts are arranged as to amount ('notional'), tenor and price directly with the counterparty (over-the-counter). The remainder are standardised in terms of their amounts and settlement dates and are bought and sold in organised markets (exchange traded).
The notional, or contractual, amount of a derivative represents the reference quantity of the underlying financial instrument on which the derivative contract is based. The value of the derivative contract is typically determined by applying a calculated price to this notional amount, and is the basis upon which changes in the value of the contract are measured. The notional amount provides an indication of the underlying volume of business transacted by ABN AMRO but does not provide any measure of risk, and is not included on the balance sheet.
Positive and negative fair values on different transactions are only netted if the transactions are with the same counterparty and the cash flows will be settled on a net basis, and ABN AMRO has the legal right to offset separate transactions with that counterparty.
Types of derivative instruments The most common types of derivatives used are as follows:
Forwards are binding contracts to buy or sell financial instruments, most typically currency, on a future date at a specified price. Forward contracts are tailor-made agreements that are transacted between counterparties in the over-the-counter (OTC) market.
Futures are exchange traded agreements to buy or sell a standard quantity of specified grade or type of financial instrument, currency or commodity at a specified future date.
Commodity derivatives are contracts to buy or sell a non-financial item. They can be either exchange traded or OTC.
Swaps are agreements between two parties to exchange cash flows on a specified notional amount for a predetermined period. Most swaps are traded OTC. The major types of swap transactions undertaken by ABN AMRO are as follows: • Interest rate swap contracts - typically the contractual exchange of fixed and floating rate interest
payments in a single currency, based on a notional amount and a reference interest rate, most commonly LIBOR.
• Cross currency swaps - the exchange of interest payments based on two different currency principal balances and reference interest rates, and usually the exchange of principal amounts at the start and end of the contract.
164 ABN AMRO Holding N.V. Annual Report 2009
L
L
L
i L
r= 6
g ==-1
-=] ___ ) d =
' i
i :J
Section 6- Financial Statements
• Credit default swaps (CDSs) - bilateral agreements under which one party (protection buyer) makes one or more payments to the other party (protection seller) in exchange for an undertaking by the seller to make a payment to the buyer following a specified credit event. Credit default swaps may be on a single name (counterparty) or on a multiple (or basket) of names (counterparties). Settlement following a credit event may be a net cash amount, or cash in return for physical delivery of one or more obligations of the credit entity and is made regardless of whether the protection buyer has actually suffered a loss.
• Total rate of return swaps - these give the total return receiver exposure to all of the cash flows and economic benefits and risks of an underlying asset, without having to own the asset, in exchange for a series of payments, often based on a reference interest rate, such as LIBOR. The total return payer has an equal and opposite position. A specific type of total return swap is an equity swap.
Options are contractual agreements under which, typically, the seller (writer) grants the purchaser the right, but not the obligation, either to buy (call option) or to sell (put option) by or at a set date, a specified quantity of a financial instrument or commodity at a predetermined price. The purchaser pays a premium to the seller for this right. Options may be traded OTC or on a regulated exchange, and may be traded in the form of a security (warrant).
Derivatives transacted for trading purposes Most of the derivative transactions relate to sales and trading activities. Sales activities include the structuring and marketing of derivative products to customers to enable them to take, transfer, modify or reduce current or expected risks.
Trading activities are entered into principally for the purpose of generating profits from short-term fluctuations in price or margin, and include market-making, positioning and arbitrage activities: • Market making involves quoting bid and offer prices to other market participants with the intention of
generating income based on spread and volume • Positioning means managing market risk positions with the expectation of profiting from favourable
movements in prices, rates or indices • Arbitrage activities involve identifying and profiting from price differentials between markets and
products.
Derivatives transacted for hedging purposes ABN AMRO enters into derivative transactions for the purposes of hedging assets, liabilities, forecast transactions, cash flows and credit exposures. The accounting treatment of hedge transactions varies according to the nature of the instrument hedged and whether the hedge qualifies for accounting purposes (see accounting policies).
ABN AMRO also enters into derivative transactions which provide economic hedges for credit risk exposures but do not meet the requirements for hedge accounting treatment, for example, ABN AMRO uses CDSs as economic hedges for credit risk exposures in the loan and traded product portfolios, but generally do not apply hedge accounting to such positions.
Risks of derivative instruments Derivative instruments are transacted in many trading portfolios, which generally include several types of instruments, not just derivatives. The market risk of derivatives is managed and controlled as an integral part of the market risk of these portfolios. ABN AMRO's approach to market risk is described in the market risk section.
Derivative instruments are transacted with many different counterparties. The credit risk of derivatives is managed and controlled in the context of ABN AMRO's overall credit exposure to each counterparty. ABN AMRO's approach to credit risk is described in the financial credit risk section in note 38. It should be noted that although the values shown on the balance sheet can be an important component of ABN AMRO's credit exposure, the positive fair values for any one counterparty are rarely an adequate reflection of ABN AMRO's credit exposure on its derivatives business with that counterparty. This is because, on the one hand, fair values can increase over time ('potential future exposure'), while on the other hand, exposure may be mitigated by entering into master netting agreements and bilateral collateral arrangements with cou nterparties.
ABN AMRO Holding N.V. Annual Report 2009 165
Section 6- Financial Statements
40 Securitisations and other credit risk mitigants
As part of ABN AMRO's funding and credit risk mitigation activities, the cash flows of selected financial assets may be transferred to third parties for funding purposes. Substantially all financial assets included in these transactions are typically mortgage or other loan portfolios. The extent of ABN AMRO's continuing involvement in these financial assets varies by transaction.
Full recognition and continuing involvement ABN AMRO participates in sales transactions where financial assets and consequently the related cash flows are sold to a special purpose entity ('SPE'). When in these transactions neither substantially all risks and rewards nor control over the financial assets has been transferred, the entire asset continues to be recognised in the consolidated statement of financial position. In the case of sales transactions involving a consolidated SPE, the retained risks and rewards are usually an interest related spread and/or an exposure on first credit losses. The carrying amounts of the assets and associated liabilities approximated EUR 1,323 million, EUR 4,609 million, and EUR 5,437 million at 31 December 2009, 2008 and 2007, respectively. In the event of a credit downgrade ABN AMRO may be required to post additional collateral in respect of these transactions.
Additionally, ABN AMRO participates in various mortgage related transactions in the Netherlands that have been conducted without the involvement of an SPE. In these transactions, the derecognition criteria are not met and the entire asset continues to be recognised in the consolidated statement of financial position. ABN AMRO also retains exposure to certain interest rate risks. The carrying amounts of these mortgage assets and associated liabilities approximated EUR 146 million, EUR 151 million, and EUR 203 million at 31 December 2009, 2008 and 2007, respectively.
ABN AMRO has not participated in any transaction where partial derecognition of specified portions of an entire financial asset have occurred.
Synthetic transactions ABN AMRO has synthetic securitisations for an amount of EUR 119 billion (2008: EUR 111 billion). Through a synthetic securitisation ABN AMRO is able to buy obtain protection without the actual transfer of any assets to an SPE. As a result, ABN AMRO as the owner of the assets buys protection to transfer a part of the credit risk on a portfolio of assets to another entity that sells the protection. Although a substantial part of the credit risk related to these loan portfolios is transferred, actual ownership and continued recognition of the portfolio of assets remains with ABN AMRO. If an SPE is involved, the securities are issued by the SPE only, and the third party investors that hold the securities have only recourse to the assets of the SPE and not to ABN AMRO.
The 31 December 2009 balance includes a EUR 34.4 billion transaction entered into in August 2009 with the Dutch State to reduce the credit risk, through a CDS, on the Netherlands mortgage portfolio.
Credit default swaps and guarantees In addition to the transactions mentioned above, ABN AMRO also uses credit default swaps and guarantees to reduce credit risk for parts of the loan portfolio by selling these risks directly to the capital markets.
At 31 December 2009 ABN AMRO has bought credit protection, in the form of CDSs, for an amount of EUR 10,973 million (2008: EUR 23,413 million) directly from the capital markets. In order to mitigate the income statement volatility associated with the fair value changes of these credit default swaps and in line with ABN AMRO's risk appetite and hedging strategy, hedges of these credit default swaps are entered into that are based on credit risk indices. The correlation of these with the credit default swaps is monitored and the strategy is adapted where necessary.
On 26 November 2009, The Royal Bank of Scotland Group pic ('RBS Group') and The Royal Bank of Scotland pic ('RBS pic') signed an accession agreement to the UK Government's Asset Protection Scheme ('APS'). This scheme also encompasses some assets within the RBS acquired businesses of ABN AMRO. For these assets ABN AMRO has purchased credit protection through a guarantee and a CDS arrangement with RBS pic to strengthen the capital position and to de-risk future earnings. These
166 ABN AMRO Holding N.V. Annual Report 2009
r
L
L
' '
L
Fi L
[ .
h l_j
i
~
. !
Section 6- Financial Statements
arrangements relate to approximately EUR 30.0 billion of covered assets predominately commercial loan facilities.
41 Private equity investments
Private equity investments are either consolidated or held at fair value through income.
Consolidated private equity holdings Investments of a private equity nature that are controlled by ABN AMRO are consolidated. These holdings represent a wide range of non-banking activities. Personnel and other costs relating to production and manufacturing activities are presented within material expenses. The impact on the income statement of consolidating these investments is set out in the following table.
Income of consolidated private equity holdings Other income included in operating income Total operating income of consolidated private equity holdings
Goods and material expenses of consolidated private equity holdings Included in personnel expenses Included in administrative costs Included in depreciation and amortisation Total operating expenses Operating profit/(loss) before tax of consolidated private equity holdings
2009 436 (15) 421
228 107 73 14
422 (1)
2008 1,726
(45) 1,681
1,278 176 136 45
1,635 46
2007 3,836 (226) 3,610
2,744 390 332 168
3,634 (24)
Goods and material expenses include personnel costs relating to manufacturing and production activities.
The assets and liabilities of the consolidated holdings that are allocated to Central items are included in the balance sheet as assets and liabilities of businesses held for sale as ABN AMRO has a plan to sell these private equity investments. The total assets of these consolidated entities at 31 December 2009 were EUR 50 million (2008: EUR 435 million), excluding goodwill.
Unconsolidated private equity investments The private equity investments over which ABN AMRO does not have control are accounted for at fair value with changes through income. Although control is not with ABN AMRO, in many cases ABN AMRO has significant influence, usually evidenced by an equity stake of between 20% and 50%. Significant influence is held in approximately 18 (2008: 29) investments with a positive material fair value. The total fair value of these investments is EUR 244 million at 31 December 2009 (2008: EUR 271 million), operating in various sectors including information technology, life sciences, media and telecommunications.
ABN AMRO Holding N.V. Annual Report 2009 167
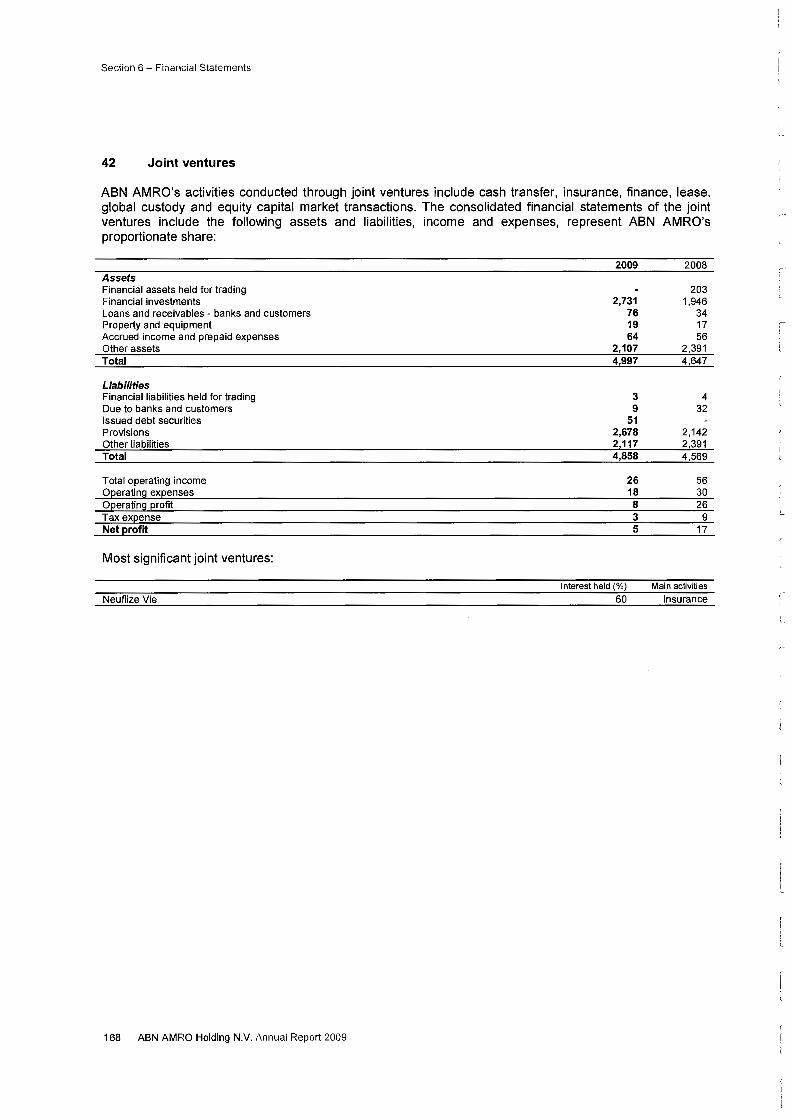
Section 6- Financial Statements
42 Joint ventures
ABN AMRO's activities conducted through joint ventures include cash transfer, insurance, finance, lease, global custody and equity capital market transactions. The consolidated financial statements of the joint ventures include the following assets and liabilities, income and expenses, represent ABN AMRO's proportionate share:
2009 2008 Assets Financial assets held for trading 203 Financial investments 2,731 1,946 Loans and receivables - banks and customers 76 34 Property and equipment 19 17 Accrued income and prepaid expenses 64 56 Other assets 2,107 2,391 Total 4,997 4,647
Liabilities Financial liabilities held for trading 3 4 Due to banks and customers 9 32 Issued debt securities 51 Provisions 2,678 2,142 Other liabilities 2,117 2,391 Total 4,858 4,569
Total operating income 26 56 O~eratin~J ex~enses 18 30 O~eratin~J ~rofit 8 26 Tax ex ense 3 9 Net profit 5 17
Most significant joint ventures:
Interest held(%) Main activities Neuflize Vie 60 Insurance
168 ABN AMRO Holding N.V. Annual Report 2009
I L
:_
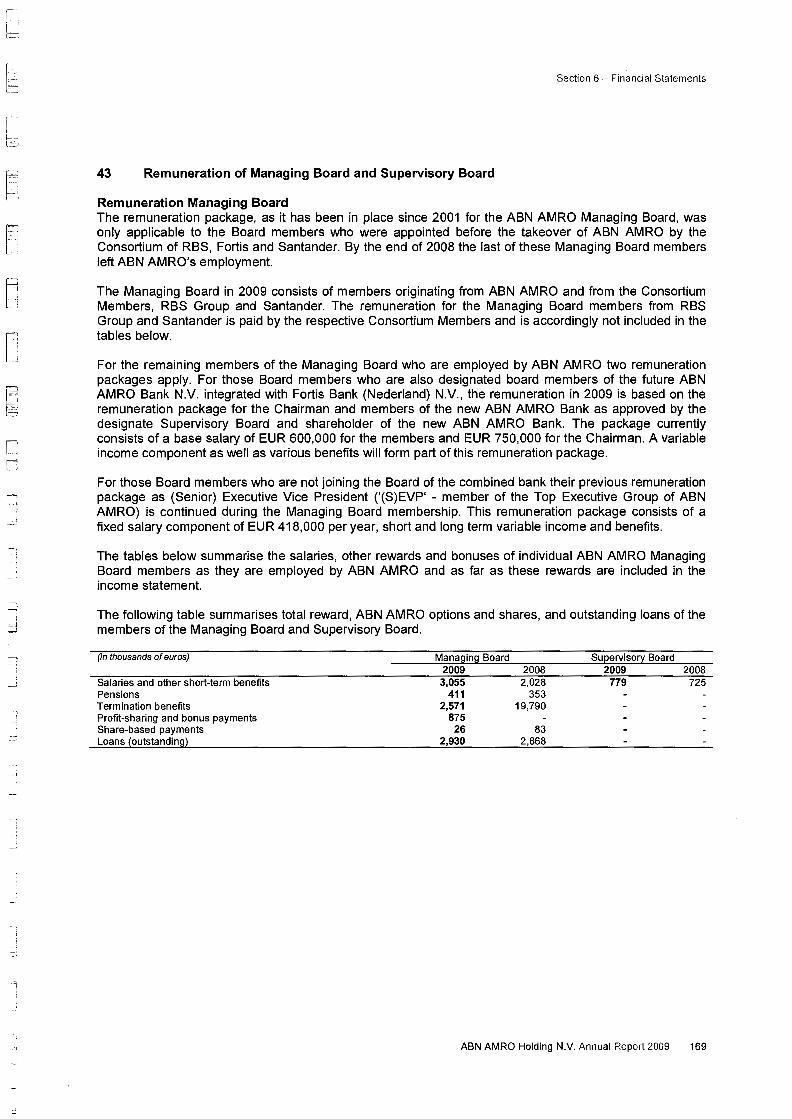
[
Section 6 -Financial Statements
43 Remuneration of Managing Board and Supervisory Board
Remuneration Managing Board The remuneration package, as it has been in place since 2001 for the ABN AMRO Managing Board, was only applicable to the Board members who were appointed before the takeover of ABN AMRO by the Consortium of RBS, Fortis and Santander. By the end of 2008 the last of these Managing Board members left ABN AMRO's employment.
The Managing Board in 2009 consists of members originating from ABN AMRO and from the Consortium Members, RBS Group and Santander. The remuneration for the Managing Board members from RBS Group and Santander is paid by the respective Consortium Members and is accordingly not included in the tables below.
For the remaining members of the Managing Board who are employed by ABN AMRO two remuneration packages apply. For those Board members who are also designated board members of the future ABN AMRO Bank N.V. integrated with Fortis Bank (Nederland) N.V., the remuneration in 2009 is based on the remuneration package for the Chairman and members of the new ABN AMRO Bank as approved by the designate Supervisory Board and shareholder of the new ABN AMRO Bank. The package currently consists of a base salary of EUR 600,000 for the members and EUR 750,000 for the Chairman. A variable income component as well as various benefits will form part of this remuneration package.
For those Board members who are not joining the Board of the combined bank their previous remuneration package as (Senior) Executive Vice President ('(S)EVP' - member of the Top Executive Group of ABN AMRO) is continued during the Managing Board membership. This remuneration package consists of a fixed salary component of EUR 418,000 per year, short and long term variable income and benefits.
The tables below summarise the salaries, other rewards and bonuses of individual ABN AMRO Managing Board members as they are employed by ABN AMRO and as far as these rewards are included in the income statement.
The following table summarises total reward, ABN AMRO options and shares, and outstanding loans of the members of the Managing Board and Supervisory Board.
(in thousands of euros)
Salaries and other short-term benefits Pensions Termination benefits Profit-sharing and bonus payments Share-based payments Loans (outstanding)
Managing Board 2009 3,055
411 2,571
875 26
2,930
2008 2,028
353 19,790
83 2,868
Supervisory Board 2009 2008
779 725
ABN AMRO Holding N.V. Annual Report 2009 169
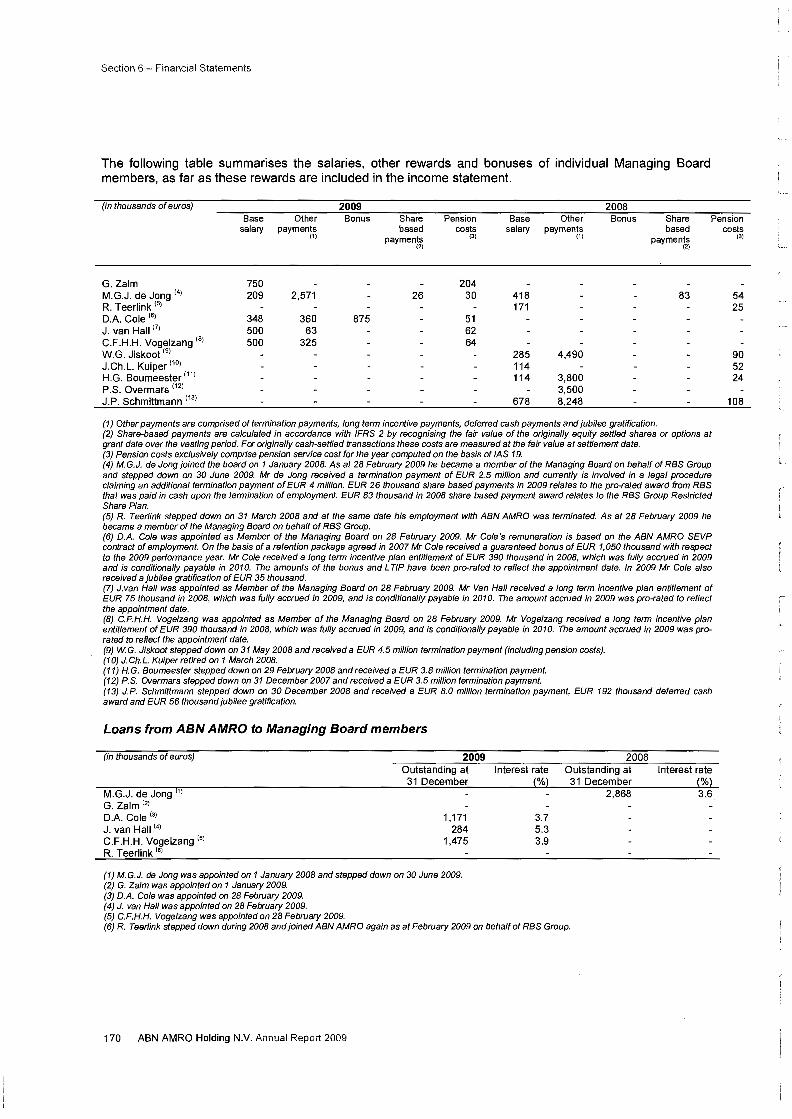
Section 6- Financial Statements
The following table summarises the salaries, other rewards and bonuses of individual Managing Board members, as far as these rewards are included in the income statement.
(in thousands of euros) 2009 2008 Base Other Bonus Share Pension Base Other Bonus Share Pension
salary payments based costs salary payments based (1) payments (3) (1)
paymeng; (2)
G.Zalm 750 204 M.G.J. de Jong 141 209 2,571 26 30 418 83 R. Teerlink 151 171 D.A. Cole 161 348 360 875 51 J. van Hall 171 500 63 62 C.F.H.H. Vogelzang 18
> 500 325 64 W.G. Jiskoot 191 285 4,490 J.Ch.L. Kuiper 1101 114 H.G. Boumeester 1111 114 3,800 P.S. Overmars 1121 3,500 J.P. Schmittmann 1131 678 8,248
(1) Other payments are comprised of termination payments, long term incentive payments, deferred cash payments and jubilee gratification. (2) Share-based payments are calculated in accordance with /FRS 2 by recognising the fair value of the originally equity settled shares or options at grant date over the vesting period. For originally cash-settled transactions these costs are measured at the fair value at settlement date. (3) Pension costs exclusively comprise pension service cost for the year computed on the basis of /AS 19. (4) M. G.J. de Jong joined the board on 1 January 2008. As at 28 February 2009 he became a member of the Managing Board on behalf of RBS Group and stepped down on 30 June 2009. Mr de Jong received a termination payment of EUR 2.5 million and currently is involved in a legal procedure claiming an additional termination payment of EUR 4 million. EUR 26 thousand share based payments in 2009 relates to the pro-rated award from RBS that was paid in cash upon the termination of employment. EUR 83 thousand in 2008 share based payment award relates to the RBS Group Restricted Share Plan. (5) R. Teerlink stepped down on 31 March 2008 and at the same date his employment with ABN AMRO was terminated. As at 28 February 2009 he became a member of the Managing Board on behalf of RBS Group. (6) D.A. Cole was appointed as Member of the Managing Board on 28 February 2009. Mr Cole's remuneration is based on the ABN AMRO SEVP contract of employment. On the basis of a retention package agreed in 2007 Mr Cole received a guaranteed bonus of EUR 1,050 thousand with respect to the 2009 performance year. Mr Cole received a long term incentive plan entitlement of EUR 390 thousand in 2008, which was fully accrued in 2009 and is conditionally payable in 2010. The amounts of the bonus and L TIP have been pro-rated to reflect the appointment date. In 2009 Mr Cole also received a jubilee gratification of EUR 35 thousand. (7) J.van Hall was appointed as Member of the Managing Board on 28 February 2009. Mr Van Hall received a long term incentive plan entitlement of EUR 75 thousand in 2008, which was fully accrued in 2009, and is conditionally payable in 2010. The amount accrued in 2009 was pro-rated to reflect the appointment date. (B) C.F.H.H. Vogelzang was appointed as Member of the Managing Board on 28 February 2009. Mr Vogelzang received a long term incentive plan entitlement of EUR 390 thousand in 2008, which was fully accrued in 2009, and is conditionally payable in 2010. The amount accrued in 2009 was prorated to reflect the appointment date. (9) W.G. Jiskoot stepped down on 31 May 2008 and received a EUR 4.5 million termination payment (including pension costs). (1 0) J. Ch.L. Kuiper retired on 1 March 2008. (11) H. G. Boumeester stepped down on 29 February 2008 and received a EUR 3.8 million termination payment. (12) P.S. Overmars stepped down on 31 December 2007 and received a EUR 3.5 million termination payment. (13) J.P. Schmittmann stepped down on 30 December 2008 and received a EUR 8.0 million termination payment, EUR 192 thousand deferred cash award and EUR 56 thousand jubilee gratification.
Loans from ABN AMRO to Managing Board members
(in thousands of euros)
M.G.J. de Jong 111
G. Zalm 121
D.A. Cole 131
J. van Hall 141
C.F.H.H. Vogelzang 151
R. Teerlink 1' 1
2009 Outstanding at 31 December
1,171 284
1,475
(1) M. G.J. de Jong was appointed on 1 January 2008 and stepped down on 30 June 2009. (2) G. Za/m was appointed on 1 January 2009. (3) D.A. Cole was appointed on 28 February 2009. (4) J. van Hall was appointed on 28 February 2009. (5) C.F.H.H. Vogelzang was appointed on 28 February 2009.
Interest rate (%)
3.7 5.3 3.9
2008 Outstanding at 31 December
2,868
(6) R. Teerlink stepped down during 2008 and joined ABN AMRO again as at February 2009 on behalf of RBS Group.
170 ABN AMRO Holding N.V. Annual Report 2009
Interest rate (%) 3.6
costs (3)
54 25
90 52 24
108
i L
L
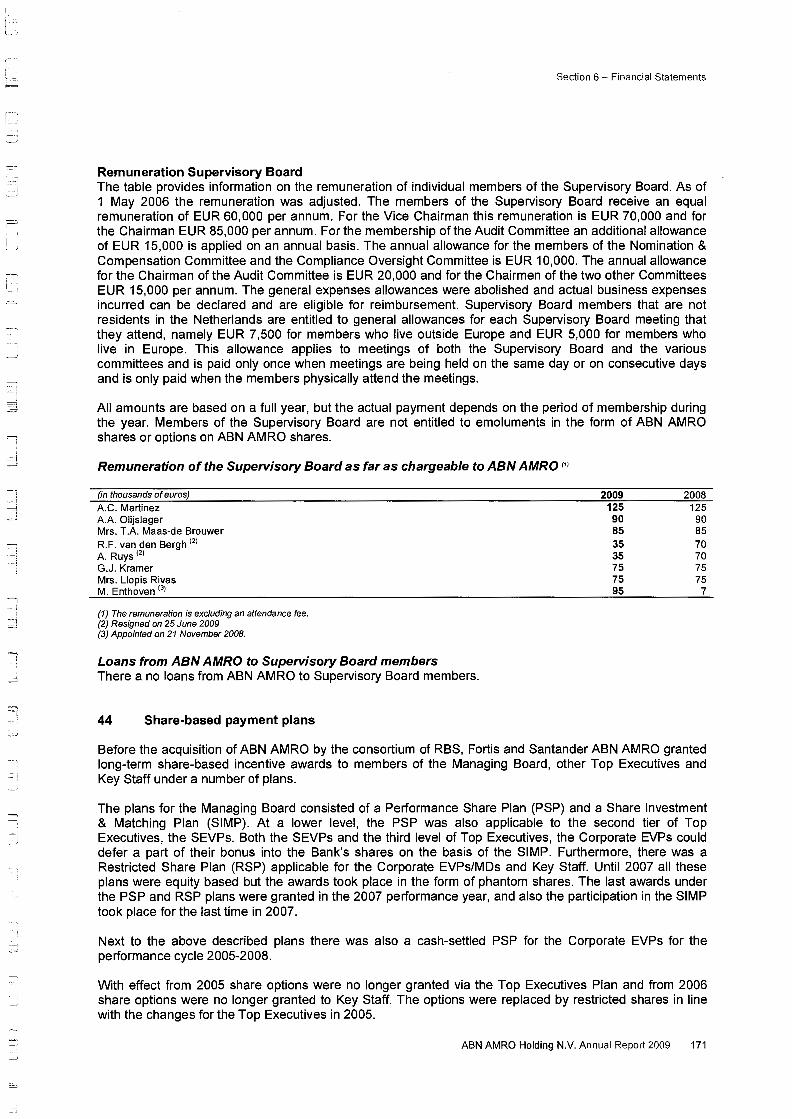
j
J
!
_j
Section 6- Financial Statements
Remuneration Supervisory Board The table provides information on the remuneration of individual members of the Supervisory Board. As of 1 May 2006 the remuneration was adjusted. The members of the Supervisory Board receive an equal remuneration of EUR 60,000 per annum. For the Vice Chairman this remuneration is EUR 70,000 and for the Chairman EUR 85,000 per annum. For the membership of the Audit Committee an additional allowance of EUR 15,000 is applied on an annual basis. The annual allowance for the members of the Nomination & Compensation Committee and the Compliance Oversight Committee is EUR 10,000. The annual allowance for the Chairman of the Audit Committee is EUR 20,000 and for the Chairmen of the two other Committees EUR 15,000 per annum. The general expenses allowances were abolished and actual business expenses incurred can be declared and are eligible for reimbursement. Supervisory Board members that are not residents in the Netherlands are entitled to general allowances for each Supervisory Board meeting that they attend, namely EUR 7,500 for members who live outside Europe and EUR 5,000 for members who live in Europe. This allowance applies to meetings of both the Supervisory Board and the various committees and is paid only once when meetings are being held on the same day or on consecutive days and is only paid when the members physically attend the meetings.
All amounts are based on a full year, but the actual payment depends on the period of membership during the year. Members of the Supervisory Board are not entitled to emoluments in the form of ABN AMRO shares or options on ABN AMRO shares.
Remuneration of the Supervisory Board as far as chargeable to ABN AMRO r>J
(in thousands of euros)
A.C. Martinez A.A. Olijslager Mrs. T.A. Maas-de Brouwer R.F. van den Bergh 121
A. Ruys 121
G.J. Kramer Mrs. Llopis Rivas M. Enthoven 131
(1) The remuneration is excluding an attendance fee. (2) Resigned on 25 June 2009 (3) Appointed on 21 November 2008.
Loans from ABN AMRO to Supervisory Board members There a no loans from ABN AMRO to Supervisory Board members.
44 Share-based payment plans
2009 2008 125 125 90 90 85 85 35 70 35 70 75 75 75 75 95 7
Before the acquisition of ABN AMRO by the consortium of RBS, Fortis and Santander ABN AMRO granted long-term share-based incentive awards to members of the Managing Board, other Top Executives and Key Staff under a number of plans.
The plans for the Managing Board consisted of a Performance Share Plan (PSP) and a Share Investment & Matching Plan (SIMP). At a lower level, the PSP was also applicable to the second tier of Top Executives, the SEVPs. Both the SEVPs and the third level of Top Executives, the Corporate EVPs could defer a part of their bonus into the Bank's shares on the basis of the SIMP. Furthermore, there was a Restricted Share Plan (RSP) applicable for the Corporate EVPs/MDs and Key Staff. Until 2007 all these plans were equity based but the awards took place in the form of phantom shares. The last awards under the PSP and RSP plans were granted in the 2007 performance year, and also the participation in the SIMP took place for the last time in 2007.
Next to the above described plans there was also a cash-settled PSP for the Corporate EVPs for the performance cycle 2005-2008.
With effect from 2005 share options were no longer granted via the Top Executives Plan and from 2006 share options were no longer granted to Key Staff. The options were replaced by restricted shares in line with the changes for the Top Executives in 2005.
ABN AMRO Holding N.V. Annual Report 2009 171
Section 6- Financial Statements
All outstanding awards and options under the Bank's L TIPs were cash settled on 17 October 2007 as a consequence of the take over of ABN AMRO. The total settlement amounted to EUR 1,013 million of which EUR 442 million related to share options, EUR 301 million to originally equity settled share plans and EUR 270 million to phantom shares. With respect to the calculation of the cash settlement amount, the value of an ABN AMRO share was the value of a tendered share on the settlement date, 17 October 2007. This value resulted in EUR 35.60 plus EUR 2.28 representing the value of 0,296 RBS share against the closing price of the RBS share on 17 October 2007. The value (further referred to as Settlement Price) per ABN AMRO Holding N.V. share (a 'Share') thus resulted in EUR 37.88.
172 ABN AMRO Holding N.V. Annual Report 2009
l
r
l_
I l
,-
i
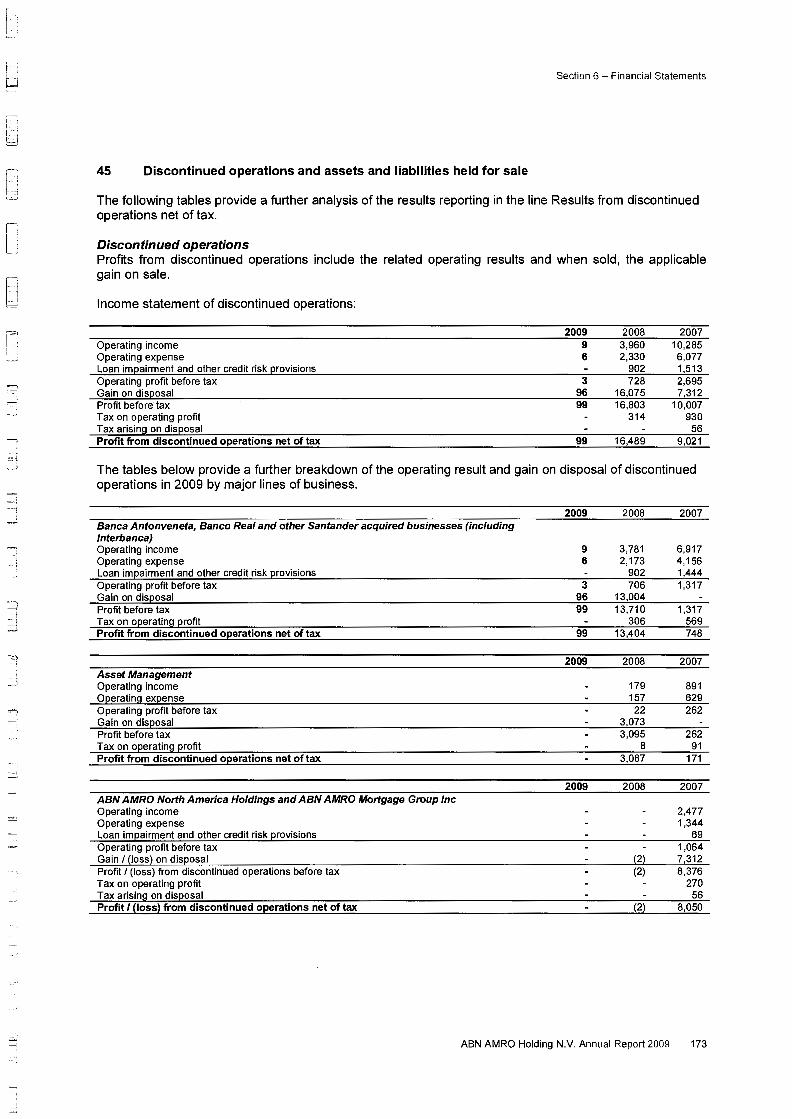
l ...
~
[: . . . )
i
~
--i
Section 6 - Financial Statements
45 Discontinued operations and assets and liabilities held for sale
The following tables provide a further analysis of the results reporting in the line Results from discontinued operations net of tax.
Discontinued operations Profits from discontinued operations include the related operating results and when sold, the applicable gain on sale.
Income statement of discontinued operations:
Operating income Operating expense Loan impairment and other credit risk provisions Operating profit before tax Gain on disposal Profit before tax Tax on operating profit Tax arising on disposal Profit from discontinued operations net of tax
2009 9 6
3 96 99
99
2008 3,960 2,330
902 728
16,075 16,803
314
16,489
2007 10,285 6,077 1,513 2,695 7,312
10,007 930 56
9,021
The tables below provide a further breakdown of the operating result and gain on disposal of discontinued operations in 2009 by major lines of business.
Banca Antonveneta, Banco Real and other Santander acquired businesses (including lnterbanca) Operating income Operating expense Loan impairment and other credit risk provisions Operating profit before tax Gain on disposal Profit before tax Tax on operating profit Profit from discontinued operations net of tax
Asset Management Operating income Operating expense Operating profit before tax Gain on disposal Profit before tax Tax on operating profit Profit from discontinued operations net of tax
ABN AMRO North America Holdings and ABN AMRO Mortgage Group Inc Operating income Operating expense Loan impairment and other credit risk provisions Operating profit before tax Gain I (loss) on disposal Profit I (loss) from discontinued operations before tax Tax on operating profit Tax arising on disposal Profit I (loss) from discontinued operations net of tax
2009
9 6
3 96 99
99
2009
2009
2008
3,781 2,173
902 706
13,004 13,710
306 13,404
2008
179 157
22 3,073 3,095
8 3,087
2008
(2) (2)
(2)
ABN AMRO Holding N.V. Annual Report 2009
2007
6,917 4,156 1,444 1,317
1,317 569 748
2007
891 629 262
262 91
171
2007
2,477 1,344
69 1,064 7,312 8,376
270 56
8,050
173
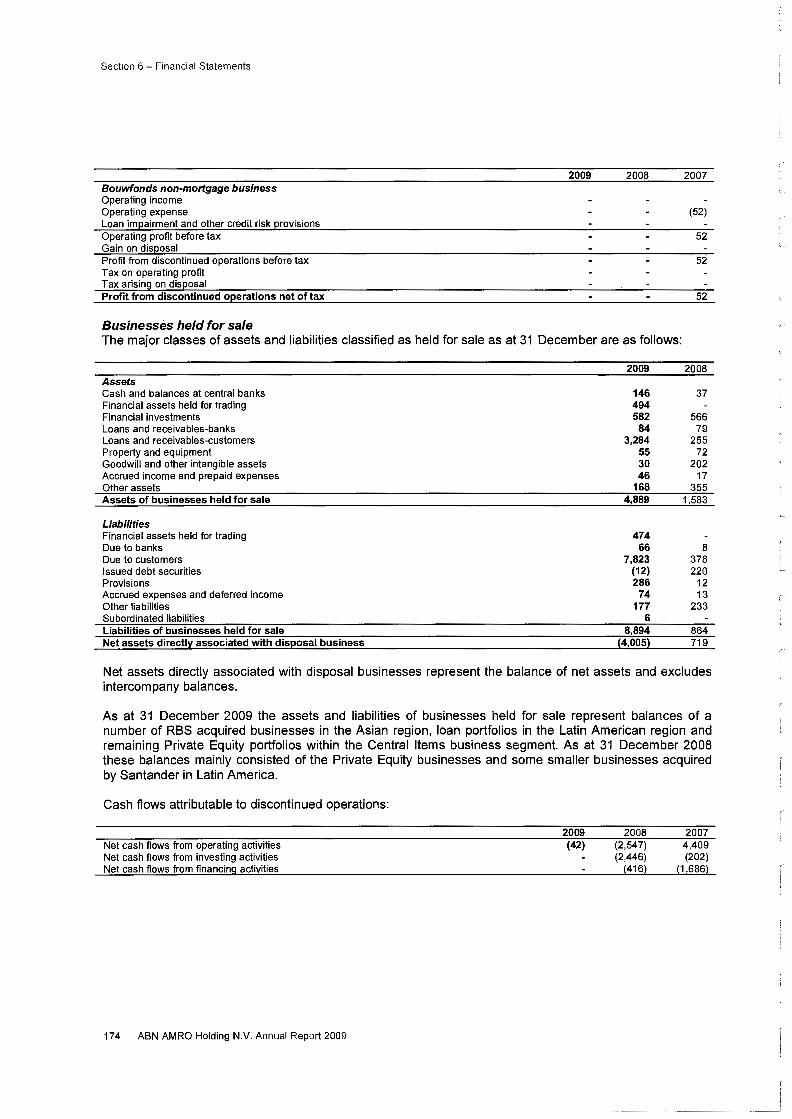
Section 6- Financial Statements
Bouwfonds non-mortgage business Operating income Operating expense Loan impairment and other credit risk provisions Operating profit before tax Gain on disposal Profit from discontinued operations before tax Tax on operating profit Tax arising on disposal Profit from discontinued operations net of tax
Businesses held for sale
2009 2008 2007
(52)
52
52
52
The major classes of assets and liabilities classified as held for sale as at 31 December are as follows:
2009 2008 Assets Cash and balances at central banks 146 37 Financial assets held for trading 494 Financial investments 582 566 Loans and receivables-banks 84 79 Loans and receivables-customers 3,284 255 Property and equipment 55 72 Goodwill and other intangible assets 30 202 Accrued income and prepaid expenses 46 17 Other assets 168 355 Assets of businesses held for sale 4,889 1,583
Liabilities Financial assets held for trading 474 Due to banks 66 8 Due to customers 7,823 378 Issued debt securities (12) 220 Provisions 286 12 Accrued expenses and deferred income 74 13 Other liabilities 177 233 Subordinated liabilities 6 Liabilities of businesses held for sale 8,894 864 Net assets directl~ associated with disposal business {4,005} 719
Net assets directly associated with disposal businesses represent the balance of net assets and excludes intercompany balances.
As at 31 December 2009 the assets and liabilities of businesses held for sale represent balances of a number of RBS acquired businesses in the Asian region, loan portfolios in the Latin American region and remaining Private Equity portfolios within the Central Items business segment. As at 31 December 2008 these balances mainly consisted of the Private Equity businesses and some smaller businesses acquired by Santander in Latin America.
Cash flows attributable to discontinued operations:
Net cash flows from operating activities Net cash flows from investing activities Net cash flows from financing activities
174 ABN AMRO Holding N.V. Annual Report 2009
2009 (42)
2008 (2,547) (2,446)
(416)
2007 4,409 (202)
(1 ,686)
L
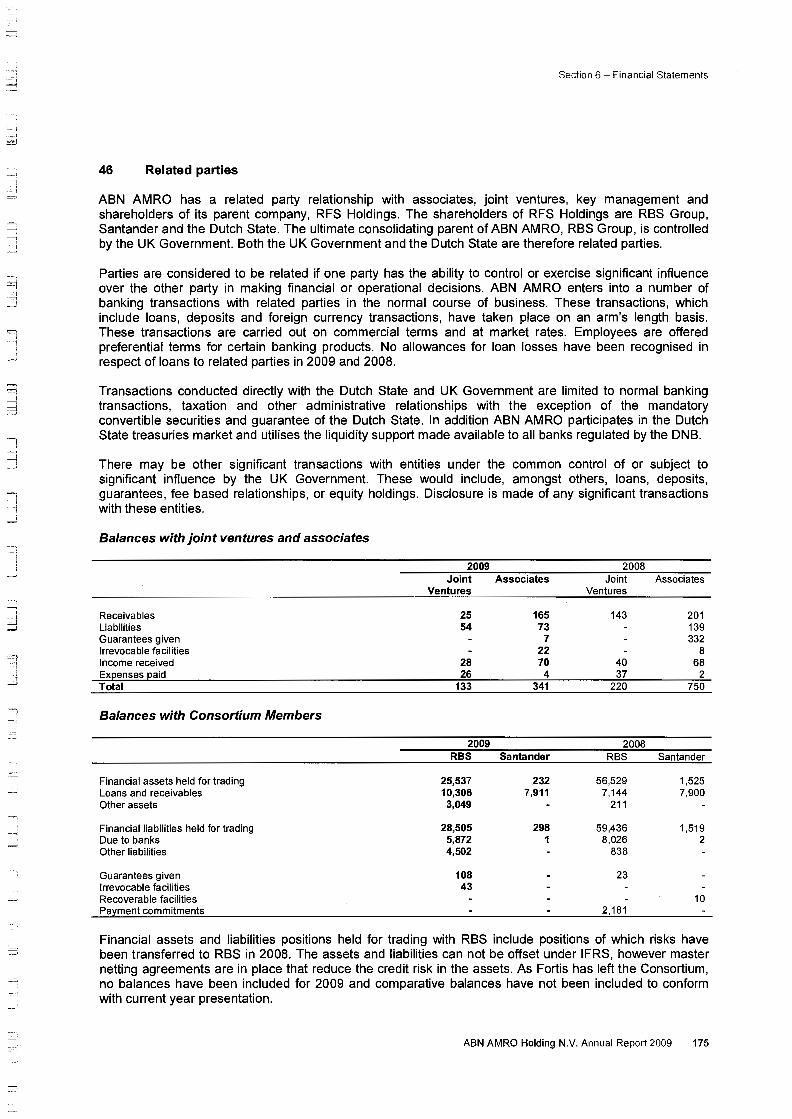
i ---, d
~
' J c_j -'
=1 ""J
J
I
•_o l
__;
Section 6- Financial Statements
46 Related parties
ABN AMRO has a related party relationship with associates, joint ventures, key management and shareholders of its parent company, RFS Holdings. The shareholders of RFS Holdings are RBS Group, Santander and the Dutch State. The ultimate consolidating parent of ABN AMRO, RBS Group, is controlled by the UK Government. Both the UK Government and the Dutch State are therefore related parties.
Parties are considered to be related if one party has the ability to control or exercise significant influence over the other party in making financial or operational decisions. ABN AMRO enters into a number of banking transactions with related parties in the normal course of business. These transactions, which include loans, deposits and foreign currency transactions, have taken place on an arm's length basis. These transactions are carried out on commercial terms and at market rates. Employees are offered preferential terms for certain banking products. No allowances for loan losses have been recognised in respect of loans to related parties in 2009 and 2008.
Transactions conducted directly with the Dutch State and UK Government are limited to normal banking transactions, taxation and other administrative relationships with the exception of the mandatory convertible securities and guarantee of the Dutch State. In addition ABN AMRO participates in the Dutch State treasuries market and utilises the liquidity support made available to all banks regulated by the DNB.
There may be other significant transactions with entities under the common control of or subject to significant influence by the UK Government. These would include, amongst others, loans, deposits, guarantees, fee based relationships, or equity holdings. Disclosure is made of any significant transactions with these entities.
Balances with joint ventures and associates
2009 Joint
Ventures
Receivables 25 Liabilities 54 Guarantees given Irrevocable facilities Income received 28 ExJ:!enses J:!aid 26 Total 133
Balances with Consortium Members
2009 RBS
Financial assets held for trading 25,537 Loans and receivables 10,306 Other assets 3,049
Financial liabilities held for trading 28,505 Due to banks 5,872 Other liabilities 4,502
Guarantees given 108 Irrevocable facilities 43 Recoverable facilities Payment commitments
2008 Associates Joint
Ventures
165 143 73
7 22 70 40 4 37
341 220
2008 Santander RBS
232 56,529 7,911 7,144
211
298 59,436 1 8,026
838
23
2,181
Associates
201 139 332
8 68
2 750
Santander
1,525 7,900
1,519 2
10
Financial assets and liabilities positions held for trading with RBS include positions of which risks have been transferred to RBS in 2008. The assets and liabilities can not be offset under IFRS, however master netting agreements are in place that reduce the credit risk in the assets. As Fortis has left the Consortium, no balances have been included for 2009 and comparative balances have not been included to conform with current year presentation.
ABN AMRO Holding N.V. Annual Report 2009 175
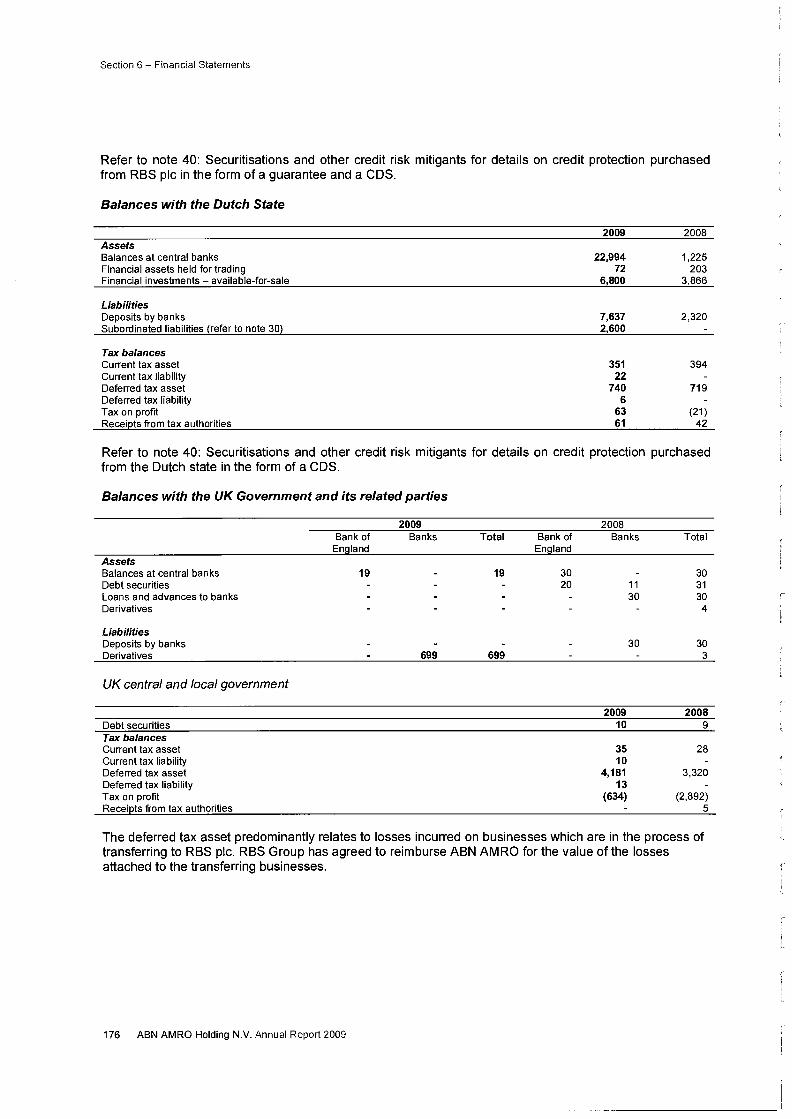
Section 6- Financial Statements
Refer to note 40: Securitisations and other credit risk mitigants for details on credit protection purchased from RBS pic in the form of a guarantee and a CDS.
Balances with the Dutch State
2009 2008 Assets Balances at central banks 22,994 1,225 Financial assets held for trading 72 203 Financial investments - available-for-sale 6,800 3,866
Liabilities Deposits by banks 7,637 2,320 Subordinated liabilities (refer to note 30) 2,600
Tax balances Current tax asset 351 394 Current tax liability 22 Deferred tax asset 740 719 Deferred tax liability 6 Tax on profit 63 (21) Recei(;!tS from tax authorities 61 42
Refer to note 40: Securitisations and other credit risk mitigants for details on credit protection purchased from the Dutch state in the form of a CDS.
Balances with the UK Government and its related parties
Assets Balances at central banks Debt securities Loans and advances to banks Derivatives
Liabilities Deposits by banks Derivatives
UK central and local government
Debt securities Tax balances Current tax asset Current tax liability Deferred tax asset Deferred tax liability Tax on profit Recei(;!tS from tax authorities
2009 Bank of Banks
En land
19
699
Total Bank of En land
19 30 20
699
2008 Banks Total
30 11 31 30 30
4
30 30 3
2009 2008 10 9
35 28 10
4,181 3,320 13
(634) (2,892) 5
The deferred tax asset predominantly relates to losses incurred on businesses which are in the process of transferring to RBS pic. RBS Group has agreed to reimburse ABN AMRO for the value of the losses attached to the transferring businesses.
176 ABN AMRO Holding N.V. Annual Report 2009
l_
,-;
L
(
' -· _J
' ' ::::!
-_-!
Section 6- Financial Statements
47 Post balance sheet events
On 5 February 2010 ABN AMRO made a distribution of EUR 7.5 billion of capital to the parent of ABN AMRO Holding, RFS Holdings B.V., for the benefit of Santander. The boards of ABN AMRO Holding have furthermore resolved to make a further distribution for an amount in the range of EUR 1.2 to 1.5 billion for the benefit of Santander, subject to Dutch Central Bank approval, immediately before legal separation. After such further distribution, the indirect interest of Santander in ABN AMRO will have decreased to its share in the remaining Shared Assets.
On 6 February 2010 the ABN AMRO Group announced the legal renaming of ABN AMRO Bank N.V. to The Royal Bank of Scotland N.V.
On 8 February 2010 ABN AMRO announced that on 6 February 2010, the businesses of ABN AMRO acquired by the Dutch State were legally demerged from the RBS acquired businesses in accordance with the demerger filing as lodged with the Chamber of Commerce on 30 September 2009. As a result, there are now two separate banks within ABN AMRO Holding N.V., The Royal Bank of Scotland N.V. ('RBS N.V.') and the new entity named ABN AMRO Bank N.V., each licensed separately by the Dutch Central Bank. Both banks are governed by the current managing and supervisory boards of ABN AMRO Holding N.V. until the legal separation of the new ABN AMRO Bank N.V. from ABN AMRO Holding N.V.
On 11 March 2010 a request for a Declaration of Non-Objection ('DNO') on the separation of ABN AMRO Bank N.V. from ABN AMRO Holding NV by means of sale to ABN AMRO Group N.V. was submitted to the DNB. The sale is planned to be executed on 1 April 2010.
On 4 January 2010 the RBS Group announced the lapse of sale of the sale of The Royal Bank of Scotland Limited (RBS Pakistan) to MCB Bank Limited (MCB). The RBS Group continues to pursue the sale of the Pakistan operations with other buyers.
On 8 January 2010 the RBS Group and ABN Bank N.V. reached an agreement to sell to The Bank of America certain offshore loans, loan participations, credit facilities or other extensions of credit generated by or related to its operations in Argentina, Chile and Venezuela. A loss relating to this sale of EUR 179 million was recognized in the 2009 results.
There have been no other significant events between the year end and the date of approval of these accounts which would require a change to or disclosure in the accounts.
ABN AMRO Holding N.V. Annual Report 2009 177
Section 6- Financial Statements
48 Major subsidiaries and participating interests
Unless otherwise stated, ABN AMRO's interest is 100% or almost 100%, on 17 March 2010. Those major subsidiaries and participating interests that are not 100% consolidated but are accounted for under the equity method (a) or proportionally consolidated (b) are indicated separately. For renamed entities, the entity names used are those applicable as at 26 March 2010.
As at 31 December 2009, ABN AMRO Holding had two subsidiaries: ABN AMRO Bank N.V. and ABN AMRO II N.V. renamed ABN AMRO Bank N.V. on 6 February 2010. ABN AMRO II N.V. did not have any subsidiaries as at 31 December 2009.
On 6 February 2010, the majority of the businesses acquired by the Dutch State were legally demerged from ABN AMRO Bank N.V. Effective at the same date, the existing legal entity, ABN AMRO Bank N.V. was renamed The Royal Bank of Scotland N.V. and the legal entity into which the Dutch State acquired businesses were demerged was also renamed from ABN AMRO II N.V. to ABN AMRO Bank N.V. (the 'new ABN AMRO Bank').
The Royal Bank of Scotland N.V., Amsterdam (formerly ABN AMRO Bank N.V.), Amsterdam
Netherlands RBS Ventures II B.V., Amsterdam RBS Participaties B.V., Amsterdam Hollandsche Bank-Unie N.V., Rotterdam
Europe (Outside the Netherlands) RBS Global Banking (Luxembourg) SA, Luxembourg RBS Bank (Polska) SA, Warsaw RBS Bank (Romania) SA, Bucharest The Royal Bank of Scotland ZAO, Moscow RBS Corporate Finance Limited, London CM Capital Markets Holding SA, Madrid (45.20%) (a) RBS Hoare Govett Limited, London
North America RBS Capital Markets (Canada) Limited., Toronto The Royal Bank of Scotland Mexico SA lnstitucion de Banca Multiple, Mexico City RBS WCS Holding Company, New York RBS Capital (USA) LLC, Chicago
South America The Royal Bank of Scotland (Chile), Santiago de Chile The Royal Bank of Scotland (Colombia) SA, Bogota RBS Securities (Venezuela) CA, Caracas RBS Finance (Chile) SA, Santiago de Chile RBS Securitizadora SA, Santiago de Chile
Rest of the World RBS Asia Limited, Hong Kong RBS Asia Corporate Finance Ltd., Hong Kong The Royal Bank of Scotland Berhad, Kuala Lumpur ABN AMRO Bank (China) Co. Ltd., Shanghai ABN AMRO Leasing (China) Co. Ltd., Beijing JSC SB RBS (Kazakhstan) Ltd., Almaty (80%) Royal Bank of Scotland Uzbekistan MB, Tashkent (58.82%) The Royal Bank of Scotland Limited, Karachi (99.22%) RBS Business Services Private Limited, Mumbai RBS Financial Services (India) Private Limited, Mumbai The Royal Bank of Scotland Securities (Kazakhstan) JSC, Almaty
178 ABN AMRO Holding NV Annual Report 2009
l
r I
I L.
l
! l
r l L
I I
- ' -=----1 -'
RBS Group (Australia) Pty Limited, Sydney RBS Asset Securitisation (Australia) Pty Limited, Sydney RBS Corporate Finance (Australia) Limited, Sydney RBS Nominees (Australia) Pty Limited., Sydney RBS Equities (Australia) Limited, Sydney RBS Equity Capital Markets (Australia) Limited, Sydney RBS Funds Management (Australia) Limited, Sydney RBS Group (New Zealand) Limited, Auckland RBS (New Zealand) Limited, Auckland Saudi Hollandi Bank, Riyadh (40%) (a)
ABN AMRO Bank N.V. (formerly ABN AMRO II N.V.), Amsterdam
Netherlands AA lnterfinance B.V., Amsterdam ABN AMRO Arbo Services B.V., Amsterdam ABN AMRO Groenbank B.V., Amsterdam ABN AMRO Hypotheken Groep B.V., Amersfoort ABN AMRO Jonge Bedrijven Fonds B.V., Amsterdam ABN AMRO Participaties Fund I B.V., Amsterdam Altajo B.V., Amsterdam (50%) (b) Amstel Lease Maatschappij N.V., Utrecht Delta Lloyd ABN AMRO Verzekeringen Holding B.V., Zwolle (49%) (a) IFN Group B.V., Rotterdam MoneYou B.V., Hoevelaken New HBU II N.V., Amstelveen Solveon lncasso B.V., Utrecht Stater N.V., Amersfoort
Rest of the World ABN AMRO Bank (Luxembourg) S.A., Luxembourg ABN AMRO Bank (Switzerland) A.G., Zurich ABN AMRO Life Capital Belgium N.V., Brussels ABN AMRO Life S.A., Luxembourg Banque Neuflize OBC SA, Paris (99.86%) DelbrOck Bethmann Maffei AG, Frankfurt am Main Neuflize Vie (60%), Paris
Section 6- Financial Statements
The list of participating interests for which statements of liability have been issued, has been filed with the Chamber of Commerce in Amsterdam.
The majority of the ABN AMRO's subsidiaries and participating investments are regulated entities and therefore their ability to transfer funds to ABN AMRO is subject to regulatory approvals.
ABN AMRO Holding N.V. Annual Report 2009 179
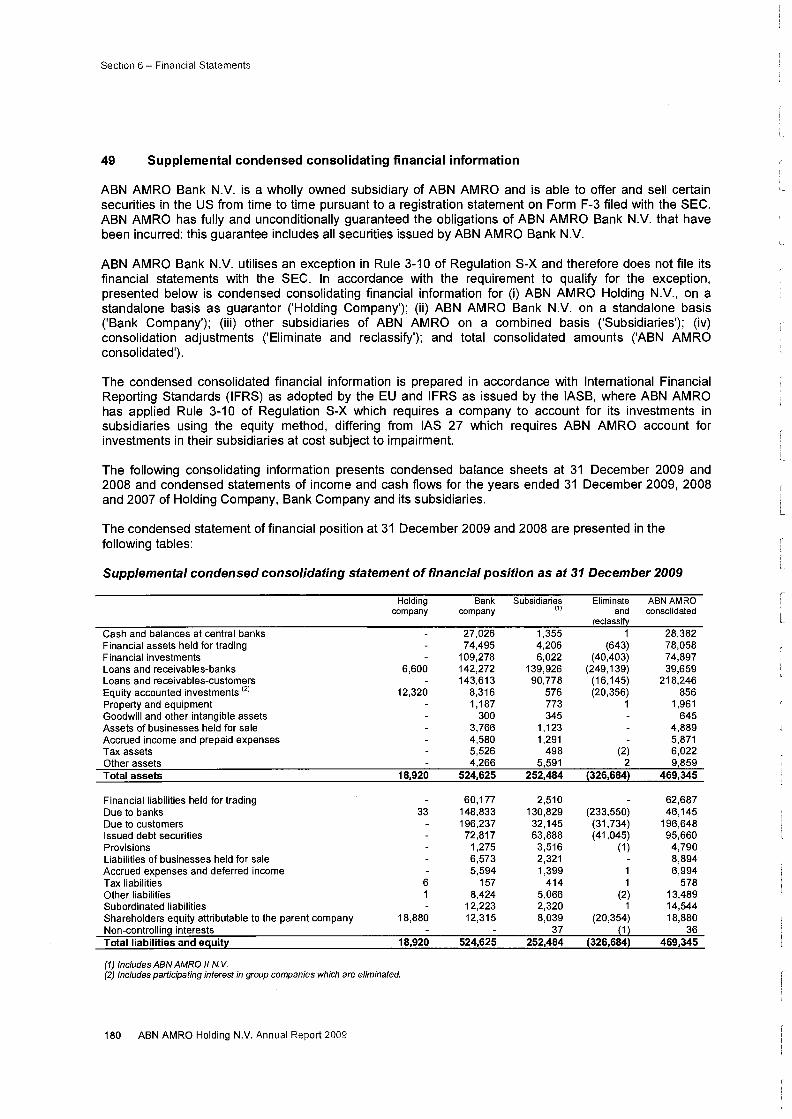
Section 6- Financial Statements
49 Supplemental condensed consolidating financial information
ABN AMRO Bank N.V. is a wholly owned subsidiary of ABN AMRO and is able to offer and sell certain securities in the US from time to time pursuant to a registration statement on Form F-3 filed with the SEC. ABN AMRO has fully and unconditionally guaranteed the obligations of ABN AMRO Bank N.V. that have been incurred: this guarantee includes all securities issued by ABN AMRO Bank N.V.
ABN AMRO Bank N.V. utilises an exception in Rule 3-10 of Regulation S-X and therefore does not file its financial statements with the SEC. In accordance with the requirement to qualify for the exception, presented below is condensed consolidating financial information for (i) ABN AMRO Holding N.V., on a standalone basis as guarantor ('Holding Company'); (ii) ABN AMRO Bank N.V. on a standalone basis ('Bank Company'); (iii) other subsidiaries of ABN AMRO on a combined basis ('Subsidiaries'); (iv) consolidation adjustments ('Eliminate and reclassify'); and total consolidated amounts ('ABN AMRO consolidated').
The condensed consolidated financial information is prepared in accordance with International Financial Reporting Standards (IFRS) as adopted by the EU and IFRS as issued by the IASB, where ABN AMRO has applied Rule 3-10 of Regulation S-X which requires a company to account for its investments in subsidiaries using the equity method, differing from lAS 27 which requires ABN AMRO account for investments in their subsidiaries at cost subject to impairment.
The following consolidating information presents condensed balance sheets at 31 December 2009 and 2008 and condensed statements of income and cash flows for the years ended 31 December 2009, 2008 and 2007 of Holding Company, Bank Company and its subsidiaries.
The condensed statement of financial position at 31 December 2009 and 2008 are presented in the following tables:
Supplemental condensed consolidating statement of financial position as at 31 December 2009
Holding Bank Subsidiaries Eliminate ABNAMRO company company (1) and consolidated
reclassif Cash and balances at central banks 27,026 1,355 1 28,382 Financial assets held for trading 74,495 4,206 (643) 78,058 Financial investments 109,278 6,022 (40,403) 74,897 Loans and receivables-banks 6,600 142,272 139,926 (249,139) 39,659 Loans and receivables-customers 143,613 90,778 (16,145) 218,246 Equity accounted investments <21 12,320 8,316 576 (20,356) 856 Property and equipment 1,187 773 1 1,961 Goodwill and other intangible assets 300 345 645 Assets of businesses held for sale 3,766 1,123 4,889 Accrued income and prepaid expenses 4,580 1,291 5,871 Tax assets 5,526 498 (2) 6,022 Other assets 4,266 5,591 2 9,859 Total assets 18,920 524,625 252,484 {326,684} 469,345
Financial liabilities held for trading 60,177 2,510 62,687 Due to banks 33 148,833 130,829 (233,550) 46,145 Due to customers 196,237 32,145 (31 ,734) 196,648 Issued debt securities 72,817 63,888 (41,045) 95,660 Provisions 1,275 3,516 (1) 4,790 Liabilities of businesses held for sale 6,573 2,321 8,894 Accrued expenses and deferred income 5,594 1,399 1 6,994 Tax liabilities 6 157 414 1 578 Other liabilities 1 8,424 5,066 (2) 13,489 Subordinated liabilities 12,223 2,320 1 14,544 Shareholders equity attributable to the parent company 18,880 12,315 8,039 (20,354) 18,880 Non-controllin9 interests 37 (1) 36 Total liabilities and eguit~ 18,920 524,625 252,484 {326,684} 469,345
(1) Includes ABN AMRO II N. V. (2) Includes participating interest in group companies which are eliminated.
180 ABN AMRO Holding N.V. Annual Report 2009
l_
c
L
I L
( I I
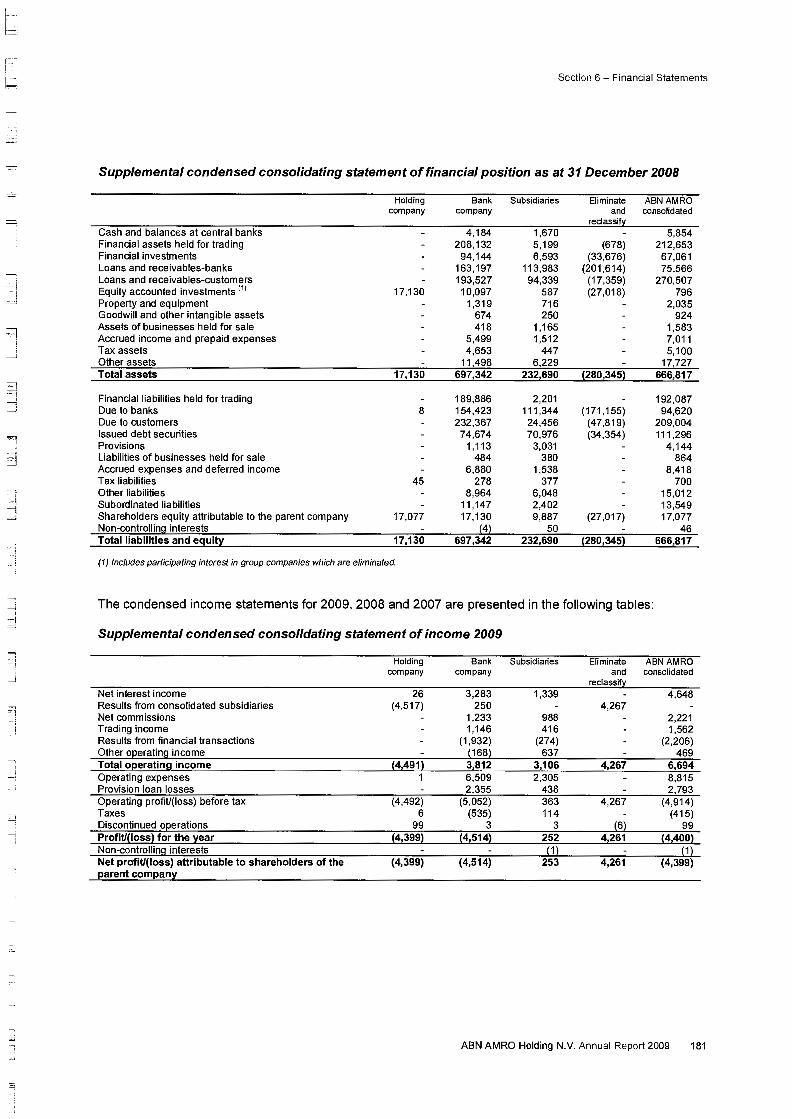
I [=
Section 6- Financial Statements
-'---! ~
Supplemental condensed consolidating statement of financial position as at 31 December 2008
Holding Bank Subsidiaries Eliminate ABNAMRO company company and consolidated
= reclassif Cash and balances at central banks 4,184 1,670 5,854 Financial assets held for trading 208,132 5,199 (678) 212,653 Financial investments 94,144 6,593 (33,676) 67,061 Loans and receivables-banks 163,197 113,983 (201,614) 75,566
~i Loans and receivables-customers 193,527 94,339 (17,359) 270,507
J Equity accounted investments t11 17,130 10,097 587 (27,018) 796 Property and equipment 1,319 716 2,035 Goodwill and other intangible assets 674 250 924
~ Assets of businesses held for sale 418 1,165 1,583
---1 Accrued income and prepaid expenses 5,499 1,512 7,011 Tax assets 4,653 447 5,100 Other assets 11,498 6,229 17,727 Total assets 17,130 697,342 232,690 {280,345} 666,817
3 ·-=i
Financial liabilities held for trading 189,886 2,201 192,087 i
~ Due to banks 8 154,423 111,344 (171,155) 94,620 Due to customers 232,367 24,456 (47,819) 209,004
"'l Issued debt securities 74,674 70,976 (34,354) 111,296 Provisions 1,113 3,031 4,144
=1 Liabilities of businesses held for sale 484 380 864 Accrued expenses and deferred income 6,880 1,538 8,418 Tax liabilities 45 278 377 700
--. Other liabilities 8,964 6,048 15,012 --~ Subordinated liabilities 11,147 2,402 13,549 ---j
__J Shareholders equity attributable to the parent company 17,077 17,130 9,887 (27,017) 17,077 Non-controllin!J interests (4) 50 46
---; Total liabilities and eguitl 17,130 697,342 232,690 {280,345} 666,817
(1) Includes participating interest in group companies which are eliminated. ,__j
--, The condensed income statements for 2009, 2008 and 2007 are presented in the following tables: ~
__ ! d
Supplemental condensed consolidating statement of income 2009
l Holding Bank Subsidiaries Eliminate ABNAMRO company company and consolidated
_j reclassif Net interest income 26 3,283 1,339 4,648 Results from consolidated subsidiaries (4,517) 250 4,267 =-; Net commissions 1,233 988 2,221
~ Trading income 1,146 416 1,562 Results from financial transactions (1,932) (274) (2,206) Other o~eratin!J income (168) 637 469 Total operating income {4,491) 3,812 3,106 4,267 6,694 Operating expenses 1 6,509 2,305 8,815 Provision loan losses 2,355 438 2,793 Operating profit/(loss) before tax (4,492) (5,052) 363 4,267 (4,914)
=j Taxes 6 (535) 114 (415) Discontinued o~erations 99 3 3 (6) 99 Profit/{loss) for the lear (4,399) (4,514) 252 4,261 {4,400) Non-controllin!J interests (1) (1) Net profit/(loss) attributable to shareholders of the (4,399) (4,514) 253 4,261 (4,399) parent companl
_.J
ABN AMRO Holding N.V. Annual Report 2009 181
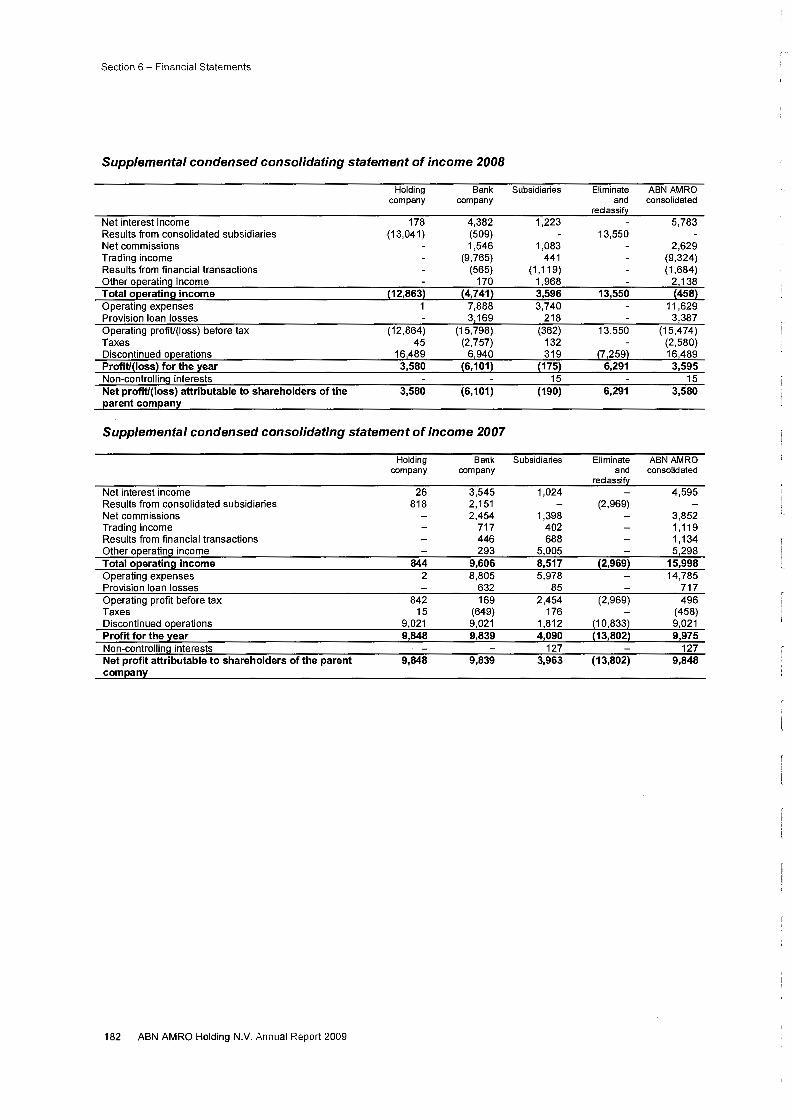
Section 6- Financial Statements
Supplemental condensed consolidating statement of income 2008
Holding Bank Subsidiaries Eliminate ABN AMRO company company and consolidated
reclassif Net interest income 178 4,382 1,223 5,783 Results from consolidated subsidiaries (13,041) (509) 13,550 Net commissions 1,546 1,083 2,629 Trading income (9,765) 441 (9,324) Results from financial transactions (565) (1 '119) (1,684) Other OJ;!erating income 170 1,968 2,138 Total operating income (12,863) (4,741) 3,596 13,550 (458) Operating expenses 1 7,888 3,740 11,629 Provision loan losses 3,169 218 3,387 Operating profit/(loss) before tax (12,864) (15,798) (362) 13,550 (15,474) Taxes 45 (2,757) 132 (2,580) Discontinued OJ;!erations 16,489 6,940 319 (7,259) 16,489 Profit/(loss) for the lear 3,580 (6, 101) (175) 6,291 3,595 Non-controlling interests 15 15 Net profit/(loss) attributable to shareholders of the 3,580 (6, 101) (190) 6,291 3,580 earent comeanl
Supplemental condensed consolidating statement of income 2007
Holding Bank Subsidiaries Eliminate ABN AMRO company company and consolidated
reclassif Net interest income 26 3,545 1,024 4,595 Results from consolidated subsidiaries 818 2,151 (2,969) i Net commissions 2,454 1,398 3,852 '-Trading income 717 402 1 '119 Results from financial transactions 446 688 1,134 f Other O(!erating income 293 5,005 5,298 I
I Total operating income 844 9,606 8,517 (2,969) 15,998 L
Operating expenses 2 8,805 5,978 14,785 Provision loan losses 632 85 717 Operating profit before tax 842 169 2,454 (2,969) 496 Taxes 15 (649) 176 (458) Discontinued O(!erations 9,021 9,021 1,812 (1 0,833) 9,021 Profit for the lear 9,848 9,839 4,090 (13,802) 9,975 Non-controlling interests 127 127 Net profit attributable to shareholders of the parent 9,848 9,839 3,963 (13,802) 9,848 com an
182 ABN AMRO Holding N.V. Annual Report 2009
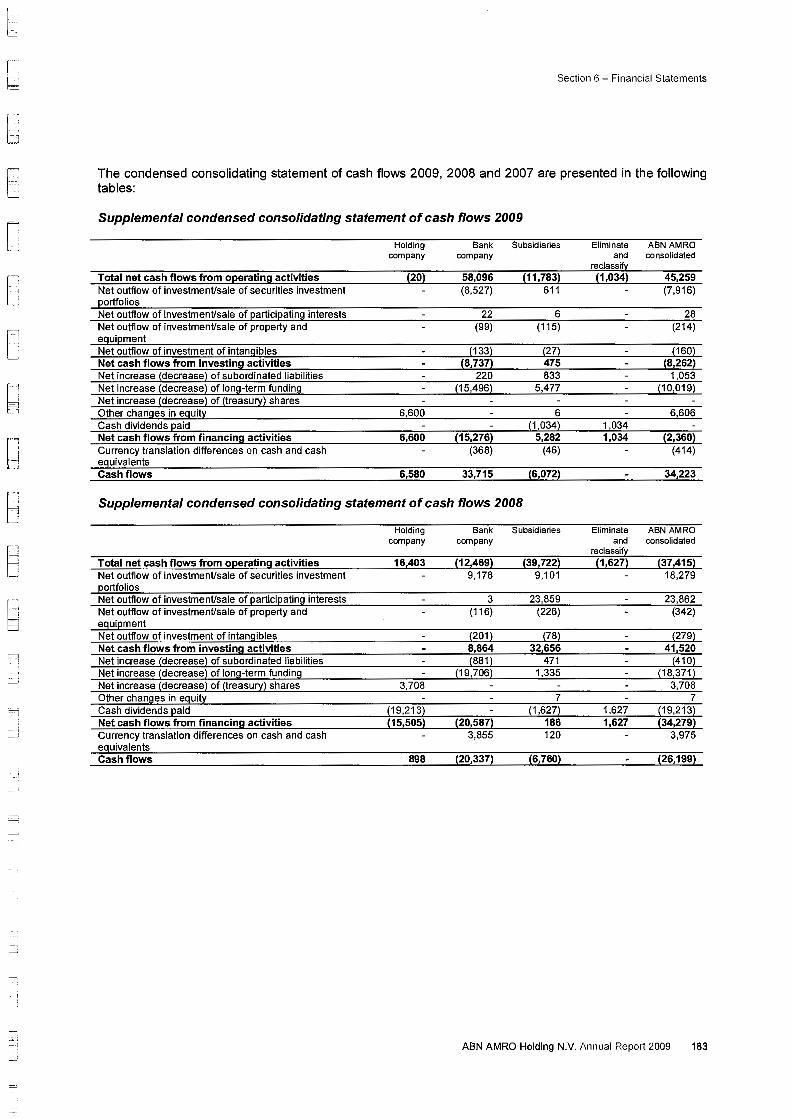
L (_ '1-' t=
I b
[ .
n
Section 6- Financial Statements
The condensed consolidating statement of cash flows 2009, 2008 and 2007 are presented in the following tables:
Supplemental condensed consolidating statement of cash flows 2009
Holding Bank Subsidiaries Eliminate ABN AMRO company company and consolidated
reclassif Total net cash flows from operating activities (20) 58,096 (11,783) (1,034) 45,259 Net outflow of investment/sale of securities investment (8,527) 611 (7,916) ortfolios
Net outflow of investment/sale of participating interests 22 6 28 Net outflow of investment/sale of property and (99) (115) (214) e ui ment Net outflow of investment of intangibles (133) (27) (160) Net cash flows from investing activities (8,737) 475 (8,262) Net increase (decrease) of subordinated liabilities 220 833 1,053 Net increase (decrease) of long-term funding (15,496) 5,477 (10,019) Net increase (decrease) of (treasury) shares Other changes in equity 6,600 6 6,606 Cash dividends paid (1 ,034) 1,034 Net cash flows from financing activities 6,600 (15,276) 5,282 1,034 (2,360) Currency translation differences on cash and cash (368) (46) (414) e uivalents Cash flows 6,580 33,715 (6,072) 34,223
Supplemental condensed consolidating statement of cash flows 2008
Holding Bank Subsidiaries Eliminate ABN AMRO company company and consolidated
reclassif Total net cash flows from operating activities 16,403 (12,469) (39,722) (1,627) (37,415) Net outflow of investment/sale of securities investment 9,178 9,101 18,279 ortfolios
Net outflow of investment/sale of participating interests 3 23,859 23,862 Net outflow of investment/sale of property and (116) (226) (342) e ui ment Net outflow of investment of intangibles (201) (78) (279) Net cash flows from investing activities 8,864 32,656 41,520 Net increase (decrease) of subordinated liabilities (881) 471 (410) Net increase (decrease) of long-term funding (19,706) 1,335 (18,371) Net increase (decrease) of (treasury) shares 3,708 3,708 Other changes in equity 7 7 Cash dividends paid (19,213) (1 ,627) 1,627 (19,213) Net cash flows from financing activities (15,505) (20,587) 186 1,627 (34,279) Currency translation differences on cash and cash 3,855 120 3,975 e uivalents Cash flows 898 (20,337) (6,760) (26,199)
ABN AMRO Holding N.V. Annual Report 2009 183
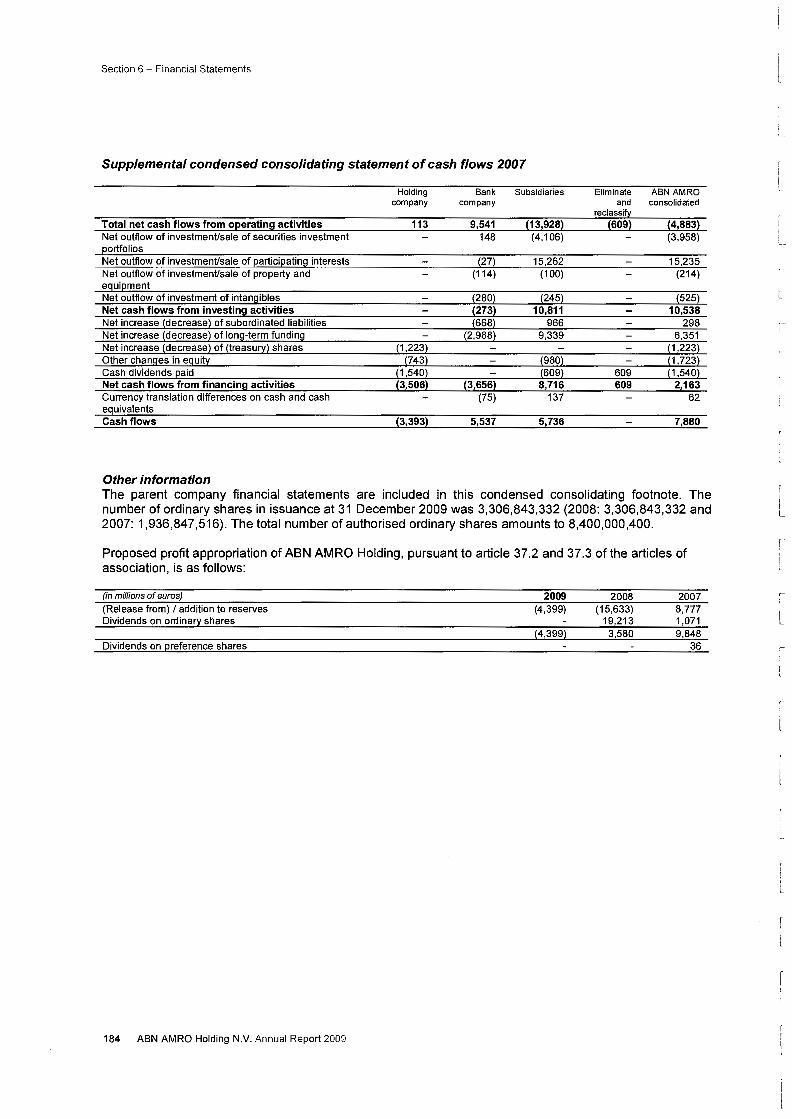
Section 6 - Financial Statements
Supplemental condensed consolidating statement of cash flows 2007
Holding Bank Subsidiaries Eliminate ABN AMRO company company and consolidated
reclassif Total net cash flows from operating activities 113 9,541 (13,928} (609} (4,883} Net outflow of investment/sale of securities investment 148 (4,106) (3,958) ortfolios
Net outflow of investment/sale of ~artici~ating interests (27) 15,262 15,235 Net outflow of investment/sale of property and (114) (100) (214) e ui ment Net outflow of investment of intangibles (280) (245) (525) Net cash flows from investing activities (273} 10,811 10,538 Net increase (decrease) of subordinated liabilities (668) 966 298 Net increase (decrease) of long-term funding (2,988) 9,339 6,351 Net increase (decrease) of (treasu!:X) shares (1 ,223) (1 ,223) Other changes in eguit:t (743) (980) (1 ,723) Cash dividends ~aid (1 ,540) (609) 609 (1 ,540) Net cash flows from financing activities (3,506} (3,656} 8,716 609 2,163 Currency translation differences on cash and cash (75) 137 62 e uivalents Cash flows (3,393} 5,537 5,736 7,880
Other information The parent company financial statements are included in this condensed consolidating footnote. The number of ordinary shares in issuance at 31 December 2009 was 3,306,843,332 (2008: 3,306,843,332 and 2007: 1 ,936,847,516). The total number of authorised ordinary shares amounts to 8,400,000,400.
Proposed profit appropriation of ABN AMRO Holding, pursuant to article 37.2 and 37.3 of the articles of association, is as follows:
(in millions of euros)
(Release from) I addition to reserves Dividends on ordina!:X shares
Dividends on ~reference shares
184 ABN AMRO Holding N.V. Annual Repor\2009
2009 (4,399)
(4,399)
2008 (15,633)
19,213 3,580
2007 8,777 1,071 9,848
36
,-I
I L
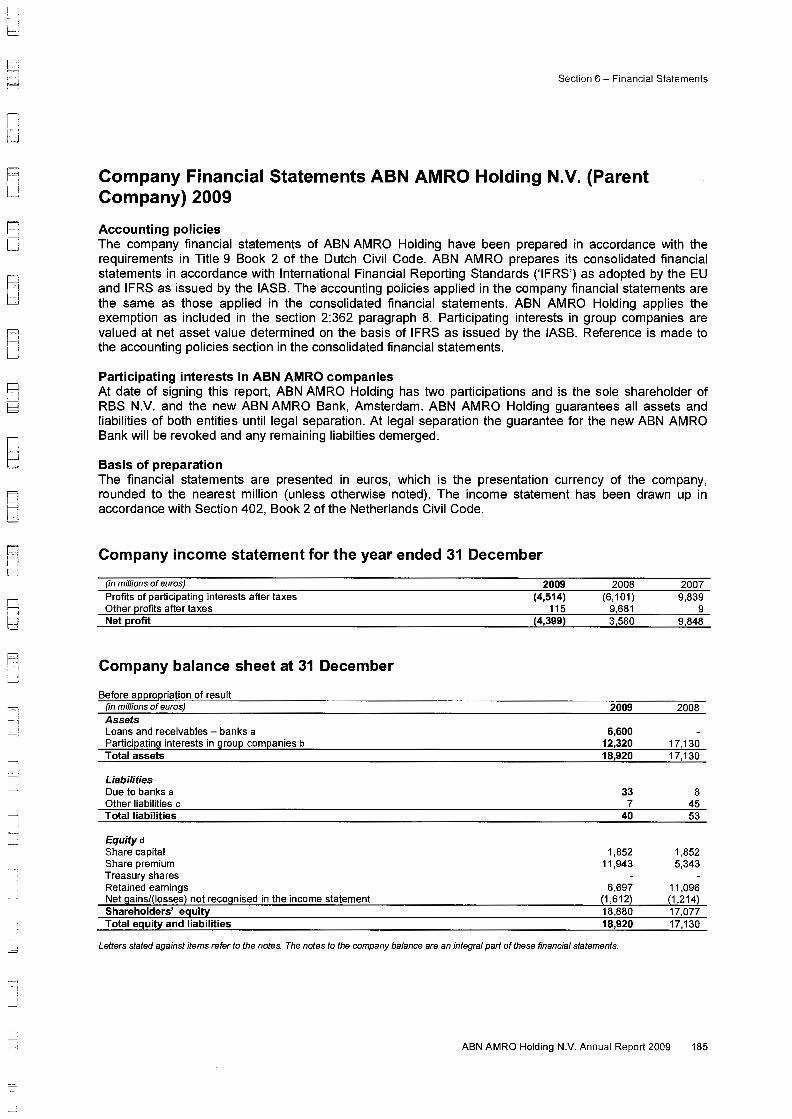
c I
.
lJ -
. I
h c R bJ
Section 6- Financial Statements
Company Financial Statements ABN AMRO Holding N.V. (Parent Company) 2009
Accounting policies The company financial statements of ABN AMRO Holding have been prepared in accordance with the requirements in Title 9 Book 2 of the Dutch Civil Code. ABN AMRO prepares its consolidated financial statements in accordance with International Financial Reporting Standards ('IFRS') as adopted by the EU and IFRS as issued by the IASB. The accounting policies applied in the company financial statements are the same as those applied in the consolidated financial statements. ABN AMRO Holding applies the exemption as included in the section 2:362 paragraph 8. Participating interests in group companies are valued at net asset value determined on the basis of IFRS as issued by the IASB. Reference is made to the accounting policies section in the consolidated financial statements.
Participating interests in ABN AMRO companies At date of signing this report, ABN AMRO Holding has two participations and is the sole shareholder of RBS N.V. and the new ABN AMRO Bank, Amsterdam. ABN AMRO Holding guarantees all assets and liabilities of both entities until legal separation. At legal separation the guarantee for the new ABN AMRO Bank will be revoked and any remaining liabilties demerged.
Basis of preparation The financial statements are presented in euros, which is the presentation currency of the company, rounded to the nearest million (unless otherwise noted). The income statement has been drawn up in accordance with Section 402, Book 2 of the Netherlands Civil Code.
Company income statement for the year ended 31 December
(in millions of euros)
Profits of participating interests after taxes Other profits after taxes Net profit
Company balance sheet at 31 December
Before appropriation of result (in millions of euros)
Assets Loans and receivables - banks a Participating interests in group companies b Total assets
Liabilities Due to banks a Other liabilities c Total liabilities
Equityd Share capital Share premium Treasury shares Retained earnings Net gains/(losses) not recognised in the income statement Shareholders' equity Total equity and liabilities
2009 (4,514)
115 (4,399)
2008 (6,101)
9,681 3,580
2009
6,600 12,320 18,920
33 7
40
1,852 11,943
6,697 (1,612) 18,880 18,920
Letters stated against items refer to the notes. The notes to the company balance are an integral part of these financial statements.
2007 9,839
9 9,848
2008
17,130 17,130
8 45 53
1,852 5,343
11,096 (1 ,214) 17,077 17,130
ABN AMRO Holding N.V. Annual Report 2009 185
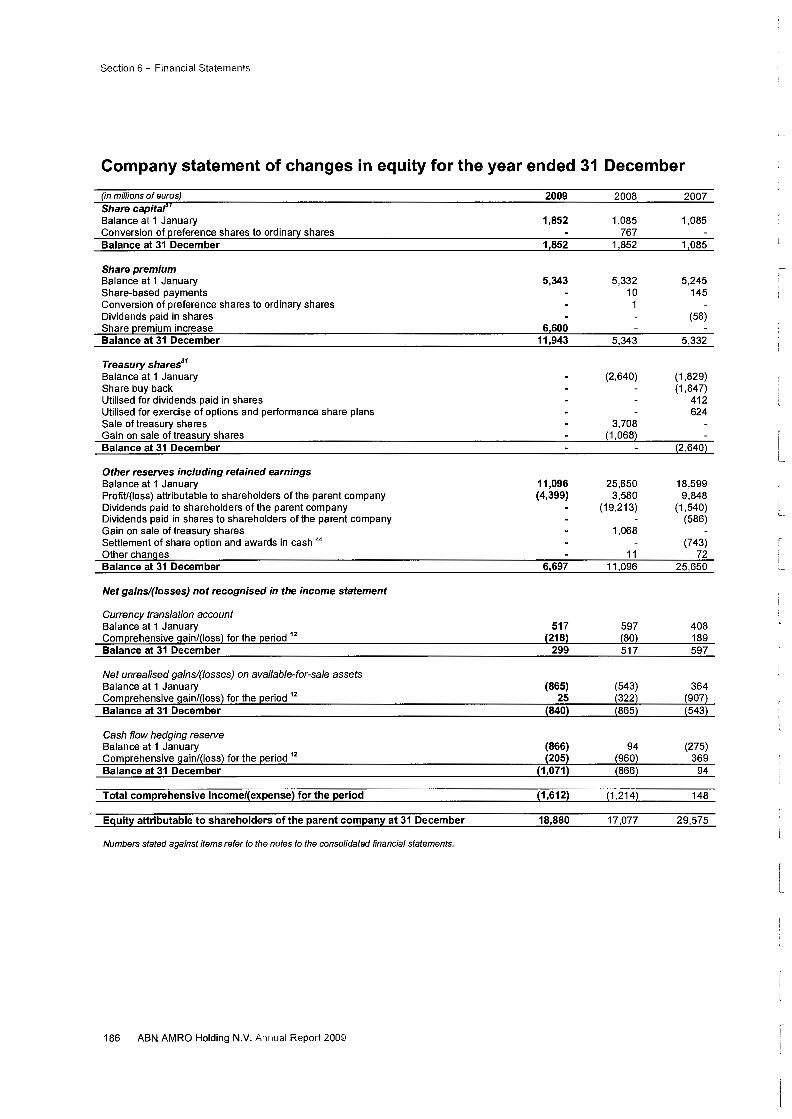
Section 6- Financial Statements
Company statement of changes in equity for the year ended 31 December
(in millions of euros)
Share capital" Balance at 1 January Conversion of preference shares to ordinary shares Balance at 31 December
Share premium Balance at 1 January Share-based payments Conversion of preference shares to ordinary shares Dividends paid in shares Share premium increase Balance at 31 December
Treasury shares31
Balance at 1 January Share buy back Utilised for dividends paid in shares Utilised for exercise of options and performance share plans Sale of treasury shares Gain on sale of treasury shares Balance at 31 December
Other reserves including retained earnings Balance at 1 January Profit/(loss) attributable to shareholders of the parent company Dividends paid to shareholders of the parent company Dividends paid in shares to shareholders of the parent company Gain on sale of treasury shares Settlement of share option and awards in cash 44
Other changes Balance at 31 December
Net gainsl(losses) not recognised in the income statement
Currency translation account Balance at 1 January Comprehensive gain/(loss) for the period 12
Balance at 31 December
Net unrealised gainsl(losses) on available-for-sale assets Balance at 1 January Comprehensive gain/(loss) for the period 12
Balance at 31 December
Cash flow hedging reserve Balance at 1 January Comprehensive gain/(loss) for the period 12
Balance at 31 December
Total comprehensive incomel(expense) for the period
Equity attributable to shareholders of the parent company at 31 December
Numbers stated against items refer to the notes to the consolidated financial statements.
186 ABN AMRO Holding N.V. Annual Report 2009
2009
1,852
1,852
5,343
6,600 11,943
11,096 (4,399)
6,697
517 (218)
299
(865) 25
(840)
(866) (205)
(1,071)
(1,612)
18,880
2008 2007
1,085 1,085 767
1,852 1,085
5,332 5,245 10 145 1
(58)
5,343 5,332
(2,640) (1 ,829) (1 ,847)
412 624
3,708 (1,068)
(2,640)
25,650 18,599 3,580 9,848
(19,213) (1 ,540) (586)
1,068 (743)
11 72 11,096 25,650
597 408 (80) 189 517 597
(543) 364 (322) (907) (865) (543)
94 (275) (960) 369 (866) 94
(1,214) 148
17,077 29,575
L
'
f I l
r-
I I
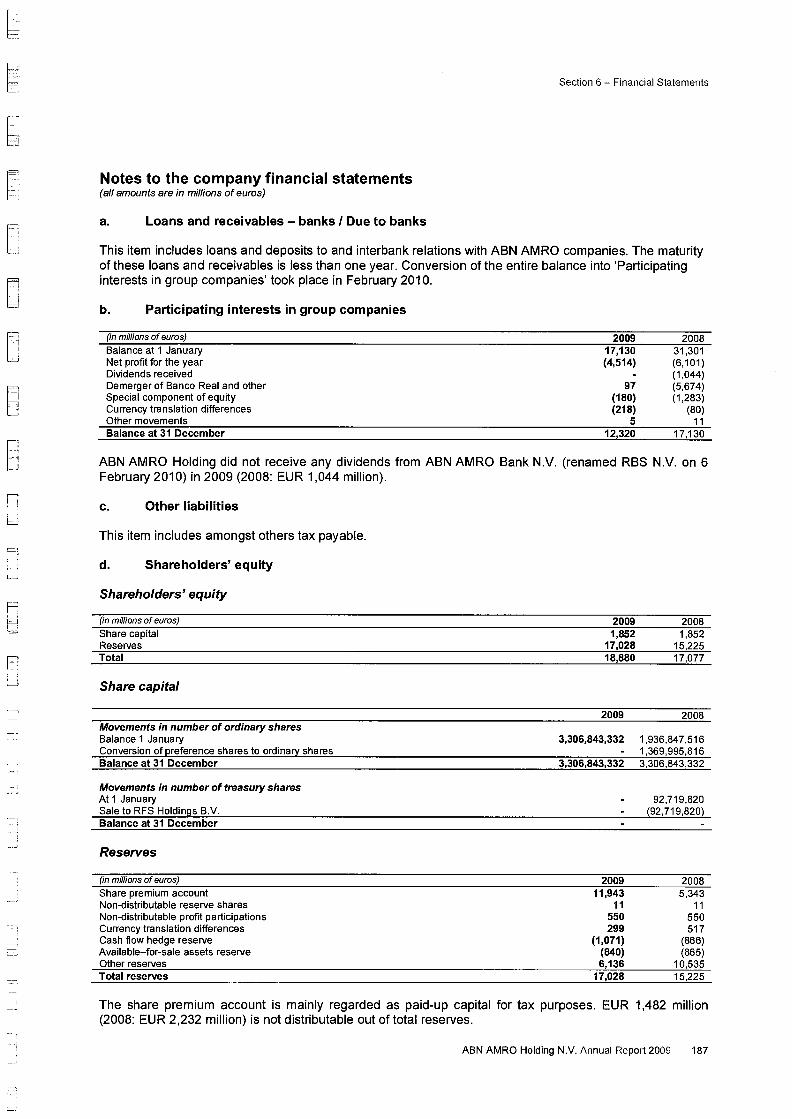
r1 L
p tJ
L__;
p I l
LJ bi
' _-_,_I
Notes to the company financial statements (all amounts are in millions of euros)
a. Loans and receivables - banks I Due to banks
Section 6 - Financial Statements
This item includes loans and deposits to and interbank relations with ABN AMRO companies. The maturity of these loans and receivables is less than one year. Conversion of the entire balance into 'Participating interests in group companies' took place in February 2010.
b. Participating interests in group companies
(in millions of euros)
Balance at 1 January Net profit for the year Dividends received Demerger of Banco Real and other Special component of equity Currency translation differences Other movements Balance at 31 December
2009 17,130 (4,514)
97 (180) (218)
5 12,320
2008 31 ,301 (6,101) (1,044) (5,674) (1,283)
(80) 11
17,130
ABN AMRO Holding did not receive any dividends from ABN AMRO Bank N.V. (renamed RBS N.V. on 6 February 201 0) in 2009 (2008: EUR 1,044 million).
c. Other liabilities
This item includes amongst others tax payable.
d. Shareholders' equity
Shareholders' equity
(in millions of euros)
Share capital Reserves Total
Share capital
Movements in number of ordinary shares Balance 1 January Conversion of preference shares to ordinary shares Balance at 31 December
Movements in number of treasury shares At 1 January Sale to RFS Holdings B.V. Balance at 31 December
Reserves
(in millions of euros)
Share premium account Non-distributable reserve shares Non-distributable profit participations Currency translation differences Cash flow hedge reserve Available-for-sale assets reserve Other reserves Total reserves
2009 1,852
17,028 18,880
2009
2008 1,852
15,225 17,077
2008
3,306,843,332 1,936,847,516 1,369,995,816
3,306,843,332 3,306,843,332
2009 11,943
11 550 299
(1,071) (840) 6,136
17,028
92,719,820 (92,719,820)
2008 5,343
11 550 517
(866) (865)
10,535 15,225
The share premium account is mainly regarded as paid-up capital for tax purposes. EUR 1,482 million (2008: EUR 2,232 million) is not distributable out of total reserves.
ABN AMRO Holding N.V. Annual Report 2009 187
Section 6- Financial Statements
Guarantees
ABN AMRO Holding N.V. guarantees all liabilities of The Royal Bank of Scotland N.V. and ABN AMRO Bank N.V. At legal separation the guarantee for ABN AMRO Bank N.V. will be revoked and any remaining liabilties demerged.
Amsterdam, 26 March 2010
Supervisory Board Managing Board
Arthur Martinez Gerrit Zalm
Andre Olijslager Ron Teerlink
Trude Maas-de Brouwer David Cole
Gert-Jan Kramer Johan van Hall
Ana Maria Llopis Rivas Chris Vogelzang
Juan Rodriguez lnciarte Donald Workman
Michael Enthoven Javier Maldonado
Miller Mclean Jeroen Kremers
Brian Stevenson
188 ABN AMRO Holding N.V. Annual Report 2009
'
r l_
\ i
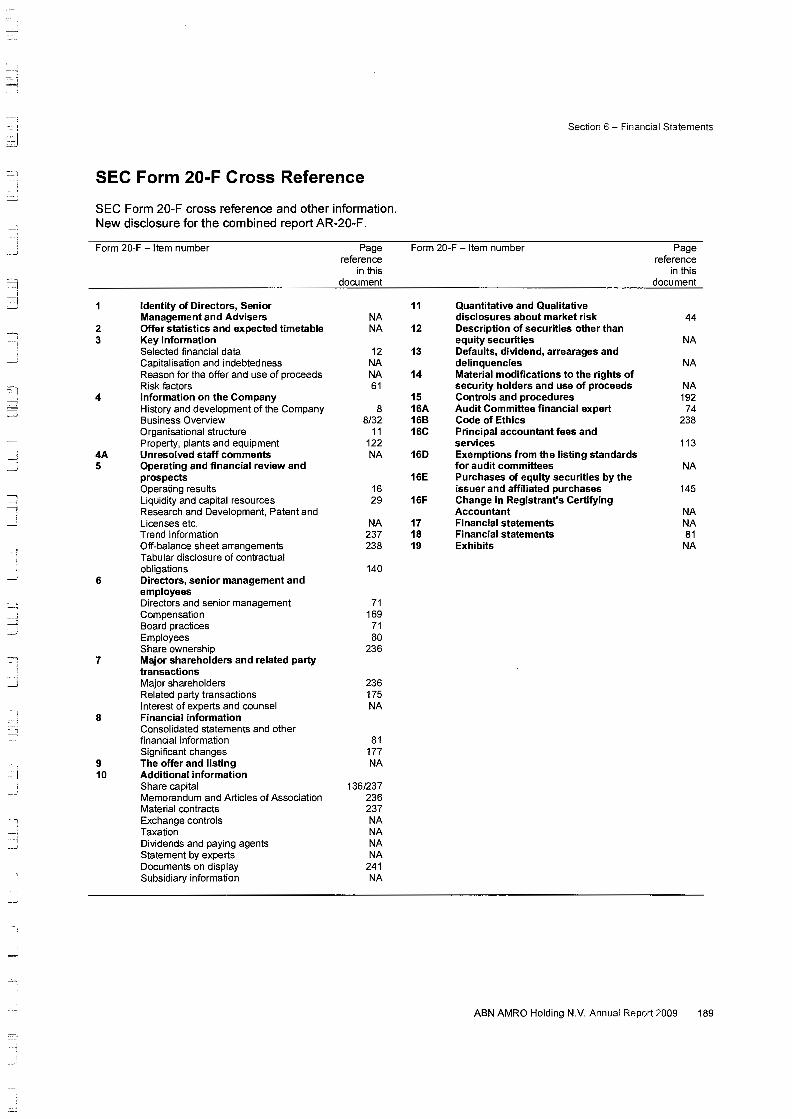
-; I
~ :::::!'
SEC Form 20-F Cross Reference
SEC Form 20-F cross reference and other information. New disclosure for the combined report AR-20-F.
Form 20-F -Item number
2 3
4
4A 5
6
7
8
9 10
Identity of Directors, Senior Management and Advisers Offer statistics and expected timetable Key information Selected financial data Capitalisation and indebtedness Reason for the offer and use of proceeds Risk factors Information on the Company History and development of the Company Business Overview Organisational structure Property, plants and equipment Unresolved staff comments Operating and financial review and prospects Operating results Liquidity and capital resources Research and Development, Patent and Licenses etc. Trend information Off-balance sheet arrangements Tabular disclosure of contractual obligations Directors, senior management and employees Directors and senior management Compensation Board practices Employees Share ownership Major shareholders and related party transactions Major shareholders Related party transactions Interest of experts and counsel Financial information Consolidated statements and other financial information Significant changes The offer and listing Additional information Share capital Memorandum and Articles of Association Material contracts Exchange controls Taxation Dividends and paying agents Statement by experts Documents on display Subsidiary information
Page reference
in this document
NA NA
12 NA NA 61
8 8/32
11 122 NA
16 29
NA 237 238
140
71 169
71 80
236
236 175 NA
81 177 NA
136/237 236 237 NA NA NA NA
241 NA
Section 6- Financial Statements
Form 20-F- Item number Page reference
in this document
11
12
13
14
15 16A 168 16C
16D
16E
16F
17 18 19
Quantitative and Qualitative disclosures about market risk Description of securities other than equity securities Defaults, dividend, arrearages and delinquencies Material modifications to the rights of security holders and use of proceeds Controls and procedures Audit Committee financial expert Code of Ethics Principal accountant fees and services Exemptions from the listing standards for audit committees Purchases of equity securities by the issuer and affiliated purchases Change in Registrant's Certifying Accountant Financial statements Financial statements Exhibits
44
NA
NA
NA 192
74 238
113
NA
145
NA NA 81 NA
ABN AMRO Holding N.V. Annual Report 2009 189