Embed Size (px)
Citation preview

2 0 1 3 A N N U A L R E P O R T
O P P O R T U N I T Y R E D E F I N E D
CO R P O R AT E D I R EC TO RY
DIRECTORS
Derek La Ferla Independent Non-Executive ChairmanKarl M Simich Managing Director & Chief Executive OfficerW John Evans Non-Executive DirectorRobert N Scott Independent Non-Executive DirectorSoocheol Shin Non-Executive Director Paul Hallam Independent Non-Executive Director
MANAGEMENT & COMPANY SECRETARY
Matthew Fitzgerald Chief Financial Officer & Company SecretaryMike Spreadborough Chief Operating OfficerRobert Klug Chief Commercial Officer
PRINCIPAL PLACE OF BUSINESS & REGISTERED OFFICE
Level 1, 31 Ventnor AvenueWest Perth WA 6005T: +61 8 6430 3800F: +61 8 6430 3849E: [email protected]: www.sandfire.com.au
SHARE REGISTRY
Security Transfer Registrars Pty Ltd770 Canning HighwayApplecross WA 6153T: +61 8 9315 2333F: +61 8 9315 2233E: [email protected]
AUDITORS
Ernst & YoungErnst & Young Buillding11 Mounts Bay RoadPerth WA 6000
HOME EXCHANGEAustralian Securities Exchange LimitedExchange Plaza2 The EsplanadePerth WA 6000
ABN55 105 154 185
ASX CODEOrdinary fully paid shares: SFR
SANDFIRE ANNUAL REPORT 2013 / 3
2 D I R E C T O R S A N D M A N A G E M E N T
4 O U R V I S I O N
5 H I G H L I G H T S A N D A C H I E V E M E N T S
6 C H A I R M A N ’ S L E T T E R
8 M A N A G I N G D I R E C T O R ’ S R E P O RT
1 2 O P E R AT I O N S R E V I E W
2 6 S U S TA I N A B I L I T Y
2 7 H E A LT H A N D S A F E T Y
2 8 O U R P E O P L E
2 9 S C H E D U L E O F E X P L O R AT I O N A N D M I N I N G T E N E M E N T S
3 1 F I N A N C I A L R E P O RT
1 1 2 C O R P O R AT E G O V E R N A N C E S TAT E M E N T
1 2 0 A S X A D D I T I O N A L I N F O R M AT I O N
1 2 2 I M P O RTA N T I N F O R M AT I O N A N D D I S C L A I M E R
CO N T EN T S

2 / SANDFIRE ANNUAL REPORT 2013
Mr Derek La Ferla Independent Non-Executive ChairmanQualifications B.Arts, B.Juris, B.Law, Fellow of AICD
Mr La Ferla has been a corporate lawyer for over 25 years and is a partner with international law firm, Norton Rose Fullbright. He is one of two national team leaders for the firm’s Corporate Advisory Group (which includes mining and resources). Mr La Ferla also has considerable experience as a company director and is the chairman of Cashmere Iron Limited and OTOC Limited. He has also previously served on the Norton Rose Australia national board (while the firm was Deacons) and listed investment company, Katana Capital Limited. He is a fellow of the Australian Institute of Company Directors.
Mr Karl M Simich Managing Director and Chief Executive OfficerQualifications B.Com, FCA, F.Fin
Mr Simich is an experienced international mining executive who has been involved in the financing, construction, development and operation of five mining projects in New Zealand, Australia and Africa. Specialising in resource finance and corporate management, Mr Simich has been a Director of and held senior executive positions with a number of ASX-listed mining companies. Mr Simich is a Fellow of the Institute of Chartered Accountants and a Fellow of the Financial Services Institute of Australasia and has completed post-graduate studies in business and finance.
Mr W John Evans Non-Executive DirectorQualifications B.Sc
Mr Evans graduated from the University of Auckland New Zealand in 1970 with B.Sc Major in geology. Between 1970 and 1987, he was employed by various divisions of CRA Limited, including being in charge of all field operations for iron ore in the Pilbara, Western Australia and gold and base metals in the Murchison, Western Australia. He was the Managing Director of Marymia Exploration NL for 12 years until 2002 and has been a geological consultant to numerous companies during and since.
Mr Robert N Scott
Independent Non-Executive DirectorQualifications FCA
Mr Scott is a Chartered Accountant with 35 years experience as an adviser on corporate services and taxation. Mr Scott holds a fellowship of the Australian Institute of Chartered Accountants and the Taxation Institute of Australia. He is also a member of the Institute of Company Directors. Mr Scott serves on the boards of Lonestar Resources Limited, Homeloans Limited and Manas Resources Limited.
Mr Soocheol Shin Non-Executive DirectorQualifications B.A. Public Administration
Mr Shin is the Managing Director of POSCO Australia Pty Ltd (a wholly-owned subsidiary of the Korean steelmaker POSCO), which holds 15.3 percent of the Company’s issued capital. Mr Shin joined POSCO in 1989 and has held a variety of positions throughout his career, including Project Manager, POSCO Australia Pty Ltd; Team Leader, Coal Procurement Group; Team Leader, Steel Making Raw Materials Procurement Group and Group Leader, Raw Materials Transportation Group. He was appointed Managing Director of POSCO Australia in February 2012.
Mr Paul Hallam Independent Non-Executive DirectorQualifications BE (Hons) Mining, FAICD, FAusIMM
Mr Hallam is a highly experienced resource industry executive with more than 35 years experience working for a number of blue chip Australian and International mining companies, including 15 years at senior executive management level. His experience spans a range of corporate and operating environments, both in Australia and overseas, covers a range of commodities (iron ore, bauxite, alumina, aluminium, gold, silver, copper, zinc and lead) and includes both surface and underground mining. His former roles include Director – Operations with Fortescue Metals Group and Executive General Manager – Development & Projects with Newcrest Mining Limited. Mr Hallam retired from executive roles in 2011 to pursue a career as a professional non-executive Director. Mr Hallam is a qualified mining engineer and holds a BE (Hons) from Melbourne University and a Certificate of Mineral Economics from Curtin University. He is a Fellow of the Australian Institute of Company Directors and the Australasian Institute of Mining & Metallurgy.
B OA R D O F D I R EC TO R S
SANDFIRE ANNUAL REPORT 2013 / 3
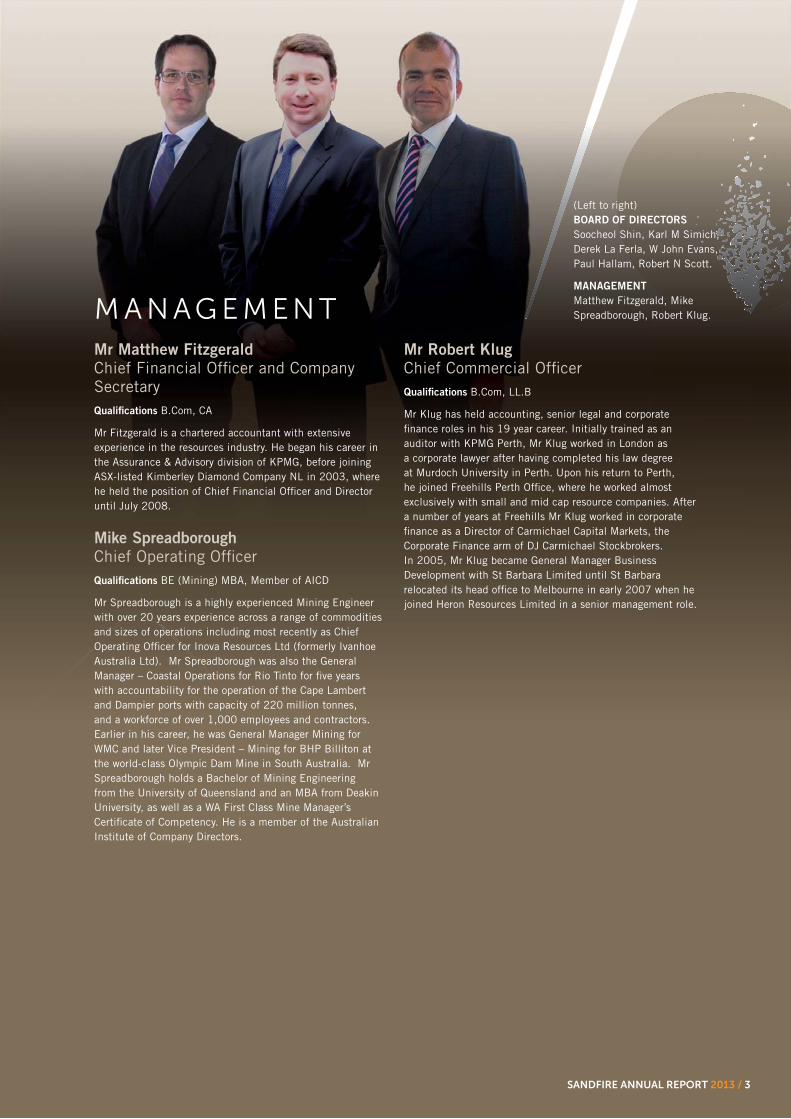
(Left to right) BOARD OF DIRECTORS
Soocheol Shin, Karl M Simich, Derek La Ferla, W John Evans, Paul Hallam, Robert N Scott.
MANAGEMENT
Matthew Fitzgerald, Mike Spreadborough, Robert Klug.
Mr Matthew Fitzgerald Chief Financial Officer and Company SecretaryQualifications B.Com, CA
Mr Fitzgerald is a chartered accountant with extensive experience in the resources industry. He began his career in the Assurance & Advisory division of KPMG, before joining ASX-listed Kimberley Diamond Company NL in 2003, where he held the position of Chief Financial Officer and Director until July 2008.
Mike Spreadborough Chief Operating OfficerQualifications BE (Mining) MBA, Member of AICD
Mr Spreadborough is a highly experienced Mining Engineer with over 20 years experience across a range of commodities and sizes of operations including most recently as Chief Operating Officer for Inova Resources Ltd (formerly Ivanhoe Australia Ltd). Mr Spreadborough was also the General Manager – Coastal Operations for Rio Tinto for five years with accountability for the operation of the Cape Lambert and Dampier ports with capacity of 220 million tonnes, and a workforce of over 1,000 employees and contractors. Earlier in his career, he was General Manager Mining for WMC and later Vice President – Mining for BHP Billiton at the world-class Olympic Dam Mine in South Australia. Mr Spreadborough holds a Bachelor of Mining Engineering from the University of Queensland and an MBA from Deakin University, as well as a WA First Class Mine Manager’s Certificate of Competency. He is a member of the Australian Institute of Company Directors.
Mr Robert Klug Chief Commercial OfficerQualifications B.Com, LL.B
Mr Klug has held accounting, senior legal and corporate finance roles in his 19 year career. Initially trained as an auditor with KPMG Perth, Mr Klug worked in London as a corporate lawyer after having completed his law degree at Murdoch University in Perth. Upon his return to Perth, he joined Freehills Perth Office, where he worked almost exclusively with small and mid cap resource companies. After a number of years at Freehills Mr Klug worked in corporate finance as a Director of Carmichael Capital Markets, the Corporate Finance arm of DJ Carmichael Stockbrokers. In 2005, Mr Klug became General Manager Business Development with St Barbara Limited until St Barbara relocated its head office to Melbourne in early 2007 when he joined Heron Resources Limited in a senior management role.
M A N AG E M EN T

4 / SANDFIRE ANNUAL REPORT 2013
O U R V I S I O N
Discover additional VMS
deposits within the emerging Doolgunna mineral field
Deliver superior returns to our owners from the premier high-grade DeGrussa VMS copper-gold mine
Foster and develop long-term strategic
relationships with raw material end-users and traders
Explore for, develop and mine key
raw materials, in Australia and overseas
Maintain the highest standards of safety,
integrity and quality at all timesDevelop a world-class mining
company

SANDFIRE ANNUAL REPORT 2013 / 5
H I G H L I G H T S & ACH I E V E M EN T SDuring the year, Sandfire cemented its position as a successful low-cost copper-gold producer, completing the commissioning and ramp-up of the DeGrussa Copper Mine, delivering a maiden annual profit and laying the foundations for its next growth chapter with successful exploration and business development activities.
OPERATIONS
The DeGrussa Copper Mine produced 64,017t of copper and 42,679oz of gold for FY2013, comprising mainly Direct Shipping Ore (DSO) from the open pit in the first half and mostly underground sulphide ore in the second half. The completion of the Stage 2 open pit in April marked the transition to a wholly-underground operation.
The Company made significant investment in underground capital development to establish multiple ore sources to secure the long-term future of the operation, with development of the new Conductor 1 and Conductor 4/5 Declines progressing on schedule. Total underground development exceeded 15km at the date of this report.
The 1.5Mtpa DeGrussa Concentrator was commissioned with nameplate ore throughput achieved and optimisation of copper recoveries progressing despite campaign processing of open pit sulphide material which temporarily reduced recoveries. The open pit blend was completed in Q1FY2014 as the underground mine ramped up successfully to 1.5Mtpa.
Shipments of copper concentrate ramped up, both through Geraldton and the newly-completed facility at Port Hedland. A further three concentrate sales contracts were finalised – increasing the total to four.
The Company confirmed it is on track to achieve production guidance for FY2014 of 65-75,000t of copper and 35-45,000oz of gold at C1 cash operating costs in the range of US$1.05-1.15/lb. Production for Q1FY2014 was 16,500t of copper and 8,500oz of gold, with production expected to be weighted towards 2HFY2014.
EXPLORATION
The mine life of the DeGrussa operation was extended until late 2020 following an increase in Mineral Resources to 13.4Mt grading 4.7% Cu and 1.9g/t Au for 634,000t copper and 795,000oz gold. This resulted in the addition of 66,000t of copper and 149,000oz of gold, net of depletion to 31 March 2013.
The updated Mineral Resource reflected the results of a successful surface drilling program targeting extensions of the Conductor 5 deposit and a significant thickening of Conductor 4. Some of the outstanding intersections from this drilling included 26.1m @ 7.2% Cu and 3.1g/t Au and 28.3m @ 5.3% Cu and 2.7g/t Au.
Underground exploration commenced with initial drilling targeting down-plunge extensions of Conductor 4. Further drill positions are expected to become available as the Conductor 1 and Conductor 4/5 Declines progress.
Both near-mine and regional exploration activity gathered momentum during the year, with the identification of important new targets within the mine corridor and within the southern extents of the broader Doolgunna tenement holding.
CORPORATE AND FINANCIAL
Sandfire posted a maiden annual net profit after income tax of $88M for the 12 months to 30 June 2013 on sales revenue of $507.3M. The profit was underpinned by strong cash flow from operating activities of $250.2M and translated to earnings per share of 57.48cps (basic) and 57.38cps (diluted).
Experienced mining executive Paul Hallam was appointed as Independent non-executive Director and former senior BHP, Rio and WMC executive Michael Spreadborough joined the Company as Chief Operating Officer.
Sandfire further strengthened its working capital position for FY2014 with a reduction in repayments and reserve account requirements for the remaining $285 million balance of the DeGrussa Project Finance Facility. $95 million in repayments were completed during FY2013.
OFFICIAL MINE OPENING
The DeGrussa Copper Mine was officially opened on Sunday, 4 August 2013 by the Hon. Colin Barnett MLA, the Premier of Western Australia and Minister for State Development and Science at a ceremony attended by over 200 dignitaries, key stakeholders, media, employees and contractors.
6 / SANDFIRE ANNUAL REPORT 2013
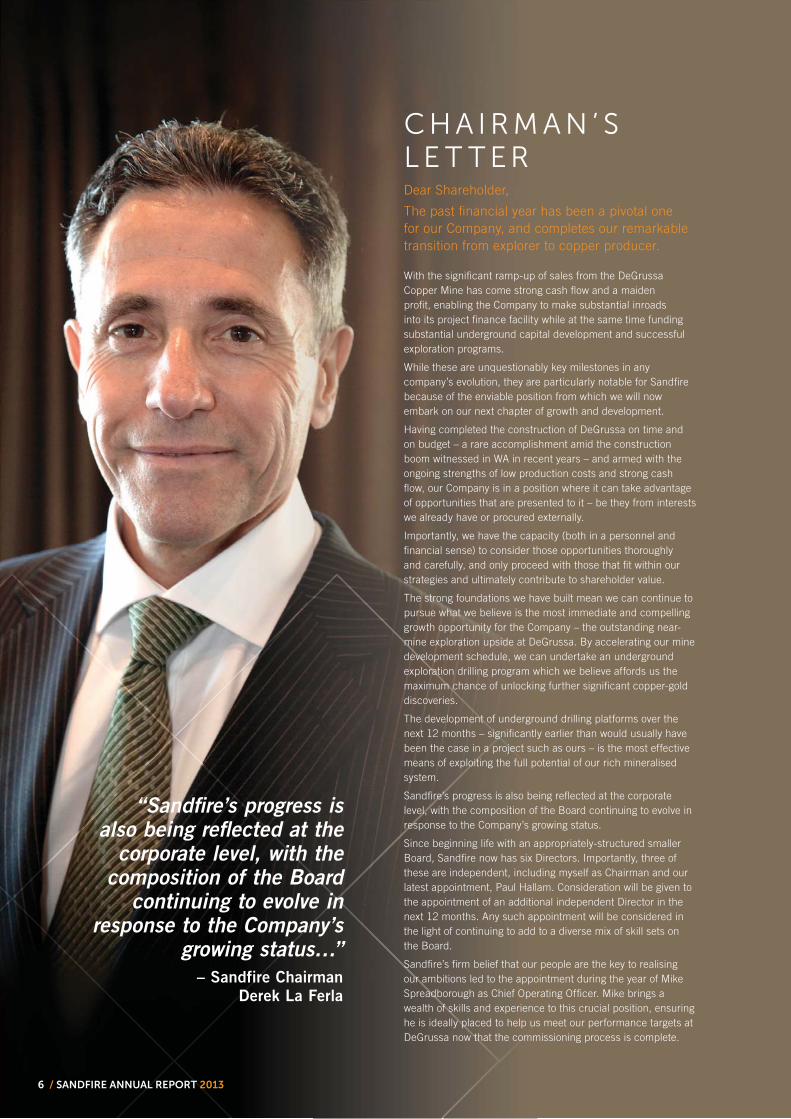
CH A I R M A N ’ S L E T T ER
With the significant ramp-up of sales from the DeGrussa Copper Mine has come strong cash flow and a maiden profit, enabling the Company to make substantial inroads into its project finance facility while at the same time funding substantial underground capital development and successful exploration programs.
While these are unquestionably key milestones in any company’s evolution, they are particularly notable for Sandfire because of the enviable position from which we will now embark on our next chapter of growth and development.
Having completed the construction of DeGrussa on time and on budget – a rare accomplishment amid the construction boom witnessed in WA in recent years – and armed with the ongoing strengths of low production costs and strong cash flow, our Company is in a position where it can take advantage of opportunities that are presented to it – be they from interests we already have or procured externally.
Importantly, we have the capacity (both in a personnel and financial sense) to consider those opportunities thoroughly and carefully, and only proceed with those that fit within our strategies and ultimately contribute to shareholder value.
The strong foundations we have built mean we can continue to pursue what we believe is the most immediate and compelling growth opportunity for the Company – the outstanding near-mine exploration upside at DeGrussa. By accelerating our mine development schedule, we can undertake an underground exploration drilling program which we believe affords us the maximum chance of unlocking further significant copper-gold discoveries.
The development of underground drilling platforms over the next 12 months – significantly earlier than would usually have been the case in a project such as ours – is the most effective means of exploiting the full potential of our rich mineralised system.
Sandfire’s progress is also being reflected at the corporate level, with the composition of the Board continuing to evolve in response to the Company’s growing status.
Since beginning life with an appropriately-structured smaller Board, Sandfire now has six Directors. Importantly, three of these are independent, including myself as Chairman and our latest appointment, Paul Hallam. Consideration will be given to the appointment of an additional independent Director in the next 12 months. Any such appointment will be considered in the light of continuing to add to a diverse mix of skill sets on the Board.
Sandfire’s firm belief that our people are the key to realising our ambitions led to the appointment during the year of Mike Spreadborough as Chief Operating Officer. Mike brings a wealth of skills and experience to this crucial position, ensuring he is ideally placed to help us meet our performance targets at DeGrussa now that the commissioning process is complete.
“Sandfire’s progress is also being reflected at the
corporate level, with the composition of the Board
continuing to evolve in response to the Company’s
growing status…”
– Sandfire Chairman
Derek La Ferla
Dear Shareholder,
The past financial year has been a pivotal one for our Company, and completes our remarkable transition from explorer to copper producer.
SANDFIRE ANNUAL REPORT 2013 / 7
The Company’s transition to a fully operational producer means it will be appropriate for your Board to consider the introduction of a dividend policy at some point. I do not wish to pre-empt the Board’s ultimate view on such an important matter, other than to say that your Directors share what appears to be a strong market sentiment regarding the desirability of returning cash to those who ultimately own it when it is appropriate to do so.
However, this important consideration must continue to be weighed against the ongoing need to fund our capital development, exploration and business development programs while at the same time meeting our debt repayment schedule. I am confident that we will be able to strike the right balance between these important considerations, implementing a policy at the right time that enables us to reward shareholders while also continuing to grow and develop our business.
In conclusion, it must be said that the fact that we are even in a position to contemplate a dividend policy just four years after making a greenfields discovery highlights the outstanding achievements of our Company.
Much of the thanks for this remarkable journey must go to our team, both staff and contractors, who have ensured that we have made the journey quickly, safely and prudently. In particular, I would like to recognise the continuing and prodigious hard work and efforts of our senior management team (both at head office and at DeGrussa), led by our Managing Director and CEO Karl Simich.
The result of the wonderful commitment and dedication of our team was clearly displayed at the official opening of the DeGrussa Copper Mine, which was officially opened by the Western Australian Premier, the Hon Colin Barnett MLA on Sunday, 4 August. This was a very proud day for all concerned.
Finally, may I also thank you, our shareholders, for your support. Your firm backing, both public and private, has allowed us to focus on achieving our Company’s objectives.
We look forward to your ongoing support as we write the next chapter in the Sandfire story.
Yours faithfully
Derek La Ferla
Chairman

8 / SANDFIRE ANNUAL REPORT 2013
M A N AG I N G D I R EC TO R ’ S R EP O R T
That said, the 2013 financial year was not without its challenges – both from a market and an operational perspective – and it is a tribute to the continued focus, hard work and dedication of our outstanding team of people, both at the DeGrussa Copper Mine and in our Perth head office, that we have been able to achieve so many outstanding milestones during the year. These have included:
Completing a successful and profitable open pit mining
operation to extract the high-grade Direct Shipping Ore (DSO) lying above the main DeGrussa deposits, as well significant volumes of open pit oxide copper and some sulphide material. The performance of the open pit mining team was outstanding and provided significant momentum to the Company while the underground mine was ramping up. Our DSO mining and sales program resulted in the production of 144,887 tonnes grading 23.6% Cu for 34,169 tonnes of copper and 15,218 ounces of gold;
Successfully ramping up the underground mining
operation, with six stopes on-line at the time of writing and the underground mining rate on track to achieve a steady-state annualised level of 1.5Mtpa from the December 2013 Quarter onwards. At the time of finalising this report, over 1 million tonnes of sulphide ore had been mined and delivered to the run-of-mine (ROM) pad since stoping commenced in October 2012;
Making a significant up-front investment in underground
capital development, which will stand the operation in excellent stead for the future. With the completion of the main Evans Decline during the year, development of the new Conductor 1 and Conductor 4/5 declines commenced from junctions off the Evans Decline to provide access to the deeper portions of the Conductor 1 and the Conductor 4 and 5 deposits. This will ensure that DeGrussa can source ore from multiple underground locations, providing stable and consistent production in the long term. Development of these new declines is progressing in line with our schedule and total underground development had exceeded the 15km mark at the time of writing this report;
Commissioning and ramping up of the 1.5Mtpa DeGrussa
Concentrator to full nameplate throughput, while continuing to optimise copper recoveries and metal production. The commissioning of modern base metal plants is never without its minor hiccups and during the
“With the ramp-up of production at DeGrussa now
largely complete, we are looking forward to another
successful year ahead as we continue to take measured steps towards realising our vision of building a leading
diversified mining company, in partnership with our
strategic commodity partners worldwide...”
– Sandfire Managing Director & CEO
Karl Simich
Dear Shareholders
I am delighted to report on what has been an extremely successful, productive and profitable year for Sandfire Resources – our first full financial year as a fully-fledged Australian copper producer.

SANDFIRE ANNUAL REPORT 2013 / 9
year we successfully managed and fine-tuned a number of elements of the processing circuit, while at the same time dealing with periods of lower copper recoveries arising from the campaign processing of stockpiled open pit sulphide material through the Concentrator. At the time of writing, campaign processing of this material had ceased with 100 per cent of the ore feed to the Concentrator comprising primary sulphide ore from the underground mine, which achieves pleasing recoveries ranging from 85-92 per cent and copper concentrate which meets specification;
Delivering a maiden net annual profit of $88 million for the 12 months to 30 June 2013. This impressive result was struck on strong sales revenue of $507.3 million from DSO, gold laterite and plant concentrate sales. The Company achieved cash flow from operating activities of $250.2 million and a profit before net finance and income tax of $142.1 million. Production for the year was 64,107 tonnes of copper and 42,679 ounces of gold;
Repaying a total of $95 million in project debt, which reduced the balance on our project finance facility to $285 million at financial year-end. A further $15 million was repaid during the September 2013 Quarter, reducing the balance to $270 million at the time of writing;
Growing our Mineral Resource inventory with successful
surface drilling campaigns targeting the deeper Conductor 4 and 5 deposits, resulting in an updated Mineral Resource statement as at 31 March 2013 comprising some 634,000 tonnes of contained copper and 795,000 ounces of gold. This represented the addition of 66,000 tonnes of copper and 149,000 ounces of gold (following depletion to the end of the March 2013 Quarter), pushing the mine life of the DeGrussa Operation out to late 2020; and
Commencing underground diamond drilling from newly established drilling positions off the Conductor 1 and Conductor 4/5 Declines from which extensions and potential repeats of the main VMS deposits can be targeted. These drill positions will be used to allow early grade drilling to define mining shapes in Conductor and 5 and to conduct in-fill drilling to enable conversion of Inferred Mineral Resources to Ore Reserves in these deposits. This marks the beginning of a very exciting new chapter for Sandfire.
The Company’s achievements have laid a solid foundation for us to resume the strong growth path as global economic conditions improve and demand for copper – which remains a core metal for industrialised economies – recovers in North America and the Euro Zone, and continues to be underpinned by the strong growth of the Chinese economy.
I firmly believe that the strength and stability of the Company’s performance reflects a number of factors including the quality of our core asset, our low cost structure and strong production
profile, our robust financial position and, most importantly, the quality and capability of our people.
Looking ahead, we have recently published a life-of-mine outlook for the DeGrussa Copper Mine, including detailed production, capital and operating cost guidance for the 2014 financial year which enables analysts and investors alike to gain a detailed understanding and insight into our business.
We are targeting production in the range of 65-75,000 tonnes of copper and 35-45,000oz of gold at a C1 cash operating cost of US$1.05-1.15/lb for the 12 months to 30 June 2014. We expect this production to be weighted towards the second half of the year due to expected variation in mined head grade across different stopes as our mining schedule unfolds. Our guidance for all-in C3 production costs including royalties and depreciation and amortisation is in the order of US$1.76/lb.
Subject to movements in the copper price and exchange rates, this should enable the DeGrussa Mine to continue to generate strong cash flows during the 2014 financial year – putting us in a strong position to fund all of the key elements of our business while at the same time supporting a balanced mix of organic growth programs, shareholder returns and, potentially, external project or corporate opportunities.
In September, we restructured the repayment profile for the remaining $285 million balance of the DeGrussa Project Finance Facility, putting in place a flatter repayment schedule which is consistent with our new Life of Mine plan and represents an eminently sensible outcome following our transition to steady-state operations.
The new schedule strengthens our working capital position and gives us additional head-room to meet all of our budgeted expenditures for FY2014, including capital expenditure, exploration and business development, as well as giving us the flexibility to consider the implementation of a dividend policy in the future. I should caution however that this remains subject to first meeting all of our existing commitments, including debt repayments, continued accelerated underground development, exploration and business development.
With the extremely difficult market conditions which have confronted the junior resource sector over the past 18 months, a number of attractive opportunities are emerging, both in the immediate Doolgunna region and elsewhere in Australia and overseas. Our business development team also continues to work hard to review and assess a wide range of opportunities in all corners of the globe.
I was extremely proud to join with our Chairman, Derek La Ferla, and other members of our team at the official opening of the DeGrussa Copper Mine, which was opened by Western Australian Premier, the Hon Colin Barnett MLA on Sunday, 4 August. I said at the opening ceremony that it was an opportunity not only to thank the many people who have

10 / SANDFIRE ANNUAL REPORT 2013
contributed to the Sandfire success story but also to celebrate the spirit of resilience and optimism which forms the backbone of Western Australia’s mining and exploration industry.
DeGrussa is without doubt one of the standout copper mines in the Asia-Pacific region with high grades and low costs. I am very pleased to say that we have taken nothing for granted in maximising the value of this wonderful asset and that everyone at Sandfire continues to work together with great focus and cohesion to write our next chapter of growth.
My sincere thanks go to the hard-working team at DeGrussa and also our senior management team – in particular our Chief Financial Officer Matt Fitzgerald, Chief Commercial Officer Rob Klug and Business Development Officer Bruce Hooper – who have worked tirelessly during the year to ensure that Sandfire’s transition to fully-fledged ASX-200 mining company has been completely seamless.
I would also like to take this opportunity to welcome Mike Spreadborough, who commenced as Chief Operating Officer in August 2013, and who has already made a significant mark with the Company.
With the ramp-up of production at DeGrussa now largely complete, we are looking forward to another successful year ahead as we continue to take measured steps towards realising our vision of building a leading diversified mining company, in partnership with our strategic commodity partners worldwide.
Yours faithfully,
Karl Simich
Managing Director & CEO
MANAGING DIRECTOR’S REPORT (continued)

SANDFIRE ANNUAL REPORT 2013 / 11
O FF I C I A L M I N E O P EN I N G
12 / SANDFIRE ANNUAL REPORT 2013
O P ER AT I O N S R E V I E WDEGRUSSA COPPER MINE
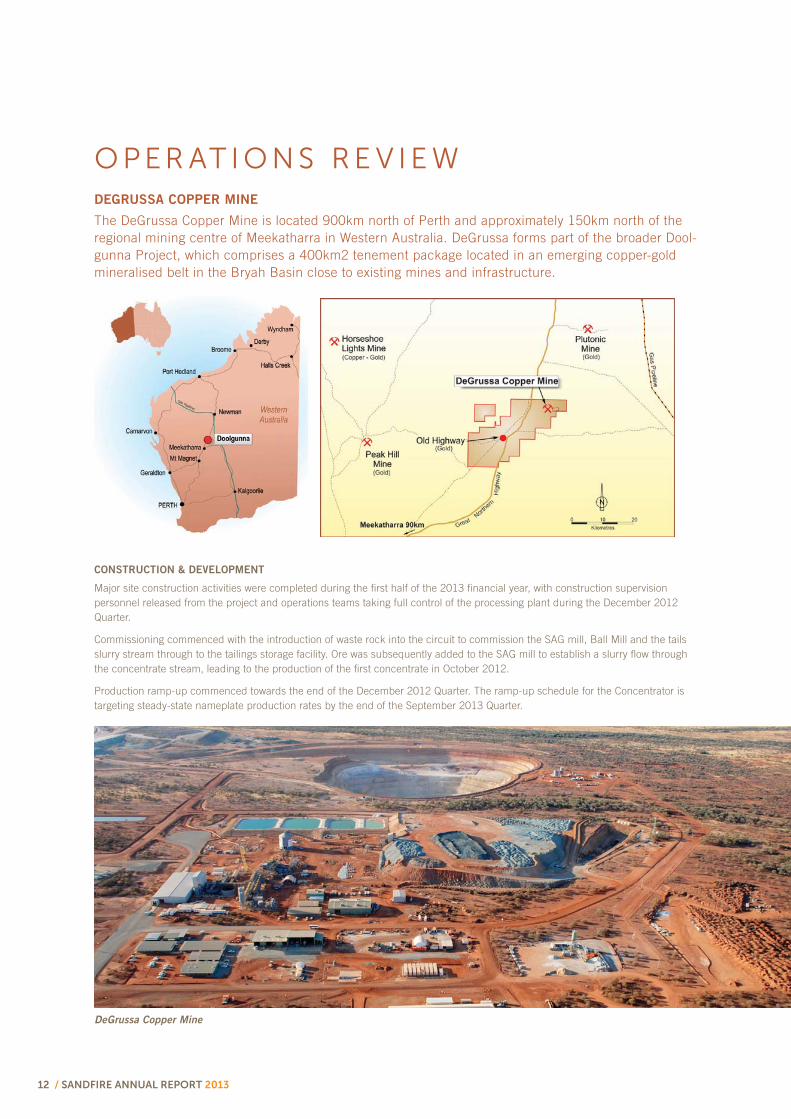
The DeGrussa Copper Mine is located 900km north of Perth and approximately 150km north of the regional mining centre of Meekatharra in Western Australia. DeGrussa forms part of the broader Dool-gunna Project, which comprises a 400km2 tenement package located in an emerging copper-gold mineralised belt in the Bryah Basin close to existing mines and infrastructure.
CONSTRUCTION & DEVELOPMENT
Major site construction activities were completed during the first half of the 2013 financial year, with construction supervision personnel released from the project and operations teams taking full control of the processing plant during the December 2012 Quarter.
Commissioning commenced with the introduction of waste rock into the circuit to commission the SAG mill, Ball Mill and the tails slurry stream through to the tailings storage facility. Ore was subsequently added to the SAG mill to establish a slurry flow through the concentrate stream, leading to the production of the first concentrate in October 2012.
Production ramp-up commenced towards the end of the December 2012 Quarter. The ramp-up schedule for the Concentrator is targeting steady-state nameplate production rates by the end of the September 2013 Quarter.
DeGrussa Copper Mine
SANDFIRE ANNUAL REPORT 2013 / 13
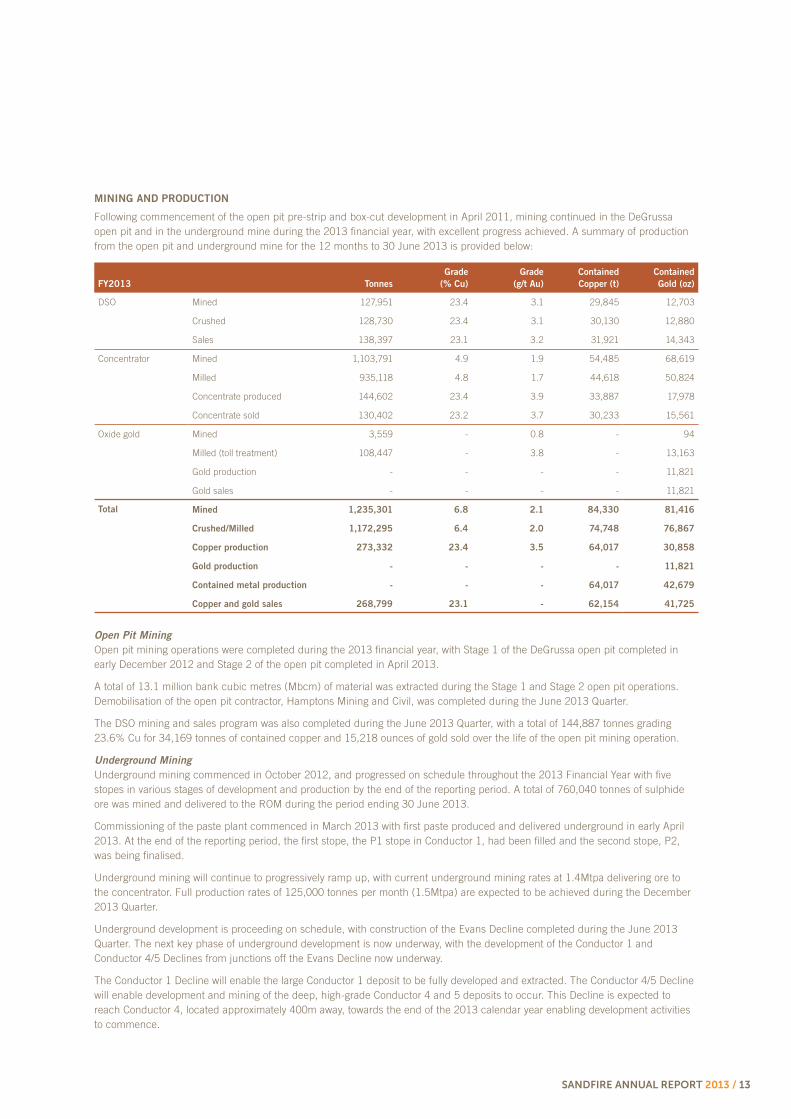
MINING AND PRODUCTION
Following commencement of the open pit pre-strip and box-cut development in April 2011, mining continued in the DeGrussa open pit and in the underground mine during the 2013 financial year, with excellent progress achieved. A summary of production from the open pit and underground mine for the 12 months to 30 June 2013 is provided below:
FY2013 Tonnes
Grade
(% Cu)
Grade
(g/t Au)
Contained
Copper (t)
Contained
Gold (oz)
DSO Mined 127,951 23.4 3.1 29,845 12,703
Crushed 128,730 23.4 3.1 30,130 12,880
Sales 138,397 23.1 3.2 31,921 14,343
Concentrator Mined 1,103,791 4.9 1.9 54,485 68,619
Milled 935,118 4.8 1.7 44,618 50,824
Concentrate produced 144,602 23.4 3.9 33,887 17,978
Concentrate sold 130,402 23.2 3.7 30,233 15,561
Oxide gold Mined 3,559 - 0.8 - 94
Milled (toll treatment) 108,447 - 3.8 - 13,163
Gold production - - - - 11,821
Gold sales - - - - 11,821
Total Mined 1,235,301 6.8 2.1 84,330 81,416
Crushed/Milled 1,172,295 6.4 2.0 74,748 76,867
Copper production 273,332 23.4 3.5 64,017 30,858
Gold production - - - - 11,821
Contained metal production - - - 64,017 42,679
Copper and gold sales 268,799 23.1 - 62,154 41,725
Open Pit Mining
Open pit mining operations were completed during the 2013 financial year, with Stage 1 of the DeGrussa open pit completed in early December 2012 and Stage 2 of the open pit completed in April 2013.
A total of 13.1 million bank cubic metres (Mbcm) of material was extracted during the Stage 1 and Stage 2 open pit operations. Demobilisation of the open pit contractor, Hamptons Mining and Civil, was completed during the June 2013 Quarter.
The DSO mining and sales program was also completed during the June 2013 Quarter, with a total of 144,887 tonnes grading 23.6% Cu for 34,169 tonnes of contained copper and 15,218 ounces of gold sold over the life of the open pit mining operation.
Underground Mining
Underground mining commenced in October 2012, and progressed on schedule throughout the 2013 Financial Year with five stopes in various stages of development and production by the end of the reporting period. A total of 760,040 tonnes of sulphide ore was mined and delivered to the ROM during the period ending 30 June 2013.
Commissioning of the paste plant commenced in March 2013 with first paste produced and delivered underground in early April 2013. At the end of the reporting period, the first stope, the P1 stope in Conductor 1, had been filled and the second stope, P2, was being finalised.
Underground mining will continue to progressively ramp up, with current underground mining rates at 1.4Mtpa delivering ore to the concentrator. Full production rates of 125,000 tonnes per month (1.5Mtpa) are expected to be achieved during the December 2013 Quarter.
Underground development is proceeding on schedule, with construction of the Evans Decline completed during the June 2013 Quarter. The next key phase of underground development is now underway, with the development of the Conductor 1 and Conductor 4/5 Declines from junctions off the Evans Decline now underway.
The Conductor 1 Decline will enable the large Conductor 1 deposit to be fully developed and extracted. The Conductor 4/5 Decline will enable development and mining of the deep, high-grade Conductor 4 and 5 deposits to occur. This Decline is expected to reach Conductor 4, located approximately 400m away, towards the end of the 2013 calendar year enabling development activities to commence.

14 / SANDFIRE ANNUAL REPORT 2013
OPERATIONS REVIEW (continued)
The development of these new declines is important as it will ensure that DeGrussa can source ore from multiple underground sources, providing stability and consistency of production in the long term. It will also facilitate the establishment of underground diamond drilling platforms later this year from which extensions and potential repeats of the Conductor 4 and 5 deposits can be targeted.
These drill positions will also be used to allow early grade drilling to define mining shapes in Conductor 4 and 5 and to conduct in-fill drilling to enable conversion of Inferred Mineral Resources to Ore Reserves in these deposits.
The performance of the paste fill plant stabilised and improved steadily, with filling of the Primary stopes in the Conductor 1 deposit completed during the September 2013 Quarter. Secondary stopes adjacent to these paste-filled Primary stopes will come on-line during the December 2013 Quarter.
PROCESSING
Plant commissioning progressed during the reporting period, with ore throughput and production maintained at nameplate levels of 125,000 tonnes per month during the September 2013 Quarter.
During the reporting period, overall concentrator recoveries were constrained in the short term while concentrator feed was supplemented by sulphide ore from the open pit. This material contributed around 30% of plant feed during the March and June 2013 Quarters, constraining overall copper recoveries to around 80%. Targeted recovery is +90% at steady-state production levels.
When primary sulphide ore from underground mining is wholly fed into the Concentrator, it achieves pleasing recoveries of 80-90% and copper concentrate which meets specification. A series of plant shutdowns were completed during the year to enable a number of identified improvements and modifications to the plant to be completed, including:
1. Tailings thickener feedwell to improve throughput and stability;
2. SAG mill grate closure to improve throughput, grind size and reduce Scats;
3. Cleaner circuit hopper modifications to improve plant stability, recovery and reliability;
4. Achievement of a coarser primary grind and greater process stability in grinding and flotation; and
5. Optimisation of the reagent suite.
The ramp-up of the DeGrussa Concentrator continued during the September 2013 Quarter, with further steady improvements achieved in all key metrics including:
377,719 tonnes milled for the Quarter at an average head feed grade of 5.3% Cu (June Quarter: 373,375 tonnes at 4.7% Cu), with the plant maintaining an annualised throughput rate of 1.5Mtpa;
increased overall recovery of 82% for the Quarter (June Quarter: 81%), reflecting the continuing impact of blending open pit transitional material with primary underground sulphide ore;
a 13% increase in concentrate production to 68,018 tonnes (June Quarter: 59,939 tonnes); and
a 15% increase in contained metal production to 16,446 tonnes of contained copper (June Quarter: 14,293 tonnes of contained copper.
Recovery continued to be optimised through increased plant stability, although processing of transitional open pit ore continued to have an impact.
The contribution of open pit sulphide material continues to reduce in line with the underground mine ramp-up. Campaign processing of this material ceased at the end of the September 2013 Quarter with 100 per cent of ore feed from the Concentrator expected to comprise primary sulphide ore from the underground mine from the December 2013 Quarter onwards.
Further optimisation programs, in line with plant ramp-up, were completed during the Quarter including the installation of control system upgrades to allow implementation of the expert control system, repairs to cyclone feed pumps and replacement of SAG mill grate plates.

SANDFIRE ANNUAL REPORT 2013 / 15
PRODUCTION GUIDANCE AND UPDATE
Sandfire confirms production guidance for the 12 months to 30 June 2014, as set out below:
Contained metal production
FY2014 (Guidance) FY2013 (Actual)
Cu (kt) Au (koz) Cu (kt) Au (koz)
Concentrator 65-75 35-45 34 18
DSO - - 30 13
Oxide gold - - - 12
Total 65-75 35-45 64 43
DSO 4 2
Oxide gold - 1
Total – FY 2012 4 3
Total – Project to date – FY 2013 68 46
FY2014 copper and gold production is expected to come solely from the concentrator, with the DSO and oxide gold production and sales programs now complete.
Guidance for key physicals and operational targets for the 2014 financial year is provided below:
Key Operational Targets
FY2014
Guidance
Ore mined 1.45Mt Solely from underground operations.
Ore processed 1.50Mt Includes stockpile of open pit sulphide (blending Q1 FY2014).
Mined grade – copper Mined grade – gold
5.2% Cu 1.8g/t Au
Mining Conductor 1 (~80%) and DeGrussa (~20%) orebodies.
Copper recovery 89% Copper recovery maintained at ~80% for Q1FY2014 (open pit blend), increasing to 92% into Q3-Q4FY2014.
Gold recovery 47% Currently ~40%, increasing to LOM target of 50% over FY2014.
Concentrate produced 280kt Based on mid-point of production guidance.
Concentrate grade – copper Concentrate grade – gold
25% Cu 5g/t Au
Targeted on spec concentrate grade and quality.
Concentrate and metal production is expected to be weighted towards the second half of FY2014. This is due to variability in the expected mined head grade, which is forecast to be lower during the December 2013 Quarter and higher in the March and December 2014 Quarters, while still averaging 5.2% Cu for the full-year. This in turn is due to the underground mining sequence and variability in the average mined head grade of different stopes.
Copper production for the September 2013 Quarter increased to 16,500 tonnes (June 2013 Quarter: 14,293 tonnes) and gold production was 8,500 ounces, which was at the upper end of guidance, with the DeGrussa Copper Mine either achieving or exceeding most of its key performance indicators (KPI’s) for the September 2013 Quarter.
C1 cash operating costs for the Quarter were US$1.28/lb (June 2013 Quarter: US$1.37/lb).
SALES & MARKETING
Metal sales for the 2013 financial year totalled 62,154 tonnes of copper metal and 41,725 ounces of gold.
DSO Shipments
The DSO mining and sales program was completed during the reporting period, with a total of 144,887 tonnes grading 23.6% Cu for 34,169 tonnes of contained copper and 15,218 ounces of gold sold on a project-to-date basis.
Copper Concentrate Shipments
For the 2013 financial year, 130,402 tonnes of plant concentrate grading 23.2% Cu and containing 30,233 tonnes of copper metal was shipped.

16 / SANDFIRE ANNUAL REPORT 2013
OPERATIONS REVIEW (continued)
Copper Concentrate Sales Agreements
During the reporting period, Sandfire secured four sales contracts for DeGrussa’s copper concentrate production, following a highly successful marketing process for DeGrussa concentrate. The sales contracts, for up to 3-year terms, have been signed with international trading companies and smelters.
Sandfire’s marketing strategy is for sales contracts covering up to 85 per cent of annual copper concentrate production from DeGrussa, with the remainder available for delivery into the spot market and production variances.
DeGrussa Laterite Gold Processing
Sandfire entered into an Ore Sale and Purchase Agreement with Barrick (Plutonic) Ltd to process the lateritic gold material mined as part of the open pit operations. During the reporting period, 108,447 tonnes grading 3.8g/t Au was processed for the production and sale of 11,821oz of gold.
FEASIBILITY STUDIES, METALLURGY, ORE RESERVES AND MINERAL RESOURCES
Oxide Copper Feasibility Study
Work continued throughout year to progress a Feasibility Study on a heap leach/solvent extraction and electrowinning (SX/EW) recovery option for the stockpiled copper oxide ore at DeGrussa. Currently, the Project has been developed to provide 6,000-7,000 tonnes of copper cathode per year for 5 years.
An engineering study of the oxide copper crushing-scrubbing plant by GR Engineering Services is also underway, with excellent results achieved from scrubbing trials which demonstrated that excellent copper recoveries can be achieved.
A composite of +150um scrubbed material was sent to Worley Parsons and Hydrogeosense USA, with testing underway to complete the required detailed heap leach design. ALS AMMTEC has commenced additional bottle roll and acid consumption testing of the bulk scrubbing testing to understand the acid consumption and total copper extraction rates to be used in the financial modelling.
Outotec has completed the thickening testing of the reject of the scrubbing testing and is preparing a report on this testwork program. ATC Williams has been given the results of this testing and the amount and rates of deposition of the composites for the final design for the oxide TSF.
Western Process Equipment has started to develop the equipment list for the scrubbing plant.
Xstrata Tech has a well-developed flow-sheet for the design of the SX/EW part of the project and is specifying the equipment and pricing for the SX/EW equipment.
The proposed layout for the oxide copper plant was completed during the September 2013 Quarter, with the following sections of the Project now defined, namely:
The scrubbing and resultant tailings deposition design;
The heap leach design and stacking methods;
The solvent extraction and electro-winning (SX-EW) design; and
Ancillary infrastructure (i.e. power-lines).
Ongoing technical development work is limited to the following:
Hydrodynamic column testing to evaluate the geotechnical suitability of the material under leach conditions (to be completed by the end of November 2013); and
Bottle-roll testing to determine the optimum acid concentrations, extractions and acid consumptions for modelling purposes (also to be completed by the end of November 2013).
In anticipation of a positive outcome from the Feasibility Study, the Company will submit a mining proposal and works approval to the regulators by the end of October 2013 to minimise the timeline to implementation once Board approval is received.

SANDFIRE ANNUAL REPORT 2013 / 17
DEGRUSSA EXPLORATION
Overview
During the year, Sandfire continued to progress a tightly focused, multi-disciplinary exploration campaign to unlock the broader potential of the Doolgunna region for additional VMS deposits. Cutting-edge geophysical and geochemical techniques, in conjunction with detailed geological interpretation and analysis, resulted in significant advances in the vectoring towards potential accumulations of VMS mineralisation within the DeGrussa mine stratigraphic corridor.
A relatively limited surface diamond drilling program was conducted during the March 2013 Quarter targeting extensions to Conductor 4 and Conductor 5. This program yielded immediate success, resulting in an increase in the Company’s high-grade Mineral Resource inventory (see below).
An important focus during the second half of CY2013 will be the establishment of new underground drilling positions from the new Conductor 1 and Conductor 4/5 declines, which will enable the Company to target depth extensions and potential repeats of the deep, high-grade VMS lenses.
This important phase of the Company’s exploration program at DeGrussa has only just commenced and is expected to accelerate as additional underground drilling positions become available.
The breakdown of metres drilled for FY2013 is shown below:
Drilling
AC/RAB Drilling
(m)
RC Drilling
(m)
Diamond Drilling
(m)
Total Drilling
(m)
Q1FY2013 21,782 - 9,168 30,950
Q2FY2013 17,384 2,751 7,198 27,332
Q3FY2013 33,423 2,919 8,823 45,165
Q4FY2013 35,552 3,310 4,866 43,729
FY2013 – TOTAL 108,141 8,980 30,055 147,176
Increase in High Grade Mineral Resource
The Mineral Resource for the DeGrussa Project as at 31 March 2013 increased to 13.4 million tonnes grading 4.7% Cu and 1.9g/t Au for 634,000 tonnes of contained copper and 795,000oz of contained gold. An additional 66,000 tonnes of contained copper and 149,000oz gold has been added to DeGrussa’s mineral inventory following depletion to March 2013, with the additional Inferred Mineral Resource now incorporated into the DeGrussa mine plan.
18 -
15 -
12 -
9 -
6 -
3 -
0 -
- 960
- 880
- 800
- 720
- 640
- 560
- 480
- 400
- 320
- 240
- 160
- 80
- 0
Cont
ained
Cop
per (
000t
) / C
onta
ined
Gol
d (0
00oz
)
Mine
ral R
esou
rce (
Mt)
Mineral Resource (Mt) Contained Copper (000t) Contained Gold (000oz)December 2012
Development Phase
DeGrussaConductor 1Conductor 4Conductor 5
DeGrussaConductor 1
DeGrussaConductor 1Conductor 4
Discovery Phase
February 2010 July 2010 March 2012September 2010
Production & Operation
DeGrussaConductor 1Conductor 4Conductor 5DSO, Oxide
DeGrussaConductor 1Conductor 4Conductor 5DSO, Oxide
Extra C4, Extra C5
March 2013
DeGrussa Resource Growth

18 / SANDFIRE ANNUAL REPORT 2013
OPERATIONS REVIEW (continued)
The majority of the increase in tonnage and contained metal has come from successful surface drilling programs at DeGrussa targeting the two deepest high-grade deposits – Conductor 4 and Conductor 5. These drilling programs were guided by information and insights gained from structural interpretation from mapping within the underground mine and open pit.
This has enabled Sandfire to develop an enhanced understanding of the lithological sequence, structural setting and, consequently, the positioning of potential accumulations of VMS mineralisation at DeGrussa.
The surface drilling programs have resulted in the addition of 56,000 tonnes of contained copper (an increase of 42%) and 63,000 ounces of contained gold (an increase of 34%) in total Inferred Mineral Resources for these two deposits, as shown below:
Mineral Resource – Conductor 4 and 5
Tonnes
(Mt)
Copper
(%)
Gold
(g/t)
Contained Copper
(t)
Contained Gold
(oz)
March 2012 – Total 2.7 4.9 2.1 134,000 185,000
Increase 0.8 6.7 2.4 56,000 63,000
March 2013 – Total 3.5 5.3 2.2 190,000 248,000
The March 2013 Mineral Resource also reflects updates to DeGrussa and Conductor 1, reflecting increased understanding of the orebodies gained from mapping, grade control drilling, and mining activities.
The revised Mineral Resource for Conductor 4, incorporating the results of diamond drilling targeting the interpreted eastern extension of the deposit, is shown below:
Mineral Resource – Conductor 4
Tonnes
(Mt)
Copper
(%)
Gold
(g/t)
Contained Copper
(t)
Contained Gold
(oz)
Indicated 1.0 5.3 1.8 54,000 59,000
Inferred 1.1 4.4 1.7 48,000 60,000
March 2013 – Total 2.1 4.8 1.7 102,000 119,000
This represents a 0.4Mt increase in tonnage (25% increase) and 24,000t Cu increase in contained copper (31% increase) compared with the March 2012 Mineral Resource.
Diamond drilling to test an interpreted sub-parallel lens stratigraphically below Conductor 5 passed through the deposit and encountered significantly thicker massive sulphide intersection than previously interpreted, highlighting the potential to materially increase the Mineral Resource in this area.
Three diamond holes were completed during the December 2012 and March 2013 Quarters to test this thickened position, with the results incorporated into a revised Mineral Resource estimate, as set out below:
Mineral Resource – Conductor 5
Tonnes
(Mt)
Copper
(%)
Gold
(g/t)
Contained Copper
(t)
Contained Gold
(oz)
Inferred 1.4 6.2 2.8 88,000 129,000
March 2013 - Total 1.4 6.2 2.8 88,000 129,000
This represents a 0.4Mt increase in tonnage (40% increase) and 32,000t Cu increase in contained copper (57% increase) compared with the March 2012 Mineral Resource.
Drilling of the Inferred Resource in C4 and C5 will be undertaken from underground when development has progressed sufficiently to allow more practical and less expensive drilling positions given the depth of these ore bodies. Drilling of the C4 Inferred Resource is planned in the first half of CY2014.
Ore Reserve and Mine Plan Update
The Mine Plan is Sandfire’s internal plan which schedules forecasted production parameters, operating and capital works programs. It is developed with the assistance of both internal Sandfire employees and external consultants and includes both Mineral Resources and Ore Reserves.

SANDFIRE ANNUAL REPORT 2013 / 19
The table below compares the DeGrussa Mine Plan to the stated Mineral Resource and Ore Reserve by key output and mining tonnes (for full details of the Mineral Resource and Ore Reserve refer below).
March 2013 Comparison of the Underground Mine Plan, Mineral Resource and Ore Reserve
DeGrussa Underground Mine
Tonnes
(Mt)
Copper
(%)
Gold
(g/t)
Contained Copper
(t)
Contained Gold
(oz)
Mine Plan 10.5 4.9 1.8 512,000 597,000
Mineral Resource 10.2 5.7 2.1 586,000 688,000
Ore Reserve 7.9 5.0 1.7 393,000 434,000
DeGrussa Underground Mine by orebody
Tonnes
(Mt)
DG
(Mt)
C1
(Mt)
C4
(Mt)
C5
(Mt)
Mine Plan 10.5 1.6 5.5 1.9 1.5
Mineral Resource 10.2 1.4 5.2 2.1 1.4
Ore Reserve 7.9 1.6 5.3 1.0 -
Note: Mine Plan and Ore Reserve include mining dilution.
The Company continues to incorporate Inferred Mineral Resources from Conductor 4 and 5 into its Mine Plan process due to the geological continuity and high copper grade tenor of the deposits.
Work commenced on the Conductor 4/5 access decline during June to develop and access these orebodies from 2014 onwards. As part of this decline development, a drill position will be established to commence grade control drilling into the C4 and C5 orebodies which the Company expects will result in additional conversion of the C4 and C5 Inferred Mineral Resource to Ore Reserve.
The drilling position will also be used to test down-dip extensions of C4 and targets below and down-plunge of C5. Exploration drilling is targeted to commence during the first half of 2014.
Ore Reserves have been updated based on the March 2013 Mineral Resource model and depletions up to 31 March 2013.
March 2013 Comparison of the Underground Mine Plan, Mineral Resource and Ore Reserve
DeGrussa Mine Ore Reserve,
net of depletion
Tonnes
(Mt)
Copper
(%)
Gold
(g/t)
Contained Copper
(t)
Contained Gold
(oz)
Underground Mine 7.9 5.0 1.7 393,000 434,000
Open Pit - Stockpiles 3.1 1.5 1.1 45,000 104,000
March 2013 - Total 11.0 4.0 1.5 439,000 538,000
The open cut mine was almost complete at the end of March 2013, with Ore Reserves of 3.1Mt grading 1.5% Cu and 1.1g/t Au containing 45,000t Cu and 104,000oz Au, representing chalcocite, sulphide and oxide copper stockpiles.
Underground Exploration
During the Quarter, exploration within the DeGrussa mine corridor has concentrated on:
Underground diamond drilling targeting strike and dip extensions to the Conductor 1 East Zone, which has allowed the Company’s exploration team to refine the geological model and subsequent mine design on the periphery of the orebody. Drilling targeting the Conductor 1 Zone down-dip will proceed as drilling positions become available; and
The establishment of new underground drilling positions from the Conductor 4 Decline, which will continue to be an important focus for the Company during the second half of CY2013. This has allowed underground diamond drilling to commence in the last week of the Quarter. The initial target zone for underground diamond drilling is the stratigraphically contiguous zone immediately down-plunge from the Conductor 4 deposit. Surface drilling in this area in 2010 only partially closed the resource potential, as shown in Figure 2 below. Subsequent work and advances in geological understanding have highlighted the opportunity that remains in this location.

20 / SANDFIRE ANNUAL REPORT 2013
OPERATIONS REVIEW (continued)
DGUE00128.7m @ 2.7% Cu
2.7g/t Au, 2.2% Zn
733800mE 734000mE 734200mE 734400mE l l l l
7173
200m
N
7173
400m
N
l
l
DGUE0015
DGUE0014
DGUE0013
DGUE0012
51m
43m
38mEXISTING
DRILLHOLE PIERCEPOINT
0.0 - 2.52.5 - 5.05.0 - 10.010.0 - 25.025.0 - 50.050.0 - 75.0>75.0 Current C4Orebody Wireframe Area for potentialextension ofConductor 4
Copper (%) X True Width (m)
DGUE00133.5m @ 3.4% Cu
1.8g/t Au, 1.75% Zn
ASSAY RESULTS FOR COMPLETED HOLES, AND PENDING RESULTS
DOOLGUNNA REGIONAL EXPLORATION
Regional exploration conducted during the reporting period included follow-up Reverse Circulation (RC) drilling of first pass geochemical aircore anomalies at the North Robinson Range regional target, which returned a series of encouraging anomalous results and geochemistry.
An in-fill aircore geochemistry program was subsequently completed at North Robinson Range, which further enhanced the prospectivity of this target.
At the Airstrip South target, RC drilling was completed targeting the DGRC672 VTEM and geochemistry anomaly. This drilling was a part of the systematic program aimed at evaluating more distal extensions of the prospective NE-SW trending stratigraphy in conjunction with interpretation of geophysical and geochemical anomalism. The geology model of this anomaly is evolving.
Following the completion of a 3D seismic surface survey of the area above the Conductor 5 orebody during 2012, further work was conducted by HiSeis during the year to acquire additional data with the aim of producing a seismic model that accurately reflects the drill-proven sub-surface geology. Processing and interpretation of this data is currently being undertaken by HiSeis.
A program of 61 aircore drill-holes completed as part of the Gascoyne West In-fill Geochemistry Program during the year returned a number of anomalous intersections. The lithological and geochemical information gained from these aircore programs is crucial in redefining the detailed interpreted geology of this section of the Bryah Basin and defining target areas for future field testing.
Systematic, regional grid Aircore drilling, in conjunction with limited, targeted Reverse Circulation drilling, has also identified a number of strong Copper-Gold geochemical anomalies related to DeGrussa-type stratigraphy located roughly 5km south-west of the DeGrussa mine site (Cow Hole Bore).
The anomalous Copper-Gold values are associated with volcanogenic sediments, basalts and dolerites, extending over a strike length exceeding 3.5km. Exploration in the first half of FY2014 will focus on better defining the tenor and disposition of the higher grade portions of the anomalous geochemistry prior to more intensive drill testing.
The DeGrussa regional land-holding is made up of over 400km2 of contiguous tenements, many of which have never been explored using a modern understanding of the regolith. In the southern extents of the land-holding little work has been completed while the Company focused on testing potential DeGrussa extensions in the immediate mine corridor.
Conductor 4 down-plunge underground diamond drilling program

SANDFIRE ANNUAL REPORT 2013 / 21
Drilling during the Quarter has seen the first-pass of systematic drilling at the Shed Well and South Robinson Range prospects. This drilling has penetrated transported material (up to 80m thick) and, for the first time, allowed detailed geological interpretation of this area to be undertaken.
Drilling on 800m x 100m reconnaissance lines has identified a number of horizons of jasperoidal chert, some with sulphides, and numerous geochemical anomalies that require follow-up work. Key areas of focus for this regional drilling campaign undertaken during the Quarter are shown in Figure 3 below:
Work on these prospects will continue into the next Quarter as the Company’s geological team continues to develop an enhanced geological understanding of this area.
Aerial photograph showing lines of Aircore drilling completed
22 / SANDFIRE ANNUAL REPORT 2013
OPERATIONS REVIEW (continued)
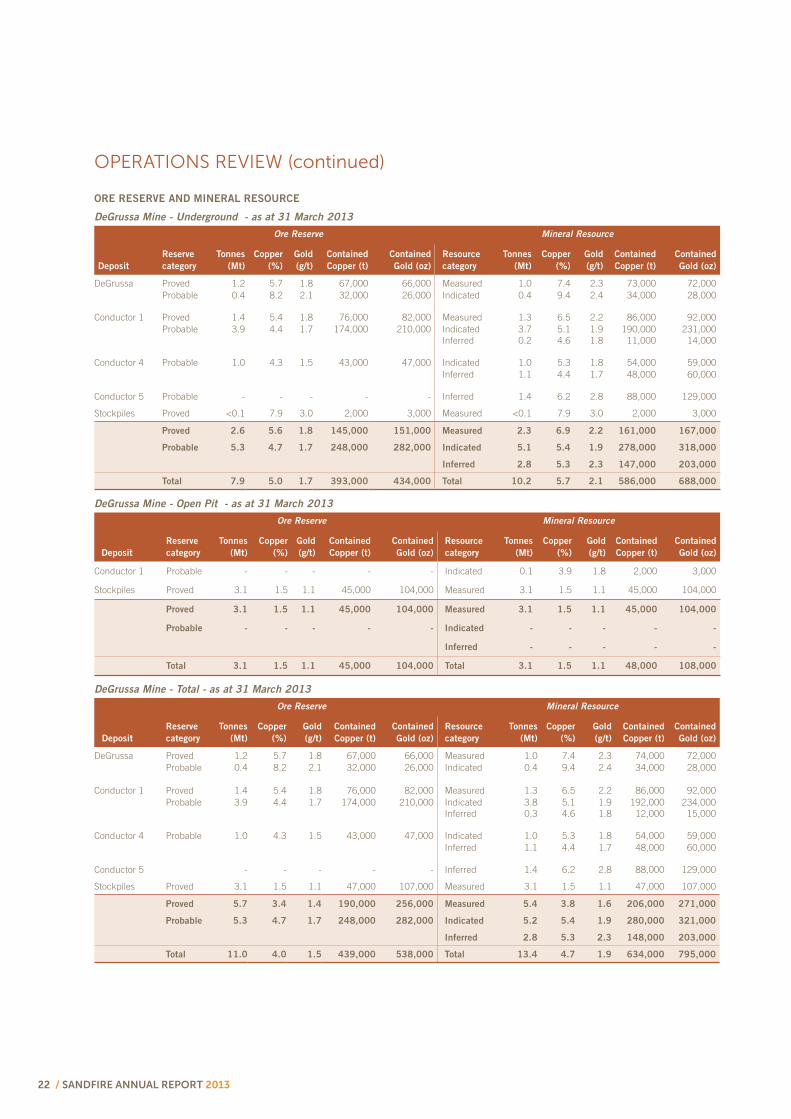
ORE RESERVE AND MINERAL RESOURCE
DeGrussa Mine - Underground - as at 31 March 2013
Ore Reserve Mineral Resource
Deposit
Reserve
category
Tonnes
(Mt)
Copper
(%)
Gold
(g/t)
Contained
Copper (t)
Contained
Gold (oz)
Resource
category
Tonnes
(Mt)
Copper
(%)
Gold
(g/t)
Contained
Copper (t)
Contained
Gold (oz)
DeGrussa Proved 1.2 5.7 1.8 67,000 66,000 Measured 1.0 7.4 2.3 73,000 72,000Probable 0.4 8.2 2.1 32,000 26,000 Indicated 0.4 9.4 2.4 34,000 28,000
Conductor 1 Proved 1.4 5.4 1.8 76,000 82,000 Measured 1.3 6.5 2.2 86,000 92,000Probable 3.9 4.4 1.7 174,000 210,000 Indicated 3.7 5.1 1.9 190,000 231,000
Inferred 0.2 4.6 1.8 11,000 14,000
Conductor 4 Probable 1.0 4.3 1.5 43,000 47,000 Indicated 1.0 5.3 1.8 54,000 59,000Inferred 1.1 4.4 1.7 48,000 60,000
Conductor 5 Probable - - - - - Inferred 1.4 6.2 2.8 88,000 129,000
Stockpiles Proved <0.1 7.9 3.0 2,000 3,000 Measured <0.1 7.9 3.0 2,000 3,000
Proved 2.6 5.6 1.8 145,000 151,000 Measured 2.3 6.9 2.2 161,000 167,000
Probable 5.3 4.7 1.7 248,000 282,000 Indicated 5.1 5.4 1.9 278,000 318,000
Inferred 2.8 5.3 2.3 147,000 203,000
Total 7.9 5.0 1.7 393,000 434,000 Total 10.2 5.7 2.1 586,000 688,000
DeGrussa Mine - Open Pit - as at 31 March 2013
Ore Reserve Mineral Resource
Deposit
Reserve
category
Tonnes
(Mt)
Copper
(%)
Gold
(g/t)
Contained
Copper (t)
Contained
Gold (oz)
Resource
category
Tonnes
(Mt)
Copper
(%)
Gold
(g/t)
Contained
Copper (t)
Contained
Gold (oz)
Conductor 1 Probable - - - - - Indicated 0.1 3.9 1.8 2,000 3,000
Stockpiles Proved 3.1 1.5 1.1 45,000 104,000 Measured 3.1 1.5 1.1 45,000 104,000
Proved 3.1 1.5 1.1 45,000 104,000 Measured 3.1 1.5 1.1 45,000 104,000
Probable - - - - - Indicated - - - - -
Inferred - - - - -
Total 3.1 1.5 1.1 45,000 104,000 Total 3.1 1.5 1.1 48,000 108,000
DeGrussa Mine - Total - as at 31 March 2013
Ore Reserve Mineral Resource
Deposit
Reserve
category
Tonnes
(Mt)
Copper
(%)
Gold
(g/t)
Contained
Copper (t)
Contained
Gold (oz)
Resource
category
Tonnes
(Mt)
Copper
(%)
Gold
(g/t)
Contained
Copper (t)
Contained
Gold (oz)
DeGrussa Proved 1.2 5.7 1.8 67,000 66,000 Measured 1.0 7.4 2.3 74,000 72,000Probable 0.4 8.2 2.1 32,000 26,000 Indicated 0.4 9.4 2.4 34,000 28,000
Conductor 1 Proved 1.4 5.4 1.8 76,000 82,000 Measured 1.3 6.5 2.2 86,000 92,000Probable 3.9 4.4 1.7 174,000 210,000 Indicated 3.8 5.1 1.9 192,000 234,000
Inferred 0.3 4.6 1.8 12,000 15,000
Conductor 4 Probable 1.0 4.3 1.5 43,000 47,000 Indicated 1.0 5.3 1.8 54,000 59,000Inferred 1.1 4.4 1.7 48,000 60,000
Conductor 5 - - - - - Inferred 1.4 6.2 2.8 88,000 129,000
Stockpiles Proved 3.1 1.5 1.1 47,000 107,000 Measured 3.1 1.5 1.1 47,000 107,000
Proved 5.7 3.4 1.4 190,000 256,000 Measured 5.4 3.8 1.6 206,000 271,000
Probable 5.3 4.7 1.7 248,000 282,000 Indicated 5.2 5.4 1.9 280,000 321,000
Inferred 2.8 5.3 2.3 148,000 203,000
Total 11.0 4.0 1.5 439,000 538,000 Total 13.4 4.7 1.9 634,000 795,000
SANDFIRE ANNUAL REPORT 2013 / 23
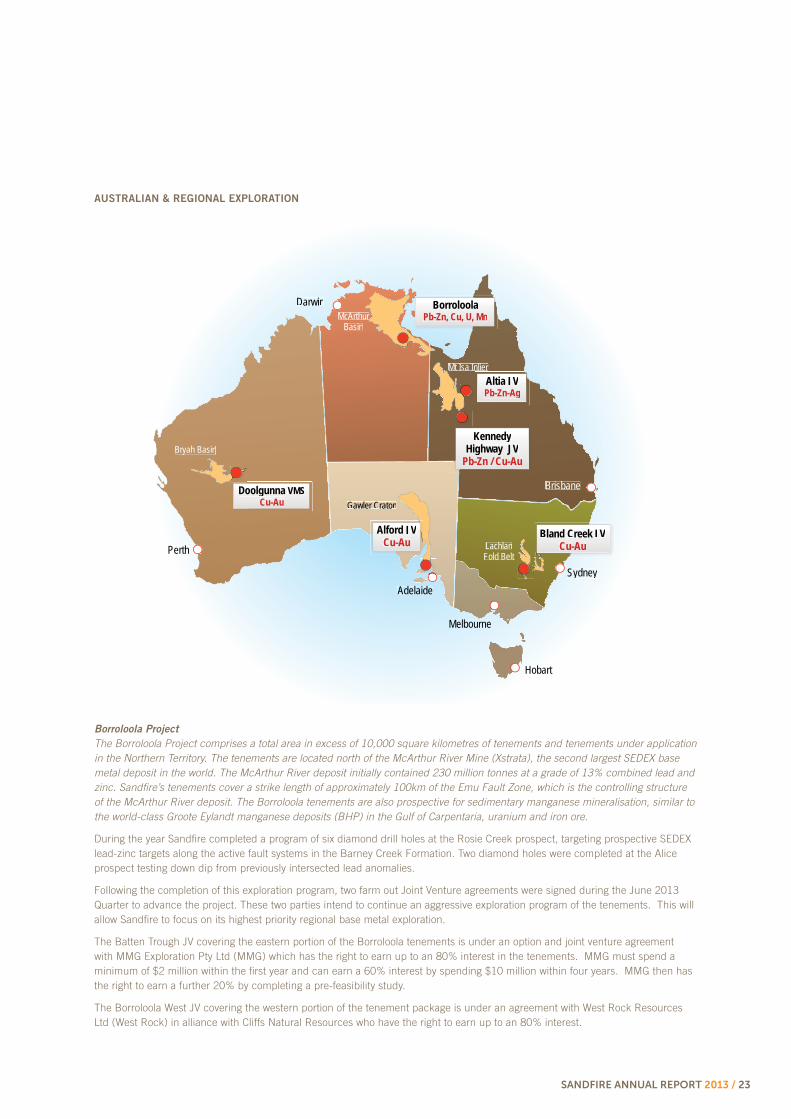
AUSTRALIAN & REGIONAL EXPLORATION
Borroloola Project
The Borroloola Project comprises a total area in excess of 10,000 square kilometres of tenements and tenements under application in the Northern Territory. The tenements are located north of the McArthur River Mine (Xstrata), the second largest SEDEX base metal deposit in the world. The McArthur River deposit initially contained 230 million tonnes at a grade of 13% combined lead and zinc. Sandfire’s tenements cover a strike length of approximately 100km of the Emu Fault Zone, which is the controlling structure of the McArthur River deposit. The Borroloola tenements are also prospective for sedimentary manganese mineralisation, similar to the world-class Groote Eylandt manganese deposits (BHP) in the Gulf of Carpentaria, uranium and iron ore.
During the year Sandfire completed a program of six diamond drill holes at the Rosie Creek prospect, targeting prospective SEDEX lead-zinc targets along the active fault systems in the Barney Creek Formation. Two diamond holes were completed at the Alice prospect testing down dip from previously intersected lead anomalies.
Following the completion of this exploration program, two farm out Joint Venture agreements were signed during the June 2013 Quarter to advance the project. These two parties intend to continue an aggressive exploration program of the tenements. This will allow Sandfire to focus on its highest priority regional base metal exploration.
The Batten Trough JV covering the eastern portion of the Borroloola tenements is under an option and joint venture agreement with MMG Exploration Pty Ltd (MMG) which has the right to earn up to an 80% interest in the tenements. MMG must spend a minimum of $2 million within the first year and can earn a 60% interest by spending $10 million within four years. MMG then has the right to earn a further 20% by completing a pre-feasibility study.
The Borroloola West JV covering the western portion of the tenement package is under an agreement with West Rock Resources Ltd (West Rock) in alliance with Cliffs Natural Resources who have the right to earn up to an 80% interest.
Bland Creek JVCu-Au
Brisbane
KennedyHighway JV
Pb-Zn / Cu-Au
Altia JVPb-Zn-Ag
McArthurBasin
BorroloolaPb-Zn, Cu, U, Mn
Darwin
AdelaideSydney
Melbourne
Hobart
LachlanFold Belt
Mt Isa Inlier
Perth
Alford JVCu-Au
Gawler Craton
Bryah Basin
Doolgunna VMSCu-Au

24 / SANDFIRE ANNUAL REPORT 2013
OPERATIONS REVIEW (continued)
West Rock is focussing on the manganese and copper potential of the tenements. West Rock must spend a minimum of $0.5 million within the first year and can earn a 51% interest by the expenditure of $1.5 million within two years. West Rock then have the right to earn a further 19% by expenditure of a further $2.5 million within two years and a further 10% for a total 80% interest by expending $7 million within six years.
Sandfire retains a 100% interest in EL26555, where it intends to complete a shallow drilling program at the Hells Gate iron ore prospect during the 2013 field season.
Kennedy Highway Project
The Kennedy Highway Project includes five exploration licenses in the Eastern Succession of the Mount Isa Block, south of Cloncurry, Queensland. The tenements are prospective for Broken Hill Type lead-zinc-silver deposits similar to the high grade Cannington mine (BHP) to the north and Iron Oxide Copper-Gold deposits similar to the Ernest Henry Mine (Xstrata). An option agreement for a Joint Venture is in place on EPM15948 with Global Resources Corporation Ltd, where Sandfire can earn up to an 80 per cent interest by funding exploration. Tenements EPM19418 and 19453 (Lilleyvale) are 100% owned by Sandfire and a further two tenement applications are expected to be granted this year.
During the year Sandfire completed two drillholes to test combined magnetic and gravity targets under deep cover in the option agreement tenement. Geochemical analysis returned no significant results. The minimum commitment for the Joint Venture has now been completed.
The Lilleyvale tenement, EPM12345 was granted during the December 2012 Quarter and the Company completed a gravity survey during the June Quarter to better define a deep gravity target for a Broken Hill type system. Drilling is planned later in the season.
Altia Project
The Altia Project is located 70km south-east of Cloncurry in north-west Queensland. The project includes an option to Joint Venture into two areas encompassing 43.7 km2 with Breakaway Resources Limited (ASX: BRW) to earn up to 80% of the project. The tenements are prospective for Broken Hill style lead-zinc-silver deposits such as the nearby Cannington deposit (BHP) to the south and the Ernest Henry Iron Oxide copper-gold deposits (Xstrata) to the northwest. The Joint Venture area includes the Altia Deposit, where previous exploration has defined the deposit and a number of regional targets.
Sandfire signed a Joint Venture agreement for the Altia Project in September 2012, under which the Company can earn an initial 60% interest by spending A$4 million on exploration over a three-year period, and can then elect to increase its stake to 80% by spending a further A$4 million over the subsequent three years. Sandfire can withdraw after spending a minimum of A$1 million within the first year of the Joint Venture.
Exploration commenced on the Altia project shortly after signing the Joint Venture agreement with the mobilisation of a diamond drill rig. Five diamond holes were completed to test the high priority Altia South, Altia North and Boralis prospects.
A combined RC and drilling program was commenced in the September 2013 Quarter to target high priority targets along strike from the Altia deposit for Broken Hill style systems.
Bland Creek Project
The Bland Creek Project lies 50km south-east of West Wyalong, in the Lachlan Fold Belt of New South Wales. The tenements are prospective for porphyry copper-gold mineralisation as found at Northparkes (Rio Tinto), Cadia (Newcrest) and Cowal (Barrick). The granted exploration licence, EL 5792, is held under a farm-in agreement to earn up to 80% with Straits Resources Ltd (ASX:SRQ) and the surrounding tenements are 100% owned by Sandfire.
Sandfire completed a major aircore and diamond drilling program at the Bland Creek Project during the reporting period.
Aircore drilling on the Currumburrama project under the Joint Venture generated a number of targets, including the Monaco Prospect, with subsequent drilling extending the Monaco copper anomaly to over 1 km.
Drilling conducted at the Bland Creek Project during the reporting period has extensively tested the prospective areas within the joint venture tenement.
The minimum drilling commitment in the Joint Venture has been completed.
Alford Project
The Alford Project on the Yorke Peninsular lies 20km north-east of Wallaroo, South Australia in the southern portion of the Gawler Craton. The tenements are prospective for iron oxide copper-gold mineralisation as found at Prominent Hill (OZ Minerals), Olympic Dam (BHP) and Hillside (Rex Minerals). The project includes an option to Joint Venture into the Alford project (EL3969, PM268) with Argonaut Resources Limited (ASX: ARE) to earn up to 75% of the project. A further 100% Sandfire owned tenement has been granted on the Yorke Peninsula (EL5272).

SANDFIRE ANNUAL REPORT 2013 / 25
Drilling commenced during the March Quarter with a regional aircore program to define the most prospective projects and define the highest ranking deep drill targets. Ground geophysical Induced Polarisation (IP) surveys were completed covering the Alford East and Glenrae prospects, and several targets were identified potentially associated with sulphides at depth.
A program of diamond drilling was subsequently completed to test these geophysical, geochemical and geological targets. Further work is planned to follow up on these targets in the December 2013 Quarter and will include further geographical surveys, including IP and Gravity with follow up Aircore and diamond drilling.
INTERNATIONAL EXPLORATION
South America
Project generation is focused on Chile and Peru, targeting large-scale mineralisation systems prospective for copper.
Ten tenements have now been granted in the Lima Province of Peru covering large scale alteration systems identified on satellite imagery.
CORPORATE
Board and management
During the year, Sandfire appointed experienced and highly regarded Australian mining executive, Mr Paul Hallam, to its Board as an independent non-executive Director. The appointment further strengthens and diversifies Sandfire’s Board, bringing significant experience in the areas of technical and operational management at senior levels in the global mining industry.
In addition, Sandfire has also appointed highly experienced mining operations and project executive Mike Spreadborough as its new Chief Operating Officer, commencing August 2013. Mr Spreadborough joins Sandfire from his most recent role as Chief Operating Officer for Inova Resources Ltd (formerly Ivanhoe Australia). Mr Spreadborough was appointed to replace Martin Reed, who resigned as Chief Operating Officer to pursue another opportunity in the Western Australian mining sector.
Finance facilities
Sandfire completed two repayments against the DeGrussa Project loan facility of $50 million in March 2013 and $45 million in June 2013, reducing the outstanding facility balance from $380 million to $285 million.
Subsequent to the end of the financial year, the Company further strengthened its working capital position with a reduction in repayments and reserve account requirements for the 2014 financial year for the remaining $285 million balance of the Project Finance Facility for its DeGrussa Copper Mine.
The improved repayment profile has been achieved with the Company’s financiers following the transition of DeGrussa to steady-state operations as well as a realignment of the funding model in line with the recently announced DeGrussa Mine Plan. The previous DeGrussa bank funding model was derived from an Ore Reserve-only mine plan, which included a shorter implied mine life and a reduced underground development and exploration profile.
Scheduled quarterly repayments under the revised schedule commence in late September 2013 (first repayment of $15 million) and are more evenly spread over the facility repayment period, which remains fixed ending December 2015. As a result, the Company’s working capital position will be strengthened for the period ended June 2014 with a reduction in repayments ($40 million) and debt service reserve account requirements ($15 million), as summarised in the table below:
Period ended Original schedule Amendment Revised schedule
$M $M $M
June 2014 165 (40) 125
June 2015 90 (15) 75
December 2015 30 55 85
Total 285 - 285
Cash on hand and deposits at 30 September 2013 totalled $101 million.

26 / SANDFIRE ANNUAL REPORT 2013
S U S TA I N A B I L I T Y We recognise that Sandfire’s activities impact directly and indirectly on the local environments and communities in which we operate. Sandfire is committed to conducting its activities in a sustainable and socially responsible manner to minimise and mitigate these impacts.
To achieve its sustainability objectives Sandfire will strive for absolute safety in the workplace, financial profitability, technical excellence, environmentally sound practices and transparent social responsibility.
Sandfire is committed to meeting the following sustainability objectives:
Protecting the health, safety and well being of our employees and contractors;
Creating long lasting commercial benefit to all stakeholders;
Proactively encouraging efficiency improvements across the organisation and minimising the impact on the environment; and
Actively engaging with the communities in which we operate.
Our sustainability strategy is to pursue these objectives by:
Promoting a strong safety culture across all areas of the business;
Never compromising on the safety and well being of our employees and contractors;
Ensuring the safe handling and transport of our materials and products;
Encouraging innovation to increase efficiency throughout the discovery, extraction and processing of our mineral resources;
Delivering superior returns to shareholders;
Developing a company-wide collaborative approach to exploration and exploitation of mineral endowments;
Preventing or minimising impact on the environment by promoting efficient use of natural resources;
Dealing fairly and equitably with all stakeholders;
Aiming to surpass our regulatory, legislative and project approvals obligations; and
Achieving continuous improvement in the management of our sustainability risks and opportunities.

H E A LT H A N D S A F E T YA safe workplace is fundamental to the success of Sandfire and to the wellbeing of its employees, contractors and visitors. We are committed to achieving a workplace that is free from harm and supported by a culture which ensures safety is an absolute priority.
To achieve these aims the Company:
Meets and strives to exceed statutory requirements and industry standards;
Ensures leadership is the key driver of zero harm culture;
Continually seeks to improve safety management systems and risk management practices;
Rigorously identifies and control risks;
Regularly communicates and consults with stakeholders, including contractors and, as appropriate, local communities;
Is actively involved in the development of practices and procedures;
Undertakes training and preparedness which is critical to a safe workplace;
Demands that working safely is a condition of service for everyone; and
Recognises that everyone’s involvement in health and safety is essential.

O U R P EO P L ESandfire is committed to providing a thriving work environment for its employees, contractors, consultants and visitors. Integral to achieving this commitment is ensuring that all of our people are fit for the work they perform and are provided with a supportive and encouraging workplace.
To achieve these aims the Company:
Provides confidential counselling and other support services;
Adopts employment practices that aim to employ people who are fit and able to undertake assigned tasks;
Incorporates Fitness for Work principles into induction processes;
Establishes and maintains procedures aimed at ensuring that no-one in our workplaces will be under the influence of alcohol, drugs (including prescription medication), illness, stress or fatigue, which may impair performance, personal safety or the safety of others;
Consistently enforces and records disciplinary procedures for employees and contractors in breach of Fitness for Work policies and procedures;
Ensures all employees and contractors are educated in their individual responsibilities; and
Regularly reviews Fitness for Work procedures and practices.

SANDFIRE ANNUAL REPORT 2013 / 29
S CH ED U L E O F E X P LO R AT I O N A N D M I N I N G T EN E M EN T S
State Project Tenement
Area Hectares (Ha), Km2
or Graticule Blocks Grant Date Interest
NT Borroloola MLN624 16.18 Ha 24/08/71 100%EL24401 87 3/06/05 100%EL25501 37 Application ApplicationEL26299 52 Application ApplicationEL26555 103 11/09/08 100%EL26587 20 11/09/08 100%EL26599 326 Application ApplicationEL26953 11 12/06/09 100%EL26831 381 9/06/09 100%EL26833 282 9/06/09 100%EL26835 367 9/06/09 100%EL26836 339 9/06/09 100%EL26837 334 9/06/09 100%EL26938 253 9/06/09 100%EL26939 292 9/06/09 100%EL28508 12 20/07/11 100%EL28534 4 7/09/11 100%EL28540 4 7/09/11 100%EL28541 3 7/09/11 100%EL28656 39 27/10/11 100%EL28657 45 27/10/11 100%EL26858 117 27/10/11 100%EL28659 20 27/10/11 100%EL29022 53 25/07/12 100%EL30048 90 Application Application
EL30098 69 Application Application
WA Doolgunna E51/1562 1 Application ApplicationE51/1583 1 Application ApplicationE52/1698 7 1/08/05 100%E52/1699 53 1/08/05 100%E52/1712 1 5/02/04 OptionE52/1715 54 22/06/05 100%E52/1928 1 2/05/06 OptionE52/2208 1 5/01/09 100%E52/2209 1 5/01/09 100%E52/2358 1 6/04/09 100%E52/2401 10 7/07/09 100%E52/2799 2 Application ApplicationE52/2846 1 Application ApplicationE52/2880 9 Application ApplicationE52/2881 1 Application ApplicationE52/2927 20 Application Application
L52/122 41 Ha 23/11/10 100%L52/125 69 Ha 21/04/11 100%L52/127 41 Ha 22/04/11 100%L52/133 2 Ha 21/09/11 100%L52/134 1,256 Ha Application ApplicationL52/135 99 Ha Application ApplicationL52/137 510 Ha 7/02/12 100%L52/138 2 Ha 3/01/12 100%L52/140 80 Ha 7/02/12 100%L52/146 6 Ha 28/06/12 100%L52/151 3 Ha 25/02/13 100%L52/152 2 Ha 25/02/13 100%L52/156 16 Ha 1/10/13 100%
M52/1046 1,704.50 Ha 8/12/13 100%P52/1433 127 Ha Application ApplicationP52/1434 144 Ha Application ApplicationP52/1457 183 Ha Application ApplicationP52/1458 194 Ha Application ApplicationP52/1459 104 Ha Application ApplicationP52/1460 167 Ha Application ApplicationP52/1461 197 Ha Application ApplicationP52/1462 192 Ha Application ApplicationP52/1463 178 Ha Application ApplicationP52/1464 152 Ha Application ApplicationP52/1465 132 Ha Application Application

30 / SANDFIRE ANNUAL REPORT 2013
SCHEDULE OF EXPLORATION AND MINING TENEMENTS (continued)
State Project Tenement
Area Hectares (Ha, Km2)
or Graticule Blocks Grant Date Interest
QLD Kennedy EPM15948 13 20/11/07 Farm-inEPM19418 36 30/11/12 100%EPM19453 100 12/03/13 100%EPM19542 97 Application ApplicationEPM25214 18 Application Application
Altia EPM17838 99 3/05/10 Farm-inEPM19832 20 25/09/13 100%EPM25388 10 Application Application
MDL431 790 Ha 1/06/13 Farm-inMDL432 18 Ha 1/06/13 Farm-in
Cannington EPM25123 21 Application ApplicationEPM25263 5 Application ApplicationEPM25341 5 Application ApplicationEPM25404 3 Application Application
Breena Plains EPM25201 3 Application ApplicationEPM25222 2 Application ApplicationEPM25340 43 Application Application
Blackrock EPM25339 32 Application ApplicationKevin Downs EPM25345 14 Application Application
EL30048 90 Application Application EL30098 69 Application Application
NSW Bland Creek EL5792 52 9/11/00 Farm-inEL7982 77 18/10/12 100%EL8025 53 29/11/12 100%
ELA4819 80 Application ApplicationELA4820 94 Application ApplicationELA4832 100 Application ApplicationELA4849 23 Application ApplicationELA4850 24 Application Application
Wyanga ELA4800 109 Application ApplicationELA4846 104 Application ApplicationELA4847 52 Application Application
Canobolas EL8142 7 23/07/13 100%
SA Alford EL5212 477 Km2 5/11/12 Farm-inEL5273 40 Km2 20/06/13 100%
ELA2013/00129 17 Km2 Application ApplicationELA2013/00130 35 Km2 Application Application
PM268 193 Ha 5/12/74 Farm-in
Peru Arena 01-01429-12 500 Ha 28/09/12 100%01-01430-12 300 Ha 28/09/12 100%01-01431-12 500 Ha 31/07/12 100%01-01432-12 400 Ha 31/10/12 100%01-01433-12 600 Ha 31/07/12 100%01-01434-12 700 Ha 28/09/12 100%01-01435-12 500 Ha 28/09/12 100%01-01436-12 900 Ha 31/07/12 100%01-01437-12 600 Ha 28/09/12 100%01-01438-12 900 Ha 23/10/12 100%
The schedule of exploration and mining tenements is current as of 4 October 2013.
SANDFIRE ANNUAL REPORT 2013 / 31
F O R T H E Y E A R E N D E D 3 0 J U N E 2 0 1 3
F I N A N CI A L R EP O R T
3 2 D i r e c t o r s ’ Re p o r t
4 9 A u d i t o r ’ s I n d e p e n d e n c e D e c l a r a t i o n
6 3 C o n s o l i d a t e d S t a t e m e n t o f C o mp r e h e n s i v e I n c o m e
6 4 C o n s o l i d a t e d S t a t e m e n t o f F i n a n c i a l P o s i t i o n
6 5 C o n s o l i d a t e d S t a t e m e n t o f C h a n g e s i n E qu i t y
6 6 C o n s o l i d a t e d S t a t e m e n t o f C a s h F l o w s
6 7 N o t e s t o t h e F i n a n c i a l S t a t e m e n t s
10 9 D i r e c t o r s ’ D e c l a r a t i o n
110 I n d e p e n d e n t A u d i t o r ’ s Re p o r t
CONTENTS
32 / SANDFIRE ANNUAL REPORT 2013
DIRECTORS’ REPORT
The directors present their report on the consolidated entity (referred to as the Group) consisting of the Parent entity, Sandfire Resources NL (Sandfire or the Company), and the entities it controlled at the end of, or during, the year ended 30 June 2013 (the reporting period) and the auditor’s report thereon.
1 DIRECTORS
The names and details of the Company’s directors in office during the financial year and until the date of this report are as follows:
Name Period of Directorship
Mr Derek La Ferla
Independent Non-Executive ChairmanAppointed 17 May 2010
Mr Karl M Simich
Managing Director & Chief Executive OfficerAppointed Director 27 September 2007 Managing Director and Chief Executive Officer since 1 July 2009
Mr W John Evans
Non-Executive Director Appointed Executive Technical Director 2 October 2007 Resigned Executive Technical Director 1 January 2013 Appointed Non-Executive Director 1 January 2013
Mr Robert N Scott
Independent Non-Executive DirectorAppointed 30 July 2010
Mr Soocheol Shin
Non-Executive DirectorAppointed 28 February 2012
Mr Paul D Hallam
Independent Non-Executive DirectorAppointed 21 May 2013
The qualifications, experience, other directorships and special responsibilities of the directors in office at the date of this report are:
Derek La Ferla Independent Non-Executive Chairman
Qualifications B. Arts, B.Juris, B.Law, Fellow of AICD
Experience and expertise Mr La Ferla has been a corporate lawyer for over 25 years and is a partner with international law firm, Norton Rose Fulbright. He is one of two national team leaders for the firm’s Corporate Advisory Group (which includes mining and resources). Mr La Ferla also has considerable experience as a company director and (in addition to his role as non-executive chairman of Sandfire Resources NL) is the chairman of Cashmere Iron Limited and OTOC Limited. He has also previously served on the Norton Rose Australia national board (while the firm was Deacons) and listed investment company, Katana Capital Limited. He is a fellow of the Australian Institute of Company Directors.
Special responsibilities Chairman of the Remuneration and Nomination Committee. Member of the Audit and Risk Committee.
Karl M Simich Managing Director and Chief Executive Officer
Qualifications B.Com, FCA, F.Fin
Experience and expertise Mr Simich has had considerable international business experience in the management and administration of publicly listed companies, specialising in resource finance and corporate management. Mr Simich is a Fellow of the Institute of Chartered Accountants and a Fellow of the Financial Services Institute of Australasia and has completed post-graduate studies in business and finance.
W John Evans Non-Executive Director
Qualifications B.Sc
Experience and other expertise Mr Evans graduated from the University of Auckland New Zealand in 1970 with B.Sc. Major in geology. Mr Evans is a fellow of the Australasian Institute of Mining and Metallurgy. Between 1970 and 1987, he was employed by various divisions of CRA Limited, including being in charge of all field operations for iron ore in the Pilbara, Western Australia and gold and base metals in the Murchison, Western Australia. He was the Managing Director of Marymia Exploration NL for 12 years until 2002 and has been a geological consultant to numerous companies during and since.

SANDFIRE ANNUAL REPORT 2013 / 33
Robert N Scott Independent Non-Executive Director
Qualifications FCA
Experience and expertise Mr Scott has extensive experience as a taxation advisor, specialising in the mining sector and has over 35 years experience with major accounting firms as a corporate advisor. Mr Scott holds a Fellowship of the Australian Institute of Chartered Accountants and the Taxation Institute of Australia. He is also a member of the Institute of Company Directors.
Other current directorships Non-executive Director of Lonestar Resources Ltd (formerly Amadeus Energy Ltd) (since October 1996). Non-executive Director of Homeloans Ltd (since November 2000). Non-executive Chairman of Manas Resources Limited (since January 2013).
Former directorships in last three years Non-executive Director of CGA Mining Ltd (January 2009 to January 2013). Non-executive Director of Neptune Marine Services Ltd (May 2007 to March 2012). Chairman of bioMD Ltd (July 2006 to June 2011). Chairman of Australian Renewable Fuels Ltd (December 2002 to June 2011).
Special responsibilities Chairman of the Audit and Risk Committee. Member of the Remuneration and Nomination Committee.
Soocheol Shin Non-Executive Director
Qualifications B.A. Public Administration
Experience and expertise Mr Shin is the Managing Director of POSCO Australia Pty Ltd (a wholly-owned subsidiary of the Korean steelmaker POSCO), which holds 15.3 percent of the Company’s issued capital. Mr Shin joined POSCO in 1989 and has held a variety of positions throughout his career, including Project Manager, POSCO Australia Pty Ltd; Team Leader, Coal Procurement Group; Team Leader, Steel Making Raw Materials Procurement Group and Group Leader, Raw Materials Transportation Group. He was appointed Managing Director of POSCO Australia in February 2012.
Other current directorships Non-executive Director of Jupiter Mines Ltd (since March 2012). Non-executive Director of Cockatoo Coal Ltd (since March 2012).
Special responsibilities Member of the Remuneration and Nomination Committee (resigned 4 June 2013). Member of the Audit and Risk Committee (resigned 4 June 2013).
Paul D Hallam Independent Non-Executive Director
Qualifications BE (Hons) Mining, FAICD, FAusIMM
Experience and expertise Mr Hallam is a highly experienced resource industry executive with more than 35 years experience working for a number of blue chip Australian and International mining companies, including 15 years at senior executive management level. His experience spans a range of corporate and operating environments, both in Australia and overseas, covers a range of commodities (iron ore, bauxite, alumina, aluminium, gold, silver, copper, zinc and lead) and includes both surface and underground mining. His former roles include Director – Operations with Fortescue Metals Group and Executive General Manager – Development & Projects with Newcrest Mining Limited. Mr Hallam retired from executive roles in 2011 to pursue a career as a professional non-executive Director. Mr Hallam is a qualified mining engineer and holds a BE (Hons) from Melbourne University and a Certificate of Mineral Economics from Curtin University. He is a Fellow of the Australian Institute of Company Directors and the Australasian Institute of Mining & Metallurgy.
Other current directorships Non-executive Director of Altona Mining Ltd (since March 2013). Non-executive Director of Gindalbie Metals Ltd (since December 2011). Non-executive Director of Enterprise Metals Ltd (since November 2011). Non-executive Director of Powertrans Pty Ltd (since December 2011).
Special responsibilities Member of the Remuneration and Nomination Committee (appointed 4 June 2013). Member of the Audit and Risk Committee (appointed 4 June 2013).
1 DIRECTORS (continued)
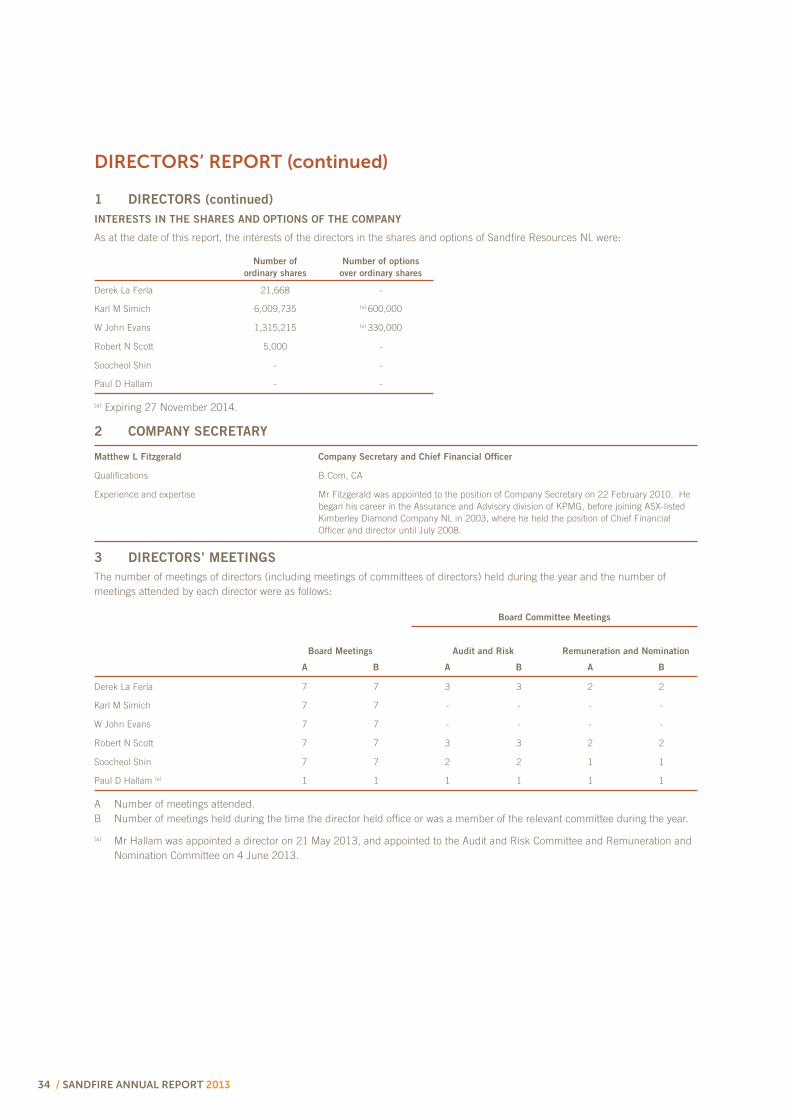
34 / SANDFIRE ANNUAL REPORT 2013
INTERESTS IN THE SHARES AND OPTIONS OF THE COMPANY
As at the date of this report, the interests of the directors in the shares and options of Sandfire Resources NL were:
Number of
ordinary shares
Number of options
over ordinary shares
Derek La Ferla 21,668 -
Karl M Simich 6,009,735 (a) 600,000
W John Evans 1,315,215 (a) 330,000
Robert N Scott 5,000 -
Soocheol Shin - -
Paul D Hallam - -
(a) Expiring 27 November 2014.
2 COMPANY SECRETARY
Matthew L Fitzgerald Company Secretary and Chief Financial Officer
Qualifications B.Com, CA
Experience and expertise Mr Fitzgerald was appointed to the position of Company Secretary on 22 February 2010. He began his career in the Assurance and Advisory division of KPMG, before joining ASX-listed Kimberley Diamond Company NL in 2003, where he held the position of Chief Financial Officer and director until July 2008.
3 DIRECTORS’ MEETINGS
The number of meetings of directors (including meetings of committees of directors) held during the year and the number of meetings attended by each director were as follows:
Board Committee Meetings
Board Meetings Audit and Risk Remuneration and Nomination
A B A B A B
Derek La Ferla 7 7 3 3 2 2
Karl M Simich 7 7 - - - -
W John Evans 7 7 - - - -
Robert N Scott 7 7 3 3 2 2
Soocheol Shin 7 7 2 2 1 1
Paul D Hallam (a) 1 1 1 1 1 1
A Number of meetings attended. B Number of meetings held during the time the director held office or was a member of the relevant committee during the year.
(a) Mr Hallam was appointed a director on 21 May 2013, and appointed to the Audit and Risk Committee and Remuneration and Nomination Committee on 4 June 2013.
DIRECTORS’ REPORT (continued)
1 DIRECTORS (continued)

SANDFIRE ANNUAL REPORT 2013 / 35
3 DIRECTORS’ MEETINGS (continued)
COMMITTEE MEMBERSHIP
As at the date of this report, the Board had an Audit and Risk Committee and a Remuneration and Nomination Committee. Members acting on the committees during the year were:
Audit and Risk Remuneration and Nomination
Robert N Scott - Chairman Derek La Ferla - Chairman
Derek La Ferla Robert Scott
Paul D Hallam (a) Paul D Hallam (a)
Soocheol Shin (b) Soocheol Shin (b)
(a) Mr Hallam was appointed a member of the Audit and Risk Committee and Remuneration and Nomination Committee on 4 June 2013.
(b) Mr Shin resigned from being a member of the Audit and Risk Committee and Remuneration and Nomination Committee on 4 June 2013.
4 DIVIDENDS
The directors have not recommended the declaration of a dividend. No dividends were paid or declared by the Group during the current or previous financial year.
5 PRINCIPAL ACTIVITIES, OPERATING AND FINANCIAL REVIEW
The principal activities of the Group during the financial year were:
Production and sale of copper and gold from the Group’s DeGrussa Copper Mine in Western Australia;
Completion of development and construction of the DeGrussa Copper Mine; and
Exploration and evaluation of mineral tenements in Australia and overseas.
5.1 PROJECT REVIEW, STRATEGIES AND FUTURE PROSPECTS
DOOLGUNNA PROJECT, WESTERN AUSTRALIA (100%)
The Doolgunna Project is located 900km north of Perth and approximately 150km north of the regional mining centre of Meekatharra in Western Australia. The tenement package, known as Doolgunna, covers a total area of 400km2 in an emerging copper-gold mineralised belt in the Bryah Basin close to existing mines and infrastructure and includes the Company’s DeGrussa Copper Mine.
DeGrussa Copper Mine
Construction & Development
Major site construction activities were completed during the first half of the 2013 financial year, with construction supervision personnel released from the project and operations teams taking full control of the processing plant during the December Quarter.
Commissioning commenced with the introduction of waste rock into the circuit to commission the SAG mill, Ball Mill and the tails slurry stream through to the tailings storage facility. Ore was subsequently added to the SAG mill to establish a slurry flow through the concentrate stream, leading to the production of the first concentrate in October 2012.
Production ramp-up commenced towards the end of the December 2012 Quarter and nameplate throughput rates were achieved from the March 2013 Quarter.
Open Pit and Underground Development
Following commencement of the open pit pre-strip and box-cut development in April 2011, mining continued in the DeGrussa open pit and in the underground mine during the 2013 financial year, with excellent progress achieved.

36 / SANDFIRE ANNUAL REPORT 2013
5 PRINCIPAL ACTIVITIES, OPERATING AND FINANCIAL REVIEW (continued)
5.1 PROJECT REVIEW, STRATEGIES AND FUTURE PROSPECTS (continued)
A summary of production from the open pit and underground mine for the 12 months to 30 June 2013 is provided below:
Tonnes
Grade
(% Cu)
Grade
(g/t Au)
Contained
Copper (t)
Contained
Gold (oz)
DSO Mined 127,951 23.4 3.1 29,845 12,703
Crushed 128,730 23.4 3.1 30,130 12,880
Sales 138,397 23.1 3.2 31,921 14,343
Concentrator Mined 1,103,791 4.9 1.9 54,485 68,619
Milled 935,118 4.8 1.7 44,618 50,824
Concentrate produced 144,602 23.4 3.9 33,887 17,978
Concentrate sold 130,402 23.2 3.7 30,233 15,561
Oxide Gold Mined 3,559 - 0.8 - 94
Milled (toll treatment) 108,447 - 3.8 - 13,163
Gold production - - - - 11,821
Gold sales - - - - 11,821
Total Mined 1,235,301 6.8 2.1 84,330 81,416
Crushed/Milled 1,172,295 6.4 2.0 74,748 76,867
Copper production 273,332 23.4 3.5 64,017 30,858
Gold production - - - - 11,821
Contained metal - - - 64,017 42,679
Copper and gold sales 268,799 23.1 - 62,154 41,725
Open Pit Mining
Open pit mining operations were completed during the 2013 financial year, with Stage 1 of the DeGrussa open pit completed in early December 2012 and Stage 2 of the open pit completed in April 2013.
A total of 13.1 million bank cubic metres (Mbcm) of material was extracted during the Stage 1 and Stage 2 open pit operations. Demobilisation of the open pit contractor, Hamptons Mining and Civil, was completed during the June 2013 Quarter.
The DSO mining and sales program was also completed during the June 2013 Quarter, with a total of 144,887 tonnes grading 23.6% Cu for 34,169 tonnes of contained copper and 15,218 ounces of gold sold over the life of the open pit mining operation.
Underground Mining
Underground mining progressed on schedule through the 2013 Financial Year with five stopes in various stages of development and production by the end of the reporting period. A total of 760,040 tonnes of sulphide ore was mined and delivered to the ROM during the period ending 30 June 2013.
Commissioning of the paste plant commenced in March 2013 with first paste produced and delivered underground in early April 2013. At the end of the reporting period, the first stope, the P1 stope in Conductor 1, had been filled and the second stope, P2, was being finalised.
Underground mining will continue to progressively ramp up, with current underground mining rates at ~100,000 tonnes per month (1.2Mtpa) delivering ore to the concentrator. Full underground mining rates of 125,000 tonnes per month (1.5Mtpa) are expected to be achieved from the end of the September 2013 Quarter.
Underground development is proceeding on schedule, with construction of the Evans Decline completed during the June 2013 Quarter. The next key phase of underground development is now underway, with the development of the Conductor 1 and Conductor 4/5 Declines from junctions off the Evans Decline now underway.
The Conductor 1 Decline will enable the large Conductor 1 deposit to be fully developed and extracted. The Conductor 4/5 Decline will enable development and mining of the deep, high-grade Conductor 4 and 5 deposits to occur. This Decline is expected to reach Conductor 4, located approximately 400m away, towards the end of the 2013 calendar year enabling development activities to commence.
DIRECTORS’ REPORT (continued)
SANDFIRE ANNUAL REPORT 2013 / 37
5 PRINCIPAL ACTIVITIES, OPERATING AND FINANCIAL REVIEW (continued)
5.1 PROJECT REVIEW, STRATEGIES AND FUTURE PROSPECTS (continued)
The development of these new declines is important as it will ensure that DeGrussa can source ore from multiple underground sources, providing stability and consistency of production in the long term. It will also facilitate the establishment of underground diamond drilling platforms later this year from which extensions and potential repeats of the Conductor 4 and 5 deposits can be targeted. These drill positions will also be used to allow early grade drilling to define mining shapes in Conductor 4 and 5 and to conduct in-fill drilling to enable conversion of Inferred Mineral Resources to Ore Reserves in these deposits.
Total development for the underground mine to date is over 13km.
Processing
Plant commissioning progressed during the reporting period, with ore throughput achieving nameplate levels of 125,000 tonnes per month by the end of the March 2013 Quarter.
During the reporting period overall concentrator recoveries were constrained in the short term while concentrator feed has been supplemented by sulphide ore from the open pit. This material contributed around [30%] of plant feed during the March and June 2013 Quarters, constraining overall copper recoveries to around [80%]. Targeted recovery is +90% at steady-state production levels.
When primary sulphide ore from underground mining has been wholly fed into the Concentrator it is delivering pleasing recoveries of 85-90% and copper concentrate which meets specification.
A series of plant shutdowns were completed during the year to enable a number of identified improvements and modifications to the plant to be completed during commissioning and ramp-up, including:
1. Tailings thickener feedwell to improve throughput and stability;2. SAG mill grate closure to improve throughput, grind size and reduce Scats; 3. Cleaner circuit hopper modifications to improve plant stability, recovery and reliability; 4. Achievement of a coarser primary grind and greater process stability in grinding and flotation; and5. Optimisation of the reagent suite.
Approximately 100,000 tonnes of open pit sulphide ore remained to be processed at the end of the reporting period, with this material to be blended on a reducing campaign basis during the September 2013 Quarter.
Once this is completed, ore feed to the Concentrator will comprise 100% primary sulphide ore from underground. Throughput rates are expected to be increased to nameplate levels of 125,000 tonnes per month (1.5Mtpa) with recoveries at the +90% target level to achieve targeted annualised production levels.
Official Opening Ceremony
The DeGrussa Copper Mine was officially opened by the Hon. Colin Barnett MLA, Premier of Western Australia and Minister for State Development and Science, on Sunday 4 August 2013 at a ceremony held on site which was attended by over 200 dignitaries and key stakeholders.
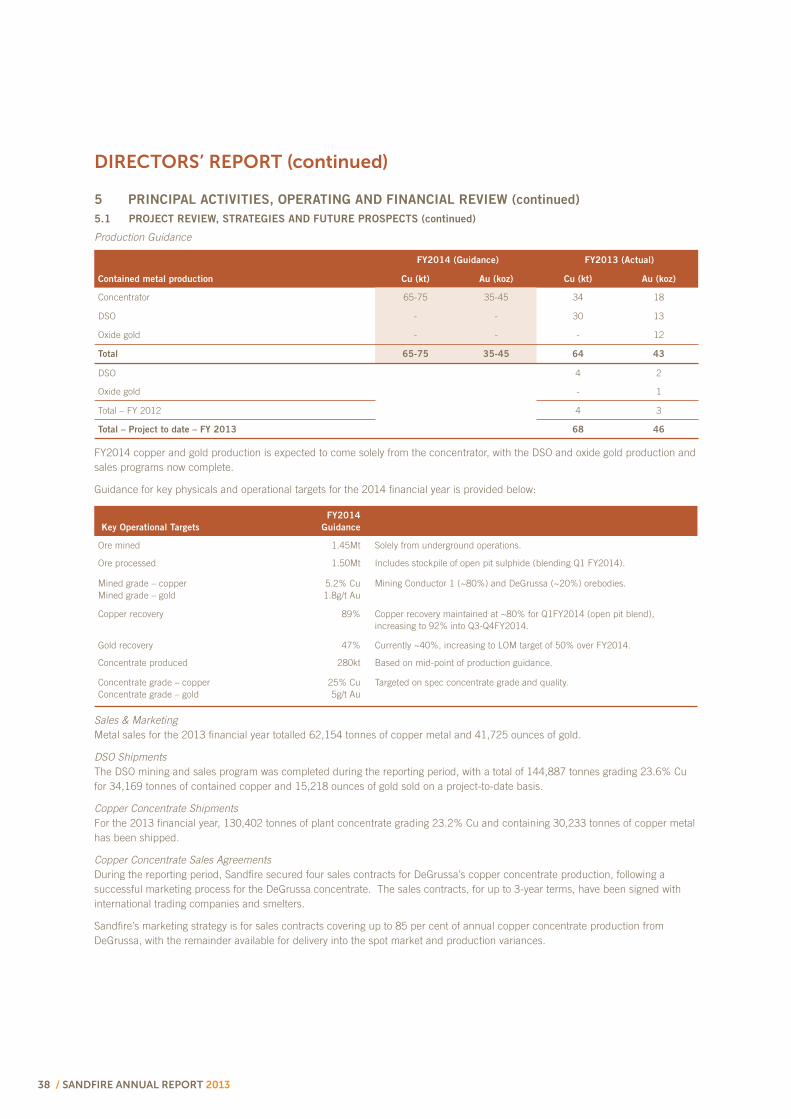
38 / SANDFIRE ANNUAL REPORT 2013
5 PRINCIPAL ACTIVITIES, OPERATING AND FINANCIAL REVIEW (continued)
5.1 PROJECT REVIEW, STRATEGIES AND FUTURE PROSPECTS (continued)
Production Guidance
Contained metal production
FY2014 (Guidance) FY2013 (Actual)
Cu (kt) Au (koz) Cu (kt) Au (koz)
Concentrator 65-75 35-45 34 18
DSO - - 30 13
Oxide gold - - - 12
Total 65-75 35-45 64 43
DSO 4 2
Oxide gold - 1
Total – FY 2012 4 3
Total – Project to date – FY 2013 68 46
FY2014 copper and gold production is expected to come solely from the concentrator, with the DSO and oxide gold production and sales programs now complete.
Guidance for key physicals and operational targets for the 2014 financial year is provided below:
Key Operational Targets
FY2014
Guidance
Ore mined 1.45Mt Solely from underground operations.
Ore processed 1.50Mt Includes stockpile of open pit sulphide (blending Q1 FY2014).
Mined grade – copper Mined grade – gold
5.2% Cu 1.8g/t Au
Mining Conductor 1 (~80%) and DeGrussa (~20%) orebodies.
Copper recovery 89% Copper recovery maintained at ~80% for Q1FY2014 (open pit blend), increasing to 92% into Q3-Q4FY2014.
Gold recovery 47% Currently ~40%, increasing to LOM target of 50% over FY2014.
Concentrate produced 280kt Based on mid-point of production guidance.
Concentrate grade – copper Concentrate grade – gold
25% Cu 5g/t Au
Targeted on spec concentrate grade and quality.
Sales & MarketingMetal sales for the 2013 financial year totalled 62,154 tonnes of copper metal and 41,725 ounces of gold.
DSO ShipmentsThe DSO mining and sales program was completed during the reporting period, with a total of 144,887 tonnes grading 23.6% Cu for 34,169 tonnes of contained copper and 15,218 ounces of gold sold on a project-to-date basis.
Copper Concentrate ShipmentsFor the 2013 financial year, 130,402 tonnes of plant concentrate grading 23.2% Cu and containing 30,233 tonnes of copper metal has been shipped.
Copper Concentrate Sales AgreementsDuring the reporting period, Sandfire secured four sales contracts for DeGrussa’s copper concentrate production, following a successful marketing process for the DeGrussa concentrate. The sales contracts, for up to 3-year terms, have been signed with international trading companies and smelters.
Sandfire’s marketing strategy is for sales contracts covering up to 85 per cent of annual copper concentrate production from DeGrussa, with the remainder available for delivery into the spot market and production variances.
DIRECTORS’ REPORT (continued)

SANDFIRE ANNUAL REPORT 2013 / 39
5 PRINCIPAL ACTIVITIES, OPERATING AND FINANCIAL REVIEW (continued)
5.1 PROJECT REVIEW, STRATEGIES AND FUTURE PROSPECTS (continued)
Laterite Gold ProcessingSandfire has entered into an Ore Sale and Purchase Agreement with Barrick (Plutonic) Ltd to process the lateritic gold material mined as part of the open pit operations.
During the reporting period, 108,447t grading 3.8g/t Au was processed for the production and sale of 11,821oz of gold.
Feasibility Studies, Metallurgy, Exploration, Ore Reserves and Mineral Resources
Oxide Copper Feasibility Study
Work continued throughout year to progress a Feasibility Study on a heap leach/solvent extraction and electrowinning (SX/EW) recovery option for the stockpiled copper oxide ore at DeGrussa.
An engineering study of the oxide copper crushing-scrubbing plant by GR Engineering Services is also underway, with excellent results achieved from scrubbing trials which demonstrated that excellent copper recoveries can be achieved.
A composite of +150um scrubbed material was sent to Worley Parsons and Hydrogeosense USA, with testing underway to complete the required detailed heap leach design. ALS AMMTEC has commenced additional bottle roll and acid consumption testing of the bulk scrubbing testing to understand the acid consumption and total copper extraction rates to be used in the financial modelling.
Outotec has completed the thickening testing of the reject of the scrubbing testing and is preparing a report on this testwork program. ATC Williams has been given the results of this testing and the amount and rates of deposition of the composites for the final design for the oxide TSF.
Western Process Equipment has started to develop the equipment list for the scrubbing plant.
Xstrata Tech has a well-developed flow-sheet for the design of the SX/EW part of the project and is specifying the equipment and pricing for the SX/EW equipment.
DeGrussa Exploration OverviewDuring the year, Sandfire continued to progress a tightly focused, multi-disciplinary exploration campaign to unlock the broader potential of the Doolgunna region for additional VMS deposits. Cutting-edge geophysical and geochemical techniques, in conjunction with detailed geological interpretation and analysis, resulted in significant advances in the vectoring towards potential accumulations of VMS mineralisation within the DeGrussa mine stratigraphic corridor.
A relatively limited surface diamond drilling program was conducted during the March 2013 Quarter targeting extensions to Conductor 4 and Conductor 5. This program yielded immediate success, resulting in an increase in the Company’s high-grade Mineral Resource inventory (see below).
An important focus during the second half of CY2013 will be the establishment of new underground drilling positions from the new Conductor 1 and Conductor 4/5 declines, which will enable the Company to target depth extensions and potential repeats of the deep, high-grade VMS lenses. This important phase of the Company’s exploration program at DeGrussa has only just commenced and is expected to accelerate as additional underground drilling positions become available.
Increase in High Grade Mineral Resource The Mineral Resource for the DeGrussa Copper Mine as at 31 March 2013 increased to 13.4 million tonnes grading 4.7% Cu and 1.9g/t Au for 634,000 tonnes of contained copper and 795,000oz of contained gold. An additional 66,000 tonnes of contained copper and 149,000oz gold has been added to DeGrussa’s mineral inventory following depletion to March 2013, with the additional Inferred Mineral Resource now incorporated into the DeGrussa mine plan.
The majority of the increase in tonnage and contained metal has come from successful surface drilling programs at DeGrussa targeting the two deepest high-grade deposits – Conductor 4 and Conductor 5. These drilling programs were guided by information and insights gained from structural interpretation from mapping within the underground mine and open pit.
This has enabled Sandfire to develop an enhanced understanding of the lithological sequence, structural setting and, consequently, the positioning of potential accumulations of VMS mineralisation at DeGrussa.
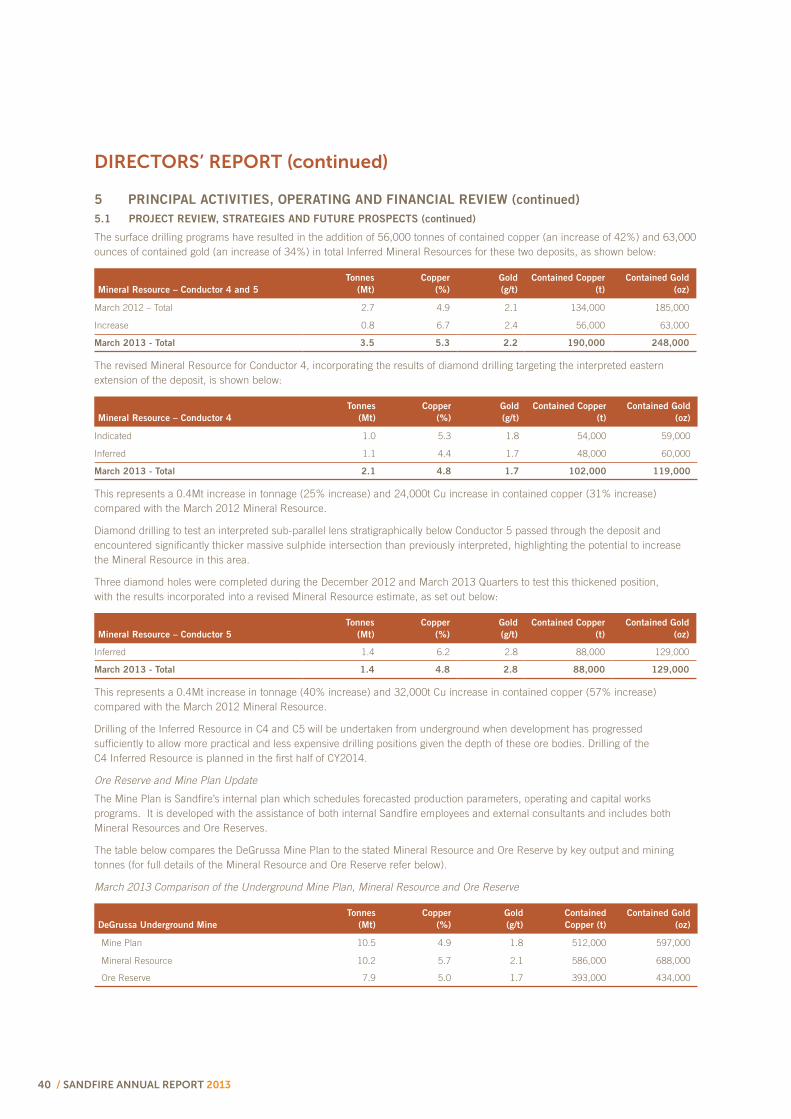
40 / SANDFIRE ANNUAL REPORT 2013
5 PRINCIPAL ACTIVITIES, OPERATING AND FINANCIAL REVIEW (continued)
5.1 PROJECT REVIEW, STRATEGIES AND FUTURE PROSPECTS (continued)
The surface drilling programs have resulted in the addition of 56,000 tonnes of contained copper (an increase of 42%) and 63,000 ounces of contained gold (an increase of 34%) in total Inferred Mineral Resources for these two deposits, as shown below:
Mineral Resource – Conductor 4 and 5
Tonnes
(Mt)
Copper
(%)
Gold
(g/t)
Contained Copper
(t)
Contained Gold
(oz)
March 2012 – Total 2.7 4.9 2.1 134,000 185,000
Increase 0.8 6.7 2.4 56,000 63,000
March 2013 - Total 3.5 5.3 2.2 190,000 248,000
The revised Mineral Resource for Conductor 4, incorporating the results of diamond drilling targeting the interpreted eastern extension of the deposit, is shown below:
Mineral Resource – Conductor 4
Tonnes
(Mt)
Copper
(%)
Gold
(g/t)
Contained Copper
(t)
Contained Gold
(oz)
Indicated 1.0 5.3 1.8 54,000 59,000
Inferred 1.1 4.4 1.7 48,000 60,000
March 2013 - Total 2.1 4.8 1.7 102,000 119,000
This represents a 0.4Mt increase in tonnage (25% increase) and 24,000t Cu increase in contained copper (31% increase) compared with the March 2012 Mineral Resource.
Diamond drilling to test an interpreted sub-parallel lens stratigraphically below Conductor 5 passed through the deposit and encountered significantly thicker massive sulphide intersection than previously interpreted, highlighting the potential to increase the Mineral Resource in this area.
Three diamond holes were completed during the December 2012 and March 2013 Quarters to test this thickened position, with the results incorporated into a revised Mineral Resource estimate, as set out below:
Mineral Resource – Conductor 5
Tonnes
(Mt)
Copper
(%)
Gold
(g/t)
Contained Copper
(t)
Contained Gold
(oz)
Inferred 1.4 6.2 2.8 88,000 129,000
March 2013 - Total 1.4 4.8 2.8 88,000 129,000
This represents a 0.4Mt increase in tonnage (40% increase) and 32,000t Cu increase in contained copper (57% increase) compared with the March 2012 Mineral Resource.
Drilling of the Inferred Resource in C4 and C5 will be undertaken from underground when development has progressed sufficiently to allow more practical and less expensive drilling positions given the depth of these ore bodies. Drilling of the C4 Inferred Resource is planned in the first half of CY2014.
Ore Reserve and Mine Plan Update
The Mine Plan is Sandfire’s internal plan which schedules forecasted production parameters, operating and capital works programs. It is developed with the assistance of both internal Sandfire employees and external consultants and includes both Mineral Resources and Ore Reserves.
The table below compares the DeGrussa Mine Plan to the stated Mineral Resource and Ore Reserve by key output and mining tonnes (for full details of the Mineral Resource and Ore Reserve refer below).
March 2013 Comparison of the Underground Mine Plan, Mineral Resource and Ore Reserve
DeGrussa Underground Mine
Tonnes
(Mt)
Copper
(%)
Gold
(g/t)
Contained
Copper (t)
Contained Gold
(oz)
Mine Plan 10.5 4.9 1.8 512,000 597,000
Mineral Resource 10.2 5.7 2.1 586,000 688,000
Ore Reserve 7.9 5.0 1.7 393,000 434,000
DIRECTORS’ REPORT (continued)

SANDFIRE ANNUAL REPORT 2013 / 41
5 PRINCIPAL ACTIVITIES, OPERATING AND FINANCIAL REVIEW (continued)
5.1 PROJECT REVIEW, STRATEGIES AND FUTURE PROSPECTS (continued)
DeGrussa Underground Mine by orebody
Tonnes
(Mt)
DG
(Mt)
C1
(Mt)
C4
(Mt)
C5
(Mt)
Mine Plan 10.5 1.6 5.5 1.9 1.5
Mineral Resource 10.2 1.4 5.2 2.1 1.4
Ore Reserve 7.9 1.6 5.3 1.0 -
* Mine Plan and Ore Reserve include mining dilution.
The Company continues to incorporate Inferred Mineral Resources from Conductor 4 and 5 into its Mine Plan process due to the geological continuity and high copper grade tenor of the deposits.
Work commenced on the Conductor 4/5 access decline during June to develop and access these orebodies from 2014 onwards. As part of this decline development, a drill position will be established to commence grade control drilling into the C4 and C5 orebodies which the Company expects will result in additional conversion of the C4 and C5 Inferred Mineral Resource to Ore Reserve.
The drilling position will also be used to test down-dip extensions of C4 and targets below and down-plunge of C5. Exploration drilling is targeted to commence during the first half of 2014.
Ore Reserves have been updated based on the March 2013 Mineral Resource model and depletions up to 31 March 2013.
DeGrussa Mine Ore Reserves, net of depletion
Tonnes
(Mt)
Copper
(%)
Gold
(g/t)
Contained
Copper (t)
Contained Gold
(oz)
Underground Mine 7.9 5.0 1.7 393,000 434,000
Open pit – stockpiles 3.1 1.5 1.1 45,000 104,000
March 2013 Total 11.0 4.0 1.5 438,000 538,000
The open cut mine was almost complete at the end of March 2013, with Ore Reserves of 3.1Mt grading 1.5% Cu and 1.1g/t Au containing 45,000t Cu and 104,000oz Au, representing chalcocite, sulphide and oxide copper stockpiles.
DeGrussa Mine - Underground as at 31 March 2013
Ore Reserve Mineral Resource
Deposit
Reserve
category
Tonnes
(Mt)
Copper
(%)
Gold
(g/t)
Contained
Copper (t)
Contained
Gold (oz)
Resource
category
Tonnes
(Mt)
Copper
(%)
Gold
(g/t)
Contained
Copper (t)
Contained
Gold (oz)
DeGrussa Proved 1.2 5.7 1.8 67,000 66,000 Measured 1.0 7.4 2.3 73,000 72,000Probable 0.4 8.2 2.1 32,000 26,000 Indicated 0.4 9.4 2.4 34,000 28,000
Conductor 1 Proved 1.4 5.4 1.8 76,000 82,000 Measured 1.3 6.5 2.2 86,000 92,000Probable 3.9 4.4 1.7 174,000 210,000 Indicated 3.7 5.1 1.9 190,000 231,000
Inferred 0.2 4.6 1.8 11,000 14,000
Conductor 4 Probable 1.0 4.3 1.5 43,000 47,000 Indicated 1.0 5.3 1.8 54,000 59,000Inferred 1.1 4.4 1.7 48,000 60,000
Conductor 5 Probable - - - - - Inferred 1.4 6.2 2.8 88,000 129,000
Stockpiles Proved <0.1 7.9 3.0 2,000 3,000 Measured <0.1 7.9 3.0 2,000 3,000
Proved 2.6 5.6 1.8 145,000 151,000 Measured 2.3 6.9 2.2 161,000 167,000
Probable 5.3 4.7 1.7 248,000 282,000 Indicated 5.1 5.4 1.9 278,000 318,000
Inferred 2.8 5.3 2.3 147,000 203,000
Total 7.9 5.0 1.7 393,000 434,000 Total 10.2 5.7 2.1 586,000 688,000

42 / SANDFIRE ANNUAL REPORT 2013
5 PRINCIPAL ACTIVITIES, OPERATING AND FINANCIAL REVIEW (continued)
5.1 PROJECT REVIEW, STRATEGIES AND FUTURE PROSPECTS (continued)
DeGrussa Mine - Open Pit as at 31 March 2013
Ore Reserve Mineral Resource
Deposit
Reserve
category
Tonnes
(Mt)
Copper
(%)
Gold
(g/t)
Contained
Copper (t)
Contained
Gold (oz)
Resource
category
Tonnes
(Mt)
Copper
(%)
Gold
(g/t)
Contained
Copper (t)
Contained
Gold (oz)
Conductor 1 Probable - - - - - Indicated 0.1 3.9 1.8 2,000 3,000
Stockpiles Proved 3.1 1.5 1.1 45,000 104,000 Measured 3.1 1.5 1.1 45,000 104,000
Proved 3.1 1.5 1.1 45,000 104,000 Measured 3.1 1.5 1.1 45,000 104,000
Probable - - - - - Indicated - - - - -
Inferred - - - - -
Total 3.1 1.5 1.1 45,000 104,000 Total 3.1 1.5 1.1 48,000 108,000
DeGrussa Mine - Total as at 31 March 2013
Ore Reserve Mineral Resource
Deposit
Reserve
category
Tonnes
(Mt)
Copper
(%)
Gold
(g/t)
Contained
Copper (t)
Contained
Gold (oz)
Resource
category
Tonnes
(Mt)
Copper
(%)
Gold
(g/t)
Contained
Copper (t)
Contained
Gold (oz)
DeGrussa Proved 1.2 5.7 1.8 67,000 66,000 Measured 1.0 7.4 2.3 74,000 72,000Probable 0.4 8.2 2.1 32,000 26,000 Indicated 0.4 9.4 2.4 34,000 28,000
Conductor 1 Proved 1.4 5.4 1.8 76,000 82,000 Measured 1.3 6.5 2.2 86,000 92,000Probable 3.9 4.4 1.7 174,000 210,000 Indicated 3.8 5.1 1.9 192,000 234,000
Inferred 0.3 4.6 1.8 12,000 15,000
Conductor 4 Probable 1.0 4.3 1.5 43,000 47,000 Indicated 1.0 5.3 1.8 54,000 59,000Inferred 1.1 4.4 1.7 48,000 60,000
Conductor 5 - - - - - Inferred 1.4 6.2 2.8 88,000 129,000
Stockpiles Proved 3.1 1.5 1.1 47,000 107,000 Measured 3.1 1.5 1.1 47,000 107,000
Proved 5.7 3.4 1.4 190,000 256,000 Measured 5.4 3.8 1.6 206,000 271,000
Probable 5.3 4.7 1.7 248,000 282,000 Indicated 5.2 5.4 1.9 280,000 321,000
Inferred 2.8 5.3 2.3 148,000 203,000
Total 11.0 4.0 1.5 439,000 538,000 Total 13.4 4.7 1.9 634,000 795,000
Doolgunna Regional Exploration
Regional exploration conducted during the reporting period included follow-up Reverse Circulation (RC) drilling of first pass geochemical aircore anomalies at the North Robinson Range regional target, which returned a series of encouraging anomalous results and geochemistry.
An in-fill aircore geochemistry program was subsequently completed at North Robinson Range, which further enhanced the prospectivity of this target.
At the Airstrip South target, RC drilling was completed targeting the DGRC672 VTEM and geochemistry anomaly. This drilling was a part of the systematic program aimed at evaluating more distal extensions of the prospective NE-SW trending stratigraphy in conjunction with interpretation of geophysical and geochemical anomalism. The geology model of this anomaly is evolving.
Following the completion of a 3D seismic surface survey of the area above the Conductor 5 orebody during 2012, further work was conducted by HiSeis during the year to acquire additional data with the aim of producing a seismic model that accurately reflects the drill-proven sub-surface geology. Processing and interpretation of this data is currently being undertaken by HiSeis.
A program of 61 aircore drill-holes completed as part of the Gascoyne West In-fill Geochemistry Program during the year returned a number of anomalous intersections. The lithological and geochemical information gained from these aircore programs is crucial in redefining the detailed interpreted geology of this section of the Bryah Basin and defining target areas for future field testing.
DIRECTORS’ REPORT (continued)
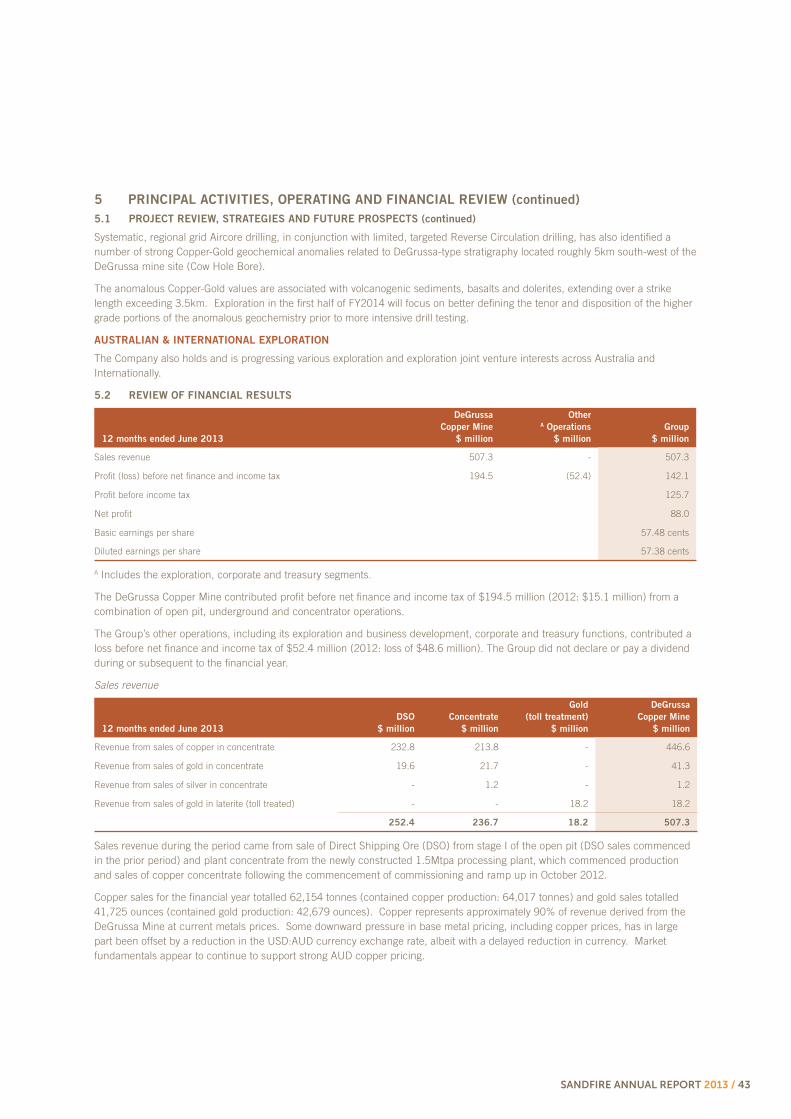
SANDFIRE ANNUAL REPORT 2013 / 43
5 PRINCIPAL ACTIVITIES, OPERATING AND FINANCIAL REVIEW (continued)
5.1 PROJECT REVIEW, STRATEGIES AND FUTURE PROSPECTS (continued)
Systematic, regional grid Aircore drilling, in conjunction with limited, targeted Reverse Circulation drilling, has also identified a number of strong Copper-Gold geochemical anomalies related to DeGrussa-type stratigraphy located roughly 5km south-west of the DeGrussa mine site (Cow Hole Bore).
The anomalous Copper-Gold values are associated with volcanogenic sediments, basalts and dolerites, extending over a strike length exceeding 3.5km. Exploration in the first half of FY2014 will focus on better defining the tenor and disposition of the higher grade portions of the anomalous geochemistry prior to more intensive drill testing.
AUSTRALIAN & INTERNATIONAL EXPLORATION
The Company also holds and is progressing various exploration and exploration joint venture interests across Australia and Internationally.
5.2 REVIEW OF FINANCIAL RESULTS
12 months ended June 2013
DeGrussa
Copper Mine
$ million
Other A Operations
$ million
Group
$ million
Sales revenue 507.3 - 507.3
Profit (loss) before net finance and income tax 194.5 (52.4) 142.1
Profit before income tax 125.7
Net profit 88.0
Basic earnings per share 57.48 cents
Diluted earnings per share 57.38 cents
A Includes the exploration, corporate and treasury segments.
The DeGrussa Copper Mine contributed profit before net finance and income tax of $194.5 million (2012: $15.1 million) from a combination of open pit, underground and concentrator operations.
The Group’s other operations, including its exploration and business development, corporate and treasury functions, contributed a loss before net finance and income tax of $52.4 million (2012: loss of $48.6 million). The Group did not declare or pay a dividend during or subsequent to the financial year.
Sales revenue
12 months ended June 2013
DSO
$ million
Concentrate
$ million
Gold
(toll treatment)
$ million
DeGrussa
Copper Mine
$ million
Revenue from sales of copper in concentrate 232.8 213.8 - 446.6
Revenue from sales of gold in concentrate 19.6 21.7 - 41.3
Revenue from sales of silver in concentrate - 1.2 - 1.2
Revenue from sales of gold in laterite (toll treated) - - 18.2 18.2
252.4 236.7 18.2 507.3
Sales revenue during the period came from sale of Direct Shipping Ore (DSO) from stage I of the open pit (DSO sales commenced in the prior period) and plant concentrate from the newly constructed 1.5Mtpa processing plant, which commenced production and sales of copper concentrate following the commencement of commissioning and ramp up in October 2012.
Copper sales for the financial year totalled 62,154 tonnes (contained copper production: 64,017 tonnes) and gold sales totalled 41,725 ounces (contained gold production: 42,679 ounces). Copper represents approximately 90% of revenue derived from the DeGrussa Mine at current metals prices. Some downward pressure in base metal pricing, including copper prices, has in large part been offset by a reduction in the USD:AUD currency exchange rate, albeit with a delayed reduction in currency. Market fundamentals appear to continue to support strong AUD copper pricing.

44 / SANDFIRE ANNUAL REPORT 2013
5 PRINCIPAL ACTIVITIES, OPERATING AND FINANCIAL REVIEW (continued)
5.2 REVIEW OF FINANCIAL RESULTS (continued)
Operations costs
12 months ended June 2013
DeGrussa
Copper Mine
$ million
Mine operations costs 83.4
Employee benefit expenses 26.5
Freight, treatment and refining expenses 78.6
Changes in inventories of finished goods and work in progress (26.9)
161.6
Operations costs have been incurred in both the open pit, underground mining and plant operations. The underground operations and concentrator plant have been in commissioning and ramp up phase during the reporting period, with all sales and costs from operations disclosed in the Statement of Comprehensive Income following commencement of commercial production in October 2012. Inventories of ore stockpiles, concentrate and consumables have all increased in line with ramping operations.
The Group has provided cost guidance for the 2014 Financial Year of US$1.05 - 1.15 per pound of payable copper production (after gold and silver credits). This compares to a stated C1 cash costs of US$1.37 per pound for the June 2013 Quarter, impacted by restricted copper production from blending of lower recovery open pit sulphide material, which is scheduled to conclude around the end of the September 2013 Quarter.
Royalties
Royalties are levied at 5.0% for copper sold as concentrate and 2.5% for gold, plus native title payments. As DeGrussa’s production value is heavily weighted towards copper production, the combined royalty rate approximates the 5% level.
The Group has expensed royalties for copper concentrate produced by open pit operations (DSO) and plant operations (concentrator) at the level of 5% as it has determined to be applicable under the royalty regulations.
The Group is currently involved in a process to fully and appropriately determine the royalty rate applicable to the DSO sold as concentrate, and has disclosed a $5.5 million contingent liability within this Financial Report, representing an additional 2.5% royalty on DSO sales for the reporting period.
Exploration and evaluation
Significant exploration and evaluation activities continued in and around the DeGrussa Copper Mine with the objective of discovering further ore bodies and lenses to establish a copper-gold VMS camp. Further expenditure has been incurred on the Group’s other project tenements and on a number of joint venture earn-in arrangements. For the period ended 30 June 2013 the Group’s Exploration segment contributed a loss before net financing expense and income tax of $31.2 million (2012: $35.5 million). In accordance with the Group’s accounting policy, exploration and evaluation expenditure is expensed as incurred. Please refer to note 4 of the financial report for further details.
Depreciation and amortisation
WDV
June 2013
$ million
WDV
June 2012
$ million
Depreciation and
amortisation
during the year
$ million
Open Pit Stage I Waste stripping - 30.0 31.0
Production stripping - 12.4 12.4
- 42.4 43.4
Stage II Waste stripping - 9.6 26.2
- 52.0 69.6
Underground Decline and lateral development 172.7 111.6 31.8
Property, plant and equipment 272.4 202.2 22.3
Rehabilitation, restoration and dismantling 21.3 14.8 2.1
Total depreciation and amortisation 125.8
DIRECTORS’ REPORT (continued)

SANDFIRE ANNUAL REPORT 2013 / 45
5 PRINCIPAL ACTIVITIES, OPERATING AND FINANCIAL REVIEW (continued)
5.2 REVIEW OF FINANCIAL RESULTS (continued)
The Group commenced waste stripping in Stage I of the open pit in May 2011, representing the start of a planned two year mining campaign to access Direct Shipping Ore (DSO) chalcocite and primary sulphides, along with direct costed secondary materials of gold laterite and oxide copper. Stage I waste stripping expenditure up to first DSO (to February 2012) was deferred on balance sheet in the prior period and amortised as a cost to DSO and sulphide inventory as mined in the prior and current reporting period.
Production phase stripping has been expensed as incurred, except for additional stripping completed in the prior period which allowed for ore access in the current period. Costs deferred in the prior period have been amortised to production and inventory during the current reporting period.
The Group commenced waste stripping in Stage II of the open pit in January 2012 to access further gold laterite, copper oxide and primary sulphide material, over a mining campaign which concluded ahead of schedule in April 2013. Stage II waste stripping expenditure up to first sulphide extraction was deferred on balance sheet and amortised to sulphide inventory as mined (from January 2013), with secondary materials of gold laterite and copper oxide material directly costed to inventory in the Statement of Financial Position.
Income tax expense
Income tax expense of $37.7 million for the period is based on the corporate tax rate of 30% on taxable income of the Group, adjusted for permanent and timing differences in tax and accounting treatments.
FINANCIAL POSITION
Net assets of the Group have increased by $94.4 million to $211.7 million during the reporting period.
Cash balance
Cash on hand was $77.1 million, including $50 million held in a debt service reserve account to cover the September 2013 scheduled facility repayment and interest. $20 million is held in a cost overrun account to be released to operating bank accounts once formal project completion is confirmed under the Group’s finance facility.
Trade and other receivables
Trade and other receivables have increased marginally with the commencement of plant concentrate sales replacing DSO sales commending in the prior period. Trade receivables include remaining funds from the sale of concentrate subject to provisional pricing and quotational periods at the time of sale.
Inventories
Inventories have increased in finished goods (plant concentrate), ore stockpiles and consumables in line with open pit operations and concentrator plant ramp up.
Mine properties
Further investment has been made in underground mine development, with mine properties at cost increasing by $116.3 million to $283.1 million, including expenditure on underground mine development of $104.9 million to establish decline and development access to the sulphide ore bodies and development phase waste stripping in stage II of the open pit of $17.6 million to access sulphide ore.
Property, plant and equipment
Property, plant and equipment at cost increased by $67.5 million to $273.1 million at the end of the period, predominantly driven by expenditure on process plant construction and associated mine infrastructure.
Deferred tax assets
Income tax resulting from profitable operations has been offset against previously recognised deferred tax assets. The Group is not required to make any income tax payments relating to the reporting period.
Interest bearing liabilities
The Group’s fully secured $390 million project finance facility was established in 2011 to fund the development and construction of the DeGrussa Copper Mine, including $380 million in project construction and working capital funding and $10 million for environmental bonding.
A total of $380 million had been drawn to August 2012 under the facility and used to fund project development and construction, assist with inventory build up, sales timing and plant commissioning costs. The following table summarises the facility transactions during the reporting period, as well as the currently scheduled repayment and cash reserve account obligations for future financial years:

46 / SANDFIRE ANNUAL REPORT 2013
5 PRINCIPAL ACTIVITIES, OPERATING AND FINANCIAL REVIEW (continued)
5.2 REVIEW OF FINANCIAL RESULTS (continued)
Financial
Year
Opening
balance
$ million
Drawdown
$ million
Scheduled
repayment
$ million
Closing
balance
$ million
Current
liability
$ million
Non-
current
liability
$ million
On deposit
(DSRA)
$ million
Closing
balance
including
deposit
$ million
2012/2013 350.0 30.0 (95.0) 285.0 165.0 120.0 (45.0) 240.0
2013/2014 285.0 - (165.0) 120.0 90.0 30.0 (25.0) 95.0
2014/2015 120.0 - (90.0) 30.0 30.0 - (15.0) 15.0
2015/2016 30.0 - (30.0) - - - - -
Within the consolidated statement of financial position, $165 million is disclosed within current liabilities, prior to offset for capitalised finance establishment costs, representing the 2013/2014 financial year scheduled quarterly repayments. A further $120 million is disclosed within non-current liabilities, prior to offset for capitalised finance establishment costs, representing the scheduled repayments to the facility end date of 31 December 2015.
CASH FLOWS Operating activities
Net cash inflow from operating activities was $250.2 million for the period. Net cash flow from operating activities prior to exploration and evaluation activities was $272.4 million for the period.
Investing activities
Net cash outflow from investing activities of $188.6 million for the period is significantly represented by payments for property, plant and equipment purchases ($68.4 million) and mine properties ($119.6 million).
Financing activities
Net cash outflow from financing activities of $84.9 million for the period includes funds received on exercise of share options ($5.5 million) and finance facility drawdown ($30.0 million), offset by facility repayment ($95.0 million) and interest and other costs of finance ($24.4 million).
5.3 CORPORATE
Board and management
On 1 January 2013 Mr W John Evans was appointed as non-executive director, retiring from his previous position as executive technical director.
On 21 May 2013, the Company appointed Mr Paul Hallam as non-executive director.
Mr Michael Spreadborough was appointed Chief Operating Officer effective 12 August 2013, following the resignation of Mr Martin Reed as Chief Operating Officer.
6 SIGNIFICANT CHANGES IN THE STATE OF AFFAIRS
In the opinion of the directors there were no other significant changes in the state of affairs of the Group that occurred during the financial year under review, other than those described in this financial report under ‘Principal activities and review of operations’.
7 SIGNIFICANT EVENTS AFTER THE BALANCE DATE
There have been no events that have occurred subsequent to the reporting date which have significantly affected or may significantly affect the Group’s operations, results or state of affairs in future periods.
8 LIKELY DEVELOPMENTS AND EXPECTED RESULTS
The Group will continue to ramp-up mining operations from its DeGrussa Copper Mine and further the exploration and evaluation of the Group’s tenements. Further comments on likely developments and expected results of certain operations of the Group are included in this financial report under ‘Principal activities and review of operations’.
DIRECTORS’ REPORT (continued)

SANDFIRE ANNUAL REPORT 2013 / 47
9 ENVIRONMENTAL REGULATION AND PERFORMANCE
The Group holds environmental licenses and is subject to significant environmental regulation in respect of its activities in both Australia and overseas. The Board is responsible for monitoring environmental exposures and compliance with these regulations and is committed to achieving a high standard of environmental performance. The Board believes that the Group has adequate systems in place for the management of its environmental requirements.
The Group is registered under the National Greenhouse and Energy Reporting Act (the NGER Act) which introduces a single national reporting framework for the reporting and dissemination of information about the greenhouse gas emissions, greenhouse gas projects, and energy use and production of corporations. As a result, the Group is required to report energy consumption and greenhouse gas emissions for its Australian facilities for the 12 months ended 30 June and future periods. The Group has established data collection systems and processes to meet the new requirements.
In addition, the Group’s Australian operations, while not liable entities, will be indirectly impacted by the Australian Federal Government’s Clean Energy Act which came into force on 1 July 2012.
The Group is also registered under the Australian Federal Government’s Energy Efficiency Opportunities Act 2006 and is currently preparing the first plan to meet the obligations under this Act.
There have been no significant known breaches of the Group’s license conditions or any environmental regulations to which it is subject.
10 SHARE OPTIONS
10.1 UNISSUED SHARES UNDER OPTION
As at the date of this report unissued ordinary shares of the Company under option are:
Expiry Date Exercise Price Number
27 November 2014 $4.66 330,000
27 November 2014 $5.44 330,000
27 November 2014 $6.22 330,000
15 June 2015 $3.80 33,333
15 June 2015 $4.40 133,333
15 June 2015 $5.00 333,335
28 February 2016 $9.00 1,749,995
28 February 2016 $10.30 1,666,665
28 February 2016 $11.70 1,583,340
10.2 SHARE OPTIONS ISSUED
The following options over ordinary shares were issued by the Company during or since the end of the financial year:
Expiry Date Exercise Price Number
28 February 2016 $9.00 250,000
28 February 2016 $10.30 166,667
28 February 2016 $11.70 83,333
28 February 2016 $9.00 250,000
28 February 2016 $10.30 250,000
28 February 2016 $11.70 250,000

48 / SANDFIRE ANNUAL REPORT 2013
10 SHARE OPTIONS (continued)
10.3 SHARES ISSUED AS A RESULT OF THE EXERCISE OF OPTIONS
The following number of ordinary shares were issued by the Company as a result of the exercise of options during or since the end of the financial year:
Expiry Date Exercise Price Number
6 July 2012 $1.40 320,000
12 July 2013 $0.60 800,000
15 June 2015 $3.80 195,833
15 June 2015 $4.40 133,333
15 June 2015 $3.80 37,500
12 July 2013 $0.80 800,000
15 June 2015 $4.40 66,667
27 November 2014 $4.66 20,000
27 November 2014 $5.44 20,000
27 November 2014 $6.22 20,000
12 July 2013 $0.60 210,000
12 July 2013 $0.80 180,000
12 July 2013 $1.00 1,600,000
11 INDEMNIFICATION AND INSURANCE OF DIRECTORS AND OFFICERS
Indemnification
The Company indemnifies each of its directors and officers, including the company secretary, to the maximum extent permitted by the Corporations Act 2001 from liability to third parties, except where the liability arises out of conduct involving lack of good faith, and in defending legal and administrative proceedings and applications for such proceedings.
The Company must use its best endeavours to insure a director or officer against any liability, which does not arise out of a conduct constituting a wilful breach of duty or a contravention of the Corporations Act 2001. The Company must also use its best endeavour to insure a director or officer against liability for costs and expenses incurred in defending proceedings whether civil or criminal.
The Company has not entered into any agreement with its current auditors indemnifying them against any claims by third parties arising from their report on the financial report. The directors of the Company are not aware of any proceedings or claim brought against Sandfire Resources NL as at the date of this report.
Insurance premiums
The Company has paid insurance premiums in respect of directors’ and officers’ liability and legal expenses insurance contracts for current and former directors, executive officers and secretaires. The directors have not included details of the premium paid in respect of the directors’ and officers’ liability and legal expenses’ insurance contracts, as such disclosure is prohibited under the terms of the contract.
12 ROUNDING
The amounts contained in this report and in the financial report have been rounded to the nearest $1,000 (where rounding is applicable and where noted ($’000)) under the option available to the Company under ASIC CO 98/0100. The Company is an entity to which the Class Order applies.
DIRECTORS’ REPORT (continued)

SANDFIRE ANNUAL REPORT 2013 / 49
13 AUDITOR INDEPENDENCE AND NON-AUDIT SERVICES
The directors received the following declaration from the auditor of Sandfire Resources NL.
Non-audit services
The following non-audit services were provided by the Company’s auditor, Ernst & Young. The directors are satisfied that the provision of non-audit services is compatible with the general standard of independence for auditors imposed by the Corporations Act 2001. The nature and scope of each type of non-audit service provided means that auditor independence was not compromised. Ernst & Young received or are due to receive the following amounts for the provision of non-audit services:
Taxation services – Research & Development Tax Concession $ 24,741
Ernst & Young 11 Mounts Bay Road Perth WA 6000 Australia GPO Box M939 Perth WA 6843
Tel: +61 8 9429 2222 Fax: +61 8 9429 2436 ey.com/au
Auditor’s Independence Declaration to the Directors of Sandfire Resources NL In relation to our audit of the financial report of Sandfire Resources NL for the financial year ended 30 June 2013, to the best of my knowledge and belief, there have been no contraventions of the auditor independence requirements of the Corporations Act 2001 or any applicable code of professional conduct. Ernst & Young D S Lewsen Partner 28 August 2013
50 / SANDFIRE ANNUAL REPORT 2013
14 REMUNERATION REPORT (AUDITED)
This remuneration report for the year ended 30 June 2013 outlines the remuneration arrangements of the Company and the Group in accordance with the requirements of the Corporations Act 2001 (the Act) and its regulations. This information has been audited as required by section 308(3C) of the Act.
14.1 INTRODUCTION
The remuneration report details the remuneration arrangements for the Group’s key management personnel (KMP) who are defined as those persons having authority and responsibility for planning, directing and controlling the major activities of the Company and the Group, directly or indirectly, including any director (whether executive or otherwise) of the Company and other designated senior executives.
For the purposes of this report, the term ‘executive’ includes the Chief Executive Officer (CEO) and other senior executives of the Company and the Group.
Details of KMP including remunerated executives of the Company and the Group are set out below.
Name Position Period as KMP
Non-executive directors (NEDs)
Derek La Ferla Chairman (non-executive) All financial year
W John Evans Director (non-executive) All financial year (a)
Robert N Scott Director (non-executive) All financial year
Soocheal Shin Director (non-executive) All financial year
Paul D Hallam Director (non-executive) Appointed 21 May 2013
Executive directors
Karl M Simich Managing Director and Chief Executive Officer All financial year
Other executive KMPs
Matthew L Fitzgerald Chief Financial Officer and Company Secretary All financial year
Martin Reed Chief Operating Officer All financial year (b)
Robert Klug Chief Commercial Officer From 1 January 2013 (c)
(a) W John Evans was appointed as non-executive director on 1 January 2013, retiring from his previous position as executive technical director.
(b) Martin Reed has resigned with effect from 30 June 2013.
(c) Robert Klug met the definition of a key management person on his appointment as Chief Commercial Officer on 1 January 2013.
Michael Spreadborough was appointed Chief Operating Officer with effect from 12 August 2013. There were no other changes to KMP after the reporting date and before the date the financial report was authorised for issue.
14.2 REMUNERATION AT A GLANCE
Remuneration strategy
The Company is committed to the alignment of remuneration, particularly that of executives, to shareholder return. To this end, Sandfire’s remuneration strategy is designed to attract, motivate and retain employees, contractors and non-executive directors (NEDs) by identifying and rewarding high performers and recognising the contribution of each employee to the continued growth and success of the Company.
Key objectives of the Company’s remuneration framework are to ensure that remuneration practices:
Are aligned to the Company’s business strategy;
Offer competitive remuneration benchmarked against the external market;
Provide strong linkage between individual and Company performance and rewards; and
Achieve the broader outcome of creation of value for shareholders by aligning the interests of executives, including employees and contractors, with shareholders.
DIRECTORS’ REPORT (continued)

SANDFIRE ANNUAL REPORT 2013 / 51
14 REMUNERATION REPORT (AUDITED) (continued)
14.2 REMUNERATION AT A GLANCE (continued)
The remuneration structure of the Company incentivised management to achieve the following during the financial year ended 30 June 2013:
Maintain safety standards;
Successfully complete major site construction activities at the DeGrussa Copper Mine during the first half of the 2013 financial year;
Complete open pit mining operations at the Company’s DeGrussa Copper Mine, with Stage 1 of the open pit completed in early December 2012 and Stage 2 of the open pit completed in April 2013. A total of 13.1 million bank cubic metres (Mbcm) of material was extracted during the Stage 1 and Stage 2 open pit operations. The direct shipping ore (DSO) mining and sales program was also completed during the June 2013 quarter, with a total of 144,887 tonnes grading 23.6% Cu for 34,169 tonnes of contained copper and 15,218 ounces of gold sold over the life of the open pit mining operation;
Progress underground mining activities with five stopes in various stages of production by the end of the reporting period and a total of 760,040 tonnes of sulphide ore mined as at 30 June 2013;
Complete commissioning of the 1.5Mtpa concentrator and achievement of nameplate levels of throughput (125,000 tonnes per month) by the end of the March 2013 quarter;
Sales and marketing – metal sales for the 2013 financial year totalled 62,154 tonnes of copper and 41,725 ounces of gold; and
Repayment of $95 million in project debt reducing the outstanding project loan facility balance to $285 million as at 30 June 2013.
14.3 BOARD OVERSIGHT OF REMUNERATION
Remuneration and Nomination Committee
The Remuneration and Nomination Committee comprises three NEDs. Members acting on the Remuneration and Nomination Committee during the financial year are listed below:
Name Period
Chairman Derek La Ferla All financial year
Members Robert Scott All financial year
Paul D Hallam Appointed 4 June 2013
Soocheol Shin Resigned 4 June 2013
The Remuneration and Nomination Committee is responsible for making recommendations to the Board on the remuneration arrangements for NEDs and executives. The committee meets regularly through the year, and assesses the appropriateness of the nature and amount of remuneration of NEDs and executives by reference to relevant market conditions, with the overall objective of ensuring maximum stakeholder benefit from the retention of high performing directors and executives. In determining the level and composition of executive remuneration, the Remuneration and Nomination Committee engages external advisors to provide independent advice where considered appropriate.
Further information on the committee’s role, responsibilities and membership can be seen at www.sandfire.com.au.
Remuneration approval process
The Board approves the remuneration arrangements of the CEO and executives and awards made under the short-term and long-term incentive plans, and sets the maximum aggregate remuneration of NEDs (which is subject to shareholder approval) and the individual NED fee levels, following recommendations from the Remuneration and Nomination Committee.
Use of remuneration consultants
To ensure the Remuneration and Nomination Committee is fully informed when making remuneration decisions, it seeks external remuneration advice. The Board’s appointed remuneration advisor is McDonald & Company (Australasia) (McDonald & Co).
The engagement by the Remuneration and Nomination Committee was based on an agreed set of protocols to ensure that remuneration recommendations are free from bias and undue influence by members of the KMP to whom the recommendations may relate.
During the 2013 financial year, McDonald & Co provided the Company with a report on Gold and General Mining Industry Remuneration. The Company paid McDonald & Co $4,750 for the provision of remuneration services during the financial year ended 30 June 2013.
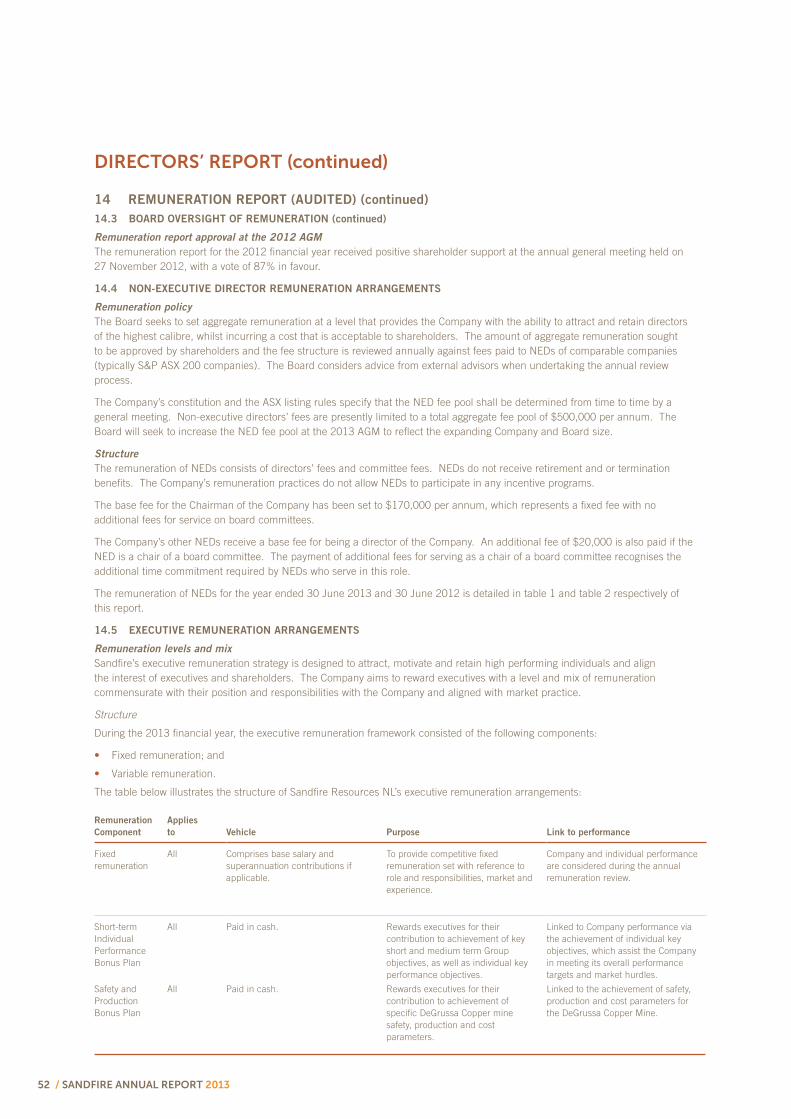
52 / SANDFIRE ANNUAL REPORT 2013
14 REMUNERATION REPORT (AUDITED) (continued)
14.3 BOARD OVERSIGHT OF REMUNERATION (continued)
Remuneration report approval at the 2012 AGM
The remuneration report for the 2012 financial year received positive shareholder support at the annual general meeting held on 27 November 2012, with a vote of 87% in favour.
14.4 NON-EXECUTIVE DIRECTOR REMUNERATION ARRANGEMENTS
Remuneration policy
The Board seeks to set aggregate remuneration at a level that provides the Company with the ability to attract and retain directors of the highest calibre, whilst incurring a cost that is acceptable to shareholders. The amount of aggregate remuneration sought to be approved by shareholders and the fee structure is reviewed annually against fees paid to NEDs of comparable companies (typically S&P ASX 200 companies). The Board considers advice from external advisors when undertaking the annual review process.
The Company’s constitution and the ASX listing rules specify that the NED fee pool shall be determined from time to time by a general meeting. Non-executive directors’ fees are presently limited to a total aggregate fee pool of $500,000 per annum. The Board will seek to increase the NED fee pool at the 2013 AGM to reflect the expanding Company and Board size.
Structure
The remuneration of NEDs consists of directors’ fees and committee fees. NEDs do not receive retirement and or termination benefits. The Company’s remuneration practices do not allow NEDs to participate in any incentive programs.
The base fee for the Chairman of the Company has been set to $170,000 per annum, which represents a fixed fee with no additional fees for service on board committees.
The Company’s other NEDs receive a base fee for being a director of the Company. An additional fee of $20,000 is also paid if the NED is a chair of a board committee. The payment of additional fees for serving as a chair of a board committee recognises the additional time commitment required by NEDs who serve in this role.
The remuneration of NEDs for the year ended 30 June 2013 and 30 June 2012 is detailed in table 1 and table 2 respectively of this report.
14.5 EXECUTIVE REMUNERATION ARRANGEMENTS
Remuneration levels and mix
Sandfire’s executive remuneration strategy is designed to attract, motivate and retain high performing individuals and align the interest of executives and shareholders. The Company aims to reward executives with a level and mix of remuneration commensurate with their position and responsibilities with the Company and aligned with market practice.
Structure
During the 2013 financial year, the executive remuneration framework consisted of the following components:
Fixed remuneration; and
Variable remuneration.
The table below illustrates the structure of Sandfire Resources NL’s executive remuneration arrangements:
Remuneration
Component
Applies
to Vehicle Purpose Link to performance
Fixed remuneration
All Comprises base salary and superannuation contributions if applicable.
To provide competitive fixed remuneration set with reference to role and responsibilities, market and experience.
Company and individual performance are considered during the annual remuneration review.
Short-term Individual Performance Bonus Plan
All Paid in cash. Rewards executives for their contribution to achievement of key short and medium term Group objectives, as well as individual key performance objectives.
Linked to Company performance via the achievement of individual key objectives, which assist the Company in meeting its overall performance targets and market hurdles.
Safety and Production Bonus Plan
All Paid in cash. Rewards executives for their contribution to achievement of specific DeGrussa Copper mine safety, production and cost parameters.
Linked to the achievement of safety, production and cost parameters for the DeGrussa Copper Mine.
DIRECTORS’ REPORT (continued)
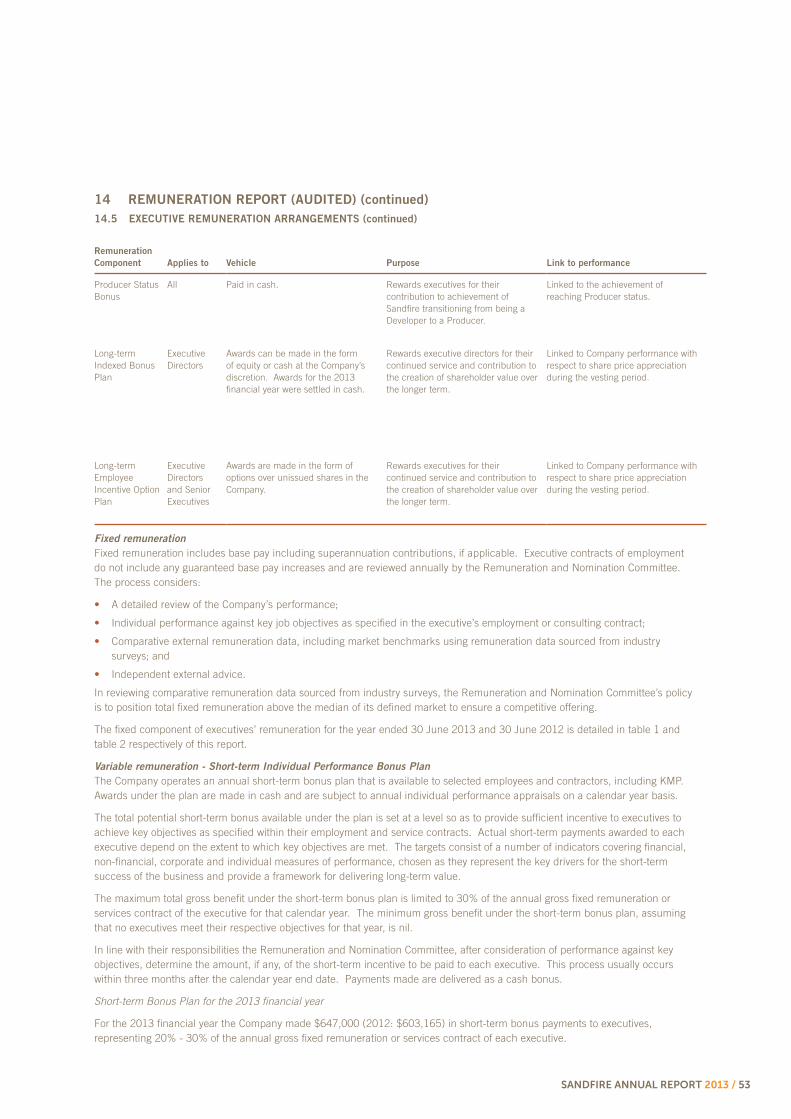
SANDFIRE ANNUAL REPORT 2013 / 53
Remuneration
Component Applies to Vehicle Purpose Link to performance
Producer Status Bonus
All Paid in cash. Rewards executives for their contribution to achievement of Sandfire transitioning from being a Developer to a Producer.
Linked to the achievement of reaching Producer status.
Long-term Indexed Bonus Plan
Executive Directors
Awards can be made in the form of equity or cash at the Company’s discretion. Awards for the 2013 financial year were settled in cash.
Rewards executive directors for their continued service and contribution to the creation of shareholder value over the longer term.
Linked to Company performance with respect to share price appreciation during the vesting period.
Long-term Employee Incentive Option Plan
Executive Directors and Senior Executives
Awards are made in the form of options over unissued shares in the Company.
Rewards executives for their continued service and contribution to the creation of shareholder value over the longer term.
Linked to Company performance with respect to share price appreciation during the vesting period.
Fixed remuneration
Fixed remuneration includes base pay including superannuation contributions, if applicable. Executive contracts of employment do not include any guaranteed base pay increases and are reviewed annually by the Remuneration and Nomination Committee. The process considers:
A detailed review of the Company’s performance;
Individual performance against key job objectives as specified in the executive’s employment or consulting contract;
Comparative external remuneration data, including market benchmarks using remuneration data sourced from industry surveys; and
Independent external advice.
In reviewing comparative remuneration data sourced from industry surveys, the Remuneration and Nomination Committee’s policy is to position total fixed remuneration above the median of its defined market to ensure a competitive offering.
The fixed component of executives’ remuneration for the year ended 30 June 2013 and 30 June 2012 is detailed in table 1 and table 2 respectively of this report.
Variable remuneration - Short-term Individual Performance Bonus Plan
The Company operates an annual short-term bonus plan that is available to selected employees and contractors, including KMP. Awards under the plan are made in cash and are subject to annual individual performance appraisals on a calendar year basis.
The total potential short-term bonus available under the plan is set at a level so as to provide sufficient incentive to executives to achieve key objectives as specified within their employment and service contracts. Actual short-term payments awarded to each executive depend on the extent to which key objectives are met. The targets consist of a number of indicators covering financial, non-financial, corporate and individual measures of performance, chosen as they represent the key drivers for the short-term success of the business and provide a framework for delivering long-term value.
The maximum total gross benefit under the short-term bonus plan is limited to 30% of the annual gross fixed remuneration or services contract of the executive for that calendar year. The minimum gross benefit under the short-term bonus plan, assuming that no executives meet their respective objectives for that year, is nil.
In line with their responsibilities the Remuneration and Nomination Committee, after consideration of performance against key objectives, determine the amount, if any, of the short-term incentive to be paid to each executive. This process usually occurs within three months after the calendar year end date. Payments made are delivered as a cash bonus.
Short-term Bonus Plan for the 2013 financial year
For the 2013 financial year the Company made $647,000 (2012: $603,165) in short-term bonus payments to executives, representing 20% - 30% of the annual gross fixed remuneration or services contract of each executive.
14 REMUNERATION REPORT (AUDITED) (continued)
14.5 EXECUTIVE REMUNERATION ARRANGEMENTS (continued)
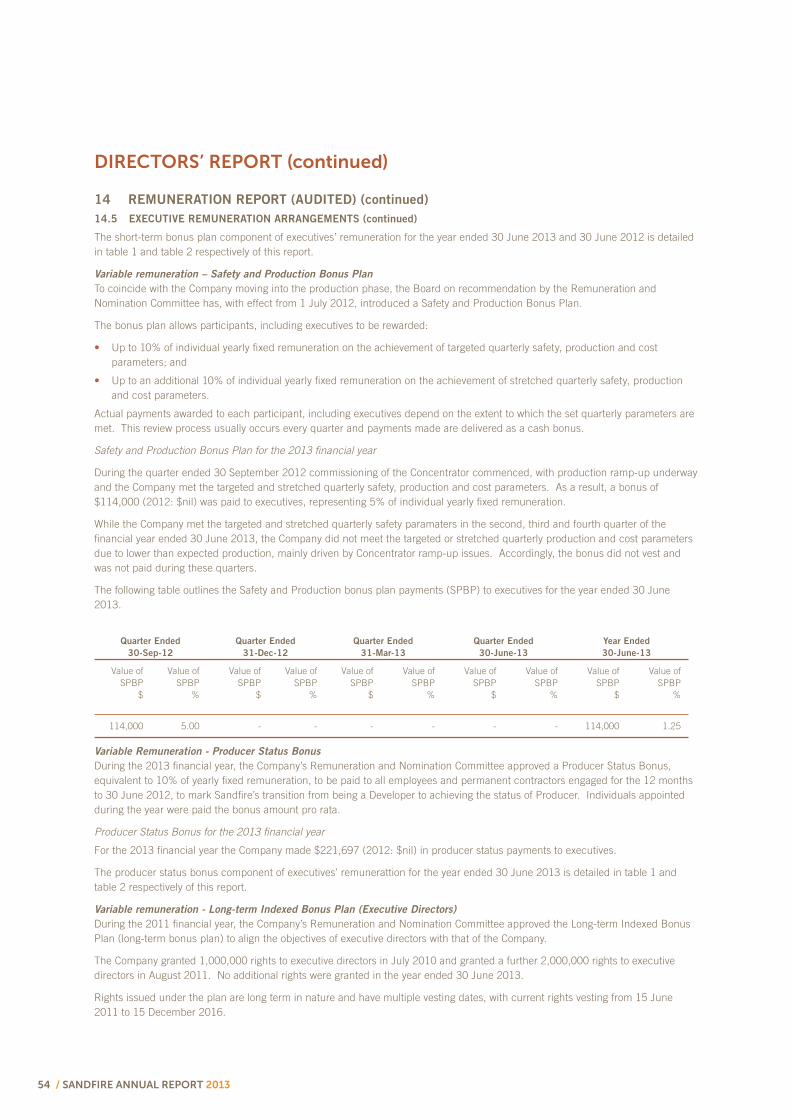
54 / SANDFIRE ANNUAL REPORT 2013
14 REMUNERATION REPORT (AUDITED) (continued)
14.5 EXECUTIVE REMUNERATION ARRANGEMENTS (continued)
The short-term bonus plan component of executives’ remuneration for the year ended 30 June 2013 and 30 June 2012 is detailed in table 1 and table 2 respectively of this report.
Variable remuneration – Safety and Production Bonus Plan
To coincide with the Company moving into the production phase, the Board on recommendation by the Remuneration and Nomination Committee has, with effect from 1 July 2012, introduced a Safety and Production Bonus Plan.
The bonus plan allows participants, including executives to be rewarded:
Up to 10% of individual yearly fixed remuneration on the achievement of targeted quarterly safety, production and cost parameters; and
Up to an additional 10% of individual yearly fixed remuneration on the achievement of stretched quarterly safety, production and cost parameters.
Actual payments awarded to each participant, including executives depend on the extent to which the set quarterly parameters are met. This review process usually occurs every quarter and payments made are delivered as a cash bonus.
Safety and Production Bonus Plan for the 2013 financial year
During the quarter ended 30 September 2012 commissioning of the Concentrator commenced, with production ramp-up underway and the Company met the targeted and stretched quarterly safety, production and cost parameters. As a result, a bonus of $114,000 (2012: $nil) was paid to executives, representing 5% of individual yearly fixed remuneration.
While the Company met the targeted and stretched quarterly safety paramaters in the second, third and fourth quarter of the financial year ended 30 June 2013, the Company did not meet the targeted or stretched quarterly production and cost parameters due to lower than expected production, mainly driven by Concentrator ramp-up issues. Accordingly, the bonus did not vest and was not paid during these quarters.
The following table outlines the Safety and Production bonus plan payments (SPBP) to executives for the year ended 30 June 2013.
Quarter Ended
30-Sep-12
Quarter Ended
31-Dec-12
Quarter Ended
31-Mar-13
Quarter Ended
30-June-13
Year Ended
30-June-13
Value of SPBP
$
Value of SPBP
%
Value of SPBP
$
Value of SPBP
%
Value of SPBP
$
Value of SPBP
%
Value of SPBP
$
Value of SPBP
%
Value of SPBP
$
Value of SPBP
%
114,000 5.00 - - - - - - 114,000 1.25
Variable Remuneration - Producer Status Bonus
During the 2013 financial year, the Company’s Remuneration and Nomination Committee approved a Producer Status Bonus, equivalent to 10% of yearly fixed remuneration, to be paid to all employees and permanent contractors engaged for the 12 months to 30 June 2012, to mark Sandfire’s transition from being a Developer to achieving the status of Producer. Individuals appointed during the year were paid the bonus amount pro rata.
Producer Status Bonus for the 2013 financial year
For the 2013 financial year the Company made $221,697 (2012: $nil) in producer status payments to executives.
The producer status bonus component of executives’ remunerattion for the year ended 30 June 2013 is detailed in table 1 and table 2 respectively of this report.
Variable remuneration - Long-term Indexed Bonus Plan (Executive Directors)
During the 2011 financial year, the Company’s Remuneration and Nomination Committee approved the Long-term Indexed Bonus Plan (long-term bonus plan) to align the objectives of executive directors with that of the Company.
The Company granted 1,000,000 rights to executive directors in July 2010 and granted a further 2,000,000 rights to executive directors in August 2011. No additional rights were granted in the year ended 30 June 2013.
Rights issued under the plan are long term in nature and have multiple vesting dates, with current rights vesting from 15 June 2011 to 15 December 2016.
DIRECTORS’ REPORT (continued)

SANDFIRE ANNUAL REPORT 2013 / 55
14 REMUNERATION REPORT (AUDITED) (continued)
14.5 EXECUTIVE REMUNERATION ARRANGEMENTS (continued)
The Company sets an initial indexed notional value (INV) for rights issued under the bonus plan. On the first vesting date, the holder of the awards receives, at the Company’s sole discretion, either cash, or subject to any shareholder approval required under the Corporations Act 2001 and the ASX Listing Rules, ordinary shares in the Company for the difference between the 5-day volume weighted average ASX price of underlying Company shares prior to the vesting date (test price), and the INV set when the rights were initially granted. At each subsequent test date, the award is re-tested, whereby the holder receives the difference between the 5-day volume weighted average ASX price of underlying Company shares prior to the test date and the higher of the initial INV or the highest test price that occurred prior to that date.
Termination and change of control provisions
Participant initiated termination
Where a participant ceases to be an employee or contractor of the Company prior to vesting of their award, all outstanding rights will expire and cease to carry any rights or benefits.
Company initiated termination
Where the engagement or employment is terminated by the Company for reasons other than serious misconduct, the rights will continue to vest for 180 days following the end of the required notice period, with the final vesting date to be the date on which the 180 day notice period expires.
Change of control
In the event of a change of control of the Company, the vesting period will be brought forward to the date of the change of control and awards will automatically vest.
Listed below are the terms and conditions of rights issued by the Company under the long-term bonus plan.
Grant date Number
Indexed
notional value
Initial
vesting date Test dates Contractual life
Long-term bonus plan grant to executive directors of the Company on 8 August 2011, expiring 15 December 2016.
666,666
666,667
666,667
$9.00
$10.30
$11.70
15 June 2013
15 June 2014
15 June 2015
15 June and 15 December from 2013 to 2016
15 June and 15 December from 2014 to 2016
15 June and 15 December from 2015 to 2016
5 years
5 years
5 years
Long-term bonus plan grant to executive directors of the Company on 2 July 2010, modified on 8 August 2011, expiring 15 December 2015.
333,332
333,334
333,334
$3.80
$4.40
$5.00
15 June 2011
15 June 2012
15 June 2013
15 June and 15 December from 2011 to 2015
15 June and 15 December from 2012 to 2015
15 June and 15 December from 2013 to 2015
4 years
4 years
4 years
Long-term Indexed Bonus Plan for the 2013 financial year
On 1 January 2013 Mr Evans resigned as an executive technical director and was appointed a non-executive director. The Board resolved that Mr Evans’ long term rights would continue to vest for 180 days after resignation date and in addition to any other test date per the original plan, the final test date would be 30 June 2013, after which time the long-term rights ceased to vest and he ceased to be entitled to any bonus payments under the plan. As a result and subsequent to his resignation date, Mr Evans’ rights were tested on 15 June 2013 and 30 June 2013 and a payment of $80,498 was made to him. Total payments to Mr Evans under the plan for the current financial year amounted to $217,931. The rights were cancelled on 30 June 2013 and an amount of $639,359 of previously recognised remuneration was reversed when valued in accordance with AASB 2.

56 / SANDFIRE ANNUAL REPORT 2013
14 REMUNERATION REPORT (AUDITED) (continued)
14.5 EXECUTIVE REMUNERATION ARRANGEMENTS (continued)
In accordance with the terms and conditions of the plan, the Company paid $1,089,655 (2012: $846,331) in cash-settled awards for the year ended 30 June 2013, representing vesting of long-term rights. The Company also recognised a credit to expenses of $2,108,264 (2012: expense of $2,001,679) during the current financial year relating to the valuation of long term rights, in accordance with AASB 2. For details on the valuation of rights, including models and assumptions used, refer to note 22 of the financial report.
The above components are included as part total executives’ remuneration in Table 1 of this report, disclosed as a component of share-based payments.
Further details in respect of the award are provided in Table 3b of this report.
Variable remuneration - Long-term Incentive Option Plan
The long-term Incentive Option Plan (IOP) was introduced to promote continuity of employment and provide additional incentive to KMP to increase shareholder wealth. The plan provides for selected executives, including KMP, to be offered the opportunity to subscribe for options over ordinary fully paid shares. Each option carries the right to subscribe for one fully paid ordinary share.
Options under the plan are provided to KMP based on their level of seniority and position within the Company. Options may only be issued to directors subject to approval by shareholders in a general meeting.
Under the IOP the Board has the right to issue options on terms and conditions they determine appropriate and in exercising that discretion may give regard to the following:
the Eligible Participant’s length of service to the Company;
the contribution made by the Eligible Participant to the Company; and
the potential contribution of the Eligible Participant to the Company.
The Board may also impose certain conditions, including performance-related and service based conditions, on the right of the participant to exercise any option granted. The Board imposed service based conditions on options issued during the financial year. The Board did not impose any performance-related conditions on options issued during the financial year.
There are no voting or dividend rights attached to the options and options issued under the plan are to be issued for no consideration. Voting rights will be attached to the ordinary issued shares when the options have been exercised.
KMPs are not permitted to limit or offset their exposure to market risk in relation to securities issued.
Long-term Incentive Option for the 2013 financial year
No options were issued to key management persons, including executives, under the IOP during the current financial year. The issue of options to Mr Klug on 2 August 2012 was made prior to his appointment as Chief Commercial Officer when he met the definition of a key management person.
For details on the valuation of options, including models and assumptions used, please refer to note 22 of the financial report.
Further details in respect of options issued to KMP are provided in Table 3a of this report.
14.6 COMPANY PERFORMANCE AND THE LINK TO REMUNERATION
Company performance and its link to short-term incentives
The Group has various short term incentives that are linked to Company performance:
the short-term individual performance bonus plan; and
the safety and production bonus plan.
The purpose of the plans is to reward executives for their contribution to achievement of key short and medium term Group objectives, as well as individual key performance objectives, which assist the Group in meeting its overall targets and market hurdles. Refer to section 14.5 of this report for more details relating to the performance of the Company and relevant executives against set performance hurdles.
Company performance and its link to long-term incentives
The Company’s long-term incentives including the Long-term Indexed Bonus Plan and the Long-term Incentive Option Plan reward key management personnel for their continued service and contribution to the achievement of Company outcomes, with respect to share price appreciation. The approach of linking individual executive remuneration to plans such as the Long-term Indexed Bonus Plan and Long-term Incentive Option Plan is an established practice for listed companies and has the benefit of conserving cash whilst appropriately incentivising and rewarding senior executives to increase shareholder wealth.
DIRECTORS’ REPORT (continued)
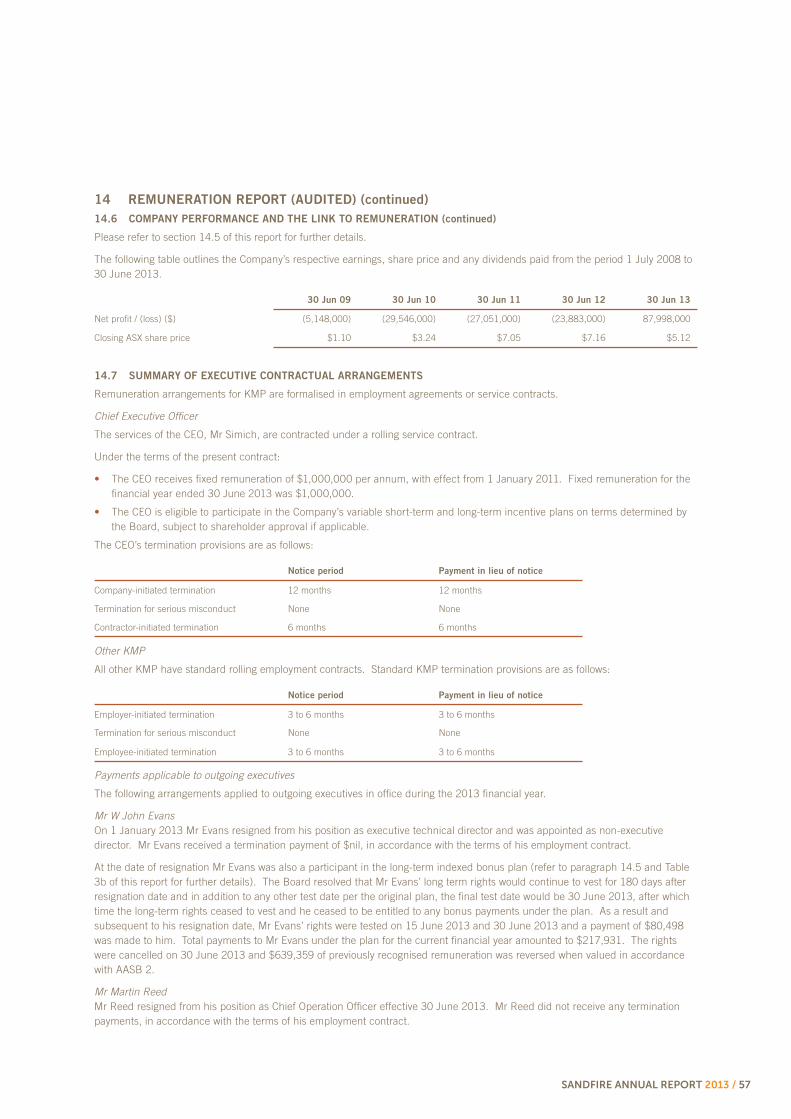
SANDFIRE ANNUAL REPORT 2013 / 57
14 REMUNERATION REPORT (AUDITED) (continued)
14.6 COMPANY PERFORMANCE AND THE LINK TO REMUNERATION (continued)
Please refer to section 14.5 of this report for further details.
The following table outlines the Company’s respective earnings, share price and any dividends paid from the period 1 July 2008 to 30 June 2013.
30 Jun 09 30 Jun 10 30 Jun 11 30 Jun 12 30 Jun 13
Net profit / (loss) ($) (5,148,000) (29,546,000) (27,051,000) (23,883,000) 87,998,000
Closing ASX share price $1.10 $3.24 $7.05 $7.16 $5.12
14.7 SUMMARY OF EXECUTIVE CONTRACTUAL ARRANGEMENTS
Remuneration arrangements for KMP are formalised in employment agreements or service contracts.
Chief Executive Officer
The services of the CEO, Mr Simich, are contracted under a rolling service contract.
Under the terms of the present contract:
The CEO receives fixed remuneration of $1,000,000 per annum, with effect from 1 January 2011. Fixed remuneration for the financial year ended 30 June 2013 was $1,000,000.
The CEO is eligible to participate in the Company’s variable short-term and long-term incentive plans on terms determined by the Board, subject to shareholder approval if applicable.
The CEO’s termination provisions are as follows:
Notice period Payment in lieu of notice
Company-initiated termination 12 months 12 months
Termination for serious misconduct None None
Contractor-initiated termination 6 months 6 months
Other KMP
All other KMP have standard rolling employment contracts. Standard KMP termination provisions are as follows:
Notice period Payment in lieu of notice
Employer-initiated termination 3 to 6 months 3 to 6 months
Termination for serious misconduct None None
Employee-initiated termination 3 to 6 months 3 to 6 months
Payments applicable to outgoing executives
The following arrangements applied to outgoing executives in office during the 2013 financial year.
Mr W John Evans On 1 January 2013 Mr Evans resigned from his position as executive technical director and was appointed as non-executive director. Mr Evans received a termination payment of $nil, in accordance with the terms of his employment contract.
At the date of resignation Mr Evans was also a participant in the long-term indexed bonus plan (refer to paragraph 14.5 and Table 3b of this report for further details). The Board resolved that Mr Evans’ long term rights would continue to vest for 180 days after resignation date and in addition to any other test date per the original plan, the final test date would be 30 June 2013, after which time the long-term rights ceased to vest and he ceased to be entitled to any bonus payments under the plan. As a result and subsequent to his resignation date, Mr Evans’ rights were tested on 15 June 2013 and 30 June 2013 and a payment of $80,498 was made to him. Total payments to Mr Evans under the plan for the current financial year amounted to $217,931. The rights were cancelled on 30 June 2013 and $639,359 of previously recognised remuneration was reversed when valued in accordance with AASB 2.
Mr Martin Reed Mr Reed resigned from his position as Chief Operation Officer effective 30 June 2013. Mr Reed did not receive any termination payments, in accordance with the terms of his employment contract.

58 / SANDFIRE ANNUAL REPORT 2013
14 REMUNERATION REPORT (AUDITED) (continued)
14.8 REMUNERATION OF KEY MANAGEMENT PERSONNEL
Table 1: Remuneration for the year ended 30 June 2013
Short-term benefits
Post
employment Total
Share-based payments
(SBP) Total
Value of
SBP
Performance
related
Salary
& fees
Cash A bonus Other
Super-
annuation Options
Share
appreciation
rights `
$ $ $ $ $ $ $ $ % %
Non-executive
directors
Derek La Ferla 155,963 - - 14,037 170,000 - - 170,000 - -
Robert N Scott 100,665 - - 4,335 105,000 - - 105,000 - -
Soocheol Shin 85,000 - - - 85,000 - - 85,000 - -
W John Evans 87,500 - - - 87,500 - - 87,500 - -
Paul D Hallam B 8,059 - - 725 8,784 - - 8,784 - -
Total non-executive
directors437,187 - - 19,097 456,284 - - 456,284 - -
Executive directors
Karl M Simich 1,000,000 450,000 - - 1,450,000 - C(597,181) 852,819 (70.02) 52.77
W John Evans D 162,546 128,500 - 22,454 313,500 - D(421,428) (107,928) (390.47) 119.06
Other key
management
personnel
Martin Reed E 400,579 220,500 - 21,621 642,700 - - 642,700 - 34.30
Matthew L Fitzgerald 408,000 183,697 - 22,000 613,697 - - 613,697 - 29.93
Robert Klug F 183,486 - - 16,514 200,000 - - 200,000 - -
Total executive KMP 2,154,611 982,697 - 82,589 3,219,897 - (1,018,609) 2,201,288 (46.27) 44.64
Totals 2,591,798 982,697 - 101,686 3,676,181 - (1,018,609) 2,657,572 (38.33) 36.98
A Amounts included in remuneration represent the amount that vested in the financial year based on achievement of key objectives in accordance with the Company’s annual Short-term Bonus Plan (Bonus Plan) as detailed in note 14.5 of the remuneration report. No amounts were forfeited and no amounts vest in future financial years in respect of the Bonus Plan for the 2013 financial year.
B Paul D Hallam was appointed a Non-executive director on 21 May 2013.
C The credit of $597,181 relates to adjustments arising from Mr Simich’s rights issued under the Long-term Indexed Bonus Plan and includes a reversal of $1,468,905 for previously recognised remuneration valued in accordance with AASB 2 (refer to note 22 of the financial report). Mr Simich received $871,724 in cash payments during the financial year representing vesting of long term rights.
D On 1 January 2013, Mr Evans resigned from his position as executive technical director and was appointed as non-executive director. In accordance with the terms of his resignation, Mr Evans’ long term rights were cancelled on 30 June 2013 and $639,359 of previously recognised remuneration was reversed when valued in accordance with AASB 2 (refer to note 22 of the financial report). Mr Evan received $217,931 in cash payments during the current financial year representing vesting of long term rights prior to cancellation.
E Martin Reed resigned with effect from 30 June 2013.
F Robert Klug met the definition of a key management person on his appointment as Chief Commercial Officer on 1 January 2013.
DIRECTORS’ REPORT (continued)

SANDFIRE ANNUAL REPORT 2013 / 59
14 REMUNERATION REPORT (AUDITED) (continued)
14.8 REMUNERATION OF KEY MANAGEMENT PERSONNEL (continued)
Table 2: Remuneration for the year ended 30 June 2012
Short-term benefits
Post
employment Total
Share-based payments
(SBP) Total
Value of
SBP
Performance
related
Salary
& fees
Cash
bonus A Other
Super-
annuation B Options
Share
appreciation
rights
$ $ $ $ $ $ $ $ % %
Non-executive
directors
Derek La Ferla 155,963 - - 14,037 170,000 - - 170,000 - -
Robert N Scott 100,665 - - 4,335 105,000 - - 105,000 - -
Soocheol Shin E 28,333 - - - 28,333 - - 28,333 - -
Jonghun Jong E 56,667 - - - 56,667 - - 56,667 - -
Total non-executive
directors341,628 - - 18,372 360,000 - - 360,000 - -
Executive directors
Karl M Simich 1,000,000 300,000 - - 1,300,000 - C2,212,685 3,512,685 62.99 8.54
W John Evans 330,275 48,165 - 34,060 412,500 - D635,325 1,047,825 60.63 5.01
Other key
management
personnel
Martin Reed 446,121 141,000 - 20,229 607,350 - - 607,350 - 23.22
Matthew L Fitzgerald 383,296 114,000 - 16,753 514,049 303,034 - 817,083 37.09 13.95
Total executive KMP 2,159,692 603,165 - 71,042 2,833,899 303,034 2,848,010 5,984,943 52.65 10.15
Totals 2,501,320 603,165 - 89,414 3,193,899 303,034 2,848,010 6,344,943 49.66 9.57
A Amounts included in remuneration represent the amount that vested in the financial year based on achievement of key objectives in accordance with the Company’s annual Short-term Bonus Plan (Bonus Plan) as detailed in note 14.5 of the remuneration report. No amounts were forfeited and no amounts vest in future financial years in respect of the Bonus Plan for the 2012 financial year.
B The fair value of options is calculated at the date of grant using the Black-Scholes option pricing model and recognised over the period in which the minimum service conditions are fulfilled (the vesting period). No share options were granted to key management persons, including executives, as remuneration during the financial year. The value disclosed is the portion of the fair value of the options issued during the previous financial year but recognised in the current reporting period. The amount included as remuneration is not related to or indicative of the benefit (if any) that individual KMP may in fact receive. For details on the valuation of the options, including models and assumptions used, refer to note 22 of the financial report.
C Mr Simich received $677,064 during the year in cash payments resulting from the vesting of long term rights.
D Mr Evans received $169,267 during the year in cash payments resulting from the vesting of long term rights.
E Soocheol Shin was appointed 28 February 2012; Jonghun Jong resigned 28 February 2012.

60 / SANDFIRE ANNUAL REPORT 2013
14 REMUNERATION REPORT (AUDITED) (continued)
14.9 EQUITY INSTRUMENTS
Table 3a: Options granted and vested during the year A
Terms and conditions for each grant during the year
Options vested during
the year
Number Grant date
Fair value per option B at grant date ($)
Exercise
price ($) Expiry date Vesting date Number %
Executive directors
Karl M Simich - 27-Nov-2009 - - - - 200,000 100.00
W John Evans C - 27-Nov-2009 - - - - 110,000 100.00
Other key
management
personnel
Martin Reed - 21-Jun-2010 - - - - 133,334 100.00
- 11-Mar-2011 - - - - 116,667 100.00
- 11-Mar-2011 - - - - 116,667 100.00
Matthew L Fitzgerald - 21-Jun-2010 - - - - 133,334 100.00
- 11-Mar-2011 - - - - 266,667 100.00
Robert Klug D - 11-Mar-2011 - - - - 83,333 100.00
250,000 2-Aug-2012 $0.59 $9.00 28-Feb-2016 2-Aug-2012 250,000 100.00
166,667 2-Aug-2012 $0.62 $10.30 28-Feb-2016 28-Feb-2013 166,667 100.00
83,333 2-Aug-2012 $0.81 $11.70 28-Feb-2016 28-Feb-2014 - -
Total 500,000 1,576,669
A Each option carries the right to subscribe for one fully paid ordinary share in Sandfire Resources NL. For details on the valuation of the options, including models and assumptions used, refer to note 22 of the financial report.
B The fair value of options is calculated at the date of grant using the Black-Scholes option pricing model and recognised over the period in which the minimum service conditions are fulfilled (the vesting period). The fair value is not related to or indicated of the benefit (if any) that the individual KMP may in fact receive.
C W John Evans was appointed a non-executive director and resigned as an executive technical director on 1 January 2013.
D Robert Klug met the definition of a key management person on his appointment as Chief Commercial Officer on 1 January 2013. The issue of options to Mr Klug was prior to his appointment as Chief Commercial Officer and as a result, the value of the options issued has not been included within Mr Klug’s remuneration for the year ended 30 June 2013.
DIRECTORS’ REPORT (continued)

SANDFIRE ANNUAL REPORT 2013 / 61
14 REMUNERATION REPORT (AUDITED) (continued)
14.9 EQUITY INSTRUMENTS (continued)
Table 3b: Rights granted, modified and vested during the year
Terms and conditions for each grant during the year
Rights vested
during the year
Rights tested
during the year
Note Number
Grant /
Modification
Date Fair value
Indexed
notional
value Expiry date
Initial
vesting date Number % Number
15-Dec-12 15-Jun-13 30-Jun-13
Test
price
Fair
value
Test
price
Fair
value
Fair
value
Test
price
Executive
directors
Karl M Simich
1,3 266,666 8-Aug 2011 $0.04 - $0.63 $8.04 15-Dec-2015 15-Jun-2011 - - 266,666 $8.04 $0.96 $6.21 -
1,3 266,667 8-Aug 2011 $0.04 - $0.63 $8.04 15-Dec-2015 15-Jun-2012 - - 266,667 $8.04 $1.10 $6.21 -
1,3 266,667 8-Aug 2011 $0.23 - $1.03 $6.21 15-Dec-2015 15-Jun-2013 266,667 100.00 266,667 $6.21 $1.21
2,3 500,000 8-Aug 2011 $0.01 - $0.75 $9.00 15-Dec-2016 15-Jun-2013 500,000 100.00 500,000 $6.21 -
2,3 500,000 8-Aug 2011 $0.05 - $0.58 $10.30 15-Dec-2016 15-Jun-2014 - -
2,3 500,000 8-Aug 2011 $0.16 - $0.45 $11.70 15-Dec-2016 15-Jun-2015 - -
W John Evans
1,3 66,666 8-Aug 2011 $0.04 - $0.63 $8.04 30-Jun-2013 15-Jun-2011 - - 66,666 $8.04 $0.96 $6.21 - $5.17 -
1,3 66,667 8-Aug 2011 $0.04 - $0.63 $8.04 30-Jun-2013 12-Jun-2012 - - 66,667 $8.04 $1.10 $6.21 - $5.17 -
1,3 66,667 8-Aug 2011 $0.23 - $1.03 $6.21 30-Jun-2013 15-Jun-2013 66,667 100.00 66,667 $6.21 $1.21 $5.17 -
2,3 166,666 8-Aug 2011 $0.01 - $0.75 $9.00 30-Jun-2013 15-Jun-2013 166,666 100.00 66,666 $6.21 - $5.17 -
2,3 166,667 8-Aug 2011 $0.05 - $0.58 $10.30 30-Jun-2013 15-Jun-2014 - - $5.17 -
2,3 166,667 8-Aug 2011 $0.16 - $0.45 $11.70 30-Jun-2013 15-Jun-2015 - - $5.17 -
Total 3,000,000 1,000,000 1,566,666
1 The terms and conditions of the rights, initially granted 2 July 2010, were modified 8 August 2011. Refer to note 14.5 of the remuneration report for details.
2 This grant relates rights issued under the Company’s long-term Indexed Bonus Plan during the current financial year. Refer to note 14.5 of the remuneration report for details.
3 The fair value of the rights is calculated at the reporting date using the Black-Scholes option pricing model. In accordance with the terms and conditions of the long-term Indexed Bonus Plan, the ultimate value of the long-term rights will be calculated on the initial vesting date and subsequent testing dates. Vested rights are tested on 15 June and 15 December of each calendar year subsequent to the initial vesting date and up to expiry. The fair value of the rights at each of the test dates, is the difference between the 5-day volume weighted average ASX price of underlying Company shares and the higher of the initial INV or the highest test price that occurred prior to that test date. For details on the valuation of the rights, including models and assumptions used, refer to note 22 of the financial report.
4 On 1 January 2013 Mr Evans resigned from his position as executive technical director and was appointed as non-executive director. The Board resolved that Mr Evans’ long term rights continued to vest for 180 days following the end of the notice period and in addition to any other test date, the final test date was the date on which the 180 day period expired (being 30 June 2013), after which time the long-term rights ceased to vest and he ceased to be entitled to be paid any bonus under the rights.

62 / SANDFIRE ANNUAL REPORT 2013
14 REMUNERATION REPORT (AUDITED) (continued)
14.9 EQUITY INSTRUMENTS (continued)
Table 4: Value of options granted, exercised and lapsed during the year
Value of options granted
during the year
Value of options exercised A during the year
Value of options sold B during the year
Value of options lapsed
during the year
$ $ $ $
Non-executive directors
W John Evans - 6,522,200 - -
Executive directors
Karl M Simich - 17,064,000 - -
Other key management
personnel
Matthew L Fitzgerald - - 1,513,164 -
A The value is calculated as the market price of shares of the Company as at close of trading on the date the options were exercised after deducting the price paid to exercise the option.
B The value is calculated as the market price of shares of the Company as at the close of trading on the date the options were disposed after deducting the price to exercise the option.
There were no alterations to the terms and conditions of options awarded as remuneration since their award date.
Shares issued on exercise of options
2,400,000 fully paid shares were issued to Mr Simich on the conversion of 800,000 unlisted options at $0.60 each, 800,000 unlisted options at $0.80 each and 800,000 unlisted options at $1.00 each.
1,190,000 fully paid shares were issued to Mr Evans on the conversion of 210,000 unlisted options at $0.60 each, 180,000 unlisted options at $0.80 each and 800,000 options at $1.00 each.
Signed in accordance with a resolution of the directors.
West Perth, 28 August 2013
Derek La Ferla Non-executive Chairman
Karl M. Simich Managing Director and Chief Executive Officer
DIRECTORS’ REPORT (continued)

SANDFIRE ANNUAL REPORT 2013 / 63
Note
2013
$000
2012
$000
Sales revenue 5 507,331 20,684
Realised and unrealised metal and price adjustments gains (losses) 5 (14,573) (326)
Other income 15 - 1,470
Changes in inventories of finished goods and work in progress 26,888 5,852
Mine operations costs (83,412) (2,920)
Employee benefit expenses 6 (38,716) (14,986)
Freight, treatment and refining expenses (78,563) (3,985)
Royalties expense (20,986) (1,263)
Exploration and evaluation expenses (22,079) (26,424)
Depreciation and amortisation expenses 6 (125,849) (4,524)
Share of net loss of associate (1,106) (650)
Impairment expense 15 (500) (1,463)
Administrative expenses (6,299) (5,008)
Profit (loss) before net finance and income tax 142,136 (33,543)
Finance income 7 3,051 1,217
Finance expense 7 (19,519) (235)
Net finance (expense) income (16,468) 982
Profit (loss) before income tax 125,668 (32,561)
Income tax (expense) benefit 8 (37,670) 8,678
Net profit (loss) for the year 87,998 (23,883)
Other comprehensive income for the period, net of tax - -
Total comprehensive income for the period 87,998 (23,883)
Earnings (loss) per share
Basic earnings (loss) per share attributable to ordinary equity holders (cents) 57.48 (15.85)
Diluted earnings (loss) per share attributable to ordinary equity holders (cents) 57.38 (15.85)
The above consolidated statement of comprehensive income should be read in conjunction with the accompanying notes.
CONSOLIDATED STATEMENT OF COMPREHENSIVE INCOME
FOR THE YEAR ENDED 30 JUNE 2013

64 / SANDFIRE ANNUAL REPORT 2013
CONSOLIDATED STATEMENT OF FINANCIAL POSITION
FOR THE YEAR ENDED 30 JUNE 2013
Note
2013
$000
2012
$000
ASSETS
Cash and cash equivalents 10 77,070 100,389
Trade and other receivables 11 8,491 7,015
Inventories 12 38,507 7,254
Other current assets 1,954 1,085
Total current assets 126,022 115,743
Receivables 11 84 3
Inventories 12 11,698 6,233
Mine properties 13 177,752 163,670
Property, plant and equipment 14 245,924 202,232
Other financial assets 15 183 1,189
Deferred tax assets 8 2,939 40,580
Total non-current assets 438,580 413,907
TOTAL ASSETS 564,602 529,650
LIABILITIES
Trade and other payables 16 43,932 49,626
Interest bearing liabilities 17 163,906 94,146
Provisions 18 2,360 1,311
Total current liabilities 210,198 145,083
Trade and other payables 16 553 1,383
Interest-bearing liabilities 17 119,542 251,019
Provisions 18 22,654 14,929
Total non-current liabilities 142,749 267,331
TOTAL LIABILITIES 352,947 412,414
NET ASSETS 211,655 117,236
EQUITY
Issued capital 19 219,391 213,007
Reserves 22 6,114 6,077
Accumulated losses (13,850) (101,848)
TOTAL EQUITY 211,655 117,236
The above consolidated statement of financial position should be read in conjunction with the accompanying notes.

SANDFIRE ANNUAL REPORT 2013 / 65
CONSOLIDATED STATEMENT OF CHANGES IN EQUITY
FOR THE YEAR ENDED 30 JUNE 2013
Note
Issued capital
$000
Share based
payments
reserve
$000
Accumulated
losses
$000
Total
equity
$000
At 1 July 2012 213,007 6,077 (101,848) 117,236
Profit for the period - - 87,998 87,998
Other comprehensive income - - - -
Total comprehensive income for the period - - 87,998 87,998
Transactions with owners in their capacity as owners:
Exercise of options 19 5,531 - - 5,531
Share issue costs net of income tax benefit (69) - - (69)
Transfer from share-based payments reserve on exercise of options
922 (922) - -
Share based payments recognised at fair value 22 - 959 - 959
At 30 June 2013 219,391 6,114 (13,850) 211,655
Note
Issued capital
$000
Share based
payments
reserve
$000
Accumulated
losses
$000
Total
equity
$000
At 1 July 2011 210,325 6,092 (77,965) 138,452
Loss for the period - - (23,883) (23,883)
Other comprehensive income - - - -
Total comprehensive income for the period - - (23,883) (23,883)
Transactions with owners in their capacity as owners:
Exercise of options 19 1,968 - - 1,968
Share issue costs net of income tax benefit (73) - - (73)
Transfer from share-based payments reserve on exercise of options
787 (787) - -
Share based payments recognised at fair value 22 - 795 - 795
Share of movement in share based payments reserve from associate
15 - (23) - (23)
At 30 June 2012 213,007 6,077 (101,848) 117,236
The above consolidated statement of changes in equity should be read in conjunction with the accompanying notes.

66 / SANDFIRE ANNUAL REPORT 2013
CONSOLIDATED STATEMENT OF CASH FLOWS
FOR THE YEAR ENDED 30 JUNE 2013
Note
2013
$000
2012
$000
Cash flows from operating activities
Cash receipts 469,634 18,187
Cash paid to suppliers and employees (201,057) (28,052)
Payments for exploration and evaluation (22,213) (29,533)
Interest received 3,866 3,073
Net cash inflow (outflow) from operating activities 20 250,230 (36,325)
Cash flows from investing activities
Payments for property, plant and equipment (68,367) (146,494)
Proceeds from sale of property, plant and equipment - 98
Payments for mine properties (119,573) (123,628)
Payments for investments 15 (600) (1,855)
Refunds (payments) of security deposits and bonds (81) 3,165
Net cash inflow (outflow) from investing activities (188,621) (268,714)
Cash flows from financing activities
Proceeds from the conversion of options to shares 5,531 1,968
Share issue costs (98) (94)
Proceeds from borrowings 30,000 350,000
Repayment of borrowings (95,000) -
Payment of finance lease liabilities (931) (350)
Finance establishment costs - (9,274)
Interest and other costs of finance paid (24,430) (10,863)
Net cash inflow (outflow) from financing activities (84,928) 331,387
Net increase (decrease) in cash and cash equivalents (23,319) 26,348
Cash and cash equivalents at the beginning of the period 100,389 74,041
Cash and cash equivalents at the end of the period 10,20 77,070 100,389
The above consolidated statement of cash flows should be read in conjunction with the accompanying notes.

SANDFIRE ANNUAL REPORT 2013 / 67
NOTES TO THE CONSOLIDATED FINANCIAL STATEMENTS
1 CORPORATE INFORMATION
The consolidated financial statements of Sandfire Resources NL for the year ended 30 June 2013 were authorised for issue in accordance with a resolution of the directors on 28 August 2013.
Sandfire Resources NL (the Parent) is a company incorporated in Australia whose shares are publicly traded on the Australian Stock Exchange (ASX). The nature of the operations and principal activities of the Company are described in the directors’ report.
2 SUMMARY OF SIGNIFICANT ACCOUNTING POLICIES
BASIS OF PREPARATION
The financial report of the Group, a for-profit entity, is a general purpose financial report, which has been prepared in accordance with the requirements of the Corporations Act 2001, Australian Accounting Standards and other authoritative pronouncements of the Australian Accounting Standards Board. The financial report has been prepared on a historical cost basis.
The financial report is presented in Australian dollars and all values are rounded to the nearest thousand dollars ($000) unless otherwise stated.
The Group’s consolidated financial statements have been prepared on a going concern basis which contemplates the continuity of normal business activities and the realisation of assets and the settlement of liabilities in the ordinary course of business.
At balance date the Group had a net working capital deficiency of $84.2 million. Cash and cash equivalents of $77.1 million included $50 million in Debt Service Reserve account, which is restricted for future finance facility repayments, and $20 million in Cost Overrun Account which is expected to be released in the short term following final Completion Test sign off. Current interest bearing liabilities include $165 million of scheduled finance facility repayments up to 30 June 2014, which are forecast to be funded from continued positive operating cash flows post balance date.
The directors have considered the funding and operational status of the business in arriving at their assessment of going concern, including consideration to the following:
Published market guidance on 2014 operating parameters, copper and gold production and operating and capital cost levels;
Current operating performance and cash flow generation compared to expectation;
Current market pricing for copper, gold and currency as well as the published outlook for these markets; and
Ability to manage the timing of cash flows to meet the obligations of the business as and when due.
Accordingly, the directors believe that the Group will continue as a going concern and that it is appropriate to adopt that basis of accounting in the preparation of the financial report.
(A) COMPLIANCE WITH IFRS
The financial report complies with International Financial Reporting Standards (IFRS) as issued by the International Accounting Standards Board.
(B) NEW ACCOUNTING STANDARDS AND INTERPRETATIONS
(i) Changes in accounting policy and disclosures – mandatory standards
The accounting policies adopted are consistent with those of the previous financial year except as described below. Certain comparative information has been reclassified to conform with the current year’s presentation.
The Group has adopted the following new and amended Australian Accounting Standards and AASB Interpretations as of 1 July 2012:
AASB 119 Employee Benefits.
AASB 112 Income Taxes (amendment) – Deferred taxes: Recovery of Underlying Assets.
AASB 7 Financial Instruments: Disclosures – Enhances Derecognition Disclosure Requirements Improvements to AASB (May 2010).
The adoption of the new and amended standards or interpretations had no impact on the financial position or performance of the Group.

68 / SANDFIRE ANNUAL REPORT 2013
2 SUMMARY OF SIGNIFICANT ACCOUNTING POLICIES (continued)
(B) NEW ACCOUNTING STANDARDS AND INTERPRETATIONS (continued)
(ii) Changes in accounting policy and disclosures – early adoption of standards
The following standards were early adopted by the Group during the year ended 30 June 2012 and were adopted again in the current financial year:
Interpretation 20 Stripping Costs in the Production Phase of a Surface Mine effective 1 July 2013. This interpretation applies to stripping costs incurred during the production phase of a surface mine. Production stripping costs are to be capitalised as part of an asset, if an entity can demonstrate that it is probable future economic benefits will be realised, the costs can be reliably measured and the entity can identify the component of an ore body for which access has been improved. This asset is to be called the “stripping activity asset”. The stripping activity asset shall be depreciated or amortised on a systematic basis, over the expected useful life of the identified component of the ore body that becomes more accessible as a result of the stripping activity. The units of production method shall be applied unless another method is more appropriate. Refer to accounting policy note 2(l) for more details.
(iii) Accounting Standards and Interpretations issued but not yet effective
Australian Accounting Standards and Interpretations that have recently been issued or amended but are not yet effective and have not been adopted by the Group for the reporting period ending 30 June 2013, are outlined in the table below.
Reference Title Summary
Application date and impact on
the Group’s financial report
AASB 10 Consolidated Financial Statements
AASB 10 establishes a new control model that applies to all entities. It replaces parts of AASB 127 Consolidated and Separate Financial Statements dealing with the accounting for consolidated financial statements and UIG-112 Consolidation – Special Purpose Entities.
The new control model broadens the situations when an entity is considered to be controlled by another entity and includes new guidance for applying the model to specific situations, including when acting as a manager may give control, the impact of potential voting rights and when holding less than a majority voting rights may give control.
Consequential amendments were also made to other standards via AASB 2011-7.
The amendments which become mandatory for the Group’s 30 June 2014 financial statements are not expected to have any impact on the financial statements.
AASB 11 Joint Arrangements AASB 11 replaces AASB 131 Interests in Joint Ventures and UIG-113 Jointly- controlled Entities – Non-monetary Contributions by Ventures. AASB 11 uses the principle of control in AASB 10 to define joint control, and therefore the determination of whether joint control exists may change. In addition it removes the option to account for jointly controlled entities (JCEs) using proportionate consolidation. Instead, accounting for a joint arrangement is dependent on the nature of the rights and obligations arising from the arrangement. Joint operations that give the venturers a right to the underlying assets and obligations themselves is accounted for by recognising the share of those assets and obligations. Joint ventures that give the venturers a right to the net assets is accounted for using the equity method.
Consequential amendments were also made to other standards via AASB 2011-7 and amendments to AASB 128.
The amendments which become mandatory for the Group’s 30 June 2014 financial statements are not expected to have any impact on the financial statements.
NOTES TO THE FINANCIAL STATEMENTS
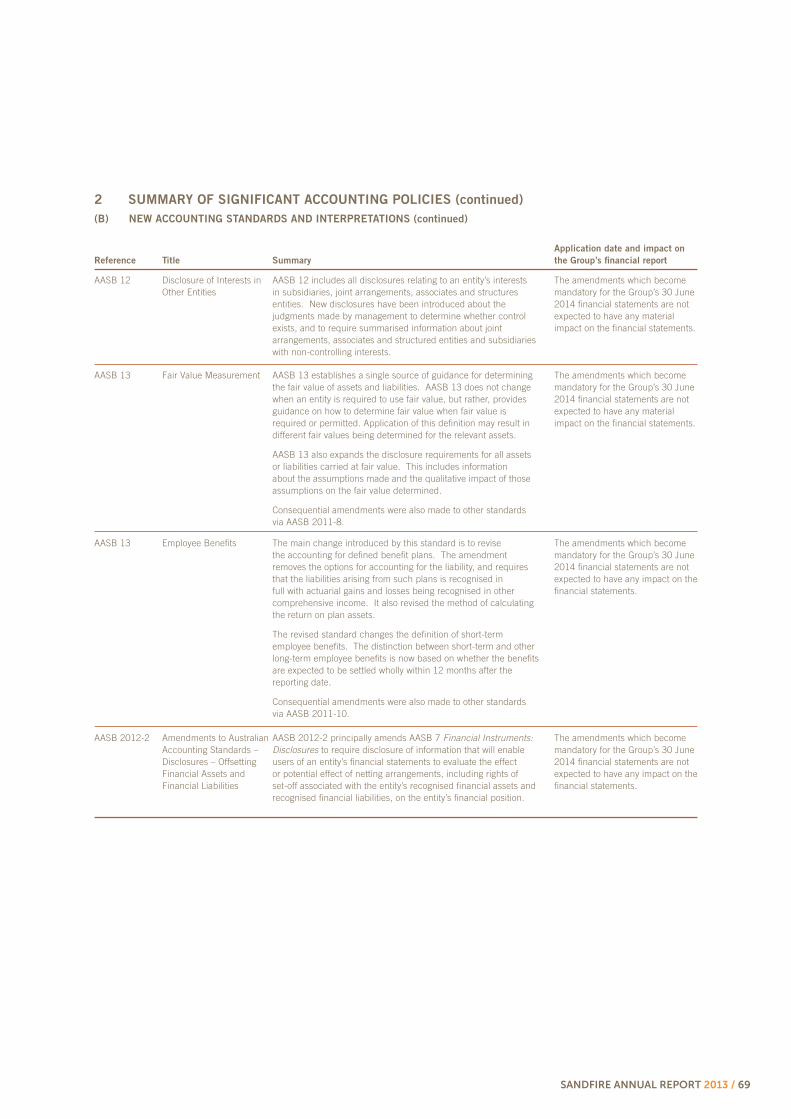
SANDFIRE ANNUAL REPORT 2013 / 69
Reference Title Summary
Application date and impact on
the Group’s financial report
AASB 12 Disclosure of Interests in Other Entities
AASB 12 includes all disclosures relating to an entity’s interests in subsidiaries, joint arrangements, associates and structures entities. New disclosures have been introduced about the judgments made by management to determine whether control exists, and to require summarised information about joint arrangements, associates and structured entities and subsidiaries with non-controlling interests.
The amendments which become mandatory for the Group’s 30 June 2014 financial statements are not expected to have any material impact on the financial statements.
AASB 13 Fair Value Measurement AASB 13 establishes a single source of guidance for determining the fair value of assets and liabilities. AASB 13 does not change when an entity is required to use fair value, but rather, provides guidance on how to determine fair value when fair value is required or permitted. Application of this definition may result in different fair values being determined for the relevant assets.
AASB 13 also expands the disclosure requirements for all assets or liabilities carried at fair value. This includes information about the assumptions made and the qualitative impact of those assumptions on the fair value determined.
Consequential amendments were also made to other standards via AASB 2011-8.
The amendments which become mandatory for the Group’s 30 June 2014 financial statements are not expected to have any material impact on the financial statements.
AASB 13 Employee Benefits The main change introduced by this standard is to revise the accounting for defined benefit plans. The amendment removes the options for accounting for the liability, and requires that the liabilities arising from such plans is recognised in full with actuarial gains and losses being recognised in other comprehensive income. It also revised the method of calculating the return on plan assets.
The revised standard changes the definition of short-term employee benefits. The distinction between short-term and other long-term employee benefits is now based on whether the benefits are expected to be settled wholly within 12 months after the reporting date.
Consequential amendments were also made to other standards via AASB 2011-10.
The amendments which become mandatory for the Group’s 30 June 2014 financial statements are not expected to have any impact on the financial statements.
AASB 2012-2 Amendments to Australian Accounting Standards – Disclosures – Offsetting Financial Assets and Financial Liabilities
AASB 2012-2 principally amends AASB 7 Financial Instruments: Disclosures to require disclosure of information that will enable users of an entity’s financial statements to evaluate the effect or potential effect of netting arrangements, including rights of set-off associated with the entity’s recognised financial assets and recognised financial liabilities, on the entity’s financial position.
The amendments which become mandatory for the Group’s 30 June 2014 financial statements are not expected to have any impact on the financial statements.
2 SUMMARY OF SIGNIFICANT ACCOUNTING POLICIES (continued)
(B) NEW ACCOUNTING STANDARDS AND INTERPRETATIONS (continued)

70 / SANDFIRE ANNUAL REPORT 2013
2 SUMMARY OF SIGNIFICANT ACCOUNTING POLICIES (continued)
(B) NEW ACCOUNTING STANDARDS AND INTERPRETATIONS (continued)
Reference Title Summary
Application date and impact
on the Group’s financial report
AASB 9 Financial Instruments
AASB 9 includes requirements for the classification and measurement of financial assets. It was further amended by AASB 2010-7 to reflect amendments to the accounting for financial liabilities.
These requirements improve and simplify the approach for classification and measurement of financial assets compared with the requirements of AASB 139. The main changes are described below.
(a) Financial assets that are debt instruments will be classified based on (1) the objective of the entity’s business model for managing the financial assets; (2) the characteristics of the contractual cash flows.
(b) Allows an irrevocable election on initial recognition to present gains and losses on investments in equity instruments that are not held for trading in other comprehensive income. Dividends in respect of these investments that are a return on investment can be recognised in profit or loss and there is no impairment or recycling on disposal of the instrument.
(c) Financial assets can be designated and measured at fair value through profit or loss at initial recognition if doing so eliminates or significantly reduces a measurement or recognition inconsistency that would arise from measuring assets or liabilities, or recognising the gains and losses on them, on different bases.
(d) Where the fair value option is used for financial liabilities the change in fair value is to be accounted for as follows: (i) The change attributable to changes in credit risk are presented in other comprehensive income (OCI); and (ii) The remaining change is presented in profit or loss.
If this approach creates or enlarges an accounting mismatch in the profit or loss, the effect of the changes in credit risk are also presented in profit or loss.
Consequential amendments were also made to other standards as a result of AASB 9, introduced by AASB 2009-11 and superseded by AASB 2010-7 and 2010-10.
The amendments which become mandatory for the Group’s 30 June 2016 financial statements are not expected to have any impact on the financial statements.
AASB 2012-3 Amendments to Australian Accounting Standards – Offsetting Financial Assets and Financial Liabilities
AASB 2012-3 adds application guidance to AASB 132 Financial Instruments: Presentation to address inconsistencies identified in applying some of the offsetting criteria of AASB 132, including clarifying the meaning of “currently has a legally enforceable right of set-off” and that some gross settlement systems may be considered equivalent to net settlement.
The amendments which become mandatory for the Group’s 30 June 2016 financial statements are not expected to have any impact on the financial statements.
NOTES TO THE FINANCIAL STATEMENTS

SANDFIRE ANNUAL REPORT 2013 / 71
2 SUMMARY OF SIGNIFICANT ACCOUNTING POLICIES (continued)
(C) BASIS OF CONSOLIDATION
The consolidated financial statements comprise the financial statements of Sandfire Resources NL and its subsidiaries (as outlined in note 21) as at and for the period ended 30 June each year (the Group). Interests in associates are equity accounted and are not part of the consolidated Group (see note 2(d) below).
Subsidiaries are all those entities over which the Group has the power to govern the financial and operating policies so as to obtain benefits from their activities. The existence and effect of potential voting rights that are currently exercisable or convertible are considered when assessing whether a group controls another entity.
The financial statements of the subsidiaries are prepared for the same reporting period as the parent company, using consistent accounting policies. In preparing the consolidated financial statements, all intercompany balances, transactions, unrealised gains and losses resulting from intra-group transactions and dividends have been eliminated in full.
Subsidiaries are fully consolidated from the date on which control is obtained by the Group and cease to be consolidated from the date on which control is transferred out of the Group.
(D) INVESTMENT IN AN ASSOCIATE
The Group’s investment in its associate is accounted for using the equity method. An associate is an entity in which the Group has, or has the ability to exert, significant influence.
Under the equity method, the investment in the associate is carried on the statement of financial position at cost plus post acquisition changes in the Group’s share of net assets of the associate. Goodwill relating to the associate is included in the carrying amount of the investment and is neither amortised nor individually tested for impairment.
The income statement reflects the Group’s share of the results of operations of the associate. When there has been a change recognised directly in the equity of the associate, the Group recognises its share of any changes and discloses this, when applicable, in the statement of changes in equity. Unrealised gains and losses resulting from transactions between the Group and the associate are eliminated to the extent of the interest in the associate.
The Group’s share of profit (loss) of an associate is shown on the face of the income statement. This is the profit (loss) attributable to equity holders of the associate and, therefore, is profit (loss) after tax and non-controlling interests in the subsidiaries of the associate.
The financial statements of the associate are prepared for the same reporting period as the Group. When necessary, adjustments are made to bring the accounting policies in line with those of the Group.
(E) OPERATING SEGMENTS
An operating segment is a component of the Group about which separate financial information is available that is evaluated regularly by the Group’s key management personnel in deciding how to allocate resources and in assessing performance.
Segment information that is evaluated by key management personnel is prepared in conformity with the accounting policies adopted for preparing the financial statements of the Group.
Operating segments have been identified based on the information provided to the chief operating decision makers – being the executive management team and the Board of directors.
(F) FOREIGN CURRENCY
(i) Functional and presentation currency
The consolidated financial statements are presented in Australian dollars. Items included in the financial statements of each of the Group’s entities are measured using the currency of the primary economic environment in which the entity operates, the ‘functional currency’. The functional currency of Sandfire Resources NL is Australian dollars ($).
(ii) Transactions and balances
Transactions in foreign currencies are initially recorded in the functional currency at the respective functional currency rates prevailing at the date of the transaction.
Monetary assets and liabilities denominated in foreign currencies are retranslated at the spot rate of exchange ruling at the reporting date. Foreign exchange gains and losses resulting from the settlement of such transactions and from the translation at year-end exchange rates of monetary assets and liabilities denominated in foreign currencies are recognised in the Consolidated Statement of Comprehensive Income.
Non-monetary items that are measured in terms of historical cost in a foreign currency are translated using the exchange rate as at the date of the initial transaction. Non-monetary items measured at fair value in a foreign currency are translated using the exchange rates at the date when the fair value was determined.
72 / SANDFIRE ANNUAL REPORT 2013
2 SUMMARY OF SIGNIFICANT ACCOUNTING POLICIES (CONTINUED)
(G) REVENUE RECOGNITION
Revenue is recognised to the extent that it is probable that the economic benefits will flow to the Group and the revenue can be reliably measured, regardless of when the payment is being made. Revenue is measured at the fair value of the consideration received or receivable, taking into account contractually defined terms of payment and excluding taxes or duty. The specific recognition criteria described below must also be met before revenue is recognised.
(i) Sale of goods – concentrate
Revenue from the sale of goods is recognised when persuasive evidence of an arrangement exists, usually in the form of an executed sales agreement, indicating there has been a transfer of risks and rewards to the customer, no further processing is required by the Group, the quantity and quality of the goods has been determined with reasonable accuracy, the price is fixed or determinable, and collectability is probable. This is generally when title passes, which for the sale of direct shipping ore represents the bill of lading date when the ore is delivered for shipment.
Revenue on provisionally priced sales is recognised at the estimated fair value of the total consideration received or receivable. Royalties paid and payable are separately reported as expenses.
Contract terms for many of the Group’s sales allow for a price adjustment based on a final assay of the goods by the customer to determine content. Recognition of the sales revenue for these commodities is based on the most recently determined estimate of product specifications with a subsequent adjustment made to revenue upon final determination.
The terms of direct shipping ore sales contracts with third parties contain provisional pricing arrangements. The selling price for metal in direct shipping ore is based on prevailing spot prices at the time of shipment to the customer and adjustments to the sales price occur based on movements in quoted market prices up to the date of final settlement.
These provisionally priced sales contracts contain an embedded derivative that is required to be separated from the host contract for accounting purposes. Accordingly, the embedded derivative, which does not qualify for hedge accounting, is recognised at fair value, with subsequent changes in fair value recognised in the Income Statement in each period until final settlement. Changes in fair value over the Quotational Period (QP) and up until final settlement are estimated by reference to forward market prices. The QP often reflects the average time to elapse between the date of shipment and the date of processing by the smelter at final destination. This pricing methodology is normal for the industry.
For amounts at balance date still subject to price adjustments due to the quotational period remaining open, a final settlement price is estimated based on the closing LME (London Metals Exchange) copper price on the final day of the month. This revaluation is performed up until the final invoice is received. The actual settlement price may vary from this estimate.
(ii) Sale of goods – gold laterite ore
Sales of gold laterite are recognised when the ore is presented for processing. Revenue is based on recovery grades and prevailing gold prices at the time of final production.
(iii) Interest income
Income is recognised as interest accrues using the effective interest method. This is a method of calculating the amortised cost of a financial asset and allocating the interest income over the relevant period using the effective interest rate, which is the rate that exactly discounts estimated future cash receipts through the expected life of the financial asset to the net carrying amount of the financial asset. Interest income is included in finance income in the income statement.
(iv) Rendering of services
Revenue from services rendered is recognised in the income statement in proportion to the stage of completion of the transaction at the reporting date.
(H) CASH AND CASH EQUIVALENTS
Cash and cash equivalents in the statement of financial position and statement of cash flows comprise cash at bank and on hand and short-term deposits that are readily convertible to known amounts of cash and which are subject to an insignificant risk of changes in value.
(I) TRADE AND OTHER RECEIVABLES
Trade receivables are recognised initially at fair value and subsequently measured at amortised cost using the effective interest method, less an allowance for impairment. Provisional payments in relation to trade receivables are due for settlement within 30 days from the date of recognition, with any mark to market adjustment due for settlement usually from 60-90 days. Sales of direct shipping ore and gold laterite are recognised in accordance with note 2(g).
NOTES TO THE FINANCIAL STATEMENTS
SANDFIRE ANNUAL REPORT 2013 / 73
2 SUMMARY OF SIGNIFICANT ACCOUNTING POLICIES (continued)
(I) TRADE AND OTHER RECEIVABLES (continued)
Collectability of trade receivables is reviewed on an ongoing basis. Individual debts that are known to be uncollectible are written off when identified. An impairment provision is recognised when there is objective evidence that the Group will not be able to collect the receivable. Financial difficulties of the debtor, default payments or debts more than 90 days overdue are considered objective evidence of impairment. The amount of the impairment loss is the receivable carrying amount compared to the present value of estimated future cash flows, discounted at the original effective interest rate. The amount of the impairment is recognised in the income statement.
(J) INVENTORIES
Stores and consumables and ore are stated at the lower of cost and net realisable value. Cost comprises direct materials, direct labour and an appropriate proportion of variable and fixed indirect expenditure.
Costs are assigned to individual items of inventory on the basis of weighted average costs. Cost includes direct material, waste removal including amortisation (refer accounting policy 2(l)), mining, processing, labour, related transportation costs to the point of sale and other fixed and variable costs directly related to mining activities.
Net realisable value is the estimated selling price in the ordinary course of business less the estimated costs of completion and the estimated costs necessary to make the sale.
Stores and consumables, and ore inventories expected to be processed or sold within twelve months after the balance sheet date, are classified as current assets. All other inventories are classified as non-current assets.
(K) EXPLORATION AND EVALUATION EXPENDITURE
Pre-licence costs are expensed in the period in which they are incurred.
Once the legal right to explore has been acquired, exploration and evaluation expenditure incurred on licences where the technical feasibility and commercial viability of extracting mineral resources has not yet been established is expensed as incurred. The directors of the Company generally consider a project to be economically viable on the satisfactory completion of a feasibility study and a JORC reserve estimate.
Exploration and evaluation expenditure include the costs of acquiring and maintaining the rights to explore, investigate, examine and evaluate an area of mineralisation, and assessing the technical feasibility and commercial viability of extracting the mineral resources from that area.
Once the technical feasibility and commercial viability of extracting mineral resources are demonstrable (at which point, the Company considers it probable that economic benefits will be realised), the Company capitalises any further evaluation costs incurred for the particular licence to mine properties.
Cash flows arising from exploration and evaluation expenditure
Cash flows arising from exploration and evaluation expenditure are included in the statement of cash flows as an operating activity.
(L) MINE PROPERTIES
Mine development
Mine property and development assets are stated at historical cost less accumulated amortisation and any impairment losses recognised. Mine property and development assets include costs incurred in accessing the ore body and costs to develop the mine to the production phase, once the technical feasibility and commercial viability of an ore body has been established.
Overburden and waste removal
Overburden and other waste removal costs (stripping costs) incurred in the development of a surface mine before production commences are capitalised and included as part of mine properties as development phase stripping. These costs include direct costs and an allocation of relevant indirect expenditure.
Stripping costs incurred during the production phase of a surface mine are capitalised when the Group can identify the component of an ore body for which access has been improved and are included as part of mine properties as production phase stripping. These costs include direct costs and an allocation of relevant indirect expenditure.

74 / SANDFIRE ANNUAL REPORT 2013
2 SUMMARY OF SIGNIFICANT ACCOUNTING POLICIES (continued)
(L) MINE PROPERTIES (continued)
Amortisation
The Group amortises mine property and development assets from the commencement of commercial production. The amortisation methods adopted by the Group are shown in the table below:
Category Amortisation method
Mine development Units of material extracted method over the life of mine.
Development phase stripping Tonnes of contained copper (direct shipping ore and sulphides) method over the life of mine.
Production phase stripping Tonnes of contained copper (direct shipping ore and sulphide) method, over the expected useful life of the identified component of the ore body that becomes more accessible as a result of the stripping activity.
(M) PROPERTY, PLANT AND EQUIPMENT
Property, plant and equipment is stated at historical cost, less accumulated depreciation and accumulated impairment losses, if any. Historical cost includes expenditure that is directly attributable to the acquisition of the items and costs incurred in bringing the asset into use.
Subsequent costs are included in the asset’s carrying amount or recognised as a separate asset, as appropriate, only when it is probable that future economic benefits associated with the item flow to the Group and the cost of the item can be measured reliably. The carrying amount of the replaced part is derecognised. All other repairs and maintenance costs are recognised in the income statement as incurred.
The capitalised value of a finance lease is also included within property, plant and equipment.
Depreciation
The depreciation methods adopted by the Group are shown in table below:
Category Depreciation method
Plant and equipment Straight line over the life of the mine/asset (3 to 7 years)
Motor vehicles Straight line over the life of the asset (3 to 5 years)
Leased equipment Straight line over the life of the asset (3 to 5 years)
An item of property, plant and equipment and any significant part initially recognised is derecognised upon disposal or when no future economic benefits are expected from its use or disposal. Any gain or loss arising on derecognition of the asset (calculated as the difference between the net disposal proceeds and the carrying amount of the asset) is included in the income statement when the asset is derecognised.
The assets’ residual values, useful lives and depreciation methods are reviewed, and adjusted if appropriate, at each financial year end.
(N) LEASES
The determination of whether an arrangement is or contains a lease is based on the substance of the arrangement at inception date, whether the fulfillment of the arrangement is dependent on the use of a specific asset or assets or the arrangement conveys a right to use the asset, even if that right is not explicitly specified in an arrangement.
Group as lessee
Finance leases that transfer substantially all the risks and benefits incidental to ownership of the leased item to the Group, are capitalised at the commencement of the lease at the fair value of the leased property or, if lower, at the present value of the minimum lease payments. Lease payments are apportioned between the finance charges and reduction of the lease liability so as to achieve a constant rate of interest on the remaining balance of the liability. Finance charges are recognised in finance costs in the income statement.
A leased asset is depreciated over the useful life of the asset. However, if there is no reasonable certainty that the Group will obtain ownership by the end of the lease term, the asset is depreciated over the shorter of the estimated useful life of the asset and lease term.
Operating lease payments are recognised as an operating expense in the income statement on a straight-line basis over the lease term.
NOTES TO THE FINANCIAL STATEMENTS
SANDFIRE ANNUAL REPORT 2013 / 75
2 SUMMARY OF SIGNIFICANT ACCOUNTING POLICIES (continued)
(O) OTHER FINANCIAL ASSETS
Initial recognition and measurement
Financial assets within the scope of AASB 139 are classified as financial assets at fair value though profit or loss, loans and receivables, held to maturity investments, available-for-sale financial assets, or as derivatives designated as hedging instruments in an effective hedge relationship, as appropriate. The Group determines the classification of its financial assets at initial recognition.
All financial assets are recognised initially at fair value plus transaction costs, except in the case of financial assets recorded at fair value through profit or loss.
Subsequent measurement – Available for sale financial investments
Available for sale financial investments include equity investments. Equity investments classified as available for sale are those that are neither classified as held for trading nor designated at fair value through profit and loss.
After initial investment, available for sale financial investments are subsequently measured at fair value with unrealised gains or losses recognised as other comprehensive income in the available for sale reserve until the investment is derecognised, at which time the cumulative gain or loss is recognised in other operating income, or the investment is determined to be impaired, when the cumulative loss is reclassified from the available for sale reserve to the income statement. Interest earned whilst holding available for sale financial investments is reported as interest income using the EIR method.
The Group evaluates whether the ability and intention to sell its available for sale financial assets in the near term is still appropriate. When, in rare circumstances, the Group is unable to trade these financial assets due to inactive markets and management’s intention to do so significantly changes in the foreseeable future, the Group may elect to reclassify these financial assets. Reclassification to loans and receivables is permitted when the financial assets meet the definition of loans and receivables and the Group has the intent and ability to hold these assets for the foreseeable future or until maturity. Reclassification to the held maturity category is permitted only when the entity has the ability and intention to hold the financial asset accordingly.
For the financial asset reclassified from the available for sale category, the fair value carrying amount at the date of reclassification becomes its new amortised cost and any previous gain or loss on the asset that has been recognised in equity is amortised to profit or loss over the remaining life of the investment using EIR. Any difference between the new amortised cost and the maturity amount is also amortised over the remaining life of the asset using the EIR. If the asset is subsequently determined to be impaired then the amount recorded in equity is reclassified to the income statement.
Derecognition
A financial asset (or, where applicable, a part of a financial asset or part of a group of similar financial assets) is derecognised when:
The rights to receive cash flows from the asset have expired.
The Group has transferred its rights to receive cash flows from the asset or has assumed an obligation to pay the received cash flows in full without material delay to a third party under a “pass-through” arrangement; and wither (a) the Group has transferred substantially all the risks and rewards of the asset, or (b) the Group has neither transferred nor retained substantially all the risks and rewards of the asset, but has transferred control of the asset.
Impairment of financial assets
The Group assesses, at each reporting date, whether there is objective evidence that a financial asset or group of financial assets is impaired. A financial asset or group of financial assets is deemed to be impaired if there is objective evidence of impairment as a result of one or more events that has occurred since the initial recognition of the asset (as incurred “loss event”) and that loss event has an impact on the estimated future cash flows of the financial asset or the group of financial assets that can be reliably estimated. Evidence of impairment may include indications that the debtors or a group of debtors is experiencing significant financial difficulty, default or delinquency in interest or principal payments, the probability that they will enter bankruptcy or other financial reorganisation and observable data indicating that there is a measurable decrease in the estimated future cash flows, such as changes in arrears or economic conditions that correlate with defaults.
(P) IMPAIRMENT OF NON-FINANCIAL ASSETS
The Group assesses, at each reporting date, whether there is an indication that an asset may be impaired. If any indication exists, or when annual impairment testing for an asset is required, the Group estimates the asset’s recoverable amount. An asset’s recoverable amount is the higher of an asset’s or cash generating unit’s (CGU) fair value less costs to sell and its value in use. Recoverable amount is determined for an individual asset, unless the asset does not generate cash inflows that are largely independent of those from other assets or groups of assets. When the carrying amount of an asset or CGU exceeds its recoverable amount, the asset is considered impaired and is written down to its recoverable amount.

76 / SANDFIRE ANNUAL REPORT 2013
2 SUMMARY OF SIGNIFICANT ACCOUNTING POLICIES (continued)
(P) IMPAIRMENT OF NON-FINANCIAL ASSETS (continued)
In assessing value in use, the estimated future cash flows are discounted to their present value using a pre-tax discount rate that reflects current market assessments of the time value of money and the risks specific to the asset. In determining fair value less costs to sell, recent market transactions are taken into account, if available. If no such transactions can be identified, an appropriate valuation model is used. These calculations are corroborated by valuation multiples, quoted share prices for publicly traded subsidiaries or other available fair value indicators.
The Group bases its impairment calculation on detailed budgets and forecast calculations, which are prepared separately for each of the Group’s CGUs to which the individual assets are allocated. These budgets and forecast calculations cover a period of three to seven years.
Impairment losses of continuing operations, including impairment on inventories, are recognised in the income statement in expense categories consistent with the function of the impaired asset, except for a property previously revalued where the revaluation was taken to other comprehensive income. In this case, the impairment is also recognised in other comprehensive income up to the amount of any previous revaluation.
For assets excluding goodwill, an assessment is made at each reporting date whether there is any indication that previously recognised impairment losses may no longer exist or may have decreased. If such indication exists, the Group estimates the asset’s or CGUs recoverable amount. A previously recognised impairment loss is reversed only if there has been a change in the assumptions used to determine the asset’s recoverable amount since the last impairment loss was recognised. The reversal is limited so that the carrying amount of the asset does not exceed its recoverable amount, nor exceed the carrying amount that would have been determined, net of depreciation, had no impairment loss been recognised for the asset in prior years. Such reversal is recognised in the income statement unless the asset is carried at a revalued amount, in which case, the reversal is treated as a revaluation increase.
(Q) TRADE AND OTHER PAYABLES
Trade and other payables are carried at amortised cost and due to their short-term nature they are not discounted. They represent liabilities for goods and services provided to the Group prior to the end of the financial year that are unpaid and arise when the Group becomes obliged to make future payments in respect of the purchase of these goods and services. The amounts are generally unsecured and are usually paid within 60 days of recognition.
(R) INTEREST BEARING LOANS AND LIABILITIES
All loans and borrowings are initially recognised at the fair value of the consideration received less directly attributable transaction costs.
After initial recognition, interest-bearing loans and borrowings are subsequently measured at amortised cost using the effective interest method. Fees paid on the establishment of loan facilities that are yield related are included as part of the carrying amount of the loans and borrowings.
Borrowings are classified as current liabilities unless the Company has an unconditional right to defer settlement of the liability for at least 12 months after the reporting date.
Borrowing costs
Borrowing costs directly attributable to the acquisition, construction or production of a qualifying asset (i.e. an asset that necessarily takes a substantial period of time to get ready for its intended use or sale) are capitalised as part of the cost of that asset. All other borrowing costs are expensed in the period they occur. Borrowing costs consist of interest and other costs that an entity incurs in connection with the borrowing of funds.
(S) PROVISIONS
General
Provisions are recognised when the Group has a present obligation (legal or constructive) as a result of a past event, it is probable that an outflow of resources embodying economic benefits will be required to settle the obligation and a reliable estimate can be made of the amount of the obligation. When the Group expects some or all of a provision to be reimbursed the reimbursement is recognised as a separate asset but only when the reimbursement is virtually certain. The expense relating to any provision is presented in the income statement net of any reimbursement.
Provisions are measured at the present value of management’s best estimate of the expenditure required to settle the present obligation at the reporting date. The discount rate used to determine the present value reflects current market assessments of the time value of money and the risks specific to the liability. The increase in the provision resulting from the passage of time is recognised in finance costs.
NOTES TO THE FINANCIAL STATEMENTS

SANDFIRE ANNUAL REPORT 2013 / 77
2. SUMMARY OF SIGNIFICANT ACCOUNTING POLICIES (continued)
(S) PROVISIONS (continued)
(i) Employee leave benefits (wages, salaries, annual leave and sick leave)
Liabilities for wages and salaries, including non-monetary benefits and annual leave expected to be settled within 12 months of the reporting date are recognised in respect of employees’ services up to the reporting date. They are measured at the amounts expected to be paid when the liabilities are settled. Expenses for non-accumulating sick leave are recognised when the leave is taken and are measured at the rates paid or payable.
(ii) Long service leave
The liability for long service leave is recognised and measured as the present value of expected future payments to be made in respect of services provided by employees up to the reporting date using the projected unit credit method. Consideration is given to expected future wage and salary levels, experience of employee departures, and periods of service. Expected future payments are discounted using market yields at the reporting date on national government bonds with terms to maturity and currencies that match, as closely as possible, the estimated future cash outflows. The Group does not have obligations with respect to long service leave as at 30 June 2013.
(iii) Rehabilitation, restoration and dismantling
The Group records the present value of estimated costs of legal and constructive obligations required to restore and rehabilitate operating locations in the period in which the obligation is incurred. The nature of these restoration activities includes dismantling and removing structures, rehabilitating mines and tailings dams, dismantling operating facilities, closure of plant and waste sites, and restoration, reclamation and re-vegetation of affected areas.
The obligation generally arises when the asset is installed or the ground/environment is disturbed at the production location. When the liability is initially recognised, the present value of the estimated costs is capitalised by increasing the carrying amount of the related assets to the extent that it was incurred by the development/construction of the asset. The capitalised cost of this asset is depreciated over the useful life of the related asset. Rehabilitation and restoration obligations arising from the Group’s exploration activities are recognised immediately in the income statement in accordance with the Group’s accounting policy 2(k).
Over time, the discounted liability is increased for the change in present value based on the discount rates that reflect current market assessments and the risks specific to the liability. The periodic unwinding of the discount is recognised in the income statement as a finance cost. Additional disturbances or changes in rehabilitation costs will be recognised as additions or charges to the corresponding assets and rehabilitation liability when they occur.
The provisions referred to above do not include any amounts related to remediation costs associated with unforeseen circumstances.
(T) SHARE-BASED PAYMENT TRANSACTIONS
(i) Equity settled transactions
The Group provides benefits to its employees and contractors (including key management personnel) in the form of share-based payments, whereby employees render services in exchange for rights over shares (equity-settled transactions). The cost of these equity-settled transactions with employees is measured by reference to the fair value of the equity instruments at the date at which they are granted. The fair value of the options granted is measured using the Black-Scholes option pricing model. Further details of which are given in note 22.
In valuing equity-settled transactions, no account is taken of any vesting conditions, other than (if applicable):
Non-vesting conditions that do not determine whether the Group receives the services that entitle the employees to receive payment in equity or cash; and
Conditions that are linked to the price of the shares of Sandfire Resources NL (market conditions).
The cost of equity-settled transactions is recognised, together with a corresponding increase in equity, over the period in which the performance and/or service conditions are fulfilled (the vesting period), ending on the date on which the relevant employees become fully entitled to the award (the vesting date).
At each subsequent reporting date until vesting, the cumulative charge to the income statement is the product of:
a) The grant date fair value of the award;
b) The current best estimate of the number of awards that will vest, taking into account such factors as the likelihood of employee turnover during the vesting period and the likelihood of non-market performance conditions being met; and
c) The expired portion of the vesting period.

78 / SANDFIRE ANNUAL REPORT 2013
2 SUMMARY OF SIGNIFICANT ACCOUNTING POLICIES (continued)
(T) SHARE-BASED PAYMENT TRANSACTIONS (continued)
The charge to the income statement for the period is the cumulative amount as calculated above less the amounts already charged in previous periods. There is a corresponding entry to equity.
Until an award has vested, any amounts recorded are contingent and will be adjusted if more or fewer awards vest than were originally anticipated to do so. Any award subject to a market condition or non-vesting condition is considered to vest irrespective of whether or not that market condition or non-vesting condition is fulfilled, provided that all other conditions are satisfied.
If a non-vesting condition is within the control of the Group or the employee, the failure to satisfy the condition is treated as a cancellation. If a non-vesting condition within the control of neither the Group nor employee is not satisfied during the vesting period, any expense for the award not previously recognised is recognised over the remaining vesting period, unless the award is forfeited.
If the terms of an equity-settled award are modified, as a minimum an expense is recognised as if the terms had not been modified. An additional expense is recognised for any modification that increases the total fair value of the share-based payment arrangement, or is otherwise beneficial to the employee, as measured at the date of modification.
If an equity-settled award is cancelled, it is treated as if it had vested on the date of cancellation, and any expense not yet recognised for the award is recognised immediately. However, if a new award is substituted for the cancelled award and designated as a replacement award on the date that it is granted, the cancelled and new award are treated as if they were a modification of the original award, as described in the previous paragraph.
The dilutive effect, if any, of outstanding options is reflected as additional share dilution in the computation of diluted loss per share (see note 9).
(ii) Cash settled transactions
The Group also provides benefits to employees and contractors (including key management personnel) in the form of cash-settled share-based payments, whereby employees render services in exchange for cash, the amounts of which are determined by reference to movements in the price of the shares of Sandfire Resources NL.
The ultimate cost of these cash-settled transactions will be equal to the actual cash paid to the employees, which will be the fair value at settlement date.
The cumulative cost recognised until settlement is a liability and the periodic determination of this liability is as follows:
At each reporting date between grant and settlement, the fair value of the award is determined;
During the vesting period, the liability recognised at each reporting date is the fair value of the award at that date multiplied by the percentage of the vesting period completed;
From the end of the vesting period until settlement, the liability recognised is the full fair value of the liability at the reporting date; and
All changes in the liability are recognised in employee benefits expense for the period.
The fair value of the liability is determined, initially and at each reporting date until it is settled, by applying the Black-Scholes option pricing model, taking into account the terms and conditions on which the award was granted, and the extent to which employees have rendered service to date (see note 22).
(U) ISSUED CAPITAL
Ordinary shares are classified as equity. Incremental costs directly attributable to the issue of new shares or options are shown in equity as a deduction, net of tax, from the proceeds.
(V) INCOME TAXES AND OTHER TAXES
Current tax assets and liabilities for the current period are measured at the amount expected to be recovered from or paid to the taxation authorities based on the current period’s taxable income. The tax rates and tax laws used to compute the amount are those that are enacted or substantively enacted at the reporting date.
Current income tax relating to items recognised directly in equity is recognised in equity and not in the income statement. Management periodically evaluates positions taken in the tax returns with respect to situations in which applicable tax regulations are subject to interpretation and establishes provisions where appropriate.
Deferred income tax is provided on all temporary differences at the reporting date between the tax bases of assets and liabilities and their carrying amounts for financial reporting purposes.
NOTES TO THE FINANCIAL STATEMENTS

SANDFIRE ANNUAL REPORT 2013 / 79
2 SUMMARY OF SIGNIFICANT ACCOUNTING POLICIES (continued)
(V) INCOME TAXES AND OTHER TAXES (continued)
Deferred income tax liabilities are recognised for all taxable temporary differences except:
When the deferred income tax liability arises from the initial recognition of goodwill or of an asset or liability in a transaction that is not a business combination and that, at the time of the transaction, affects neither the accounting profit nor taxable profit or loss;
In respect of taxable temporary difference associated with investments in subsidiaries, associates and interests in joint ventures, when the timing of the reversal of the temporary difference can be controlled and it is probable that the temporary difference will not reverse in the foreseeable future.
Deferred income tax assets are recognised for all deductible temporary differences, the carry forward of unused tax credits and unused tax losses. Deferred tax assets are recognised to the extent that it is probable that taxable profit will be available against which the deductible temporary differences, and the carry forward of unused tax credits and unused tax losses can be utilised, except:
When the deferred tax asset relating to the deductible temporary difference arises from the initial recognition of an asset or liability in a transaction that is not a business combination and, at the time of the transaction, affects neither the accounting profit nor taxable profit or loss;
In respect of deductible temporary differences associated with investments in subsidiaries, associates and interests in joint ventures, deferred tax assets are recognised only to the extent that it is probable that the temporary differences will reverse in the foreseeable future and taxable profit will be available against which the temporary differences can be utilised.
The carrying amount of deferred tax assets is reviewed at each reporting date and reduced to the extent that it is no longer probable that sufficient taxable profit will be available to allow all or part of the deferred tax asset to be utilised. Unrecognised deferred tax assets are reassessed at each reporting date and are recognised to the extent that it has become probable that future taxable profits will allow the deferred tax asset to be recovered.
Deferred tax assets and liabilities are measured at the tax rates that are expected to apply in the year when the asset is realised or the liability is settled, based on tax rates (and tax laws) that have been enacted or substantively enacted at the reporting date.
Deferred tax relating to items recognised outside profit or loss is recognised outside profit or loss. Deferred tax items are recognised in correlation to the underlying transaction either in other comprehensive income or directly in equity.
Deferred tax assets and deferred tax liabilities are offset only if a legally enforceable right exists to set off current tax assets against current income tax liabilities and the deferred taxes relate to the same taxable entity and the same taxation authority.
Tax benefits acquired as part of a business combination, but not satisfying the criteria for separate recognition at that date, would be recognised subsequently if new information about facts and circumstances changed. The adjustment would either be treated as a reduction to goodwill (as long as it does not exceed goodwill) if it was incurred during the measurement period or in profit or loss.
Other taxes
Revenues, expenses and assets are recognised net of the amount of GST except:
When the GST incurred on a purchase of goods and services is not recoverable from the taxation authority, in which case the GST is recognised as part of the cost of acquisition of the asset or as part of the expense item as applicable.
Receivables and payables, which are stated with the amount of GST included.
The net amount of GST recoverable from, or payable to, the taxation authority is included as part of receivables or payables in the statement of financial position.
Cash flows are included in the statement of cash flows on a gross basis and the GST component of cash flows arising from investing and financing activities, which is recoverable from, or payable to, the taxation authority is classified as part of operating cash flows.
Commitments and contingencies are disclosed net of the amount of GST recoverable from, or payable to, the taxation authority.
(W) EARNINGS PER SHARE
Basic earnings per share is calculated as net profit/(loss) attributable to members of the Group divided by the weighted average number of ordinary shares. Diluted earnings per share is calculated by adjusting the net profit/(loss) attributable to members of the Group and the number of shares outstanding for the effects of all dilutive potential ordinary shares, which include share options.

80 / SANDFIRE ANNUAL REPORT 2013
2 SUMMARY OF SIGNIFICANT ACCOUNTING POLICIES (continued)
(X) FINANCIAL INSTRUMENTS
Offsetting of financial instruments
Financial assets and financial liabilities are offset and the net amount reported in the consolidated statement of financial position if, and only if:
There is a currently enforceable legal right to offset the recognised amounts.
There is an intention to settle on a net basis, or to realise the assets and settle the liabilities simultaneously.
Fair value of financial instruments
The fair value of financial instruments that are traded in active markets at each reporting date is determined by reference to quoted market prices, without any deduction for transaction costs.
For financial instruments not traded in an active market, the fair value is determined using appropriate valuation techniques. Such techniques may include:
Using recent arm’s length market transactions.
Reference to the current fair value of another instrument that is substantially the same.
A discounted cash flow analysis or other valuation models.
An analysis of fair values of financial instruments and further details as to how they are measured are provided in note 23.
3 SIGNIFICANT ACCOUNTING JUDGEMENTS, ESTIMATES AND ASSUMPTIONS
The preparation of the financial statements requires management to make judgements, estimates and assumptions that affect the reported amounts in the financial statements. Management continually evaluates its judgements and estimates in relation to assets, liabilities, contingent liabilities, revenue and expenses. Management bases its judgements and estimates on historical experience and on other various factors it believes to be reasonable under the circumstances, the result of which form the basis of the carrying values of assets and liabilities that are not readily apparent from other sources.
Management has identified the following critical accounting policies for which significant judgements, estimates and assumptions are made. Actual results may differ from these estimates under different assumptions and conditions and may materially affect financial results or the financial position reported in future periods.
Further details of the nature of these assumptions and conditions may be found in the relevant notes to the financial statements.
Rehabilitation, restoration and dismantling provision
The Group assesses its rehabilitation, restoration and dismantling (rehabilitation) provision annually. Significant estimates and assumptions are made in determining the provision for rehabilitation as there are numerous factors that will affect the ultimate liability payable. These factors include estimates of the extent and costs of rehabilitation activities, technological changes, regulatory changes, cost increases as compared to the inflation rates, and changes in discount rates. These uncertainties may result in future actual expenditure differing from the amounts currently provided. The provision at reporting date represents management’s best estimate of the present value of the future rehabilitation costs required. Changes to estimated future costs are recognised in the statement of financial position by either increasing or decreasing the rehabilitation liability and rehabilitation asset if the initial estimate was originally recognised as part of an asset measured in accordance with IAS 16 Property, Plant and Equipment. Any reduction in the rehabilitation liability and therefore any deduction from the rehabilitation asset may not exceed the carrying amount of that asset. If it does, any excess over the carrying value is taken immediately to profit or loss.
If the change in estimate results in an increase in the rehabilitation liability and therefore an addition to the carrying value of the asset, the entity is required to consider whether this is an indication of impairment of the asset as a whole and test for impairment in accordance with AASB 136. If the revised assets, net of rehabilitation provisions, exceed the recoverable value, that portion of the increase is charged directly to the income statement.
Ore reserve and resource estimates
Ore reserves are estimates of the amount of ore that can be economically and legally extracted from the Group’s mining properties. The Group estimates its ore reserves and mineral resources based on information compiled by appropriately qualified persons relating to the geological data on the size, depth and shape of the ore body, and requires complex geological judgments to interpret the data. The estimation of recoverable reserves is based upon factors such as estimates of foreign exchange rates, commodity prices, future capital requirements, and production costs along with geological assumptions and judgments made in estimating the size and grade of the ore body and removal of waste material. Changes in these estimates may impact upon the carrying value of mine properties, property, plant and equipment, provision for rehabilitation, recognition of deferred tax assets, inventory, and depreciation and amortisation charges.
NOTES TO THE FINANCIAL STATEMENTS
SANDFIRE ANNUAL REPORT 2013 / 81
3 SIGNIFICANT ACCOUNTING JUDGEMENTS, ESTIMATES AND ASSUMPTIONS (continued)
Technical feasibility and commercial viability of extracting mineral resources
The Group assesses a project to be in a development stage when the project is assessed as being technically and commercially viable. The process for determining whether a project is technically and commercially viable involves a number of judgements and estimates, including forecasting metal prices, assessing resource grades and viable methods of extracting the mineral resource. The directors of the Company generally consider a project to be economically viable upon the satisfactory completion of a feasibility study and a JORC reserve estimate.
Impairment of non-financial assets
The Group assesses impairment of all assets at each reporting date by evaluating conditions specific to the Group and to the particular asset that may lead to impairment. If an impairment trigger exists the recoverable amount of the asset is determined. As at 30 June 2013 the Group assessed that no indication of impairment existed.
Taxation and recovery of deferred tax assets
Judgment is required in determining whether deferred tax assets and certain deferred tax liabilities are recognised on the statement of financial position. Deferred tax assets, including those arising from unrecouped tax losses, capital losses and temporary differences, are recognised only where it is considered more likely than not that they will be recovered, which is dependent on the generation of sufficient future taxable profits.
Assumptions about the generation of future taxable profits depend on management’s estimates of future cash flows. These depend on estimates of future production and sales volumes, operating costs, restoration costs, capital expenditure, dividends and other capital management transactions. Judgements are also required about the application of income tax legislation. These judgements and assumptions are subject to risk and uncertainty, hence there is a possibility that changes in circumstances will alter expectations, which may impact the amount of deferred tax assets and deferred tax liabilities recognised on the statement of financial position and the amount of other tax losses and temporary differences not yet recognised. In such circumstances, some or all of the carrying amounts of recognised deferred tax assets and liabilities may require adjustment, resulting in a corresponding credit or charge to the statement of comprehensive income.
Share-based payment transactions
The Group measures the cost of equity-settled and cash-settled transactions with employees and contractors (including key management personnel) by reference to the fair value of the instruments. Estimating fair value for share based payment transactions requires determining the most appropriate valuation model, which is dependent on the terms and conditions of the grant. This estimate also requires determining the most appropriate inputs to the valuation model including the expected life of the instrument, volatility and dividend yield and making assumptions about them. The assumptions and models used for estimating fair value for share-based payment transactions are disclosed in note 22.
Estimated useful lives of assets
The estimation of the useful lives of assets has been based on historical experience, lease terms (for leased equipment) and turnover policies (for motor vehicles). In addition, the condition of the assets is assessed at least once per year and considered against the remaining useful life. Adjustments to useful lives are made when considered necessary.
4 SEGMENT INFORMATION
For management purposes, the Group has four reportable segments as follows:
The DeGrussa Copper Mine, a copper-gold mine located in the Bryah Basin mineral province of Western Australia, approximately 900 kilometres north-east of Perth and 150 kilometres north of Meekatharra. The DeGrussa Copper Mine generates revenue from the sale of copper-gold products to customers in Asia;
Exploration, which includes exploration and evaluation of the mineral tenements in Australia and overseas, including exploring for potential repeats of the DeGrussa Volcanogenic Massive Sulphide (VMS) mineralised system at the Doolgunna Project;
Treasury, which includes realised and unrealised price adjustments, finance income and finance expense; and
Corporate, which includes all corporate expenses that cannot be directly attributed to the DeGrussa Copper Mine exploration and treasury.
Segment information that is evaluated by key management personnel is prepared in conformity with the accounting policies adopted for preparing the financial statements of the Group.

82 / SANDFIRE ANNUAL REPORT 2013
4 SEGMENT INFORMATION (continued)
in $000 DeGrussa Mine Exploration Corporate Treasury Group
Income statement for the year ended 30 June 2013
Sales revenue 507,331 - - - 507,331
Net metal and price adjustments gains (losses) (6,878) - - (7,695) (14,573)
Other income - - - - -
Changes in inventories of finished goods and work in progress 26,888 - - - 26,888
Mine operations costs (83,412) - - - (83,412)
Employee benefit expenses (26,459) (8,342) (3,915) - (38,716)
Freight, treatment and refining expenses (78,563) - - - (78,563)
Royalties expense (20,986) - - - (20,986)
Exploration and evaluation expenses - (22,079) - - (22,079)
Depreciation and amortisation expenses (123,409) (806) (1,634) - (125,849)
Share of net loss of associates - - (1,106) - (1,106)
Impairment expense - - (500) - (500)
Other expenses - - (6,299) - (6,299)
Profit (loss) before net finance and income tax 194,512 (31,227) (13,454) (7,695) 142,136
Finance income - - - 3,051 3,051
Finance expense - - - (19,519) (19,519)
Profit (loss) before income tax 194,512 (31,227) (13,454) (24,163) 125,668
Income tax expense (37,670)
Net profit (loss) for the year 87,998
Income statement for the year ended 30 June 2012
Sales revenue 20,684 - - - 20,684
Net metal and price adjustments gains (losses) - - - (326) (326)
Other income - - 1,470 - 1,470
Changes in inventories of finished goods and work in progress 5,852 - - - 5,852
Mine operations costs (2,920) - - - (2,920)
Employee benefit expenses (122) (8,236) (6,628) - (14,986)
Freight, treatment and refining expenses (3,985) - - - (3,985)
Royalties expense (1,263) - - - (1,263)
Exploration and evaluation expenses - (26,424) - - (26,424)
Depreciation and amortisation expenses (3,149) (892) (483) - (4,524)
Share of net loss of associates - - (650) - (650)
Impairment expense - - (1,463) - (1,463)
Other expenses - - (5,008) - (5,008)
Profit (loss) before net finance and income tax 15,097 (35,552) (12,762) (326) (33,543)
Finance income - - - 1,217 1,217
Finance expense - - - (235) (235)
Profit (loss) before income tax 15,097 (35,552) (12,762) 656 (32,561)
Income tax benefit 8,678
Net profit (loss) for the year (23,883)
NOTES TO THE FINANCIAL STATEMENTS
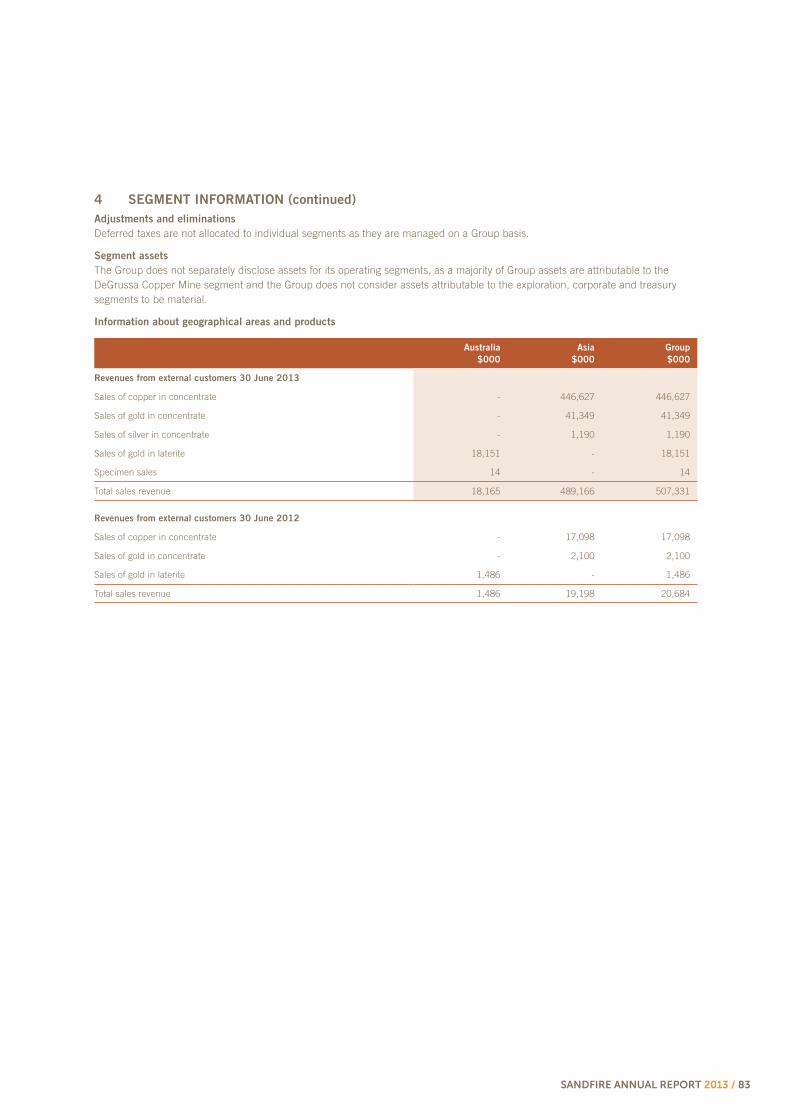
SANDFIRE ANNUAL REPORT 2013 / 83
4 SEGMENT INFORMATION (continued)
Adjustments and eliminations
Deferred taxes are not allocated to individual segments as they are managed on a Group basis.
Segment assets
The Group does not separately disclose assets for its operating segments, as a majority of Group assets are attributable to the DeGrussa Copper Mine segment and the Group does not consider assets attributable to the exploration, corporate and treasury segments to be material.
Information about geographical areas and products
Australia
$000
Asia
$000
Group
$000
Revenues from external customers 30 June 2013
Sales of copper in concentrate - 446,627 446,627
Sales of gold in concentrate - 41,349 41,349
Sales of silver in concentrate - 1,190 1,190
Sales of gold in laterite 18,151 - 18,151
Specimen sales 14 - 14
Total sales revenue 18,165 489,166 507,331
Revenues from external customers 30 June 2012
Sales of copper in concentrate - 17,098 17,098
Sales of gold in concentrate - 2,100 2,100
Sales of gold in laterite 1,486 - 1,486
Total sales revenue 1,486 19,198 20,684

84 / SANDFIRE ANNUAL REPORT 2013
Note
2013
$000
2012
$000
5 SALES REVENUE, REALISED AND UNREALISED
METAL AND PRICE ADJUSTMENT GAINS (LOSSES)
Sales revenue
Sales of copper in concentrate (i) 446,641 17,098
Sales of gold in concentrate (i) 41,349 2,100
Sales of silver in concentrate (i) 1,190 -
Sales of gold in laterite 18,151 1,486
507,331 20,684
Realised and unrealised metal and price adjustment gains (losses) (i)
Copper metal and price adjustment (12,257) (307)
Gold metal and price adjustment (2,365) 31
Silver metal and price adjustment 188 -
Copper and gold foreign exchange adjustment (139) (50)
(14,573) (326)
(i) Sandfire delivers concentrate to customers on the industry standard basis using prevailing London Metal Exchange (LME) metal prices.
For those sales based on prevailing LME metal prices, the customer makes a provisional payment to Sandfire against a provisional invoice for the contained copper and precious metal credits (for gold and silver) in the shipment. Final settlement of the payment is based on the average LME metal price over a subsequent pricing period as specified by the terms of the sales contract.
The period commencing on the date of shipment to the end of the pricing period is known as the Quotational Period (QP). The QP historically reflects the average time to elapse (usually 2 to 4 months) between the date of shipment and the date of processing by the smelter at final destination. This pricing methodology is normal for the industry.
This resulted in an unfavourable $14,573,000 (2012: $326,000) mark-to-market adjustment to profit or loss for the year ended 30 June 2013.
NOTES TO THE FINANCIAL STATEMENTS

SANDFIRE ANNUAL REPORT 2013 / 85
Note
2013
$000
2012
$000
6 EXPENSES
Profit (loss) before income tax includes the following expenses:
Depreciation
Plant and equipment 21,336 948
Motor vehicles 222 311
Leased equipment 829 395
Rehabilitation, restoration and dismantling 1,407 -
23,794 1,654
Less depreciation capitalised to mine properties (150) (279)
Total depreciation 23,644 1,375
Amortisation
Mine development 31,809 -
Development phase stripping 57,289 3,149
Production stripping 12,375 -
Rehabilitation, restoration and dismantling 732 -
Total amortisation 102,205 3,149
Total depreciation and amortisation 125,849 4,524
Lease payments included in statement of comprehensive income
Minimum lease payments – operating lease 810 824
Cost of goods sold 216,322 2,547
Net loss on sale of property, plant and equipment - 11
Consultant share-based payments 642 -
EMPLOYEE BENEFITS EXPENSES
Wages and salaries 38,098 21,455
Defined contribution superannuation expense 2,854 1,778
Employee share-based payments 22 (702) 3,643
Other employee benefits expense 2,392 1,325
42,642 28,201
Less employee benefits expenses capitalised to mine properties and property, plant and equipment (3,926) (13,215)
38,716 14,986
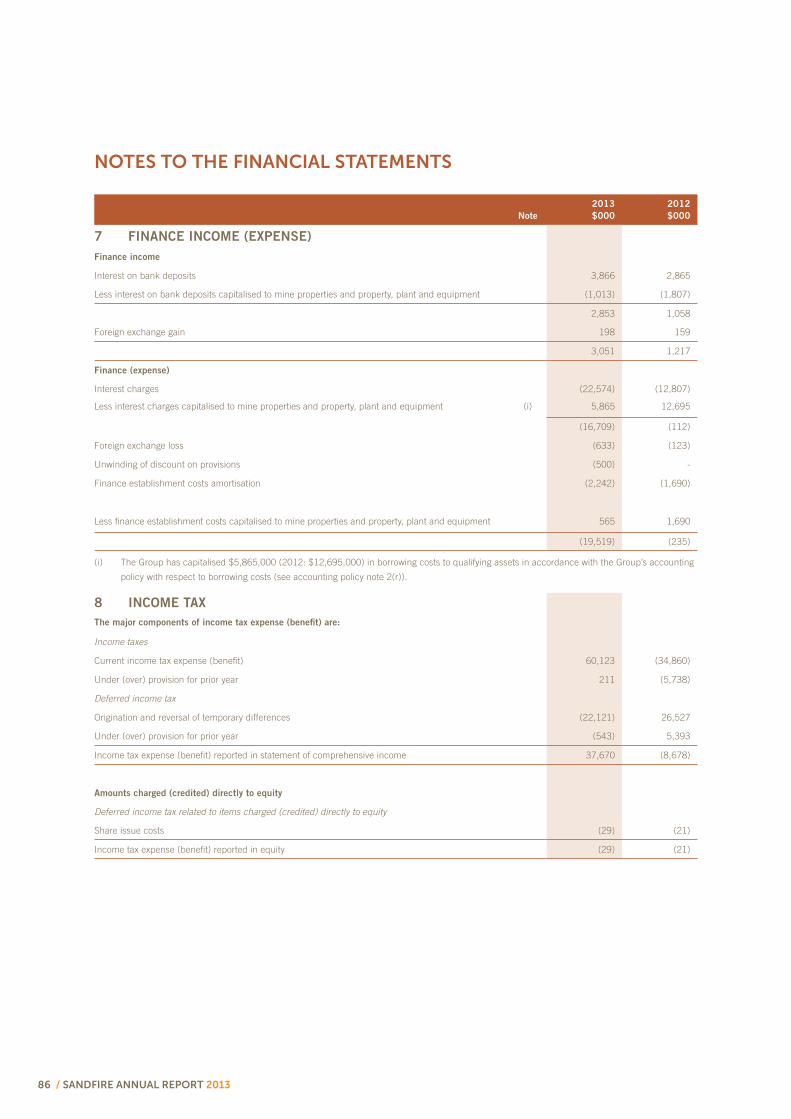
86 / SANDFIRE ANNUAL REPORT 2013
Note
2013
$000
2012
$000
7 FINANCE INCOME (EXPENSE)
Finance income
Interest on bank deposits 3,866 2,865
Less interest on bank deposits capitalised to mine properties and property, plant and equipment (1,013) (1,807)
2,853 1,058
Foreign exchange gain 198 159
3,051 1,217
Finance (expense)
Interest charges (22,574) (12,807)
Less interest charges capitalised to mine properties and property, plant and equipment (i) 5,865 12,695
(16,709) (112)
Foreign exchange loss (633) (123)
Unwinding of discount on provisions (500) -
Finance establishment costs amortisation (2,242) (1,690)
Less finance establishment costs capitalised to mine properties and property, plant and equipment 565 1,690
(19,519) (235)
(i) The Group has capitalised $5,865,000 (2012: $12,695,000) in borrowing costs to qualifying assets in accordance with the Group’s accounting
policy with respect to borrowing costs (see accounting policy note 2(r)).
8 INCOME TAX
The major components of income tax expense (benefit) are:
Income taxes
Current income tax expense (benefit) 60,123 (34,860)
Under (over) provision for prior year 211 (5,738)
Deferred income tax
Origination and reversal of temporary differences (22,121) 26,527
Under (over) provision for prior year (543) 5,393
Income tax expense (benefit) reported in statement of comprehensive income 37,670 (8,678)
Amounts charged (credited) directly to equity
Deferred income tax related to items charged (credited) directly to equity
Share issue costs (29) (21)
Income tax expense (benefit) reported in equity (29) (21)
NOTES TO THE FINANCIAL STATEMENTS

SANDFIRE ANNUAL REPORT 2013 / 87
2013
$000
2012
$000
8 INCOME TAX (continued)
Reconciliation between tax expense (benefit) recognised in the statement of comprehensive income and
tax expense (benefit) calculated per the statutory income tax rate
Profit / (loss) before tax 125,668 (32,561)
Income tax expense (benefit) using domestic corporate tax rate of 30% (2012: 30%) 37,700 (9,768)
Increase (decrease) in income tax due to:
Non-deductible expenses 51 802
Movement in unrecognised temporary differences with respect to investments 482 633
Under (over) provision for prior year (332) (345)
Other deductible expenses (231) -
Income tax expense (benefit) 37,670 (8,678)
Recognised deferred tax assets and liabilities
2013 2012
in $000
Current tax
payable
Deferred income
tax
Current tax
payable
Deferred
income tax
Opening balance - 40,580 - 31,881
Charged to income - (37,670) - 8,678
Charged to equity - 29 - 21
Closing balance - 2,939 - 40,580
Tax expense (benefit) in the statement of comprehensive income 37,670 (8,678)
Amounts recognised in the statement of financial position:
Deferred tax asset 2,939 40,580
Deferred tax liability - -
2,939 40,580
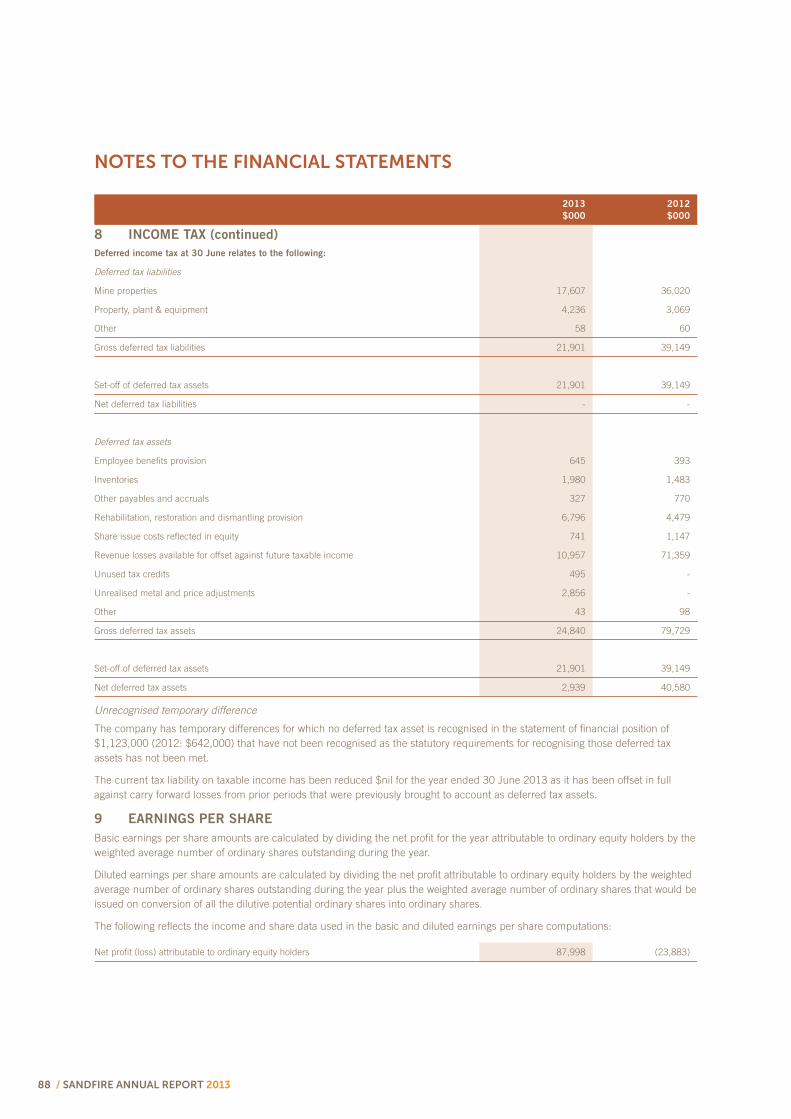
88 / SANDFIRE ANNUAL REPORT 2013
2013
$000
2012
$000
8 INCOME TAX (continued)
Deferred income tax at 30 June relates to the following:
Deferred tax liabilities
Mine properties 17,607 36,020
Property, plant & equipment 4,236 3,069
Other 58 60
Gross deferred tax liabilities 21,901 39,149
Set-off of deferred tax assets 21,901 39,149
Net deferred tax liabilities - -
Deferred tax assets
Employee benefits provision 645 393
Inventories 1,980 1,483
Other payables and accruals 327 770
Rehabilitation, restoration and dismantling provision 6,796 4,479
Share issue costs reflected in equity 741 1,147
Revenue losses available for offset against future taxable income 10,957 71,359
Unused tax credits 495 -
Unrealised metal and price adjustments 2,856 -
Other 43 98
Gross deferred tax assets 24,840 79,729
Set-off of deferred tax assets 21,901 39,149
Net deferred tax assets 2,939 40,580
Unrecognised temporary difference
The company has temporary differences for which no deferred tax asset is recognised in the statement of financial position of $1,123,000 (2012: $642,000) that have not been recognised as the statutory requirements for recognising those deferred tax assets has not been met.
The current tax liability on taxable income has been reduced $nil for the year ended 30 June 2013 as it has been offset in full against carry forward losses from prior periods that were previously brought to account as deferred tax assets.
9 EARNINGS PER SHARE
Basic earnings per share amounts are calculated by dividing the net profit for the year attributable to ordinary equity holders by the weighted average number of ordinary shares outstanding during the year.
Diluted earnings per share amounts are calculated by dividing the net profit attributable to ordinary equity holders by the weighted average number of ordinary shares outstanding during the year plus the weighted average number of ordinary shares that would be issued on conversion of all the dilutive potential ordinary shares into ordinary shares.
The following reflects the income and share data used in the basic and diluted earnings per share computations:
Net profit (loss) attributable to ordinary equity holders 87,998 (23,883)
NOTES TO THE FINANCIAL STATEMENTS

SANDFIRE ANNUAL REPORT 2013 / 89
2013
Number
2012
Number
9 EARNINGS PER SHARE (continued)
Weighted average number of ordinary shares for basic earnings per share 153,081,977 150,712,453
Effect of dilution:
Share options 266,136 -
Weighted average number of ordinary shares adjusted for the effect of dilution 153,348,113 150,712,453
Note
2013
$000
2012
$000
10 CASH AND CASH EQUIVALENTS
Cash at bank and on hand 7,070 72,389
Debt service reserve account (i) 50,000 8,000
Cost overrun account (ii) 20,000 20,000
77,070 100,389
Under the terms and conditions of the Group’s Project Loan Facility (see note 17), the Group must maintain:
(i) A cash debt service reserve amount equal to or greater than the next quarter’s scheduled amortisation payment and projected interest payment; and
(ii) A cost overrun account, to only be withdrawn and used as a contingency in the event of a cost overrun to achieve project (DeGrussa Copper Mine) completion as defined by the Group’s Finance Facilities. Following project completion a minimum of $20 million is to be held in the proceeds account, until the final repayment date, being 31 December 2015 (see note 17).
11 TRADE AND OTHER RECEIVABLES
Current
Trade receivables 6,151 2,382
Other receivables 2,340 4,633
8,491 7,015
Non-current
Security and environmental bonds 84 3
All amounts are not considered past due or impaired. It is expected that these amounts will be received when due. The Group does not hold any collateral in relation to these receivables.
See note 23 on credit risk of trade receivables to understand how the Group manages and measures credit quality of trade receivables that are neither past due nor impaired.
12 INVENTORIES
Current
Concentrate 14,566 6,863
Ore stockpiles – copper sulphide 18,930 -
Stores and consumables 5,011 391
38,507 7,254
Non-current
Ore stockpiles – oxide copper 11,698 6,233
All inventories are valued at cost.
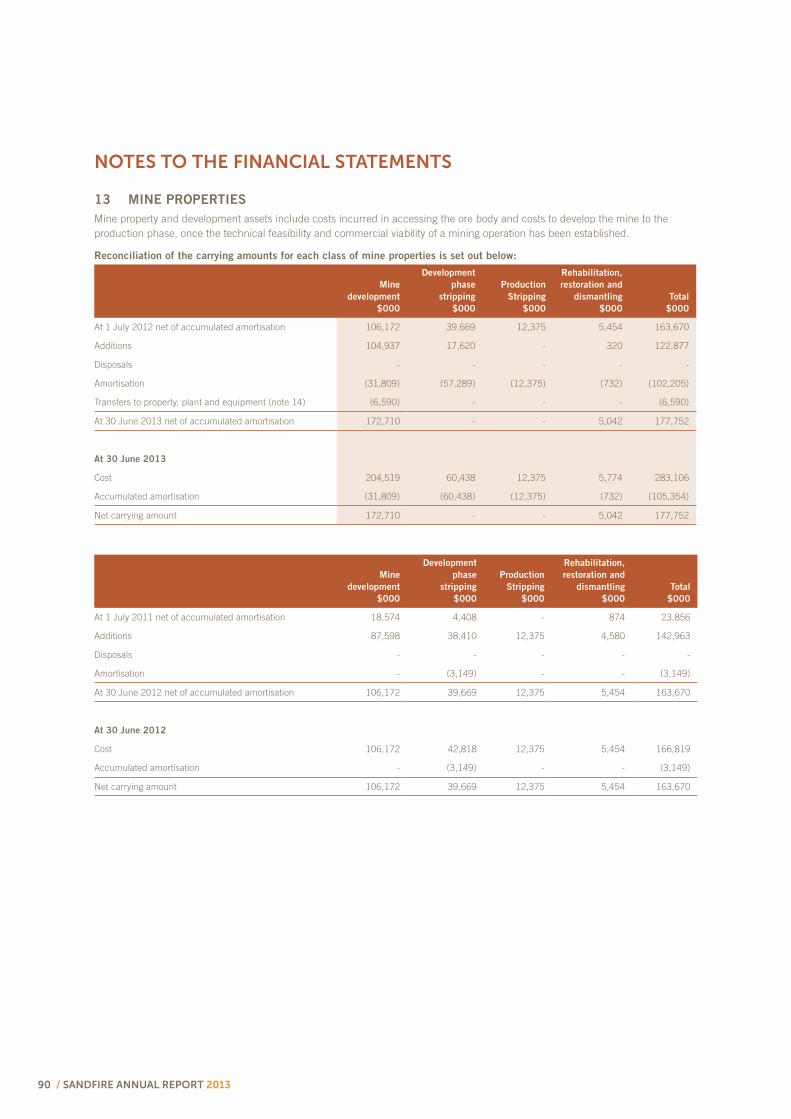
90 / SANDFIRE ANNUAL REPORT 2013
13 MINE PROPERTIES
Mine property and development assets include costs incurred in accessing the ore body and costs to develop the mine to the production phase, once the technical feasibility and commercial viability of a mining operation has been established.
Reconciliation of the carrying amounts for each class of mine properties is set out below:
Mine
development
$000
Development
phase
stripping
$000
Production
Stripping
$000
Rehabilitation,
restoration and
dismantling
$000
Total
$000
At 1 July 2012 net of accumulated amortisation 106,172 39,669 12,375 5,454 163,670
Additions 104,937 17,620 - 320 122,877
Disposals - - - - -
Amortisation (31,809) (57,289) (12,375) (732) (102,205)
Transfers to property, plant and equipment (note 14) (6,590) - - - (6,590)
At 30 June 2013 net of accumulated amortisation 172,710 - - 5,042 177,752
At 30 June 2013
Cost 204,519 60,438 12,375 5,774 283,106
Accumulated amortisation (31,809) (60,438) (12,375) (732) (105,354)
Net carrying amount 172,710 - - 5,042 177,752
Mine
development
$000
Development
phase
stripping
$000
Production
Stripping
$000
Rehabilitation,
restoration and
dismantling
$000
Total
$000
At 1 July 2011 net of accumulated amortisation 18,574 4,408 - 874 23,856
Additions 87,598 38,410 12,375 4,580 142,963
Disposals - - - - -
Amortisation - (3,149) - - (3,149)
At 30 June 2012 net of accumulated amortisation 106,172 39,669 12,375 5,454 163,670
At 30 June 2012
Cost 106,172 42,818 12,375 5,454 166,819
Accumulated amortisation - (3,149) - - (3,149)
Net carrying amount 106,172 39,669 12,375 5,454 163,670
NOTES TO THE FINANCIAL STATEMENTS

SANDFIRE ANNUAL REPORT 2013 / 91
14 PROPERTY, PLANT AND EQUIPMENT
Reconciliation of the carrying amounts for each class of property, plant and equipment is set out below:
Plant and
equipment
$000
Motor
vehicles
$000
Leased
equipment
$000
Assets under
construction
$000
Rehabilitation,
restoration and
dismantling
$000
Total
$000
At 1 July 2012 net of accumulated depreciation 2,548 513 2,193 187,504 9,474 202,232
Additions 256 74 1,467 52,193 6,906 60,896
Disposals - - - - - -
Transfers from mine properties (note 13) 6,324 266 - - - 6,590
Transfers 235,561 (589) 47 (235,019) - -
Depreciation (21,336) (222) (829) - (1,407) (23,794)
At 30 June 2013 net of accumulated depreciation 223,353 42 2,878 4,678 14,973 245,924
At 30 June 2013
Cost 246,622 1,227 4,197 4,678 16,380 273,104
Accumulated depreciation (23,269) (1,185) (1,319) - (1,407) (27,180)
Net carrying amount 223,353 42 2,878 4,678 14,973 245,924
Plant and
equipment
$000
Motor
vehicles
$000
Leased
equipment
$000
Assets under
construction
$000
Rehabilitation,
restoration and
dismantling
$000
Total
$000
At 1 July 2011 net of accumulated depreciation 1,899 718 1,274 33,538 159 37,588
Additions 1,599 119 1,408 153,966 9,315 166,407
Disposals (2) (13) (94) - - (109)
Transfers - - - - - -
Depreciation (948) (311) (395) - - (1,654)
At 30 June 2012 net of accumulated depreciation 2,548 513 2,193 187,504 9,474 202,232
At 30 June 2012
Cost 4,481 1,476 2,683 187,504 9,474 205,618
Accumulated depreciation (1,933) (963) (490) - - (3,386)
Net carrying amount 2,548 513 2,193 187,504 9,474 202,232

92 / SANDFIRE ANNUAL REPORT 2013
2013
$000
2012
$000
15 OTHER FINANCIAL ASSETS
Available for sale investment – Breakaway Resources Ltd
Acquisition at cost 600 -
Impairment (417) -
Closing carrying amount 183 -
Investment in associate - White Star Resources Ltd - 1,189
Movement in carrying amount of investment
Acquisition at cost 1,189 3,325
Share of losses after income tax (1,106) (650)
Share of movement in reserves - (23)
Impairment (83) (1,463)
Closing carrying amount - 1,189
183 1,189
Breakaway Resources Limited
The Group has a 6.3% interest in Breakaway Resources Ltd (ASX: BRW) whose principal activities are the exploration for gold, nickel and copper in Queensland and Western Australia.
For available for sale financial investments, the Group assesses at each reporting date whether there is objective evidence that an investment or a group of investments is impaired. In the case of equity investments classified as available for sale, objective evidence would include a significant or prolonged decline in the fair value of the investment below its cost. The determination of what is “significant” or “prolonged” requires judgement. In making this judgement, the Group evaluates, among other factors, the duration or extent to which the fair value of an investment is less than its cost.
Based on these criteria, the Company identified an impairment of $417,000 on the available for sale investment – Breakwater Resources Limited. The impairment on available for sale financial investments is recognised within impairment expense in the consolidated statement of comprehensive income.
White Star Resources Limited
The Group has a 17.4% interest in junior explorer White Star Resources Ltd (ASX: WSR), a South American-focused copper-gold explorer. The Group was issued 26.5 million shares at $0.07 per share, for a total cost of $1.855 million, as part of the $7.28 million share placement undertaken by White Star to sophisticated investors. In addition, the Group was issued with 17 million White Star shares and 14.5 million options with an exercise price of $0.20 per share and an expiry date of 30 April 2014 as part of Technical Services Agreement between the companies, recognising $1.47 million as other income in the year ended 30 June 2012.
The share price of White Star as at 30 June 2013 was $0.006. The Group accounts for the investment in White Star using the equity method of accounting.
The share of losses after income tax of $1,106,000 (2012: $650,000) represents the Group’s share of the net loss after tax of White Star after adjustments to expense capitalised exploration expenditure recognised by White Star, in accordance with the Group’s accounting policy (see policy note 2(o)).
At the date of this report, White Star has not completed its full year financial statements as at 30 June 2013 and therefore summarised financial information on White Star at 30 June 2013 is not included in these financial statements. The following information is based on the White Star interim financial statements for the half year ended 31 December 2012, which are White Star’s latest auditor reviewed financial statements:
in $000 Assets Liabilities Revenue Net loss after tax
White Star Resources Ltd 4,999 353 127 (4,688)
NOTES TO THE FINANCIAL STATEMENTS

SANDFIRE ANNUAL REPORT 2013 / 93
Note
2013
$000
2012
$000
16 TRADE AND OTHER PAYABLES
Current
Trade payables and accruals 43,276 43,169
Other payables 31 3,028
Interest payable 17 87 1,944
Related party payables – cash-settled share-based payments 22 207 1,485
Related party payables – KMP related entities 21 331 -
43,932 49,626
Non-current
Related party payables – cash-settled share-based payments 22 553 1,383
Terms and conditions of the above financial liabilities:Trade payables and accruals are non-interest bearing and are normally settled on 60-day terms.Other payables are non-interest bearing and have an average term of three months.Interest payable relates to the Group’s DeGrussa Project Loan Facility and is normally settled quarterly throughout the financial year. Refer to note 17 for details.For terms and conditions relating to cash-settled share-based payments, refer to note 22.For terms and conditions relating KMP related entities, refer to note 21.For explanations on the Group’s credit risk management processes, refer to note 23.
17 INTEREST-BEARING LIABILITIES
Current interest-bearing loans and borrowings
Obligations under finance leases and hire purchase contracts 1,024 649
Insurance premium funding 1,133 630
Secured bank loan
DeGrussa Project Loan Facility (i) 165,000 95,000
Capitalised finance establishment costs (net of amortisation) offset against Project Loan Facility (3,251) (2,133)
Total current interest-bearing loans and borrowings 163,906 94,146
Non-current interest-bearing loans and borrowings
Obligations under finance leases and hire purchase contracts 1,906 1,744
Secured bank loan
DeGrussa Project Loan Facility (i) 120,000 255,000
Capitalised finance establishment costs (net of amortisation) offset against Project Loan Facility (2,364) (5,725)
Total non-current interest-bearing loans and borrowings 119,542 251,019
(i) Finance facilities
The Group has access to the following facilities:
DeGrussa Project Loan Facility 285,000 380,000
Bond Facility 10,000 10,000
295,000 390,000
Facilities utilised at reporting date:
DeGrussa Project Loan Facility 285,000 350,000
Bond Facility 4,145 4,250
289,145 354,250
Facilities not utilised at reporting date:
DeGrussa Project Loan Facility - 30,000
Bond Facility 5,855 5,750
5,855 35,750

94 / SANDFIRE ANNUAL REPORT 2013
17 INTEREST-BEARING LIABILITIES (continued)
Finance facilities - Project Loan Facility
The Group’s financing arrangements are provided under a secured loan facility with the Group’s bankers and are secured by a fixed and floating charge over the Group’s assets, including the DeGrussa Project and the broader Doolgunna Project, and a mining mortgage over the Project tenements. The full $295 million facility, which includes $10 million relating to bonding, was designed to underpin the Group’s construction and development of its DeGrussa Copper Mine in Western Australia.
The Group completed the final drawdown under the Project Loan Facility, totaling $30 million in August 2012. The facility is repayable in set quarterly installments (repayments commenced on 31 March 2013) and is to be fully repaid by 31 December 2015.
The bond facility is drawn in the form of bank guarantees to the relevant State Government for environmental restoration and property managers for security deposits and does not involve the provision of funds.
Interest rate and liquidity risk
Information regarding interest rate and liquidity risk exposure is set out in note 23.
2013
$000
2012
$000
18 PROVISIONS
Current
Employee benefits 2,151 1,311
Obsolete stock 209 -
2,360 1,311
Non-current
Rehabilitation, restoration and dismantling 22,654 14,929
Movement in provisions
Movements in each class of provision during the financial year are set out below:
Employee
benefits
$000
Obsolete stock
$000
Rehabilitation,
restoration and
dismantling
$000
Total
$000
At 1 July 2012 1,311 - 14,929 16,240
Arising during the year 2,368 209 8,225 10,802
Utilised (1,528) - - (1,528)
Unwinding of discount - - (500) (500)
At 30 June 2013 2,151 209 22,654 25,014
2013
$000
2012
$000
19 ISSUED CAPITAL
Ordinary and paid up capital 219,391 213,007
Issued ordinary shares
The holders of ordinary shares are entitled to receive dividends from time to time and are entitled to one vote per share at meetings of the Company. All shares rank equally with regard to the Group’s residual assets. Ordinary shares have no par value.
2013
Number
2012
Number
Movement in ordinary shares on issue
On issue at 1 July 151,237,635 149,384,969
Conversion of options to shares 4,403,333 1,852,666
On issue at 30 June 155,640,968 151,237,635
NOTES TO THE FINANCIAL STATEMENTS

SANDFIRE ANNUAL REPORT 2013 / 95
19 ISSUED CAPITAL (continued)
Posco Australia Pty Ltd (POSA)
Australian Securities Exchange (ASX) has granted the Company a waiver from listing rule 6.18 to the extent necessary to permit the Company to give POSA the right to maintain its percentage interest in the issued capital of the Company by participating in any issue of shares or subscribing for shares (the “Top-Up Right”) in respect of a diluting event, subject to the following conditions:
(i) The Top-Up Right lapses if POSA’s percentage holding in the Company falls below 10%;
(ii) The Top-Up Right lapses if the strategic relationship between the Company and POSA ceases or changes in such a way that it effectively ceases;
(iii) The Top-Up Right may only be transferred to an entity in the wholly owned group of POSA;
(iv) Any securities issued under the Top-Up-Right are offered to POSA for cash consideration that is no more favourable than offered to third parties; and
(v) The number of securities that may be issued to POSA under the Top-Up Right in the case of any diluting event must not be greater than the number required in order for POSA to maintain its percentage holding immediately before the diluting event.
Movement in shares under option
Options expiring on or before Note
Exercise
Price
On issue
30 Jun 12 Issued Exercised
On issue
30 Jun 13
6 July 2012 $1.40 320,000 - (320,000) -
12 July 2013 $0.60 1,010,000 - (1,010,000) -
12 July 2013 $0.80 980,000 - (980,000) -
12 July 2013 $1.00 1,600,000 - (1,600,000) -
27 November 2014 $4.66 330,000 - (20,000) 310,000
27 November 2014 $5.44 330,000 - (20,000) 310,000
27 November 2014 $6.22 330,000 - (20,000) 310,000
15 June 2015 $3.80 266,666 - (233,333) 33,333
15 June 2015 $4.40 333,333 - (200,000) 133,333
15 June 2015 $5.00 333,335 - - 333,335
28 February 2016 (i) $9.00 1,249,995 500,000 - 1,749,995
28 February 2016 (i) $10.30 1,249,998 416,667 - 1,666,665
28 February 2016 (i) $11.70 1,250,007 333,333 - 1,583,340
9,583,334 1,250,000 (4,403,333) 6,430,001
(i) The options were issued to senior employees and officers of the Group. Refer to note 22 for details.
Capital management
The primary objective of the Group’s capital management is to ensure that it maintains a strong liquidity position in order to support its business and maximise shareholder value.
The Group manages and makes adjustments to its capital structure in light of changes in economic conditions. In order to maintain or adjust the capital structure, the Group may for example return capital to shareholders, issue new shares or sell assets to reduce debt.
The Group has a $285 million secured loan facility, secured by a fixed and floating charge over the Group’s assets, including the DeGrussa Project and the broader Doolgunna Project, to underpin the construction and development of its DeGrussa Copper Mine in Western Australia (see note 17).
The directors have not recommended the declaration of a dividend and no dividends were paid or declared by the Company during the current or previous financial year.
The Group is not subject to externally imposed capital requirements other than restrictions relating to the Company’s finance facilities as disclosed in this report (see note 17).

96 / SANDFIRE ANNUAL REPORT 2013
Note
2013
$000
2012
$000
20 CASH FLOW STATEMENT RECONCILIATION
Cash and cash equivalents in the statement of cash flows 10 77,070 100,389
Reconciliation of cash flows from operating activities
Profit (loss) for the period 87,998 (23,883)
Adjusted for:
Loss on sale of assets - 11Depreciation and amortisation included in statement of comprehensive income
125,849 4,524
Capitalised interest revenue 1,013 1,807
Interest and other costs of finance paid 16,709 112
Share based payments (credit) expense (1,148) 553
Unrealised price adjustments and FX adjustments 9,519 -
Income tax expense (benefit) 37,670 (8,678)
Other non cash items 3,992 140
Operating loss before changes in working capital and provisions 281,602 (25,414)
Change in assets and liabilities:
Decrease (increase) in trade and other receivables (11,785) (4,706)
Decrease (increase) in prepayments (868) (702)
Decrease (increase) in inventories (36,446) (6,242)
(Increase) decrease in trade and other payables 15,712 155
(Increase) decrease in interest-bearing liabilities 503 308
(Increase) decrease in provisions 1,512 276
Net cash inflow (outflow) from operating activities 250,230 (36,325)
Non cash financing and investing activities
Equity-settled employee share-based payments capitalised to mine properties 22 - 242
21 RELATED PARTY DISCLOSURES
The consolidated financial statements include the financial statements of the Company and the subsidiaries listed in the following table:
% equity interest
Name
Note
Country of
incorporation
2013
2012
SFR Copper & Gold Peru S.A. (i) Peru 100.00 100.00
(i) The wholly owned subsidiary was formed and incorporated by the Company on 11 April 2012.
The ultimate parent
Sandfire Resources NL is the ultimate parent based and listed in Australia.Associate
White Star Resources LtdThe Group has a 17.4% interest in White Star Resources Ltd (White Star) (2012: 17.4%). Refer to note 15 for details.
Information relating to Sandfire Resources NL (the ‘Parent entity’)
The results and financial position of the Group for the financial year ended 30 June 2013 and financial year ended 30 June 2012 represent that of the Parent entity.
NOTES TO THE FINANCIAL STATEMENTS

SANDFIRE ANNUAL REPORT 2013 / 97
21 RELATED PARTY DISCLOSURES (continued)
Compensation of key management personnel of the Group
2013
$
2012
$
Short-term employee benefits 3,574,495 3,104,485
Post-employment benefits 101,686 89,414
Share-based payments (1,018,609) 3,151,044
Total compensation 2,657,572 6,344,943
The amounts disclosed in the table are the amounts recognised as an expense during the reporting period related to key management personnel.
Option holdings of key management personnel
The movement during the reporting period in the number of options over ordinary shares in Sandfire Resources NL held, directly, indirectly or beneficially, by each key management person, including their related parties, is as follows:
Balance at
1 Jul 12
Granted as
remuneration
Options
exercised
Other A changes
Held on
resignation
Balance at
30 Jun 13
Vested and
exercisable
Executive directors
Karl M Simich 3,000,000 - (2,400,000) - 600,000 600,000
W John Evans 1,520,000 - (1,190,000) - 330,000 330,000
Other key management personnel
Martin Reed B 650,000 - - - 650,000 650,000 650,000
Matthew L Fitzgerald 1,262,500 - - (329,166) 933,334 667,667
Robert Klug 287,500 500,000 (37,500) - 750,000 583,333
A Includes off-market transfers and sales.
B Martin Reed has resigned with effect from 30 June 2013.
Balance at
1 Jul 11
Granted as
remuneration
Options
exercised
Other A changes
Held on
resignation
Balance at
30 Jun 12
Vested and
exercisable
Non-executive directors
Jonghun Jong B 60,000 - - - 60,000 - -
Executive directors
Karl M Simich 3,000,000 - - - 3,000,000 2,800,000
W John Evans 1,520,000 - - - 1,520,000 1,410,000
Other key management personnel
Martin Reed 650,000 - - - 650,000 166,666
Matthew L Fitzgerald 1,312,500 - - (50,000) 1,262,500 329,166
A Includes off-market transfers and sales.
B Mr Jong resigned 28 February 2012.

98 / SANDFIRE ANNUAL REPORT 2013
21 RELATED PARTY DISCLOSURES (continued)
Shareholdings of key management personnel
The movement during the reporting period in the number of ordinary shares in Sandfire Resources NL held, directly, indirectly or beneficially, by each key management person, including their related parties, is as follows:
Balance at
1 Jul 12 Purchases
Exercise of
options Sales
Held on
resignation
Balance at
30 Jun 13
Non-executive directors
Derek La Ferla 21,668 - - - 21,668
Robert N Scott 5,000 - - - 5,000
Executive directors
Karl M Simich 3,909,735 - 2,400,000 (300,000) 6,009,735
W John Evans 860,215 - 1,190,000 (735,000) 1,315,215
Other key management personnel
Martin Reed A 6,733 - - - 6,733 6,733
Matthew L Fitzgerald 19,000 - - (19,000) -
Robert Klug - - 37,500 (35,500) 2,000
A Martin Reed has resigned with effect from 30 June 2013.
Balance at
1 Jul 11 Purchases
Exercise of
options Sales
Held on
resignation
Balance at
30 Jun 12
Non-executive directors
Derek La Ferla 21,668 - - - 21,668
Robert N Scott - 5,000 - - 5,000
Executive directors
Karl M Simich 3,909,735 - - - 3,909,735
W John Evans 860,215 - - - 860,215
Other key management personnel
Martin Reed 6,733 - - - 6,733
Matthew L Fitzgerald 92,483 - - (73,483) 19,000
Other transactions and balances with key management personnel and their related parties
A number of key management persons, or their related parties, hold positions in other entities that result in them having control or significant influence over the financial or operating policies of those entities and transacted with the Group during the reporting period. The terms and conditions of the transactions with management persons and their related parties were no more favourable than those available, or which might reasonably be expected to be available, on similar transactions to non-director related entities on an arm’s length basis. Outstanding balances at the year-end are unsecured and interest free and settlement occurs in cash. There have been no guarantees received for any related party payables. It is the Company’s policy to avoid related party transactions when possible. The Company’s related party transactions with Resource Development Company Pty Ltd and Tongaat Pty Ltd have existed since the Sandfire Resources NL was a junior explorer.
NOTES TO THE FINANCIAL STATEMENTS
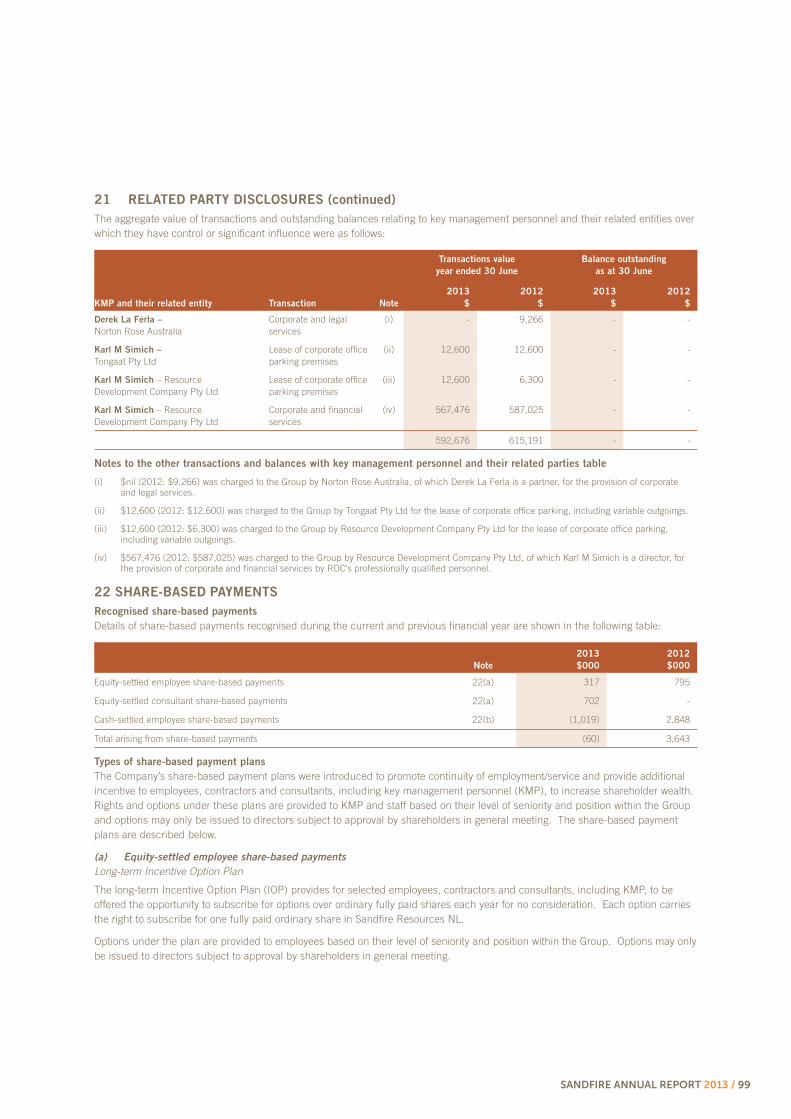
SANDFIRE ANNUAL REPORT 2013 / 99
21 RELATED PARTY DISCLOSURES (continued)
The aggregate value of transactions and outstanding balances relating to key management personnel and their related entities over which they have control or significant influence were as follows:
Transactions value
year ended 30 June
Balance outstanding
as at 30 June
KMP and their related entity Transaction Note
2013
$
2012
$
2013
$
2012
$
Derek La Ferla –
Norton Rose AustraliaCorporate and legal services
(i) - 9,266 - -
Karl M Simich –
Tongaat Pty LtdLease of corporate office parking premises
(ii) 12,600 12,600 - -
Karl M Simich – Resource Development Company Pty Ltd
Lease of corporate office parking premises
(iii) 12,600 6,300 - -
Karl M Simich – Resource Development Company Pty Ltd
Corporate and financial services
(iv) 567,476 587,025 - -
592,676 615,191 - -
Notes to the other transactions and balances with key management personnel and their related parties table
(i) $nil (2012: $9,266) was charged to the Group by Norton Rose Australia, of which Derek La Ferla is a partner, for the provision of corporate and legal services.
(ii) $12,600 (2012: $12,600) was charged to the Group by Tongaat Pty Ltd for the lease of corporate office parking, including variable outgoings.
(iii) $12,600 (2012: $6,300) was charged to the Group by Resource Development Company Pty Ltd for the lease of corporate office parking, including variable outgoings.
(iv) $567,476 (2012: $587,025) was charged to the Group by Resource Development Company Pty Ltd, of which Karl M Simich is a director, for the provision of corporate and financial services by RDC’s professionally qualified personnel.
22 SHARE-BASED PAYMENTS
Recognised share-based payments
Details of share-based payments recognised during the current and previous financial year are shown in the following table:
Note
2013
$000
2012
$000
Equity-settled employee share-based payments 22(a) 317 795
Equity-settled consultant share-based payments 22(a) 702 -
Cash-settled employee share-based payments 22(b) (1,019) 2,848
Total arising from share-based payments (60) 3,643
Types of share-based payment plans
The Company’s share-based payment plans were introduced to promote continuity of employment/service and provide additional incentive to employees, contractors and consultants, including key management personnel (KMP), to increase shareholder wealth. Rights and options under these plans are provided to KMP and staff based on their level of seniority and position within the Group and options may only be issued to directors subject to approval by shareholders in general meeting. The share-based payment plans are described below.
(a) Equity-settled employee share-based payments
Long-term Incentive Option Plan
The long-term Incentive Option Plan (IOP) provides for selected employees, contractors and consultants, including KMP, to be offered the opportunity to subscribe for options over ordinary fully paid shares each year for no consideration. Each option carries the right to subscribe for one fully paid ordinary share in Sandfire Resources NL.
Options under the plan are provided to employees based on their level of seniority and position within the Group. Options may only be issued to directors subject to approval by shareholders in general meeting.

100 / SANDFIRE ANNUAL REPORT 2013
22 SHARE BASED PAYMENTS (continued)
Under the IOP the Board of directors has the right to issue options on terms and conditions they determine appropriate and in exercising that discretion may give regard to the following:
the Eligible Participant’s length of service to the Group;
the contribution made by the Eligible Participant to the Group; and
the potential contribution of the Eligible Participant to the Group.
The directors may also impose certain conditions, including performance-related and service based conditions, on the right of the participant to exercise any option granted.
There are no voting or dividend rights attached to the options and options issued under the plan are to be issued for no consideration. Voting rights will be attached to the ordinary issued shares when the options have been exercised.
In accordance with the IOP, listed below are the terms and conditions of issues made by the Group during the financial year.
Grant date Number
Exercise
price
Service based vesting
conditions Contractual life
Option grant to employee on 2 August 2012, expiring 28 February 2016
250,000 166,667
83,333
$9.00 $10.30 $11.70
- 28 February 2013 28 February 2014
3.6 years 3.6 years 3.6 years
Option grant to consultant on 21 December 2012, expiring 28 February 2016
250,000 250,000 250,000
$9.00 $10.30 $11.70
28 February 2013 28 February 2014 28 February 2015
3.3 years 3.3 years 3.3 years
The options cannot be exercised before the above listed dates (referred to as vesting conditions), except where either of the following events occurs before the relevant vesting condition is satisfied:
The service of a bidder’s statement or a like document on the Company; or
The option holder ceases to be an employee or contractor of the Company for any reason (including voluntary or involuntary resignation) (ceasing date); or
If a merger by way of a scheme of arrangement under the Corporations Act 2001 (Cth) has been approved by the Court under section 411(4)(b) of the Corporations Act 2001 (Cth).
Where an option holder ceases to be an employee or contractor of the Group for any reason (including voluntary or involuntary resignation), the option holder will be entitled to exercise the options granted as a result of the offer in accordance with the terms of the offer, for a period up to 180 days after the ceasing date, after which the option holder’s options will lapse immediately and all rights in respect of those options will thereupon be lost.
Option pricing model
The fair value of options issued are estimated at the date of grant using the Black-Scholes option pricing model and have been recognised over the period in which the minimum service conditions are fulfilled (the vesting period). The following tables set out the assumptions made in determining the fair value of the options granted during the years ended 30 June 2013 and 30 June 2012.
30 June 2013
2 August 2012
Employee option grant
21 December 2012
Consultant option grant
Fair value at grant date $0.59 $0.62 $0.81 $0.40 $0.96 $1.21
Option exercise price $9.00 $10.30 $11.70 $9.00 $10.30 $11.70
Grant date 2 Aug 12 2 Aug 12 2 Aug 12 12 Dec 12 12 Dec 12 12 Dec 12
Dividend yield 0.00% 0.00% 0.00% 0.00% 0.00% 0.00%
Expected volatility 40.00% 40.00% 40.00% 40.00% 40.00% 40.00%
Risk-free interest rate 3.30% 2.79% 2.79% 2.97% 2.69% 2.69%
Expected life 1 year 1.5 years 2.5 years 0.2 years 1.2 years 2.2 years
Share price on date of grant $7.05 $7.05 $7.05 $8.49 $8.49 $8.49
NOTES TO THE FINANCIAL STATEMENTS

SANDFIRE ANNUAL REPORT 2013 / 101
22 SHARE-BASED PAYMENTS (continued)
30 June 2012
9 March 2012
Employee option grant
30 March 2012
Employee option grant
Fair value at grant date $0.78 $0.89 $1.32 $0.77 $0.84 $1.29
Option exercise price $9.00 $10.30 $11.70 $9.00 $10.30 $11.70
Grant date 9 Mar 12 9 Mar 12 9 Mar 12 30 Mar 12 30 Mar 12 30 Mar 12
Dividend yield 0.00% 0.00% 0.00% 0.00% 0.00% 0.00%
Expected volatility 50.00% 50.00% 50.00% 50.00% 50.00% 50.00%
Risk-free interest rate 4.51% 3.36% 3.36% 4.28% 3.47% 3.47%
Expected life 6 months 1 year 2 years 6 months 3 years 2 years
Share price on date of grant $7.90 $7.90 $7.90 $7.89 $7.89 $7.89
The effects of early exercise have been incorporated into the calculations by using an expected life for the option that is shorter than the contractual life based on historical exercise behaviour, which is not necessarily indicative of exercise patterns that may occur in the future.
Movements in the year
The following table illustrates the number and weighted average exercise prices (WAEP) of, and movements in, share options issued during the current and previous financial years:
2013
Number
2013
WAEP
2012
Number
2012
WAEP
Outstanding at 1 July 9,583,334 $5.40 10,936,000 $4.44
Granted during the year 1,250,000 $10.15 500,000 $10.33
Exercised during the year A (4,403,333) $1.26 (1,852,666) $1.06
Outstanding at 30 June B 6,430,001 $9.16 9,583,334 $5.40
Exercisable at 30 June 4,846,661 $8.33 6,419,994 $3.19
A The weighted average share price at the date of exercise is $7.54 (2012: $6.71).
B The outstanding balance at 30 June 2013 is represented by:
Options expiring on or before Exercise Price
On issue
30 Jun 13
27 November 2014 $4.66 310,000
27 November 2014 $5.44 310,000
27 November 2014 $6.22 310,000
15 June 2015 $3.80 33,333
15 June 2015 $4.40 133,333
15 June 2015 $5.00 333,335
28 February 2016 $9.00 1,749,995
28 February 2016 $10.30 1,666,665
28 February 2016 $11.70 1,583,340
6,430,001
Weighted average remaining contractual life
The weighted average remaining contractual life for share options outstanding as at 30 June 2013 is 2.43 years (2012: 2.48 years).
Range of exercise price
The range of exercise prices for options outstanding at the end of the year was $3.80 - $11.70 (2012: $0.60 - $11.70). As the range of exercise prices is wide, refer to the above table for further information in assessing the number and timing of additional shares that may be issued and the cash that may be received upon exercise of those options.

102 / SANDFIRE ANNUAL REPORT 2013
22 SHARE-BASED PAYMENTS (continued)
Weighted average fair valueThe weighted average fair value of options granted during the year was $0.77 (2012 $0.98).
(b) Cash-settled employee share-based payments
During the 2011 financial year, the Company’s Remuneration and Nomination Committee approved the Long-term Indexed Bonus Plan (long-term bonus plan) to align the objectives of executive directors with that of the Company.
The Company granted 1,000,000 rights to executive directors in July 2010 and granted a further 2,000,000 rights to executive directors in August 2011.
Rights issued under the plan are long term in nature and have multiple vesting dates, with current rights vesting from 15 June 2011 to 15 December 2016.
The Company sets an initial indexed notional value (INV) for rights issued under the bonus plan. On the first vesting date, the holder of the awards receives, at the Company’s sole discretion, either cash, or subject to any shareholder approval required under the Corporations Act 2001 and the ASX Listing Rules, ordinary shares in the Company for the difference between the 5-day volume weighted average ASX price of underlying Company shares prior to the vesting date (test price), and the INV set when the rights were initially granted. At each subsequent test date, the award is retested, whereby the holder receives the difference between the 5-day volume weighted average ASX price of underlying Company shares prior to the test date and the higher of the initial INV or the highest test price that occurred prior to that date.
Termination and change of control provisions
Participant initiated termination
Where a participant ceases to be an employee or contractor of the Group prior to vesting of their award, all outstanding rights will expire and cease to carry any rights or benefits.
Group initiated termination
Where the engagement or employment is terminated by the Group for reasons other than serious misconduct, the rights will continue to vest for 180 days following the end of the required notice period, with the final vesting date to be the date on which the 180 day notice period expires.
Change of control
In the event of a change of control of the Company, the vesting period will be brought forward to the date of the change of control and awards will automatically vest.
Listed below are the terms and conditions of rights issued by the Company under the long-term indexed bonus plan. No additional rights were issued by the company during the current financial year.
Grant date Number
Indexed
notional
value Initial vesting date Test dates
Contractual
life
Long-term bonus plan grant to executive directors of the Company on 8 August 2011, expiring 15 December 2016.
666,666
666,667
666,667
$9.00
$10.30
$11.70
15 June 2013
15 June 2014
15 June 2015
15 June and 15 December from 2013 to 2016
15 June and 15 December from 2014 to 2016
15 June and 15 December from 2015 to 2016
5 years
5 years
5 years
Long-term bonus plan grant to executive directors of the Company on 2 July 2010, modified on 8 August 2011, expiring 15 December 2015.
333,332
333,334
333,334
$3.80
$4.40
$5.00
15 June 2011
15 June 2012
15 June 2013
15 June and 15 December from 2011 to 2015
15 June and 15 December from 2012 to 2015
15 June and 15 December from 2013 to 2015
4 years
4 years
4 years
NOTES TO THE FINANCIAL STATEMENTS
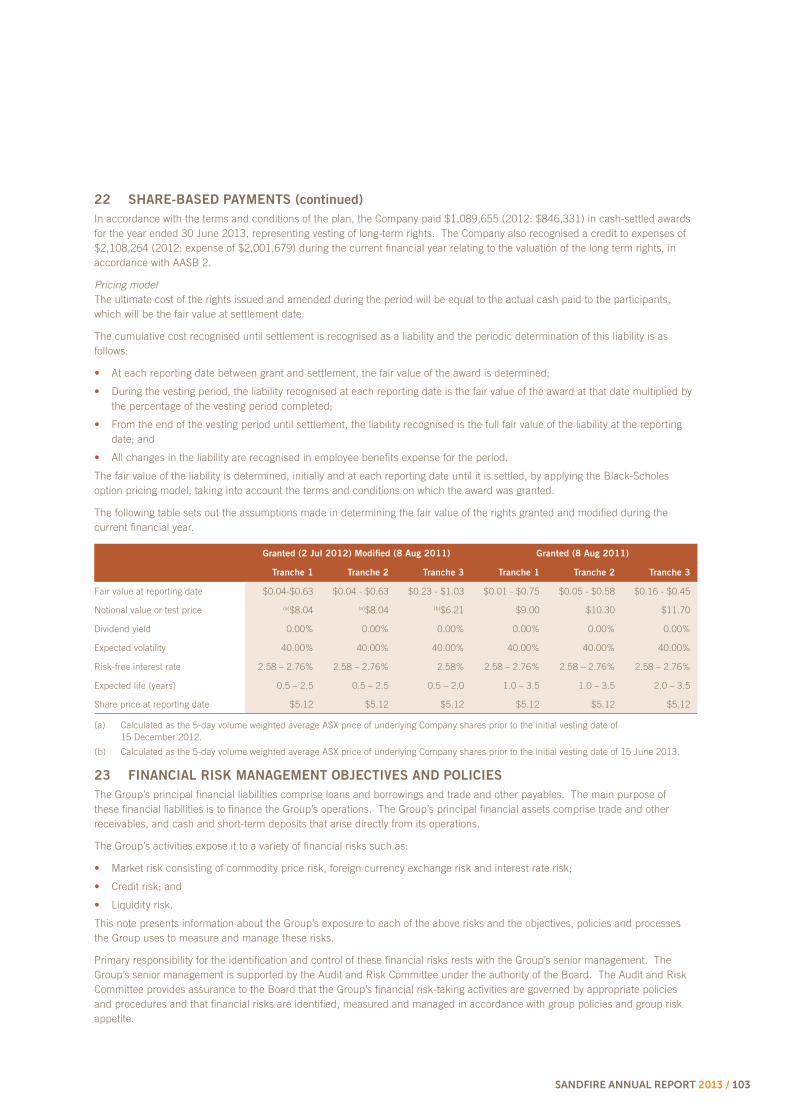
SANDFIRE ANNUAL REPORT 2013 / 103
22 SHARE-BASED PAYMENTS (continued)
In accordance with the terms and conditions of the plan, the Company paid $1,089,655 (2012: $846,331) in cash-settled awards for the year ended 30 June 2013, representing vesting of long-term rights. The Company also recognised a credit to expenses of $2,108,264 (2012: expense of $2,001,679) during the current financial year relating to the valuation of the long term rights, in accordance with AASB 2.
Pricing modelThe ultimate cost of the rights issued and amended during the period will be equal to the actual cash paid to the participants, which will be the fair value at settlement date.
The cumulative cost recognised until settlement is recognised as a liability and the periodic determination of this liability is as follows:
At each reporting date between grant and settlement, the fair value of the award is determined;
During the vesting period, the liability recognised at each reporting date is the fair value of the award at that date multiplied by the percentage of the vesting period completed;
From the end of the vesting period until settlement, the liability recognised is the full fair value of the liability at the reporting date; and
All changes in the liability are recognised in employee benefits expense for the period.
The fair value of the liability is determined, initially and at each reporting date until it is settled, by applying the Black-Scholes option pricing model, taking into account the terms and conditions on which the award was granted.
The following table sets out the assumptions made in determining the fair value of the rights granted and modified during the current financial year.
Granted (2 Jul 2012) Modified (8 Aug 2011) Granted (8 Aug 2011)
Tranche 1 Tranche 2 Tranche 3 Tranche 1 Tranche 2 Tranche 3
Fair value at reporting date $0.04-$0.63 $0.04 - $0.63 $0.23 - $1.03 $0.01 - $0.75 $0.05 - $0.58 $0.16 - $0.45
Notional value or test price (a)$8.04 (a)$8.04 (b)$6.21 $9.00 $10.30 $11.70
Dividend yield 0.00% 0.00% 0.00% 0.00% 0.00% 0.00%
Expected volatility 40.00% 40.00% 40.00% 40.00% 40.00% 40.00%
Risk-free interest rate 2.58 – 2.76% 2.58 – 2.76% 2.58% 2.58 – 2.76% 2.58 – 2.76% 2.58 – 2.76%
Expected life (years) 0.5 – 2.5 0.5 – 2.5 0.5 – 2.0 1.0 – 3.5 1.0 – 3.5 2.0 – 3.5
Share price at reporting date $5.12 $5.12 $5.12 $5.12 $5.12 $5.12
(a) Calculated as the 5-day volume weighted average ASX price of underlying Company shares prior to the initial vesting date of 15 December 2012.
(b) Calculated as the 5-day volume weighted average ASX price of underlying Company shares prior to the initial vesting date of 15 June 2013.
23 FINANCIAL RISK MANAGEMENT OBJECTIVES AND POLICIES
The Group’s principal financial liabilities comprise loans and borrowings and trade and other payables. The main purpose of these financial liabilities is to finance the Group’s operations. The Group’s principal financial assets comprise trade and other receivables, and cash and short-term deposits that arise directly from its operations.
The Group’s activities expose it to a variety of financial risks such as:
Market risk consisting of commodity price risk, foreign currency exchange risk and interest rate risk;
Credit risk; and
Liquidity risk.
This note presents information about the Group’s exposure to each of the above risks and the objectives, policies and processes the Group uses to measure and manage these risks.
Primary responsibility for the identification and control of these financial risks rests with the Group’s senior management. The Group’s senior management is supported by the Audit and Risk Committee under the authority of the Board. The Audit and Risk Committee provides assurance to the Board that the Group’s financial risk-taking activities are governed by appropriate policies and procedures and that financial risks are identified, measured and managed in accordance with group policies and group risk appetite.

104 / SANDFIRE ANNUAL REPORT 2013
23 FINANCIAL RISK MANAGEMENT OBJECTIVES AND POLICIES (continued)
The Group uses different methods to measure and manage different types of risks to which it is exposed. These include monitoring levels of exposure to interest rates via assessments of market forecasts for interest rates and monitoring liquidity risk through the development of future rolling cash flow forecasts.
As at 30 June 2013, the Group did not use any form of derivatives to hedge its exposures. The Group does not enter into or trade financial instruments, including derivative financial instruments, for speculative purposes.
Market riskMarket risk is the risk that the fair value of future cash flows of a financial instrument will fluctuate because of changes in market prices. Market prices for the Group comprise three types of risk: interest rate risk, currency risk and commodity price risk. Financial instruments affected by market risk include loans and borrowings, trade receivables and cash and short-term deposits.
Interest rate risk
Interest rate risk is the risk that the fair value of future cash flows of a financial instrument will fluctuate because of changes in market interest rates. The Group’s exposure to the risk of changes in market interest rates relates primarily to the Group’s current and non-current debt obligations with floating interest rates. The Group is also exposed to interest rate risk on its cash and short-term deposits.
At 30 June 2013 the interest rate profile of the Group’s interest-bearing financial instruments was:
Fixed interest rate maturity
Average
interest rate
%
Variable
interest rate
$000
Less than 1
year
$000
1 to 5
years
$000
More than 5
years
$000
Total
$000
Financial assets
Cash and cash equivalents 3.04 77,070 - - - 77,070
Financial liabilities
Interest bearing liabilities 5.90 285,000 2,157 1,906 - 289,063
At 30 June 2012 the interest rate profile of the Group’s interest-bearing financial instruments was:
Fixed interest rate maturity
Average
interest rate
%
Variable
interest rate
$000
Less than 1
year
$000
1 to 5
years
$000
More than 5
years
$000
Total
$000
Financial assets
Cash and cash equivalents 3.39 100,389 - - - 100,389
Financial liabilities
Interest bearing liabilities 6.34 350,000 1,279 1,744 - 353,023
The following table demonstrates the sensitivity of pre-tax losses and equity to a reasonably possible change in interest rates by +0.25%/-0.50% as at 30 June 2013 (2012: +0.25%/-0.50%) with all other variables held constant. The exposure is mainly as a result of borrowings and cash at bank at floating rates.
Pre-tax loss higher (lower) Equity higher (lower)
2013
$000
2012
$000
2013
$000
2012
$000
0.25% increase (2012: 0.25% increase) (520) - - 624
0.50% decrease (2012: 0.50% decrease) 1,004 - - (1,248)
The assumed movement in basis points for the interest rate sensitivity analysis is based on the currently observable market environment.
NOTES TO THE FINANCIAL STATEMENTS
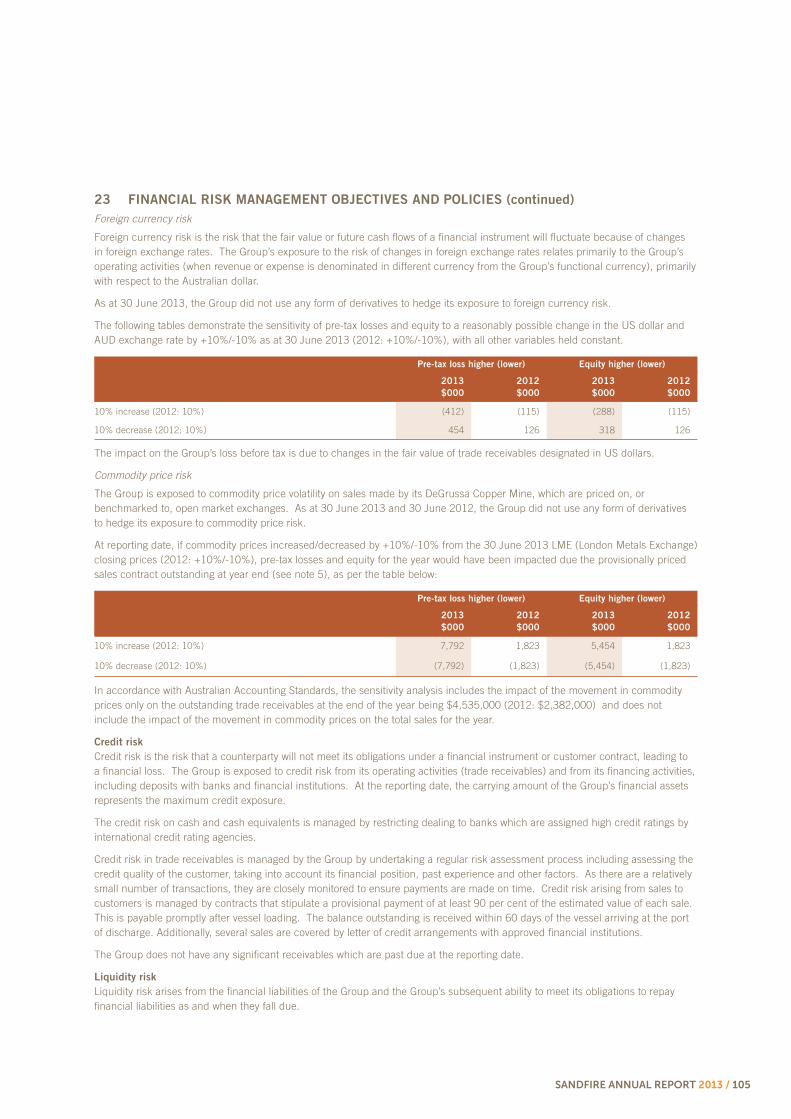
SANDFIRE ANNUAL REPORT 2013 / 105
23 FINANCIAL RISK MANAGEMENT OBJECTIVES AND POLICIES (continued)
Foreign currency risk
Foreign currency risk is the risk that the fair value or future cash flows of a financial instrument will fluctuate because of changes in foreign exchange rates. The Group’s exposure to the risk of changes in foreign exchange rates relates primarily to the Group’s operating activities (when revenue or expense is denominated in different currency from the Group’s functional currency), primarily with respect to the Australian dollar.
As at 30 June 2013, the Group did not use any form of derivatives to hedge its exposure to foreign currency risk.
The following tables demonstrate the sensitivity of pre-tax losses and equity to a reasonably possible change in the US dollar and AUD exchange rate by +10%/-10% as at 30 June 2013 (2012: +10%/-10%), with all other variables held constant.
Pre-tax loss higher (lower) Equity higher (lower)
2013
$000
2012
$000
2013
$000
2012
$000
10% increase (2012: 10%) (412) (115) (288) (115)
10% decrease (2012: 10%) 454 126 318 126
The impact on the Group’s loss before tax is due to changes in the fair value of trade receivables designated in US dollars.
Commodity price risk
The Group is exposed to commodity price volatility on sales made by its DeGrussa Copper Mine, which are priced on, or benchmarked to, open market exchanges. As at 30 June 2013 and 30 June 2012, the Group did not use any form of derivatives to hedge its exposure to commodity price risk.
At reporting date, if commodity prices increased/decreased by +10%/-10% from the 30 June 2013 LME (London Metals Exchange) closing prices (2012: +10%/-10%), pre-tax losses and equity for the year would have been impacted due the provisionally priced sales contract outstanding at year end (see note 5), as per the table below:
Pre-tax loss higher (lower) Equity higher (lower)
2013
$000
2012
$000
2013
$000
2012
$000
10% increase (2012: 10%) 7,792 1,823 5,454 1,823
10% decrease (2012: 10%) (7,792) (1,823) (5,454) (1,823)
In accordance with Australian Accounting Standards, the sensitivity analysis includes the impact of the movement in commodity prices only on the outstanding trade receivables at the end of the year being $4,535,000 (2012: $2,382,000) and does not include the impact of the movement in commodity prices on the total sales for the year.
Credit risk
Credit risk is the risk that a counterparty will not meet its obligations under a financial instrument or customer contract, leading to a financial loss. The Group is exposed to credit risk from its operating activities (trade receivables) and from its financing activities, including deposits with banks and financial institutions. At the reporting date, the carrying amount of the Group’s financial assets represents the maximum credit exposure.
The credit risk on cash and cash equivalents is managed by restricting dealing to banks which are assigned high credit ratings by international credit rating agencies.
Credit risk in trade receivables is managed by the Group by undertaking a regular risk assessment process including assessing the credit quality of the customer, taking into account its financial position, past experience and other factors. As there are a relatively small number of transactions, they are closely monitored to ensure payments are made on time. Credit risk arising from sales to customers is managed by contracts that stipulate a provisional payment of at least 90 per cent of the estimated value of each sale. This is payable promptly after vessel loading. The balance outstanding is received within 60 days of the vessel arriving at the port of discharge. Additionally, several sales are covered by letter of credit arrangements with approved financial institutions.
The Group does not have any significant receivables which are past due at the reporting date.
Liquidity risk
Liquidity risk arises from the financial liabilities of the Group and the Group’s subsequent ability to meet its obligations to repay financial liabilities as and when they fall due.

106 / SANDFIRE ANNUAL REPORT 2013
23 FINANCIAL RISK MANAGEMENT OBJECTIVES AND POLICIES (continued)
The Group’s approach to managing liquidity is to ensure, as far as possible, that it will always have sufficient liquidity to meet its liabilities when due, under both normal and stressed conditions, without incurring unacceptable losses or risking damage to the Group’s reputation. The Group manages liquidity risk by conducting regular reviews of the timing of cash flows in order to ensure sufficient funds are available to meet these obligations.
The table below analyses the Group’s financial liabilities into relevant maturity groupings based on the remaining period at the reporting date to the contractual maturity date. The amounts disclosed in the table are the contractual undiscounted cash flows.
Note
Within 6 months
$000
6 to 12 months
$000
1 to 5 years
$000
Total
$000
Year ended 30 June 2013
Trade and other payables 16 43,881 51 55344,485
DeGrussa Project Loan Facility 17 92,354 84,594 124,842301,790
Other interest bearing liabilities 17 1,675 677 2,0444,396
137,910 85,322 127,439 350,671
Year ended 30 June 2012
Trade and other payables 16 48,141 1,485 1,38351,009
DeGrussa Project Loan Facility 17 12,145 105,445 298,652416,242
Other interest bearing liabilities 17 961 500 1,8783,339
61,247 107,430 301,913 470,590
Finance Facilities
The Group’s financing arrangements are provided under a secured loan facility with the Group’s bankers and are secured by a fixed and floating charge over the Group’s assets, including the DeGrussa Project and the broader Doolgunna Project, and a mining mortgage over the Project tenements. The full $295 million facility, which includes $10 million relating to bonding, was designed to underpin the Group’s construction and development of its DeGrussa Copper Mine in Western Australia.
The Group completed the final drawdown under the Project Loan Facility, totaling $30 million in August 2012. The facility is repayable in set quarterly installments (repayments commenced on 31 March 2013) and is to be fully repaid by 31 December 2015.
The bond facility is drawn in the form of bank guarantees to the relevant State Government for environmental restoration and property managers for security deposits and does not involve the provision of funds.
Fair value
The carrying amount of all financial assets and financial liabilities recognised in the Balance Sheet approximates their fair value.
24 CONTINGENT LIABILITIES AND COMMITMENTS
Contingent liability - DeGrussa DSO Royalty Rate
The Western Australian Department of Mines and Petroleum has advised Sandfire of its determination that a royalty rate of 7.5% applies to the Direct Shipping Ore (“DSO”) sold from its DeGrussa Copper Mine. This is based on an assessment that it is “other crushed and screened material” under the applicable Regulations.
The Company was invited to, and made, a submission to the Western Australian Minister for Mines and Petroleum to present an alternative interpretation of the Regulations. This submission was part of a process aimed at finally determining the royalty rate which should apply to the DSO.
Sandfire contends that under the Regulations, a maximum royalty rate of 5 per cent applies to the sale of copper material, applying to copper sold as concentrate. Sandfire has submitted that the royalty rate of 5 per cent apply to its DSO which it contends has been sold as concentrate. Sandfire has received legal advice in this regard. Sandfire has expensed royalties based on the 5 per cent rate.
Sandfire believes it probable that a rate of 5 per cent will ultimately be determined to be applicable consistent with its royalty expense. However, as the additional 2.5 per cent liability is considered a possible result following full and proper determination by other parties, an amount of $5.5 million exists at balance date, as a contingent liability, representing the potential additional 2.5 per cent royalty from the period from the first DSO sale, to 30 June 2013.
NOTES TO THE FINANCIAL STATEMENTS

SANDFIRE ANNUAL REPORT 2013 / 107
24 CONTINGENT LIABILITIES AND COMMITMENTS (continued)
Operating lease commitments – Group as lessee
The Group leases corporate office, administrative and storage facilities throughout Australia. The leases have varying terms, with options to renew the lease on respective expiry dates. There are no restrictions placed upon the lessee by entering into these leases.
Future minimum rentals payable under non-cancellable operating leases as at 30 June are as follows:
Note
2013
$000
2012
$000
Within one year 759 750
After one year but not more than five years 2,811 26
Total minimum lease payments 3,570 776
Finance leases and hire purchase commitments – Group as lessee
The Group has finance leases and hire purchase contracts for various motor vehicles and mobile plant with a carrying amount of $2,878,000 (2012: $2,193,000). These lease contracts expire within two to five years. Future minimum lease payments under finance leases and hire purchase contracts together with the present value of the net minimum lease payments are as follows:
Within one year 1,186 822
After one year but not more than five years 2,044 1,878
Total minimum lease payments 3,230 2,700
Less amounts representing finance charges (300) (307)
Present value of minimum lease payments 2,930 2,393
Included in the financial statements as:
Current interest-bearing liabilities 17 1,024 649
Non-current interest-bearing liabilities 17 1,906 1,744
Total included in interest-bearing liabilities 2,930 2,393
Contractual commitments
The Group has entered into a number of key contracts as part of its operation of the DeGrussa Copper Mine located in Western Australia. The minimum expected payments in relation to these contracts which were not required to be recognised as liabilities at 30 June 2013 amount to approximately $5.6 million (undiscounted).
Other Contractual commitments
Posco Australia Pty Ltd (POSA)On 2 May 2008, the Company entered into a commercial agreement with Posco Australia Pty Ltd (POSA), whereby POSA, or POSA nominated affiliates, has the right to purchase 30% of the Company’s future mineral production, excluding gold and diamond production, at fair market value. The rights under the commercial agreement remain for as long as POSA has at least a 10% holding of Sandfire ordinary shares and entitles POSA to a 7.5% discount on the first $100 million of offtake. A contract for 40,000 tonnes of concentrate up to March 2014 has been entered into, representing an estimated $70 million of product which will result in a $5 million discount in the 2014 financial year.
25 EVENTS AFTER THE BALANCE SHEET DATE
There have been no events that have occurred subsequent to the reporting date which have significantly affected or may significantly affect the Group’s operations, results or state of affairs in future periods.
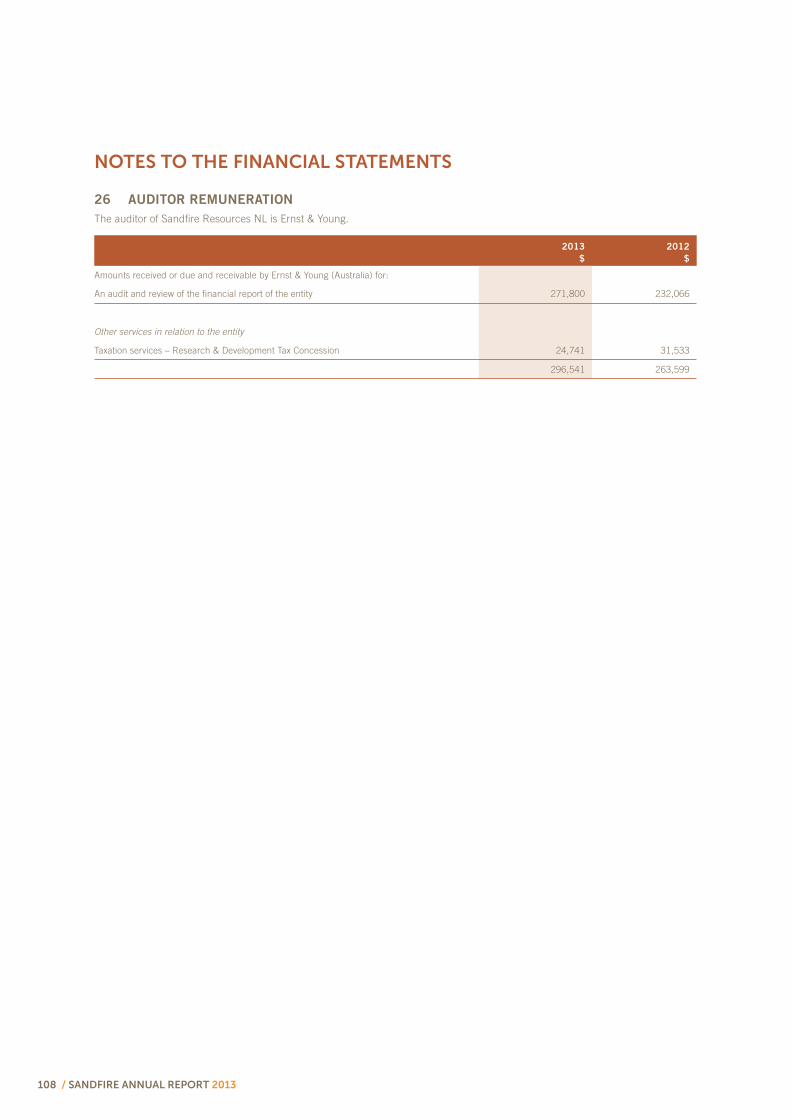
108 / SANDFIRE ANNUAL REPORT 2013
26 AUDITOR REMUNERATION
The auditor of Sandfire Resources NL is Ernst & Young.
2013
$
2012
$
Amounts received or due and receivable by Ernst & Young (Australia) for:
An audit and review of the financial report of the entity 271,800 232,066
Other services in relation to the entity
Taxation services – Research & Development Tax Concession 24,741 31,533
296,541 263,599
NOTES TO THE FINANCIAL STATEMENTS

SANDFIRE ANNUAL REPORT 2013 / 109
In accordance with a resolution of the directors of Sandfire Resources NL, I state that:
1. In the opinion of the directors:
a) the financial statements and notes of Sandfire Resources NL for the financial year ended 30 June 2013 are in accordance with the Corporations Act 2001, including:
(i) Giving a true and fair view of its financial position as at 30 June 2013 and of its performance for the year ended on that date; and (ii) Complying with Accounting Standards and the Corporations Regulations 2001;
b) the financial statements and notes also comply with International Financial Reporting Standards as disclosed in note 2(a); and
c) there are reasonable grounds to believe that the Company will be able to pay its debts as and when they become due and payable.
2. This declaration has been made after receiving the declarations required to be made to the directors by the chief executive officer and chief financial officer in accordance with section 295A of the Corporations Act 2001 for the financial year ending 30 June 2013.
On behalf of the Board
West Perth, 28 August 2013
Derek La Ferla Non-executive Chairman
Karl M. Simich Managing Director and Chief Executive Officer
DIRECTORS’ DECLARATION
FOR THE YEAR ENDED 30 JUNE 2013

110 / SANDFIRE ANNUAL REPORT 2013
INDEPENDENT AUDITOR’S REPORT TO THE MEMBERS OF SANDFIRE RESOURCES NL
Report on the financial report
We have audited the accompanying financial report of Sandfire Resources NL, which comprises the consolidated statement of financial position as at 30 June 2013, the consolidated statement of comprehensive income, the consolidated statement of changes in equity and the consolidated statement of cash flows for the year then ended, notes comprising a summary of significant accounting policies and other explanatory information, and the directors’ declaration of the consolidated entity comprising the company and the entities it controlled at the year’s end or from time to time during the financial year.Directors’ responsibility for the financial report
The directors of the company are responsible for the preparation of the financial report that gives a true and fair view in accordance with Australian Accounting Standards and the Corporations Act 2001 and for such internal controls as the directors determine are necessary to enable the preparation of the financial report that is free from material misstatement, whether due to fraud or error. In Note 2, the directors also state, in accordance with Accounting Standard AASB 101 Presentation of Financial Statements, that the financial statements comply with International Financial Reporting Standards.Auditor’s responsibility
Our responsibility is to express an opinion on the financial report based on our audit. We conducted our audit in accordance with Australian Auditing Standards. Those standards require that we comply with relevant ethical requirements relating to audit engagements and plan and perform the audit to obtain reasonable assurance about whether the financial report is free from material misstatement.An audit involves performing procedures to obtain audit evidence about the amounts and disclosures in the financial report. The procedures selected depend on the auditor’s judgment, including the assessment of the risks of material misstatement of the financial report, whether due to fraud or error. In making those risk assessments, the auditor considers internal controls relevant to the entity’s preparation and fair presentation of the financial report in order to design audit procedures that are appropriate in the circumstances, but not for the purpose of expressing an opinion on the effectiveness of the entity’s internal controls. An audit also includes evaluating the appropriateness of accounting policies used and the reasonableness of accounting estimates made by the directors, as well as evaluating the overall presentation of the financial report.
We believe that the audit evidence we have obtained is sufficient and appropriate to provide a basis for our audit opinion.
Independence
In conducting our audit we have complied with the independence requirements of the Corporations Act 2001. We have given to the directors of the company a written Auditor’s Independence Declaration, a copy of which is included in the directors’ report.
INDEPENDENT AUDITOR’S REPORT
FOR THE YEAR ENDED 30 JUNE 2013
A member firm of Ernst & Young Global Limited Liability limited by a scheme approved under Professional Standards Legislation
DL:DR:SANDFIRE:042
Ernst & Young 11 Mounts Bay Road Perth WA 6000 Australia GPO Box M939 Perth WA 6843
Tel: +61 8 9429 2222 Fax: +61 8 9429 2436 ey.com/au
Independent auditor's report to the members of Sandfire Resources NL
Report on the financial report
We have audited the accompanying financial report of Sandfire Resources NL, which comprises the consolidated statement of financial position as at 30 June 2013, the consolidated statement of comprehensive income, the consolidated statement of changes in equity and the consolidated statement of cash flows for the year then ended, notes comprising a summary of significant accounting policies and other explanatory information, and the directors' declaration of the consolidated entity comprising the company and the entities it controlled at the year's end or from time to time during the financial year.
Directors' responsibility for the financial report
The directors of the company are responsible for the preparation of the financial report that gives a true and fair view in accordance with Australian Accounting Standards and the Corporations Act 2001 and for such internal controls as the directors determine are necessary to enable the preparation of the financial report that is free from material misstatement, whether due to fraud or error. In Note 1, the directors also state, in accordance with Accounting Standard AASB 101 Presentation of Financial Statements, that the financial statements comply with International Financial Reporting Standards.
Auditor's responsibility
Our responsibility is to express an opinion on the financial report based on our audit. We conducted our audit in accordance with Australian Auditing Standards. Those standards require that we comply with relevant ethical requirements relating to audit engagements and plan and perform the audit to obtain reasonable assurance about whether the financial report is free from material misstatement.
An audit involves performing procedures to obtain audit evidence about the amounts and disclosures in the financial report. The procedures selected depend on the auditor's judgment, including the assessment of the risks of material misstatement of the financial report, whether due to fraud or error. In making those risk assessments, the auditor considers internal controls relevant to the entity's preparation and fair presentation of the financial report in order to design audit procedures that are appropriate in the circumstances, but not for the purpose of expressing an opinion on the effectiveness of the entity's internal controls. An audit also includes evaluating the appropriateness of accounting policies used and the reasonableness of accounting estimates made by the directors, as well as evaluating the overall presentation of the financial report.
We believe that the audit evidence we have obtained is sufficient and appropriate to provide a basis for our audit opinion.
Independence
In conducting our audit we have complied with the independence requirements of the Corporations Act 2001. We have given to the directors of the company a written Auditor’s Independence Declaration, a copy of which is included in the directors’ report.

SANDFIRE ANNUAL REPORT 2013 / 111
Opinion
In our opinion: a) the financial report of Sandfire Resources NL is in accordance with the Corporations Act 2001, including: i) giving a true and fair view of the consolidated entity’s financial position as at 30 June 2013 and of its performance for the year ended on that date; and
ii) complying with Australian Accounting Standards and the Corporations Regulations 2001; and
b) the financial report also complies with International Financial Reporting Standards as disclosed in Note 2.
Report on the remuneration report
We have audited the Remuneration Report included in the directors’ report for the year ended 30 June 2013. The directors of the company are responsible for the preparation and presentation of the Remuneration Report in accordance with section 300A of the Corporations Act 2001. Our responsibility is to express an opinion on the Remuneration Report, based on our audit conducted in accordance with Australian Auditing Standards.
Opinion
In our opinion, the Remuneration Report of Sandfire Resources NL for the year ended 30 June 2013, complies with section 300A of the Corporations Act 2001.
Ernst & Young
D S Lewsen
Partner Perth 28 August 2013
A member firm of Ernst & Young Global Limited Liability limited by a scheme approved under Professional Standards Legislation
DL:DR:SANDFIRE:042
Opinion
In our opinion:
a. the financial report of Sandfire Resources NL is in accordance with the Corporations Act 2001, including:
i giving a true and fair view of the consolidated entity's financial position as at 30 June 2013 and of its performance for the year ended on that date; and
ii complying with Australian Accounting Standards and the Corporations Regulations 2001; and
b. the financial report also complies with International Financial Reporting Standards as disclosed in Note 1.
Report on the remuneration report
We have audited the Remuneration Report included in the directors' report for the year ended 30 June 2013. The directors of the company are responsible for the preparation and presentation of the Remuneration Report in accordance with section 300A of the Corporations Act 2001. Our responsibility is to express an opinion on the Remuneration Report, based on our audit conducted in accordance with Australian Auditing Standards.
Opinion
In our opinion, the Remuneration Report of Sandfire Resources NL for the year ended 30 June 2013, complies with section 300A of the Corporations Act 2001.
Ernst & Young D S Lewsen Partner Perth 28 August 2013

112 / SANDFIRE ANNUAL REPORT 2013
The Board of Directors of Sandfire Resources NL (Sandfire or the Company) is responsible for establishing the corporate governance framework of the Company having regard to the ASX Corporate Governance Council (CGC) published guidelines as well as its corporate governance principles and recommendations. The Board guides and monitors the business and affairs of the Company on behalf of the shareholders by whom they are elected and to whom they are accountable.
Various corporate governance practices are discussed within this statement. For further information on corporate governance policies adopted by the Company, refer to our website: www.sandfire.com.au.
The Company’s corporate governance practices were in place throughout the year ended 30 June 2013, unless noted elsewhere within this report.
PRINCIPLE 1 LAY SOLID FOUNDATIONS FOR MANAGEMENT AND OVERSIGHT
Recommendation Comply
1.1 Companies should establish the functions reserved to the Board and those delegated to senior executives and disclose those functions.
Yes
1.2 Companies should disclose the process for evaluating the performance of senior executives. Yes
1.3 Companies should provide the information indicated in the guide to reporting on Principle 1. Yes
The Board has adopted a written Charter to provide a framework for the effective operation of the Board which sets out:
the Board’s composition;
the Board’s role and responsibilities;
delegation of duties and powers;
Board process; and
review and performance evaluation.
Specialist committees are able to focus on a particular responsibility and provide informed feedback to the Board. To this end the Board has established the following committees:
Audit and Risk; and
Remuneration and Nomination.
The roles and responsibilities of these committees are discussed throughout this corporate governance statement.
The Board’s role is to:
represent and serve the interests of shareholders by overseeing and appraising the Company’s strategies, policies and performance. This includes overseeing the financial and human resources the Company has in place to meet its objectives, as well as reviewing management performance;
protect and optimise Company performance and build sustainable value for shareholders in accordance with any duties and obligations imposed on the Board by law and the Company’s constitution and with a framework or prudent and effective controls that enable risk to be assessed and managed;
set, review and ensure compliance with the Company’s values and governance framework (including establishing and observing high ethical standards); and
ensure shareholders are kept informed of the Company’s performance and major developments affecting its state of affairs.
Matters which are specifically reserved for the Board or its committees include:
appointment of a Chair;
appointment and removal of Managing Director and Chief Executive Officer;
appointment of Directors to fill a vacancy or as additional Director;
establishment of Board committees, their membership and delegated authorities;
approval of dividends;
approval of major capital expenditure, acquisitions and divestitures in excess of authority levels delegated to management;
calling of meetings of shareholders; and
any other specific matters nominated by the Board from time to time.
CORPORATE GOVERNANCE STATEMENT

SANDFIRE ANNUAL REPORT 2013 / 113
Each Director of the Company has entered into a formal letter of appointment which clearly sets out what is expected of each Director. Senior executives have service agreements containing detailed duties and responsibilities which are complimented by key performance indicators. The performance of the key executives is reviewed regularly against both measurable and qualitative indicators.
During the reporting period, the Remuneration and Nomination committee conducted performance evaluations that involve an assessment of each senior executive’s performance against specific and measurable qualitative and quantitative performance criteria. The performance criteria against which executives are assessed are aligned with the financial and non-financial objectives of Sandfire.
PRINCIPLE 2 STRUCTURE THE BOARD TO ADD VALUE
Recommendation Comply
2.1 A majority of the Board should be independent directors. No
2.2 The chair should be an independent director. Yes
2.3 The roles of chair and chief executive officer (CEO) should not be exercised by the same individual. Yes
2.4 The Board should establish a nomination committee. Yes
2.5 Companies should disclose the process for evaluating the performance of the Board, its committees and individual directors.
Yes
2.6 Companies should provide the information indicated in the guide to reporting on Principle 2. Yes
The skills, experience and expertise held by each director in office at the date of the financial report are included in the directors’ report. Directors of Sandfire are considered to be independent when they are independent of management and free from any business or other relationship that could materially interfere with – or could reasonably be perceived to materially interfere with – the exercise of their unfettered and independent judgement. The Board will consider the materiality of any given relationship on a case-by-case basis and has adopted guidelines to assist in this regard. The Board, guided by the Board Charter, considers thresholds of materiality for the purposes of determining independence in accordance with ASX Recommendations, having regard to both quantitative and qualitative principles. An item is presumed to be quantitatively immaterial if it is equal to or less than 5% of the appropriate base amount. It is presumed to be material (unless there is qualitative evidence to the contrary) if it is equal to or greater than 10% of the appropriate base amount.
In accordance with the definition of independence above, and the materiality thresholds set, the following directors of Sandfire are considered to be independent:
Name Position
Derek La Ferla Non-executive chairman (appointed 17 May 2010)
Robert N Scott Non-executive director (appointed 30 July 2010)
Paul D Hallam Non-executive director (appointed 21 May 2013)
Accordingly, the Board does not consist of a majority of independent directors. The Sandfire Board consists of six directors and three are considered independent. The Board acknowledges the Corporate Governance Council’s recommendation that the majority of the Board should be comprised of independent directors. The Board appointed Mr Hallam, an independent non-executive director, on 21 May 2013. The Board will continue to appoint additional independent non-executive directors, as appropriate, with relevant corporate and industry experience to further strengthen its Board and guide its corporate and development strategy.
The roles of chair and chief executive officer (CEO) are not exercised by the same individual.

114 / SANDFIRE ANNUAL REPORT 2013
Remuneration and Nomination Committee
The Board has established a Remuneration and Nomination committee, which meets at least twice annually, and comprises non-executive directors, with a majority of independent directors.
The Remuneration and Nomination committee comprised the following members throughout the year:
Name Position Period
Derek La Ferla Committee Chairman, Non-executive director (Independent) All financial year
Robert N Scott Non-executive director (Independent) All financial year
Paul D Hallam Non-executive director (Independent) Appointed 4 June 2013
Soocheol Shin Non-executive director (Not Independent) Resigned 4 June 2013
The main functions of the Committee in relation to Nomination are to assist the Board with establishing a Board of effective composition, size, diversity, expertise and commitment to adequately discharge its responsibilities and duties, and assist the Board as required in relation to performance evaluation of the Board, its committees and individual directors.
The performance of the Board is reviewed regularly against both measurable and qualitative indicators. During the reporting period, the Remuneration and Nomination committee conducted performance evaluations that involves an assessment of each board member’s and key executive’s performance against specific and measurable qualitative and quantitative performance criteria. The performance criteria against which directors are assessed are aligned with the financial and non-financial objectives of Sandfire. The Remuneration and Nomination committee has determined that board performance evaluations should be undertaken with the assistance of consultants. Directors whose performance is consistently unsatisfactory may be asked to retire.
PRINCIPLE 3 PROMOTE ETHICAL AND RESPONSIBLE DECISION-MAKING
Recommendation Comply
3.1 Companies should establish a code of conduct and disclose the code or a summary of the code as to:
the practices necessary to maintain confidence in the company’s integrity;
the practices necessary to take into account their legal obligations and the reasonable
expectations of their stakeholders; and
the responsibility and accountability of individuals for reporting and investigating
reports of unethical practices.
Yes
3.2 Companies should establish a policy concerning diversity and disclose the policy or a summary of that
policy. The policy should include requirements for the Board to establish measurable objectives for
achieving gender diversity and for the Board to assess annually both the objectives and progress in
achieving them.
Yes
3.3 Companies should disclose in each annual report the measurable objectives for achieving gender diversity
set by the Board in accordance with the diversity policy and progress towards achieving them.
Yes
3.4 Companies should disclose in each annual report the proportion of women employees in the whole
organisation, women in senior executive positions and women on the Board.
Yes
3.5 Companies should provide the information indicated in the Guide to reporting on Principle 3. Yes
Code of Conduct
The Board recognises the need to observe the highest standards of corporate practice and business conduct. Accordingly, the Board has established a Code of Conduct which applies to directors, employees, temporary employees and contractors of Sandfire.
They key principles underpinning the Code of Conduct are:
our actions must be governed by the highest standards of integrity and fairness;
our decisions must be made in accordance with the spirit and letter of applicable law; and
our business must be conducted honestly and ethically, with our best skills and judgement, and for the benefit of our people, clients, shareholders, stakeholders and Sandfire alike.
CORPORATE GOVERNANCE STATEMENT (continued)
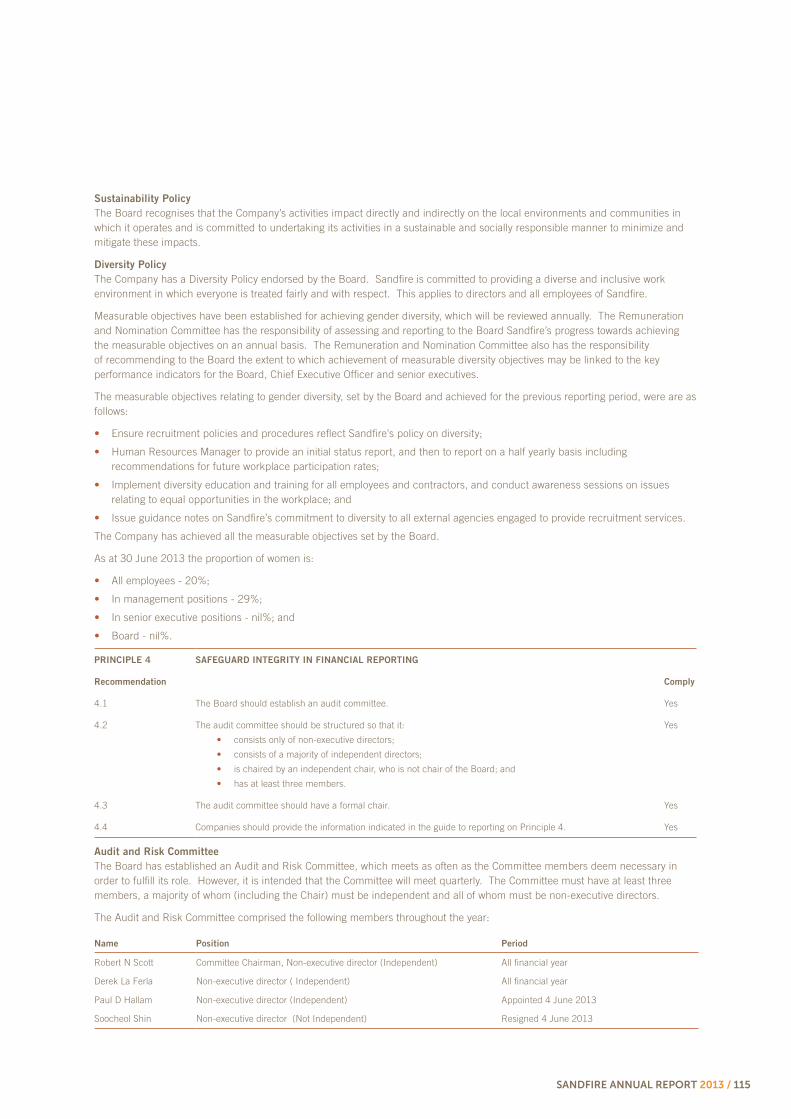
SANDFIRE ANNUAL REPORT 2013 / 115
Sustainability Policy
The Board recognises that the Company’s activities impact directly and indirectly on the local environments and communities in which it operates and is committed to undertaking its activities in a sustainable and socially responsible manner to minimize and mitigate these impacts.
Diversity Policy
The Company has a Diversity Policy endorsed by the Board. Sandfire is committed to providing a diverse and inclusive work environment in which everyone is treated fairly and with respect. This applies to directors and all employees of Sandfire.
Measurable objectives have been established for achieving gender diversity, which will be reviewed annually. The Remuneration and Nomination Committee has the responsibility of assessing and reporting to the Board Sandfire’s progress towards achieving the measurable objectives on an annual basis. The Remuneration and Nomination Committee also has the responsibility of recommending to the Board the extent to which achievement of measurable diversity objectives may be linked to the key performance indicators for the Board, Chief Executive Officer and senior executives.
The measurable objectives relating to gender diversity, set by the Board and achieved for the previous reporting period, were are as follows:
Ensure recruitment policies and procedures reflect Sandfire’s policy on diversity;
Human Resources Manager to provide an initial status report, and then to report on a half yearly basis including recommendations for future workplace participation rates;
Implement diversity education and training for all employees and contractors, and conduct awareness sessions on issues relating to equal opportunities in the workplace; and
Issue guidance notes on Sandfire’s commitment to diversity to all external agencies engaged to provide recruitment services.
The Company has achieved all the measurable objectives set by the Board.
As at 30 June 2013 the proportion of women is:
All employees - 20%;
In management positions - 29%;
In senior executive positions - nil%; and
Board - nil%.
PRINCIPLE 4 SAFEGUARD INTEGRITY IN FINANCIAL REPORTING
Recommendation Comply
4.1 The Board should establish an audit committee. Yes
4.2 The audit committee should be structured so that it:
consists only of non-executive directors;
consists of a majority of independent directors;
is chaired by an independent chair, who is not chair of the Board; and
has at least three members.
Yes
4.3 The audit committee should have a formal chair. Yes
4.4 Companies should provide the information indicated in the guide to reporting on Principle 4. Yes
Audit and Risk Committee
The Board has established an Audit and Risk Committee, which meets as often as the Committee members deem necessary in order to fulfill its role. However, it is intended that the Committee will meet quarterly. The Committee must have at least three members, a majority of whom (including the Chair) must be independent and all of whom must be non-executive directors.
The Audit and Risk Committee comprised the following members throughout the year:
Name Position Period
Robert N Scott Committee Chairman, Non-executive director (Independent) All financial year
Derek La Ferla Non-executive director ( Independent) All financial year
Paul D Hallam Non-executive director (Independent) Appointed 4 June 2013
Soocheol Shin Non-executive director (Not Independent) Resigned 4 June 2013

116 / SANDFIRE ANNUAL REPORT 2013
CORPORATE GOVERNANCE STATEMENT (continued)
The Committee’s key responsibilities and functions are to:
oversee the Company’s relationship with the external auditor and the external audit function generally;
oversee the preparation of the financial statements and reports;
oversee the Company’s financial controls and systems; and
oversee the process of identification and management of financial risk and operational risk.
Under the Charter it is the policy of Sandfire that its external auditing firm must be independent of it. The Committee will review and assess the independence of the external auditor on an annual basis. The Charter contains an “External Audit Policy”, which provides information on procedures for the selection and appointment of the external auditor, and for the rotation of external audit engagement partners, presently every 5 years.
PRINCIPLE 5 MAKE TIMELY AND BALANCED DISCLOSURE
Recommendation Comply
5.1 Companies should establish written policies designed to ensure compliance with ASX Listing Rule
disclosure requirements and to ensure accountability at a senior executive level for that compliance and
disclose those policies or a summary of those policies.
Yes
5.2 Companies should provide the information indicated in the guide to reporting on Principle 5. Yes
Disclosure and Communication Policy
The Board has endorsed at Disclosure and Communication Policy, which establishes procedures aimed at ensuring that directors and management are aware of and fulfill their obligations in relation to the timely disclosure of material price sensitive information.
Policy for Dealing in Securities
Sandfire has adopted a Policy for Dealing in Securities which explains the prohibited types of conduct in relation to dealings in securities under the Corporations Act and to establish a best practice procedure in relation to dealings by Directors, management and personnel.
Subject to the overriding restriction that persons may not deal in the Company’s securities while they are in possession of materially price sensitive information, directors, management and personnel are not permitted to deal in the Company’s securities during the following “blackout periods”:
from the close of trading on the ASX on 30 June each year, or if that date is not a trading day, the last trading day before that day, until the close of trading on the day following the announcement to ASX of the Company’s full year results;
from the close of trading on the ASX on 31 December each year, or if that date is not a trading day, the last trading day before that day, until close of trading on the day following the announcement of the Company’s half-yearly results;
from the close of trading on the ASX on 30 September or 31 March, or if that date is not a trading day, the last trading day before that day, until close of trading on the day following the announcement of the Company’s quarterly reports; and
any other period that the Board specifies from time to time.
Outside of these periods, directors and management must receive clearance for any proposed dealing in the Company’s securities. In all instances, buying or selling shares is not permitted at any time by any person who possesses price sensitive information.
PRINCIPLE 6 RESPECT THE RIGHTS OF SHAREHOLDERS
Recommendation Comply
6.1 Companies should design a communications policy for promoting effective communication with
shareholders and encouraging their participation at general meetings and disclose their policy or a
summary of that policy.
Yes
6.2 Companies should provide the information indicated in the Guide on reporting on Principle 6. Yes
The Board has endorsed a Shareholder Communication Strategy. The Company aims to ensure that shareholders are kept informed of all major developments affecting the state of affairs of the Company. Additionally, the Company recognises that potential

SANDFIRE ANNUAL REPORT 2013 / 117
investors and other interested stakeholders may wish to obtain information about the Company from time to time. To achieve this, the Company communicates information regularly to shareholders and other stakeholders through a range of forums and publications.
One of the Company’s key communication tools is its website located at www.sandfire.com.au. The “investor section” of the website includes details of the following:
the Company’s Constitution;
the Company’s Board and Board Committee Charters;
the Company’s core corporate governance policies;
press releases, external presentation and announcements made by the Company;
analysts research papers; and
financial information about the Company.
The website also contains a facility for shareholders to direct inquiries to the Company, and to elect to receive communications from the Company via email (or to elect to discontinue receiving email communications from the Company).
Forums or measures for communicating the following important aspects of the Company’s affairs include:
Notice of meeting;
Annual General Meeting;
Annual Report;
announcements lodged with the ASX; and
presentations.
The Company provides a telephone helpline facility (+61 (8) 6430 3800) and an online e-mail inquiry service to assist shareholders with any queries. Information is also communicated to shareholders via periodic mail outs, or by email to shareholders who have provided their e-mail address.
Note that the Company’s external auditor will attend the AGM and be available to answer shareholder questions about the conduct of the audit and the preparation and content of the auditor’s report. The external auditor will also be allowed a reasonable opportunity to answer written questions submitted by shareholders to the auditor as permitted under the Corporations Act.
PRINCIPLE 7 RECOGNISE AND MANAGE RISK
Recommendation Comply
7.1 Companies should establish policies for the oversight and management of material business risks and
disclose a summary of those policies.
Yes
7.2The Board should require management to design and implement the risk management and internal control
system to manage the Company’s material business risks and report to it on whether those risks are being
managed effectively. The Board should disclose that management has reported to it as to the effectiveness
of the Company’s management of its material business risks.
Yes
7.3 The Board should disclose whether it has received assurance from the CEO [or equivalent] and the Chief
Financial Officer (CFO) [or equivalent] that the declaration provided in accordance with section 295A of
the Corporations Act is founded on a sound system of risk management and internal control and that the
system is operating effectively in all material respects in relation to financial reporting risks.
Yes
7.4 Companies should provide the information indicated in the guide to reporting on Principle 7. Yes

118 / SANDFIRE ANNUAL REPORT 2013
Governance and Risk Management Policy
Sandfire has adopted a Governance and Risk Management Policy. The Board is committed to reviewing and overseeing the risk management strategy for Sandfire and for ensuring the Company has an appropriate corporate governance structure, in order to support the achievement of business objectives.
The identification and effective management of risk, including calculated risk-taking is viewed as an essential part of the Company’s approach to creating long-term shareholder value.
The Board determines the Company’s risk profile and is responsible for overseeing and approving risk management strategy and policies, internal compliance and internal control. The Board oversees an annual assessment of the effectiveness of risk management and internal compliance and control. The tasks of undertaking and assessing risk management and internal control effectiveness are delegated to the Audit and Risk Committee.
Management through the CEO is responsible for the day to day design and implementation of the Company’s risk management and internal control system. Management reports to the Board on the Company’s key risks and the extent to which it believes these risks are being adequately managed.
The Board has a number of mechanisms in place to ensure that management’s objectives and activities are aligned with the risks identified by the Board. These include the following:
board approval of strategic planning, which encompasses the Company’s vision, mission and strategy statements, designed to meet stakeholders’ needs and manage business risk;
implementation of Board approved operating plans and budgets and Board monitoring of progress against these budgets, including the establishment and monitoring of key performance indicators of both a financial and non-financial nature; and
underpinning these efforts is a comprehensive set of policies and procedures directed towards achieving the following objectives in relation to the requirements of Principle 7:
effectiveness and efficiency in the use of the Company’s resources;
compliance with applicable laws and regulations; and
preparation of reliable published financial information.
CEO and CFO Certification
In accordance with section 295A of the Corporations Act, the CEO and CFO have provided a written statement to the Board that:
their view provided on the Company’s financial report is founded on a sound system of risk management and internal compliance and control which implements the financial policies adopted by the Board; and
the Company’s risk management and internal compliance and control system is operating effectively in all material respects.
The Board agrees with the views of the ASX on this matter and notes that due to its nature, internal control assurance from the CEO and CFO can only be reasonable rather than absolute. This is due to such factors as the need for judgement, the use of testing on a sample basis, the inherent limitations in internal control and because much of the evidence available is persuasive rather than conclusive and therefore is not and cannot be designed to detect all weaknesses in control procedures.
PRINCIPLE 8 REMUNERATE FAIRLY AND RESPONSIBLY
Recommendation Comply
8.1 The Board should establish a remuneration committee. Yes
8.2 The remuneration committee should be structured so that it: consists of a majority of independent directors;
is chaired by an independent Chair; and
has at least three members.
Yes
8.3 Companies should clearly distinguish the structure of non-executive directors’ remuneration from that of executive directors and senior executives.
Yes
8.4 Companies should provide the information indicated in the guide to reporting on Principle 8. Yes
CORPORATE GOVERNANCE STATEMENT (continued)

SANDFIRE ANNUAL REPORT 2013 / 119
Remuneration and Nomination Committee
The main functions of the Committee in relation to Remuneration are to assist the Board with establishing a Board of effective composition, size, diversity, expertise and commitment to adequately discharge its responsibilities and duties, and assist the Board as required in relation to performance evaluation of the Board, its committees and individual directors.
It is the Company’s objective to provide maximum stakeholder benefit from the retention of a high quality Board and executive team by remunerating directors and key executives fairly and appropriately with reference to relevant employment market conditions.
To assist in achieving this objective, the Remuneration and Nomination Committee links the nature and amount of executive directors’ and executives’ remuneration to the Company’s financial and operational performance. The expected outcomes of the remuneration structure are:
retention and motivation of key executives;
attraction of high quality management to the Company; and
performance incentives that allow executives to share in the success of Sandfire Resources NL.
For a full discussion of the Company’s remuneration philosophy and framework and the remuneration received by directors and executives in the current period please refer to the Remuneration Report, which is contained within the Directors’ Report.
There is no scheme to provide retirement benefits to non-executive directors.

120 / SANDFIRE ANNUAL REPORT 2013
ASX ADDITIONAL INFORMATION
Additional shareholder information required by the Australian Securities Exchange Limited Listing Rules and not disclosed elsewhere in this report is set out below.
Capital
Share capital comprised 155,640,968 fully paid ordinary shares on 4 October 2013.
Shareholder details
At 4 October 2013 the Company had 3,728 holders of ordinary fully paid shares.
Distribution of equity security holders at 4 October 2013
Ranges Number of investors Number of shares Issued capital (%)
1 – 1,000 1,676 730,994 0.47
1,001 – 5,000 1,343 3,414,726 2.19
5,001 – 10,000 320 2,451,498 1.58
10,001 – 100,000 326 8,720,374 5.60
100,001 – and over 63 140,323,376 90.16
The number of ordinary fully paid shareholders holding less than a marketable parcel at 4 October 2013 was 342.
Ordinary fully paid shareholders – Top 20 investors at 4 October 2013
Holder Name Number of shares %
OZ Minerals Investments Pty Ltd 29,915,090 19.22
POSCO Australia Pty Ltd 23,756,338 15.26
JP Morgan Nominees Australia Ltd 21,975,983 14.12
National Nominees Ltd 21,134,648 13.58
HSBC Custody Nominees Australia Ltd 10,505,290 6.75
Citicorp Nominees Pty Ltd 5,716,127 3.67
BNP Paribas Nominees Pty Ltd 3,222,500 2.07
Tongaat Pty Ltd 2,409,984 1.55
AMP Life Ltd 2,091,998 1.34
Resource Development Company Pty Ltd 1,886,786 1.21
Kape Securities Pty Ltd 1,554,750 1.00
UBS Nominees Pty Ltd 1,420,800 0.91
Feldkirchen Pty Ltd 1,148,800 0.74
UBS Wealth Management Australia Nominees Pty Ltd 1,132,261 0.73
JP Morgan Nominees Australia Ltd 949,841 0.61
Citicorp Nominees Pty Ltd 923,257 0.59
CS Fourth Nominees Pty Ltd 804,541 0.52
Mr William John Evans and Mrs Carolina Maria Theresia Evans 665,215 0.43
Mr William John Evans 650,000 0.42
HSBC Custody Nominees Australia Ltd 559,388 0.36
Total 132,423,597 83.15

SANDFIRE ANNUAL REPORT 2013 / 121
Substantial shareholders of Sandfire Resources NL
National Australia Bank Ltd advised that as at 3 July 2013, it and its associates had an interest in 9,469,496 shares, which represented 6.084% of Sandfire capital at that time.
POSCO Australia Pty Ltd advised that as at 14 March 2013, it and its associates had an interest in 23,756,338 shares, which represented 15.46% of Sandfire capital at that time.
OZ Minerals Ltd advised that as at 2 February 2011, it and its associates had an interest in 28,021,018 shares, which represented 18.89% of Sandfire capital at that time.
Voting rights
The voting rights to security holders of the Company are set out in the Company’s Constitution and, in summary, each member has one vote for each fully paid share held by the member in the Company. Holders of options do not have voting rights.
Unquoted options on issue at 4 October 2013
Expiry Date Exercise Price Number Holders
12 July 2013 $0.60 210,000 1
12 July 2013 $0.80 980,000 2
12 July 2013 $1.00 1,600,000 2
27 November 2014 $4.66 330,000 3
27 November 2014 $5.44 330,000 3
27 November 2014 $6.22 330,000 3
15 June 2015 $3.80 70,833 2
15 June 2015 $4.40 200,000 2
15 June 2015 $5.00 333,335 3
28 February 2016 $9.00 1,499,995 12
28 February 2016 $10.30 1,416,665 12
28 February 2016 $11.70 1,333,340 12
On-market buy back
The Company does not have a current buy-back plan.

122 / SANDFIRE ANNUAL REPORT 2013
IMPORTANT INFORMATION AND DISCLAIMER
Competent Person’s Statement – Mineral Resources and Open Pit Ore Reserves
The information in this report that relates to Mineral Resources and Open Pit Ore Reserves is based on information compiled by Mr. Ekow Taylor who is a Member of The Australasian Institute of Mining and Metallurgy. Mr. Taylor is a permanent employee of Sandfire Resources and has sufficient experience that is relevant to the style of mineralization and type of deposit under consideration and to the activity which he is undertaking to qualify as Competent Person as defined in the 2012 Edition of the Australasian Code for Reporting of Exploration Results, Mineral Resources and Ore Reserves. Mr Taylor consents to the inclusion in the report of the matters based on his information in the form and context in which it appears.
Competent Person’s Statement – Underground Ore Reserves
The information in this report that relates to Underground Ore Resources is based on information compiled by Mr Shane McLeay who is a Fellow of The Australasian Institute of Mining and Metallurgy. Mr. McLeay is a permanent employee of Entech Pty Ltd and has sufficient experience that is relevant to the style of mineralization and type of deposit under consideration and to the activity which he is undertaking to qualify as Competent Person as defined in the 2012 Edition of the Australasian Code for Reporting of Exploration Results, Mineral Resources and Ore Reserves. Mr McLeay consents to the inclusion in the report of the matters based on his information in the form and context in which it appears.
Forward-Looking Statements
Certain statements made during or in connection with this statement contain or comprise certain forward-looking statements regarding Sandfire’s Mineral Resources and Reserves, exploration operations, project development operations, production rates, life of mine, projected cash flow, capital expenditure, operating costs and other economic performance and financial condition as well as general market outlook. Although Sandfire believes that the expectations reflected in such forward-looking statements are reasonable, such expectations are only predictions and are subject to inherent risks and uncertainties which could cause actual values, results, performance or achievements to differ materially from those expressed, implied or projected in any forward looking statements and no assurance can be given that such expectations will prove to have been correct. Accordingly, results could differ materially from those set out in the forward-looking statements as a result of, among other factors, changes in economic and market conditions, delays or changes in project development, success of business and operating initiatives, changes in the regulatory environment and other government actions, fluctuations in metals prices and exchange rates and business and operational risk management. Except for statutory liability which cannot be excluded, each of Sandfire, its officers, employees and advisors expressly disclaim any responsibility for the accuracy or completeness of the material contained in this statement and excludes all liability whatsoever (including in negligence) for any loss or damage which may be suffered by any person as a consequence of any information in this statement or any error or omission. Sandfire undertakes no obligation to update publicly or release any revisions to these forward-looking statements to reflect events or circumstances after today’s date or to reflect the occurrence of unanticipated events other than required by the Corporations Act and ASX Listing Rules. Accordingly you should not place undue reliance on any forward looking statement.
Exploration and Resource Targets
Any discussion in relation to the potential quantity and grade of Exploration Targets is only conceptual in nature. While Sandfire is confident that it will report additional JORC compliant resources for the DeGrussa Project, there has been insufficient exploration to define mineral resources in addition to the current JORC compliant Mineral Resource inventory and it is uncertain if further exploration will result in the determination of additional JORC compliant Mineral Resources.
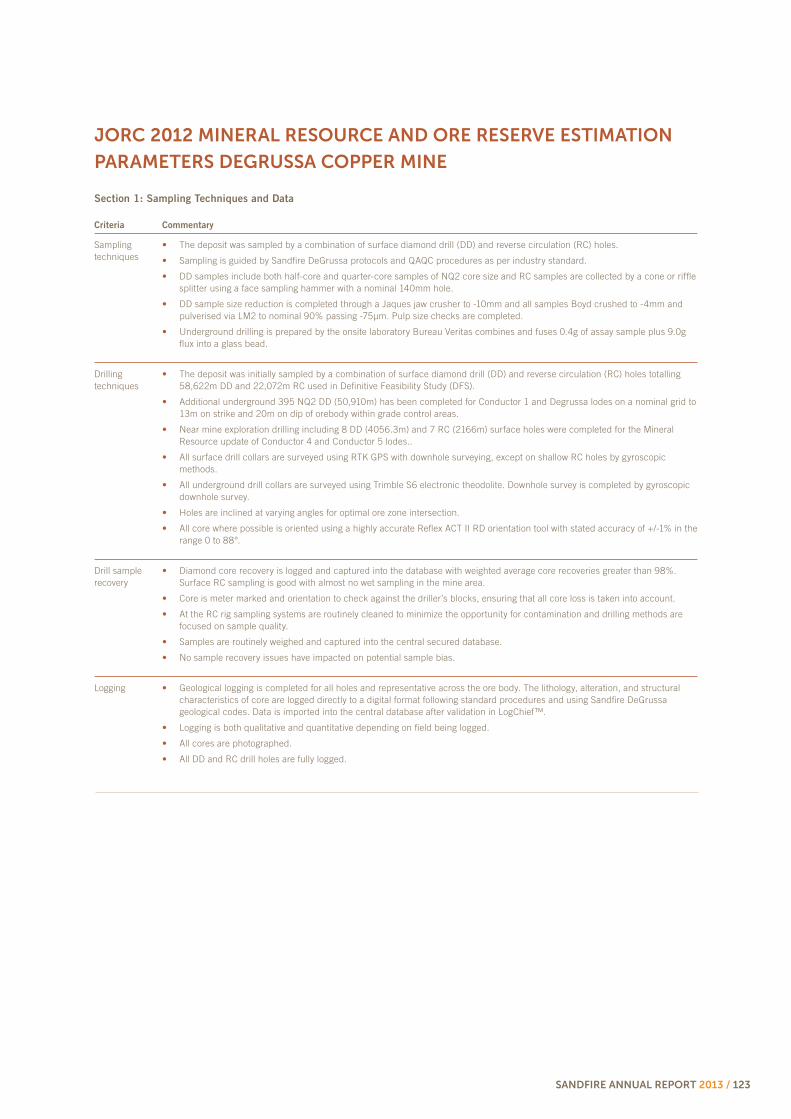
SANDFIRE ANNUAL REPORT 2013 / 123
JORC 2012 MINERAL RESOURCE AND ORE RESERVE ESTIMATION
PARAMETERS DEGRUSSA COPPER MINE
Section 1: Sampling Techniques and Data
Criteria Commentary
Sampling techniques
The deposit was sampled by a combination of surface diamond drill (DD) and reverse circulation (RC) holes.
Sampling is guided by Sandfire DeGrussa protocols and QAQC procedures as per industry standard.
DD samples include both half-core and quarter-core samples of NQ2 core size and RC samples are collected by a cone or riffle splitter using a face sampling hammer with a nominal 140mm hole.
DD sample size reduction is completed through a Jaques jaw crusher to -10mm and all samples Boyd crushed to -4mm and pulverised via LM2 to nominal 90% passing -75μm. Pulp size checks are completed.
Underground drilling is prepared by the onsite laboratory Bureau Veritas combines and fuses 0.4g of assay sample plus 9.0g flux into a glass bead.
Drilling techniques
The deposit was initially sampled by a combination of surface diamond drill (DD) and reverse circulation (RC) holes totalling 58,622m DD and 22,072m RC used in Definitive Feasibility Study (DFS).
Additional underground 395 NQ2 DD (50,910m) has been completed for Conductor 1 and Degrussa lodes on a nominal grid to 13m on strike and 20m on dip of orebody within grade control areas.
Near mine exploration drilling including 8 DD (4056.3m) and 7 RC (2166m) surface holes were completed for the Mineral Resource update of Conductor 4 and Conductor 5 lodes..
All surface drill collars are surveyed using RTK GPS with downhole surveying, except on shallow RC holes by gyroscopic methods.
All underground drill collars are surveyed using Trimble S6 electronic theodolite. Downhole survey is completed by gyroscopic downhole survey.
Holes are inclined at varying angles for optimal ore zone intersection.
All core where possible is oriented using a highly accurate Reflex ACT II RD orientation tool with stated accuracy of +/-1% in the range 0 to 88°.
Drill sample recovery
Diamond core recovery is logged and captured into the database with weighted average core recoveries greater than 98%. Surface RC sampling is good with almost no wet sampling in the mine area.
Core is meter marked and orientation to check against the driller’s blocks, ensuring that all core loss is taken into account.
At the RC rig sampling systems are routinely cleaned to minimize the opportunity for contamination and drilling methods are focused on sample quality.
Samples are routinely weighed and captured into the central secured database.
No sample recovery issues have impacted on potential sample bias.
Logging Geological logging is completed for all holes and representative across the ore body. The lithology, alteration, and structural characteristics of core are logged directly to a digital format following standard procedures and using Sandfire DeGrussa geological codes. Data is imported into the central database after validation in LogChief™.
Logging is both qualitative and quantitative depending on field being logged.
All cores are photographed.
All DD and RC drill holes are fully logged.

124 / SANDFIRE ANNUAL REPORT 2013
Criteria Commentary
Sub-sampling techniques and sample preparation
Core orientation is completed where possible and all are marked prior to sampling. Half core samples are produced using Almonte Core Saw. Samples are weighed and recorded. Some quarter core samples have been used and statistical test work has shown them to be representative.
RC samples are split using a cone or riffle splitter.
A majority of RC samples are dry. On the occasion that wet samples are encountered, they are dried prior to splitting with a riffle splitter.
Underground and open pit sample preparation at the onsite laboratory involves the original sample being dried at 80° for up to 24 hours and weighed on submission to laboratory. Sample is then crushed through Jaques crusher to nominal -10mm (DD samples only). Second stage crushing uses Boyd crusher to nominal -4mm (both RC and DD samples). Sample is split to less than 2kg through linear splitter and excess retained for for metallurgical work. Sample splits are weighed at a frequency of 1/20 and entered into the job results file. Pulverising is completed using LM2 mill to 90% passing 75%μm. Two lots of packets are retained for on-site laboratory services whilst the pulverised residue is shipped to Ultra Trace in Perth for further analysis.
Sample preparation at Ultra Trace involves the sample being dried at 80° for up to 24 hours and weighed. DD samples are then crushed through a Jaques crusher to nominal -10mm. Second stage crushing uses Boyd crusher to a nominal -4mm. All RC samples are Boyd crushed to -4mm. Samples are then split to less than 2kg through linear splitter and excess retained. Sample splits are weighed at a frequency of 1/20 and entered into the job. Pulverising is completed using LM2 mill to 90% passing 75%μm. Size at a minimum of 1 per batch. 1.5kg of rock quartz is pulverised at every 10th sample.
Sandfire DeGrussa has protocols that cover auditing of sample preparation at the laboratories and the collection and assessment of data to ensure accurate steps in producing representative samples for the analytical process. Key performance indices include contamination index of 90% (that is 90% blanks pass); Crush Size index of P95-10mm; Grind Size index of P90-75μm and Check Samples returning at worse 20% precision at 95% confidence interval and bias of 5% or better.
Duplicate analysis has been completed and identified no issues with sampling representatively.
Test work on half-core versus quarter-core has been completed with results confirming that sampling at either core size is representative of the in situ material.
The sample size is considered appropriate for the Massive Sulphide mineralization style.
Quality of assay data and laboratory tests
Samples submitted to Ultra Trace in Perth are assayed using Mixed 4 Acid Digest (MAD) 0.3g charge and MAD Hotbox 0.15g charge methods with ICPOES or ICPMS. The samples are digested and refluxed with a mixture of acids including Hydrofluoric, Nitric, Hydrochloric and Perchloric acids and conducted for multi elements including Cu, Pb, Zn, Ag, As, Fe, S, Sb, Bi, Mo, Re, Mn, Co, Cd, Cr, Ni, Se, Te, Ti, Zr, V, Sn, W and Ba. The MAD Hotbox method is an extended digest method that approaches a total digest for many elements however some refractory minerals are not completely attacked. The elements S, Cu, Zn, Co, Fe, Ca, Mg, Mn, Ni, Cr, Ti, K, Na, V are determined by ICPOES, and Ag, Pb, As, Sb, Bi, Cd, Se, Te, Mo, Re, Zr, Ba, Sn, W are determined by ICPMS. Samples are analysed for Au, Pd and Pt by firing a 40g of sample. Lower sample weights are employed where samples have very high S contents. This is a classical FA process and results in total separation of Au, Pt and Pd in the samples
Samples submitted to the onsite laboratory have 0.4g of sample plus 9.0g flux combined and fused into a glass bead. XRF is used to analyse for a suite of elements (including Cu, Fe, SiO2, Al, Ca, MgO, P, Ti, Mn, Co, Ni, Zn, As, and Pb). Pulps are dispatched to Ultra Trace in Perth for ICPOES or ICPMS for extended elements (including Cu, Fe, As, Pb, S, Zn, Fe, Ag, Sb, Bi, Cd, Cl, F, and Hg). Au, Pt, and Pd analysed by FA/ASS on a 40g assay charge (assay charge is variable depending on Sulphur content).
Handheld XRF units are used as grade control tools to delineate ore boundaries and grades in the field and for exploration for alteration minerals. These units are fit for this purpose. Handheld XRF results are not used in the Mineral Resource estimation.
Sandfire DeGrussa QAQC protocol is considered industry standard with standard reference material (SRM) submitted on regular basis with routine samples.
SRMs and blanks are inserted at a minimum of 5% frequency rate. A minimum of 2% of assays are routinely re-submitted as Check Assays and Check Samples through blind submittals to external and primary laboratories respectively. Adhoc umpire checks are done.
QAQC data returned is automatically checked against set pass/fail limits within SQL database and are either passed or failed on import. On import a first pass automatic QAQC report is generated and sent to QAQC Geologists for recommended action.
QAQC data analysis has been completed for all data and demonstrates sufficient accuracy and precision for use in Mineral Resource estimation.
Verification of sampling and assaying
Significant intersections have been verified by alternative company personnel.
There are no twinned holes drilled for the DeGrussa Mineral Resource.
Primary data are captured on field tough book laptops using Logchief™ Software. The software has validation routines and data is then imported into a secure central database.
The primary data is always kept and is never replaced by adjusted or interpreted data.
JORC 2012 MINERAL RESOURCE AND ORE RESERVE ESTIMATION
PARAMETERS DEGRUSSA COPPER MINE (continued)
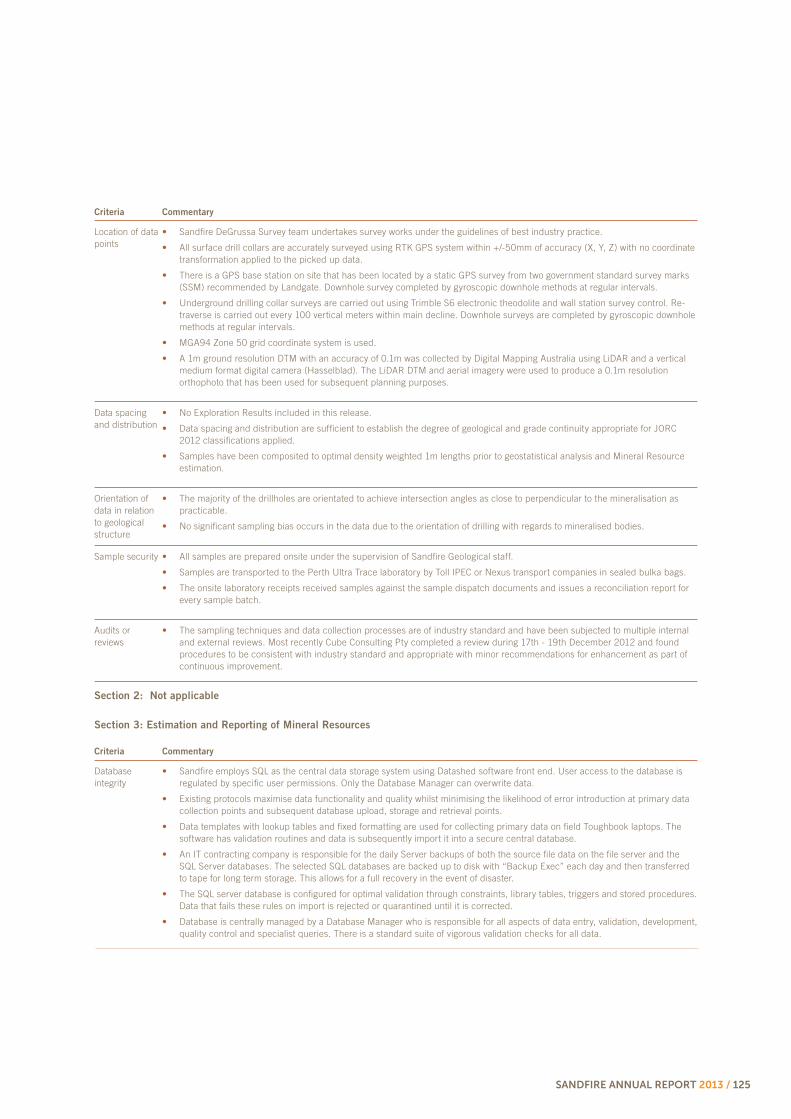
SANDFIRE ANNUAL REPORT 2013 / 125
Criteria Commentary
Location of data points
Sandfire DeGrussa Survey team undertakes survey works under the guidelines of best industry practice.
All surface drill collars are accurately surveyed using RTK GPS system within +/-50mm of accuracy (X, Y, Z) with no coordinate transformation applied to the picked up data.
There is a GPS base station on site that has been located by a static GPS survey from two government standard survey marks (SSM) recommended by Landgate. Downhole survey completed by gyroscopic downhole methods at regular intervals.
Underground drilling collar surveys are carried out using Trimble S6 electronic theodolite and wall station survey control. Re-traverse is carried out every 100 vertical meters within main decline. Downhole surveys are completed by gyroscopic downhole methods at regular intervals.
MGA94 Zone 50 grid coordinate system is used.
A 1m ground resolution DTM with an accuracy of 0.1m was collected by Digital Mapping Australia using LiDAR and a vertical medium format digital camera (Hasselblad). The LiDAR DTM and aerial imagery were used to produce a 0.1m resolution orthophoto that has been used for subsequent planning purposes.
Data spacing and distribution
No Exploration Results included in this release.
Data spacing and distribution are sufficient to establish the degree of geological and grade continuity appropriate for JORC 2012 classifications applied.
Samples have been composited to optimal density weighted 1m lengths prior to geostatistical analysis and Mineral Resource estimation.
Orientation of data in relation to geological structure
The majority of the drillholes are orientated to achieve intersection angles as close to perpendicular to the mineralisation as practicable.
No significant sampling bias occurs in the data due to the orientation of drilling with regards to mineralised bodies.
Sample security All samples are prepared onsite under the supervision of Sandfire Geological staff.
Samples are transported to the Perth Ultra Trace laboratory by Toll IPEC or Nexus transport companies in sealed bulka bags.
The onsite laboratory receipts received samples against the sample dispatch documents and issues a reconciliation report for every sample batch.
Audits or reviews
The sampling techniques and data collection processes are of industry standard and have been subjected to multiple internal and external reviews. Most recently Cube Consulting Pty completed a review during 17th - 19th December 2012 and found procedures to be consistent with industry standard and appropriate with minor recommendations for enhancement as part of continuous improvement.
Section 2: Not applicable
Section 3: Estimation and Reporting of Mineral Resources
Criteria Commentary
Database integrity
Sandfire employs SQL as the central data storage system using Datashed software front end. User access to the database is regulated by specific user permissions. Only the Database Manager can overwrite data.
Existing protocols maximise data functionality and quality whilst minimising the likelihood of error introduction at primary data collection points and subsequent database upload, storage and retrieval points.
Data templates with lookup tables and fixed formatting are used for collecting primary data on field Toughbook laptops. The software has validation routines and data is subsequently import it into a secure central database.
An IT contracting company is responsible for the daily Server backups of both the source file data on the file server and the SQL Server databases. The selected SQL databases are backed up to disk with “Backup Exec” each day and then transferred to tape for long term storage. This allows for a full recovery in the event of disaster.
The SQL server database is configured for optimal validation through constraints, library tables, triggers and stored procedures. Data that fails these rules on import is rejected or quarantined until it is corrected.
Database is centrally managed by a Database Manager who is responsible for all aspects of data entry, validation, development, quality control and specialist queries. There is a standard suite of vigorous validation checks for all data.
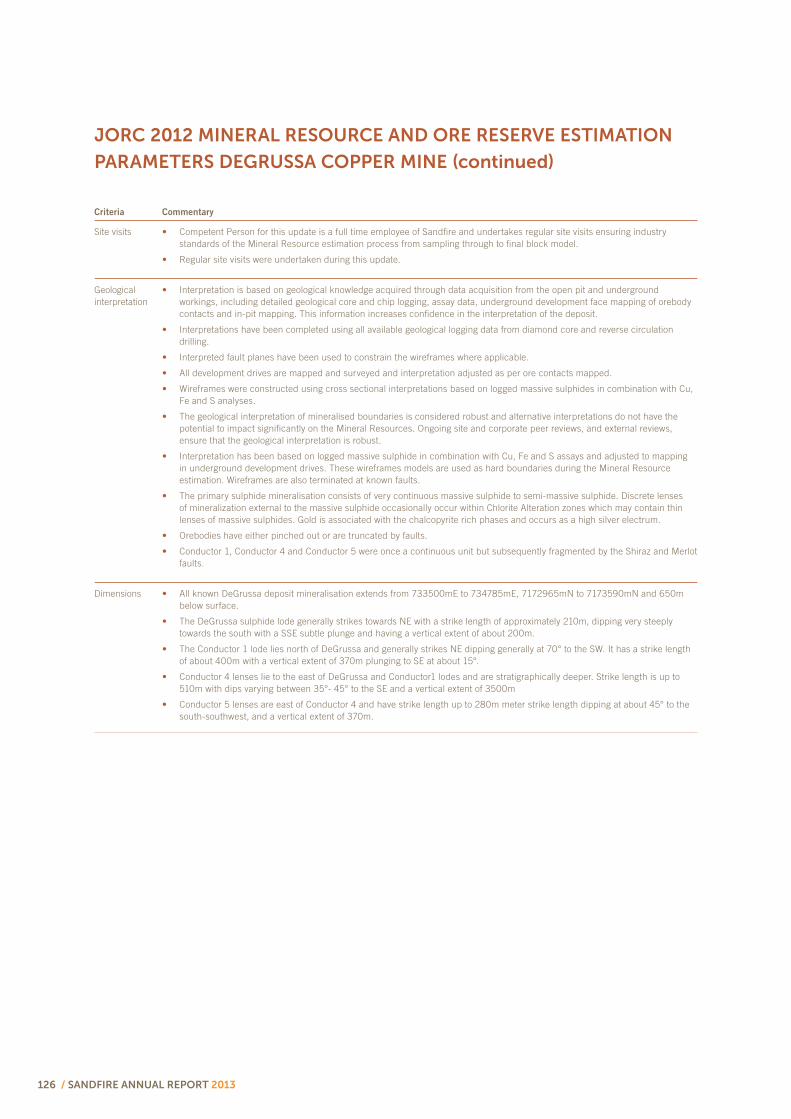
126 / SANDFIRE ANNUAL REPORT 2013
Criteria Commentary
Site visits Competent Person for this update is a full time employee of Sandfire and undertakes regular site visits ensuring industry standards of the Mineral Resource estimation process from sampling through to final block model.
Regular site visits were undertaken during this update.
Geological interpretation
Interpretation is based on geological knowledge acquired through data acquisition from the open pit and underground workings, including detailed geological core and chip logging, assay data, underground development face mapping of orebody contacts and in-pit mapping. This information increases confidence in the interpretation of the deposit.
Interpretations have been completed using all available geological logging data from diamond core and reverse circulation drilling.
Interpreted fault planes have been used to constrain the wireframes where applicable.
All development drives are mapped and surveyed and interpretation adjusted as per ore contacts mapped.
Wireframes were constructed using cross sectional interpretations based on logged massive sulphides in combination with Cu, Fe and S analyses.
The geological interpretation of mineralised boundaries is considered robust and alternative interpretations do not have the potential to impact significantly on the Mineral Resources. Ongoing site and corporate peer reviews, and external reviews, ensure that the geological interpretation is robust.
Interpretation has been based on logged massive sulphide in combination with Cu, Fe and S assays and adjusted to mapping in underground development drives. These wireframes models are used as hard boundaries during the Mineral Resource estimation. Wireframes are also terminated at known faults.
The primary sulphide mineralisation consists of very continuous massive sulphide to semi-massive sulphide. Discrete lenses of mineralization external to the massive sulphide occasionally occur within Chlorite Alteration zones which may contain thin lenses of massive sulphides. Gold is associated with the chalcopyrite rich phases and occurs as a high silver electrum.
Orebodies have either pinched out or are truncated by faults.
Conductor 1, Conductor 4 and Conductor 5 were once a continuous unit but subsequently fragmented by the Shiraz and Merlot faults.
Dimensions All known DeGrussa deposit mineralisation extends from 733500mE to 734785mE, 7172965mN to 7173590mN and 650m below surface.
The DeGrussa sulphide lode generally strikes towards NE with a strike length of approximately 210m, dipping very steeply towards the south with a SSE subtle plunge and having a vertical extent of about 200m.
The Conductor 1 lode lies north of DeGrussa and generally strikes NE dipping generally at 70° to the SW. It has a strike length of about 400m with a vertical extent of 370m plunging to SE at about 15°.
Conductor 4 lenses lie to the east of DeGrussa and Conductor1 lodes and are stratigraphically deeper. Strike length is up to 510m with dips varying between 35°- 45° to the SE and a vertical extent of 3500m
Conductor 5 lenses are east of Conductor 4 and have strike length up to 280m meter strike length dipping at about 45° to the south-southwest, and a vertical extent of 370m.
JORC 2012 MINERAL RESOURCE AND ORE RESERVE ESTIMATION
PARAMETERS DEGRUSSA COPPER MINE (continued)

SANDFIRE ANNUAL REPORT 2013 / 127
Criteria Commentary
Estimation and modelling techniques
Block estimation has been completed within Datamine™ Studio 3 Resource Modelling software. Three dimensional mineralisation wireframes were completed within Surpac™ and Micromine™ software and imported into Datamine™. These wireframes are used as hard boundaries for the interpolation.
Ordinary Kriging using a local dynamic anisotropy search is used for block grade estimates using uniquely coded 1m composite data for respective lodes.
All block estimates are based on interpolation into parent blocks. Parent block estimates are then assigned to sub-blocks. Mineral Resource estimation does not include any form of dilution.
Block model extends from 733,250mE to 735,250mE, 7,172,850mN to 7,173,750mN and vertical from1, 700mRL to 2,800mRL. Elements estimated include Cu, Au, Ag, Fe, S, Pb, and Zn.
Thorough univariate statistical analysis of density weighted, 1m, mineralogy flagged, downhole composites has been completed for all elements and for all lodes and top-cuts established where applicable.
1m composites are extracted with minimum passing of 70% and best fit such that no residuals are created.
Variogram modelling completed within Snowden Supervisor™ software and used to define the characterization of the spatial continuity of all elements within all lodes and parameters used for the interpolation process. Variogram model are cross-validated to ensure parameters are accurate.
Quantitative kriging neighbourhood analysis (QKNA) using goodness of fit statistics to optimize estimation parameters has been undertaken. Parameters optimised include block size, search parameters, number of samples (minimum and maximum) and block descritization.
Ordinary krigged Mineral Resource estimates are checked against an alternate inverse distance weighting estimates and also reconciled with previous estimates.
No assumptions were made regarding recovery of by-products during the Mineral Resource estimates.
Estimates includes deleterious or penalty elements Pb, Bi, Zn, As, MgO as well as Magnetic Susceptibility and Pyrite: Pyrrhotite ratio for metallurgical modelling.
QKNA indicates parent block sizes of X (5m) by Y (5m) by Z (5m) to be suitable for grade control (GC) areas where drillhole ore intercept spacing varies from 0.2m to 45m averaging 6m. Within Resource Definition areas parent block sizes of X (10m) by Y (10m) by Z (10m) were found to be adequate for drillhole intercept spacing varying from 8m to 90m averaging at 30m. Parent blocks were sub-blocked to X (0.5m) by Y (0.5m) by Z (0.5m) ensuring high resolution at ore boundaries when filling wireframes with blocks taking into consideration orebody geometry.
Directional ranges have been determined from variogram modelling and are used to constrain the search distances used in block interpolation, incorporating geologists’ interpretation of ore geometry and continuity. Estimation search strategies implemented have sought to ensure robust estimates while minimising conditional bias. Three search estimation runs are used with initial short-search runs extending the sample influence in later runs.
Grade restriction applied during interpolation is either as a capping or restricted search or combination of both. Restricted searching during estimation is applied to restrict the influence of extreme grades from smearing distant blocks by using a tighter search ellipsoid.
No selective mining units were assumed in this estimate
Within the massive sulphides there is a good and consistent correlation between Cu, Fe, S and bulk density which has been analysed separately for all lodes using multiple regression to fit the density and Cu, Fe, S relationship. The regressed formula is then applied to block model estimated Cu, Fe and S to assign the estimated block bulk density value.
The geological interpretation wireframes correlate with massive sulphide minerlisation boundaries. The block model has been assigned a unique mineralisation zone code that corresponds with the geological domain as defined by wireframes. Geological interpretations are used as hard boundaries during interpolation where blocks are estimated only with composites having the corresponding zone code.
Statistical analysis indicated that outlier management was crucial to prevent severe high grade smearing that could result in potential overestimation for some elements. The approach used has been capping or restricted search or the combination of both (Top-cuts and restricted search were defined following thorough examinations of histograms, probability curves and the spatial locations of the outliers).
Standard model validation has been completed using visual and numerical methods and formal peer review sessions by key geology staff.
Mineral Resource Model has been validated visually against the input composite/raw drillhole data with sufficient spot checks carried out on a number of block estimates on sections and plans.
Easting, northing and elevation swath plots have been generated to check input composited assay means for block estimates within swath windows. Ordinary krigged estimates have also been checked against an alternate inverse distance weighting estimates within the same swath windows.
A comparison of block volume weighted mean versus the drillhole cell de-clustered mean grade of the composited data was undertaken.
Efficiency models using block Kriging Efficiencies (KE) and Slope of Regression (ZZ) were used to quantitatively measure estimation quality to ensure the desired level of quality of estimation.
No meaningful reconciliation data is available at this time.
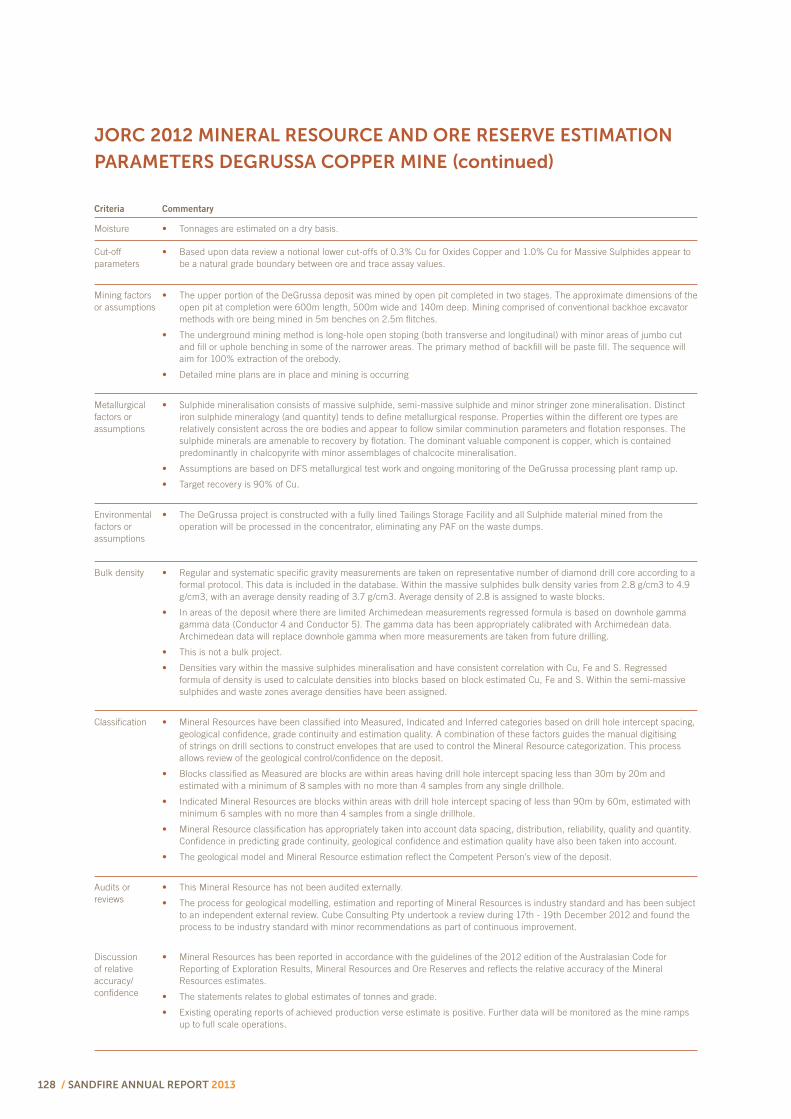
128 / SANDFIRE ANNUAL REPORT 2013
Criteria Commentary
Moisture Tonnages are estimated on a dry basis.
Cut-off parameters
Based upon data review a notional lower cut-offs of 0.3% Cu for Oxides Copper and 1.0% Cu for Massive Sulphides appear to be a natural grade boundary between ore and trace assay values.
Mining factors or assumptions
The upper portion of the DeGrussa deposit was mined by open pit completed in two stages. The approximate dimensions of the open pit at completion were 600m length, 500m wide and 140m deep. Mining comprised of conventional backhoe excavator methods with ore being mined in 5m benches on 2.5m flitches.
The underground mining method is long-hole open stoping (both transverse and longitudinal) with minor areas of jumbo cut and fill or uphole benching in some of the narrower areas. The primary method of backfill will be paste fill. The sequence will aim for 100% extraction of the orebody.
Detailed mine plans are in place and mining is occurring
Metallurgical factors or assumptions
Sulphide mineralisation consists of massive sulphide, semi-massive sulphide and minor stringer zone mineralisation. Distinct iron sulphide mineralogy (and quantity) tends to define metallurgical response. Properties within the different ore types are relatively consistent across the ore bodies and appear to follow similar comminution parameters and flotation responses. The sulphide minerals are amenable to recovery by flotation. The dominant valuable component is copper, which is contained predominantly in chalcopyrite with minor assemblages of chalcocite mineralisation.
Assumptions are based on DFS metallurgical test work and ongoing monitoring of the DeGrussa processing plant ramp up.
Target recovery is 90% of Cu.
Environmental factors or assumptions
The DeGrussa project is constructed with a fully lined Tailings Storage Facility and all Sulphide material mined from the operation will be processed in the concentrator, eliminating any PAF on the waste dumps.
Bulk density Regular and systematic specific gravity measurements are taken on representative number of diamond drill core according to a formal protocol. This data is included in the database. Within the massive sulphides bulk density varies from 2.8 g/cm3 to 4.9 g/cm3, with an average density reading of 3.7 g/cm3. Average density of 2.8 is assigned to waste blocks.
In areas of the deposit where there are limited Archimedean measurements regressed formula is based on downhole gamma gamma data (Conductor 4 and Conductor 5). The gamma data has been appropriately calibrated with Archimedean data. Archimedean data will replace downhole gamma when more measurements are taken from future drilling.
This is not a bulk project.
Densities vary within the massive sulphides mineralisation and have consistent correlation with Cu, Fe and S. Regressed formula of density is used to calculate densities into blocks based on block estimated Cu, Fe and S. Within the semi-massive sulphides and waste zones average densities have been assigned.
Classification Mineral Resources have been classified into Measured, Indicated and Inferred categories based on drill hole intercept spacing, geological confidence, grade continuity and estimation quality. A combination of these factors guides the manual digitising of strings on drill sections to construct envelopes that are used to control the Mineral Resource categorization. This process allows review of the geological control/confidence on the deposit.
Blocks classified as Measured are blocks are within areas having drill hole intercept spacing less than 30m by 20m and estimated with a minimum of 8 samples with no more than 4 samples from any single drillhole.
Indicated Mineral Resources are blocks within areas with drill hole intercept spacing of less than 90m by 60m, estimated with minimum 6 samples with no more than 4 samples from a single drillhole.
Mineral Resource classification has appropriately taken into account data spacing, distribution, reliability, quality and quantity. Confidence in predicting grade continuity, geological confidence and estimation quality have also been taken into account.
The geological model and Mineral Resource estimation reflect the Competent Person’s view of the deposit.
Audits or reviews
This Mineral Resource has not been audited externally.
The process for geological modelling, estimation and reporting of Mineral Resources is industry standard and has been subject to an independent external review. Cube Consulting Pty undertook a review during 17th - 19th December 2012 and found the process to be industry standard with minor recommendations as part of continuous improvement.
Discussion of relative accuracy/ confidence
Mineral Resources has been reported in accordance with the guidelines of the 2012 edition of the Australasian Code for Reporting of Exploration Results, Mineral Resources and Ore Reserves and reflects the relative accuracy of the Mineral Resources estimates.
The statements relates to global estimates of tonnes and grade.
Existing operating reports of achieved production verse estimate is positive. Further data will be monitored as the mine ramps up to full scale operations.
JORC 2012 MINERAL RESOURCE AND ORE RESERVE ESTIMATION
PARAMETERS DEGRUSSA COPPER MINE (continued)

SANDFIRE ANNUAL REPORT 2013 / 129
Section 4: Estimation and Reporting of Ore Reserves
Criteria Commentary
Mineral Resource estimate for conversion to Ore Reserves
The Underground Ore Reserve estimate is based on the Mineral Resource estimate carried out by Sandfire Resource NL in March 2013.
The Mineral Resources are reported inclusive of Ore Reserve.
Site visits A site visit was conducted by the competent person.
The site visit included underground inspections as well visual inspection of core.
Study status Definitive Feasibility Study.
Cut-off parameters
Three cut-off grades have been calculated based on current and forecasted costs and modifying factors, forecast for a period of three years. These cut-off values are;
o Fully Costed - cut-off includes all operating costs associated with the extraction and processing of ore material,
o Incremental - cut-off grade applies to all material that does not require any additional development, and
o Marginal – cut-off applies to material that will be mined in the process of gaining access to economic material.
Mining factors or assumptions
Ore Reserves have been calculated by generating detailed mining shapes for each stoping block as well as development. All mining dilution has been designed into the Reserve shapes and interrogated. Mining recovery factors have been applied post geological interrogation to generate the final diluted and recovered Ore Reserve.
All mining methods are currently being applied on site and are in line with the parameters set out in the Feasibility Study.
Stope sizes have been created to suit the Mineral Resource. As the Mineral Resource changes in width and dip the mining method changes from large multi lift stopes to echelon retreat single access stopes.
Mining dilution has been applied to each mining shape with 0.5 m of over break applied to the footwall and hangingwall. When mining shapes come into contact with geotechnically complicated zones additional dilution is designed to ensure the stability of the mining shapes is sustained.
A mining recovery of 95% has been applied to all stopes. This mining recovery is applied to allow for any ore loss due to mining related issues such as but not limited to; under break due to poor drilling and blasting techniques, stope bridging or freezing or material being left in stopes due inaccessibility.
Minimum mining width for stoping is 4m.
All Inferred Mineral Resources included in the Ore Reserve shapes have had all grade stripped and are hence assumed to be waste.
Infrastructure for the mining method is currently installed or being installed and has been accounted for in the costing.
Metallurgical factors or assumptions
The enrichment of the sulphide ore is by traditional crushing, grinding, flotation and filtration to produce a high grade high purity concentrate suitable for further pyrometallurgical enrichment. ROM ore is crushed in a jaw crusher and stored in a crushed ore bin. Feeders underneath the crushed ore bin reclaim ore and introduce it into a SAG and Ball mill circuit (SAB) whereby the ore is reduced to a size suitable for flotation. The flotation circuit consists of roughing, scavenging, concentrate regrind, cleaning, scavenging cleaning and recleaning stages to increase the grade of the concentrate to ~25% copper. The concentrate is then thickened and filtered to nominal moisture of ~10%.
Assumptions are based on DFS metallurgical test work and ongoing monitoring of the DeGrussa processing plant ramp up.
Target recovery is 90% of Cu.
Environmental DeGrussa is currently compliant with all environmental regulatory requirements. To the best of the Competent Person’s knowledge all sites for waste rock are compliant and their design and construction have complied with all environmental regulations, permits and recommendations.
Infrastructure All infrastructures required for the processing and mining of the Ore Reserve is in place and operating.
Costs All costs used in the generation of the Ore Reserve have been based on current modelling of the life of mine plan.
A revenue reduction factor of 19.6% has been applied which included all transport, smelting, refining and royalty payments.
Exchange rates have been sourced from Sandfire Resources NL’s current financial modelling data.

130 / SANDFIRE ANNUAL REPORT 2013
JORC 2012 MINERAL RESOURCE AND ORE RESERVE ESTIMATION
PARAMETERS DEGRUSSA COPPER MINE (continued)
Criteria Commentary
Revenue factors Sandfire is a low cost copper concentrate producer.
Selling into global market for custom concentrates.
Pricing is fundamentally on value of contained metals the main metal being copper with gold and small silver credits.
The price of copper being set based on the LME which is a mature, well established and publically traded exchange.
Sandfire produces a clean concentrate, low in deleterious elements.
Sandfire’s DeGrussa copper concentrate has a grade similar to the average grade most non-Chinese smelters feed at and notably above the common feed grade for Chinese smelters.
Sandfire relies upon independent expert publications (CRU, Wood Mac, Metal Bulletin) and other sources (bank reports, trader reports, conferences, other trade publications) in forming a view about future demand and supply and the likely effects of this on both metal prices and concentrate prices.
The current market for copper is defined by weak global demand and rising mine supply leading to an expected cooper surplus at least through to 2016, however the long run marginal cost of new mine capacity and production is likely to underpin the market at around US$3/lb.
“Clean” copper concentrates with copper grades between 23 and 28% are expected to continue to be in demand and Sandfire foresees continued demand for its concentrate.
At the last tender Chinese smelters directly or indirectly via traders offered competitively for SFR concentrates.
There is still significant interest in spot and long term sales opportunities for Sandfire concentrates.
Chinese smelters are still at low levels of utilisation and more smelter capacity is being built.
The breakeven TC/RC for smelters varies somewhere between 60/6 and 80/8, therefore strong buying interest is expected should the spot TC/RC get above these levels effectively capping TC/RC costs at around the 90/9 level.
Economic No NPV’s have been generated as part of the Ore Reserve assessment, however all material contained within the Reserve is deemed to generate positive cash flow based on the economic input parameters.
Social To the best of the Competent Persons knowledge all agreements are in place and are current with all key stakeholders including traditional owner claimants.
Other DeGrussa is currently compliant with all legal and regulatory requirements. To the best of the Competent Person’s knowledge, there is no reason to assume any government permits and licenses or statutory approvals will not be granted.
Classification The Ore Reserve has been broken into Proven and Probable categories.
Only Measured material has been converted to a Proven Ore Reserve.
Indicated material has been converted to a Probable Ore Reserve.
The Competent Person believes the classification of the Underground Mineral Resource and hence the conversion to Ore Reserve is appropriate.
Audits or reviews
The Ore Reserve has been peer reviewed internally and is in line with current industry standards.
Discussion of relative accuracy/ confidence
The Ore Reserve has been completed to a DFS standard; hence confidence in the resulting figures is high. Mining Operations have demonstrated the assumptions made are correct.
All modifying factors have been applied to designed mining shapes on a global scale as current local data reflects the global assumptions.


![1418 Annual Report 2017 – WEB VERSION - Home - … · SANDFIRE RESOURCES ANNUAL REPORT 2017 [I] Business Overview 2017 Snapshot Chairman’s Letter Board and Management Operations](https://img.pdfslide.us/doc/110x75/5b812b0b7f8b9a466b8bd294/1418-annual-report-2017-web-version-home-sandfire-resources-annual-report.jpg)