Embed Size (px)
Citation preview
36323 outside.pdf 1 4/6/12 11:00 PM

36323 Inside.pdf 1 4/19/12 12:43 PM
1
TO OUR STOCKHOLDERS We are pleased to report that we achieved record gross sales for the 19th consecutive year. In 2011, our gross sales were $1.95 billion, compared to $1.49 billion in the previous year. This achievement was primarily attributable to increased sales of Monster Energy® drinks both internationally and in the United States and in particular to our new Monster Rehab® line which was originally launched with one product in March 2011. Notably, we continued to expand the distribution of our Monster Energy® brand into new international markets. Monster Energy® drinks are now sold in more than 70 countries and territories outside of the United States. During 2011 we introduced a number of new beverages including: Monster Rehab® Tea + Lemonade + Energy Monster Rehab® Green Tea + Energy Monster Rehab® Rojo Tea + Energy Monster Rehab® Protean + Energy Peace Tea® Caddy Shack® We also introduced a number of new beverages and line extensions to our Hansen’s®, Blue Sky® and Hubert’s® brands. We launched our new non-carbonated Monster Rehab® tea + lemonade + energy, energy drink, which contains electrolytes and additional supplements, in the United States in March 2011. Following the success achieved with this drink, we expanded the Monster Rehab® line with the introduction of three additional Monster Rehab® drinks in the fourth quarter of 2011. In March 2012 we launched a new non-carbonated Monster Rehab® tea + orangeade + energy, energy drink, which is the fifth product in our Monster Rehab® line. We intend to expand the Monster Rehab® line to Canada, Mexico and to a number of countries in Europe and elsewhere this year. We also launched Übermonster™ energy drinks in 500ml wide mouth glass bottles in the first quarter of 2012. Übermonster™ energy drinks are non-alcoholic and are manufactured using a brewed fermentation process. We intend to continue our innovation and introduction of new Monster Energy® drinks as well as other beverages in 2012, with continued emphasis on lower calorie drinks to meet the increasing demand from consumers for such products. In 2011, gross sales outside of the United States increased to $381.0 million from $240.6 million in the prior year. During 2011, we launched Monster Energy® drinks into many new countries including Colombia, Cyprus, Denmark, Estonia, Greece, Iceland, Latvia, Lebanon, Lithuania, Malta, Mauritius, Portugal, and Tahiti and commenced limited sales in Russia and Ukraine. In the first quarter of 2012 we launched Monster Energy® drinks in Poland. We plan to expand the distribution of Monster Energy® drinks to additional countries in Central and Eastern Europe as well as to additional countries in South America and Asia in 2012 in order to achieve our goal of making Monster Energy® a global brand. The energy drink category in the United States continues to grow in excess of the beverage category in general, which continues to reflect positively for the future of our Company. The
2
macro environment continues to remain challenging, but we are nonetheless optimistic about our ability to continue to grow the Monster Energy® brand and achieve increased sales in 2012. Sales of Peace Tea® iced teas continue to grow and we are optimistic that we will continue to achieve increased sales and market share for our Peace Tea® brand in 2012. Once again, I would like to express my gratitude for the support afforded to the Company by Mr. Hilton Schlosberg, our President and Chief Operating Officer, and Mr. Mark Hall, President of our Monster Beverage Division. I would also like to express my personal thanks to our consumers, stockholders, customers, distributors, and suppliers for their continued support. To all of our management and employees, my sincere thanks and appreciation for all their efforts, which are evidenced by the continued success of our Company. To our stockholders, thank you for the trust you have placed in our management team. Sincerely, Rodney C. Sacks Chairman and Chief Executive Officer
3
UNITED STATES
SECURITIES AND EXCHANGE COMMISSION
Washington, D.C. 20549
Form 10-K (Mark One)
[ X] ANNUAL REPORT PURSUANT TO SECTION 13 OR 15(d) OF THE SECURITIES EXCHANGE ACT OF 1934
For the fiscal year ended December 31, 2011
OR
[ ] TRANSITION REPORT PURSUANT TO SECTION 13 OR 15(d) OF THE SECURITIES EXCHANGE ACT OF 1934
For the transition period from _____ to _____
Commission File Number 0-18761
MONSTER BEVERAGE CORPORATION (Exact name of registrant as specified in its charter)
Delaware 39-1679918 (State or other jurisdiction of (I.R.S. Employer incorporation or organization) Identification No.)
550 Monica Circle, Suite 201, Corona, California 92880
(Address of principal executive offices) (Zip Code)
Registrant’s telephone number, including area code: (951) 739 - 6200
Securities registered pursuant to Section 12(b) of the Act:
Title of Each Class Name of each exchange on which registered Common Stock, $.005 par value per share Nasdaq Global Select Market
Securities registered pursuant to Section 12(g) of the Act: None
Indicate by check mark if the registrant is a well-known seasoned issuer, as defined in Rule 405 of the Securities Act. Yesþ Noo
Indicate by check mark if the registrant is not required to file reports pursuant to Section 13 or Section 15(d) of the Exchange Act.
Yeso Noþ
Indicate by check mark whether the registrant: (1) has filed all reports required to be filed by Section 13 or 15(d) of the Securities Exchange Act of 1934 during the preceding 12 months (or for such shorter period that the registrant was required to file such reports), and (2) has been subject to such filing requirements for the past 90 days. Yes þ No o
Indicate by check mark whether the registrant has submitted electronically and posted on its corporate Web site, if any, every Interactive
Data File required to be submitted and posted pursuant to Rule 405 of Regulation S-T (§ 232.405 of this chapter) during the preceding 12 months (or for such shorter period that the registrant was required to submit and post such files). Yes þNo o
Indicate by check mark if disclosure of delinquent filers pursuant to Item 405 of Regulation S-K is not contained herein, and will not be
contained, to the best of the registrant’s knowledge, in definitive proxy or information statements incorporated by reference in Part III of this Form 10-K or any amendment to this Form 10-K. þ
Indicate by check mark whether the registrant is a large accelerated filer, an accelerated filer, a non-accelerated filer, or a smaller reporting company. See definitions of “large accelerated filer,” “accelerated filer,” and “smaller reporting company” in Rule 12b-2 of the Exchange Act. (Check one):
Large accelerated filer þ Accelerated filer o Non-accelerated filer o Smaller reporting company o
(Do not check if a smaller reporting company)
4
Indicate by check mark whether the registrant is a shell company (as defined by Rule 12b-2 of the Exchange Act.) Yes o No þ
The aggregate market value of the voting and non-voting common equity held by nonaffiliates of the registrant was $6,213,402,086 computed by reference to the closing sale price for such stock on the NASDAQ Global Select Market on June 30, 2011, the last business day of the registrant’s most recently completed second fiscal quarter.
The number of shares of the registrant’s common stock, $0.005 par value per share (being the only class of common stock of the
registrant), outstanding on February 24, 2012 was 174,309,342 shares, as adjusted to give effect to the two-for-one stock split described in “Part 1, Item 1-Business.”
DOCUMENTS INCORPORATED BY REFERENCE: Portions of the registrant’s Definitive Proxy Statement to be filed subsequent to the date hereof with the Commission pursuant to Regulation
14A in connection with the registrant’s 2011 Annual Meeting of Stockholders are incorporated by reference into Part III of this Report. Such Definitive Proxy Statement will be filed with the Securities and Exchange Commission no later than 120 days after the conclusion of the registrant’s fiscal year ended December 31, 2011.
5
MONSTER BEVERAGE CORPORATION
FORM 10-K
TABLE OF CONTENTS Item Number Page Number PART I
1. Business 6 1A. Risk Factors 19 1B. Unresolved Staff Comments 28
2. Properties 28 3. Legal Proceedings 28 4. Mine Safety Disclosures 31
PART II
5. Market for the Registrant’s Common Equity, Related Stockholder Matters and Issuer Purchases of Equity Securities
31
6. Selected Financial Data 34 7. Management’s Discussion and Analysis of Financial Condition and Results
of Operations 35
7A. Quantitative and Qualitative Disclosures about Market Risk 56 8. Financial Statements and Supplementary Data 57 9. Changes in and Disagreements with Accountants on Accounting and
Financial Disclosure 57
9A. Controls and Procedures 57 9B. Other Information 60
PART III
10. Directors, Executive Officers and Corporate Governance 60 11. Executive Compensation 60
12. Security Ownership of Certain Beneficial Owners and Management and Related Stockholder Matters
60
13. Certain Relationships and Related Transactions, and Director Independence 61 14. Principal Accountant Fees and Services 61
PART IV
15. Exhibits and Financial Statement Schedules 62 Signatures 63
6
PART I
ITEM 1. BUSINESS
Overview
Monster Beverage Corporation, formerly named Hansen Natural Corporation, was incorporated in Delaware on April 25, 1990. Our principal place of business is located at 550 Monica Circle, Suite 201, Corona, California 92880 and our telephone number is (951) 739-6200. When this report uses the words “Monster Energy Company”, “Monster”, “MBC”, “MEC”, “Hansen”, “Hansen Beverage Company”, “HBC”, “the Company”, “we”, “us”, and “our”, these words refer to Monster Beverage Corporation and its subsidiaries, unless the context otherwise requires. We are a holding company and conduct no operating business except through our consolidated subsidiaries.
On January 11, 2012, we announced that our Board of Directors had approved a two-for-one stock split of our common stock (“the Stock Split”) to be effected in the form of a 100% stock dividend. The common stock dividend was issued on February 15, 2012 to stockholders of record as of February 6, 2012. Accordingly, all per share amounts, average common stock outstanding, common stock outstanding, common stock repurchased, common stock in treasury and equity based compensation presented in this Form 10-K have been adjusted retroactively, where applicable, to reflect the stock split.
We develop, market, sell and distribute “alternative” beverage category beverages primarily under the following brand names:
· Monster Energy® · Hansen’s® · Monster Rehab™ · Hansen’s Natural Soda® · Monster Energy Extra Strength Nitrous Technology® · Junior Juice® · Java Monster® · Blue Sky® · X-Presso Monster® · Hubert’s® · Worx Energy® · Vidration® · Peace Tea®
Our Monster Energy® drinks, which represented 91.2%, 89.9% and 90.0% of our net sales for the years ended December 31, 2011, 2010 and 2009, respectively, include the following:
· Monster Energy® · Java Monster® Kona Blend · Lo-Carb Monster Energy® · Java Monster® Loca Moca® · Monster Energy® Assault® · Java Monster® Mean Bean® · Monster Khaos® · Java Monster® Vanilla Light · Monster M-80® (named “RIPPER” in certain countries) · Java Monster® Irish Blend® · Monster MIXXD® · Java Monster® Toffee · Monster Energy® Absolutely Zero · Monster Energy Extra Strength Nitrous · Monster Energy® Import Technology® Super Dry™ · Monster Energy® Import Light · Monster Energy Extra Strength Nitrous · Monster Energy® Dub Edition Technology® Anti-Gravity® · Monster Rehab™ Tea + Lemonade + Energy · Monster Energy Extra Strength Nitrous · Monster Rehab™ Rojo Tea + Energy Technology® Killer B® · Monster Rehab™ Green Tea + Energy · Monster Energy Extra Strength Nitrous · Monster Rehab™ Protean + Energy Technology® Black Ice™ · Monster Energy® M3™ Super Concentrate · X-Presso Monster® Hammer · X-Presso Monster® Midnite
7
Industry Overview
The “alternative” beverage category combines non-carbonated ready-to-drink iced teas, lemonades, juice cocktails, single-serve juices and fruit beverages, ready-to-drink dairy and coffee drinks, energy drinks, sports drinks, and single-serve still water (flavored, unflavored and enhanced) with “new age” beverages, including sodas that are considered natural, sparkling juices and flavored sparkling beverages. According to Beverage Marketing Corporation, domestic U.S. wholesale sales in 2011 for the “alternative” beverage category of the market are estimated at $31.9 billion, representing an increase of approximately 5.1% over the estimated domestic U.S. wholesale sales in 2010 of approximately $30.4 billion (revised from a previously reported estimate of $27.3 billion).
Corporate History
In the 1930s, Hubert Hansen and his sons started a business to sell fresh non-pasteurized juices in Los Angeles, California. This business eventually became Hansen’s Juices, Inc., which subsequently became known as The Fresh Juice Company of California, Inc. (“FJC”). FJC retained the right to market and sell fresh non-pasteurized juices under the Hansen’s trademark. In 1977, Tim Hansen, one of the grandsons of Hubert Hansen, perceived a demand for shelf stable pasteurized natural juices and juice blends and formed Hansen Foods, Inc. (“HFI”). HFI expanded its product line from juices to include Hansen’s Natural Soda® brand sodas. In 1990, California Co-Packers Corporation (d/b/a Hansen Beverage Company) (“CCC”) acquired certain assets of HFI, including the right to market the Hansen’s® brand name. In 1992, we acquired the Hansen’s® brand natural soda and apple juice business from CCC. Under our ownership, the Hansen beverage business has significantly expanded and includes a wide range of beverages within the growing “alternative” beverage category, including in particular, energy drinks. In 1999, we acquired all of FJC’s rights to manufacture, sell and distribute fresh non-pasteurized juice products under the Hansen’s® trademark together with certain additional rights.
Reportable Segments
We have two reportable segments, namely Direct Store Delivery (“DSD”), whose principal products comprise energy drinks, and Warehouse (“Warehouse”), whose principal products comprise juice based and soda beverages. The DSD segment develops, markets and sells products primarily through an exclusive distributor network, whereas the Warehouse segment develops, markets and sells products primarily directly to retailers. Corporate and unallocated amounts that do not relate to the DSD or Warehouse segments specifically, have been allocated to “Corporate and Unallocated.” Our DSD segment represented 94.4%, 93.0% and 91.4% of our consolidated net sales for the years ended December 31, 2011, 2010 and 2009, respectively. Our Warehouse segment represented 5.6%, 7.0% and 8.6% of our consolidated net sales for the years ended December 31, 2011, 2010 and 2009, respectively.
For financial information about our reporting segments and geographic areas, refer to Note 16 of Notes to the Consolidated Financial Statements set forth in “Part II, Item 8 – Financial Statements and Supplementary Data” of this report, incorporated herein by reference. For certain risks with respect to our energy drinks see “Part I, Item 1A – Risk Factors” below.
2011 Product Introductions
During 2011, we continued to expand our existing product lines and flavors and further develop our distribution markets. In particular, we continued to focus on developing and marketing beverages that fall within the category generally described as the “alternative” beverage category. During 2011, we introduced a number of new products including the following:
· Monster Rehab™ Tea + Lemonade + Energy, a non-carbonated rehydration energy drink (February 2011). · Peace Tea® “Caddy Shack”, a non-carbonated tea + lemonade drink (February 2011). · Monster Rehab™ Rojo Tea + Energy, a non-carbonated rehydration energy drink (October 2011). · Monster Rehab™ Green Tea + Energy, a non-carbonated rehydration energy drink (October 2011). · Monster Rehab™ Protean + Energy, a non-carbonated protein rehydration energy drink (October 2011). · Hubert’s® Half & Half, a line of premium ready-to-drink lemonade + teas (October 2011). · Angeleno™ Aguas Fresca, a line of premium ready-to-drink aguas frescas (December 2011).
8
Products – DSD Segment
Monster Energy® Drinks - In 2002, we launched a new carbonated energy drink under the Monster
Energy® brand name in 16-ounce cans, which was almost double the size of our original Hansen’s® brand energy drinks (in 8.3-ounce cans) and the vast majority of competitive energy drinks on the market at that time. Our Monster Energy® drinks contain vitamins, minerals, nutrients, herbs and supplements (collectively, “supplements”) and are marketed through our full service distributor network. We offer the following products under the Monster Energy® brand energy drink product line: Monster Energy®, Lo-Carb Monster Energy®, Monster Energy® Assault®, Monster Khaos®, Monster M-80® (named RIPPER® in certain countries), Monster MIXXD®, Monster Energy® Absolutely Zero, Monster Energy® Import and Import Light, Monster Energy® Dub Edition and Monster Energy® M3™ Super Concentrate energy drinks. We package our Monster Energy® drinks in 8.3-ounce and/or 12-ounce and/or 16-ounce and/or 23.5-ounce and/or 24-ounce and/or 32-ounce and/or 500ml and/or 18.6-ounce aluminum cans and/or 5-ounce glass bottles.
Java Monster® Coffee + Energy Drinks - A line of non-carbonated dairy based coffee + energy drinks. We
offer the following products under the Java Monster® product line: Java Monster® Kona Blend, Java Monster® Loca Moca®, Java Monster® Mean Bean®, Java Monster® Vanilla Light, Java Monster® Irish Blend® and Java Monster® Toffee. We package our Java Monster® coffee + energy drinks in 15-ounce aluminum cans.
Monster Energy Extra Strength Nitrous Technology® Energy Drinks - A line of carbonated energy drinks
containing nitrous oxide. We offer the following products under the Monster Energy Extra Strength Nitrous Technology® product line: Super Dry™, Anti Gravity®, Killer-B® and Black Ice™. We package our Monster Energy Extra Strength Nitrous Technology® drinks in 12-ounce sleek aluminum cap-cans.
X-Presso Monster® Coffee Energy Drinks - A line of non-carbonated dairy based espresso + energy drinks
in 6.75-ounce and/or 9.6-ounce aluminum cans. We offer the following products under the X-Presso Monster® coffee energy drinks product line: X-Presso Monster® Hammer and X-Presso Monster® Midnite.
Monster Rehab™ Tea + Energy Drinks - A line of non-carbonated rehydration energy drinks with
electrolytes in 15.5-ounce aluminum cans. We offer the following products under the Monster Rehab™ drink line: Monster Rehab™ Tea + Lemonade + Energy, Monster Rehab™ Rojo Tea + Energy, Monster Rehab™ Green Tea + Energy and Monster Rehab™ Protean + Energy.
Worx Energy® Energy Shots - A line of energy supplements which contains zero calories and zero sugar in
2-ounce wide-mouth PET plastic bottles. We offer the following products under the Worx Energy® energy shot product line: Original Formula and Extra Strength.
Peace Tea® Iced Teas - A line of ready-to-drink iced teas in 23-ounce aluminum cans. We offer the
following products under the Peace Tea® product line: green tea, diet green tea, imported Ceylon tea, sweet lemon tea, razzleberry tea, unsweetened tea and “Caddy Shack” tea + lemonade (introduced in the first quarter of 2011).
Products – Warehouse Segment
Hansen’s Natural Soda® Brand Sodas - Hansen’s Natural Soda® brand sodas have been a leading natural
soda brand on the West Coast of the United States for more than 30 years. Hansen’s Natural Soda® brand sodas, sweetened with cane sugar, and Hansen’s® Diet Sodas, sweetened with Splenda® no calorie sweetener and Acesulfame-K, contain no preservatives, no sodium, no caffeine and no artificial coloring. We offer the following sodas under the Hansen’s® brand name: Hansen’s Natural Soda®, Hansen’s® Diet Sodas and Hansen’s® Natural Mixers, as well as Hansen’s® Sparkling Waters, in a variety of flavors. We package our natural sodas and sparkling waters in 12-ounce aluminum cans and our mixers in 8-ounce aluminum cans.
9
Blue Sky® Products - Our Blue Sky® products contain no preservatives, artificial sweeteners, caffeine (other than our Blue Sky® energy drinks) or artificial coloring and are made with sugar and high quality natural flavors. We offer the following products under the Blue Sky® product line: Blue Sky® Natural Soda, Blue Sky® Free Sodas (sweetened with Truvia® brand stevia extract (“Truvia®”), an all natural sweetener), Blue Sky® Premium Sodas, Blue Sky® Organic Natural Sodas, Blue Sky® Seltzer Waters, Blue Sky® Blue Energy® drinks, Blue Sky® Free Blue Energy® drinks and Blue Sky® Café Energy drinks. In October 2011, we introduced Blue Sky® Recover Energy™ drink, a new natural, non-carbonated recovery energy drink with electrolytes, sweetened with Truvia®. We package our Blue Sky® natural sodas and seltzer waters in 12-ounce aluminum cans and/or bag in box. We package our Blue Sky® Café energy drinks in 15-ounce aluminum cans. We package our Blue Sky® energy drinks in 8.3-ounce and/or 16-ounce aluminum cans.
Hansen’s® Energy Drinks - Our original Hansen’s® energy drinks compete in the “functional” beverage category, namely, beverages that provide a real or perceived benefit in addition to simply delivering refreshment. We offer the following products under the Hansen’s® energy drink product line: Hansen’s® Natural Energy Pro and Hansen’s® Energy Diet Red. We package our Hansen’s® energy drinks in 8.3-ounce aluminum cans.
Hansen’s® Juice Products and Smoothies - Our fruit juice product line includes Hansen’s® Natural Apple Juice, which is packaged in 64-ounce PET plastic bottles and 128-ounce High Density Polyethylene bottles; as well as Hansen’s® Natural Grape Juice, White Grape Juice, Pineapple Juice, Apple Grape Juice, Apple Strawberry Juice, Orange Juice, Cranberry-Apple Juice, Ruby Red Grapefruit Juice, and Organic Apple Juice, which are all packaged in 64-ounce PET plastic bottles. In March 2011, we added Hansen’s® Natural Cranberry Juice and Cranberry-Grape Juices. These Hansen’s® juice products contain 100% juice as well as 120% of the United States Recommended Daily Allowances (the “USRDA”) for vitamin C. We also offer Hansen’s® Natural Lo-Cal juice cocktails, a line of all natural, low-calorie 64-ounce juice cocktails in four flavors. The Lo-Cal juice cocktails are sweetened with Truvia®. Hansen’s® juice products compete in the shelf-stable juice category.
Hansen’s® fruit juice smoothies contain approximately 25% juice and provide 100% of the USRDA for adults of vitamins A, C & E. Hansen’s® fruit juice smoothies are packaged in 11.5-ounce aluminum cans.
Hansen’s® Aseptic Juices – We offer a number of aseptically packed boxed juice products, including our dual-branded multi-vitamin 100% juice line, which we sell in conjunction with Costco Wholesale Corporation (“Costco”) through Costco stores. We offer our Hansen’s® Natural line of multi-vitamin 100% juices to other customers. These multi-vitamin juices contain eleven essential vitamins and six essential minerals, are packaged in 6.75-ounce aseptic boxes, and are available in a variety of flavors.
Our Hansen’s® Junior Juice® product line is a 100% juice line offered principally in 4.23-ounce aseptic packages, targeted at toddlers and preschoolers. These juices have added calcium and all flavors contain 100% of the daily recommended allowance of vitamin C. We also offer organic juices in 4.23-ounce aseptic boxes. In October 2011, we launched Junior Juice® Coconut Water Twist™, a line of fruit and coconut water juices packaged in 6.75-ounce aseptic boxes and available in a number of flavors. We also market Hansen’s® Organic Junior Water®, a lightly flavored reduced calorie beverage line, also packaged in 4.23-ounce aseptic packages.
Hubert’s® Lemonades – Our Hubert’s® Lemonade is a line of premium ready-to-drink lemonades packaged in 16-ounce glass bottles. Hubert’s® Lemonade is sweetened with cane sugar and Truvia®. Hubert’s® Lemonade is all natural and contains no preservatives, artificial sweeteners, caffeine, or artificial colorings. We offer the following products under the Hubert’s® Lemonade product line: strawberry lemonade, limeade, mango lemonade, honey lemonade, raspberry lemonade and original lemonade.
In October 2011, we introduced Hubert’s® Half & Half, a line of premium ready-to-drink lemonade + tea drinks, packaged in 15.5-ounce aluminum cans and available in a variety of flavors. Hubert’s® Half & Half is sweetened with cane sugar and Truvia®, and contains no preservatives, artificial sweeteners, or artificial colorings.
Hansen’s® Natural Fruit Stix® and Tea Stix™ - Our Fruit and Tea Stix™ product line is an all-natural, low-calorie powder drink mix line, sweetened naturally with Truvia®. Hansen’s® Natural Fruit Stix® and Tea Stix™ powders are packaged in 3-gram and 4-gram slim stick packs.
10
Vidration® Enhanced Waters - Our zero calorie, vitamin enhanced flavored water line is offered under the Vidration® brand name, packaged in 20-ounce PET plastic bottles. This line includes the following beverages: Defense, Recover, Energy, Multi-V and Power.
Angeleno™ Aquas Frescas - In December 2011, we introduced Angeleno™ Aguas Frescas, a line of premium ready-to-drink aguas frescas packaged in 16-ounce glass bottles. Angeleno™ Aguas Frescas are sweetened with cane sugar and real fruit juice and contain no preservatives, artificial sweeteners, caffeine, or artificial colorings. We offer the following flavors under the Angeleno™ Aguas Frescas product line: Mango, Melon, Pineapple, Jamaica (Hibiscus), and Tamarindo.
PRE® Beverages and Drink Mixes - In December 2011, we acquired PRE Beverage’s assets which include a line of prebiotic and probiotic digestive wellness ready-to-drink beverages and powder drink mixes, containing specially formulated blends by Jarrow Formulas. PRE® prebiotic ready-to-drink beverages are sweetened with either cane sugar or stevia and are packaged in proprietary 16.9-ounce PET plastic bottles. PRE® probiotic powder drink mixes are sweetened with cane sugar and stevia and are packaged in 7-gram stick packs.
Other Products
We continue to evaluate and, where considered appropriate, introduce additional flavors and types of beverages to complement our existing product lines. We may also evaluate, and where considered appropriate, introduce additional types of consumer products we consider are complementary to our existing products and/or to which our brand names are able to add value.
We also develop and supply, on a limited basis, selected beverages in different formats to a limited number of customers with the objective of solidifying and/or enhancing our relationship with those customers.
Manufacture and Distribution
We do not directly manufacture our products, but instead outsource the manufacturing process to third party bottlers and contract packers.
We purchase concentrates, juices, flavors, supplements, cans, bottles, aseptic boxes, caps, labels, trays, boxes and other ingredients for our beverage products from our suppliers, which are delivered to our various third party bottlers and co-packers. Depending on the product, the third party bottlers or packers add filtered water and/or other ingredients and supplements for the manufacture and packaging of the finished products into our approved containers in accordance with our formulas. Depending on the beverage, the bottler/packer may also add carbonation to the products as part of the production process.
Co-Packing Arrangements
All of our beverage products are manufactured by various third party bottlers and co-packers situated throughout the United States and abroad, under separate arrangements with each party. The majority of our co-packaging arrangements are generally on a month-to-month basis or are terminable upon request and do not generally obligate us to produce any minimum quantities of products within specified periods.
In some instances subject to agreement, certain equipment may be purchased by us and installed at the facilities of our co-packers to enable them to produce certain of our products. In general, such equipment remains our property and is returned to us upon termination of the packing arrangements with such co-packers, unless we are reimbursed by the co-packer via a per case charge over a pre-determined number of cases that are produced at the facilities concerned.
We are generally responsible for arranging for the purchase and delivery to our third party bottlers and co-packers of the containers in which our beverage products are packaged.
We pack certain of our products in a number of locations both domestically and internationally, including Australia, Brazil, Canada, Europe, Mexico and the United States, to enable us to produce products closer to the markets where they are sold with the objective of reducing freight costs. As distribution volumes increase in both our domestic and international markets, we continue to source additional packing arrangements closer to such markets to further reduce freight costs. Our ability to estimate demand for our products is imprecise, particularly
11
with new products, and may be less precise during periods of rapid growth, particularly in new markets. If we materially underestimate demand for our products and/or are unable to secure sufficient ingredients or raw materials including, but not limited to aluminum cans, PET plastic bottles, aseptic boxes, glass, labels, flavors, juice concentrates, supplements, other ingredients, certain sweeteners, and/or procure adequate packing arrangements and/or obtain adequate or timely shipment of our products, we might not be able to satisfy demand on a short-term basis. (See “Part I, Item 1A – Risk Factors”).
Although our production arrangements are generally of short duration or are terminable upon our request, we believe a short disruption or delay would not significantly affect our revenues because alternative packing facilities in our domestic and international markets with adequate capacity can usually be obtained for many of our products at commercially reasonable rates and/or within a reasonably short time period. However, there are limited packing facilities in our domestic and international markets with adequate capacity and/or suitable equipment for certain of our products, including Monster Energy®, Monster Rehab™, Monster Energy® Import and Import Light, Monster Energy® Dub Edition, Monster Energy Extra Strength Nitrous Technology®, X-Presso Monster®, Worx Energy® energy shots, our Java Monster® product line and our aseptic juice products.
A lengthy disruption or delay in production of any of such products could significantly affect our revenues from such products, as alternative co-packing facilities in our domestic and international markets with adequate capacity may not be available for such products, either at commercially reasonable rates and/or within a reasonably short time period, if at all. Consequently, a disruption in production of such products could affect our revenues.
We continue to seek alternative and/or additional advantageously located co-packing facilities in Asia, Canada, Central America, Europe, South America and the United States with adequate capacity and capability for the production of our various products to minimize the risk of a disruption in production.
Distribution Agreements
During 2011, we continued to expand distribution of our products in both the domestic and international markets, and our Monster Energy® drinks are now sold in approximately 70 countries and territories around the world.
Certain of our distribution agreements, as amended from time to time, are described below:
(a) During the second quarter of 2006, we entered into the Monster Beverages Off-Premise Distribution Coordination Agreement and the Allied Products Distribution Coordination Agreement (jointly, the “Off-Premise Agreements”) with Anheuser-Busch, Inc., a Missouri corporation (“AB”). Under the Off-Premise Agreements, select Anheuser-Busch distributors (the “AB Distributors”) distribute and sell, primarily our Monster Energy® beverages, as well as additional products that may be agreed between the parties in various territories within the United States.
(b) During the first quarter of 2007, we entered into the On-Premise Distribution Coordination Agreement (the “On-Premise Agreement”) with AB. Under the On-Premise Agreement, select AB Distributors distribute and sell our Monster Energy® beverages to on-premise retailers including bars, nightclubs and restaurants.
(c) During the fourth quarter of 2008, we entered into the Monster Energy Distribution Coordination Agreement (the “TCCC North American Coordination Agreement”) with The Coca-Cola Company (“TCCC”). Pursuant to the TCCC North American Coordination Agreement, we have designated, and in the future may designate, subject to TCCC’s approval, territories in Canada and the United States in which bottlers from TCCC’s network of wholly or partially-owned and independent bottlers, including Coca-Cola Enterprises, Inc. (“CCE”) (now Coca-Cola Refreshments USA, Inc. (“CCR”)), Coca-Cola Bottling Company (“CCBC”), CCBCC Operations, LLC (“Consolidated”), United Bottling Contracts Company, LLC (“United”), and other TCCC independent bottlers (collectively, the “TCCC North American Bottlers”) will distribute and sell primarily our Monster Energy® beverages (the “Products”).
(d) During the fourth quarter of 2008, we entered into the Monster Energy Distribution Agreement with CCE (now CCR), pursuant to which CCE was appointed to distribute, directly and through certain sub-distributors, the Products in portions of the United States.
12
(e) During the fourth quarter of 2008, we entered into the Monster Energy Canadian Distribution Agreement with CCBC (now Coca-Cola Refreshments Canada, Ltd. (“CCRC”)), pursuant to which CCBC was appointed to distribute and sell, directly and through certain sub-distributors, the Products in Canada, commencing January 1, 2009.
(f) During the fourth quarter of 2008, we entered into distribution agreements with Consolidated, United and other TCCC North American Bottlers for the distribution of the Products in various territories within the United States.
(g) On October 2, 2010, TCCC completed its acquisition of the North American business operations of CCE, through a merger with a wholly owned subsidiary of TCCC. The surviving wholly owned subsidiary was subsequently renamed CCR, and currently distributes the Products in those portions of the United States in which CCE previously distributed the Products. Concurrently with this acquisition, a new entity, which retained the name Coca-Cola Enterprises, Inc. (“New CCE”) was formed, which currently distributes the Products in certain European territories (see (i) below).
(h) During the fourth quarter of 2008, we entered into the Monster Energy International Coordination Agreement (the “TCCC International Coordination Agreement”) with TCCC. Pursuant to the TCCC International Coordination Agreement, we have designated, and in the future may designate, countries in which we wish to appoint TCCC distributors to distribute and sell the Products, subject to TCCC’s approval.
(i) During the fourth quarter of 2008, we entered into the Monster Energy International Distribution Agreement and the Monster Energy Belgium Distribution Agreement with CCE (now New CCE) pursuant to which CCE was appointed to distribute directly, and through certain sub-distributors, the Products in Great Britain, France, Belgium, the Netherlands, Luxembourg and Monaco. During the first quarter of 2011, Sweden was added to the Monster Energy International Distribution Agreement.
(j) During 2010 and 2011, the Company entered into distribution agreements with certain bottlers of the Coca-Cola Hellenic group (“Coca-Cola Hellenic”) for distribution of its Monster Energy® products in Austria, Bulgaria, Czech-Republic, Hungary, Slovakia, Cyprus, Greece, Latvia, Lithuania, Estonia and Switzerland. In the first quarter of 2012, Coca-Cola Hellenic commenced distribution in Poland.
(k) During the fourth quarter of 2008, we entered into a distribution agreement with Comercializadora Eloro, S.A., a subsidiary of Grupo Jumex (“Jumex”), for exclusive distribution throughout Mexico, excluding the Baja and Sonora regions, for certain of our Monster Energy® beverages. Distribution under this agreement commenced January 26, 2009. Effective June 11, 2010, this agreement was amended to include the Baja and Sonora regions.
(l) During the second quarter of 2009, we entered into a distribution agreement with Schweppes Australia Pty Ltd. for exclusive distribution throughout Australia of certain of our Monster Energy® energy drinks. Distribution under this agreement commenced in July 2009.
(m) On September 12, 2011, we entered into a distribution agreement with Lotte Chilsung Beverage Co. Ltd. for exclusive distribution throughout South Korea of certain of our Monster Energy® beverages. Distribution under this agreement is expected to commence in the first half of 2012.
(n) On August 17, 2011, we entered into a distribution agreement with Asahi Soft Drinks Co, Ltd. for exclusive distribution throughout Japan of certain of our Monster Energy® beverages. Distribution under this agreement is expected to commence in the first half of 2012.
Distribution levels vary by product and geographic location. Gross sales outside the United States accounted for $381.0 million, $240.6 million and $168.0 million for the years ended December 31, 2011, 2010 and 2009, respectively.
We continually seek to expand distribution of our products by entering into agreements with other regional bottlers or direct store delivery distributors with established sales, marketing and distribution organizations. Many of our bottlers and distributors are affiliated with and manufacture and/or distribute other beverage products. In many cases, such products compete directly with our products.
13
Raw Materials and Suppliers
The principal raw materials used in the manufacturing of our products are aluminum cans, PET plastic
bottles as well as juice concentrates, sugar, sucralose, milk, cream and supplements, the costs of which are subject to fluctuations. Overall prices of our raw materials increased in 2011 as compared to 2010 and certain raw material costs are continuing to increase in 2012. We have contracted for the majority of our projected aluminum can requirements for 2012 at more favorable pricing than in 2011, due to more favorable aluminum pricing contracts entered into by us with our aluminum can suppliers. Although the price of apple juice concentrate has increased significantly, we have secured a portion of our anticipated 2012 requirements of apple juice concentrate at prices similar to the pricing incurred in 2011, however, we expect our average cost of apple juice concentrate in 2012 to be higher than 2011. Sugar prices were higher in 2011 than 2010 and are continuing to increase. We have also secured a large portion of our sugar requirements for 2012. We are experiencing increased costs of PET plastic bottles, fuel, as well as certain juice concentrates, certain supplements and other ingredients in 2012.
We purchase beverage flavors, concentrates, juices, supplements, cane sugar, sucrose, sucralose and other sweeteners as well as other ingredients from independent suppliers located in the United States and abroad.
Generally, raw materials utilized by us in our business are readily available from numerous sources.
However, certain raw materials are manufactured by only one company. We purchase sucralose, which is used alone or in combination with Acesulfame-K in many of our products, flavors, vitamin blends and herbs, certain other supplements, as well as certain other ingredients, from single manufacturers. Additionally, certain of our cans and flavors are only manufactured by single companies.
With regard to our Java Monster® product line, the dairy industry is subject to shortages and increased demand from time to time, which may result in higher prices.
With regard to our fruit juice and juice-drink products, the industry is subject to variability of demand and weather conditions, which may result in higher prices and/or lower consumer demand for juices.
Generally, flavor suppliers hold the proprietary rights to their flavors and do not make their flavor formulas available to their customers and also do not make our flavors available to other third parties. Consequently, we do not have the list of ingredients or formulae for our flavors and certain of our concentrates readily available to us and we may be unable to obtain comparable flavors or concentrates from alternative suppliers on short notice. We have identified alternative suppliers for many of the ingredients contained in many of our beverages. However, industry-wide shortages of certain fruits and fruit juices, coffee, tea, supplements and sweeteners have been, and could from time to time in the future be, encountered, which could interfere with and/or delay production of certain of our products.
We continually endeavor to develop back-up sources of supply for certain of our flavors and concentrates as well as to negotiate arrangements with suppliers, which would enable us to obtain access to certain concentrates or our flavor formulas in certain circumstances. We have been partially successful in these endeavors. Additionally, in a limited number of cases, contractual restrictions and/or the necessity to obtain regulatory approvals and licenses may limit our ability to enter into agreements with alternative suppliers, manufacturers and/or distributors.
In connection with the development of new products and flavors, independent suppliers bear a large portion
of the expense of product development, thereby enabling us to develop new products and flavors at a relatively low cost. We have historically developed and successfully introduced new products, flavors and packaging for our products and intend to continue to develop and introduce additional new beverages, flavors and innovative packaging.
14
Competition
The beverage industry is highly competitive. The principal areas of competition are pricing, packaging, development of new products and flavors as well as promotional and marketing strategies. Our products compete with a wide range of drinks produced by a relatively large number of companies, many of which have substantially greater financial, marketing and distribution resources than we do.
Important factors affecting our ability to compete successfully include taste and flavor of products, trade and consumer promotions, rapid and effective development and marketing of new, unique cutting edge products, attractive and different packaging, branded product advertising, and pricing. We also compete for distributors who will give our products more focus than those of our competitors, provide stable and reliable distribution and secure adequate shelf space in retail outlets. Competitive pressures in the “alternative”, energy, coffee and “functional” beverage categories could cause our products to be unable to gain or to lose market share or we could experience price erosion, which could have a material adverse effect on our business and results of operations.
We have experienced substantial competition from new entrants in the energy drink and energy shot categories. A number of companies who market and distribute iced teas, juice cocktails and enhanced waters in larger volume packages, such as 16- and 20-ounce glass and plastic bottles, including Sobe, Sobe Life Water, Vitamin Water, Snapple, Arizona, Fuse, Ocean Spray, Honest Tea, Gold Peak Tea, Activate and Neuro, have added supplements to their products with a view to marketing their products as “functional” or energy beverages or as having “functional” benefits. We believe that many of those products contain lower levels of supplements, principally deliver refreshment and are positioned differently from our energy or “functional” drinks. Our Peace Tea® ready-to-drink iced teas are positioned more closely against those products.
We are also subject to increasing levels of regulatory issues particularly in relation to the registration and
taxation of our products in certain new international markets, which may put us at a competitive disadvantage. We compete not only for consumer preference, but also for maximum marketing and sales efforts by multi-
brand licensed bottlers, brokers and distributors, many of which have a principal affiliation with competing companies and brands. Our products compete with all liquid refreshments and in many cases with products of much larger and substantially better financed competitors, including the products of numerous nationally and internationally known producers such as TCCC, PepsiCo, Inc. (“PepsiCo”), The Dr. Pepper Snapple Group, Inc. (the “DPS Group”), Red Bull Gmbh, Kraft Foods, Inc., GlaxoSmithKline plc, Nestle Beverage Company, Tree Top and Ocean Spray. We also compete with companies that are smaller or primarily local in operation. Our products also compete with private label brands such as those carried by grocery store chains, convenience store chains and club stores.
Domestically, our energy drinks compete directly with Red Bull, Rockstar, Full Throttle, No Fear, Amp, Adrenaline Rush, NOS, Venom, Redline, 180, Red Devil, Rip It, 5-Hour Energy Shots, Stacker 2, VPX Redline Energy Shots, and many other brands. TCCC and PepsiCo also market and/or distribute additional products in that market segment such as Pepsi Max, Mountain Dew, Mountain Dew MDX and Vault. Internationally, our energy drinks compete with Red Bull, Rockstar, Burn, V-Energy, Lucozade, Relentless and numerous local and private label brands that usually differ from country to country, such as Power Play, Mother, Hell, Shock, Tiger and a host of other international brands.
Our Java Monster® and X-Presso Monster® product lines compete directly with Starbucks Frappuccino,
Starbucks Double Shot, Starbucks Double Shot Energy Plus Coffee and other Starbucks coffee drinks, Rockstar Roasted, Seattle’s Best, illy issimo coffee and Full Throttle Coffee.
Our Peace Tea® ready to drink iced tea product line competes directly with Arizona, Lipton, Snapple,
Nestea, Xing Tea, Honest Tea, Gold Peak Tea and other tea brands.
15
Our natural sodas compete directly with traditional soda products, including those marketed by TCCC, PepsiCo, the DPS Group, Cott Corporation and National Beverage Corporation, as well as with carbonated beverages marketed by smaller or primarily local companies such as Jones Soda Co., Clearly Canadian Beverage Company, Crystal Geyser, J.M. Smucker Company and with private label brands such as those carried by grocery store chains, convenience store chains and club stores.
Our apple and other juice products compete directly with Tree Top, Mott’s, Martinelli’s, Welch’s, Ocean Spray, Tropicana, Minute Maid, Langers, Apple and Eve, Seneca, Northland, Juicy Juice and also with other brands of apple juice and juice blends, including store brands.
Our fruit juice smoothies compete directly with Kern’s, Jumex and Jugos del Valle as well as with single-
serve juice products produced by many competitors. Our Hubert’s® Lemonades and Hubert’s® Half & Half lemonade + teas compete directly with Calypso,
Simply Lemonade, Mistic Drinks and Newman’s Own.
Sales and Marketing
Our sales and marketing strategy for all our beverages is to focus our efforts on developing brand awareness through image enhancing programs and product sampling. We use our branded vehicles and other promotional vehicles at events where we offer samples of our products to consumers. We utilize “push-pull” methods to enhance shelf and display space exposure in sales outlets (including advertising, in-store promotions and in-store placement of point-of-sale materials, racks, coolers and barrel coolers) to enhance demand from consumers for our products. We also support our brands with prize promotions, price promotions, competitions, endorsements from selected public and extreme sports figures, personality endorsements (including from television and other well known sports personalities), coupons, sampling and sponsorship of selected causes, events, athletes and teams. In-store posters, outdoor posters, print, radio and television advertising and coupons may also be used to promote our brands.
We believe that one of the keys to success in the beverage industry is differentiation, making our brands and products visually distinctive from other beverages on the shelves of retailers. We review our products and packaging on an ongoing basis and, where practical, endeavor to make them different, better and unique. The labels and graphics for many of our products are redesigned from time to time to maximize their visibility and identification, wherever they may be placed in stores, which we will continue to reevaluate from time to time.
Where appropriate, we partner with retailers to assist our marketing efforts. For example, while we retain responsibility for the marketing of our Hansen’s® line of children’s multi-vitamin juice drinks, Costco has undertaken partial responsibility for the marketing of the Juice Blast® line.
We increased expenditures for our sales and marketing programs by approximately 46.8% in 2011
compared to 2010. As of December 31, 2011, we employed 1,543 employees in sales and marketing activities, of which 701 were employed on a full-time basis. Customers
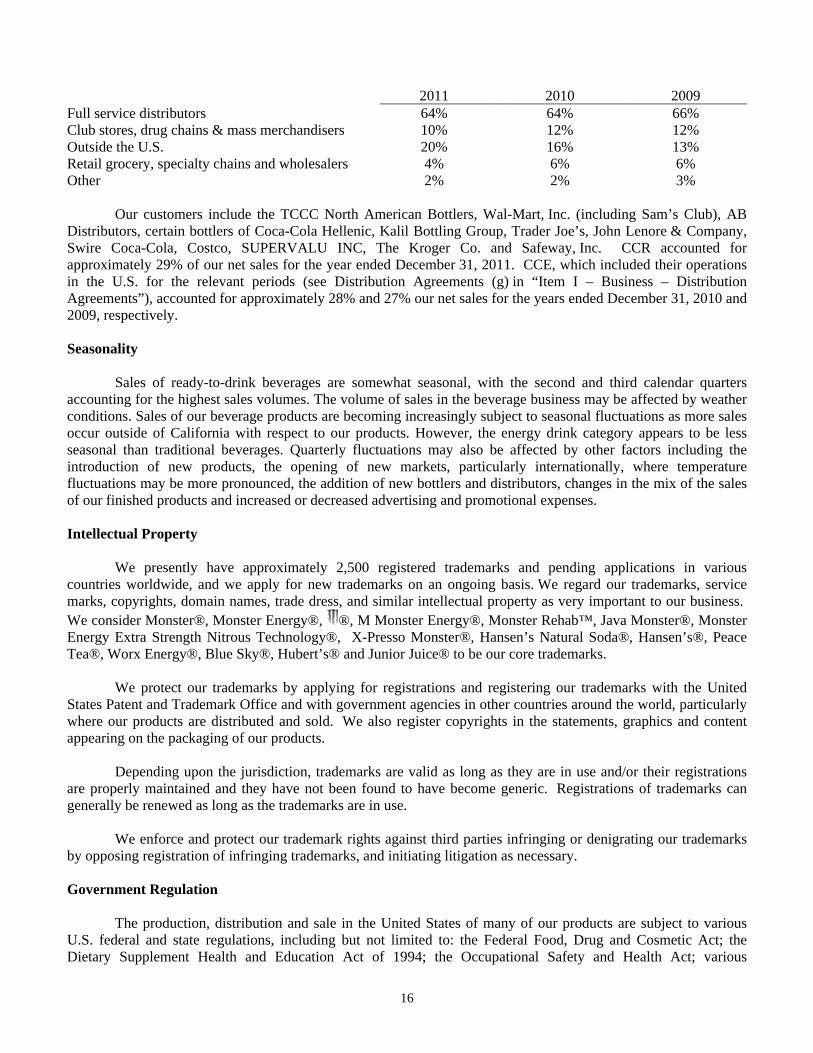
Our customers are primarily full service beverage distributors, retail grocery and specialty chains, wholesalers, club stores, drug chains, mass merchandisers, convenience chains, health food distributors, food service customers and the military. Gross sales to our various customer types for the years ended December 2011, 2010 and 2009 are reflected below. Such information reflects sales made by us directly to the customer types concerned, which include our full service beverage distributors in the United States. Such full service beverage distributors in turn sell certain of our products to the same customer types listed below. We do not have complete details of the sales of our products by our full service distributors to their respective customers and therefore limit our description of our customer types to include only our sales to such full service distributors, without reference to such distributor’s sales to their own customers.
16
2011 2010 2009 Full service distributors 64% 64% 66% Club stores, drug chains & mass merchandisers 10% 12% 12% Outside the U.S. 20% 16% 13% Retail grocery, specialty chains and wholesalers 4% 6% 6% Other 2% 2% 3%
Our customers include the TCCC North American Bottlers, Wal-Mart, Inc. (including Sam’s Club), AB Distributors, certain bottlers of Coca-Cola Hellenic, Kalil Bottling Group, Trader Joe’s, John Lenore & Company, Swire Coca-Cola, Costco, SUPERVALU INC, The Kroger Co. and Safeway, Inc. CCR accounted for approximately 29% of our net sales for the year ended December 31, 2011. CCE, which included their operations in the U.S. for the relevant periods (see Distribution Agreements (g) in “Item I – Business – Distribution Agreements”), accounted for approximately 28% and 27% our net sales for the years ended December 31, 2010 and 2009, respectively.
Seasonality
Sales of ready-to-drink beverages are somewhat seasonal, with the second and third calendar quarters accounting for the highest sales volumes. The volume of sales in the beverage business may be affected by weather conditions. Sales of our beverage products are becoming increasingly subject to seasonal fluctuations as more sales occur outside of California with respect to our products. However, the energy drink category appears to be less seasonal than traditional beverages. Quarterly fluctuations may also be affected by other factors including the introduction of new products, the opening of new markets, particularly internationally, where temperature fluctuations may be more pronounced, the addition of new bottlers and distributors, changes in the mix of the sales of our finished products and increased or decreased advertising and promotional expenses. Intellectual Property
We presently have approximately 2,500 registered trademarks and pending applications in various countries worldwide, and we apply for new trademarks on an ongoing basis. We regard our trademarks, service marks, copyrights, domain names, trade dress, and similar intellectual property as very important to our business. We consider Monster®, Monster Energy®, ®, M Monster Energy®, Monster Rehab™, Java Monster®, Monster Energy Extra Strength Nitrous Technology®, X-Presso Monster®, Hansen’s Natural Soda®, Hansen’s®, Peace Tea®, Worx Energy®, Blue Sky®, Hubert’s® and Junior Juice® to be our core trademarks.
We protect our trademarks by applying for registrations and registering our trademarks with the United
States Patent and Trademark Office and with government agencies in other countries around the world, particularly where our products are distributed and sold. We also register copyrights in the statements, graphics and content appearing on the packaging of our products.
Depending upon the jurisdiction, trademarks are valid as long as they are in use and/or their registrations are properly maintained and they have not been found to have become generic. Registrations of trademarks can generally be renewed as long as the trademarks are in use.
We enforce and protect our trademark rights against third parties infringing or denigrating our trademarks by opposing registration of infringing trademarks, and initiating litigation as necessary. Government Regulation
The production, distribution and sale in the United States of many of our products are subject to various U.S. federal and state regulations, including but not limited to: the Federal Food, Drug and Cosmetic Act; the Dietary Supplement Health and Education Act of 1994; the Occupational Safety and Health Act; various
17
environmental statutes; and a number of other federal, state and local statutes and regulations applicable to the production, transportation, sale, safety, advertising, labeling and ingredients of such products. Outside the United States, the production, distribution and sale of many of our products are also subject to numerous similar and other statutes and regulations.
We are also subject to Proposition 65 in California, a law which requires that a specific warning appear on
any product sold in California that contains a substance listed by that state as having been found to cause cancer or birth defects in excess of certain levels. If we were required to add warning labels to any of our products or place warnings in certain locations where our products are sold, it is difficult to predict whether, or to what extent, such a warning would have an impact on sales of our products in those locations or elsewhere. While none of our beverage products are currently required to display warnings under this law, we cannot predict whether a component of any of our products might be included in the future.
Proposals to limit or restrict the sale of energy drinks to minors and/or persons below a specified age and/or
restrict the venues in which energy drinks can be sold and/or impose taxation on the sale of energy drinks, continue to surface and are currently pending before certain state and/or county and/or foreign country legislatures and may from time to time be proposed and/or enacted by such legislatures. Should these current or any future proposals to enact legislation to limit or restrict the sale of energy drinks to minors and/or persons below a specified age and/or the venues in which energy drinks can be sold and/or impose taxation on the sale of energy drinks, succeed and become widespread, such legislation could result in a reduction in demand for our energy drinks and adversely affect our results of operations, see “Part I, Item 1A – Risk Factors” below.
Measures have been enacted in various localities and/or states and/or foreign countries that require that a
deposit be charged for certain non-refillable beverage containers. The precise requirements imposed by these measures vary by jurisdiction. Other deposit, recycling or product stewardship proposals have been introduced in certain states and localities and in the Congress of the United States and/or in certain foreign countries, and we anticipate that additional legislation or regulations in this regard may be proposed in the future at the local, state and federal levels, both in the United States and elsewhere.
Public health officials and health advocates are increasingly focused on the public health consequences
associated with obesity, especially as the disease affects children, and are encouraging consumers to reduce consumption of sweetened beverages. Increasing public concern about these issues could result in the implementation of governmental regulations concerning the marketing, labeling or availability of our beverages. The U.S. Food and Drug Administration has proposed revising regulations with respect to serving size information and nutrition labeling on food and beverage products. Compliance with Environmental Laws
Our facilities in the United States are subject to federal, state and local environmental laws and regulations. Our operations in other countries are subject to similar laws and regulations that may be applicable in such countries. Compliance with these provisions has not had, nor do we expect such compliance to have, any material adverse effect upon our capital expenditures, net income or competitive position.
In California, we are required to collect redemption values from our customers and to remit such redemption values to the State of California Department of Conservation based upon the number of cans and bottles of certain carbonated and non-carbonated products sold. In certain other states and countries where our products are sold, we are also required to collect deposits from our customers and to remit such deposits to the respective jurisdictions based upon the number of cans and bottles of certain carbonated and non-carbonated products sold in such states.
18
Employees
As of December 31, 2011, we employed a total of 1,900 employees of which 1,047 were employed on a full-time basis. Of our 1,900 employees, we employed 357 in administrative and operational capacities and 1,543 persons in sales and marketing capacities. Available Information
As a public company, we are required to file our annual reports on Form 10-K, quarterly reports on Form 10-Q, current reports on Form 8-K, proxy statements on Schedule 14A and other information (including any amendments) with the Securities and Exchange Commission (the “SEC”). You may read and copy such material at the SEC’s Public Reference Room located at 100 F Street, N.E., Washington, D.C. 20549. You may obtain information on the operation of the Public Reference Room by calling the SEC at 1-800-SEC-0330. You can also find the Company’s SEC filings at the SEC’s website at http://www.sec.gov.
Our Internet address is www.monsterbevcorp.com. Information contained on our website is not part of this
annual report on Form 10-K. Our SEC filings (including any amendments) will be made available free of charge on www.monsterbevcorp.com, as soon as reasonably practicable after we electronically file such material with, or furnish it to, the SEC. In addition, you may request a copy of these filings (excluding exhibits) at no cost by writing to, or telephoning us at the following address or telephone number:
Monster Beverage Corporation 550 Monica Circle, Suite 201
Corona, CA 92880 (951) 739-6200 (800) 426-7367
19
ITEM 1A. RISK FACTORS
In addition to the other information in this report, you should carefully consider the following risks. If any of the following risks actually occur, our business, financial condition and/or operating results could be materially adversely affected. The risk factors summarized below are not the only risks we face. Additional risks and uncertainties not currently known to us or that we currently deem to be immaterial also may materially adversely affect our business, financial condition and/or operating results. Significant changes in government regulation may hinder sales.
The production, distribution and sale in the United States of many of our products are subject to various federal and state regulations, including, but not limited to: the Federal Food, Drug and Cosmetic Act; the Dietary Supplement Health and Education Act of 1994; the Occupational Safety and Health Act; various environmental statutes; and various other federal, state and local statutes and regulations applicable to the production, transportation, sale, safety, advertising, labeling and ingredients of such products. Outside the United States, the production, distribution and sale of many of our products are also subject to numerous similar and other statutes and regulations. New statutes and regulations may also be instituted in the future. If a regulatory authority finds that a current or future product or production run is not in compliance with any of these regulations, we may be fined, or such products may have to be recalled and/or reformulated and/or have the packaging changed, thus adversely affecting our financial condition and operations. In particular, California law requires that a specific warning appear on any product that contains a component listed by the State of California as having been found to cause cancer or birth defects above certain levels. While we do not believe that any of our beverage products are currently required to display warnings under this law, we cannot predict whether an important component of any of our products might be added to the California list in the future. We also are unable to predict whether or to what extent a warning under this law would have an impact on costs or sales of our products. Proposals to limit or restrict the sale of energy drinks to minors and/or persons below a specified age and/or restrict the venues in which energy drinks can be sold and/or to impose taxation on the sale of energy drinks, continue to emerge and are currently pending before certain state and/or county and/or other foreign country legislatures. Should these current or any future proposals to enact legislation to limit or restrict the sale of energy drinks to minors and/or persons below a specified age and/or the venues in which energy drinks can be sold and/or to impose taxation of the sale of energy drinks, succeed and/or be enacted by additional states, counties and/or other jurisdictions, such legislation could result in a reduction in demand for our energy drinks and adversely affect our results of operations.
Public health officials and health advocates are increasingly focused on the public health consequences
associated with obesity, especially as the disease affects children, and are encouraging consumers to reduce consumption of sweetened beverages. Increasing public concern about these issues could result in the implementation of governmental regulations concerning the marketing, labeling or availability of our beverages. The U.S. Food and Drug Administration has proposed revising regulations with respect to serving size information and nutrition labeling on food and beverage products. If such definitive regulation is promulgated, we may incur significant costs to alter our existing packaging materials to comply with such regulations. Additionally, revised serving size information may impact and/or reduce and/or otherwise affect the purchase and consumption of our products by our consumers.
The U.S. Congress and several state legislatures have considered proposals to impose an excise tax on
sweetened beverages. The imposition of such taxes on our products would increase the cost of products or, to the extent levied directly on consumers, make our products less affordable, both of which could reduce demand for our beverages and adversely affect our results of operations. Additionally, on January 1, 2011, the Mexican legislature imposed a 25% excise tax on energy drinks. We have adjusted the caffeine levels in our Monster Energy® products that are sold in Mexico to address this legislation. In 2011, Hungary implemented a tax on energy drinks. In light of this tax, we are adjusting the formulation of our energy drinks in Hungary. However, such actions, or other actions by retailers to line price energy drinks generally irrespective of tax treatment, could decrease consumer demand for our products and adversely affect our results of operations. Furthermore, if similar taxes are imposed in other jurisdictions where we distribute our products, such taxes could result in a reduction in demand for our energy drinks and adversely affect our results of operations.
20
We derive a substantial portion of our revenues from our energy drinks and criticism of our energy drink products and/or of the energy drink market generally could adversely affect our operating results.
Our energy drink products currently generate the vast majority of our revenues. Criticism of our energy drink products, including criticism by healthcare professionals of the nutritional benefits of our energy drink products and other criticism for a variety of reasons, could affect consumer opinions of our energy drink products and result in decreased demand, which in turn could have an adverse effect on our results of operations and business. Increased competition could hurt our business.
The beverage industry is highly competitive. The principal areas of competition are pricing, packaging, development of new products and flavors and promotion and marketing strategies. Our products compete with a wide range of drinks produced by a relatively large number of manufacturers, many of which have substantially greater financial, marketing and distribution resources than we do.
Important factors affecting our ability to compete successfully include the taste and flavor of our products, trade and consumer promotions, rapid and effective development of new, unique cutting edge products, attractive and different packaging, branded product advertising and pricing. Our products compete with all liquid refreshments and in many cases with products of much larger and substantially better financed competitors, including the products of numerous nationally and internationally known producers such as TCCC, PepsiCo, Red Bull Gmbh, the DPS Group, Kraft Foods Inc., GlaxoSmithKline plc, and Nestle Beverage Company. We also compete with companies that are smaller or primarily national or local in operations. Our products also compete with private label brands such as those carried by grocery store chains, convenience store chains, and club stores.
There can be no assurance that we will not encounter difficulties in maintaining our current revenues or
market share or position due to competition in the beverage industry. If our revenues decline, our business, financial condition and results of operations could be adversely affected. Continued uncertainty in the financial markets and other adverse changes in general economic or political conditions in any of the major countries in which we do business could adversely affect our industry, business and results of operations.
In 2011, the global economy improved as compared to 2010, however uncertainty continues to exist as to the overall rate and stability of the recovery. More recently, turmoil in the European credit markets and the sovereign debt crisis in the Euro-zone have posed potential threats to global growth and market stability, and European growth and stability in particular, and thereby increased global macroeconomic uncertainties. These economic uncertainties affect businesses such as ours in a number of ways, making it difficult to accurately forecast and plan our future business activities. The current global economic conditions may lead consumers to decrease spending, or change their existing and future purchasing habits for cheaper alternatives. In addition, financial difficulties experienced by our suppliers or customers could result in product delays, possible accounts receivable defaults and inventory challenges. There can be no assurance that any of the recent economic improvements will be broad-based and sustainable, or that they will enhance conditions in markets relevant to us. In addition, we cannot predict the duration and severity of the current disruptions in Europe or the impact they may have on our customers or business, as our expansion outside of the United States has increased our exposure to any crisis in European and other international markets. Additionally, many of our products are considered premium products and to maintain market share during recessionary periods we may have to reduce profit margins, which could adversely affect our results of operations. If the improved economic conditions are slower than anticipated or if conditions worsen, our business and results of operations could be materially and adversely affected.
21
Changes in consumer preferences may reduce demand for some of our products.
The beverage industry is subject to changing consumer preferences and shifts in consumer preferences may adversely affect us. There is increasing awareness of and concern for the health consequences of obesity. This may reduce demand for our non-diet beverages, which could reduce our revenues and adversely affect our results of operations.
Consumers are seeking greater variety in their beverages. Our future success will depend, in part, upon our continued ability to develop and introduce different and innovative beverages that appeal to consumers. In order to retain and expand our market share, we must continue to develop and introduce different and innovative beverages and be competitive in the areas of taste, quality and health, although there can be no assurance of our ability to do so. There is no assurance that consumers will continue to purchase our products in the future. Product lifecycles for some beverage brands and/or products and/or packages may be limited to a few years before consumers’ preferences change. The beverages we currently market are in varying stages of their product lifecycles and there can be no assurance that such beverages will become or remain profitable for us. We may be unable to achieve volume growth through product and packaging initiatives. We also may be unable to penetrate new markets. If our revenues decline, our business, financial condition and results of operations could be adversely affected. Operations outside the United States expose us to uncertain conditions and other risks in international markets.
Our gross sales to customers outside of the United States were approximately 20%, 16% and 13% of consolidated gross sales for the years ended December 31, 2011, 2010 and 2009, respectively, and our growth strategy includes further expanding our international business. If we are unable to continue to expand distribution of our products outside the United States, our growth rate could be adversely affected. In many international markets, we have limited operating experience and in some areas we have no operating experience. It is costly to establish, develop and maintain international operations and develop and promote our brands in international markets. Our percentage gross profit margins in many international markets are expected to be less than the comparable percentage gross profit margins obtained in the U.S. We face and will continue to face substantial risks associated with having foreign operations, including: economic and/or political instability in our international markets; restrictions on or costs relating to the repatriation of foreign profits to the United States, including possible taxes and/or withholding obligations on any repatriations; and tariffs and/or trade restrictions. These risks could have a significant impact on our ability to sell our products on a competitive basis in international markets and could have a material adverse effect on our business, financial condition and results of operations. Also, our operations outside of the United States are subject to risks relating to appropriate compliance with legal and regulatory requirements in local jurisdictions, potential difficulties in staffing and managing local operations, potentially higher incidence of fraud and/or corruption, credit risk of local customers and distributors and potentially adverse tax consequences.
Global or regional catastrophic events could impact our operations and affect our ability to grow our business.
Because of our increasingly global presence, our business could be affected by unstable political
conditions, civil unrest, large-scale terrorist acts, especially those directed against the United States or other major industrialized countries where our products are distributed, the outbreak or escalation of armed hostilities, major natural disasters or widespread outbreaks of infectious diseases. Such events could impact the production and distribution of our products. In addition, such events could disrupt global or regional economic activity, which could affect consumer purchasing power, thereby reducing demand for our products. If we are unable to grow our business internationally as a result of these factors, our growth rate could decline. Fluctuations in foreign currency exchange rates may adversely affect our operating results.
We are exposed to foreign currency exchange rate risk with respect to our sales, expenses, profits, assets and liabilities denominated in currencies other than the U.S. dollar. We have not used instruments to hedge certain foreign currency risks and are not protected against foreign currency fluctuations. As a result, our reported earnings may be affected by changes in foreign currency exchange rates. Moreover, any favorable impacts to profit margins or financial results from fluctuations in foreign currency exchange rates are likely to be unsustainable over time.
22
We derive a substantial portion of revenues from our energy drinks and competitive pressure in the energy drink category could adversely affect our operating results.
A substantial portion of our sales are derived from our energy drinks, including in particular our Monster Energy® brand energy drinks. Our DSD segment, which is comprised primarily of energy drinks, represented 94.4% of net sales for the year ended December 31, 2011. Any decrease in the sales of our Monster Energy® brand and other energy drinks could significantly adversely affect our future revenues and net income. Historically, we have experienced substantial competition from new entrants in the energy drink category as well as from the more recently emerging energy shot category. Domestically, our energy drinks compete directly with Red Bull, Rockstar, Full Throttle, No Fear, Amp, Adrenaline Rush, NOS, Venom, Redline, 180, Red Devil, Rip It, Starbucks Double Shot, Starbucks Double Shot Energy Plus Coffee, Rockstar Roasted, Full Throttle Coffee, 5-Hour Energy Shots, Stacker 2, VPX Redline Energy Shots and many other brands. A number of companies who market and distribute iced teas, juice cocktails and enhanced waters in different packages, such as 16- and 20-ounce glass and plastic bottles, including Sobe, Sobe Life Water, Snapple, Arizona, Fuse, Ocean Spray, Honest Tea, Gold Peak Tea, Activate, Neuro and Vitamin Water, have added supplements to their products with a view to marketing their products as “functional” or energy beverages or as having “functional” benefits. In addition, certain large companies such as TCCC and PepsiCo, market and/or distribute products in that market segment such as Pepsi Max, Mountain Dew, Mountain Dew MDX and Vault. Internationally, our energy drinks compete with Red Bull, Rockstar, Burn, V-Energy, Lucozade, Relentless and numerous local and private label brands that usually differ from country to country, such as Power Play, Mother, Hell, Shock, Tiger and a host of other international brands. Our Java Monster® product line competes directly with Starbucks Frappuccino, Starbucks Double Shot, Starbucks Double Shot Energy Plus Coffee and other Starbucks coffee drinks, Rockstar Roasted, Seattle’s Best, illy issimo coffee drinks and Full Throttle Coffee. Competitive pressures in the energy drink category could impact our revenues and/or we could experience price erosion and/or lower market share, any of which could have a material adverse effect on our business and results of operations.
We rely on bottlers and other contract packers to manufacture our products. If we are unable to maintain good relationships with our bottlers and contract packers and/or their ability to manufacture our products becomes constrained or unavailable to us, our business could suffer.
We do not directly manufacture our products, but instead outsource such manufacturing to bottlers and other contract packers. In the event of a disruption and/or delay, we may be unable to procure alternative packing facilities at commercially reasonable rates and/or within a reasonably short time period. In addition, there are limited alternative packing facilities in our domestic and international markets with adequate capacity and/or suitable equipment for many of our products, including Monster Energy®, Monster Rehab™, Monster Energy Extra Strength Nitrous Technology®, X-Presso Monster®, Monster Energy® Import and Import Light, Monster Energy® Dub Edition energy drinks and Monster Energy® M3™ Super Concentrate in 6.75-ounce and/or 8.3-ounce and/or 9.6-ounce and/or 12-ounce and/or 15.5-ounce and/or 16-ounce and/or 23.5-ounce and/or 24-ounce and/or 32-ounce and/or 500ml aluminum cans and/or 18.6-ounce BRE aluminum cans and/or 5-ounce glass bottles and/or 12-ounce, 15-ounce and 24-ounce aluminum cap cans, our Java Monster® product line in 15-ounce aluminum cans, Worx Energy® energy shots in 2-ounce wide-mouth PET plastic bottles, our Peace Tea® product line in 23-ounce aluminum cans, our Hansen’s® brand energy drinks in 8.3-ounce cans, aseptic juice products in 4.23-ounce and 6.75-ounce aseptic boxes, our Hubert’s® Lemonades in 16-ounce glass bottles, our Hubert’s® Half & Half in 16-ounce aluminum cans and other products. A disruption or delay in production of any of such products could significantly affect our revenues from such products as alternative co-packing facilities in the United States and abroad with adequate capacity may not be available for such products either at commercially reasonable rates, and/or within a reasonably short time period, if at all. Consequently, a disruption in production of such products could adversely affect our revenues.
We rely on bottlers and distributors to distribute our DSD segment products. If we are unable to maintain good relationships with our existing bottlers and distributors and/or secure such bottlers and distributors, our business could suffer.
23
Many of our bottlers and distributors are affiliated with and manufacture and/or distribute other soda, carbonated and non-carbonated brands and other beverage products (both alcoholic and non-alcoholic), including energy drinks. In many cases, such products compete directly with our products.
The TCCC North American Bottlers, AB Distributors, New CCE and Coca-Cola Hellenic are our primary domestic and international distributors of our Monster Energy® beverages. If we are unable to maintain good relationships with the TCCC North American Bottlers and/or the AB Distributors and/or New CCE and/or Coca-Cola Hellenic, or if the TCCC North American Bottlers and/or AB Distributors and/or New CCE and/or Coca-Cola Hellenic do not effectively focus on marketing, promoting, selling and distributing our products, sales of our Monster Energy® beverages could be adversely affected.
We continually seek to expand distribution of our products by entering into agreements with regional bottlers and/or other direct store delivery distributors having established sales, marketing and distribution organizations.
The marketing efforts of our distributors are important for our success. If our DSD segment brands prove to
be less attractive to our existing bottlers and distributors and/or if we fail to attract additional bottlers and distributors, and/or our bottlers and/or distributors do not market, promote and distribute our products effectively, our business, financial condition and results of operations could be adversely affected. Our customers are material to our success. If we are unable to maintain good relationships with our existing customers, our business could suffer.
Unilateral decisions could be taken by our distributors, convenience chains, grocery chains, specialty chain
stores, club stores and other customers to discontinue carrying all or any of our products that they are carrying at any time, which could cause our business to suffer.
CCR accounted for approximately 29% of our net sales for the year ended December 31, 2011. CCE
accounted for approximately 28% and 27% our net sales for the years ended December 31, 2010 and 2009, respectively. A decision by CCR, CCRC, New CCE, Wal-Mart, Inc. (including Sam’s Club), Coca-Cola Hellenic, or any other large customer to decrease the amount purchased from us or to cease carrying our products could have a material adverse effect on our financial condition and consolidated results of operations.
Increases in costs and/or shortages of raw materials and/or ingredients and/or fuel and/or costs of co-packing could harm our business.
The principal raw materials used by us are aluminum cans, PET plastic bottles, as well as juice concentrates, sugar, sucralose, supplements, milk and cream, the costs and availability of which are subject to fluctuations. In addition, certain of our co-pack arrangements allow such co-packers to increase their charges based on certain of their own cost increases. We are uncertain whether the prices of any of the above or any other raw materials or ingredients, certain of which have risen, will continue to rise or may rise in the future. We are unsure whether we will be able to pass any of such increases on to our customers. We generally do not use hedging agreements or alternative instruments to manage the risks associated with securing sufficient ingredients or raw materials although we do, from time to time, enter into purchase agreements for a significant portion of our annual anticipated requirements for certain raw materials such as aluminum cans, apple juice and sugar.
In addition, some of these raw materials, such as certain sizes of cans, are available from a limited number of suppliers.
Our failure to accurately estimate demand for our products could adversely affect our business and financial results.
We may not correctly estimate demand for our products. Our ability to estimate demand for our products is imprecise, particularly with new products, and may be less precise during periods of rapid growth, particularly in
24
new markets. If we materially underestimate demand for our products or are unable to secure sufficient ingredients or raw materials including, but not limited to, aluminum cans, PET plastic bottles, glass, labels, sucralose, flavors, supplements, juice concentrates, certain sweeteners, coffee, tea or packing arrangements, we might not be able to satisfy demand on a short-term basis. Moreover, industry-wide shortages of certain juice concentrates, supplements and sweeteners have been and could, from time to time in the future, be experienced. We generally do not use hedging agreements or alternative instruments to manage this risk. Such shortages could interfere with and/or delay production of certain of our products and could have a material adverse effect on our business and financial results. The costs of packaging supplies are subject to price increases from time to time and we may be unable to pass all or some of such increased costs on to our customers.
Many of our packaging supply contracts allow our suppliers to alter the costs they charge us for packaging supplies based on changes in the costs of the underlying commodities that are used to produce those packaging supplies, such as aluminum for cans, resin for PET plastic bottles, and pulp and paper for cartons and/or trays. These changes in the prices we pay for our packaging supplies occur at certain predetermined times that vary by product and supplier. In some cases, we are able to fix the prices of certain packaging supplies and/or commodities for a reasonable period. In other cases, we bear the risk of increases in the costs of these packaging supplies, including the underlying costs of the commodities that comprise these packaging supplies. We do not use derivative instruments to manage this risk. If the costs of these packaging supplies increase, we may be unable to pass these costs along to our customers through corresponding adjustments to the prices we charge, which could have a material adverse effect on our results of operations. We rely upon our ongoing relationships with our key flavor suppliers. If we are unable to source our flavors on acceptable terms from our key suppliers, we could suffer disruptions in our business.
Generally, flavor suppliers hold the proprietary rights to their flavors. Consequently, we do not have the list of ingredients or formulae for our flavors and certain of our concentrates readily available to us and we may be unable to obtain these flavors or concentrates from alternative suppliers on short notice. If we must replace a flavor supplier, we could experience temporary disruptions in our ability to deliver products to our customers, which could have a material adverse effect on our results of operations.
Our intellectual property rights are critical to our success, and the loss of such rights could materially adversely affect our business.
We own numerous trademarks that are very important to our business. We also own the copyright in and to a portion of the content on the packaging of our products. We regard our trademarks, copyrights, and similar intellectual property as critical to our success and attempt to protect such intellectual property with registered and common law trademarks and copyrights, restrictions on disclosure and other actions to prevent infringement. However, there can be no assurance that other third parties will not infringe or misappropriate our trademarks and similar proprietary rights. If we lose some or all of our intellectual property rights, our business may be materially adversely affected. If we are unable to maintain brand image or product quality, or if we encounter product recalls, our business may suffer.
Our success depends on our ability to build and maintain brand image for our existing products, new products and brand extensions. We have no assurance that our advertising, marketing and promotional programs will have the desired impact on our products’ brand image and on consumer preference and demand. Product quality and/or ingredient content issues, efficacy or lack thereof, real or imagined, or allegations of product contamination, even if false or unfounded, could tarnish the image of the affected brands and may cause consumers to choose other products. We may be required from time to time to recall products entirely or from specific co-packers, markets or batches. Product recalls could adversely affect our profitability and our brand image. We do not maintain recall insurance.
25
While we have to date not experienced any credible product liability litigation, there is no assurance that we will not experience such litigation in the future. In the event we were to experience product liability claims or a product recall, our financial condition and business operations could be materially adversely affected.
If we do not maintain sufficient inventory levels and/or if we are unable to deliver our products to our customers in sufficient quantities, and/or if our retailers’ inventory levels are too high, our operating results could be adversely affected.
If we do not accurately anticipate the future demand for a particular product or the time it will take to obtain new inventory, our inventory levels may be inadequate and our results of operations may be negatively impacted. If we fail to meet our shipping schedules, we could damage our relationships with distributors and/or retailers, increase our distribution costs and/or cause sales opportunities to be delayed or lost. In order to be able to deliver our products on a timely basis, we need to maintain adequate inventory levels of the desired products. If the inventory of our products held by our distributors and/or retailers is too high, they will not place orders for additional products, which could unfavorably impact our future sales and adversely affect our operating results. If we are not able to retain the full-time services of senior management there may be an adverse effect on our operations and/or our operating performance until we find suitable replacements.
Our business is dependent, to a large extent, upon the services of our senior management. We do not maintain key person life insurance on any members of our senior management. The loss of services of either Mr. Sacks, Chairman and Chief Executive Officer, Mr. Schlosberg, President and Chief Financial Officer, or any other key members of our senior management could adversely affect our business until suitable replacements can be found. There may be a limited number of personnel with the requisite skills to serve in these positions and we may be unable to locate or employ such qualified personnel on acceptable terms.
Climate change may negatively affect our business.
There is concern that a gradual increase in global average temperatures could cause significant changes in weather patterns around the globe and an increase in the frequency and severity of natural disasters. While warmer weather has historically been associated with increased sales of our products, changing weather patterns could result in decreased agricultural productivity in certain regions, which may limit availability and/or increase the cost of certain key ingredients, juice concentrates and supplements used in our products. Increased frequency or duration of extreme weather conditions could also impair production capabilities, disrupt our supply chain including, without limitation, the availability of, and/or result in higher prices for, juice concentrates, natural flavors and supplements or impact demand for our products. In addition, public expectations for reductions in greenhouse gas emissions could result in increased energy, transportation and raw material costs and may require us to make additional investments in facilities and equipment. As a result, the effects of climate change could have a long-term adverse impact on our business and results of operations. Sales of our products may also be influenced to some extent by weather conditions in the markets in which we operate. Weather conditions may influence consumer demand for certain of our beverages, which could have an adverse effect on our results of operations. Potential changes in accounting practices and/or taxation may adversely affect our financial results.
We cannot predict the impact that future changes in accounting standards or practices may have on our financial results. New accounting standards could be issued that change the way we record revenues, expenses, assets and liabilities. These changes in accounting standards could adversely affect our reported earnings. Increases in direct and indirect income tax rates could affect after tax income. Equally, increases in indirect taxes (including environmental taxes pertaining to the disposal of beverage containers) could affect our products’ affordability and reduce our sales.
26
Volatility of stock price may restrict sale opportunities.
Our stock price is affected by a number of factors, including stockholder expectations, financial results, the introduction of new products by us and our competitors, general economic and market conditions, estimates and projections by the investment community and public comments by other parties and many other factors, many of which are beyond our control. We may be unable to achieve analysts’ earnings forecasts, which may be based on their own projected revenues, sales volumes and sales mix of many product types and/or new products, certain of which are more profitable than others, as well as their own estimates of sales revenues, gross margin and operating expenses. There can be no assurance that we will achieve projected levels or mixes of product sales and/or revenues and/or gross margins and/or operating profits and/or net income. As a result, our stock price is subject to significant volatility and stockholders may not be able to sell our stock at attractive prices. In addition, periods of volatility in the market price of our stock could result in the initiation of securities class action litigation against us. During the fiscal year ended December 31, 2011, our stock price high was $49.18 and stock price low was $25.84, as adjusted for the Stock Split.
Provisions in our organizational documents and control by insiders may prevent changes in control even if such changes would be beneficial to other stockholders.
Our organizational documents may limit changes in control. Furthermore, as of February 9, 2012, Mr. Sacks and Mr. Schlosberg together may be deemed to beneficially own and/or exercise voting control over approximately 19% of our outstanding common stock. Consequently, Mr. Sacks and Mr. Schlosberg could exercise significant control over matters submitted to a vote of our stockholders, including electing directors, amending organizational documents and disapproving extraordinary transactions such as a takeover attempt, even though such actions may be favorable to the other common stockholders.
Our cash flow may not be sufficient to fund our long term goals.
Although we currently have sufficient cash to support our planned operating activities in the current year, we may be unable to generate sufficient cash flow to support our capital expenditure plans and general operating activities in the future. In addition, the terms and/or availability of our credit facility and/or the activities of our creditors could affect the financing of our future growth.
Our investments in marketable securities are subject to risks which may cause losses and affect the liquidity of these investments.
At December 31, 2011, we had $359.3 million in cash and cash equivalents and $434.5 million in short-
and long-term investments. We have historically invested these amounts in U.S. Treasury bills, government agencies and municipal securities (which may have an auction reset feature), corporate notes and bonds, commercial paper and money market funds meeting certain criteria. Certain of these investments are subject to general credit, liquidity, market and interest rate risks, which may be exacerbated by the U.S. sub-prime mortgage defaults that continue to affect various sectors of the financial markets and caused credit and liquidity issues. These market risks associated with our investment portfolio may have an adverse effect on our future results of operations, liquidity and financial condition.
Certain of our short-term investments and all of our long-term investments are comprised of municipal or
educational related or other public body notes with an auction reset feature (“auction rate securities”). Liquidity for these auction rate securities was typically provided by an auction process which allowed holders to sell their notes at periodic auctions. Since 2008, the auctions for these auction rate securities failed, and there is no assurance that future auctions will succeed.
At December 31, 2011, we held auction rate securities with a face value of $44.8 million (amortized cost
basis of $35.9 million).
27
In June 2011, we entered into an agreement (the “2011 ARS Agreement”), related to $24.5 million of par value auction rate securities (the “2011 ARS Securities”). Under the 2011 ARS Agreement, we have the right to sell the 2011 ARS Securities including all accrued but unpaid interest thereon (the “2011 Put Option”) as follows: (i) on or after July 1, 2013, up to $1.0 million aggregate par value; (ii) on or after October 1, 2013, up to an additional $1.0 million aggregate par value; and (iii) in quarterly installments thereafter based on a formula of the then outstanding 2011 ARS securities, as adjusted for normal market redemptions, with full sale rights available on or after April 1, 2016. During the year ended December 31, 2011, $3.7 million of par value 2011 ARS Securities were redeemed at par through normal market channels.
In March 2010, we entered into an agreement (the “2010 ARS Agreement”), related to $54.2 million of par
value auction rate securities (the “2010 ARS Securities”). Under the 2010 ARS Agreement, we have the right, but not the obligation, to sell the 2010 ARS Securities including all accrued but unpaid interest thereon (the “2010 Put Option”) as follows: (i) on or after March 22, 2011, up to $13.6 million aggregate par value; and (ii) equal semi-annual or annual installments thereafter with full sale rights available on or after March 22, 2013. During the year ended December 31, 2011, $27.1 million of par value 2010 ARS Securities were redeemed at par through the exercise of the 2010 Put Option and $4.0 million of par value 2010 ARS Securities were redeemed at par through normal market channels ($7.4 million of par value 2010 ARS Securities were redeemed at par through normal market channels during the year ended December 31, 2010).
If the issuers of these auction rate securities are unable to refinance their debts and call the notes or
successfully close future auctions and their credit ratings deteriorate, we may be required to record additional impairment charges on these investments in the future. If uncertainties in the credit and capital markets continue or there are ratings downgrades on the auction rate securities held by us, we may be required to recognize additional impairments on these investments. We may be required to wait until market stability is restored to redeem these instruments, for the related Put Options to be exercisable, or until the final maturity of the underlying notes (up to 40 years) to realize our investments’ recorded value (See “Part II, Item 7A – Qualitative And Quantitative Disclosures About Market Risks” and “Part II, Item 8, Notes 2 and 3” in our consolidated financial statements”).
If we fail to maintain effective disclosure controls and procedures and internal control over financial reporting on a consolidated basis, our stock price and investor confidence in our Company could be materially and adversely affected.
We are required to maintain both disclosure controls and procedures and internal control over financial reporting that are effective for the purposes described in “Part II, Item 9A – Controls and Procedures.” If we fail to do so, our business, results of operations, financial condition or the value of our stock could be materially harmed. Litigation or legal proceedings could expose us to significant liabilities and thus negatively affect our financial results.
We are a party, from time to time, to various litigation claims and legal proceedings, including, but not limited to, intellectual property, fraud, unfair business practices and false advertising, breach of contract claims, securities actions and shareholder derivative actions. Material legal proceedings are described more fully in “Part I, Item 3 – Legal Proceedings” and in “Part II, Item 8, Note 9” to our consolidated financial statements contained in this Form 10-K.
Defending these proceedings can result in significant ongoing expenditures and the diversion of our management’s time and attention from the operation of our business, which could have a negative effect on our business operations. Our failure to successfully defend or settle any litigation or legal proceedings could result in liabilities that, to the extent not covered by our insurance, could have a material adverse effect on our financial condition, revenue and profitability, and could cause the market value of our common stock to decline.
We must continually maintain, protect and/or upgrade our information technology systems.
Information technology helps us operate efficiently, interface with customers, maintain financial accuracy
and efficiency, and accurately produce our financial statements. If we do not allocate and effectively manage the
28
resources necessary to build and sustain the proper technology infrastructure, we could be subject to transaction errors, processing inefficiencies, the loss of customers, business disruptions, or the loss of or damage to intellectual property through security breaches, including cybersecurity attacks. Cybersecurity attacks are evolving and include, but are not limited to, malicious software, attempts to gain unauthorized access to data, and other electronic security breaches that could lead to disruptions in systems, unauthorized release of confidential or otherwise protected information and corruption of data. We believe that we have adopted appropriate measures to mitigate potential risks to our technology and our operations from these information technology-related disruptions. However, given the unpredictability of the timing, nature and scope of such disruptions, we could potentially be subject to operational interruption, damage to our brand image and private data exposure. Moreover, if our data management systems, including our SAP enterprise resource planning system, do not effectively collect, store, process and report relevant data for the operation of our business, whether due to equipment malfunction or constraints, software deficiencies, cybersecurity attack, or human error, our ability to effectively plan, forecast and execute our business plan and comply with applicable laws and regulations will be impaired, perhaps materially. Any such impairment could materially and adversely affect our financial condition, results of operations, cash flows and the timeliness with which we report our internal and external operating results.
ITEM 1B. UNRESOLVED STAFF COMMENTS
Not applicable.
ITEM 2. PROPERTIES Our leased corporate offices are located in Corona, California. Our main warehouse and distribution space
is located in a leased 346,495 square-foot building in Corona, California. We lease less significant office and warehouse space both domestically and in certain international locations.
During October 2011, we entered into an agreement to acquire an approximately 75,425 square foot, free
standing, three-story office building, including the real property thereunder and improvements thereon, located in Corona, CA, for a purchase price of approximately $8.2 million. The purchase is subject to various conditions precedent that must be satisfied prior to the closing. If we ultimately acquire the building, we intend to complete any necessary improvements and occupy the building as our new corporate headquarters at some time in the future. ITEM 3. LEGAL PROCEEDINGS
In September 2006, Christopher Chavez purporting to act on behalf of himself and a certain class of consumers filed an action in the Superior Court of the State of California, County of San Francisco, against the Company and its subsidiaries for unfair business practices, false advertising, violation of California Consumers Legal Remedies Act (“CLRA”), fraud, deceit and/or misrepresentation alleging that the Company misleadingly labels its Blue Sky® beverages as manufactured and canned/bottled wholly in Santa Fe, New Mexico. Defendants removed this Superior Court action to the United States District Court for the Northern District of California (the “District Court”) under the Class Action Fairness Act and filed motions for dismissal or transfer. On June 11, 2007, the District Court granted the Company’s motion to dismiss Chavez’s complaint with prejudice. On June 23, 2009, the United States Court of Appeals for the Ninth Circuit (“Ninth Circuit”) filed a memorandum opinion reversing the decision of the District Court and remanded the case to the District Court for further proceedings. The Company filed a motion to dismiss the CLRA claims; the plaintiff filed a motion for a decision on a preemption issue; and the plaintiff filed a motion for class certification. On June 18, 2010, the District Court entered an order certifying the class, ruled that there was no preemption by federal law, and denied the Company’s motion to dismiss. The class that the District Court certified initially consists of all persons who purchased any beverage bearing the Blue Sky mark or brand in the United States at any time between May 16, 2002 and June 30, 2006. On September 9, 2010, the District Court approved the form of the class notice and its distribution plan; and set an opt-out date of December 10, 2010. On January 27, 2012, the parties entered into a settlement agreement on terms acceptable to the Company. On February 23, 2012, the District Court granted preliminary approval of the class action settlement agreement. A final approval hearing is scheduled for May 11, 2012. If approved, the
29
Company does not believe that the settlement will have a material adverse effect on the Company’s financial position or results of operations.
In May 2009, Avraham Wellman, purporting to act on behalf of himself and a class of consumers in
Canada, filed a putative class action in the Ontario Superior Court of Justice, in the City of Toronto, Ontario, Canada, against the Company and its former Canadian distributor, Pepsi-Cola Canada Ltd., as defendants. The plaintiff alleges that the defendants misleadingly packaged and labeled Monster Energy® products in Canada by not including sufficiently specific statements with respect to contra-indications and/or adverse reactions associated with the consumption of the energy drink products. The plaintiff’s claims against the defendants are for negligence, unjust enrichment, and making misleading/false representations in violation of the Competition Act (Canada), the Food and Drugs Act (Canada) and the Consumer Protection Act, 2002 (Ontario). The plaintiff claims general damages on behalf of the putative class in the amount of CDN$20 million, together with punitive damages of CDN$5 million, plus legal costs and interest. The plaintiff’s certification motion materials have not yet been filed. The Company believes that any such damages, if awarded, would not have a material adverse effect on the Company’s financial position or results of operations. In accordance with class action practices in Ontario, the Company will not file an answer to the complaint until after the determination of the certification motion. The Company believes that the plaintiff’s complaint is without merit and plans a vigorous defense.
Securities Litigation — On September 11, 2008, a federal securities class action complaint styled Cunha v. Hansen Natural Corp., et al. was filed in the United States District Court for the Central District of California (the “District Court”). On September 17, 2008, a second federal securities class action complaint styled Brown v. Hansen Natural Corp., et al. was also filed in the District Court.
On July 14, 2009, the District Court entered an order consolidating the actions and appointing lead counsel and the Structural Ironworkers Local Union #1 Pension Fund as lead plaintiff. On August 28, 2009, lead plaintiff filed a Consolidated Complaint for Violations of Federal Securities Laws (the “Consolidated Class Action Complaint”). The Consolidated Class Action Complaint purported to be brought on behalf of a class of purchasers of the Company’s stock during the period November 9, 2006 through November 8, 2007 (the “Class Period”). It named as defendants the Company, Rodney C. Sacks, Hilton H. Schlosberg, and Thomas J. Kelly. Plaintiff principally alleged that, during the Class Period, the defendants made false and misleading statements relating to the Company’s distribution coordination agreements with Anheuser-Busch, Inc. (“AB”) and its sales of “Allied” energy drink lines, and engaged in sales of shares in the Company on the basis of material non-public information. Plaintiff also alleged that the Company’s financial statements for the second quarter of 2007 did not include certain promotional expenses. The Consolidated Class Action Complaint alleged violations of Sections 10(b) and 20(a) of the Securities Exchange Act of 1934, as amended (the “Exchange Act”) and Rule 10b-5 promulgated thereunder, and sought an unspecified amount of damages.
On November 16, 2009, the defendants filed their motion to dismiss the Consolidated Class Action Complaint pursuant to Federal Rules of Civil Procedure 12(b)(6) and 9(b), as well as the Private Securities Litigation Reform Act. On July 12, 2010, following a hearing, the District Court granted the defendants’ motion to dismiss the Consolidated Class Action Complaint, with leave to amend, on the grounds, among others, that it failed to specify which statements plaintiff claimed were false or misleading, failed adequately to allege that certain statements were actionable or false or misleading, and failed adequately to demonstrate that defendants acted with scienter.
On August 27, 2010, plaintiff filed a Consolidated Amended Class Action Complaint for Violations of Federal Securities Laws (the “Amended Class Action Complaint”). While similar in many respects to the Consolidated Class Action Complaint, the Amended Class Action Complaint drops certain of the allegations set forth in the Consolidated Class Action Complaint and makes certain new allegations, including that the Company engaged in “channel stuffing” during the Class Period that rendered false or misleading the Company’s reported sales results and certain other statements made by the defendants. In addition, it no longer names Thomas J. Kelly as a defendant. The Amended Class Action Complaint continues to allege violations of Sections 10(b) and 20(a) of the Exchange Act and Rule 10b-5 promulgated thereunder, and seeks an unspecified amount of damages.
30
Defendants filed a motion to dismiss the Amended Class Action Complaint on November 8, 2010. At a hearing on defendants’ motion to dismiss the Amended Class Action Complaint held on May 12, 2011, the District Court issued a tentative ruling that would grant the motion to dismiss as to certain of plaintiff’s claims, but would deny the motion to dismiss with regard to the majority of plaintiff’s claims. The District Court has not, however, issued a final ruling. The District Court held an additional hearing on the motion to dismiss on May 25, 2011, and has received supplemental submissions from the parties. Defendants’ motion to dismiss remains sub judice.
The Amended Class Action Complaint seeks an unspecified amount of damages. As a result, the amount or
range of reasonably possible litigation losses to which the Company is exposed cannot be estimated. Although the ultimate outcome of this action cannot be determined with certainty, the Company believes that the allegations in the Amended Class Action Complaint are without merit. The Company intends to vigorously defend against this lawsuit.
Derivative Litigation — On October 15, 2008, a derivative complaint was filed in the United States District Court for the Central District of California (the “District Court”), styled Merckel v. Sacks, et al. On November 17, 2008, a second derivative complaint styled Dislevy v. Sacks, et al. was also filed in the District Court. The derivative suits were each brought, purportedly on behalf of the Company, by a shareholder of the Company who made no prior demand on the Company’s Board of Directors.
On June 29, 2009, the District Court entered an order consolidating the Merckel and Dislevy actions. On July 13, 2009, the District Court entered an order re-styling the consolidated actions as In re Hansen Derivative Shareholder Litigation, appointing Raymond Merckel as lead plaintiff and appointing lead counsel, and establishing a schedule for the filing of a consolidated amended complaint and for defendants’ response to such complaint.
On October 13, 2009, a purported Consolidated Shareholder Derivative Complaint (the “Consolidated Derivative Complaint”) was filed. The Consolidated Derivative Complaint named as defendants certain current and former officers, directors, and employees of the Company, including Rodney C. Sacks, Hilton H. Schlosberg, Harold C. Taber, Jr., Benjamin M. Polk, Norman C. Epstein, Mark S. Vidergauz, Sydney Selati, Thomas J. Kelly, Mark J. Hall, and Kirk S. Blower, as well as Hilrod Holdings, L.P. The Company was named as a nominal defendant. The factual allegations of the Consolidated Derivative Complaint were similar to those set forth in the Consolidated Class Action Complaint described above. Plaintiff alleged that, from November 2006 to the present, the defendants caused the Company to issue false and misleading statements concerning its business prospects and failed to properly disclose problems related to its non-Monster Energy® brand energy drinks, the prospects for the Anheuser-Busch distribution relationship, and alleged “inventory loading” that affected the Company’s results for the second quarter of 2007. Plaintiff further alleged that while the Company’s shares were purportedly artificially inflated because of those improper statements, certain of the defendants sold Company stock while in possession of material non-public information. The Consolidated Derivative Complaint asserted various causes of action, including breach of fiduciary duty, aiding and abetting breach of fiduciary duty, violation of Cal. Corp. Code §§ 25402 and 25403 for insider selling, and unjust enrichment. The suit sought an unspecified amount of damages to be paid to the Company and adoption of corporate governance reforms, among other things.
On January 8, 2010, the Company filed its motion to dismiss the Consolidated Derivative Complaint pursuant to Federal Rules of Civil Procedure 12(b)(6) and 23.1. On March 2, 2010, plaintiff’s counsel filed a motion to amend the Consolidated Derivative Complaint pursuant to Rule 15(a)(2) for the purpose of replacing Mr. Merckel as lead plaintiff with another shareholder of the Company, Anastasia Brueckheimer. Following a hearing on July 12, 2010, the District Court (i) permitted Ms. Brueckheimer to intervene in the Derivative Litigation as lead plaintiff and to file a Verified Complaint in Intervention (the “Complaint in Intervention”) similar in all material respects to the Consolidated Derivative Complaint; and (ii) dismissed the Complaint in Intervention, with leave to amend, on the ground that plaintiff’s allegations of demand futility were insufficient to excuse the failure to make a pre-suit demand on the Company’s Board of Directors.
On October 1, 2010, Ms. Brueckheimer filed a Verified Amended Consolidated Shareholder Derivative
Complaint (the “Amended Derivative Complaint”). While the Amended Derivative Complaint asserted the same
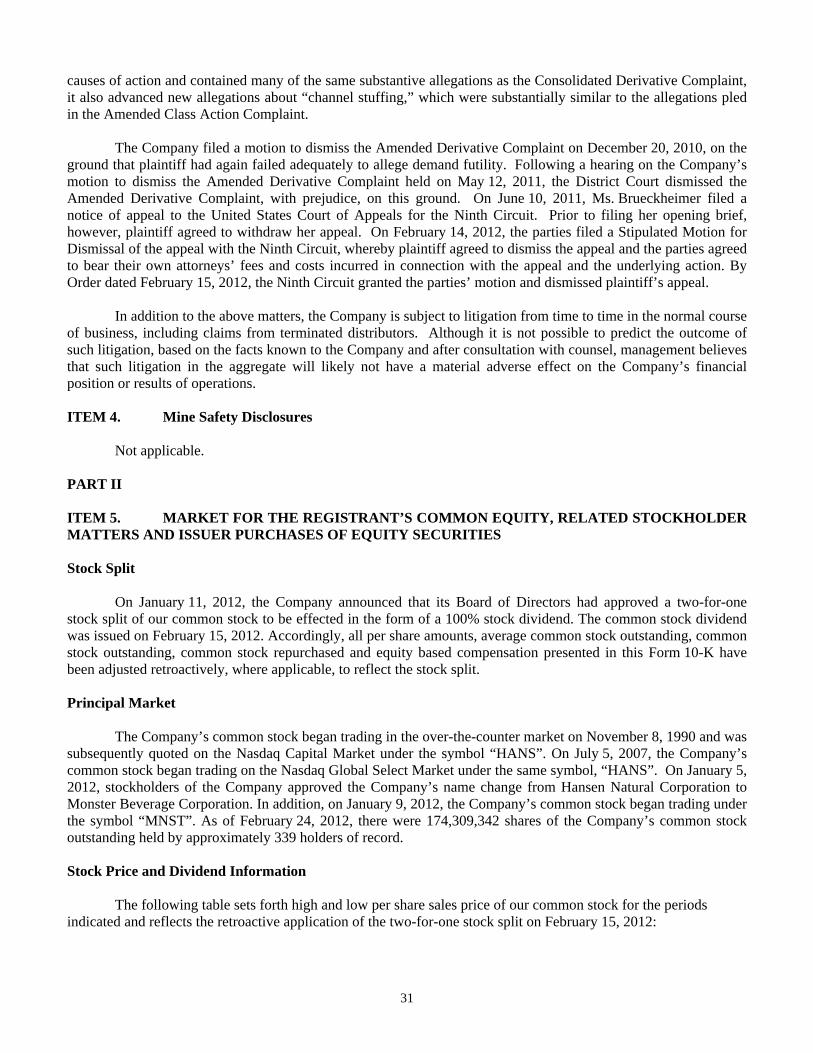
31
causes of action and contained many of the same substantive allegations as the Consolidated Derivative Complaint, it also advanced new allegations about “channel stuffing,” which were substantially similar to the allegations pled in the Amended Class Action Complaint.
The Company filed a motion to dismiss the Amended Derivative Complaint on December 20, 2010, on the
ground that plaintiff had again failed adequately to allege demand futility. Following a hearing on the Company’s motion to dismiss the Amended Derivative Complaint held on May 12, 2011, the District Court dismissed the Amended Derivative Complaint, with prejudice, on this ground. On June 10, 2011, Ms. Brueckheimer filed a notice of appeal to the United States Court of Appeals for the Ninth Circuit. Prior to filing her opening brief, however, plaintiff agreed to withdraw her appeal. On February 14, 2012, the parties filed a Stipulated Motion for Dismissal of the appeal with the Ninth Circuit, whereby plaintiff agreed to dismiss the appeal and the parties agreed to bear their own attorneys’ fees and costs incurred in connection with the appeal and the underlying action. By Order dated February 15, 2012, the Ninth Circuit granted the parties’ motion and dismissed plaintiff’s appeal.
In addition to the above matters, the Company is subject to litigation from time to time in the normal course
of business, including claims from terminated distributors. Although it is not possible to predict the outcome of such litigation, based on the facts known to the Company and after consultation with counsel, management believes that such litigation in the aggregate will likely not have a material adverse effect on the Company’s financial position or results of operations. ITEM 4. Mine Safety Disclosures
Not applicable.
PART II ITEM 5. MARKET FOR THE REGISTRANT’S COMMON EQUITY, RELATED STOCKHOLDER MATTERS AND ISSUER PURCHASES OF EQUITY SECURITIES Stock Split
On January 11, 2012, the Company announced that its Board of Directors had approved a two-for-one stock split of our common stock to be effected in the form of a 100% stock dividend. The common stock dividend was issued on February 15, 2012. Accordingly, all per share amounts, average common stock outstanding, common stock outstanding, common stock repurchased and equity based compensation presented in this Form 10-K have been adjusted retroactively, where applicable, to reflect the stock split. Principal Market
The Company’s common stock began trading in the over-the-counter market on November 8, 1990 and was subsequently quoted on the Nasdaq Capital Market under the symbol “HANS”. On July 5, 2007, the Company’s common stock began trading on the Nasdaq Global Select Market under the same symbol, “HANS”. On January 5, 2012, stockholders of the Company approved the Company’s name change from Hansen Natural Corporation to Monster Beverage Corporation. In addition, on January 9, 2012, the Company’s common stock began trading under the symbol “MNST”. As of February 24, 2012, there were 174,309,342 shares of the Company’s common stock outstanding held by approximately 339 holders of record.
Stock Price and Dividend Information
The following table sets forth high and low per share sales price of our common stock for the periods
indicated and reflects the retroactive application of the two-for-one stock split on February 15, 2012:
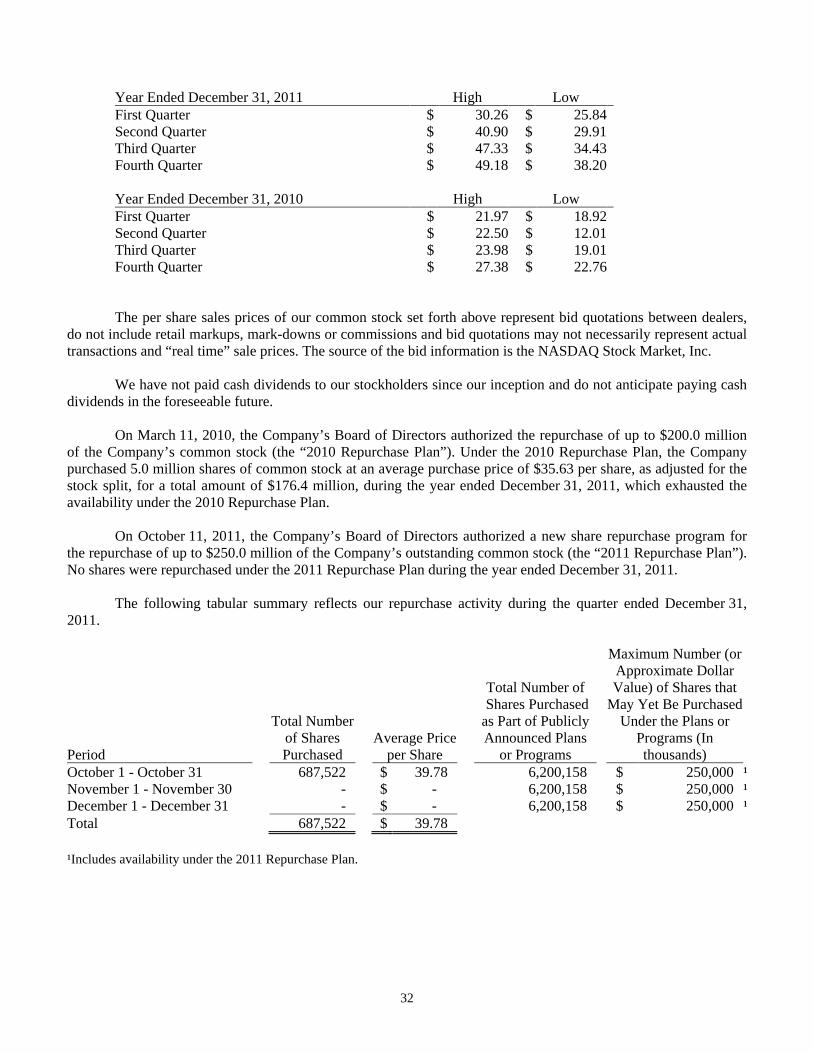
32
Year Ended December 31, 2011 High Low First Quarter $ 30.26 $ 25.84 Second Quarter $ 40.90 $ 29.91 Third Quarter $ 47.33 $ 34.43 Fourth Quarter $ 49.18 $ 38.20
Year Ended December 31, 2010 High Low First Quarter $ 21.97 $ 18.92 Second Quarter $ 22.50 $ 12.01 Third Quarter $ 23.98 $ 19.01 Fourth Quarter $ 27.38 $ 22.76
The per share sales prices of our common stock set forth above represent bid quotations between dealers,
do not include retail markups, mark-downs or commissions and bid quotations may not necessarily represent actual transactions and “real time” sale prices. The source of the bid information is the NASDAQ Stock Market, Inc.
We have not paid cash dividends to our stockholders since our inception and do not anticipate paying cash
dividends in the foreseeable future. On March 11, 2010, the Company’s Board of Directors authorized the repurchase of up to $200.0 million
of the Company’s common stock (the “2010 Repurchase Plan”). Under the 2010 Repurchase Plan, the Company purchased 5.0 million shares of common stock at an average purchase price of $35.63 per share, as adjusted for the stock split, for a total amount of $176.4 million, during the year ended December 31, 2011, which exhausted the availability under the 2010 Repurchase Plan.
On October 11, 2011, the Company’s Board of Directors authorized a new share repurchase program for the repurchase of up to $250.0 million of the Company’s outstanding common stock (the “2011 Repurchase Plan”). No shares were repurchased under the 2011 Repurchase Plan during the year ended December 31, 2011.
The following tabular summary reflects our repurchase activity during the quarter ended December 31,
2011.
Period
Total Number of Shares Purchased
Average Price per Share
Total Number of Shares Purchased as Part of Publicly Announced Plans
or Programs
Maximum Number (or Approximate Dollar Value) of Shares that
May Yet Be Purchased Under the Plans or
Programs (In thousands)
October 1 - October 31 687,522 $ 39.78 6,200,158 $ 250,000 ¹ November 1 - November 30 - $ - 6,200,158 $ 250,000 ¹ December 1 - December 31 - $ - 6,200,158 $ 250,000 ¹ Total 687,522 $ 39.78 ¹Includes availability under the 2011 Repurchase Plan.
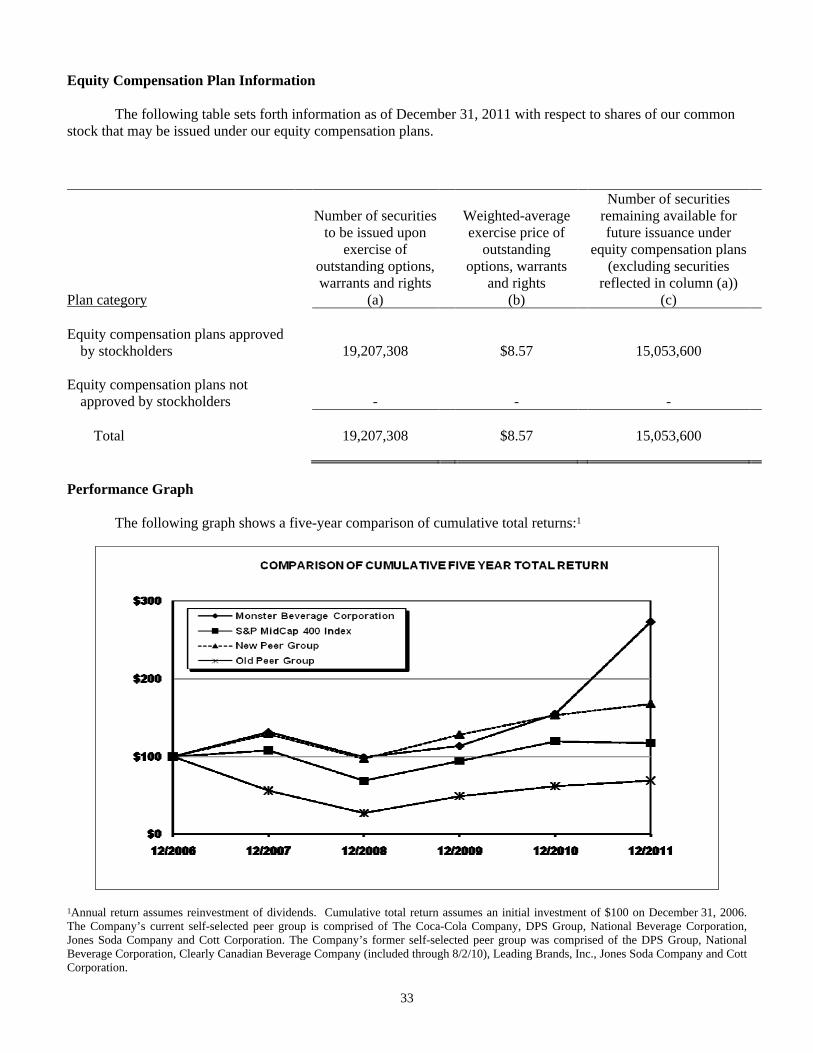
33
Equity Compensation Plan Information
The following table sets forth information as of December 31, 2011 with respect to shares of our common stock that may be issued under our equity compensation plans.
Plan category
Number of securities to be issued upon
exercise of outstanding options, warrants and rights
(a)
Weighted-average exercise price of
outstanding options, warrants
and rights (b)
Number of securities remaining available for future issuance under
equity compensation plans (excluding securities
reflected in column (a)) (c)
Equity compensation plans approved
by stockholders 19,207,308 $8.57 15,053,600 Equity compensation plans not
approved by stockholders - - -
Total 19,207,308 $8.57 15,053,600
Performance Graph
The following graph shows a five-year comparison of cumulative total returns:1
1Annual return assumes reinvestment of dividends. Cumulative total return assumes an initial investment of $100 on December 31, 2006. The Company’s current self-selected peer group is comprised of The Coca-Cola Company, DPS Group, National Beverage Corporation, Jones Soda Company and Cott Corporation. The Company’s former self-selected peer group was comprised of the DPS Group, National Beverage Corporation, Clearly Canadian Beverage Company (included through 8/2/10), Leading Brands, Inc., Jones Soda Company and Cott Corporation.
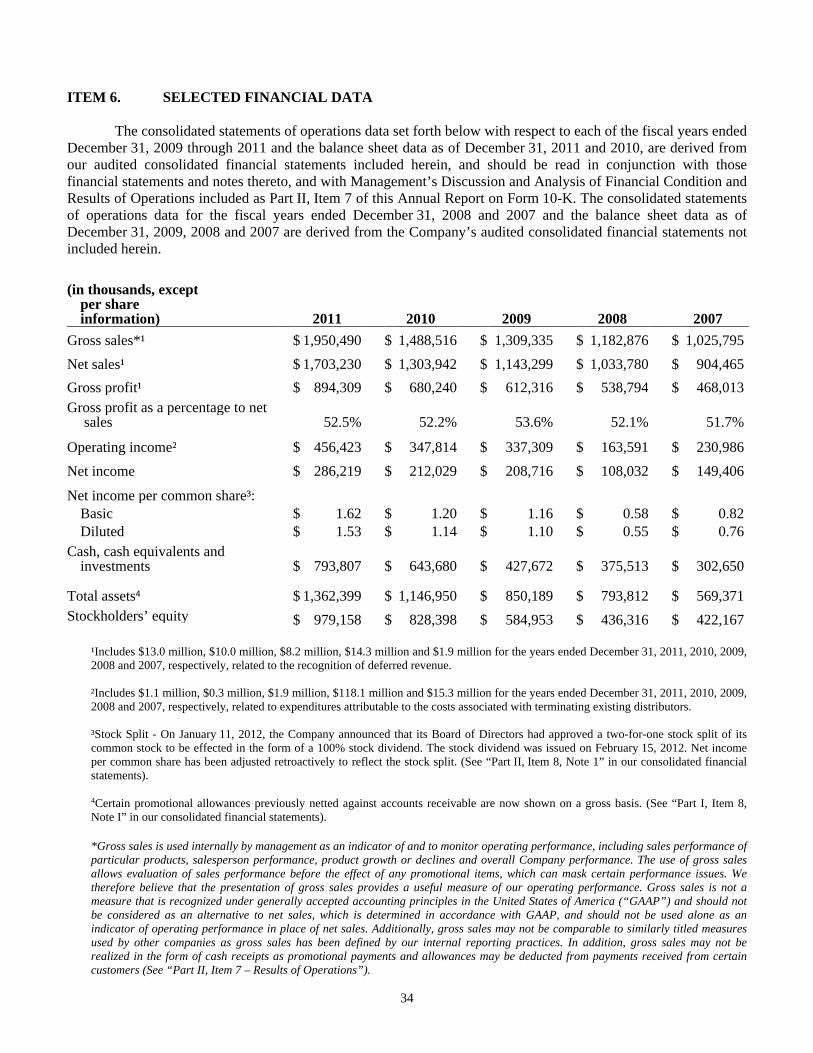
34
ITEM 6. SELECTED FINANCIAL DATA
The consolidated statements of operations data set forth below with respect to each of the fiscal years ended
December 31, 2009 through 2011 and the balance sheet data as of December 31, 2011 and 2010, are derived from our audited consolidated financial statements included herein, and should be read in conjunction with those financial statements and notes thereto, and with Management’s Discussion and Analysis of Financial Condition and Results of Operations included as Part II, Item 7 of this Annual Report on Form 10-K. The consolidated statements of operations data for the fiscal years ended December 31, 2008 and 2007 and the balance sheet data as of December 31, 2009, 2008 and 2007 are derived from the Company’s audited consolidated financial statements not included herein.
(in thousands, except per share information) 2011 2010 2009 2008 2007
Gross sales*¹ $ 1,950,490 $ 1,488,516 $ 1,309,335 $ 1,182,876 $ 1,025,795 Net sales¹ $ 1,703,230 $ 1,303,942 $ 1,143,299 $ 1,033,780 $ 904,465 Gross profit¹ $ 894,309 $ 680,240 $ 612,316 $ 538,794 $ 468,013 Gross profit as a percentage to net
sales 52.5% 52.2% 53.6% 52.1% 51.7%
Operating income² $ 456,423 $ 347,814 $ 337,309 $ 163,591 $ 230,986 Net income $ 286,219 $ 212,029 $ 208,716 $ 108,032 $ 149,406 Net income per common share³:
Basic $ 1.62 $ 1.20 $ 1.16 $ 0.58 $ 0.82 Diluted $ 1.53 $ 1.14 $ 1.10 $ 0.55 $ 0.76
Cash, cash equivalents and investments $ 793,807 $ 643,680 $ 427,672 $ 375,513 $ 302,650
Total assets4 $ 1,362,399 $ 1,146,950 $ 850,189 $ 793,812 $ 569,371 Stockholders’ equity $ 979,158 $ 828,398 $ 584,953 $ 436,316 $ 422,167
¹Includes $13.0 million, $10.0 million, $8.2 million, $14.3 million and $1.9 million for the years ended December 31, 2011, 2010, 2009, 2008 and 2007, respectively, related to the recognition of deferred revenue. ²Includes $1.1 million, $0.3 million, $1.9 million, $118.1 million and $15.3 million for the years ended December 31, 2011, 2010, 2009, 2008 and 2007, respectively, related to expenditures attributable to the costs associated with terminating existing distributors. ³Stock Split - On January 11, 2012, the Company announced that its Board of Directors had approved a two-for-one stock split of its common stock to be effected in the form of a 100% stock dividend. The stock dividend was issued on February 15, 2012. Net income per common share has been adjusted retroactively to reflect the stock split. (See “Part II, Item 8, Note 1” in our consolidated financial statements). 4Certain promotional allowances previously netted against accounts receivable are now shown on a gross basis. (See “Part I, Item 8, Note I” in our consolidated financial statements). *Gross sales is used internally by management as an indicator of and to monitor operating performance, including sales performance of particular products, salesperson performance, product growth or declines and overall Company performance. The use of gross sales allows evaluation of sales performance before the effect of any promotional items, which can mask certain performance issues. We therefore believe that the presentation of gross sales provides a useful measure of our operating performance. Gross sales is not a measure that is recognized under generally accepted accounting principles in the United States of America (“GAAP”) and should not be considered as an alternative to net sales, which is determined in accordance with GAAP, and should not be used alone as an indicator of operating performance in place of net sales. Additionally, gross sales may not be comparable to similarly titled measures used by other companies as gross sales has been defined by our internal reporting practices. In addition, gross sales may not be realized in the form of cash receipts as promotional payments and allowances may be deducted from payments received from certain customers (See “Part II, Item 7 – Results of Operations”).
35
ITEM 7. MANAGEMENT’S DISCUSSION AND ANALYSIS OF FINANCIAL CONDITION AND RESULTS OF OPERATIONS
The following Management’s Discussion and Analysis of Financial Condition and Results of Operations
(“MD&A”) is provided as a supplement to – and should be read in conjunction with – our financial statements and the accompanying notes (“Notes”) included in Part II, Item 8 of this Form 10-K. This discussion contains forward-looking statements that are based on management’s current expectations, estimates and projections about our business and operations. Our actual results may differ materially from those currently anticipated and expressed in such forward-looking statements. See “Forward-Looking Statements” and “Part I. Item 1A – Risk Factors.”
This overview provides our perspective on the individual sections of MD&A. MD&A includes the
following sections: · Our Business – a general description of our business; the value drivers of our business; and opportunities and
risks facing our Company;
· Results of Operations – an analysis of our consolidated results of operations for the three years presented in our financial statements;
· Liquidity and Capital Resources – an analysis of our cash flows, sources and uses of cash and contractual obligations;
· Accounting Policies and Pronouncements – a discussion of accounting policies that require critical judgments and estimates including newly issued accounting pronouncements;
· Sales – details of our sales measured on a quarterly basis in both dollars and cases;
· Inflation – information about the impact that inflation may or may not have on our results;
· Forward-Looking Statements – cautionary information about forward-looking statements and a description of certain risks and uncertainties that could cause our actual results to differ materially from the Company’s historical results or our current expectations or projections; and
· Market Risks – information about market risks and risk management. (See “Forward-Looking Statements” and “Part II, Item 7A – Qualitative and Quantitative Disclosures About Market Risks”).
Our Business
Overview We develop, market, sell and distribute “alternative” beverage category beverages primarily under the
following brand names:
· Monster Energy® · Hansen’s® · Monster Rehab™ · Hansen’s Natural Soda® · Monster Energy Extra Strength Nitrous Technology® · Junior Juice® · Java Monster® · Blue Sky® · X-Presso Monster® · Hubert’s® · Worx Energy® · Vidration® · Peace Tea®
36
Our Monster Energy® drinks, which represented 91.2%, 89.9% and 90.0% of our net sales for the years ended December 31, 2011, 2010 and 2009, respectively, include the following: · Monster Energy® · Java Monster® Kona Blend · Lo-Carb Monster Energy® · Java Monster® Loca Moca® · Monster Energy® Assault® · Java Monster® Mean Bean® · Monster Khaos® · Java Monster® Vanilla Light · Monster M-80® (named “RIPPER” in certain countries) · Java Monster® Irish Blend® · Monster MIXXD® · Java Monster® Toffee · Monster Energy® Absolutely Zero · Monster Energy Extra Strength Nitrous · Monster Energy® Import Technology® Super Dry™ · Monster Energy® Import Light · Monster Energy Extra Strength Nitrous · Monster Energy® Dub Edition Technology® Anti-Gravity® · Monster Rehab™ Tea + Lemonade + Energy · Monster Energy Extra Strength Nitrous · Monster Rehab™ Rojo Tea + Energy Technology® Killer B® · Monster Rehab™ Green Tea + Energy · Monster Energy Extra Strength Nitrous · Monster Rehab™ Protean + Energy Technology® Black Ice™ · Monster Energy® M3™ Super Concentrate · X-Presso Monster® Hammer · X-Presso Monster® Midnite
We have two reportable segments, namely Direct Store Delivery (“DSD”), whose principal products comprise energy drinks, and Warehouse (“Warehouse”), whose principal products comprise juice based and soda beverages. The DSD segment develops, markets and sells products primarily through an exclusive distributor network, whereas the Warehouse segment develops, markets and sells products primarily direct to retailers.
During the year ended December 31, 2011, we continued to expand our existing product lines and flavors and further developed our markets. In particular, we continued to focus on developing and marketing beverages that fall within the category generally described as the “alternative” beverage category. During the year ended December 31, 2011, we introduced the following products:
· Monster Rehab™ Tea + Lemonade + Energy, a non-carbonated rehydration energy drink (February 2011). · Peace Tea® “Caddy Shack”, a non-carbonated tea + lemonade drink (February 2011). · Monster Rehab™ Rojo Tea + Energy, a non-carbonated rehydration energy drink (October 2011). · Monster Rehab™ Green Tea + Energy, a non-carbonated rehydration energy drink (October 2011). · Monster Rehab™ Protean + Energy, a non-carbonated protein rehydration energy drink (October 2011). · Hubert’s® Half & Half, a line of premium ready-to-drink lemonade + teas (October 2011). · Angeleno™ Aguas Fresca, a line of premium ready-to-drink aguas frescas (December 2011).
Our gross sales* of $1,950.5 million for the year ended December 31, 2011 represented record annual sales. The vast majority of our gross sales are derived from our Monster Energy® brand energy drinks. Gross sales of our Monster Energy® brand energy drinks were $1,788.8 million for the year ended December 31, 2011, an increase of $446.7 million, or 96.7% of our overall increase in gross sales for the year ended December 31, 2011. Any decrease in gross sales of our Monster Energy® brand energy drinks could have a significant adverse effect on our future revenues and net income. Competitive pressure in the energy drink category could also adversely affect our operating results.
Our gross sales of $1,488.5 million for the year ended December 31, 2010 were negatively impacted by advance purchases made by our customers in the 2009 fourth quarter due to our announcement of a new per case marketing contribution program for our Monster Energy® distributors commencing January 1, 2010, as well as to avoid potential interruptions in product supply due to our announcement to transition our North American operations to the SAP enterprise resource planning system commencing January 2010 (the “Advance Purchases”). We previously estimated that gross sales for the three-months ended December 31, 2009 were increased by approximately 4% to 6% as a result of the Advance Purchases. We did not limit the amount of our customers’ purchases during the fourth quarter of 2009.
37
Our DSD segment represented 94.4%, 93.0% and 91.4% of our consolidated net sales for the years ended December 31, 2011, 2010 and 2009, respectively. Our Warehouse segment represented 5.6%, 7.0% and 8.6% of our consolidated net sales for the years ended December 31, 2011, 2010 and 2009, respectively. Competitive pressure in the energy drink category could adversely affect our operating results.
Our sales and marketing strategy for all our beverages is to focus our efforts on developing brand awareness through image enhancing programs and product sampling. We use our branded vehicles and other promotional vehicles at events where we offer samples of our products to consumers. We utilize “push-pull” methods to enhance shelf and display space exposure in sales outlets (including advertising, in-store promotions and in-store placement of point-of-sale materials, racks, coolers and barrel coolers) to enhance demand from consumers for our products. We also support our brands with prize promotions, price promotions, competitions, endorsements from selected public and extreme sports figures, personality endorsements (including from television and other well known sports personalities), coupons, sampling and sponsorship of selected causes, events, athletes and teams. In-store posters, outdoor posters, print, radio and television advertising and coupons, may also be used to promote our brands.
We believe that one of the keys to success in the beverage industry is differentiation, making our brands and products visually distinctive from other beverages on the shelves of retailers. We review our products and packaging on an ongoing basis and, where practical, endeavor to make them different, better and unique. The labels and graphics for many of our products are redesigned from time to time to maximize their visibility and identification, wherever they may be placed in stores, which we will continue to reevaluate from time to time.
All of our beverage products are manufactured by various third party bottlers and co-packers situated throughout the United States and abroad, under separate arrangements with each party.
Our growth strategy includes expanding our international business. Gross sales to customers outside the United States amounted to $381.0 million, $240.6 million and $168.0 million for the years ended December 31, 2011, 2010 and 2009, respectively. Such sales were approximately 20%, 16% and 13% of gross sales for the years ended December 31, 2011, 2010 and 2009, respectively. Gross sales to customers in EMEA (Europe, the Middle East and Africa) for the year ended December 31, 2011 were 87.5% higher than gross sales in EMEA for the year ended December 31, 2010.
Our customers are primarily full service beverage distributors, retail grocery and specialty chains, wholesalers, club stores, drug chains, mass merchandisers, convenience chains, health food distributors, food service customers and the military. Gross sales to our various customer types for the years ended December 31, 2011, 2010 and 2009 are reflected below. Such information reflects sales made by us directly to the customer types concerned, which include our full service beverage distributors in the United States. Such full service beverage distributors in turn sell certain of our products to the same customer types listed below. We do not have complete details of such full service distributors’ sales of our products to their respective customers and therefore limit our description of our customer types to include only our sales to such full service distributors without reference to such distributor’s sales to their own customers.
2011 2010 2009 Full service distributors 64% 64% 66% Club stores, drug chains & mass merchandisers 10% 12% 12% Outside the U.S. 20% 16% 13% Retail grocery, specialty chains and wholesalers 4% 6% 6% Other 2% 2% 3%
On October 2, 2010, TCCC completed its acquisition of the North American business operations of CCE, through a merger with a wholly owned subsidiary of TCCC. The surviving wholly owned subsidiary was subsequently renamed CCR, and currently distributes certain of our products in those portions of the United States in which CCE previously distributed certain of our products. Concurrently with this acquisition, New CCE was formed, which currently distributes certain of our products in Great Britain, France, Belgium, the Netherlands, Luxembourg, Monaco and Sweden (Sweden was added during the first quarter of 2011).
38
Our customers include the TCCC North American Bottlers, Wal-Mart, Inc. (including Sam’s Club), the AB
Distributors, Coca-Cola Hellenic, Kalil Bottling Group, Trader Joe’s, John Lenore & Company, Swire Coca-Cola, Costco, SUPERVALU INC, The Kroger Co. and Safeway, Inc. A decision by any large customer to decrease amounts purchased from us or to cease carrying our products could have a material negative effect on our financial condition and consolidated results of operations. CCR accounted for approximately 29% of our net sales for the year ended December 31, 2011. CCE, which included their operations in the U.S. for the relevant periods (see distribution agreement (g) in “Item 1 – Business – Distribution Agreements”), accounted for approximately 28% and 27% our net sales for the years ended December 31, 2010 and 2009, respectively.
We continue to incur expenditures in connection with the development and introduction of new products
and flavors. Value Drivers of our Business
We believe that the key value drivers of our business include the following:
· Profitable Growth – We believe “functional”, “image based” and/or “better for you” brands properly
supported by marketing and innovation, targeted to a broad consumer base, drive profitable growth. We continue to broaden our family of brands. In particular, we are expanding our energy drinks and specialty beverages to provide more alternatives to consumers. We are focused on maintaining profit margins and believe that tailored branding, packaging, pricing and distribution channel strategies help achieve profitable growth. We are implementing these strategies with a view to continuing profitable growth.
· International – The profitable introduction and development of our Monster Energy brand internationally remains a key value driver for our corporate growth.
· Cost Management – The principal focus of cost management will continue to be on reducing input
supply and production costs on a per-case basis, including raw material costs and co-packing fees. Another key area of focus is to decrease promotional allowances, selling and general and administrative costs, including sponsorships, sampling, promotional and marketing expenses, as a percentage of net sales. The reduction of accounts receivable and inventory days on hand also remains a further key area of focus.
· Efficient Capital Structure – Our capital structure is intended to optimize our working capital to finance
expansion, both domestically and internationally. We believe our strong capital position, our ability to raise funds, if necessary, at low effective cost and low overall costs of borrowings provide a competitive advantage.
We believe that, subject to increases in the costs of certain raw materials being contained, these value
drivers, when properly implemented in the U.S. and internationally, will result in: (1) maintaining our product gross profit margins; (2) providing additional leverage over time through reduced expenses as a percentage of net operating revenues; and (3) optimizing our cost of capital. The ultimate measure of success is and will be reflected in our current and future results of operations.
Gross and net sales, gross profits, operating income, net income and net income per share represent key measurements of the above value drivers. These measurements will continue to be a key management focus in 2012 and beyond (See “Part II, Item 7 – Results of Operations for the Year Ended December 31, 2011 Compared to the Year Ended December 31, 2010”).
As of December 31, 2011, the Company had working capital of $916.6 million compared to $769.3 million as of December 31, 2010. The increase in working capital was primarily the result of retained profits reflected in an
39
overall increase in cash, cash equivalents and short-term investments. For the year ended December 31, 2011, our net cash provided by operating activities was approximately $333.8 million as compared to $229.0 million for the year ended December 31, 2010. Principal uses of cash flows in 2011 were purchases of investments, repurchases of our common stock, purchases of inventory, development of our Monster Energy® brand internationally, acquisition of property and equipment and acquisition of trademarks. These principal uses of cash flows are expected to be and remain our principal recurring use of cash and working capital funds in the future (See “Part II, Item 7 – Liquidity and Capital Resources”).
Opportunities, Challenges and Risks
Looking forward, our management has identified certain challenges and risks that demand the attention of
the beverage industry and our Company. Uncertainty and volatility in domestic and international economic markets could negatively affect both the stability of our industry and our Company. Our growth strategy includes expanding our international business which exposes us to risks inherent in conducting international operations (See “Part I, Item 1A – Risk Factors”). Decreased consumer discretionary spending represents a challenge to the successful marketing and purchase of our products. Increases in consumer and regulatory awareness of the health problems arising from obesity and inactive lifestyles continue to represent a challenge. We recognize that obesity is a complex and serious public health problem. Our commitment to consumers begins with our broad product line and a wide selection of diet, light and low carbohydrate beverages, juices and juice drinks, waters and energy drinks. We continuously strive to meet changing consumer needs through beverage innovation, choice and variety.
Our historical success is attributable, in part, to our introduction of different and innovative beverages. Our future success will depend, in part, upon our continued ability to develop and introduce different and innovative beverages, although there can be no assurance of our ability to do so. In order to retain and expand our market share, we must continue to develop and introduce different and innovative beverages and be competitive in the areas of quality, health, method of distribution, brand image and intellectual property protection. The beverage industry is subject to changing consumer preferences that may adversely affect us if we misjudge such preferences.
In addition, other key challenges and risks that could impact our Company’s future financial results
include, but are not limited to:
· changes in consumer preferences and demand for our products; · economic uncertainty in the United States, Europe and other countries in which we operate; · the risks associated with foreign currency exchange rate fluctuations; · maintenance of our brand image and product quality; · profitable expansion and growth of our family of brands in the competitive market place (See
“Part I, Item 1 – Business - Competition and Sales and Marketing”); · costs of establishing and promoting our brands internationally; · restrictions on imports and sources of supply; duties or tariffs; changes in government regulations; · protection of our existing intellectual property portfolio of trademarks and copyrights and the
continuous pursuit to develop and protect new and innovative trademarks and copyrights for our expanding product lines;
· limitations on available quantities of certain package containers such as the 12-ounce and 24-ounce cap-can, the 18.6-ounce BRE can, the 32-ounce can, and co-packing availability;
· the imposition of additional regulatory restrictions; · increasing concern over obesity and changes in regulation and consumer preferences in response to
those concerns; and · legislation that would limit or restrict the sale of energy drinks to minors and/or persons below a
specified age and/or the venues in which energy drinks can be sold and/or impose taxation of the sale of energy drinks.
See “Part I, Item 1A – Risk Factors” for additional information about risks and uncertainties facing our
Company.
40
We believe that the following opportunities exist for us: · growth potential of the energy drink category, both domestically and internationally; · growth potential of other segments of the “alternative” beverage category including sparkling
beverages, carbonated soft drinks, ready-to-drink iced teas, juice drinks and enhanced waters; · planned and future new product and product line introductions with the objective of contributing to
higher profitability; · the introduction of premium packages designed to generate strong revenue growth; · significant package, pricing and channel opportunities to increase profitable growth; · effective strategic positioning to capitalize on industry growth; · broadening distribution/expansion opportunities in both domestic and international markets; · launching our products into new geographic markets; and · continued focus on reducing our cost base.
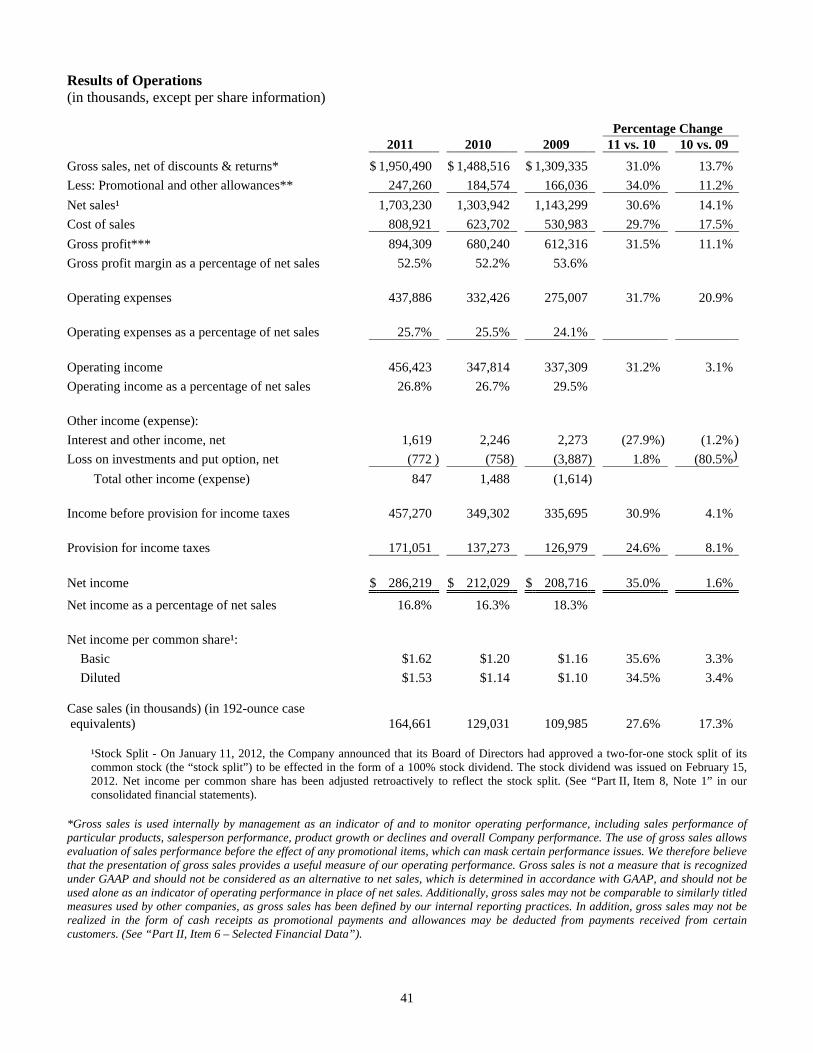
41
Results of Operations (in thousands, except per share information)
Percentage Change 2011 2010 2009 11 vs. 10 10 vs. 09
Gross sales, net of discounts & returns* $ 1,950,490 $ 1,488,516 $ 1,309,335 31.0% 13.7%
Less: Promotional and other allowances** 247,260 184,574 166,036 34.0% 11.2%
Net sales¹ 1,703,230 1,303,942 1,143,299 30.6% 14.1%
Cost of sales 808,921 623,702 530,983 29.7% 17.5%
Gross profit*** 894,309 680,240 612,316 31.5% 11.1%
Gross profit margin as a percentage of net sales 52.5% 52.2% 53.6%
Operating expenses 437,886 332,426 275,007 31.7% 20.9%
Operating expenses as a percentage of net sales 25.7% 25.5% 24.1%
Operating income 456,423 347,814 337,309 31.2% 3.1%
Operating income as a percentage of net sales 26.8% 26.7% 29.5%
Other income (expense):
Interest and other income, net 1,619 2,246 2,273 (27.9%) (1.2%)
Loss on investments and put option, net (772 ) (758) (3,887) 1.8% (80.5%)
Total other income (expense) 847 1,488 (1,614)
Income before provision for income taxes 457,270 349,302 335,695 30.9% 4.1%
Provision for income taxes 171,051 137,273 126,979 24.6% 8.1%
Net income $ 286,219 $ 212,029 $ 208,716 35.0% 1.6%
Net income as a percentage of net sales 16.8% 16.3% 18.3%
Net income per common share¹:
Basic $1.62 $1.20 $1.16 35.6% 3.3%
Diluted $1.53 $1.14 $1.10 34.5% 3.4%
Case sales (in thousands) (in 192-ounce case equivalents) 164,661 129,031 109,985 27.6% 17.3%
¹Stock Split - On January 11, 2012, the Company announced that its Board of Directors had approved a two-for-one stock split of its common stock (the “stock split”) to be effected in the form of a 100% stock dividend. The stock dividend was issued on February 15, 2012. Net income per common share has been adjusted retroactively to reflect the stock split. (See “Part II, Item 8, Note 1” in our consolidated financial statements).
*Gross sales is used internally by management as an indicator of and to monitor operating performance, including sales performance of particular products, salesperson performance, product growth or declines and overall Company performance. The use of gross sales allows evaluation of sales performance before the effect of any promotional items, which can mask certain performance issues. We therefore believe that the presentation of gross sales provides a useful measure of our operating performance. Gross sales is not a measure that is recognized under GAAP and should not be considered as an alternative to net sales, which is determined in accordance with GAAP, and should not be used alone as an indicator of operating performance in place of net sales. Additionally, gross sales may not be comparable to similarly titled measures used by other companies, as gross sales has been defined by our internal reporting practices. In addition, gross sales may not be realized in the form of cash receipts as promotional payments and allowances may be deducted from payments received from certain customers. (See “Part II, Item 6 – Selected Financial Data”).
42
** Although the expenditures described in this line item are determined in accordance with GAAP and meet GAAP requirements, the disclosure thereof does not conform with GAAP presentation requirements. Additionally, our definition of promotional and other allowances may not be comparable to similar items presented by other companies. The presentation of promotional and other allowances facilitates an evaluation of their impact on the determination of net sales and the spending levels incurred or correlated with such sales. Promotional and other allowances constitute a material portion of our marketing activities. ***Gross profit may not be comparable to that of other entities since some entities include all costs associated with their distribution process in cost of sales, whereas others exclude certain costs and instead include such costs within another line item such as operating expenses. We include out-bound freight and warehouse costs in operating expenses rather than in cost of sales. Results of Operations for the Year Ended December 31, 2011 Compared to the Year Ended December 31, 2010.
Gross Sales. Gross sales were $1,950.5 million for the year ended December 31, 2011, an increase of approximately $462.0 million, or 31.0% higher than gross sales of $1,488.5 million for the year ended December 31, 2010. The increase in the gross sales of our Monster Energy® brand energy drinks represented approximately $446.7 million, or 96.7%, of the overall increase in gross sales. Gross sales of our Monster Energy® brand energy drinks increased primarily due to increased sales by volume as a result of increased consumer demand in both our existing domestic and international markets as well as our expansion into new international markets. Pricing changes did not have a material impact on the increase in gross sales. No other individual product line contributed either a material increase or decrease to gross sales for the year ended December 31, 2011. Promotional and other allowances were $247.3 million for the year ended December 31, 2011, an increase of $62.7 million, or 34.0% higher than promotional and other allowances of $184.6 million for the year ended December 31, 2010. Promotional and other allowances as a percentage of gross sales increased to 12.7% from 12.4% for the year ended December 31, 2011 and 2010, respectively. As a result, the percentage increase in gross sales for the year ended December 31, 2011 was higher than the percentage increase in net sales.
Net Sales. Net sales were $1,703.2 million for the year ended December 31, 2011, an increase of approximately $399.3 million, or 30.6% higher than net sales of $1,303.9 million for the year ended December 31, 2010. The increase in net sales of our Monster Energy® brand energy drinks represented approximately $380.0 million, or 95.2%, of the overall increase in net sales. Net sales of our Monster Energy® brand energy drinks increased primarily due to increased sales by volume as a result of increased consumer demand in both our existing domestic and international markets as well as our expansion into new international markets. Pricing changes did not have a material impact on the increase in net sales. No other individual product line contributed either a material increase or decrease to net sales for the year ended December 31, 2011.
Case sales, in 192-ounce case equivalents, were 164.7 million cases for the year ended December 31, 2011, an increase of approximately 35.6 million cases or 27.6% higher than case sales of 129.0 million cases for the year ended December 31, 2010. The overall average net sales per case increased to $10.34 for the year ended December 31, 2011, which was 2.4% higher than the average net sales per case of $10.11 for the year ended December 31, 2010. The increase in the average net sales per case was attributable to an increase in the proportion of case sales derived from higher priced products, primarily our Monster Energy® brand energy drinks.
Net sales for the DSD segment were $1,608.3 million for the year ended December 31, 2011, an increase of approximately $395.7 million, or 32.6% higher than net sales of $1,212.6 million for the year ended December 31, 2010. The increase in the net sales of our Monster Energy® brand energy drinks represented approximately $380.0 million, or 96.0%, of the overall increase in net sales for the DSD segment. Net sales for the DSD segment of our Monster Energy® brand energy drinks increased primarily due to increased sales by volume as a result of increased consumer demand in both our existing domestic and international markets as well as our expansion into new international markets. Pricing changes did not have a material impact on the increase in net sales for the DSD segment. No other individual product line contributed either a material increase or decrease to net sales for the DSD segment for the year ended December 31, 2011.
Net sales for the Warehouse segment were $94.9 million for the year ended December 31, 2011, an increase of approximately $3.6 million, or 4.0% higher than net sales of $91.3 million for the year ended December 31, 2010. The increase in net sales for the Warehouse segment was primarily attributable to decreased promotional and other allowances.
43
Gross Profit. Gross profit was $894.3 million for the year ended December 31, 2011, an increase of approximately $214.1 million, or 31.5% higher than the gross profit of $680.2 million for the year ended December 31, 2010. Gross profit as a percentage of net sales increased slightly to 52.5% for the year ended December 31, 2011 from 52.2% for the year ended December 31, 2010. The increase in gross profit dollars was primarily the result of the $446.7 million increase in gross sales of our Monster Energy® brand energy drinks.
Operating Expenses. Total operating expenses were $437.9 million for the year ended December 31, 2011,
an increase of approximately $105.5 million, or 31.7% higher than total operating expenses of $332.4 million for the year ended December 31, 2010. The increase in operating expenses was partially attributable to increased payroll expenses of $14.3 million, increased out-bound freight and warehouse costs of $13.9 million, increased expenditures of $13.6 million for sponsorships and endorsements, increased expenditures of $13.0 million for advertising, increased expenditures of $12.3 million for allocated trade development, increased expenditures of $10.5 million for commissions, increased expenditures for promotional items of $7.1 million, increased expenditures of $6.5 million for merchandise displays, increased expenditures of $3.6 million for samples and increased expenditures of $10.7 million for other operating expenses. Total operating expenses as a percentage of net sales was 25.7% for the year ended December 31, 2011, compared to 25.5% for the year ended December 31, 2010.
Contribution Margin. Contribution margin for the DSD segment was $543.2 million for the year ended
December 31, 2011, an increase of approximately $106.5 million, or 24.4% higher than the contribution margin of $436.7 million for the year ended December 31, 2010. The increase in the contribution margin for the DSD segment was primarily the result of the $380.0 million increase in net sales of our Monster Energy® brand energy drinks. Contribution margin for the Warehouse segment was $4.3 million for the year ended December 31, 2011, approximately $5.1 million higher than the contribution margin of ($0.8) million for the year ended December 31, 2010. The increase in the contribution margin for the Warehouse segment was primarily attributable to decreased promotional and other allowances and lower selling expenses.
Operating Income. Operating income was $456.4 million for the year ended December 31, 2011, an
increase of approximately $108.6 million, or 31.2% higher than operating income of $347.8 million for the year ended December 31, 2010. Operating income as a percentage of net sales was 26.8% and 26.7% for the years ended December 31, 2011 and 2010, respectively. The increase in operating income was primarily due to an increase in gross profit of $214.1 million, partially offset by a $105.5 million increase in operating expenses. Operating income was negatively affected by combined operating losses of $15.4 million and $9.2 million for the years ended December 31, 2011 and 2010, respectively, in relation to our new and existing markets in Europe, the Middle East, Africa, Australasia and South America.
Other Income (Expense). Other income (expense) was $0.8 million for the year ended December 31, 2011, a decrease of $0.6 million from $1.5 million for the year ended December 31, 2010. This decrease was primarily attributable to an increase in foreign currency losses.
Provision for Income Taxes. Provision for income taxes was $171.1 million for the year ended
December 31, 2011, an increase of $33.8 million or 24.6% higher than the provision for income taxes of $137.3 million for the year ended December 31, 2010. The effective combined federal, state and foreign tax rate decreased to 37.4% from 39.3% for the year ended December 31, 2011 and 2010, respectively. The decrease in the effective tax rate was primarily the result of a lower effective combined state tax rate and the establishment of a full valuation allowance against the deferred tax assets of a foreign subsidiary established during the second fiscal quarter of 2010. The decrease in the effective tax rate was partially offset by the increase in the reserve for certain uncertain tax benefits.
Net Income. Net income was $286.2 million for the year ended December 31, 2011, an increase of $74.2
million or 35.0% higher than net income of $212.0 million for the year ended December 31, 2010. The increase in net income was primarily attributable to an increase in gross profit of $214.1 million. The increase in net income was partially offset by an increase in operating expenses of $105.5 million and an increase in the provision for income taxes of $33.8 million.
44
Results of Operations for the Year Ended December 31, 2010 Compared to the Year Ended December 31, 2009.
Gross Sales. Gross sales were $1,488.5 million for the year ended December 31, 2010, an increase of
approximately $179.2 million, or 13.7% higher than gross sales of $1,309.3 million for the year ended December 31, 2009. The increase in the gross sales of our Monster Energy® brand energy drinks represented approximately $162.1 million, or 90.5%, of the overall increase in gross sales. Gross sales of our Monster Energy® brand energy drinks increased primarily due to increased sales by volume as a result of increased consumer demand in both our existing domestic and international markets, as well as our expansion into new international markets. Pricing changes did not have a material impact on the increase in gross sales. No other individual product line contributed either a material increase or decrease to gross sales for the year ended December 31, 2010. The increase in gross sales was negatively affected by the Advance Purchases made by customers in the 2009 fourth quarter. Promotional and other allowances were $184.6 million for the year ended December 31, 2010, an increase of $18.5 million, or 11.2% higher than promotional and other allowances of $166.0 million for the year ended December 31, 2009. Promotional and other allowances as a percentage of gross sales decreased to 12.4% from 12.7% for the years ended December 31, 2010 and 2009, respectively. As a result, the percentage increase in gross sales for the year ended December 31, 2010 was lower than the percentage increase in net sales.
Net Sales. Net sales were $1,303.9 million for the year ended December 31, 2010, an increase of
approximately $160.6 million, or 14.1% higher than net sales of $1,143.3 million for the year ended December 31, 2009. The increase in net sales of our Monster Energy® brand energy drinks represented approximately $143.3 million, or 89.2%, of the overall increase in net sales. Net sales of our Monster Energy® brand energy drinks increased primarily due to increased sales by volume as a result of increased consumer demand in both our existing domestic and international markets, as well as our expansion into new international markets. Pricing changes did not have a material impact on the increase in net sales. No other individual product line contributed either a material increase or decrease to net sales for the year ended December 31, 2010. The increase in net sales was negatively affected by the Advance Purchases made by customers in the 2009 fourth quarter.
Case sales, in 192-ounce case equivalents, were 129.0 million cases for the year ended December 31, 2010,
an increase of approximately 19.0 million cases or 17.3% higher than case sales of 110.0 million cases for the year ended December 31, 2009. The average net sales price per case decreased to $10.11 for the year ended December 31, 2010 which was 2.8% lower than the average net sales price per case of $10.40 for the year ended December 31, 2009. The decrease in the average net sales price per case was attributable to an increase in the proportion of case sales derived from lower priced products and geographic mix.
Net sales for the DSD segment were $1,212.6 million for the year ended December 31, 2010, an increase of approximately $167.5 million, or 16.0% higher than net sales of $1,045.1 million for the year ended December 31, 2009. The increase in the net sales of our Monster Energy® brand energy drinks represented approximately $143.3 million, or 85.5%, of the overall increase in net sales for the DSD segment. Net sales for the DSD segment of our Monster Energy® brand energy drinks increased primarily due to increased sales by volume as a result of increased consumer demand in both our existing domestic and international markets as well as our expansion into new international markets. Pricing changes did not have a material impact on the increase in net sales for our DSD segment. No other individual product line contributed either a material increase or decrease to net sales for our DSD segment for the year ended December 31, 2010. The increase in net sales for the DSD segment was negatively affected by the Advance Purchases made by customers in the 2009 fourth quarter.
Net sales for the Warehouse segment were $91.3 million for the year ended December 31, 2010, a decrease
of approximately $6.9 million, or 7.0% lower than net sales of $98.2 million for the year ended December 31, 2009. The decrease in net sales for the Warehouse segment was primarily attributable to decreased sales by volume of apple juice and Rumba®, Samba and Tango energy juices as well as increased promotional allowances. The decrease in net sales for the Warehouse segment was partially offset by increased sales by volume of our juice blends.
45
Gross Profit. Gross profit was $680.2 million for the year ended December 31, 2010, an increase of approximately $67.9 million, or 11.1% higher than the gross profit of $612.3 million for the year ended December 31, 2009. Gross profit as a percentage of net sales decreased to 52.2% for the year ended December 31, 2010 from 53.6% for the year ended December 31, 2009. The increase in gross profit dollars was primarily the result of the $162.1 million increase in gross sales of our Monster Energy® brand energy drinks. The decrease in gross profit as a percentage of net sales was primarily attributable to production variances and increased costs of goods including the costs of raw materials in the DSD and Warehouse segments as well as product mix and geographic mix.
Operating Expenses. Total operating expenses were $332.4 million for the year ended December 31, 2010,
an increase of approximately $57.4 million, or 20.9% higher than total operating expenses of $275.0 million for the year ended December 31, 2009. Total operating expenses as a percentage of net sales was 25.5% for the year ended December 31, 2010, compared to 24.1% for the year ended December 31, 2009. The increase in operating expenses was partially attributable to increased payroll expenses of $15.0 million (of which $2.8 million was related to an increase in stock-based compensation) and increased expenditures of $13.4 million for professional service fees, including legal and accounting costs. Expenditures for professional service fees, including legal and accounting costs and SAP implementation costs for the year ended December 31, 2010 were $21.5 million as compared to $8.2 million for the year ended December 31, 2009 (the 2009 comparative period included a $4.7 million credit related to reimbursements to the Company of legal expenses previously paid by the Company). In addition, the increase in operating expenses was partially attributable to increased expenditures of $11.2 million for sponsorships and endorsements, increased out-bound freight and warehouse costs of $9.6 million, increased expenditures of $6.2 million for point-of-sale materials, increased expenditures of $4.5 million for allocated trade development, increased depreciation expense of $1.6 million and increased expenditures of $2.2 million for other operating expenses. The increase in operating expenses was partially offset by decreased expenditures of $1.6 million related to the costs associated with distributor terminations, decreased expenditures of $1.7 million for advertising, decreased expenditures of $1.5 million for samples and decreased expenditures of $1.5 million for commissions.
Contribution Margin. Contribution margin for the DSD segment was $436.7 million for the year ended
December 31, 2010, an increase of approximately $45.0 million, or 11.5% higher than contribution margin of $391.7 million for the year ended December 31, 2009. The increase in the contribution margin for the DSD segment was primarily the result of the $162.1 million increase in net sales of our Monster Energy® brand energy drinks. Contribution margin for the Warehouse segment was ($0.8) million for the year ended December 31, 2010, approximately $4.4 million lower than contribution margin of $3.6 million for the year ended December 31, 2009. The decrease in the contribution margin for the Warehouse segment was primarily attributable to decreased net sales, increased off-invoice and promotional allowances and increased costs of goods.
Operating Income. Operating income was $347.8 million for the year ended December 31, 2010, an
increase of approximately $10.5 million, or 3.1% higher than operating income of $337.3 million for the year ended December 31, 2009. Operating income as a percentage of net sales decreased to 26.7% for the year ended December 31, 2010 from 29.5% for the year ended December 31, 2009. The increase in operating income was primarily due to an increase in gross profit of $67.9 million, partially offset by a $57.4 million increase in operating expenses. The decrease in operating income as a percentage of net sales was primarily due to a decrease in gross profit as a percentage of net sales and an increase in operating expenses as a percentage of net sales. Operating income was negatively affected by operating losses of $9.2 million and $6.9 million for the years ended December 31, 2010 and 2009, respectively, in relation to our operations in Europe, Australia and Brazil.
Other Income (Expense). Other income (expense) was $1.5 million for the year ended December 31, 2010,
an increase of $3.1 million from ($1.6) million for the year ended December 31, 2009. The increase was primarily attributable to a loss on investments and put option of ($0.8) million for the year ended December 31, 2010 as compared to a loss on investments and put option of ($3.9) million for the year ended December 31, 2009. The increase in other income (expense) was partially offset by decreased interest revenue earned on our cash balances and short- and long-term investments for the year ended December 31, 2010.
46
Provision for Income Taxes. Provision for income taxes was $137.3 million for the year ended December 31, 2010, an increase of $10.3 million or 8.1% higher than the provision for income taxes of $127.0 million for the year ended December 31, 2009. The effective combined federal and state and foreign tax rate increased to 39.3% from 37.8% for the years ended December 31, 2010 and 2009, respectively. The increase in the effective tax rate was primarily the result of the establishment of a full valuation allowance against the deferred tax assets of a foreign subsidiary during the year ended December 31, 2010, lower state tax benefits and the release of certain unrecognized tax benefits that arose in the year ended December 31, 2009. The increase in tax rates was partially offset by the increase in tax benefits resulting from the Domestic Production Deduction. The effect of the valuation allowance and its related impact on the Company’s overall tax rate increased the provision for income taxes by $3.4 million for the year ended December 31, 2010.
Net Income. Net income was $212.0 million for the year ended December 31, 2010, an increase of $3.3
million or 1.6% higher than net income of $208.7 million for the year ended December 31, 2009. The increase in net income was primarily attributable to an increase in gross profit of $67.9 million and an increase in other income (expense) of $3.1 million. The increase in net income was partially offset by an increase in operating expenses of $57.4 million and an increase in the provision for income taxes of $10.3 million. Liquidity and Capital Resources
Cash flows provided by operating activities – Net cash provided by operating activities was $333.8 million for the year ended December 31, 2011, as compared with net cash provided by operating activities of $229.0 million for the year ended December 31, 2010. For the year ended December 31, 2011, cash provided by operating activities was primarily attributable to net income earned of $286.2 million and adjustments for certain non-cash expenses consisting of $19.4 million of stock-based compensation and $17.0 million of depreciation and other amortization. For the year ended December 31, 2011, cash provided by operations also increased due to a $28.4 million increase in accrued promotional allowances, a $26.3 million increase in accounts payable, a $13.9 million increase in income taxes payable, a $9.5 million decrease in prepaid income taxes, an $8.1 million increase in accrued liabilities and a $2.9 million increase in accrued compensation. For the year ended December 31, 2011, cash provided by operating activities was reduced due to a $56.8 million increase in accounts receivable, a $6.3 million decrease in deferred revenue, a $6.2 million increase in prepaid expenses and other current assets, a $4.5 million increase in inventory and a $3.8 million increase in tax benefit from the exercise of stock options. For the year ended December 31, 2010, cash provided by operating activities was primarily attributable to net income earned of $212.0 million and adjustments for certain non-cash expenses consisting of $16.9 million of stock-based compensation, $11.7 million of depreciation and other amortization, a $4.5 million impairment loss on investments and $1.7 million of bad debt expense. For the year ended December 31, 2010, cash provided by operations also increased due to a $33.4 million increase in accounts payable, a $14.7 million increase in accrued promotional allowances, a $13.2 million increase in accrued liabilities, a $12.5 million increase in income taxes payable and a $4.3 million decrease in distributor receivables. For the year ended December 31, 2010, cash provided by operating activities was reduced due to a $45.0 million increase in inventory, a $12.7 million increase in accounts receivable, a $12.4 million increase in tax benefit from the exercise of stock options, a $10.0 million increase in prepaid income taxes, a $5.5 million decrease in deferred revenue, a $3.8 million gain on the Put Option (defined below), a $2.8 million increase in prepaid expenses and other current assets, a $2.6 million decrease in accrued distributor terminations and a $1.4 million decrease in deferred income taxes.
Cash flows used in investing activities – Net cash used in investing activities was $173.0 million for the
year ended December 31, 2011, as compared to net cash used in investing activities of $212.5 million for the year ended December 31, 2010. For the year ended December 31, 2011, cash used in investing activities was primarily attributable to purchases of held-to-maturity investments, purchases of available-for-sale investments, purchases of property and equipment and additions to intangibles. For the year ended December 31, 2010 cash used in investing activities was primarily attributable to purchases of held-to-maturity investments, additions to intangibles and purchases of property and equipment. For both the years ended December 31, 2011 and 2010, cash provided by investing activities was primarily attributable to maturities of held-to-maturity investments, sales of available-for-sale investments and sales of trading investments. For both the years ended December 31, 2011 and 2010, cash used in investing activities included the acquisitions of fixed assets consisting of vans and promotional vehicles, coolers
47
and other equipment to support our marketing and promotional activities, production equipment, furniture and fixtures, office and computer equipment, computer software, and equipment used for sales and administrative activities, as well as certain leasehold improvements. For the year ended December 31, 2011, cash used in investing activities also included acquisitions of real property. We expect to continue to use a portion of our cash in excess of our requirements for operations for purchasing short-term and long-term investments, and for other corporate purposes, including, the acquisition of capital equipment, specifically, vans, trucks and promotional vehicles, coolers, other promotional equipment, merchandise displays, warehousing racks as well as items of production equipment required to produce certain of our existing and/or new products and to develop our brand in international markets. From time to time, we may also purchase real property related to our beverage business and/or acquire compatible businesses as a use of cash in excess of our requirements for operations.
Cash flows (used in) provided by financing activities – Net cash used in financing activities was $154.2
million for the year ended December 31, 2011, as compared to net cash provided by financing activities of $9.2 million for the year ended December 31, 2010. For the year ended December 31, 2011 cash used in financing activities was primarily attributable to $176.4 million of purchases of common stock. For the year ended December 31, 2011 cash provided by financing activities was primarily attributable to $20.3 million received from the issuance of common stock in connection with the exercise of certain stock options. For the year ended December 31, 2010, cash used in financing activities was primarily attributable to $23.5 million of purchases of common stock. For the year ended December 31, 2010, cash provided by financing activities was primarily attributable to proceeds of $20.8 million received from the issuance of common stock in connection with the exercise of certain stock options and a $12.4 million excess tax benefit in connection with the exercise of certain stock options.
Purchases of inventories, increases in accounts receivable and other assets, acquisition of property and
equipment, acquisition and maintenance of trademarks, payments of accounts payable, income taxes payable and purchases of our common stock are expected to remain our principal recurring use of cash.
Cash and cash equivalents, short-term and long-term investments – At December 31, 2011, we had $359.3
million in cash and cash equivalents and $434.5 million in short-term and long-term investments. We have historically invested these amounts in U.S. Treasury bills, U.S. government agency securities and municipal securities (which may have an auction reset feature), corporate notes and bonds, commercial paper and money market funds meeting certain criteria. We maintain our investments for cash management purposes and not for purposes of speculation. Our risk management policies emphasize credit quality (primarily based on short-term ratings by nationally recognized statistical organizations) in selecting and maintaining our investments. We regularly assess market risk of our investments and believe our current policies and investment practices adequately limit those risks. However, certain of these investments are subject to general credit, liquidity, market and interest rate risks. These market risks associated with our investment portfolio may have an adverse effect on our future results of operations, liquidity and financial condition.
Our long-term investments are comprised of auction rate securities. A large portion of these auction rate
securities carry an investment grade credit rating and are additionally backed by various federal agencies and/or monoline insurance companies. The applicable interest rate is reset at pre-determined intervals, usually every 7 to 35 days. Liquidity for these auction rate securities was typically provided by an auction process which allowed holders to sell their notes at periodic auctions. Since 2008, the auctions for these auction rate securities failed. The securities for which auctions have failed will continue to accrue and/or pay interest at their pre-determined rates and be auctioned every 7 to 35 days until their respective auction succeeds, the issuer calls the securities, they mature or we are able exercise the Put Options (as defined below), or we are able to sell the securities to third parties. As a result, our ability to liquidate and fully recover the carrying value of our auction rate securities in the near term may be limited. Consequently, these securities, except those that we intend to sell prior to December 31, 2012 as a result of the agreements described below, or those that were redeemed at par after December 31, 2011 and 2010, respectively, are classified as long-term investments in the accompanying consolidated balance sheets.
In June 2011, we entered into an agreement (the “2011 ARS Agreement”) related to $24.5 million of par
value auction rate securities (the “2011 ARS Securities”). Under the 2011 ARS Agreement, we have the right to
48
sell the 2011 ARS Securities including all accrued but unpaid interest thereon (the “2011 Put Option”) as follows: (i) on or after July 1, 2013, up to $1.0 million aggregate par value; (ii) on or after October 1, 2013, up to an additional $1.0 million aggregate par value; and (iii) in quarterly installments thereafter based on a formula of the then outstanding 2011 ARS Securities, as adjusted for normal market redemptions, with full sale rights available on or after April 1, 2016. The 2011 ARS Securities will continue to accrue interest until redeemed through the 2011 Put Option, or as determined by the auction process or the terms outlined in the prospectus of the respective 2011 ARS Securities when the auction process fails. Under the 2011 ARS Agreement, we have the obligation, should we receive written notification from the put issuer, to sell the 2011 ARS Securities at par plus all accrued but unpaid interest. During the year ended December 31, 2011, $3.7 million of par value 2011 ARS Securities were redeemed at par through normal market channels.
In March 2010, we entered into an agreement (the “2010 ARS Agreement”) related to $54.2 million of par value auction rate securities (the “2010 ARS Securities”). Under the 2010 ARS Agreement, we have the right, but not the obligation, to sell the 2010 ARS Securities including all accrued but unpaid interest thereon (the “2010 Put Option”) as follows: (i) on or after March 22, 2011, up to $13.6 million aggregate par value; and (ii) equal semi-annual or annual installments thereafter with full sale rights available on or after March 22, 2013. The 2010 ARS Securities will continue to accrue interest until redeemed through the 2010 Put Option, or as determined by the auction process or the terms outlined in the prospectus of the respective 2010 ARS Securities when the auction process fails. During the year ended December 31, 2011, $27.1 million of par value 2010 ARS Securities were redeemed at par through the exercise of the 2010 Put Option and $4.0 million of par value 2010 ARS Securities were redeemed at par through normal market channels ($7.4 million of par value 2010 ARS Securities were redeemed at par through normal market channels during the year ended December 31, 2010).
At December 31, 2011, we held auction rate securities with a face value of $44.8 million (amortized cost
basis of $35.9 million). A Level 3 valuation was performed on our auction rate securities as of December 31, 2011 resulting in a fair value of $3.3 million for our available-for-sale auction rate securities (after a $5.0 million impairment) and $32.5 million for our trading auction rate securities (after a $4.0 million impairment), which are included in short-term and long-term investments. This valuation utilized a mark-to-model approach which included estimates for interest rates, timing and amount of cash flows, credit and liquidity premiums, as well as expected holding periods for the auction rate securities. These assumptions are typically volatile and subject to change as the underlying data sources and market conditions evolve.
As of December 31, 2011, we recorded $3.0 million in aggregate as the fair market value of the 2011 Put
Option and the 2010 Put Option (collectively the “Put Options”). The net effect of (i) the acquisition of the 2011 Put Option during the second fiscal quarter of 2011; (ii) the
revaluation of the Put Options as of December 31, 2011; (iii) the transfer from available-for-sale to trading of the 2011 ARS Securities during the second fiscal quarter of 2011; (iv) the revaluation of our trading auction rate securities as of September 30, 2011; (v) the redemption at par of certain 2011 ARS Securities and 2010 ARS Securities, including those redeemed at par through the exercise of the 2010 Put Option; and (vi) a recognized gain resulting from the redemption at par of a previously other-than-temporary impaired security during the first fiscal quarter of 2011, resulted in a (loss) of ($0.8) million included in other income (expense) for the year ended December 31, 2011. The net effect of (i) the acquisition of the 2010 Put Option during the first fiscal quarter of 2010; (ii) the revaluation of the 2010 Put Option as of December 31, 2010; (iii) the transfer from available-for-sale to trading of the 2010 ARS Securities during the first fiscal quarter of 2010; (iv) the revaluation of the Company’s trading auction rate securities as of December 31, 2010; (v) the redemption at par of certain 2010 ARS Securities; (vi) a recognized gain resulting from the redemption at par of a previously other-than-temporary impaired security during the first fiscal quarter of 2010; and (vii) an increase in the other-than-temporary impairment of certain auction rate securities, resulted in a (loss) of ($0.8) million included in other income (expense) for the year ended December 31, 2010.
We hold additional auction rate securities that do not have a related put option. These auction rate
securities continue to be classified as available-for-sale securities. We intend to retain our investment in these securities until the earlier of the anticipated recovery in market value or maturity.
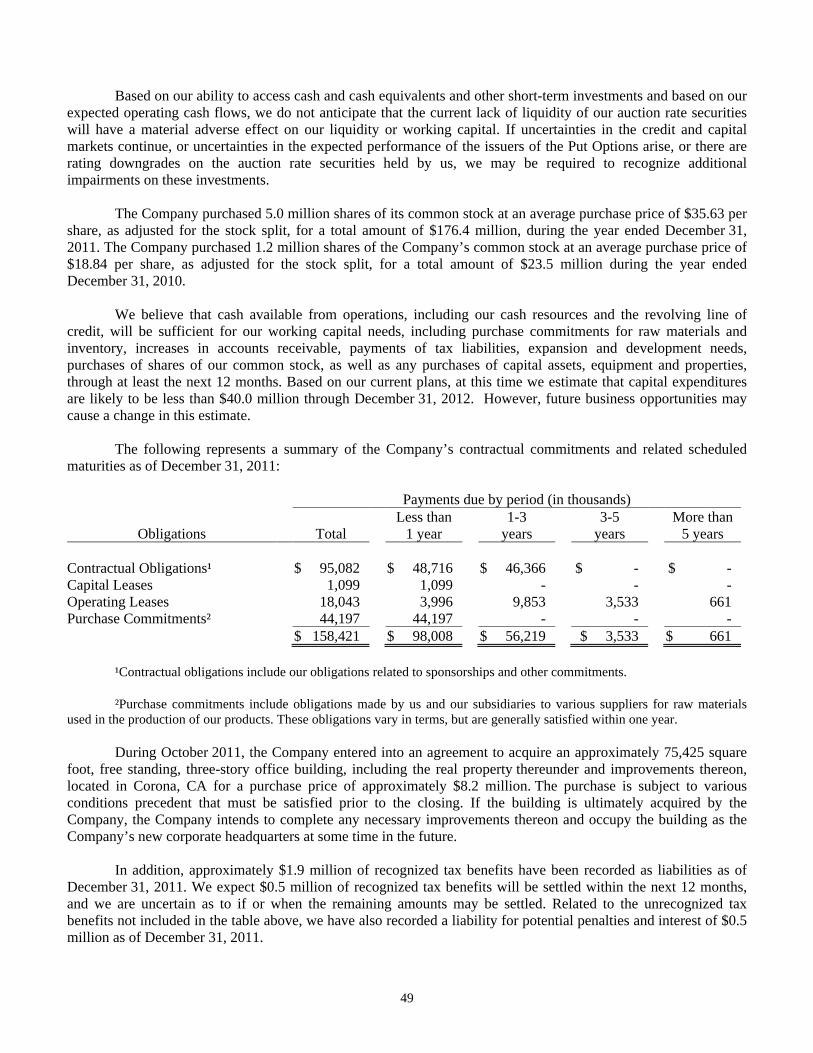
49
Based on our ability to access cash and cash equivalents and other short-term investments and based on our
expected operating cash flows, we do not anticipate that the current lack of liquidity of our auction rate securities will have a material adverse effect on our liquidity or working capital. If uncertainties in the credit and capital markets continue, or uncertainties in the expected performance of the issuers of the Put Options arise, or there are rating downgrades on the auction rate securities held by us, we may be required to recognize additional impairments on these investments.
The Company purchased 5.0 million shares of its common stock at an average purchase price of $35.63 per share, as adjusted for the stock split, for a total amount of $176.4 million, during the year ended December 31, 2011. The Company purchased 1.2 million shares of the Company’s common stock at an average purchase price of $18.84 per share, as adjusted for the stock split, for a total amount of $23.5 million during the year ended December 31, 2010.
We believe that cash available from operations, including our cash resources and the revolving line of
credit, will be sufficient for our working capital needs, including purchase commitments for raw materials and inventory, increases in accounts receivable, payments of tax liabilities, expansion and development needs, purchases of shares of our common stock, as well as any purchases of capital assets, equipment and properties, through at least the next 12 months. Based on our current plans, at this time we estimate that capital expenditures are likely to be less than $40.0 million through December 31, 2012. However, future business opportunities may cause a change in this estimate.
The following represents a summary of the Company’s contractual commitments and related scheduled
maturities as of December 31, 2011:
Payments due by period (in thousands)
Obligations Total Less than
1 year 1-3
years 3-5
years More than
5 years Contractual Obligations¹ $ 95,082 $ 48,716 $ 46,366 $ - $ - Capital Leases 1,099 1,099 - - - Operating Leases 18,043 3,996 9,853 3,533 661 Purchase Commitments² 44,197 44,197 - - - $ 158,421 $ 98,008 $ 56,219 $ 3,533 $ 661
¹Contractual obligations include our obligations related to sponsorships and other commitments. ²Purchase commitments include obligations made by us and our subsidiaries to various suppliers for raw materials
used in the production of our products. These obligations vary in terms, but are generally satisfied within one year. During October 2011, the Company entered into an agreement to acquire an approximately 75,425 square
foot, free standing, three-story office building, including the real property thereunder and improvements thereon, located in Corona, CA for a purchase price of approximately $8.2 million. The purchase is subject to various conditions precedent that must be satisfied prior to the closing. If the building is ultimately acquired by the Company, the Company intends to complete any necessary improvements thereon and occupy the building as the Company’s new corporate headquarters at some time in the future.
In addition, approximately $1.9 million of recognized tax benefits have been recorded as liabilities as of
December 31, 2011. We expect $0.5 million of recognized tax benefits will be settled within the next 12 months, and we are uncertain as to if or when the remaining amounts may be settled. Related to the unrecognized tax benefits not included in the table above, we have also recorded a liability for potential penalties and interest of $0.5 million as of December 31, 2011.
50
Accounting Policies and Pronouncements
Critical Accounting Policies
Our consolidated financial statements are prepared in accordance with GAAP. GAAP requires us to make estimates and assumptions that affect the reported amounts in our consolidated financial statements. The following summarizes our most significant accounting and reporting policies and practices:
Investments – Our investments in debt securities are classified as either held-to-maturity, available-for-sale or trading, in accordance with the Financial Accounting Standards Board (the “FASB”) Accounting Standards Codification (“ASC”) 320. Held-to-maturity securities are those securities that we have the positive intent and ability to hold until maturity. Trading securities are those securities that we intend to sell in the near term. All other securities not included in the held-to-maturity or trading category are classified as available-for-sale. Held-to-maturity securities are recorded at amortized cost which approximates fair market value. Trading securities are carried at fair value with unrealized gains and losses charged to earnings. Available-for-sale securities are carried at fair value with unrealized gains and losses recorded within accumulated other comprehensive income (loss) as a separate component of stockholders’ equity. ASC 820 defines fair value as the price that would be received to sell an asset or paid to transfer a liability in an orderly transaction between market participants at the measurement date. ASC 820 also establishes a fair value hierarchy which requires an entity to maximize the use of observable inputs, where available (see Note 3 “Fair Value of Certain Financial Assets and Liabilities” in the notes to consolidated financial statements). Under ASC 320-10-35, a security is considered to be other-than-temporarily impaired if the present value of cash flows expected to be collected are less than the security’s amortized cost basis (the difference being defined as the “Credit Loss”) or if the fair value of the security is less than the security’s amortized cost basis and the investor intends, or will be required, to sell the security before recovery of the security’s amortized cost basis. If an other-than-temporary impairment exists, the charge to earnings is limited to the amount of Credit Loss if the investor does not intend to sell the security, and will not be required to sell the security, before recovery of the security’s amortized cost basis. Any remaining difference between fair value and amortized cost is recognized in other comprehensive income (loss), net of applicable taxes. We evaluate whether the decline in fair value of our investments is other-than-temporary at each quarter-end. This evaluation consists of a review by management, and includes market pricing information and maturity dates for the securities held, market and economic trends in the industry and information on the issuer’s financial condition and, if applicable, information on the guarantors’ financial condition. Factors considered in determining whether a loss is temporary include the length of time and extent to which the investment’s fair value has been less than its cost basis, the financial condition and near-term prospects of the issuer and guarantors, including any specific events which may influence the operations of the issuer and our intent and ability to retain the investment for a reasonable period of time sufficient to allow for any anticipated recovery of fair value.
Accounts Receivable – We evaluate the collectability of our trade accounts receivable based on a number of factors. In circumstances where we become aware of a specific customer’s inability to meet its financial obligations to us, a specific reserve for bad debts is estimated and recorded, which reduces the recognized receivable to the estimated amount we believe will ultimately be collected. In addition to specific customer identification of potential bad debts, bad debt charges are recorded based on our recent loss history and an overall assessment of past due trade accounts receivable outstanding.
Inventories – Inventories are stated at the lower of cost to purchase and/or manufacture the inventory or the current estimated market value of the inventory. We regularly review our inventory quantities on hand and record a provision for excess and obsolete inventory based primarily on our estimated forecast of product demand, production availability and/or our ability to sell the product(s) concerned. Demand for our products can fluctuate significantly. Factors that could affect demand for our products include unanticipated changes in consumer preferences, general market and economic conditions or other factors that may result in cancellations of advance orders or reductions in the rate of reorders placed by customers and/or continued weakening of economic conditions. Additionally, management’s estimates of future product demand may be inaccurate, which could result in an understated or overstated provision required for excess and obsolete inventory.
51
Long-Lived Assets – Management regularly reviews property and equipment and other long-lived assets, including certain definite-lived identifiable intangible assets, for possible impairment. This review occurs annually or more frequently if events or changes in circumstances indicate the carrying amount of the asset may not be recoverable. If there is indication of impairment of property and equipment or amortizable intangible assets, then management prepares an estimate of future cash flows (undiscounted and without interest charges) expected to result from the use of the asset and its eventual disposition. If these cash flows are less than the carrying amount of the asset, an impairment loss is recognized to write down the asset to its estimated fair value. The fair value is estimated at the present value of the future cash flows discounted at a rate commensurate with management’s estimates of the business risks. No impairment indicators were identified as of December 31, 2011 or 2010. Management believes that the accounting estimate related to impairment of its long-lived assets, including its trademarks (as discussed below), is a “critical accounting estimate” because: (1) the estimate is highly susceptible to change from period to period because it requires company management to make assumptions about cash flows and discount rates; and (2) the impact that recognizing an impairment would have on the assets reported on our consolidated balance sheet, as well as net income, could be material. Management’s assumptions about cash flows and discount rates require significant judgment because actual revenues and expenses have fluctuated in the past and are expected to continue to do so. Intangibles – Intangibles are comprised primarily of trademarks that represent our exclusive ownership of the Monster Energy® trademark, the Hansen’s® trademark, the Blue Sky® trademark, and the Junior Juice® trademark, all used in connection with the manufacture, sale and distribution of supplements and beverages. We also own in our own right, a number of other trademarks in the United States, as well as in a number of countries around the world. During 2002, we adopted ASC 350. Under the provisions of ASC 350, we discontinued amortization on indefinite-lived trademarks while continuing to amortize remaining definite-lived trademarks over one to 25 years. In accordance with ASC 350, we evaluate our trademarks annually for impairment or earlier if there is an indication of impairment. If there is an indication of impairment of identified intangible assets not subject to amortization, management compares the estimated fair value with the carrying amount of the asset. An impairment loss is recognized to write down the intangible asset to its fair value if it is less than the carrying amount. The fair value is calculated using the income approach. However, preparation of estimated expected future cash flows is inherently subjective and is based on management’s best estimate of assumptions concerning expected future conditions. Based on management’s impairment analysis performed for the year ended December 31, 2011, the estimated fair values of trademarks exceeded the carrying values. In estimating future revenues, we use internal budgets. Internal budgets are developed based on recent revenue data and future marketing plans for existing product lines and planned timing of future introductions of new products and their impact on our future cash flows.
Revenue Recognition – We recognize revenue when persuasive evidence of an arrangement exists, delivery has occurred, the sales price is fixed or determinable and collectability is reasonably assured. Generally, ownership of and title to our products pass to customers upon delivery of the products to customers. Certain of our distributors may also perform a separate function as a co-packer on our behalf. In such cases, ownership of and title to our products that are co-packed on our behalf by those co-packers who are also distributors, passes to such distributors when we are notified by them that they have taken transfer or possession of the relevant portion of our finished goods. Net sales have been determined after deduction of promotional and other allowances in accordance with ASC 605-50. Amounts received pursuant to new and/or amended distribution agreements entered into with certain distributors, relating to the costs associated with terminating our prior distributors, are accounted for as revenue ratably over the anticipated life of the respective distribution agreement, generally 20 years.
52
Management believes that adequate provision has been made for cash discounts, returns and spoilage based on our historical experience. Cost of Sales – Cost of sales consists of the costs of raw materials utilized in the manufacture of products, co-packing fees, repacking fees, in-bound freight charges, as well as certain internal transfer costs, warehouse expenses incurred prior to the manufacture of our finished products and certain quality control costs. Raw materials account for the largest portion of the cost of sales. Raw materials include cans, bottles, other containers, ingredients and packaging materials. Operating Expenses – Operating expenses include selling expenses such as distribution expenses to transport products to customers and warehousing expenses after manufacture, as well as expenses for advertising, commissions, sampling and in-store demonstration costs, costs for merchandise displays, point-of-sale materials and premium items, sponsorship expenses, other marketing expenses and design expenses. Operating expenses also include payroll costs, travel costs, professional service fees including legal fees, termination payments made to certain of our prior distributors, entertainment, insurance, postage, depreciation and other general and administrative costs. Stock-Based Compensation – The Company accounts for stock-based compensation under the provisions of ASC 718. The Company records compensation expense for employee stock options based on the estimated fair value of the options on the date of grant using the Black-Scholes-Merton option pricing formula. The Company records compensation expense for non-employee stock options based on the estimated fair value of the options as of the earlier of (1) the date at which a commitment for performance by the non-employee to earn the stock option is reached or (2) the date at which the non-employee’s performance is complete, using the Black-Scholes-Merton option pricing formula. Stock-based compensation cost for restricted stock awards and restricted stock units is measured based on the closing fair market value of the Company’s common stock at the date of grant. In the event that the Company has the option and intent to settle a restricted stock unit in cash, the award is classified as a liability and revalued at each balance sheet date. Income Taxes – We utilize the liability method of accounting for income taxes as set forth in ASC 740. Under the liability method, deferred taxes are determined based on the temporary differences between the financial statement and tax basis of assets and liabilities using tax rates expected to be in effect during the years in which the basis differences reverse. A valuation allowance is recorded when it is more likely than not that some of the deferred tax assets will not be realized. In determining the need for valuation allowances we consider projected future taxable income and the availability of tax planning strategies. If in the future we determine that we would not be able to realize our recorded deferred tax assets, an increase in the valuation allowance would be recorded, decreasing earnings in the period in which such determination is made.
We assess our income tax positions and record tax benefits for all years subject to examination based upon our evaluation of the facts, circumstances and information available at the reporting date. For those tax positions where there is a greater than 50% likelihood that a tax benefit will be sustained, we have recorded the largest amount of tax benefit that may potentially be realized upon ultimate settlement with a taxing authority that has full knowledge of all relevant information. For those income tax positions where there is less than 50% likelihood that a tax benefit will be sustained, no tax benefit has been recognized in the financial statements.
Recent Accounting Pronouncements
See Part II, Item 8 “Financial Statements and Supplementary Data – Note 1 – Organization and Summary of Significant Accounting Policies – Recently Issued Accounting Pronouncements” for a full description of recent accounting pronouncements including the respective expected dates of adoption and expected effects on the Company’s consolidated financial position, results of operations or liquidity.
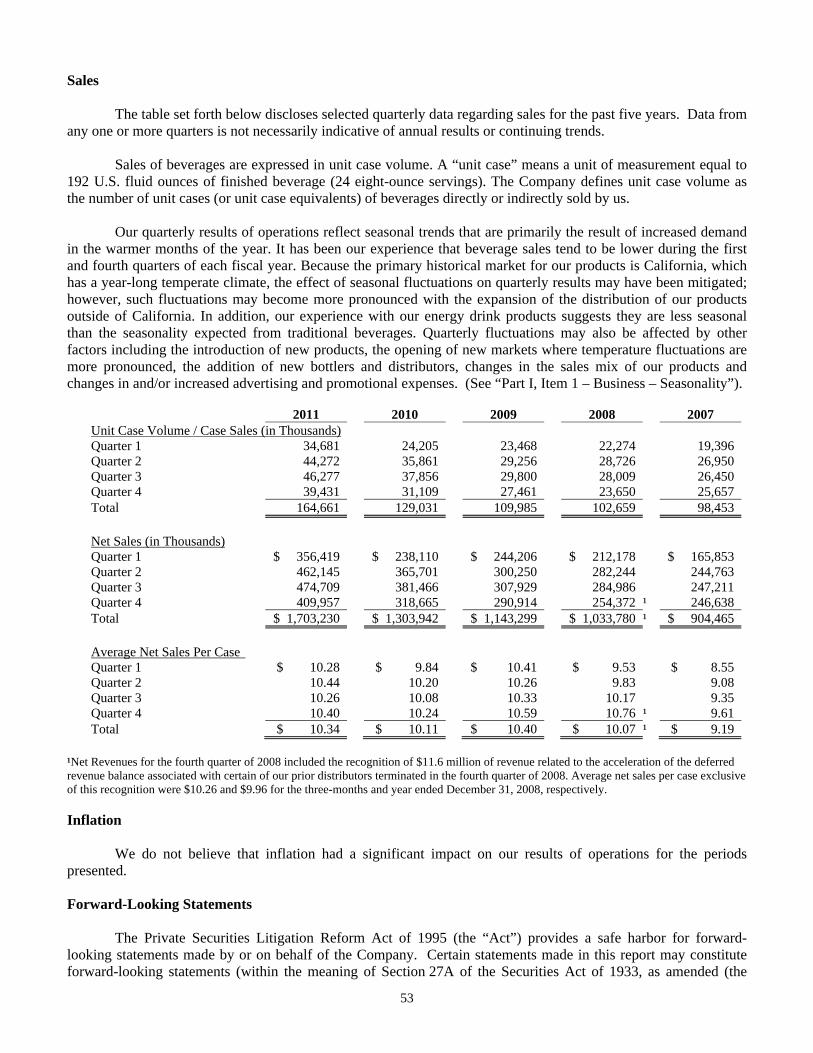
53
Sales
The table set forth below discloses selected quarterly data regarding sales for the past five years. Data from any one or more quarters is not necessarily indicative of annual results or continuing trends.
Sales of beverages are expressed in unit case volume. A “unit case” means a unit of measurement equal to 192 U.S. fluid ounces of finished beverage (24 eight-ounce servings). The Company defines unit case volume as the number of unit cases (or unit case equivalents) of beverages directly or indirectly sold by us.
Our quarterly results of operations reflect seasonal trends that are primarily the result of increased demand in the warmer months of the year. It has been our experience that beverage sales tend to be lower during the first and fourth quarters of each fiscal year. Because the primary historical market for our products is California, which has a year-long temperate climate, the effect of seasonal fluctuations on quarterly results may have been mitigated; however, such fluctuations may become more pronounced with the expansion of the distribution of our products outside of California. In addition, our experience with our energy drink products suggests they are less seasonal than the seasonality expected from traditional beverages. Quarterly fluctuations may also be affected by other factors including the introduction of new products, the opening of new markets where temperature fluctuations are more pronounced, the addition of new bottlers and distributors, changes in the sales mix of our products and changes in and/or increased advertising and promotional expenses. (See “Part I, Item 1 – Business – Seasonality”).
2011 2010 2009 2008 2007
Unit Case Volume / Case Sales (in Thousands) Quarter 1 34,681 24,205 23,468 22,274 19,396 Quarter 2 44,272 35,861 29,256 28,726 26,950 Quarter 3 46,277 37,856 29,800 28,009 26,450 Quarter 4 39,431 31,109 27,461 23,650 25,657 Total 164,661 129,031 109,985 102,659 98,453 Net Sales (in Thousands) Quarter 1 $ 356,419 $ 238,110 $ 244,206 $ 212,178 $ 165,853 Quarter 2 462,145 365,701 300,250 282,244 244,763 Quarter 3 474,709 381,466 307,929 284,986 247,211 Quarter 4 409,957 318,665 290,914 254,372 ¹ 246,638 Total $ 1,703,230 $ 1,303,942 $ 1,143,299 $ 1,033,780 ¹ $ 904,465 Average Net Sales Per Case Quarter 1 $ 10.28 $ 9.84 $ 10.41 $ 9.53 $ 8.55 Quarter 2 10.44 10.20 10.26 9.83 9.08 Quarter 3 10.26 10.08 10.33 10.17 9.35 Quarter 4 10.40 10.24 10.59 10.76 ¹ 9.61 Total $ 10.34 $ 10.11 $ 10.40 $ 10.07 ¹ $ 9.19
¹Net Revenues for the fourth quarter of 2008 included the recognition of $11.6 million of revenue related to the acceleration of the deferred revenue balance associated with certain of our prior distributors terminated in the fourth quarter of 2008. Average net sales per case exclusive of this recognition were $10.26 and $9.96 for the three-months and year ended December 31, 2008, respectively. Inflation
We do not believe that inflation had a significant impact on our results of operations for the periods presented. Forward-Looking Statements
The Private Securities Litigation Reform Act of 1995 (the “Act”) provides a safe harbor for forward-looking statements made by or on behalf of the Company. Certain statements made in this report may constitute forward-looking statements (within the meaning of Section 27A of the Securities Act of 1933, as amended (the
54
“Securities Act”), and Section 21E of the Exchange Act, as amended) regarding our expectations with respect to revenues, profitability, adequacy of funds from operations and our existing credit facility, among other things. All statements containing a projection of revenues, income (loss), earnings (loss) per share, capital expenditures, dividends, capital structure or other financial items, a statement of management’s plans and objectives for future operations, or a statement of future economic performance contained in management’s discussion and analysis of financial condition and results of operations, including statements related to new products, volume growth and statements encompassing general optimism about future operating results and non-historical information, are forward-looking statements within the meaning of the Act. Without limiting the foregoing, the words “believes,” “thinks,” “anticipates,” “plans,” “expects,” “estimates,” and similar expressions are intended to identify forward-looking statements.
Management cautions that these statements are qualified by their terms and/or important factors, many of which are outside our control, involve a number of risks, uncertainties and other factors, that could cause actual results and events to differ materially from the statements made including, but not limited to, the following: · The current uncertainty and volatility in the national and global economy; ·
The impact of lower disposable incomes of our consumers, as a result of the current state of the economy, the continuing high levels of unemployment and high gasoline prices;
· The impact of the acquisition of CCE’s North American business by TCCC; ·
Disruption in distribution or sales and/or decline in sales due to the termination and/or appointment of existing and/or new domestic and/or international distributors;
· The impact of the acquisition of AB by InBev; · Lack of anticipated demand for our products in international markets; ·
Unfavorable international regulations, including taxation requirements, product registration requirements, tariffs or trade restrictions;
· Losses arising from our operations outside the United States; ·
Our ability to manage legal and regulatory requirements in foreign jurisdictions, potential difficulties in staffing and managing foreign operations, potentially higher incidence of fraud or corruption and credit risk of foreign customers and distributors;
· Our ability to effectively manage our inventories and/or our accounts receivables; ·
Our foreign currency exchange rate risk with respect to our sales, expenses, profits, assets and liabilities denominated in currencies other than the U.S. dollar, which will continue to increase as foreign sales increase, since we do not use derivative financial instruments to reduce our net exposure to currency fluctuations;
·
Any proceedings which may be brought against us by the Securities and Exchange Commission (the “SEC’) or other governmental agencies;
·
The outcome of the shareholder securities litigation filed against us and/or against certain of our officers and directors, and the possibility of other private litigation;
· The possibility of future shareholder derivative actions or shareholder securities litigation filed against us; ·
The outcome of future auctions of auction rate securities and/or our ability to recover payments thereunder and/or the creditworthiness of issuers of our auction rate securities and/or our Put Options and/or their ability to make payment thereunder;
·
Our ability to address any significant deficiencies or material weakness in our internal control over financial reporting;
·
Our ability to generate sufficient cash flows to support capital expansion plans and general operating activities;
·
Decreased demand for our products resulting from changes in consumer preferences or from decreased consumer discretionary spending power;
· Changes in demand that are weather related, particularly in areas outside of California; ·
Competitive products and pricing pressures and our ability to gain or maintain our share of sales in the marketplace as a result of actions by competitors;
· Our ability to introduce new products; · An inability to achieve volume growth through product and packaging initiatives; ·
Our ability to sustain the current level of sales and/or increase the sales of our Monster Energy® brand energy drinks and/or our Java Monster® line of non-carbonated dairy based coffee + energy drinks and/or our
55
Monster Energy Extra Strength Nitrous Technology® drinks and/or our Peace Tea® iced teas and/or our Monster Rehab™ energy drinks and/or our Worx Energy® energy shots;
·
The impact of criticism of our energy drink products and/or the energy drink market generally and/or legislation enacted, whether as a result of such criticism or otherwise that limits or otherwise restricts the sale of energy drinks to minors and/or persons below a specified age and/or the venues in which energy drinks can be sold;
·
Our ability to comply with and/or resultant lower consumer demand for energy drinks due to existing and/or future foreign, national, state and local laws and regulations and/or any changes therein, including changes in accounting standards, taxation requirements (including tax rate changes, new tax laws, new and/or increased excise and/or sales and/or other taxes on our products and revised tax law interpretations) and environmental laws, as well as the Federal Food, Drug and Cosmetic Act, the Dietary Supplement Health and Education Act,and regulations made thereunder or in connection therewith, as well as changes in any other food and drug laws in the United States and internationally, especially those that may affect the way in which our products are marketed, and/or labeled, and/or sold, including the contents thereof, as well as laws and regulations or rules made or enforced by the Food and Drug Administration, and/or the Bureau of Alcohol, Tobacco and Firearms and Explosives, and/or the Federal Trade Commission and/or certain state regulatory agencies and/or by any other countries in which we decide to sell our products;
·
Changes in the cost, quality and availability of containers, packaging materials, raw materials, supplements and juice concentrates, and the ability to obtain and/or maintain favorable supply arrangements and relationships and procure timely and/or adequate production of all or any of our products;
·
Our ability to pass on to our customers all or a portion of the increasing costs of fuel and/or raw materials and/or ingredients and/or commodities affecting our business;
·
Our ability to achieve both domestic and international forecasts, which may be based on projected volumes and sales of many product types and/or new products, certain of which are more profitable than others; there can be no assurance that we will achieve projected levels or mixes of product sales;
· Our ability to penetrate new domestic and/or international markets; ·
Our ability to gain approval or mitigate the delay in securing approval for the sale of our products in various countries;
· Economic or political instability in one or more of our international markets; · Our ability to secure and/or retain competent and/or effective distributors internationally; ·
The sales and/or marketing efforts of distributors of our products, most of which distribute products that are competitive with our products;
·
Unilateral decisions by distributors, convenience chains, grocery chains, specialty chain stores, club stores and other customers to discontinue carrying all or any of our products that they are carrying at any time and/or restrict the range of our products they carry and/or devote less resources to the sale of our products;
· The terms and/or availability of our credit facility and the actions of our creditors; · The costs and/or effectiveness, now or in the future, of our advertising, marketing and promotional strategies; · Changes in product category consumption; · Unforeseen economic and political changes; · Possible recalls of our products and/or defective production; ·
Our ability to make suitable arrangements for the co-packing of any of our products and/or the timely replacement of discontinued co-packing arrangements;
· Our ability to make suitable arrangements for the procurement of non-defective raw materials; ·
Our inability to protect and/or the loss of our intellectual property rights and/or our inability to use our trademarks and/or trade names or designs in certain countries;
· Volatility of stock prices which may restrict stock sales or other opportunities; ·
Provisions in our organizational documents and/or control by insiders which may prevent changes in control even if such changes would be beneficial to other stockholders;
· The failure of our bottlers and contract packers to manufacture our products on a timely basis or at all; · Exposure to significant liabilities due to litigation, legal or regulatory proceedings; ·
Any disruption in and/or lack of effectiveness of our information technology systems that disrupts our business or negatively impacts customer relationships;
· Recruitment and retention of senior management, other key employees and our employee base in general.
56
The foregoing list of important factors and other risks detailed from time to time in our reports filed with the Securities and Exchange Commission is not exhaustive. See “Part I, Item 1A – Risk Factors,” for a more complete discussion of these risks and uncertainties and for other risks and uncertainties. Those factors and the other risk factors described therein are not necessarily all of the important factors that could cause actual results or developments to differ materially from those expressed in any of our forward-looking statements. Other unknown or unpredictable factors also could harm our results. Consequently, our actual results could be materially different from the results described or anticipated by our forward-looking statements due to the inherent uncertainty of estimates, forecasts and projections and may be better or worse than anticipated. Given these uncertainties, you should not rely on forward-looking statements. Forward-looking statements represent our estimates and assumptions only as of the date that they were made. We expressly disclaim any duty to provide updates to forward-looking statements, and the estimates and assumptions associated with them, after the date of this report, in order to reflect changes in circumstances or expectations or the occurrence of unanticipated events except to the extent required by applicable securities laws. ITEM 7A. QUANTITATIVE AND QUALITATIVE DISCLOSURES ABOUT MARKET RISK
In the normal course of business, our financial position is routinely subject to a variety of risks. The principal market risks (i.e., the risk of loss arising from adverse changes in market rates and prices) to which we are exposed are fluctuations in energy and fuel prices, commodity prices affecting the costs of juice concentrates and other raw materials (including, but not limited to, increases in the price of aluminum for cans, resin for PET plastic bottles, as well as cane sugar and other sweeteners, glucose, sucrose and milk and cream, all of which are used in some or many of our products) and limited availability of certain raw materials. We generally do not use hedging agreements or alternative instruments to manage the risks associated with securing sufficient ingredients or raw materials. We are also subject to market risks with respect to the cost of commodities because our ability to recover increased costs through higher pricing is limited by the competitive environment in which we operate.
We do not use derivative financial instruments to protect ourselves from fluctuations in interest rates and do not hedge against fluctuations in commodity prices.
Our gross sales to customers outside of the United States were approximately 20% and 16% of
consolidated gross sales for the years ended December 31, 2011 and 2010, respectively. Our growth strategy includes expanding our international business. As a result, we are subject to risks from changes in foreign currency exchange rates. These changes result in cumulative translation adjustments, which are included in accumulated other comprehensive income (loss). We do not consider the potential loss resulting from a hypothetical 10% adverse change in quoted foreign currency exchange rates as of December 31, 2011 to be significant. For the year ended December 31, 2011 we did not use derivative financial instruments to reduce our net exposure to currency fluctuations.
We are primarily exposed to market risks from fluctuations in interest rates and the effects of those
fluctuations on the market values of our short-term and long-term investments. Certain of our short-term and long-term investments are subject to interest rate risk because these investments generally include a fixed interest rate. As a result, the market values of these investments are affected by changes in prevailing interest rates.
At December 31, 2011, we had $359.3 million in cash and cash equivalents and $434.5 million in short-
term and long-term investments including U.S. treasuries, certificates of deposit, corporate bonds, municipal securities, U.S. government agency securities, variable rate demand notes and municipal securities (which may have an auction reset feature). Certain of these investments are subject to general credit, liquidity, market and interest rate risks. At the current time, we are not increasing our investments in auction rate securities.
In June 2011, we entered into the 2011 ARS Agreement, related to $24.5 million of par value auction rate securities. Under the 2011 ARS Agreement, we have the right to sell the 2011 ARS Securities including all accrued but unpaid interest as follows: (i) on or after July 1, 2013, up to $1.0 million aggregate par value; (ii) on or after October 1, 2013, up to an additional $1.0 million aggregate par value; and (iii) in quarterly installments thereafter based on a formula of the then outstanding 2011 ARS securities, as adjusted for normal market redemptions, with
57
full sale rights available on or after April 1, 2016. The 2011 ARS Securities will continue to accrue interest until redeemed through the 2011 Put Option, or as determined by the auction process or the terms outlined in the prospectus of the respective 2011 ARS Securities when the auction process fails. Under the 2011 ARS Agreement, we have the obligation, should we receive written notification from the put issuer, to sell the 2011 ARS Securities at par including all accrued but unpaid interest.
In March 2010, we entered into the 2010 ARS Agreement, related to $54.2 million of par value auction rate
securities. Under the 2010 ARS Agreement, we have the right, but not the obligation, to sell the 2010 ARS Securities including all accrued but unpaid interest as follows: (i) on or after March 22, 2011, up to $13.6 million aggregate par value; and (ii) equal semi-annual or annual installments thereafter with full sale rights available on or after March 22, 2013. The 2010 ARS Securities will continue to accrue interest until redeemed through the 2010 Put Option, or as determined by the auction process or the terms outlined in the prospectus of the 2010 ARS Securities when the auction process fails.
During the year ended December 31, 2011, $4.0 million of par value 2010 ARS Securities were redeemed
at par through normal market channels ($7.4 million of par value 2010 ARS Securities were redeemed at par through normal market channels during the year ended December 31, 2010). During the year ended December 31, 2011, $27.1 million of par value 2010 ARS Securities were redeemed at par through the exercise of the 2010 Put Option. During the year ended December 31, 2011, $3.7 million of par value 2011 ARS Securities were redeemed at par through normal market channels.
The applicable interest rate on our auction rate securities is reset at pre-determined intervals, usually every
7 to 35 days. Liquidity for auction rate securities was typically provided by an auction process which allowed holders to sell their notes. Since 2008, the auctions for these auction rate securities failed. There is no assurance that future auctions of any auction rate securities in our investment portfolio will succeed. If the issuers of these auction rate securities are unable to refinance their debts and call the notes or successfully close future auctions and their credit ratings deteriorate, we may be required to record additional impairment charges on these investments in the future. We may be required to wait until market stability is restored to redeem these instruments, the related Put Options become exercisable, or until the final maturity of the underlying notes (up to 40 years) to realize our investments’ recorded value.
ITEM 8. FINANCIAL STATEMENTS AND SUPPLEMENTARY DATA
The information required to be furnished in response to this ITEM 8 follows the signature page hereto at pages 68 through 103. ITEM 9. CHANGES IN AND DISAGREEMENTS WITH ACCOUNTANTS ON ACCOUNTING AND FINANCIAL DISCLOSURE
None. ITEM 9A. CONTROLS AND PROCEDURES
Evaluation of Disclosure Controls and Procedures – Under the supervision and with the participation of the Company’s management, including our Chief Executive Officer and Chief Financial Officer, we have evaluated the effectiveness of the design and operation of our disclosure controls and procedures (as defined in Rules 13(a)-15(e) and 15(d)-15(e) of the Exchange Act) as of the end of the period covered by this report. Based upon this evaluation, the Chief Executive Officer and Chief Financial Officer have concluded that our disclosure controls and procedures are adequate and effective to ensure that information we are required to disclose in reports that we file or submit under the Exchange Act is (1) recorded, processed, summarized and reported within the time periods specified in rules and forms of the SEC and (2) is accumulated and communicated to our management, including its principal executive and principal financial officers as appropriate to allow timely decisions regarding required disclosures.
58
Management’s Report on Internal Control Over Financial Reporting – Our management is responsible for establishing and maintaining adequate internal control over financial reporting, as defined in Exchange Act Rules 13a-15(f) and 15d-15(f). Under the supervision and with the participation of our management, including our Chief Executive Officer and Chief Financial Officer, our management conducted an evaluation of the effectiveness of our internal control over financial reporting as of December 31, 2011, based on the framework in Internal Control – Integrated Framework issued by the Committee of Sponsoring Organizations of the Treadway Commission. Based on our management’s evaluation under the framework in Internal Control - Integrated Framework, our management concluded that our internal control over financial reporting was effective as of December 31, 2011.
Our internal control over financial reporting as of December 31, 2011, has been audited by Deloitte & Touche LLP, an independent registered public accounting firm, as stated in their attestation report, which is included herein.
Changes in Internal Control Over Financial Reporting – There were no changes in the Company’s internal
controls over financial reporting during the quarter ended December 31, 2011, that have materially affected, or are reasonably likely to materially affect, our internal control over financial reporting.
59
REPORT OF INDEPENDENT REGISTERED PUBLIC ACCOUNTING FIRM To the Board of Directors and Stockholders of Monster Beverage Corporation Corona, California We have audited the internal control over financial reporting of Monster Beverage Corporation and subsidiaries (the “Company”) as of December 31, 2011, based on criteria established in Internal Control — Integrated Framework issued by the Committee of Sponsoring Organizations of the Treadway Commission. The Company’s management is responsible for maintaining effective internal control over financial reporting and for its assessment of the effectiveness of internal control over financial reporting, included in the accompanying Management’s Report on Internal Control Over Financial Reporting. Our responsibility is to express an opinion on the Company’s internal control over financial reporting based on our audit. We conducted our audit in accordance with the standards of the Public Company Accounting Oversight Board (United States). Those standards require that we plan and perform the audit to obtain reasonable assurance about whether effective internal control over financial reporting was maintained in all material respects. Our audit included obtaining an understanding of internal control over financial reporting, assessing the risk that a material weakness exists, testing and evaluating the design and operating effectiveness of internal control based on the assessed risk, and performing such other procedures as we considered necessary in the circumstances. We believe that our audit provides a reasonable basis for our opinion. A company’s internal control over financial reporting is a process designed by, or under the supervision of, the company’s principal executive and principal financial officers, or persons performing similar functions, and effected by the company’s board of directors, management, and other personnel to provide reasonable assurance regarding the reliability of financial reporting and the preparation of financial statements for external purposes in accordance with generally accepted accounting principles. A company’s internal control over financial reporting includes those policies and procedures that (1) pertain to the maintenance of records that, in reasonable detail, accurately and fairly reflect the transactions and dispositions of the assets of the company; (2) provide reasonable assurance that transactions are recorded as necessary to permit preparation of financial statements in accordance with generally accepted accounting principles, and that receipts and expenditures of the company are being made only in accordance with authorizations of management and directors of the company; and (3) provide reasonable assurance regarding prevention or timely detection of unauthorized acquisition, use, or disposition of the company’s assets that could have a material effect on the financial statements. Because of the inherent limitations of internal control over financial reporting, including the possibility of collusion or improper management override of controls, material misstatements due to error or fraud may not be prevented or detected on a timely basis. Also, projections of any evaluation of the effectiveness of the internal control over financial reporting to future periods are subject to the risk that the controls may become inadequate because of changes in conditions, or that the degree of compliance with the policies or procedures may deteriorate. In our opinion, the Company maintained, in all material respects, effective internal control over financial reporting as of December 31, 2011, based on the criteria established in Internal Control — Integrated Framework issued by the Committee of Sponsoring Organizations of the Treadway Commission. We have also audited, in accordance with the standards of the Public Company Accounting Oversight Board (United States), the consolidated financial statements and financial statement schedule as of and for the year ended December 31, 2011 of the Company and our report dated February 29, 2012 expressed an unqualified opinion on those financial statements and financial statement schedule. /s/ DELOITTE & TOUCHE LLP Costa Mesa, California February 29, 2012
60
ITEM 9B. OTHER INFORMATION
None. PART III ITEM 10. DIRECTORS, EXECUTIVE OFFICERS AND CORPORATE GOVERNANCE
The information required by this item regarding our directors is included under the caption “Proposal One – Election of Directors” in our Proxy Statement for our 2012 Annual Meeting of Stockholders to be filed with the SEC within 120 days after the end of the fiscal year ended December 31, 2011 (the “2012 Proxy Statement”) and is incorporated herein by reference.
Information concerning compliance with Section 16(a) of the Exchange Act is included under the caption
“Section 16(a) Beneficial Ownership Reporting Compliance” in our 2012 Proxy Statement and is incorporated herein by reference.
Information concerning the Audit Committee and the Audit Committee Financial expert is reported under
the caption “Audit Committee; Report of the Audit Committee; Duties and Responsibilities” in our 2012 Proxy Statement and is incorporated herein by reference.
Code of Business Conduct and Ethics
We have adopted a Code of Business Conduct and Ethics that applies to all our directors, officers (including our principal executive officer, principal financial officer, principal accounting officer and controllers) and employees and is available at http://investors.monsterbevcorp.com/governance.cfm. The Code of Business Conduct and Ethics and any amendment thereto, as well as any waivers that are required to be disclosed by the rules of the SEC or NASDAQ may be obtained at no cost to you by writing or telephoning us at the following address or telephone number:
Monster Beverage Corporation 550 Monica Circle, Suite 201
Corona, CA 92880 (951) 739-6200 (800) 426-7367
ITEM 11. EXECUTIVE COMPENSATION
Information concerning the compensation of our directors and executive officers and Compensation Committee Interlocks and Insider Participation is reported under the captions “Compensation Discussion and Analysis,” and “Compensation Committee,” respectively, in our 2012 Proxy Statement and is incorporated herein by reference. ITEM 12. SECURITY OWNERSHIP OF CERTAIN BENEFICIAL OWNERS AND MANAGEMENT AND RELATED STOCKHOLDER MATTERS
The disclosure set forth in Item 5, “Market for the Registrant’s Common Equity, Related Stockholder Matters and Issuer Repurchases of Equity Securities”, of this report is incorporated herein.
61
Information concerning the beneficial ownership of the Company’s Common Stock of (a) those persons known to the Company to be the beneficial owners of more than 5% of the Company’s common stock; (b) each of the Company’s directors and nominees for director; and (c) the Company’s executive officers and all of the Company’s current directors and executive officers as a group is reported under the caption “Principal Stockholders and Security Ownership of Management” in our 2012 Proxy Statement and is incorporated herein by reference. ITEM 13. CERTAIN RELATIONSHIPS AND RELATED TRANSACTIONS AND DIRECTOR INDEPENDENCE
Information concerning certain relationships and related transactions is reported under the caption “Certain Relationships and Related Transactions and Director Independence” in our 2012 Proxy Statement and is incorporated herein by reference. ITEM 14. PRINCIPAL ACCOUNTANT FEES AND SERVICES
Information concerning our accountant fees and our Audit Committee’s pre-approval of audit and permissible non-audit services of independent auditors is reported under the captions “Principal Accounting Firm Fees” and “Pre-Approval of Audit and Non-Audit Services,” respectively, in our 2012 Proxy Statement and is incorporated herein by reference.
62
PART IV ITEM 15. EXHIBITS, FINANCIAL STATEMENT SCHEDULES
(a) The following documents are filed as a part of this Form 10-K: Report of Independent Registered Public Accounting Firm 68 Financial Statements: Consolidated Balance Sheets as of December 31, 2011 and 2010 69 Consolidated Statements of Income for the years ended December 31, 2011,
2010 and 2009 70 Consolidated Statements of Stockholders’ Equity for the years ended
December 31, 2011, 2010 and 2009 71 Consolidated Statements of Comprehensive Income for the years ended
December 31, 2011, 2010 and 2009 72 Consolidated Statements of Cash Flows for the years ended December 31,
2011, 2010 and 2009 73 Notes to Consolidated Financial Statements 75 Financial Statement Schedule:
Valuation and Qualifying Accounts for the years ended December 31, 2011, 2010 and 2009 103
Exhibits:
The Exhibits listed in the Index of Exhibits, which appears immediately following the signature page and is incorporated herein by reference, as filed as part of this Form 10-K.
63
SIGNATURES
Pursuant to the requirements of Sections 13 or 15(d) of the Securities Exchange Act of 1934, as amended, the registrant has duly caused this report to be signed on its behalf by the undersigned, thereunto duly authorized. MONSTER BEVERAGE CORPORATION
/s/ RODNEY C. SACKS Rodney C. Sacks Date: February 29, 2012 Chairman of the Board
Pursuant to the requirements of the Securities Exchange Act of 1934, this report has been signed below by
the following persons on behalf of the registrant in the capacities and on the dates indicated. Signature Title Date /s/ RODNEY C. SACKS
Chairman of the Board of Directors and Chief Executive Officer (principal executive officer)
February 29, 2012 Rodney C. Sacks /s/ HILTON H. SCHLOSBERG
Vice Chairman of the Board of Directors, President, Chief Operating Officer, Chief Financial Officer and Secretary (principal financial officer, controller and principal accounting officer)
February 29, 2012 Hilton H. Schlosberg /s/ NORMAN C. EPSTEIN
Director February 29, 2012 Norman C. Epstein /s/ BENJAMIN M. POLK
Director February 29, 2012 Benjamin M. Polk /s/ SYDNEY SELATI
Director February 29, 2012 Sydney Selati /s/ HAROLD C. TABER, JR.
Director February 29, 2012 Harold C. Taber, Jr. /s/ MARK S. VIDERGAUZ
Director February 29, 2012 Mark S. Vidergauz
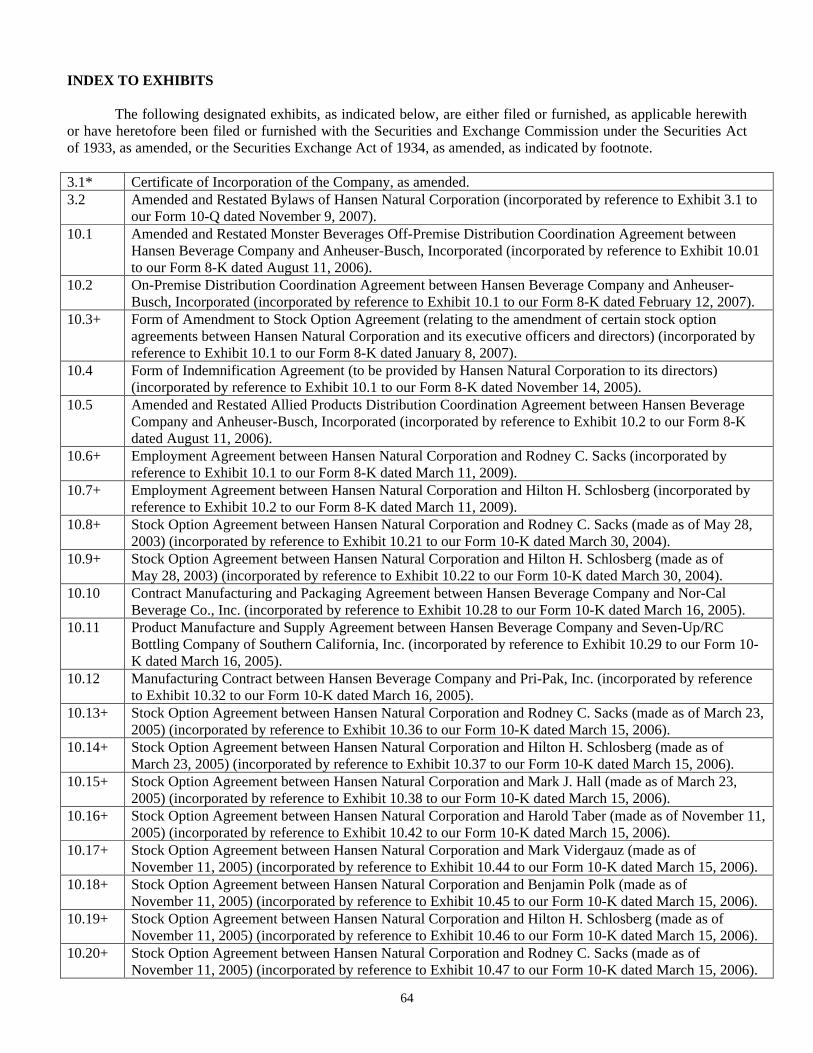
64
INDEX TO EXHIBITS
The following designated exhibits, as indicated below, are either filed or furnished, as applicable herewith or have heretofore been filed or furnished with the Securities and Exchange Commission under the Securities Act of 1933, as amended, or the Securities Exchange Act of 1934, as amended, as indicated by footnote.
3.1* Certificate of Incorporation of the Company, as amended. 3.2 Amended and Restated Bylaws of Hansen Natural Corporation (incorporated by reference to Exhibit 3.1 to
our Form 10-Q dated November 9, 2007). 10.1 Amended and Restated Monster Beverages Off-Premise Distribution Coordination Agreement between
Hansen Beverage Company and Anheuser-Busch, Incorporated (incorporated by reference to Exhibit 10.01 to our Form 8-K dated August 11, 2006).
10.2 On-Premise Distribution Coordination Agreement between Hansen Beverage Company and Anheuser-Busch, Incorporated (incorporated by reference to Exhibit 10.1 to our Form 8-K dated February 12, 2007).
10.3+ Form of Amendment to Stock Option Agreement (relating to the amendment of certain stock option agreements between Hansen Natural Corporation and its executive officers and directors) (incorporated by reference to Exhibit 10.1 to our Form 8-K dated January 8, 2007).
10.4 Form of Indemnification Agreement (to be provided by Hansen Natural Corporation to its directors) (incorporated by reference to Exhibit 10.1 to our Form 8-K dated November 14, 2005).
10.5 Amended and Restated Allied Products Distribution Coordination Agreement between Hansen Beverage Company and Anheuser-Busch, Incorporated (incorporated by reference to Exhibit 10.2 to our Form 8-K dated August 11, 2006).
10.6+ Employment Agreement between Hansen Natural Corporation and Rodney C. Sacks (incorporated by reference to Exhibit 10.1 to our Form 8-K dated March 11, 2009).
10.7+ Employment Agreement between Hansen Natural Corporation and Hilton H. Schlosberg (incorporated by reference to Exhibit 10.2 to our Form 8-K dated March 11, 2009).
10.8+ Stock Option Agreement between Hansen Natural Corporation and Rodney C. Sacks (made as of May 28, 2003) (incorporated by reference to Exhibit 10.21 to our Form 10-K dated March 30, 2004).
10.9+ Stock Option Agreement between Hansen Natural Corporation and Hilton H. Schlosberg (made as of May 28, 2003) (incorporated by reference to Exhibit 10.22 to our Form 10-K dated March 30, 2004).
10.10 Contract Manufacturing and Packaging Agreement between Hansen Beverage Company and Nor-Cal Beverage Co., Inc. (incorporated by reference to Exhibit 10.28 to our Form 10-K dated March 16, 2005).
10.11 Product Manufacture and Supply Agreement between Hansen Beverage Company and Seven-Up/RC Bottling Company of Southern California, Inc. (incorporated by reference to Exhibit 10.29 to our Form 10-K dated March 16, 2005).
10.12 Manufacturing Contract between Hansen Beverage Company and Pri-Pak, Inc. (incorporated by reference to Exhibit 10.32 to our Form 10-K dated March 16, 2005).
10.13+ Stock Option Agreement between Hansen Natural Corporation and Rodney C. Sacks (made as of March 23, 2005) (incorporated by reference to Exhibit 10.36 to our Form 10-K dated March 15, 2006).
10.14+ Stock Option Agreement between Hansen Natural Corporation and Hilton H. Schlosberg (made as of March 23, 2005) (incorporated by reference to Exhibit 10.37 to our Form 10-K dated March 15, 2006).
10.15+ Stock Option Agreement between Hansen Natural Corporation and Mark J. Hall (made as of March 23, 2005) (incorporated by reference to Exhibit 10.38 to our Form 10-K dated March 15, 2006).
10.16+ Stock Option Agreement between Hansen Natural Corporation and Harold Taber (made as of November 11, 2005) (incorporated by reference to Exhibit 10.42 to our Form 10-K dated March 15, 2006).
10.17+ Stock Option Agreement between Hansen Natural Corporation and Mark Vidergauz (made as of November 11, 2005) (incorporated by reference to Exhibit 10.44 to our Form 10-K dated March 15, 2006).
10.18+ Stock Option Agreement between Hansen Natural Corporation and Benjamin Polk (made as of November 11, 2005) (incorporated by reference to Exhibit 10.45 to our Form 10-K dated March 15, 2006).
10.19+ Stock Option Agreement between Hansen Natural Corporation and Hilton H. Schlosberg (made as of November 11, 2005) (incorporated by reference to Exhibit 10.46 to our Form 10-K dated March 15, 2006).
10.20+ Stock Option Agreement between Hansen Natural Corporation and Rodney C. Sacks (made as of November 11, 2005) (incorporated by reference to Exhibit 10.47 to our Form 10-K dated March 15, 2006).
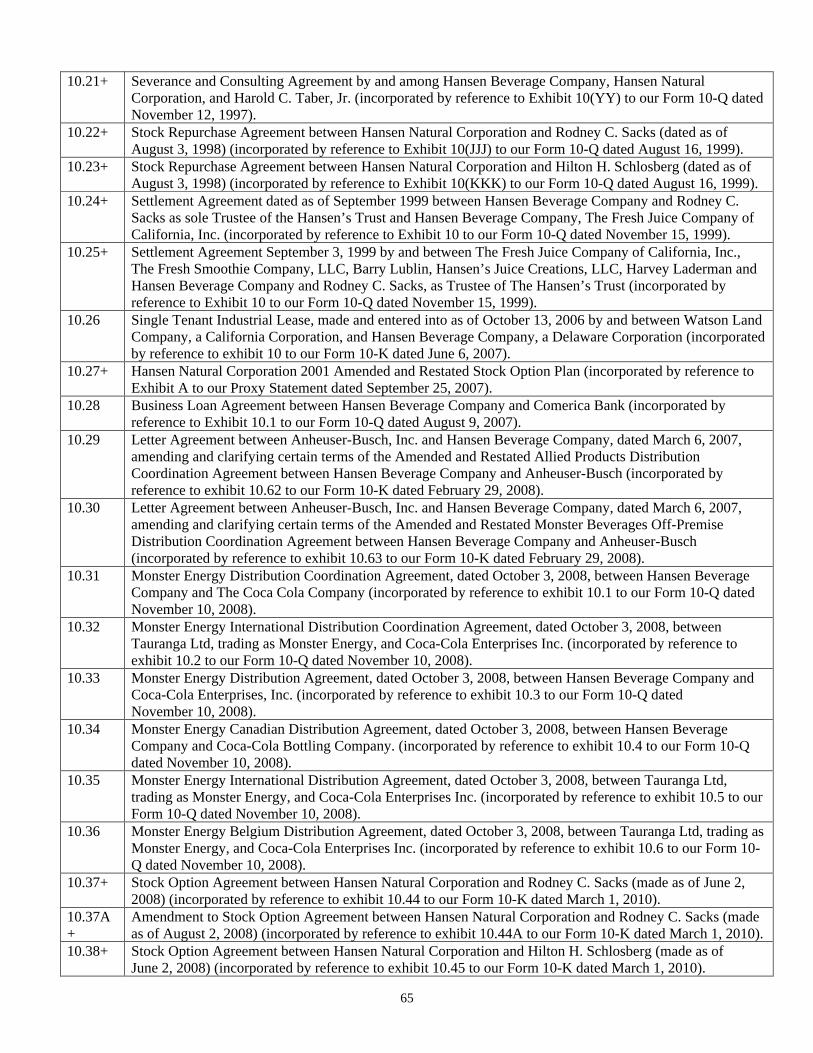
65
10.21+ Severance and Consulting Agreement by and among Hansen Beverage Company, Hansen Natural Corporation, and Harold C. Taber, Jr. (incorporated by reference to Exhibit 10(YY) to our Form 10-Q dated November 12, 1997).
10.22+ Stock Repurchase Agreement between Hansen Natural Corporation and Rodney C. Sacks (dated as of August 3, 1998) (incorporated by reference to Exhibit 10(JJJ) to our Form 10-Q dated August 16, 1999).
10.23+ Stock Repurchase Agreement between Hansen Natural Corporation and Hilton H. Schlosberg (dated as of August 3, 1998) (incorporated by reference to Exhibit 10(KKK) to our Form 10-Q dated August 16, 1999).
10.24+ Settlement Agreement dated as of September 1999 between Hansen Beverage Company and Rodney C. Sacks as sole Trustee of the Hansen’s Trust and Hansen Beverage Company, The Fresh Juice Company of California, Inc. (incorporated by reference to Exhibit 10 to our Form 10-Q dated November 15, 1999).
10.25+ Settlement Agreement September 3, 1999 by and between The Fresh Juice Company of California, Inc., The Fresh Smoothie Company, LLC, Barry Lublin, Hansen’s Juice Creations, LLC, Harvey Laderman and Hansen Beverage Company and Rodney C. Sacks, as Trustee of The Hansen’s Trust (incorporated by reference to Exhibit 10 to our Form 10-Q dated November 15, 1999).
10.26 Single Tenant Industrial Lease, made and entered into as of October 13, 2006 by and between Watson Land Company, a California Corporation, and Hansen Beverage Company, a Delaware Corporation (incorporated by reference to exhibit 10 to our Form 10-K dated June 6, 2007).
10.27+ Hansen Natural Corporation 2001 Amended and Restated Stock Option Plan (incorporated by reference to Exhibit A to our Proxy Statement dated September 25, 2007).
10.28 Business Loan Agreement between Hansen Beverage Company and Comerica Bank (incorporated by reference to Exhibit 10.1 to our Form 10-Q dated August 9, 2007).
10.29 Letter Agreement between Anheuser-Busch, Inc. and Hansen Beverage Company, dated March 6, 2007, amending and clarifying certain terms of the Amended and Restated Allied Products Distribution Coordination Agreement between Hansen Beverage Company and Anheuser-Busch (incorporated by reference to exhibit 10.62 to our Form 10-K dated February 29, 2008).
10.30 Letter Agreement between Anheuser-Busch, Inc. and Hansen Beverage Company, dated March 6, 2007, amending and clarifying certain terms of the Amended and Restated Monster Beverages Off-Premise Distribution Coordination Agreement between Hansen Beverage Company and Anheuser-Busch (incorporated by reference to exhibit 10.63 to our Form 10-K dated February 29, 2008).
10.31 Monster Energy Distribution Coordination Agreement, dated October 3, 2008, between Hansen Beverage Company and The Coca Cola Company (incorporated by reference to exhibit 10.1 to our Form 10-Q dated November 10, 2008).
10.32 Monster Energy International Distribution Coordination Agreement, dated October 3, 2008, between Tauranga Ltd, trading as Monster Energy, and Coca-Cola Enterprises Inc. (incorporated by reference to exhibit 10.2 to our Form 10-Q dated November 10, 2008).
10.33 Monster Energy Distribution Agreement, dated October 3, 2008, between Hansen Beverage Company and Coca-Cola Enterprises, Inc. (incorporated by reference to exhibit 10.3 to our Form 10-Q dated November 10, 2008).
10.34 Monster Energy Canadian Distribution Agreement, dated October 3, 2008, between Hansen Beverage Company and Coca-Cola Bottling Company. (incorporated by reference to exhibit 10.4 to our Form 10-Q dated November 10, 2008).
10.35 Monster Energy International Distribution Agreement, dated October 3, 2008, between Tauranga Ltd, trading as Monster Energy, and Coca-Cola Enterprises Inc. (incorporated by reference to exhibit 10.5 to our Form 10-Q dated November 10, 2008).
10.36 Monster Energy Belgium Distribution Agreement, dated October 3, 2008, between Tauranga Ltd, trading as Monster Energy, and Coca-Cola Enterprises Inc. (incorporated by reference to exhibit 10.6 to our Form 10-Q dated November 10, 2008).
10.37+ Stock Option Agreement between Hansen Natural Corporation and Rodney C. Sacks (made as of June 2, 2008) (incorporated by reference to exhibit 10.44 to our Form 10-K dated March 1, 2010).
10.37A+
Amendment to Stock Option Agreement between Hansen Natural Corporation and Rodney C. Sacks (made as of August 2, 2008) (incorporated by reference to exhibit 10.44A to our Form 10-K dated March 1, 2010).
10.38+ Stock Option Agreement between Hansen Natural Corporation and Hilton H. Schlosberg (made as of June 2, 2008) (incorporated by reference to exhibit 10.45 to our Form 10-K dated March 1, 2010).
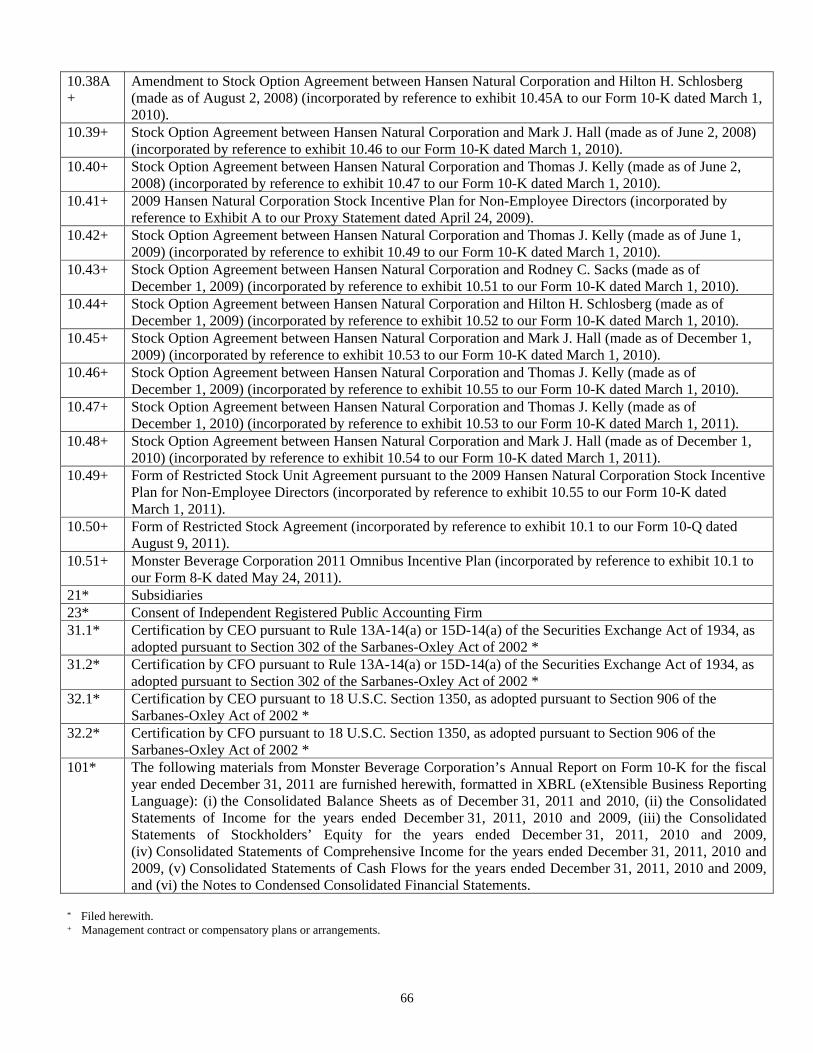
66
10.38A+
Amendment to Stock Option Agreement between Hansen Natural Corporation and Hilton H. Schlosberg (made as of August 2, 2008) (incorporated by reference to exhibit 10.45A to our Form 10-K dated March 1, 2010).
10.39+ Stock Option Agreement between Hansen Natural Corporation and Mark J. Hall (made as of June 2, 2008) (incorporated by reference to exhibit 10.46 to our Form 10-K dated March 1, 2010).
10.40+ Stock Option Agreement between Hansen Natural Corporation and Thomas J. Kelly (made as of June 2, 2008) (incorporated by reference to exhibit 10.47 to our Form 10-K dated March 1, 2010).
10.41+ 2009 Hansen Natural Corporation Stock Incentive Plan for Non-Employee Directors (incorporated by reference to Exhibit A to our Proxy Statement dated April 24, 2009).
10.42+ Stock Option Agreement between Hansen Natural Corporation and Thomas J. Kelly (made as of June 1, 2009) (incorporated by reference to exhibit 10.49 to our Form 10-K dated March 1, 2010).
10.43+ Stock Option Agreement between Hansen Natural Corporation and Rodney C. Sacks (made as of December 1, 2009) (incorporated by reference to exhibit 10.51 to our Form 10-K dated March 1, 2010).
10.44+ Stock Option Agreement between Hansen Natural Corporation and Hilton H. Schlosberg (made as of December 1, 2009) (incorporated by reference to exhibit 10.52 to our Form 10-K dated March 1, 2010).
10.45+ Stock Option Agreement between Hansen Natural Corporation and Mark J. Hall (made as of December 1, 2009) (incorporated by reference to exhibit 10.53 to our Form 10-K dated March 1, 2010).
10.46+ Stock Option Agreement between Hansen Natural Corporation and Thomas J. Kelly (made as of December 1, 2009) (incorporated by reference to exhibit 10.55 to our Form 10-K dated March 1, 2010).
10.47+ Stock Option Agreement between Hansen Natural Corporation and Thomas J. Kelly (made as of December 1, 2010) (incorporated by reference to exhibit 10.53 to our Form 10-K dated March 1, 2011).
10.48+ Stock Option Agreement between Hansen Natural Corporation and Mark J. Hall (made as of December 1, 2010) (incorporated by reference to exhibit 10.54 to our Form 10-K dated March 1, 2011).
10.49+ Form of Restricted Stock Unit Agreement pursuant to the 2009 Hansen Natural Corporation Stock Incentive Plan for Non-Employee Directors (incorporated by reference to exhibit 10.55 to our Form 10-K dated March 1, 2011).
10.50+ Form of Restricted Stock Agreement (incorporated by reference to exhibit 10.1 to our Form 10-Q dated August 9, 2011).
10.51+ Monster Beverage Corporation 2011 Omnibus Incentive Plan (incorporated by reference to exhibit 10.1 to our Form 8-K dated May 24, 2011).
21* Subsidiaries 23* Consent of Independent Registered Public Accounting Firm 31.1* Certification by CEO pursuant to Rule 13A-14(a) or 15D-14(a) of the Securities Exchange Act of 1934, as
adopted pursuant to Section 302 of the Sarbanes-Oxley Act of 2002 * 31.2* Certification by CFO pursuant to Rule 13A-14(a) or 15D-14(a) of the Securities Exchange Act of 1934, as
adopted pursuant to Section 302 of the Sarbanes-Oxley Act of 2002 * 32.1* Certification by CEO pursuant to 18 U.S.C. Section 1350, as adopted pursuant to Section 906 of the
Sarbanes-Oxley Act of 2002 * 32.2* Certification by CFO pursuant to 18 U.S.C. Section 1350, as adopted pursuant to Section 906 of the
Sarbanes-Oxley Act of 2002 * 101* The following materials from Monster Beverage Corporation’s Annual Report on Form 10-K for the fiscal
year ended December 31, 2011 are furnished herewith, formatted in XBRL (eXtensible Business Reporting Language): (i) the Consolidated Balance Sheets as of December 31, 2011 and 2010, (ii) the Consolidated Statements of Income for the years ended December 31, 2011, 2010 and 2009, (iii) the Consolidated Statements of Stockholders’ Equity for the years ended December 31, 2011, 2010 and 2009, (iv) Consolidated Statements of Comprehensive Income for the years ended December 31, 2011, 2010 and 2009, (v) Consolidated Statements of Cash Flows for the years ended December 31, 2011, 2010 and 2009, and (vi) the Notes to Condensed Consolidated Financial Statements.
* Filed herewith. + Management contract or compensatory plans or arrangements.
67
INDEX TO CONSOLIDATED FINANCIAL STATEMENTS AND FINANCIAL STATEMENT SCHEDULE Page MONSTER BEVERAGE CORPORATION AND SUBSIDIARIES Report of Independent Registered Public Accounting Firm 68
Consolidated Balance Sheets as of December 31, 2011 and 2010 69
Consolidated Statements of Income for the years ended December 31, 2011, 2010 and 2009 70
Consolidated Statements of Stockholders’ Equity for the years ended December 31, 2011, 2010 and 2009 71
Consolidated Statements of Comprehensive Income for the years ended December 31, 2011, 2010 and 2009 72
Consolidated Statements of Cash Flows for the years ended December 31, 2011, 2010 and 2009 73
Notes to Consolidated Financial Statements 75 Financial Statement Schedule – Valuation and Qualifying Accounts for the years ended
December 31,2011, 2010 and 2009 103
68
REPORT OF INDEPENDENT REGISTERED PUBLIC ACCOUNTING FIRM To the Board of Directors and Stockholders of Monster Beverage Corporation Corona, California We have audited the accompanying consolidated balance sheets of Monster Beverage Corporation and subsidiaries (the “Company”) as of December 31, 2011 and 2010, and the related consolidated statements of income, stockholders’ equity, comprehensive income, and cash flows for each of the three years in the period ended December 31, 2011. Our audits also included the financial statement schedule listed in the Index at Item 15(a). These consolidated financial statements and financial statement schedule are the responsibility of the Company’s management. Our responsibility is to express an opinion on the consolidated financial statements and financial statement schedule based on our audits. We conducted our audits in accordance with the standards of the Public Company Accounting Oversight Board (United States). Those standards require that we plan and perform the audit to obtain reasonable assurance about whether the consolidated financial statements are free of material misstatement. An audit includes examining, on a test basis, evidence supporting the amounts and disclosures in the consolidated financial statements. An audit also includes assessing the accounting principles used and significant estimates made by management, as well as evaluating the overall consolidated financial statement presentation. We believe that our audits provide a reasonable basis for our opinion. In our opinion, such consolidated financial statements present fairly, in all material respects, the financial position of Monster Beverage Corporation and subsidiaries as of December 31, 2011 and 2010, and the results of their operations and their cash flows for each of the three years in the period ended December 31, 2011, in conformity with accounting principles generally accepted in the United States of America. Also, in our opinion, such financial statement schedule, when considered in relation to the basic consolidated financial statements taken as a whole, presents fairly, in all material respects, the information set forth therein. We have also audited, in accordance with the standards of the Public Company Accounting Oversight Board (United States), the Company’s internal control over financial reporting as of December 31, 2011, based on the criteria established in Internal Control—Integrated Framework issued by the Committee of Sponsoring Organizations of the Treadway Commission and our report dated February 29, 2012, expressed an unqualified opinion on the Company’s internal control over financial reporting. /s/ DELOITTE & TOUCHE LLP Costa Mesa, California February 29, 2012
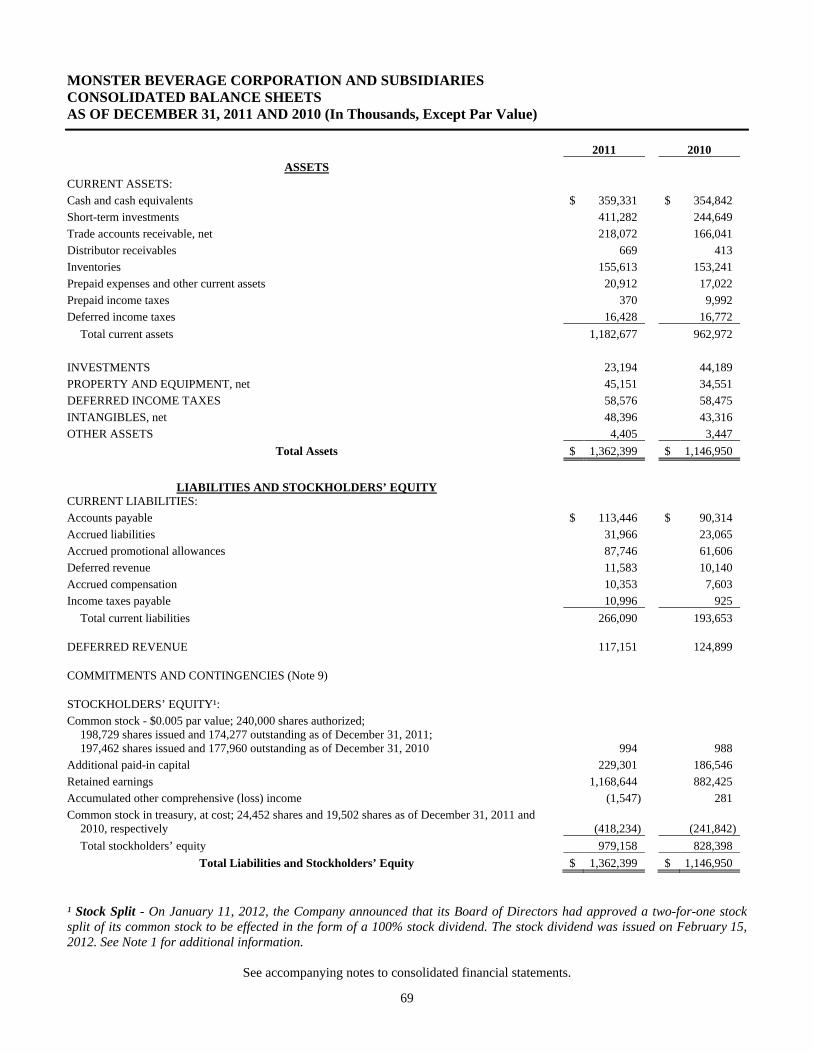
69
MONSTER BEVERAGE CORPORATION AND SUBSIDIARIES CONSOLIDATED BALANCE SHEETS AS OF DECEMBER 31, 2011 AND 2010 (In Thousands, Except Par Value)
2011 2010
ASSETS CURRENT ASSETS: Cash and cash equivalents $ 359,331 $ 354,842 Short-term investments 411,282 244,649 Trade accounts receivable, net 218,072 166,041 Distributor receivables 669 413 Inventories 155,613 153,241 Prepaid expenses and other current assets 20,912 17,022 Prepaid income taxes 370 9,992 Deferred income taxes 16,428 16,772
Total current assets 1,182,677 962,972 INVESTMENTS 23,194 44,189 PROPERTY AND EQUIPMENT, net 45,151 34,551 DEFERRED INCOME TAXES 58,576 58,475 INTANGIBLES, net 48,396 43,316 OTHER ASSETS 4,405 3,447
Total Assets $ 1,362,399 $ 1,146,950
LIABILITIES AND STOCKHOLDERS’ EQUITY
CURRENT LIABILITIES: Accounts payable $ 113,446 $ 90,314 Accrued liabilities 31,966 23,065 Accrued promotional allowances 87,746 61,606 Deferred revenue 11,583 10,140 Accrued compensation 10,353 7,603 Income taxes payable 10,996 925
Total current liabilities 266,090 193,653
DEFERRED REVENUE 117,151 124,899
COMMITMENTS AND CONTINGENCIES (Note 9)
STOCKHOLDERS’ EQUITY¹: Common stock - $0.005 par value; 240,000 shares authorized;
198,729 shares issued and 174,277 outstanding as of December 31, 2011; 197,462 shares issued and 177,960 outstanding as of December 31, 2010 994 988
Additional paid-in capital 229,301 186,546 Retained earnings 1,168,644 882,425 Accumulated other comprehensive (loss) income (1,547) 281 Common stock in treasury, at cost; 24,452 shares and 19,502 shares as of December 31, 2011 and
2010, respectively (418,234) (241,842)
Total stockholders’ equity 979,158 828,398
Total Liabilities and Stockholders’ Equity $ 1,362,399 $ 1,146,950
¹ Stock Split - On January 11, 2012, the Company announced that its Board of Directors had approved a two-for-one stock split of its common stock to be effected in the form of a 100% stock dividend. The stock dividend was issued on February 15, 2012. See Note 1 for additional information.
See accompanying notes to consolidated financial statements.
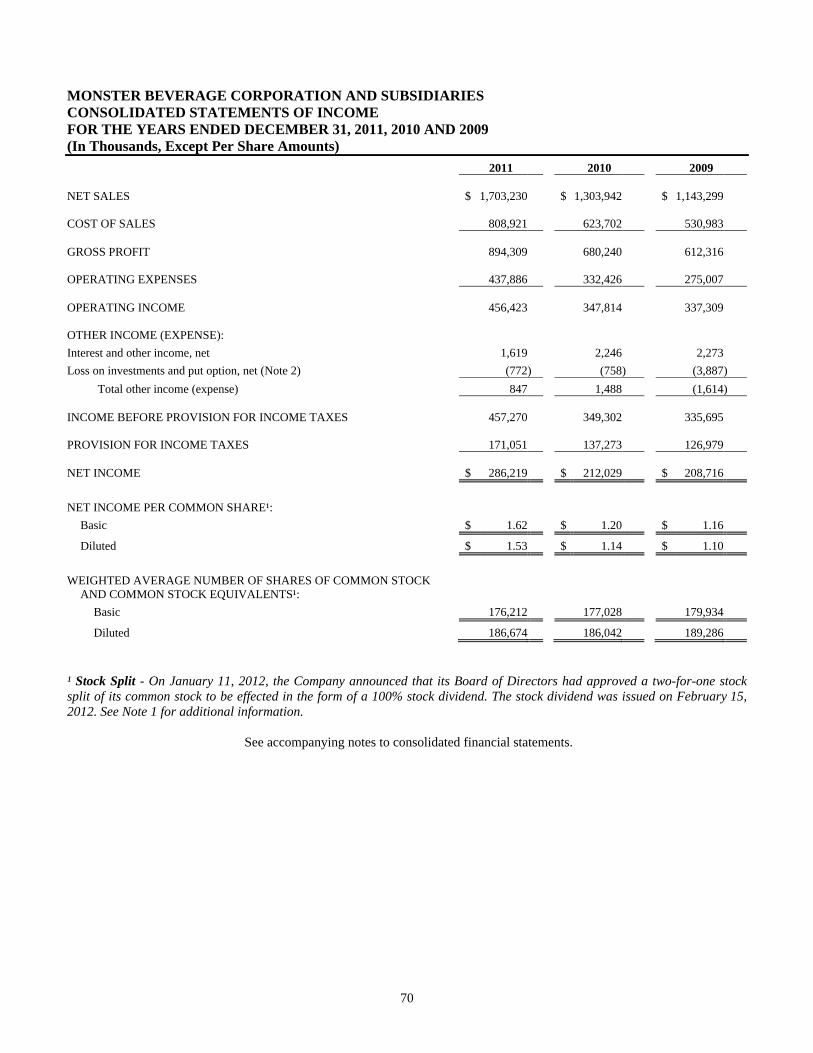
70
MONSTER BEVERAGE CORPORATION AND SUBSIDIARIES CONSOLIDATED STATEMENTS OF INCOME FOR THE YEARS ENDED DECEMBER 31, 2011, 2010 AND 2009 (In Thousands, Except Per Share Amounts)
2011 2010 2009 NET SALES $ 1,703,230 $ 1,303,942 $ 1,143,299 COST OF SALES 808,921 623,702 530,983 GROSS PROFIT 894,309 680,240 612,316 OPERATING EXPENSES 437,886 332,426 275,007 OPERATING INCOME 456,423 347,814 337,309 OTHER INCOME (EXPENSE):
Interest and other income, net 1,619 2,246 2,273
Loss on investments and put option, net (Note 2) (772) (758) (3,887)
Total other income (expense) 847 1,488 (1,614) INCOME BEFORE PROVISION FOR INCOME TAXES 457,270 349,302 335,695 PROVISION FOR INCOME TAXES 171,051 137,273 126,979 NET INCOME $ 286,219 $ 212,029 $ 208,716
NET INCOME PER COMMON SHARE¹:
Basic $ 1.62 $ 1.20 $ 1.16
Diluted $ 1.53 $ 1.14 $ 1.10
WEIGHTED AVERAGE NUMBER OF SHARES OF COMMON STOCK AND COMMON STOCK EQUIVALENTS¹:
Basic 176,212 177,028 179,934
Diluted 186,674 186,042 189,286
¹ Stock Split - On January 11, 2012, the Company announced that its Board of Directors had approved a two-for-one stock split of its common stock to be effected in the form of a 100% stock dividend. The stock dividend was issued on February 15, 2012. See Note 1 for additional information.
See accompanying notes to consolidated financial statements.
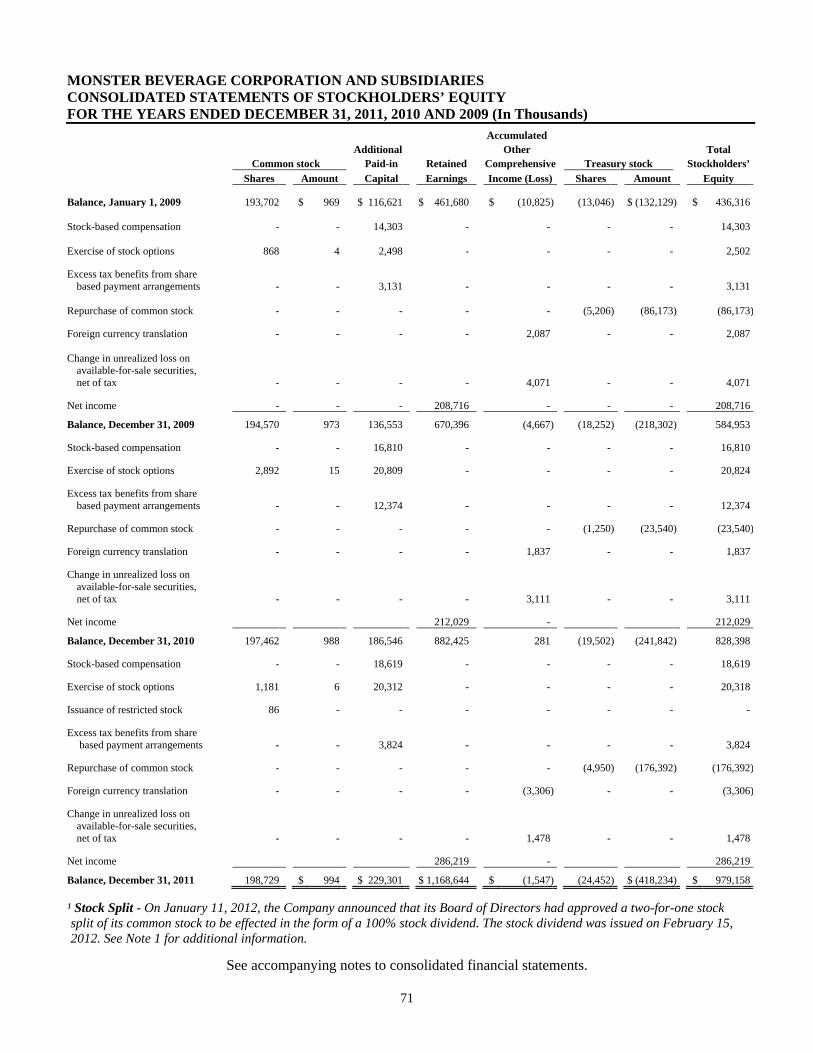
71
MONSTER BEVERAGE CORPORATION AND SUBSIDIARIES CONSOLIDATED STATEMENTS OF STOCKHOLDERS’ EQUITY FOR THE YEARS ENDED DECEMBER 31, 2011, 2010 AND 2009 (In Thousands)
Accumulated Additional Other Total Common stock Paid-in Retained Comprehensive Treasury stock Stockholders’ Shares Amount Capital Earnings Income (Loss) Shares Amount Equity Balance, January 1, 2009 193,702 $ 969 $ 116,621 $ 461,680 $ (10,825) (13,046) $ (132,129) $ 436,316 Stock-based compensation - - 14,303 - - - - 14,303 Exercise of stock options 868 4 2,498 - - - - 2,502 Excess tax benefits from share
based payment arrangements - - 3,131 - - - - 3,131 Repurchase of common stock - - - - - (5,206) (86,173) (86,173) Foreign currency translation - - - - 2,087 - - 2,087 Change in unrealized loss on
available-for-sale securities, net of tax - - - - 4,071 - - 4,071
Net income - - - 208,716 - - - 208,716
Balance, December 31, 2009 194,570 973 136,553 670,396 (4,667) (18,252) (218,302) 584,953 Stock-based compensation - - 16,810 - - - - 16,810 Exercise of stock options 2,892 15 20,809 - - - - 20,824 Excess tax benefits from share
based payment arrangements - - 12,374 - - - - 12,374 Repurchase of common stock - - - - - (1,250) (23,540) (23,540) Foreign currency translation - - - - 1,837 - - 1,837 Change in unrealized loss on
available-for-sale securities, net of tax - - - - 3,111 - - 3,111
Net income 212,029 - 212,029
Balance, December 31, 2010 197,462 988 186,546 882,425 281 (19,502) (241,842) 828,398 Stock-based compensation - - 18,619 - - - - 18,619 Exercise of stock options 1,181 6 20,312 - - - - 20,318 Issuance of restricted stock 86 - - - - - - - Excess tax benefits from share
based payment arrangements - - 3,824 - - - - 3,824 Repurchase of common stock - - - - - (4,950) (176,392) (176,392) Foreign currency translation - - - - (3,306) - - (3,306) Change in unrealized loss on
available-for-sale securities, net of tax - - - - 1,478 - - 1,478
Net income 286,219 - 286,219
Balance, December 31, 2011 198,729 $ 994 $ 229,301 $ 1,168,644 $ (1,547) (24,452) $ (418,234) $ 979,158
¹ Stock Split - On January 11, 2012, the Company announced that its Board of Directors had approved a two-for-one stock split of its common stock to be effected in the form of a 100% stock dividend. The stock dividend was issued on February 15, 2012. See Note 1 for additional information.
See accompanying notes to consolidated financial statements.
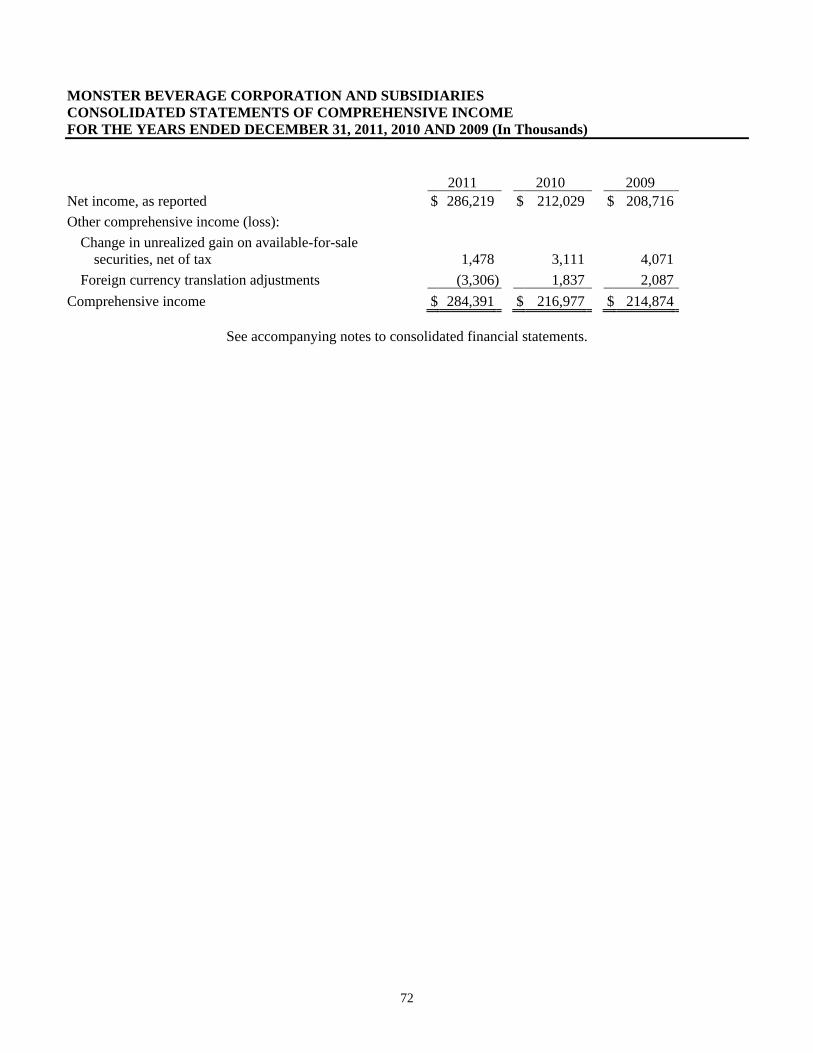
72
MONSTER BEVERAGE CORPORATION AND SUBSIDIARIES CONSOLIDATED STATEMENTS OF COMPREHENSIVE INCOME FOR THE YEARS ENDED DECEMBER 31, 2011, 2010 AND 2009 (In Thousands)
2011 2010 2009 Net income, as reported $ 286,219 $ 212,029 $ 208,716 Other comprehensive income (loss):
Change in unrealized gain on available-for-sale securities, net of tax 1,478 3,111 4,071
Foreign currency translation adjustments (3,306) 1,837 2,087
Comprehensive income $ 284,391 $ 216,977 $ 214,874
See accompanying notes to consolidated financial statements.
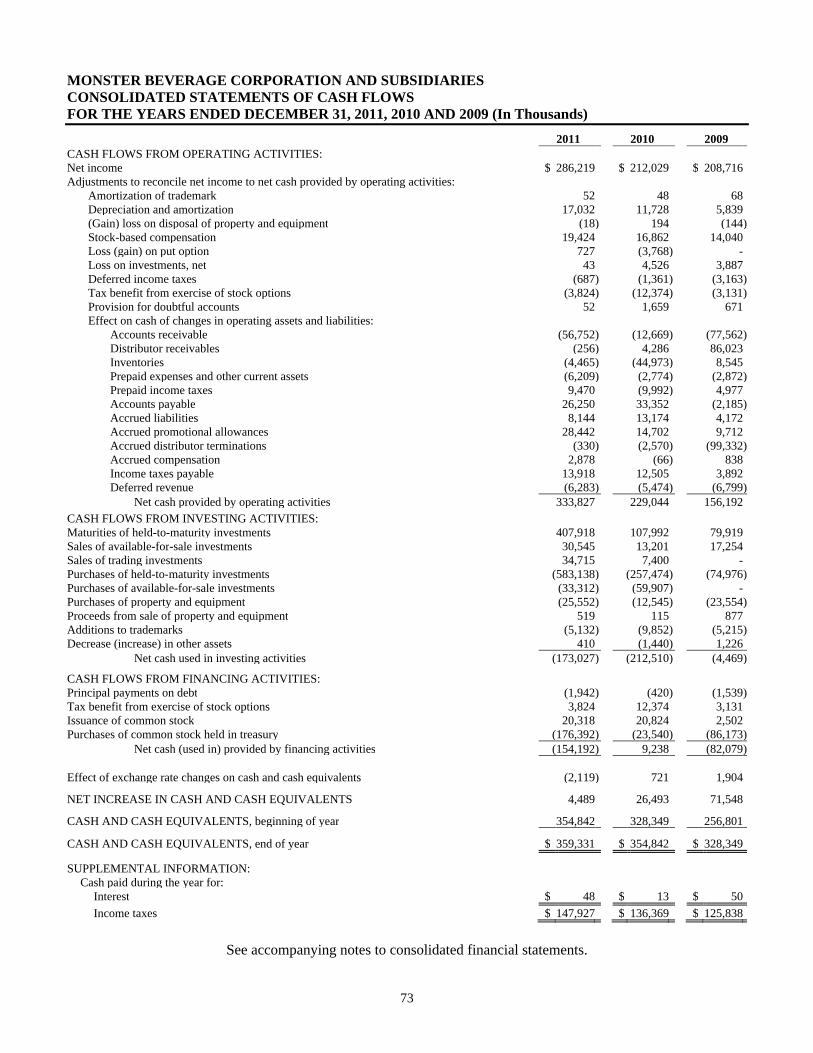
73
MONSTER BEVERAGE CORPORATION AND SUBSIDIARIES CONSOLIDATED STATEMENTS OF CASH FLOWS FOR THE YEARS ENDED DECEMBER 31, 2011, 2010 AND 2009 (In Thousands)
2011 2010 2009 CASH FLOWS FROM OPERATING ACTIVITIES: Net income $ 286,219 $ 212,029 $ 208,716 Adjustments to reconcile net income to net cash provided by operating activities:
Amortization of trademark 52 48 68 Depreciation and amortization 17,032 11,728 5,839 (Gain) loss on disposal of property and equipment (18) 194 (144) Stock-based compensation 19,424 16,862 14,040 Loss (gain) on put option 727 (3,768) - Loss on investments, net 43 4,526 3,887 Deferred income taxes (687) (1,361) (3,163) Tax benefit from exercise of stock options (3,824) (12,374) (3,131) Provision for doubtful accounts 52 1,659 671 Effect on cash of changes in operating assets and liabilities:
Accounts receivable (56,752) (12,669) (77,562) Distributor receivables (256) 4,286 86,023 Inventories (4,465) (44,973) 8,545 Prepaid expenses and other current assets (6,209) (2,774) (2,872) Prepaid income taxes 9,470 (9,992) 4,977 Accounts payable 26,250 33,352 (2,185) Accrued liabilities 8,144 13,174 4,172 Accrued promotional allowances 28,442 14,702 9,712 Accrued distributor terminations (330) (2,570) (99,332) Accrued compensation 2,878 (66) 838 Income taxes payable 13,918 12,505 3,892 Deferred revenue (6,283) (5,474) (6,799)
Net cash provided by operating activities 333,827 229,044 156,192 CASH FLOWS FROM INVESTING ACTIVITIES: Maturities of held-to-maturity investments 407,918 107,992 79,919 Sales of available-for-sale investments 30,545 13,201 17,254 Sales of trading investments 34,715 7,400 - Purchases of held-to-maturity investments (583,138) (257,474) (74,976) Purchases of available-for-sale investments (33,312) (59,907) - Purchases of property and equipment (25,552) (12,545) (23,554) Proceeds from sale of property and equipment 519 115 877 Additions to trademarks (5,132) (9,852) (5,215) Decrease (increase) in other assets 410 (1,440) 1,226
Net cash used in investing activities (173,027) (212,510) (4,469)
CASH FLOWS FROM FINANCING ACTIVITIES: Principal payments on debt (1,942) (420) (1,539) Tax benefit from exercise of stock options 3,824 12,374 3,131 Issuance of common stock 20,318 20,824 2,502 Purchases of common stock held in treasury (176,392) (23,540) (86,173)
Net cash (used in) provided by financing activities (154,192) 9,238 (82,079)
Effect of exchange rate changes on cash and cash equivalents (2,119) 721 1,904
NET INCREASE IN CASH AND CASH EQUIVALENTS 4,489 26,493 71,548
CASH AND CASH EQUIVALENTS, beginning of year 354,842 328,349 256,801
CASH AND CASH EQUIVALENTS, end of year $ 359,331 $ 354,842 $ 328,349
SUPPLEMENTAL INFORMATION: Cash paid during the year for:
Interest $ 48 $ 13 $ 50 Income taxes $ 147,927 $ 136,369 $ 125,838
See accompanying notes to consolidated financial statements.
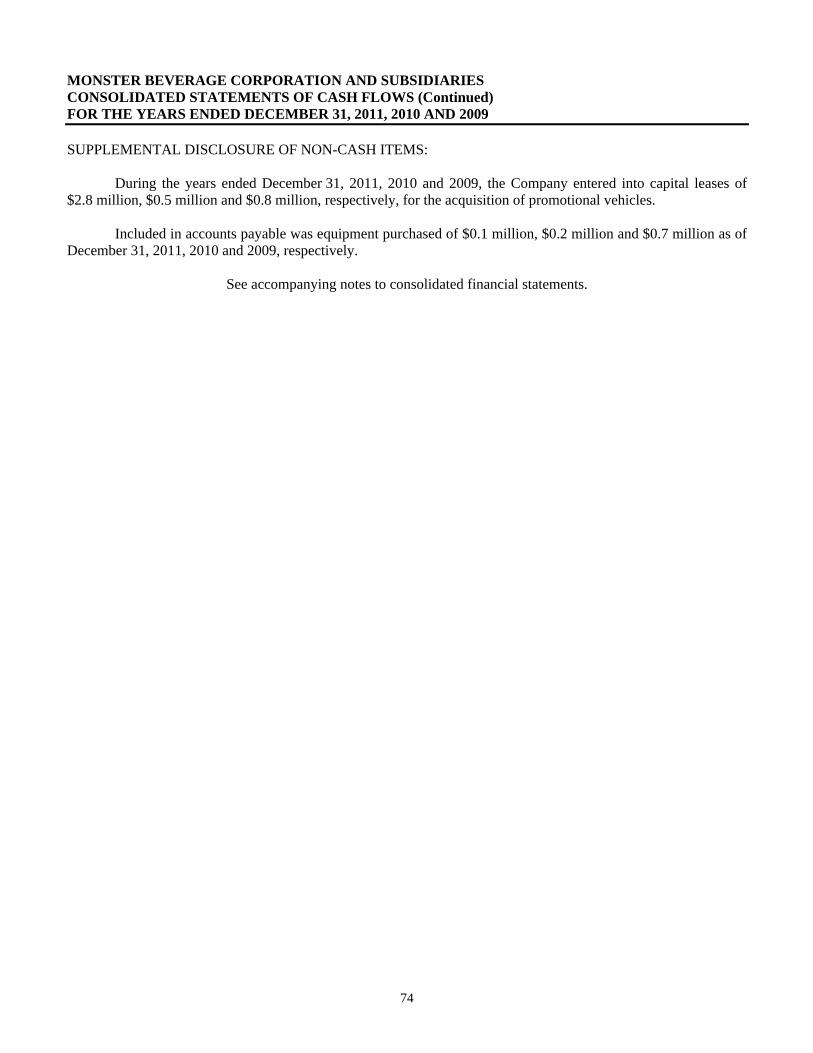
74
MONSTER BEVERAGE CORPORATION AND SUBSIDIARIES CONSOLIDATED STATEMENTS OF CASH FLOWS (Continued) FOR THE YEARS ENDED DECEMBER 31, 2011, 2010 AND 2009 SUPPLEMENTAL DISCLOSURE OF NON-CASH ITEMS:
During the years ended December 31, 2011, 2010 and 2009, the Company entered into capital leases of $2.8 million, $0.5 million and $0.8 million, respectively, for the acquisition of promotional vehicles.
Included in accounts payable was equipment purchased of $0.1 million, $0.2 million and $0.7 million as of
December 31, 2011, 2010 and 2009, respectively.
See accompanying notes to consolidated financial statements.
MONSTER BEVERAGE CORPORATION AND SUBSIDIARIES NOTES TO CONSOLIDATED FINANCIAL STATEMENTS (Tabular Dollars in Thousands, Except Per Share Amounts)
75
1. ORGANIZATION AND SUMMARY OF SIGNIFICANT ACCOUNTING POLICIES
Organization – Monster Beverage Corporation, formerly named Hansen Natural Corporation, (the “Company”, “Monster”, “MBC”, “MEC”, “Hansen”, “Hansen Beverage Company” or “HBC”) was incorporated in Delaware on April 25, 1990. The Company is a holding company and has no operating business except through its consolidated subsidiaries.
Stock Split – On January 11, 2012, the Company announced that its Board of Directors had approved a two-for-
one stock split of the Company’s common stock to be effected in the form of a 100% stock dividend. The common stock dividend was issued on February 15, 2012. Accordingly, all per share amounts, average common stock outstanding, common stocks outstanding, common stock repurchased and equity based compensation presented in the consolidated financial statements and notes have been adjusted retroactively, where applicable, to reflect the stock split. Stockholders’ equity has been retroactively adjusted, where applicable, to give effect to the stock split for all periods presented by reclassifying the par value of the additional shares issued in connection with the stock split to Common Stock from Retained Earnings and Additional Paid-in Capital.
Nature of Operations – The Company develops, markets, sells and distributes “alternative” beverage category
beverages primarily under the following brand names: Monster Energy®, Java Monster®, X-Presso Monster®, Monster Energy Extra Strength Nitrous Technology®, Monster Rehab™, Peace Tea®, Hansen’s®, Hansen’s Natural Soda®, Junior Juice®, Blue Sky®, Vidration®, Worx Energy®, and Hubert’s®. The “alternative” beverage category combines non-carbonated ready-to-drink iced teas, lemonades, juice cocktails, single-serve juices and fruit beverages, ready-to-drink dairy and coffee drinks, energy drinks, sports drinks, and single-serve still water (flavored, unflavored and enhanced) with “new age” beverages, including sodas that are considered natural, sparkling juices and flavored sparkling beverages.
Basis of Presentation – The accompanying consolidated financial statements have been prepared in accordance
with accounting principles generally accepted in the United States of America (“GAAP”) and include the accounts of the Company and its consolidated subsidiaries.
Reclassifications – The Company has reclassified $0.4 million of accrued distributor terminations and $0.3
million of current portion of debt to accrued liabilities in the consolidated balance sheet as of December 31, 2010 in order to conform to the current year presentation.
Subsequent Events – Management has reviewed and evaluated subsequent events and transactions occurring after
the balance sheet date through the filing of this annual report on Form 10-K on February 29, 2012. Principles of Consolidation – The Company consolidates all entities that it controls by ownership of a majority
voting interest. All intercompany balances and transactions have been eliminated in consolidation. Cash and Cash Equivalents – The Company considers all highly liquid investments with an original maturity of
three months or less from date of purchase to be cash equivalents. Throughout the year, the Company has had amounts on deposit at financial institutions that exceed the federally insured limits. The Company has not experienced any loss as a result of these deposits and does not expect to incur any losses in the future.
Investments – The Company’s investments in debt securities are classified as either held-to-maturity, available-
for-sale or trading, in accordance with Financial Accounting Standards Board (the “FASB”) Accounting Standards Codification (“ASC”) ASC 320. Held-to-maturity securities are those securities that the Company has the positive intent and ability to hold until maturity. Trading securities are those securities that the Company intends to sell in the near term. All other securities not included in the held-to-maturity or trading category are classified as available-for-sale. Held-to-maturity securities are recorded at amortized cost which approximates fair market value. Trading securities are carried at fair value with unrealized gains and losses charged to earnings. Available-for-sale securities are carried at fair value with unrealized gains and losses recorded within accumulated other comprehensive income (loss) as a separate component of
MONSTER BEVERAGE CORPORATION AND SUBSIDIARIES NOTES TO CONSOLIDATED FINANCIAL STATEMENTS (Tabular Dollars in Thousands, Except Per Share Amounts)
76
stockholders’ equity. ASC 820 defines fair value as the price that would be received to sell an asset or paid to transfer a liability in an orderly transaction between market participants at the measurement date. ASC 820 also establishes a fair value hierarchy which requires an entity to maximize the use of observable inputs, where available (see Note 3). Under ASC 320-10-35, a security is considered to be other-than-temporarily impaired if the present value of cash flows expected to be collected are less than the security’s amortized cost basis (the difference being defined as the “Credit Loss”) or if the fair value of the security is less than the security’s amortized cost basis and the investor intends, or will be required, to sell the security before recovery of the security’s amortized cost basis. If an other-than-temporary impairment exists, the charge to earnings is limited to the amount of Credit Loss if the investor does not intend to sell the security, and will not be required to sell the security, before recovery of the security’s amortized cost basis. Any remaining difference between fair value and amortized cost is recognized in other comprehensive income (loss), net of applicable taxes. The Company evaluates whether the decline in fair value of its investments is other-than-temporary at each quarter-end. This evaluation consists of a review by management, and includes market pricing information and maturity dates for the securities held, market and economic trends in the industry and information on the issuer’s financial condition and, if applicable, information on the guarantors’ financial condition. Factors considered in determining whether a loss is temporary include the length of time and extent to which the investment’s fair value has been less than its cost basis, the financial condition and near-term prospects of the issuer and guarantors, including any specific events which may influence the operations of the issuer and our intent and ability to retain the investment for a reasonable period of time sufficient to allow for any anticipated recovery of fair value.
Accounts Receivable – The Company evaluates the collectability of its trade accounts receivable based on a
number of factors. In circumstances where the Company becomes aware of a specific customer’s inability to meet its financial obligations to the Company, a specific reserve for bad debts is estimated and recorded, which reduces the recognized receivable to the estimated amount the Company believes will ultimately be collected. In addition to specific customer identification of potential bad debts, bad debt charges are recorded based on the Company’s recent loss history and an overall assessment of past due trade accounts receivable outstanding. In accordance with ASC 210-20-45, in its consolidated balance sheets, the Company has presented accounts receivable, net of promotional allowances, only for those customers that it allows net settlement. All other accounts receivable and related promotional allowances are shown on a gross basis.
Adjustment – Subsequent to the issuance of the Company’s December 31, 2010 consolidated financial statements,
management concluded that its presentation of accounts receivable, net of certain promotional allowances in the 2010 consolidated balance sheet, should be adjusted to present such receivables and accrued expenses on a gross basis with regard to those customers for which the Company does not allow net settlement, to conform with the ASC 210-20-45; and to continue to present that portion of the allowances owed to those customers that the Company allows net settlement, to be presented on a net basis. As a result of such adjustment, accounts receivable increased by $64.8 million, accounts payable increased by $4.6 million, accrued liabilities decreased by $1.4 million and accrued promotional allowances increased by $61.6 million in the comparative 2010 consolidated balance sheet. As a result of such adjustment, there was no change in total net cash provided by operating activities in the consolidated statement of cash flows for the years ended December 31, 2010 and 2009. However, the following line items within net cash flows from operating activities were adjusted as follows for the years ended December 31, 2010 and 2009, respectively; (i) accounts receivable by ($14.7) million and ($18.1) million; (ii) accounts payable by ($3.7) million and $13.6 million; (iii) accrued liabilities by $3.7 million and ($5.2) million; and (iv) accrued promotional allowances by $14.7 million and $9.7 million.
Inventories – Inventories are valued at the lower of first-in, first-out, cost or market value (net realizable value).
Property and Equipment – Property and equipment are stated at cost. Depreciation of furniture and fixtures, office and computer equipment, computer software, equipment, and vehicles is based on their estimated useful lives (three to ten years) and is calculated using the straight-line method. Amortization of leasehold improvements is based on the lesser of their estimated useful lives or the terms of the related leases and is calculated using the straight-line method. Normal repairs and maintenance costs are expensed as incurred. Expenditures that materially increase values or extend useful lives are capitalized. The related costs and accumulated depreciation of disposed assets are eliminated and any resulting gain or loss on disposition is included in net income.
MONSTER BEVERAGE CORPORATION AND SUBSIDIARIES NOTES TO CONSOLIDATED FINANCIAL STATEMENTS (Tabular Dollars in Thousands, Except Per Share Amounts)
77
Capitalized Software Costs – In accordance with ASC 350-40, the Company capitalizes certain costs incurred in connection with developing or obtaining internal use software. Costs incurred in the preliminary project stage are expensed. All direct external costs incurred to develop internal use software during the development stage are capitalized and amortized using the straight-line method over the remaining useful lives. Costs such as maintenance and training are expensed as incurred.
Intangibles – Intangibles are primarily comprised of trademarks representing the Company’s exclusive ownership of the Monster Energy® trademark in connection with the manufacture, sale and distribution of supplements and beverages and the Hansen’s® trademark in connection with the manufacture, sale and distribution of beverages. The Company also owns a number of other trademarks in the United States as well as in a number of countries around the world. In addition, the Company owns the Blue Sky® trademark, which was acquired in September 2000, and the Junior Juice® trademark, which was acquired in May 2001. In accordance with ASC 350, intangible assets with indefinite lives are not amortized but instead are measured for impairment at least annually, or when events indicate that an impairment exists. The Company calculates impairment as the excess of the carrying value of its indefinite-lived assets over their estimated fair value. If the carrying value exceeds the estimate of fair value a write-down is recorded. The Company amortizes its trademarks with finite useful lives over their respective useful lives, which range from 1 to 25 years. For the fiscal years ended December 31, 2011, 2010 and 2009, there were no impairments recorded.
Long-Lived Assets – Management regularly reviews property and equipment and other long-lived assets, including certain definite-lived intangible assets, for possible impairment. This review occurs annually, or more frequently if events or changes in circumstances indicate the carrying amount of the asset may not be recoverable. If there is indication of impairment, management then prepares an estimate of future cash flows (undiscounted and without interest charges) expected to result from the use of the asset and its eventual disposition. If these cash flows are less than the carrying amount of the asset, an impairment loss is recognized to write down the asset to its estimated fair value. The fair value is estimated using the present value of the future cash flows discounted at a rate commensurate with management’s estimates of the business risks. Preparation of estimated expected future cash flows is inherently subjective and is based on management’s best estimate of assumptions concerning expected future conditions. For the fiscal years ended December 31, 2011, 2010 and 2009, there were no impairment indicators identified.
Foreign Currency Translation and Transactions – The accounts of the Company’s foreign subsidiaries are
translated in accordance with ASC 830. Foreign currency transaction gains and losses are recognized in interest and other income, net, at the time they occur. Net foreign currency exchange gains or losses resulting from the translation of assets and liabilities of foreign subsidiaries whose functional currency is not the U.S. dollar are recorded as a part of accumulated other comprehensive income (loss) in stockholders’ equity. Unrealized foreign currency exchange gains and losses on certain intercompany transactions that are of a long-term investment nature (i.e., settlement is not planned or anticipated in the foreseeable future) are also recorded in accumulated other comprehensive income (loss) in stockholders’ equity.
Revenue Recognition – The Company recognizes revenue when persuasive evidence of an arrangement exists, delivery has occurred, the sales price is fixed or determinable and collectability is reasonably assured. Generally, ownership of and title to the Company’s products passes to customers upon delivery of the products to customers. Certain of the Company’s distributors may also perform a separate function as a co-packer on the Company’s behalf. In such cases, ownership of and title to the Company’s products that are co-packed on the Company’s behalf by those co-packers who are also distributors, passes to such distributors when the Company is notified by them that they have taken transfer or possession of the relevant portion of the Company’s finished goods. Net sales have been determined after deduction of promotional and other allowances in accordance with ASC 605-50. Amounts received pursuant to new and/or amended distribution agreements entered into with certain distributors, relating to the costs associated with terminating the Company’s prior distributors, are accounted for as revenue ratably over the anticipated life of the respective distribution agreement, generally 20 years.
Management believes that adequate provision has been made for cash discounts, returns and spoilage based on the
Company’s historical experience.
MONSTER BEVERAGE CORPORATION AND SUBSIDIARIES NOTES TO CONSOLIDATED FINANCIAL STATEMENTS (Tabular Dollars in Thousands, Except Per Share Amounts)
78
Cost of Sales – Cost of sales consists of the costs of raw materials utilized in the manufacture of products, co-
packing fees, repacking fees, in-bound freight charges, as well as certain internal transfer costs, warehouse expenses incurred prior to the manufacture of the Company’s finished products and certain quality control costs. Raw materials account for the largest portion of the cost of sales. Raw materials include cans, bottles, other containers, ingredients and packaging materials.
Operating Expenses – Operating expenses include selling expenses such as distribution expenses to transport
products to customers and warehousing expenses after manufacture, as well as expenses for advertising, sampling and in-store demonstration costs, costs for merchandise displays, point-of-sale materials and premium items, sponsorship expenses, other marketing expenses and design expenses. Operating expenses also include such costs as payroll costs, travel costs, professional service fees including legal fees, termination payments made to certain of the Company’s prior distributors, depreciation and other general and administrative costs.
Freight-Out Costs – For the years ended December 31, 2011, 2010 and 2009, freight-out costs amounted to $60.5
million, $47.4 million and $39.8 million, respectively, and have been recorded in operating expenses in the accompanying consolidated statements of income.
Advertising and Promotional Expenses – The Company accounts for advertising production costs by expensing
such production costs the first time the related advertising takes place. A significant amount of the Company’s promotional expenses result from payments under endorsement and sponsorship contracts. Accounting for endorsement and sponsorship payments is based upon specific contract provisions. Generally, endorsement and sponsorship payments are expensed on a straight-line basis over the term of the contract after giving recognition to periodic performance compliance provisions of the contracts. Advertising and promotional expenses, including but not limited to production costs, amounted to $148.8 million, $104.9 million and $86.7 million for the years ended December 31, 2011, 2010 and 2009, respectively. Advertising and promotional expenses are included in operating expenses in the accompanying consolidated statements of income.
Income Taxes – The Company utilizes the liability method of accounting for income taxes as set forth in ASC 740. Under the liability method, deferred taxes are determined based on the temporary differences between the financial statement and tax basis of assets and liabilities using tax rates expected to be in effect during the years in which the basis differences reverse. A valuation allowance is recorded when it is more likely than not that some of the deferred tax assets will not be realized. In determining the need for valuation allowances the Company considers projected future taxable income and the availability of tax planning strategies. If in the future the Company determines that it would not be able to realize its recorded deferred tax assets, an increase in the valuation allowance would be recorded, decreasing earnings in the period in which such determination is made.
The Company assesses its income tax positions and records tax benefits for all years subject to examination based
upon the Company’s evaluation of the facts, circumstances and information available at the reporting date. For those tax positions where there is a greater than 50% likelihood that a tax benefit will be sustained, the Company has recorded the largest amount of tax benefit that may potentially be realized upon ultimate settlement with a taxing authority that has full knowledge of all relevant information. For those income tax positions where there is less than 50% likelihood that a tax benefit will be sustained, no tax benefit has been recognized in the financial statements.
Stock-Based Compensation – The Company accounts for stock-based compensation under the provisions of ASC
718. The Company records compensation expense for employee stock options based on the estimated fair value of the options on the date of grant using the Black-Scholes-Merton option pricing formula. The Company records compensation expense for non-employee stock options based on the estimated fair value of the options as of the earlier of (1) the date at which a commitment for performance by the non-employee to earn the stock option is reached or (2) the date at which the non-employee’s performance is complete, using the Black-Scholes-Merton option pricing formula. Stock-based compensation cost for restricted stock awards and restricted stock units is measured based on the closing fair market value
MONSTER BEVERAGE CORPORATION AND SUBSIDIARIES NOTES TO CONSOLIDATED FINANCIAL STATEMENTS (Tabular Dollars in Thousands, Except Per Share Amounts)
79
of the Company’s common stock at the date of grant. In the event that the Company has the option and intent to settle a restricted stock unit in cash, the award is classified as a liability and revalued at each balance sheet date. See Note 12.
Net Income Per Common Share – In accordance with ASC 260, net income per common share, on a basic and diluted basis, is presented for all periods. Basic net income per share is computed by dividing net income by the weighted average number of common shares outstanding during each period. Diluted net income per share is computed by dividing net income by the weighted average number of common and dilutive common equivalent shares outstanding. The calculation of common equivalent shares assumes the exercise of dilutive stock options, net of assumed treasury share repurchases at average market prices, as applicable.
Concentration of Risk – Certain of the Company’s products utilize components (raw materials and/or co-packing services) from a limited number of sources. A disruption in the supply of such components could significantly affect the Company’s revenues from those products, as alternative sources of such components may not be available at commercially reasonable rates or within a reasonably short time period. The Company continues to take steps on an ongoing basis to secure the availability of alternative sources for such components and minimize the risk of any disruption in production.
On October 2, 2010, The Coca-Cola Company (“TCCC”) completed its acquisition of the North American business operations of Coca-Cola Enterprises, Inc. (“CCE”), through a merger with a wholly owned subsidiary of TCCC. The surviving wholly owned subsidiary was subsequently renamed Coca-Cola Refreshments USA, Inc. (“CCR”), and currently distributes certain of the Company’s products in those portions of the United States in which CCE previously distributed certain of the Company’s products. Concurrently with this acquisition, a new entity, which retained the name Coca-Cola Enterprises, Inc. (“New CCE”) was formed, which currently distributes certain of our products in Great Britain, France, Belgium, the Netherlands, Luxembourg, Monaco and Sweden (added during the first quarter of 2011).
CCR, a customer of the Direct Store Delivery segment (“DSD”) with sales within specific markets in the United States and Canada, accounted for approximately 29% of the Company’s net sales for the year ended December 31, 2011. CCE (including the Coca-Cola Bottling Company up to September 30, 2010) (CCE replaced by New CCE from October 1, 2010), a customer of the DSD segment with sales within specific markets in the United States, Canada, the United Kingdom and certain countries in Europe, accounted for approximately 28% and 27% of the Company’s net sales for the years ended December 31, 2010 and 2009, respectively.
Credit Risk – The Company sells its products nationally and internationally, primarily to full service beverage
distributors, retail grocery and specialty chains, wholesalers, club stores, drug chains, mass merchandisers, convenience chains, health food distributors and food service customers. The Company performs ongoing credit evaluations of its customers and generally does not require collateral. The Company maintains reserves for estimated credit losses, and historically, such losses have been within management’s expectations.
Fair Value of Financial Instruments – The carrying value of the Company’s financial instruments, including cash and cash equivalents, accounts receivable, accounts payable and accrued liabilities, approximate fair value due to the relatively short maturity of the respective instruments.
Use of Estimates – The preparation of the consolidated financial statements in conformity with GAAP requires management to make estimates and assumptions that affect the reported amounts of assets and liabilities and disclosure of contingent assets and liabilities at the date of the financial statements and the reported amounts of revenues and expenses during the reporting period. Actual results could differ from those estimates.
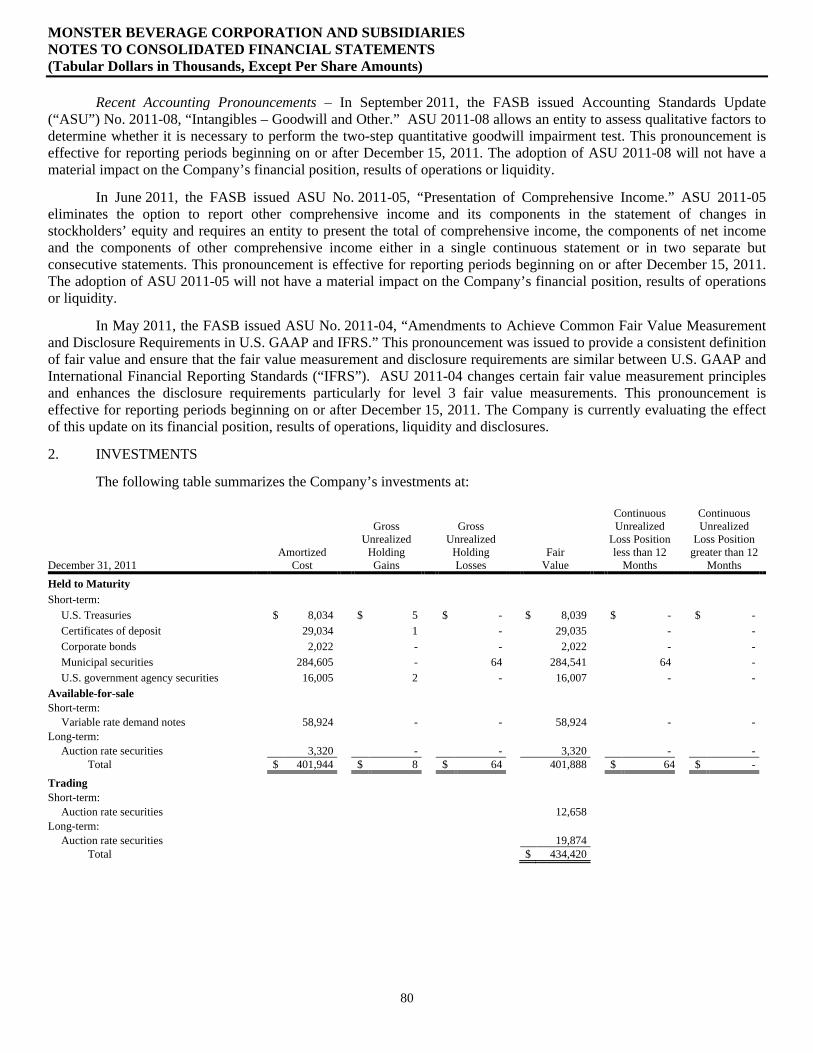
MONSTER BEVERAGE CORPORATION AND SUBSIDIARIES NOTES TO CONSOLIDATED FINANCIAL STATEMENTS (Tabular Dollars in Thousands, Except Per Share Amounts)
80
Recent Accounting Pronouncements – In September 2011, the FASB issued Accounting Standards Update (“ASU”) No. 2011-08, “Intangibles – Goodwill and Other.” ASU 2011-08 allows an entity to assess qualitative factors to determine whether it is necessary to perform the two-step quantitative goodwill impairment test. This pronouncement is effective for reporting periods beginning on or after December 15, 2011. The adoption of ASU 2011-08 will not have a material impact on the Company’s financial position, results of operations or liquidity.
In June 2011, the FASB issued ASU No. 2011-05, “Presentation of Comprehensive Income.” ASU 2011-05 eliminates the option to report other comprehensive income and its components in the statement of changes in stockholders’ equity and requires an entity to present the total of comprehensive income, the components of net income and the components of other comprehensive income either in a single continuous statement or in two separate but consecutive statements. This pronouncement is effective for reporting periods beginning on or after December 15, 2011. The adoption of ASU 2011-05 will not have a material impact on the Company’s financial position, results of operations or liquidity.
In May 2011, the FASB issued ASU No. 2011-04, “Amendments to Achieve Common Fair Value Measurement and Disclosure Requirements in U.S. GAAP and IFRS.” This pronouncement was issued to provide a consistent definition of fair value and ensure that the fair value measurement and disclosure requirements are similar between U.S. GAAP and International Financial Reporting Standards (“IFRS”). ASU 2011-04 changes certain fair value measurement principles and enhances the disclosure requirements particularly for level 3 fair value measurements. This pronouncement is effective for reporting periods beginning on or after December 15, 2011. The Company is currently evaluating the effect of this update on its financial position, results of operations, liquidity and disclosures.
2. INVESTMENTS
The following table summarizes the Company’s investments at:
December 31, 2011 Amortized
Cost
Gross Unrealized
Holding Gains
Gross Unrealized
Holding Losses
Fair Value
Continuous Unrealized
Loss Position less than 12
Months
Continuous Unrealized
Loss Position greater than 12
Months
Held to Maturity Short-term:
U.S. Treasuries $ 8,034 $ 5 $ - $ 8,039 $ - $ - Certificates of deposit 29,034 1 - 29,035 - - Corporate bonds 2,022 - - 2,022 - - Municipal securities 284,605 - 64 284,541 64 - U.S. government agency securities 16,005 2 - 16,007 - -
Available-for-sale Short-term:
Variable rate demand notes 58,924 - - 58,924 - - Long-term:
Auction rate securities 3,320 - - 3,320 - - Total $ 401,944 $ 8 $ 64 401,888 $ 64 $ -
Trading Short-term:
Auction rate securities 12,658 Long-term:
Auction rate securities 19,874 Total $ 434,420
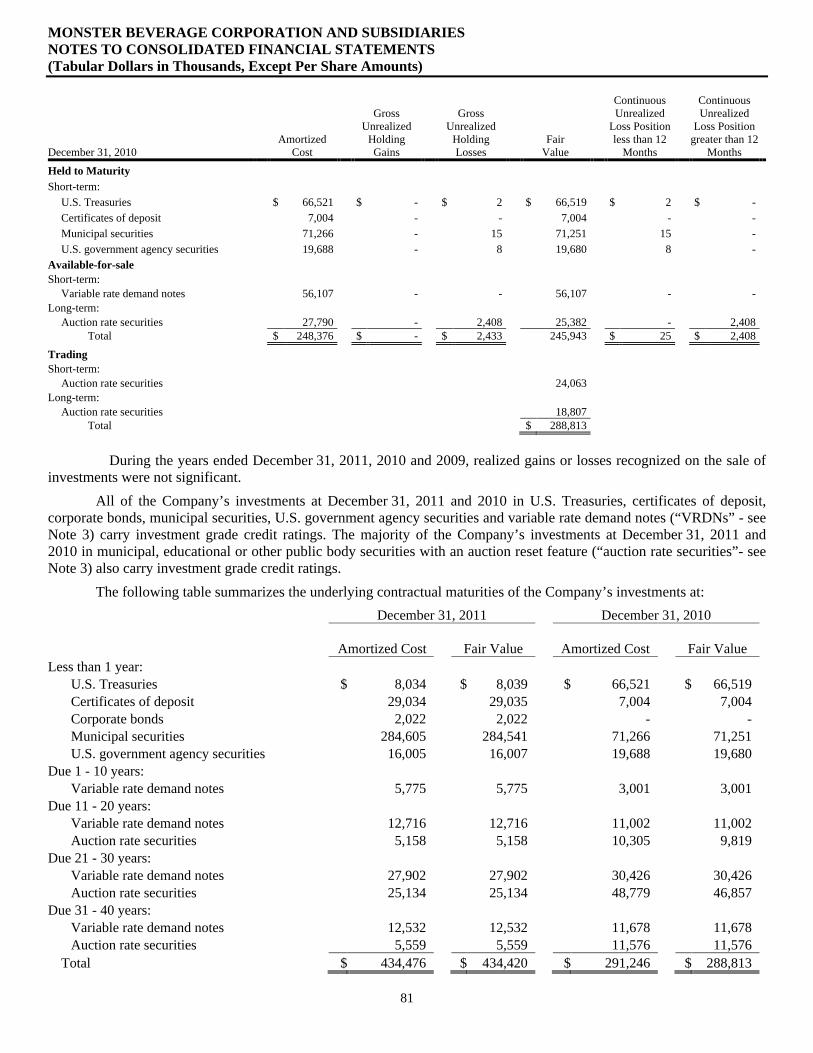
MONSTER BEVERAGE CORPORATION AND SUBSIDIARIES NOTES TO CONSOLIDATED FINANCIAL STATEMENTS (Tabular Dollars in Thousands, Except Per Share Amounts)
81
December 31, 2010 Amortized
Cost
Gross Unrealized
Holding Gains
Gross Unrealized
Holding Losses
Fair Value
Continuous Unrealized
Loss Position less than 12
Months
Continuous Unrealized
Loss Position greater than 12
Months
Held to Maturity Short-term:
U.S. Treasuries $ 66,521 $ - $ 2 $ 66,519 $ 2 $ - Certificates of deposit 7,004 - - 7,004 - - Municipal securities 71,266 - 15 71,251 15 - U.S. government agency securities 19,688 - 8 19,680 8 -
Available-for-sale Short-term:
Variable rate demand notes 56,107 - - 56,107 - - Long-term:
Auction rate securities 27,790 - 2,408 25,382 - 2,408 Total $ 248,376 $ - $ 2,433 245,943 $ 25 $ 2,408
Trading Short-term:
Auction rate securities 24,063 Long-term:
Auction rate securities 18,807 Total $ 288,813
During the years ended December 31, 2011, 2010 and 2009, realized gains or losses recognized on the sale of
investments were not significant.
All of the Company’s investments at December 31, 2011 and 2010 in U.S. Treasuries, certificates of deposit, corporate bonds, municipal securities, U.S. government agency securities and variable rate demand notes (“VRDNs” - see Note 3) carry investment grade credit ratings. The majority of the Company’s investments at December 31, 2011 and 2010 in municipal, educational or other public body securities with an auction reset feature (“auction rate securities”- see Note 3) also carry investment grade credit ratings.
The following table summarizes the underlying contractual maturities of the Company’s investments at:
December 31, 2011 December 31, 2010 Amortized Cost Fair Value Amortized Cost Fair Value
Less than 1 year: U.S. Treasuries $ 8,034 $ 8,039 $ 66,521 $ 66,519 Certificates of deposit 29,034 29,035 7,004 7,004 Corporate bonds 2,022 2,022 - - Municipal securities 284,605 284,541 71,266 71,251 U.S. government agency securities 16,005 16,007 19,688 19,680
Due 1 - 10 years: Variable rate demand notes 5,775 5,775 3,001 3,001
Due 11 - 20 years: Variable rate demand notes 12,716 12,716 11,002 11,002 Auction rate securities 5,158 5,158 10,305 9,819
Due 21 - 30 years: Variable rate demand notes 27,902 27,902 30,426 30,426 Auction rate securities 25,134 25,134 48,779 46,857
Due 31 - 40 years: Variable rate demand notes 12,532 12,532 11,678 11,678 Auction rate securities 5,559 5,559 11,576 11,576
Total $ 434,476 $ 434,420 $ 291,246 $ 288,813
MONSTER BEVERAGE CORPORATION AND SUBSIDIARIES NOTES TO CONSOLIDATED FINANCIAL STATEMENTS (Tabular Dollars in Thousands, Except Per Share Amounts)
82
3. FAIR VALUE OF CERTAIN FINANCIAL ASSETS AND LIABILITIES
ASC 820 provides a framework for measuring fair value and requires expanded disclosures regarding fair value measurements. ASC 820 defines fair value as the price that would be received to sell an asset or paid to transfer a liability in an orderly transaction between market participants at the measurement date. ASC 820 also establishes a fair value hierarchy which requires an entity to maximize the use of observable inputs, where available. The three levels of inputs required by the standard that the Company uses to measure fair value are summarized below.
· Level 1: Quoted prices in active markets for identical assets or liabilities. · Level 2: Observable inputs other than Level 1 prices, such as quoted prices for similar assets or liabilities; quoted
prices in markets that are not active; or other inputs that are observable or can be corroborated by observable market data for substantially the full term of the related assets or liabilities.
· Level 3: Unobservable inputs that are supported by little or no market activity and that are significant to the fair
value of the assets or liabilities.
ASC 820 requires the use of observable market inputs (quoted market prices) when measuring fair value and requires a Level 1 quoted price to be used to measure fair value whenever possible.
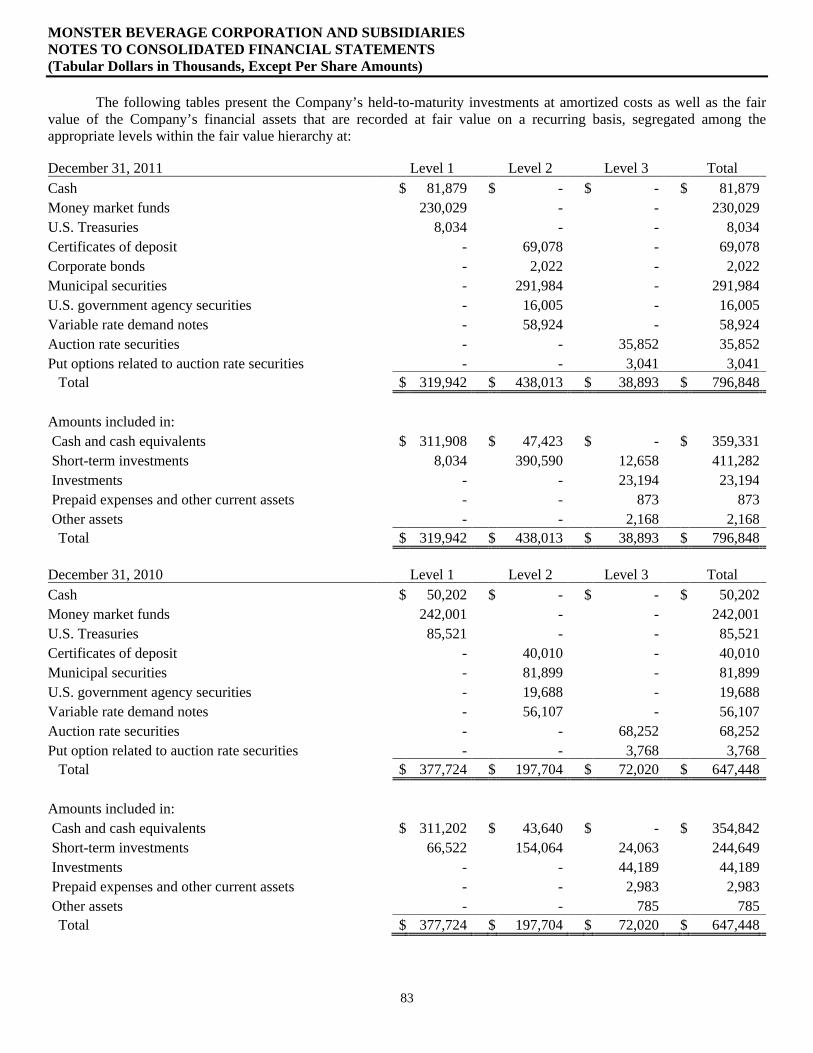
MONSTER BEVERAGE CORPORATION AND SUBSIDIARIES NOTES TO CONSOLIDATED FINANCIAL STATEMENTS (Tabular Dollars in Thousands, Except Per Share Amounts)
83
The following tables present the Company’s held-to-maturity investments at amortized costs as well as the fair value of the Company’s financial assets that are recorded at fair value on a recurring basis, segregated among the appropriate levels within the fair value hierarchy at: December 31, 2011 Level 1 Level 2 Level 3 Total Cash $ 81,879 $ - $ - $ 81,879 Money market funds 230,029 - - 230,029 U.S. Treasuries 8,034 - - 8,034 Certificates of deposit - 69,078 - 69,078 Corporate bonds - 2,022 - 2,022 Municipal securities - 291,984 - 291,984 U.S. government agency securities - 16,005 - 16,005 Variable rate demand notes - 58,924 - 58,924 Auction rate securities - - 35,852 35,852 Put options related to auction rate securities - - 3,041 3,041
Total $ 319,942 $ 438,013 $ 38,893 $ 796,848 Amounts included in: Cash and cash equivalents $ 311,908 $ 47,423 $ - $ 359,331 Short-term investments 8,034 390,590 12,658 411,282 Investments - - 23,194 23,194 Prepaid expenses and other current assets - - 873 873 Other assets - - 2,168 2,168 Total $ 319,942 $ 438,013 $ 38,893 $ 796,848
December 31, 2010 Level 1 Level 2 Level 3 Total Cash $ 50,202 $ - $ - $ 50,202 Money market funds 242,001 - - 242,001 U.S. Treasuries 85,521 - - 85,521 Certificates of deposit - 40,010 - 40,010 Municipal securities - 81,899 - 81,899 U.S. government agency securities - 19,688 - 19,688 Variable rate demand notes - 56,107 - 56,107 Auction rate securities - - 68,252 68,252 Put option related to auction rate securities - - 3,768 3,768
Total $ 377,724 $ 197,704 $ 72,020 $ 647,448 Amounts included in: Cash and cash equivalents $ 311,202 $ 43,640 $ - $ 354,842 Short-term investments 66,522 154,064 24,063 244,649 Investments - - 44,189 44,189 Prepaid expenses and other current assets - - 2,983 2,983 Other assets - - 785 785 Total $ 377,724 $ 197,704 $ 72,020 $ 647,448
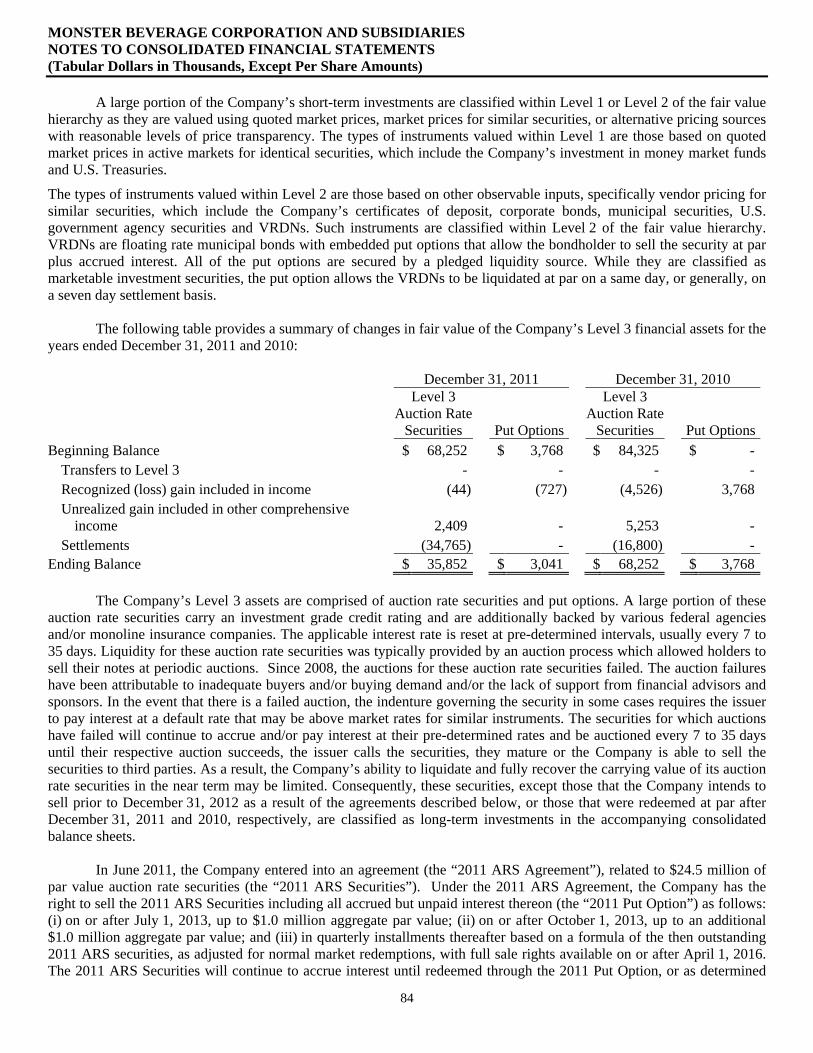
MONSTER BEVERAGE CORPORATION AND SUBSIDIARIES NOTES TO CONSOLIDATED FINANCIAL STATEMENTS (Tabular Dollars in Thousands, Except Per Share Amounts)
84
A large portion of the Company’s short-term investments are classified within Level 1 or Level 2 of the fair value hierarchy as they are valued using quoted market prices, market prices for similar securities, or alternative pricing sources with reasonable levels of price transparency. The types of instruments valued within Level 1 are those based on quoted market prices in active markets for identical securities, which include the Company’s investment in money market funds and U.S. Treasuries.
The types of instruments valued within Level 2 are those based on other observable inputs, specifically vendor pricing for similar securities, which include the Company’s certificates of deposit, corporate bonds, municipal securities, U.S. government agency securities and VRDNs. Such instruments are classified within Level 2 of the fair value hierarchy. VRDNs are floating rate municipal bonds with embedded put options that allow the bondholder to sell the security at par plus accrued interest. All of the put options are secured by a pledged liquidity source. While they are classified as marketable investment securities, the put option allows the VRDNs to be liquidated at par on a same day, or generally, on a seven day settlement basis.
The following table provides a summary of changes in fair value of the Company’s Level 3 financial assets for the
years ended December 31, 2011 and 2010:
December 31, 2011 December 31, 2010
Level 3 Auction Rate
Securities Put Options
Level 3 Auction Rate
Securities Put Options Beginning Balance $ 68,252 $ 3,768 $ 84,325 $ -
Transfers to Level 3 - - - - Recognized (loss) gain included in income (44) (727) (4,526) 3,768 Unrealized gain included in other comprehensive
income 2,409 - 5,253 - Settlements (34,765) - (16,800) -
Ending Balance $ 35,852 $ 3,041 $ 68,252 $ 3,768
The Company’s Level 3 assets are comprised of auction rate securities and put options. A large portion of these auction rate securities carry an investment grade credit rating and are additionally backed by various federal agencies and/or monoline insurance companies. The applicable interest rate is reset at pre-determined intervals, usually every 7 to 35 days. Liquidity for these auction rate securities was typically provided by an auction process which allowed holders to sell their notes at periodic auctions. Since 2008, the auctions for these auction rate securities failed. The auction failures have been attributable to inadequate buyers and/or buying demand and/or the lack of support from financial advisors and sponsors. In the event that there is a failed auction, the indenture governing the security in some cases requires the issuer to pay interest at a default rate that may be above market rates for similar instruments. The securities for which auctions have failed will continue to accrue and/or pay interest at their pre-determined rates and be auctioned every 7 to 35 days until their respective auction succeeds, the issuer calls the securities, they mature or the Company is able to sell the securities to third parties. As a result, the Company’s ability to liquidate and fully recover the carrying value of its auction rate securities in the near term may be limited. Consequently, these securities, except those that the Company intends to sell prior to December 31, 2012 as a result of the agreements described below, or those that were redeemed at par after December 31, 2011 and 2010, respectively, are classified as long-term investments in the accompanying consolidated balance sheets.
In June 2011, the Company entered into an agreement (the “2011 ARS Agreement”), related to $24.5 million of
par value auction rate securities (the “2011 ARS Securities”). Under the 2011 ARS Agreement, the Company has the right to sell the 2011 ARS Securities including all accrued but unpaid interest thereon (the “2011 Put Option”) as follows: (i) on or after July 1, 2013, up to $1.0 million aggregate par value; (ii) on or after October 1, 2013, up to an additional $1.0 million aggregate par value; and (iii) in quarterly installments thereafter based on a formula of the then outstanding 2011 ARS securities, as adjusted for normal market redemptions, with full sale rights available on or after April 1, 2016. The 2011 ARS Securities will continue to accrue interest until redeemed through the 2011 Put Option, or as determined
MONSTER BEVERAGE CORPORATION AND SUBSIDIARIES NOTES TO CONSOLIDATED FINANCIAL STATEMENTS (Tabular Dollars in Thousands, Except Per Share Amounts)
85
by the auction process or the terms outlined in the prospectus of the respective 2011 ARS Securities when the auction process fails. Under the 2011 ARS Agreement, the Company has the obligation, should it receive written notification from the put issuer, to sell the 2011 ARS Securities at par plus all accrued but unpaid interest. During the year ended December 31, 2011, $3.7 million of par value 2011 ARS Securities were redeemed at par through normal market channels.
In March 2010, the Company entered into an agreement (the “2010 ARS Agreement”), related to $54.2 million of
par value auction rate securities (the “2010 ARS Securities”). Under the 2010 ARS Agreement, the Company has the right, but not the obligation, to sell the 2010 ARS Securities including all accrued but unpaid interest thereon (the “2010 Put Option”) as follows: (i) on or after March 22, 2011, up to $13.6 million aggregate par value; and (ii) equal semi-annual or annual installments thereafter with full sale rights available on or after March 22, 2013. The 2010 ARS Securities will continue to accrue interest until redeemed through the 2010 Put Option, or as determined by the auction process or the terms outlined in the prospectus of the respective 2010 ARS Securities when the auction process fails. During the year ended December 31, 2011, $27.1 million of par value 2010 ARS Securities were redeemed at par through the exercise of the 2010 Put Option and $4.0 million of par value 2010 ARS Securities were redeemed at par through normal market channels ($7.4 million of par value 2010 ARS Securities were redeemed at par through normal market channels during the year ended December 31, 2010).
The 2011 ARS Agreement and the 2010 ARS Agreement (collectively the “ARS Agreements”) represent firm
commitments in accordance with ASC 815, which defines a firm commitment with an unrelated party, binding on both parties and usually legally enforceable, with the following characteristics: (i) the commitment specifies all significant terms, including the quantity to be exchanged, the fixed price, and the timing of the transaction; and (ii) the commitment includes a disincentive for nonperformance that is sufficiently large to make performance probable. The enforceability of the ARS Agreements results in the 2010 Put Option and the 2011 Put Option (collectively the “Put Options”), which are recognized as separate freestanding assets and are accounted for separately from the Company’s auction rate securities. The Put Options do not meet the definition of derivative instruments under ASC 815. Therefore, the Company elected the fair value option under ASC 825-10 in accounting for the Put Options. As of December 31, 2011, the Company recorded $3.0 million as the fair market value of the Put Options ($0.9 million current portion included in prepaid expenses and other current assets and $2.1 million long-term portion included in other assets) in the consolidated balance sheet, with a corresponding (loss) of ($0.7) million recorded in other income (expense) in the consolidated statement of income for the year ended December 31, 2011, respectively (a $3.8 million gain was previously recognized through earnings during the year ended December 31, 2010). The valuation of the Put Options utilized a mark-to-model approach which included estimates for interest rates, timing and amount of cash flows, adjusted for any bearer risk associated with the put issuer’s ability to repurchase the 2010 ARS Securities and the 2011 ARS Securities in installments, as indicated above, beginning March 22, 2011 and July 1, 2013, respectively, as well as the expected holding periods for the Put Options. These assumptions are typically volatile and subject to change as the underlying data sources and market conditions evolve. The Put Options will continue to be adjusted on each balance sheet date based on their then fair values, with any changes in fair values recorded in earnings.
At December 31, 2011, the Company held auction rate securities with a face value of $44.8 million (amortized cost basis of $35.9 million). A Level 3 valuation was performed on the Company’s auction rate securities as of December 31, 2011 resulting in a fair value of $3.3 million for the Company’s available-for-sale auction rate securities (after a $5.0 million impairment) and $32.5 million for the Company’s trading auction rate securities (after a $4.0 million impairment), which are included in short-term and long-term investments. This valuation utilized a mark-to-model approach which included estimates for interest rates, timing and amount of cash flows, credit and liquidity premiums, as well as expected holding periods for the auction rate securities. These assumptions are typically volatile and subject to change as the underlying data sources and market conditions evolve.
ASC 320-10-35 indicates that an other-than-temporary impairment must be recognized through earnings if an
investor has the intent to sell the debt security or if it is more likely than not that the investor will be required to sell the debt security before recovery of its amortized cost basis. However, even if an investor does not expect to sell a debt security, it must compare the present value of cash flows expected to be collected from the security with the amortized
MONSTER BEVERAGE CORPORATION AND SUBSIDIARIES NOTES TO CONSOLIDATED FINANCIAL STATEMENTS (Tabular Dollars in Thousands, Except Per Share Amounts)
86
cost basis of the security. If the present value of cash flows expected to be collected is less than the amortized cost basis of the security, the entire amortized cost basis of the security will not be recovered (that is, a “Credit Loss” exists), and an other-than-temporary impairment shall be considered to have occurred. In the event of a Credit Loss and absent the intent or requirement to sell a debt security before recovery of its amortized cost, only the amount associated with the Credit Loss is recognized as a loss in the income statement. The amount of loss relating to other factors is recorded in accumulated other comprehensive income (loss). ASC 320-10-35 also requires additional disclosures regarding the calculation of the Credit Loss and the factors considered in reaching a conclusion that an investment is not other-than-temporarily impaired.
In connection with the 2011 ARS Agreement, during the second fiscal quarter of 2011, the Company reclassified
$24.5 million of auction rate securities from available-for-sale to trading in accordance with ASC 320, as the Company has the ability and intent to exercise the related 2011 Put Option beginning July 1, 2013. In connection with the 2010 ARS Agreement, during the first fiscal quarter of 2010, the Company reclassified $54.2 million of auction rate securities from available-for-sale to trading in accordance with ASC 320, as the Company had the ability and intent to exercise the related 2010 Put Option beginning March 22, 2011.
The Company recognized a net loss through earnings on its trading securities as follows for the years ended
December 31:
2011 2010 2009 (Loss) on transfer from available-for-sale to trading $ (2,438) $ (4,876) $ - Gain on trading securities sold 2,604 375 - (Loss) gain on trading securities held (210) 572 - Loss on trading securites $ (44) $ (3,929) $ -
The Company determined that the $5.0 million impairment of its available-for-sale auction rate securities at December 31, 2011 was deemed other-than-temporary. The other-than-temporary impairment was deemed Credit Loss related. The Company recorded no additional other-than-temporary impairment during the year ended December 31, 2011 ($0.6 million, $3.9 million and $0.5 million were previously deemed other-than-temporary Credit Loss related and were charged through earnings for the years ended December 31, 2010, 2009 and 2008, respectively). The factors evaluated to differentiate between temporary impairment and other-than-temporary impairment included the projected future cash flows, credit ratings actions, and assessment of the credit quality of the underlying collateral, as well as the other factors included in the valuation model for debt securities described above.
The net effect of (i) the acquisition of the 2011 Put Option during the second fiscal quarter of 2011; (ii) the revaluation of the Put Options as of December 31, 2011; (iii) the transfer from available-for-sale to trading of the 2011 ARS Securities during the second fiscal quarter of 2011; (iv) the revaluation of the Company’s trading auction rate securities as of December 31, 2011; (v) the redemption at par of certain 2011 ARS Securities and 2010 ARS Securities, including those redeemed at par through the exercise of the 2010 Put Option; and (vi) a recognized gain resulting from the redemption at par of a previously other-than-temporary impaired security during the first fiscal quarter of 2011, resulted in a (loss) of ($0.8) million included in other income (expense) for the year ended December 31, 2011. The net effect of (i) the acquisition of the 2010 Put Option during the first fiscal quarter of 2010; (ii) the revaluation of the 2010 Put Option as of December 31, 2010; (iii) the transfer from available-for-sale to trading of the 2010 ARS Securities during the first fiscal quarter of 2010; (iv) the revaluation of the Company’s trading auction rate securities as of December 31, 2010; (v) the redemption at par of certain 2010 ARS Securities; (vi) a recognized gain resulting from the redemption at par of a previously other-than-temporary impaired security during the first fiscal quarter of 2010; and (vii) an increase in the other-than-temporary impairment of certain auction rate securities, resulted in a (loss) of ($0.8) million included in other income (expense) for the year ended December 31, 2010. The net effect of an other-than-temporary impairment of certain auction rate securities, resulted a (loss) of ($3.9) million, included in other income (expense) for the year ended December 31, 2009.
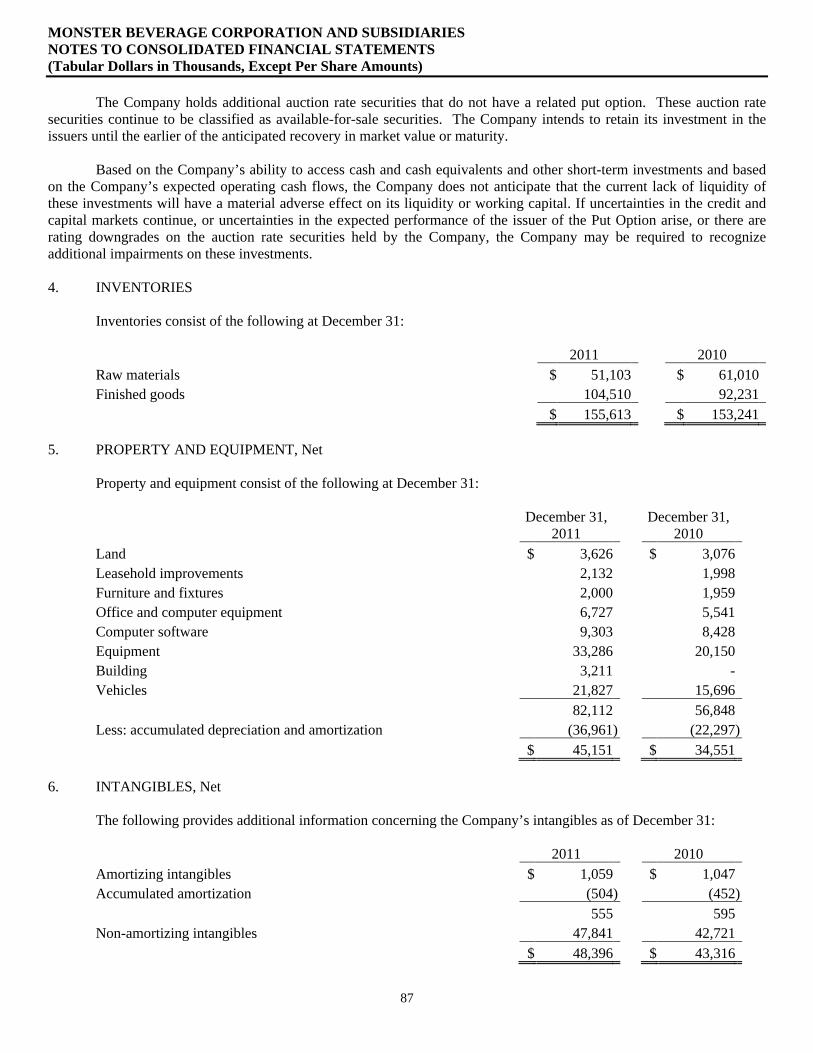
MONSTER BEVERAGE CORPORATION AND SUBSIDIARIES NOTES TO CONSOLIDATED FINANCIAL STATEMENTS (Tabular Dollars in Thousands, Except Per Share Amounts)
87
The Company holds additional auction rate securities that do not have a related put option. These auction rate securities continue to be classified as available-for-sale securities. The Company intends to retain its investment in the issuers until the earlier of the anticipated recovery in market value or maturity.
Based on the Company’s ability to access cash and cash equivalents and other short-term investments and based
on the Company’s expected operating cash flows, the Company does not anticipate that the current lack of liquidity of these investments will have a material adverse effect on its liquidity or working capital. If uncertainties in the credit and capital markets continue, or uncertainties in the expected performance of the issuer of the Put Option arise, or there are rating downgrades on the auction rate securities held by the Company, the Company may be required to recognize additional impairments on these investments.
4. INVENTORIES
Inventories consist of the following at December 31: 2011 2010 Raw materials $ 51,103 $ 61,010 Finished goods 104,510 92,231 $ 155,613 $ 153,241
5. PROPERTY AND EQUIPMENT, Net
Property and equipment consist of the following at December 31:
December 31,
2011 December 31,
2010 Land $ 3,626 $ 3,076 Leasehold improvements 2,132 1,998 Furniture and fixtures 2,000 1,959 Office and computer equipment 6,727 5,541 Computer software 9,303 8,428 Equipment 33,286 20,150 Building 3,211 - Vehicles 21,827 15,696 82,112 56,848 Less: accumulated depreciation and amortization (36,961) (22,297) $ 45,151 $ 34,551
6. INTANGIBLES, Net
The following provides additional information concerning the Company’s intangibles as of December 31: 2011 2010 Amortizing intangibles $ 1,059 $ 1,047 Accumulated amortization (504) (452) 555 595 Non-amortizing intangibles 47,841 42,721 $ 48,396 $ 43,316
MONSTER BEVERAGE CORPORATION AND SUBSIDIARIES NOTES TO CONSOLIDATED FINANCIAL STATEMENTS (Tabular Dollars in Thousands, Except Per Share Amounts)
88
All amortizing intangibles have been assigned an estimated finite useful life and such intangibles are amortized on a straight-line basis over the number of years that approximate their respective useful lives ranging from one to 25 years (weighted-average life of 20 years). Total amortization expense recorded was $0.05 million, $0.05 million and $0.07 million for the years ended December 31, 2011, 2010 and 2009, respectively. As of December 31, 2011, future estimated amortization expense related to amortizing intangibles through the year ending December 31, 2016 is approximately $0.05 million per year. 7. DISTRIBUTION AGREEMENTS
Amounts received pursuant to new and/or amended distribution agreements entered into with certain distributors, relating to the costs associated with terminating the Company prior distributors, have been accounted for as deferred revenue in the accompanying consolidated balance sheets and are recognized as revenue ratably over the anticipated life of the respective distribution agreement, generally 20 years. Revenue recognized was $9.3 million, $8.0 million and $7.5 million for the years ended December 31, 2011, 2010 and 2009, respectively. 8. DEBT
The Company entered into a credit facility with Comerica Bank (“Comerica”) consisting of a revolving line of credit, which was amended in May 2010, under which the Company may borrow up to $10.0 million of non-collateralized debt. The revolving line of credit is effective through June 1, 2012. Interest on borrowings under the line of credit is based on Comerica’s base (prime) rate minus up to 1.5%, or varying London Interbank Offered Rates up to 180 days, plus an additional percentage of up to 1.75%, depending upon certain financial ratios maintained by the Company. The Company had no outstanding borrowings on this line of credit at December 31, 2011. Letters of credit issued on the Company’s behalf, totaling $0.3 million under this credit facility, were outstanding as of December 31, 2011 and 2010, respectively.
At December 31, 2011, the Company was in compliance with the terms of its line of credit, which contains certain
financial covenants, including certain financial ratios. If any event of default shall occur for any reason, whether voluntary or involuntary, Comerica may declare all or any portion outstanding on the line of credit immediately due and payable, exercise rights and remedies available to them, including instituting legal proceedings.
The Company’s debt of $1.1 million and $0.3 million at December 31, 2011 and 2010, respectively, consisted of
capital leases, collateralized by vehicles, payable over 12 months in monthly installments at various effective interest rates, with final payments ending on or before December 31, 2012.
At December 31, 2011 and 2010, the assets acquired under capital leases had a net book value of $3.6 million and
$2.1 million, net of accumulated depreciation of $2.1 million and $2.3 million, respectively.
Interest expense for capital lease obligations amounted to $0.05 million, $0.01 million and $0.05 million for the years ended December 31, 2011, 2010 and 2009, respectively. 9. COMMITMENTS AND CONTINGENCIES
The Company is obligated under various non-cancellable lease agreements providing for office space, warehouse space, and automobiles that expire at various dates through the year 2020.
Rent expense under operating leases was $4.1 million, $3.8 million and $3.8 million for the years ended
December 31, 2011, 2010 and 2009, respectively.
MONSTER BEVERAGE CORPORATION AND SUBSIDIARIES NOTES TO CONSOLIDATED FINANCIAL STATEMENTS (Tabular Dollars in Thousands, Except Per Share Amounts)
89
Future minimum rental payments at December 31, 2011 under the operating leases referred to above are as
follows: Year ending December 31: 2012 $ 3,996 2013 3,385 2014 3,227 2015 3,241 2016 2,783 2017 and thereafter 1,411 $ 18,043 Contractual obligations – The Company has the following contractual obligations related primarily to
sponsorships and other commitments as of December 31, 2011: Year ending December 31: 2012 $ 48,716 2013 24,737 2014 14,513 2015 7,116 2016 - 2017 and thereafter - $ 95,082 Purchase Commitments – The Company has purchase commitments aggregating approximately $44.2 million at
December 31, 2011, which represent commitments made by the Company and its subsidiaries to various suppliers of raw materials for the production of its products. These obligations vary in terms, but are generally satisfied within one year.
The Company purchases various raw material items, including, but not limited to, flavors, ingredients, supplements, containers, milk and cream, from a limited number of resources. An interruption in supply from any of such resources could result in the Company’s inability to produce certain products for limited or possibly extended periods of time. The aggregate value of purchases from suppliers of such limited resources described above for the years ended December 31, 2011, 2010 and 2009 was $279.5 million, $186.4 million and $168.6 million, respectively.
The Company has a purchase commitment of approximately $8.2 million, which is related to an agreement to acquire an office building, including the real property thereunder and improvements thereon, located in Corona, CA.
Guarantees – The Company from time to time enters into certain types of contracts that contingently require the
Company to indemnify parties against third party claims. These contracts primarily relate to: (i) certain agreements with the Company’s officers, directors and employees under which the Company may be required to indemnify such persons for liabilities arising out of their employment relationship, (ii) certain distribution or purchase agreements under which the Company may have to indemnify the Company’s customers from any claim, liability or loss arising out of any actual or alleged injury or damages suffered in connection with the consumption or purchase of the Company’s products or the use of Company trademarks, and (iii) certain real estate leases, under which the Company may be required to indemnify property owners for liabilities and other claims arising from the Company’s use of the applicable premises. The terms of such obligations vary and typically, a maximum obligation is not explicitly stated. Generally, the Company believes that its insurance coverage is adequate to cover any resulting liabilities or claims.
MONSTER BEVERAGE CORPORATION AND SUBSIDIARIES NOTES TO CONSOLIDATED FINANCIAL STATEMENTS (Tabular Dollars in Thousands, Except Per Share Amounts)
90
Litigation – In September 2006, Christopher Chavez purporting to act on behalf of himself and a certain class of consumers filed an action in the Superior Court of the State of California, County of San Francisco, against the Company and its subsidiaries for unfair business practices, false advertising, violation of California Consumers Legal Remedies Act (“CLRA”), fraud, deceit and/or misrepresentation alleging that the Company misleadingly labels its Blue Sky® beverages as manufactured and canned/bottled wholly in Santa Fe, New Mexico. Defendants removed this Superior Court action to the United States District Court for the Northern District of California (the “District Court”) under the Class Action Fairness Act and filed motions for dismissal or transfer. On June 11, 2007, the District Court granted the Company’s motion to dismiss Chavez’s complaint with prejudice. On June 23, 2009, the United States Court of Appeals for the Ninth Circuit (“Ninth Circuit”) filed a memorandum opinion reversing the decision of the District Court and remanded the case to the District Court for further proceedings. The Company filed a motion to dismiss the CLRA claims; the plaintiff filed a motion for a decision on a preemption issue; and the plaintiff filed a motion for class certification. On June 18, 2010, the District Court entered an order certifying the class, ruled that there was no preemption by federal law, and denied the Company’s motion to dismiss. The class that the District Court certified initially consists of all persons who purchased any beverage bearing the Blue Sky mark or brand in the United States at any time between May 16, 2002 and June 30, 2006. On September 9, 2010, the District Court approved the form of the class notice and its distribution plan; and set an opt-out date of December 10, 2010. On January 27, 2012, the parties entered into a settlement agreement on terms acceptable to the Company. On February 23, 2012, the District Court granted preliminary approval of the class action settlement agreement. A final approval hearing is scheduled for May 11, 2012. If approved, the Company does not believe that the settlement will have a material adverse effect on the Company’s financial position or results of operations.
In May 2009, Avraham Wellman, purporting to act on behalf of himself and a class of consumers in Canada, filed
a putative class action in the Ontario Superior Court of Justice, in the City of Toronto, Ontario, Canada, against the Company and its former Canadian distributor, Pepsi-Cola Canada Ltd., as defendants. The plaintiff alleges that the defendants misleadingly packaged and labeled Monster Energy® products in Canada by not including sufficiently specific statements with respect to contra-indications and/or adverse reactions associated with the consumption of the energy drink products. The plaintiff’s claims against the defendants are for negligence, unjust enrichment, and making misleading/false representations in violation of the Competition Act (Canada), the Food and Drugs Act (Canada) and the Consumer Protection Act, 2002 (Ontario). The plaintiff claims general damages on behalf of the putative class in the amount of CDN$20 million, together with punitive damages of CDN$5 million, plus legal costs and interest. The plaintiff’s certification motion materials have not yet been filed. The Company believes that any such damages, if awarded, would not have a material adverse effect on the Company’s financial position or results of operations. In accordance with class action practices in Ontario, the Company will not file an answer to the complaint until after the determination of the certification motion. The Company believes that the plaintiff’s complaint is without merit and plans a vigorous defense.
Securities Litigation — On September 11, 2008, a federal securities class action complaint styled Cunha v. Hansen Natural Corp., et al. was filed in the United States District Court for the Central District of California (the “District Court”). On September 17, 2008, a second federal securities class action complaint styled Brown v. Hansen Natural Corp., et al. was also filed in the District Court.
On July 14, 2009, the District Court entered an order consolidating the actions and appointing lead counsel and the Structural Ironworkers Local Union #1 Pension Fund as lead plaintiff. On August 28, 2009, lead plaintiff filed a Consolidated Complaint for Violations of Federal Securities Laws (the “Consolidated Class Action Complaint”). The Consolidated Class Action Complaint purported to be brought on behalf of a class of purchasers of the Company’s stock during the period November 9, 2006 through November 8, 2007 (the “Class Period”). It named as defendants the Company, Rodney C. Sacks, Hilton H. Schlosberg, and Thomas J. Kelly. Plaintiff principally alleged that, during the Class Period, the defendants made false and misleading statements relating to the Company’s distribution coordination agreements with Anheuser-Busch, Inc. (“AB”) and its sales of “Allied” energy drink lines, and engaged in sales of shares in the Company on the basis of material non-public information. Plaintiff also alleged that the Company’s financial statements for the second quarter of 2007 did not include certain promotional expenses. The Consolidated Class Action Complaint alleged violations of Sections 10(b) and 20(a) of the Securities Exchange Act of 1934, as amended (the “Exchange Act”) and Rule 10b-5 promulgated thereunder, and sought an unspecified amount of damages.
MONSTER BEVERAGE CORPORATION AND SUBSIDIARIES NOTES TO CONSOLIDATED FINANCIAL STATEMENTS (Tabular Dollars in Thousands, Except Per Share Amounts)
91
On November 16, 2009, the defendants filed their motion to dismiss the Consolidated Class Action Complaint
pursuant to Federal Rules of Civil Procedure 12(b)(6) and 9(b), as well as the Private Securities Litigation Reform Act. On July 12, 2010, following a hearing, the District Court granted the defendants’ motion to dismiss the Consolidated Class Action Complaint, with leave to amend, on the grounds, among others, that it failed to specify which statements plaintiff claimed were false or misleading, failed adequately to allege that certain statements were actionable or false or misleading, and failed adequately to demonstrate that defendants acted with scienter.
On August 27, 2010, plaintiff filed a Consolidated Amended Class Action Complaint for Violations of Federal Securities Laws (the “Amended Class Action Complaint”). While similar in many respects to the Consolidated Class Action Complaint, the Amended Class Action Complaint drops certain of the allegations set forth in the Consolidated Class Action Complaint and makes certain new allegations, including that the Company engaged in “channel stuffing” during the Class Period that rendered false or misleading the Company’s reported sales results and certain other statements made by the defendants. In addition, it no longer names Thomas J. Kelly as a defendant. The Amended Class Action Complaint continues to allege violations of Sections 10(b) and 20(a) of the Exchange Act and Rule 10b-5 promulgated thereunder, and seeks an unspecified amount of damages.
Defendants filed a motion to dismiss the Amended Class Action Complaint on November 8, 2010. At a hearing
on defendants’ motion to dismiss the Amended Class Action Complaint held on May 12, 2011, the District Court issued a tentative ruling that would grant the motion to dismiss as to certain of plaintiff’s claims, but would deny the motion to dismiss with regard to the majority of plaintiff’s claims. The District Court has not, however, issued a final ruling. The District Court held an additional hearing on the motion to dismiss on May 25, 2011, and has received supplemental submissions from the parties. Defendants’ motion to dismiss remains sub judice.
The Amended Class Action Complaint seeks an unspecified amount of damages. As a result, the amount or range
of reasonably possible litigation losses to which the Company is exposed cannot be estimated. Although the ultimate outcome of this action cannot be determined with certainty, the Company believes that the allegations in the Amended Class Action Complaint are without merit. The Company intends to vigorously defend against this lawsuit.
Derivative Litigation — On October 15, 2008, a derivative complaint was filed in the United States District Court for the Central District of California (the “District Court”), styled Merckel v. Sacks, et al. On November 17, 2008, a second derivative complaint styled Dislevy v. Sacks, et al. was also filed in the District Court. The derivative suits were each brought, purportedly on behalf of the Company, by a shareholder of the Company who made no prior demand on the Company’s Board of Directors.
On June 29, 2009, the District Court entered an order consolidating the Merckel and Dislevy actions. On July 13, 2009, the District Court entered an order re-styling the consolidated actions as In re Hansen Derivative Shareholder Litigation, appointing Raymond Merckel as lead plaintiff and appointing lead counsel, and establishing a schedule for the filing of a consolidated amended complaint and for defendants’ response to such complaint.
On October 13, 2009, a purported Consolidated Shareholder Derivative Complaint (the “Consolidated Derivative Complaint”) was filed. The Consolidated Derivative Complaint named as defendants certain current and former officers, directors, and employees of the Company, including Rodney C. Sacks, Hilton H. Schlosberg, Harold C. Taber, Jr., Benjamin M. Polk, Norman C. Epstein, Mark S. Vidergauz, Sydney Selati, Thomas J. Kelly, Mark J. Hall, and Kirk S. Blower, as well as Hilrod Holdings, L.P. The Company was named as a nominal defendant. The factual allegations of the Consolidated Derivative Complaint were similar to those set forth in the Consolidated Class Action Complaint described above. Plaintiff alleged that, from November 2006 to the present, the defendants caused the Company to issue false and misleading statements concerning its business prospects and failed to properly disclose problems related to its non-Monster Energy® brand energy drinks, the prospects for the Anheuser-Busch distribution relationship, and alleged “inventory loading” that affected the Company’s results for the second quarter of 2007. Plaintiff further alleged that while the Company’s shares were purportedly artificially inflated because of those improper statements, certain of the defendants sold Company stock while in possession of material non-public information. The Consolidated Derivative
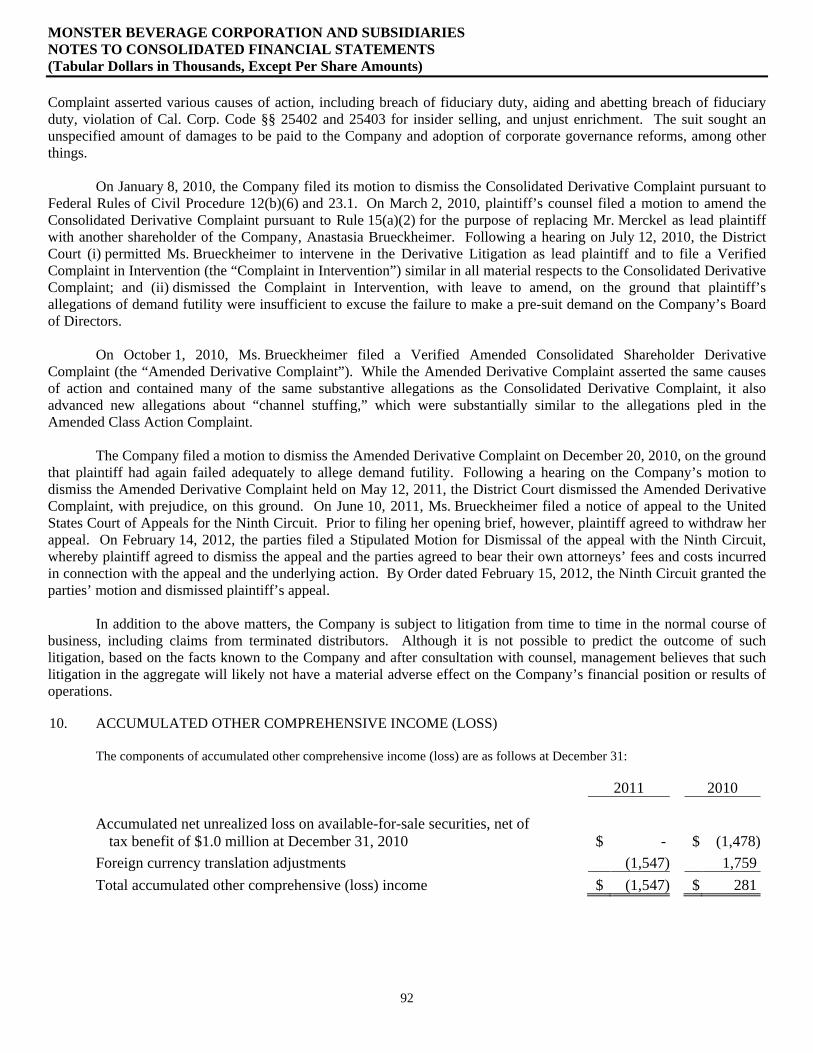
MONSTER BEVERAGE CORPORATION AND SUBSIDIARIES NOTES TO CONSOLIDATED FINANCIAL STATEMENTS (Tabular Dollars in Thousands, Except Per Share Amounts)
92
Complaint asserted various causes of action, including breach of fiduciary duty, aiding and abetting breach of fiduciary duty, violation of Cal. Corp. Code §§ 25402 and 25403 for insider selling, and unjust enrichment. The suit sought an unspecified amount of damages to be paid to the Company and adoption of corporate governance reforms, among other things.
On January 8, 2010, the Company filed its motion to dismiss the Consolidated Derivative Complaint pursuant to Federal Rules of Civil Procedure 12(b)(6) and 23.1. On March 2, 2010, plaintiff’s counsel filed a motion to amend the Consolidated Derivative Complaint pursuant to Rule 15(a)(2) for the purpose of replacing Mr. Merckel as lead plaintiff with another shareholder of the Company, Anastasia Brueckheimer. Following a hearing on July 12, 2010, the District Court (i) permitted Ms. Brueckheimer to intervene in the Derivative Litigation as lead plaintiff and to file a Verified Complaint in Intervention (the “Complaint in Intervention”) similar in all material respects to the Consolidated Derivative Complaint; and (ii) dismissed the Complaint in Intervention, with leave to amend, on the ground that plaintiff’s allegations of demand futility were insufficient to excuse the failure to make a pre-suit demand on the Company’s Board of Directors.
On October 1, 2010, Ms. Brueckheimer filed a Verified Amended Consolidated Shareholder Derivative Complaint (the “Amended Derivative Complaint”). While the Amended Derivative Complaint asserted the same causes of action and contained many of the same substantive allegations as the Consolidated Derivative Complaint, it also advanced new allegations about “channel stuffing,” which were substantially similar to the allegations pled in the Amended Class Action Complaint.
The Company filed a motion to dismiss the Amended Derivative Complaint on December 20, 2010, on the ground
that plaintiff had again failed adequately to allege demand futility. Following a hearing on the Company’s motion to dismiss the Amended Derivative Complaint held on May 12, 2011, the District Court dismissed the Amended Derivative Complaint, with prejudice, on this ground. On June 10, 2011, Ms. Brueckheimer filed a notice of appeal to the United States Court of Appeals for the Ninth Circuit. Prior to filing her opening brief, however, plaintiff agreed to withdraw her appeal. On February 14, 2012, the parties filed a Stipulated Motion for Dismissal of the appeal with the Ninth Circuit, whereby plaintiff agreed to dismiss the appeal and the parties agreed to bear their own attorneys’ fees and costs incurred in connection with the appeal and the underlying action. By Order dated February 15, 2012, the Ninth Circuit granted the parties’ motion and dismissed plaintiff’s appeal.
In addition to the above matters, the Company is subject to litigation from time to time in the normal course of
business, including claims from terminated distributors. Although it is not possible to predict the outcome of such litigation, based on the facts known to the Company and after consultation with counsel, management believes that such litigation in the aggregate will likely not have a material adverse effect on the Company’s financial position or results of operations.
10. ACCUMULATED OTHER COMPREHENSIVE INCOME (LOSS)
The components of accumulated other comprehensive income (loss) are as follows at December 31:
2011 2010 Accumulated net unrealized loss on available-for-sale securities, net of
tax benefit of $1.0 million at December 31, 2010 $ - $ (1,478) Foreign currency translation adjustments (1,547) 1,759
Total accumulated other comprehensive (loss) income $ (1,547) $ 281
MONSTER BEVERAGE CORPORATION AND SUBSIDIARIES NOTES TO CONSOLIDATED FINANCIAL STATEMENTS (Tabular Dollars in Thousands, Except Per Share Amounts)
93
11. TREASURY STOCK PURCHASE
October 12, 2011, the Company’s Board of Directors authorized a new share repurchase program for the repurchase of up to $250.0 million of the Company’s outstanding common stock (the “2011 Repurchase Plan”). No shares were repurchased under the 2011 Repurchase Plan during the year ended December 31, 2011.
On March 11, 2010, the Company’s Board of Directors authorized the repurchase of up to $200.0 million of the
Company’s common stock (the “2010 Repurchase Plan”). Under the 2010 Repurchase Plan, the Company purchased 5.0 million shares of common stock at an average purchase price of $35.63 per share, as adjusted for the stock split, for a total amount of $176.4 million, during the year ended December 31, 2011, which the Company holds in treasury. This repurchase exhausted the availability under the 2010 Repurchase Plan.
Under the 2010 Repurchase Plan, the Company purchased 1.2 million shares of the Company’s common stock at
an average purchase price of $18.84 per share, as adjusted for the stock split, for a total amount of $23.5 million during the year ended December 31, 2010, which the Company holds in treasury. 12. STOCK-BASED COMPENSATION
The Company has two stock-based compensation plans under which shares were available for grant at December 31, 2011: the Monster Beverage Corporation 2011 Omnibus Incentive Plan (the “2011 Omnibus Incentive Plan”) and the 2009 Monster Beverage Corporation Stock Incentive Plan for Non-Employee Directors (the “2009 Directors Plan”).
The 2011 Omnibus Incentive Plan permits the granting of options, stock appreciation rights, restricted stock,
restricted stock units, performance awards and other stock-based awards up to an aggregate of 14,500,000 shares of the common stock of the Company to employees or consultants of the Company and its subsidiaries. Shares authorized under the 2011 Omnibus Incentive Plan are reduced by 2.16 shares for each share granted or issued with respect to a Full Value Award. A Full Value Award is an award other than an incentive stock option, a non-qualified stock option, or a stock appreciation right, which is settled by the issuance of shares. Options granted under the 2011 Omnibus Incentive Plan may be incentive stock options under Section 422 of the Internal Revenue Code, as amended, or non-qualified stock options. The Compensation Committee of the Board of Directors (the “Compensation Committee”) has sole and exclusive authority to grant stock awards to all employees who are not new hires and to all new hires who are subject to Section 16 of the Exchange Act. The Compensation Committee and the Executive Committee of the Board of Directors (the “Executive Committee”) each independently has the authority to grant stock awards to new hires who are not Section 16 employees. Awards granted by the Executive Committee are not subject to approval or ratification by the Board or the Compensation Committee. Options granted under the 2011 Omnibus Incentive Plan generally vest over a five-year period from the grant date and are generally exercisable up to 10 years after the grant date. As of December 31, 2011, 993,450 shares of the Company’s common stock have been granted, net of cancellations, and 13,506,550 shares of the Company’s common stock remain available for grant under the 2011 Omnibus Incentive Plan.
The 2009 Directors Plan permits the granting of options, stock appreciation rights (each, an “SAR”), and other stock-based awards to purchase up to an aggregate of 1,600,000 shares of common stock of the Company to non-employee directors of the Company. The 2009 Directors Plan is administered by the Board of Directors. Each award granted under the 2009 Directors Plan will be evidenced by a written agreement and will contain the terms and conditions that the Board of Directors deems appropriate. The Board of Directors may grant such awards on the last business day prior to the date of the annual meeting of stockholders. Any award granted under the 2009 Directors Plan will vest, with respect to 100% of such award, on the last business day prior to the date of the annual meeting, in the calendar year following the calendar year in which such award is granted. The Board of Directors may determine the exercise price per share of the Company’s common stock under each option, but such price may not be less than 100% of the closing price of the Company’s common stock on the date an option is granted. Option grants may be made under the 2009 Directors Plan for 10 years from June 4, 2009. The Board of Directors may also grant SARs, independently, or in connection with an option grant. The Board of Directors may determine the exercise price per share of the Company’s common stock
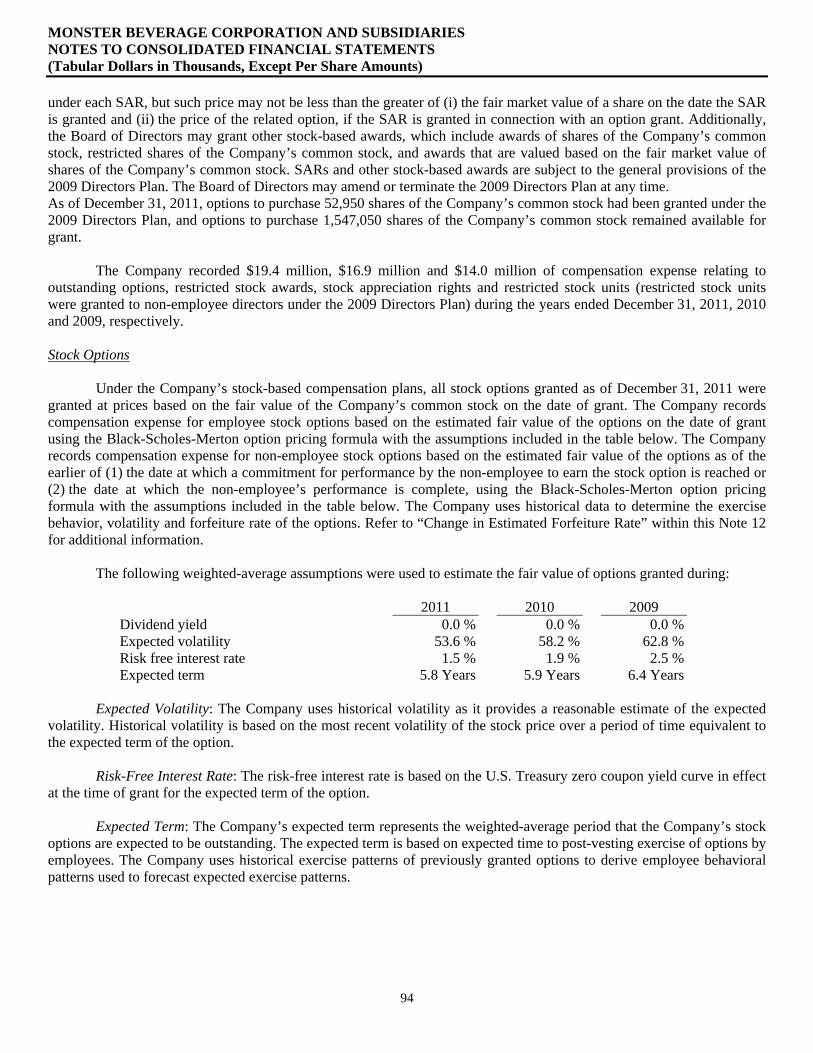
MONSTER BEVERAGE CORPORATION AND SUBSIDIARIES NOTES TO CONSOLIDATED FINANCIAL STATEMENTS (Tabular Dollars in Thousands, Except Per Share Amounts)
94
under each SAR, but such price may not be less than the greater of (i) the fair market value of a share on the date the SAR is granted and (ii) the price of the related option, if the SAR is granted in connection with an option grant. Additionally, the Board of Directors may grant other stock-based awards, which include awards of shares of the Company’s common stock, restricted shares of the Company’s common stock, and awards that are valued based on the fair market value of shares of the Company’s common stock. SARs and other stock-based awards are subject to the general provisions of the 2009 Directors Plan. The Board of Directors may amend or terminate the 2009 Directors Plan at any time. As of December 31, 2011, options to purchase 52,950 shares of the Company’s common stock had been granted under the 2009 Directors Plan, and options to purchase 1,547,050 shares of the Company’s common stock remained available for grant.
The Company recorded $19.4 million, $16.9 million and $14.0 million of compensation expense relating to
outstanding options, restricted stock awards, stock appreciation rights and restricted stock units (restricted stock units were granted to non-employee directors under the 2009 Directors Plan) during the years ended December 31, 2011, 2010 and 2009, respectively.
Stock Options
Under the Company’s stock-based compensation plans, all stock options granted as of December 31, 2011 were
granted at prices based on the fair value of the Company’s common stock on the date of grant. The Company records compensation expense for employee stock options based on the estimated fair value of the options on the date of grant using the Black-Scholes-Merton option pricing formula with the assumptions included in the table below. The Company records compensation expense for non-employee stock options based on the estimated fair value of the options as of the earlier of (1) the date at which a commitment for performance by the non-employee to earn the stock option is reached or (2) the date at which the non-employee’s performance is complete, using the Black-Scholes-Merton option pricing formula with the assumptions included in the table below. The Company uses historical data to determine the exercise behavior, volatility and forfeiture rate of the options. Refer to “Change in Estimated Forfeiture Rate” within this Note 12 for additional information.
The following weighted-average assumptions were used to estimate the fair value of options granted during:
2011 2010 2009 Dividend yield 0.0 % 0.0 % 0.0 % Expected volatility 53.6 % 58.2 % 62.8 % Risk free interest rate 1.5 % 1.9 % 2.5 % Expected term 5.8 Years 5.9 Years 6.4 Years
Expected Volatility: The Company uses historical volatility as it provides a reasonable estimate of the expected
volatility. Historical volatility is based on the most recent volatility of the stock price over a period of time equivalent to the expected term of the option.
Risk-Free Interest Rate: The risk-free interest rate is based on the U.S. Treasury zero coupon yield curve in effect
at the time of grant for the expected term of the option. Expected Term: The Company’s expected term represents the weighted-average period that the Company’s stock
options are expected to be outstanding. The expected term is based on expected time to post-vesting exercise of options by employees. The Company uses historical exercise patterns of previously granted options to derive employee behavioral patterns used to forecast expected exercise patterns.
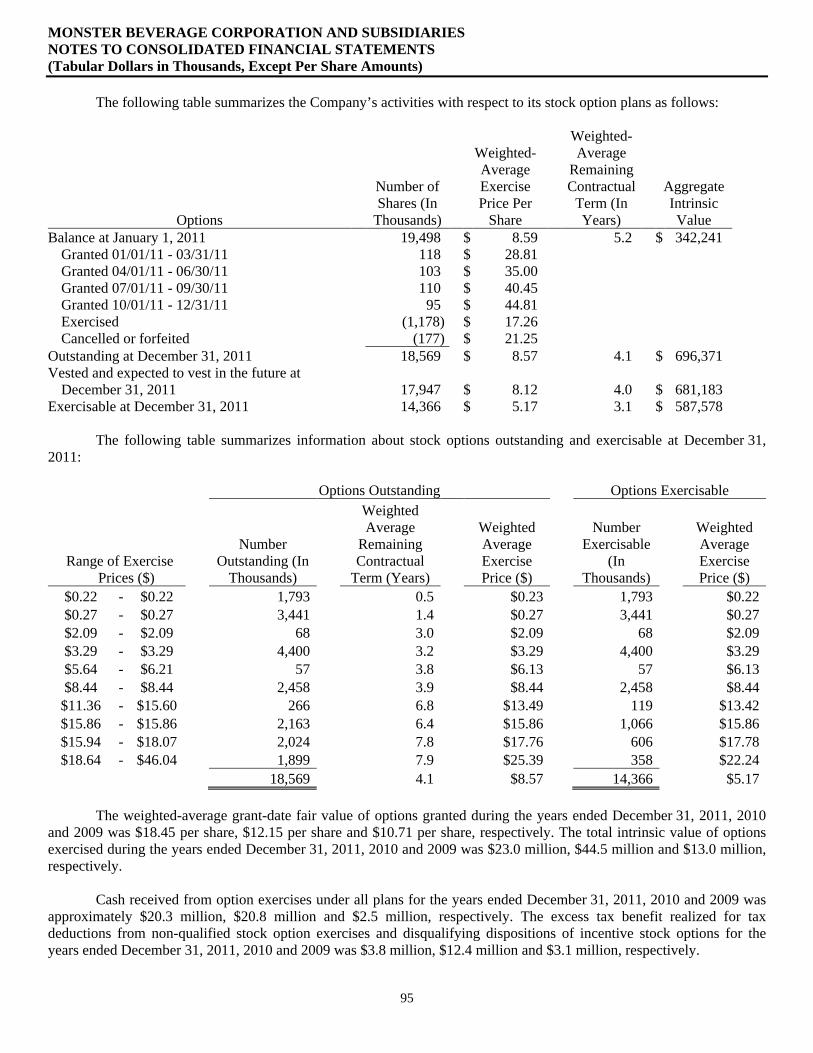
MONSTER BEVERAGE CORPORATION AND SUBSIDIARIES NOTES TO CONSOLIDATED FINANCIAL STATEMENTS (Tabular Dollars in Thousands, Except Per Share Amounts)
95
The following table summarizes the Company’s activities with respect to its stock option plans as follows:
Options
Number of Shares (In
Thousands)
Weighted- Average Exercise Price Per
Share
Weighted- Average
Remaining Contractual
Term (In Years)
Aggregate Intrinsic Value
Balance at January 1, 2011 19,498 $ 8.59 5.2 $ 342,241 Granted 01/01/11 - 03/31/11 118 $ 28.81 Granted 04/01/11 - 06/30/11 103 $ 35.00 Granted 07/01/11 - 09/30/11 110 $ 40.45 Granted 10/01/11 - 12/31/11 95 $ 44.81 Exercised (1,178) $ 17.26 Cancelled or forfeited (177) $ 21.25
Outstanding at December 31, 2011 18,569 $ 8.57 4.1 $ 696,371 Vested and expected to vest in the future at
December 31, 2011 17,947 $ 8.12 4.0 $ 681,183 Exercisable at December 31, 2011 14,366 $ 5.17 3.1 $ 587,578
The following table summarizes information about stock options outstanding and exercisable at December 31,
2011:
Options Outstanding Options Exercisable
Range of Exercise Prices ($)
Number Outstanding (In
Thousands)
Weighted Average
Remaining Contractual
Term (Years)
Weighted Average Exercise Price ($)
Number Exercisable
(In Thousands)
Weighted Average Exercise Price ($)
$0.22 - $0.22 1,793 0.5 $0.23 1,793 $0.22 $0.27 - $0.27 3,441 1.4 $0.27 3,441 $0.27 $2.09 - $2.09 68 3.0 $2.09 68 $2.09 $3.29 - $3.29 4,400 3.2 $3.29 4,400 $3.29 $5.64 - $6.21 57 3.8 $6.13 57 $6.13 $8.44 - $8.44 2,458 3.9 $8.44 2,458 $8.44 $11.36 - $15.60 266 6.8 $13.49 119 $13.42 $15.86 - $15.86 2,163 6.4 $15.86 1,066 $15.86 $15.94 - $18.07 2,024 7.8 $17.76 606 $17.78 $18.64 - $46.04 1,899 7.9 $25.39 358 $22.24
18,569 4.1 $8.57 14,366 $5.17
The weighted-average grant-date fair value of options granted during the years ended December 31, 2011, 2010 and 2009 was $18.45 per share, $12.15 per share and $10.71 per share, respectively. The total intrinsic value of options exercised during the years ended December 31, 2011, 2010 and 2009 was $23.0 million, $44.5 million and $13.0 million, respectively.
Cash received from option exercises under all plans for the years ended December 31, 2011, 2010 and 2009 was
approximately $20.3 million, $20.8 million and $2.5 million, respectively. The excess tax benefit realized for tax deductions from non-qualified stock option exercises and disqualifying dispositions of incentive stock options for the years ended December 31, 2011, 2010 and 2009 was $3.8 million, $12.4 million and $3.1 million, respectively.
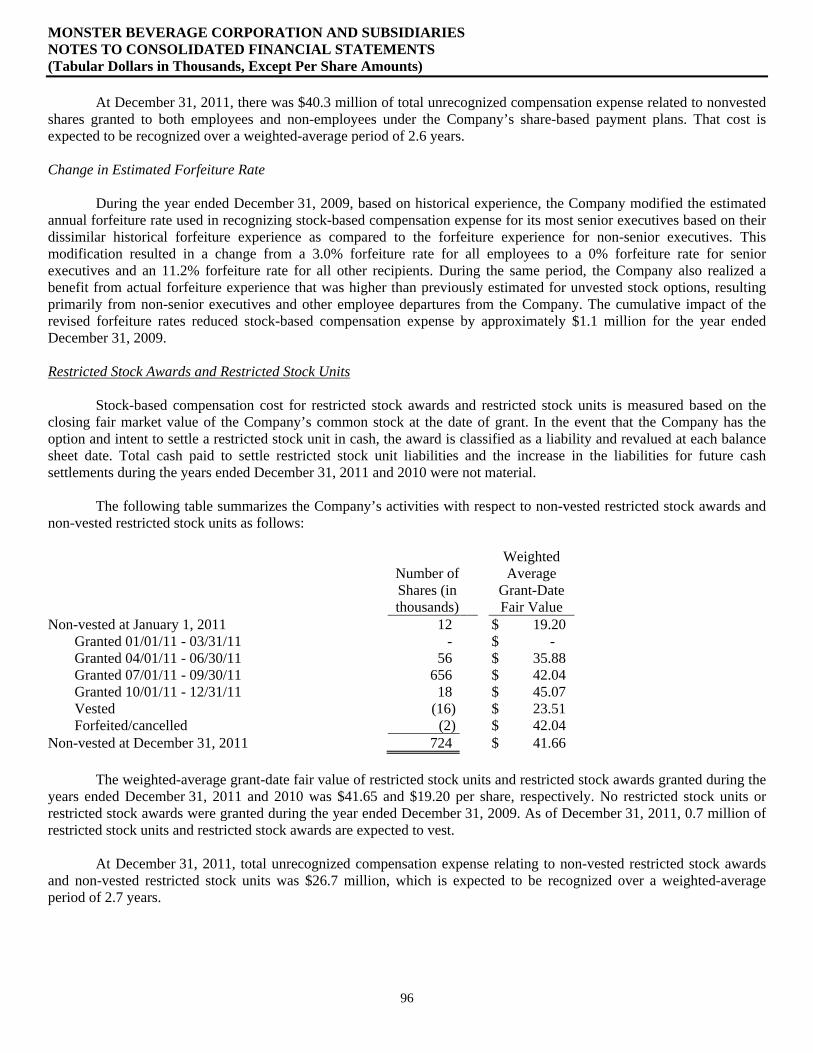
MONSTER BEVERAGE CORPORATION AND SUBSIDIARIES NOTES TO CONSOLIDATED FINANCIAL STATEMENTS (Tabular Dollars in Thousands, Except Per Share Amounts)
96
At December 31, 2011, there was $40.3 million of total unrecognized compensation expense related to nonvested shares granted to both employees and non-employees under the Company’s share-based payment plans. That cost is expected to be recognized over a weighted-average period of 2.6 years.
Change in Estimated Forfeiture Rate
During the year ended December 31, 2009, based on historical experience, the Company modified the estimated annual forfeiture rate used in recognizing stock-based compensation expense for its most senior executives based on their dissimilar historical forfeiture experience as compared to the forfeiture experience for non-senior executives. This modification resulted in a change from a 3.0% forfeiture rate for all employees to a 0% forfeiture rate for senior executives and an 11.2% forfeiture rate for all other recipients. During the same period, the Company also realized a benefit from actual forfeiture experience that was higher than previously estimated for unvested stock options, resulting primarily from non-senior executives and other employee departures from the Company. The cumulative impact of the revised forfeiture rates reduced stock-based compensation expense by approximately $1.1 million for the year ended December 31, 2009.
Restricted Stock Awards and Restricted Stock Units
Stock-based compensation cost for restricted stock awards and restricted stock units is measured based on the
closing fair market value of the Company’s common stock at the date of grant. In the event that the Company has the option and intent to settle a restricted stock unit in cash, the award is classified as a liability and revalued at each balance sheet date. Total cash paid to settle restricted stock unit liabilities and the increase in the liabilities for future cash settlements during the years ended December 31, 2011 and 2010 were not material.
The following table summarizes the Company’s activities with respect to non-vested restricted stock awards and
non-vested restricted stock units as follows:
Number of Shares (in thousands)
Weighted Average
Grant-Date Fair Value
Non-vested at January 1, 2011 12 $ 19.20 Granted 01/01/11 - 03/31/11 - $ - Granted 04/01/11 - 06/30/11 56 $ 35.88 Granted 07/01/11 - 09/30/11 656 $ 42.04 Granted 10/01/11 - 12/31/11 18 $ 45.07 Vested (16) $ 23.51 Forfeited/cancelled (2) $ 42.04
Non-vested at December 31, 2011 724 $ 41.66 The weighted-average grant-date fair value of restricted stock units and restricted stock awards granted during the
years ended December 31, 2011 and 2010 was $41.65 and $19.20 per share, respectively. No restricted stock units or restricted stock awards were granted during the year ended December 31, 2009. As of December 31, 2011, 0.7 million of restricted stock units and restricted stock awards are expected to vest.
At December 31, 2011, total unrecognized compensation expense relating to non-vested restricted stock awards
and non-vested restricted stock units was $26.7 million, which is expected to be recognized over a weighted-average period of 2.7 years.
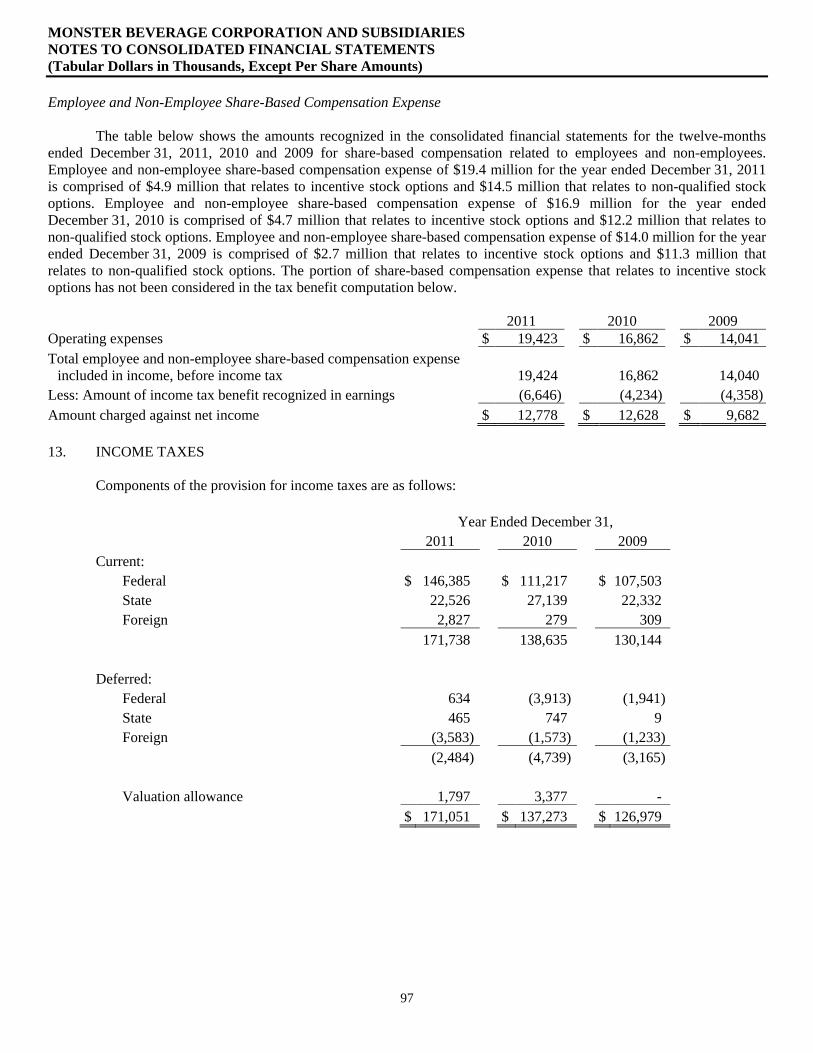
MONSTER BEVERAGE CORPORATION AND SUBSIDIARIES NOTES TO CONSOLIDATED FINANCIAL STATEMENTS (Tabular Dollars in Thousands, Except Per Share Amounts)
97
Employee and Non-Employee Share-Based Compensation Expense
The table below shows the amounts recognized in the consolidated financial statements for the twelve-months ended December 31, 2011, 2010 and 2009 for share-based compensation related to employees and non-employees. Employee and non-employee share-based compensation expense of $19.4 million for the year ended December 31, 2011 is comprised of $4.9 million that relates to incentive stock options and $14.5 million that relates to non-qualified stock options. Employee and non-employee share-based compensation expense of $16.9 million for the year ended December 31, 2010 is comprised of $4.7 million that relates to incentive stock options and $12.2 million that relates to non-qualified stock options. Employee and non-employee share-based compensation expense of $14.0 million for the year ended December 31, 2009 is comprised of $2.7 million that relates to incentive stock options and $11.3 million that relates to non-qualified stock options. The portion of share-based compensation expense that relates to incentive stock options has not been considered in the tax benefit computation below. 2011 2010 2009 Operating expenses $ 19,423 $ 16,862 $ 14,041 Total employee and non-employee share-based compensation expense
included in income, before income tax 19,424 16,862 14,040 Less: Amount of income tax benefit recognized in earnings (6,646) (4,234) (4,358) Amount charged against net income $ 12,778 $ 12,628 $ 9,682 13. INCOME TAXES
Components of the provision for income taxes are as follows:
Year Ended December 31, 2011 2010 2009 Current:
Federal $ 146,385 $ 111,217 $ 107,503 State 22,526 27,139 22,332 Foreign 2,827 279 309
171,738 138,635 130,144 Deferred:
Federal 634 (3,913) (1,941) State 465 747 9 Foreign (3,583) (1,573) (1,233)
(2,484) (4,739) (3,165)
Valuation allowance 1,797 3,377 - $ 171,051 $ 137,273 $ 126,979
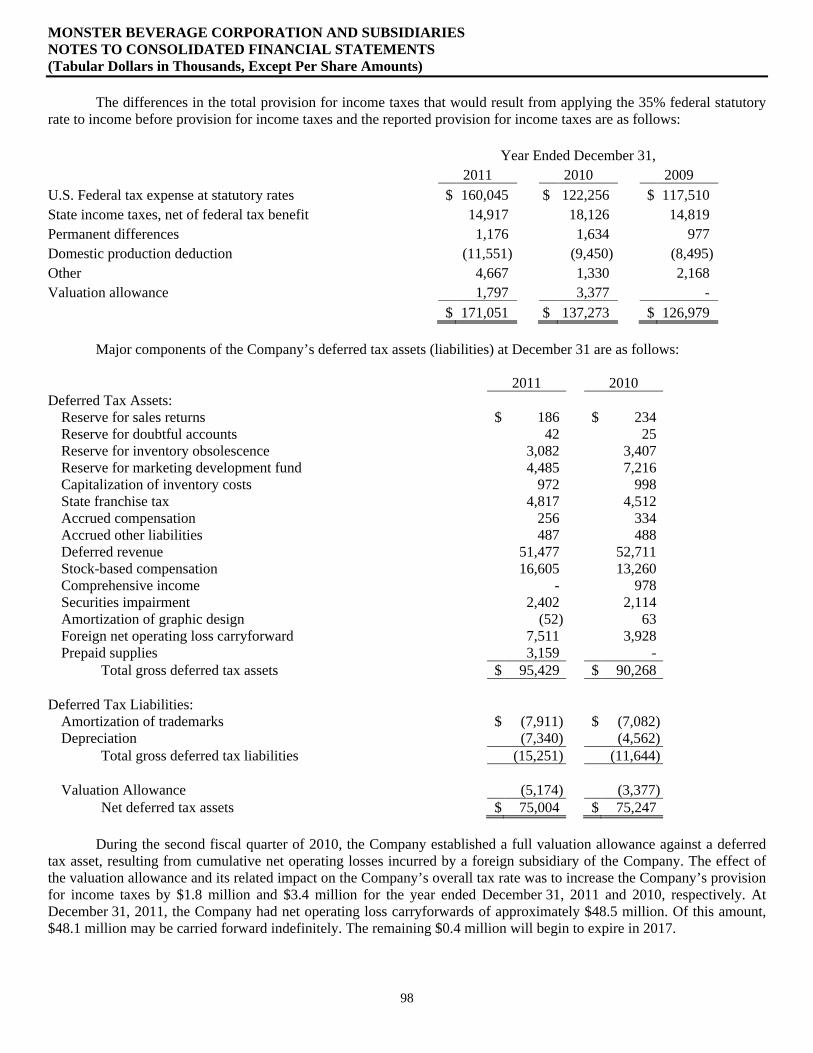
MONSTER BEVERAGE CORPORATION AND SUBSIDIARIES NOTES TO CONSOLIDATED FINANCIAL STATEMENTS (Tabular Dollars in Thousands, Except Per Share Amounts)
98
The differences in the total provision for income taxes that would result from applying the 35% federal statutory rate to income before provision for income taxes and the reported provision for income taxes are as follows: Year Ended December 31, 2011 2010 2009 U.S. Federal tax expense at statutory rates $ 160,045 $ 122,256 $ 117,510 State income taxes, net of federal tax benefit 14,917 18,126 14,819 Permanent differences 1,176 1,634 977 Domestic production deduction (11,551) (9,450) (8,495) Other 4,667 1,330 2,168 Valuation allowance 1,797 3,377 - $ 171,051 $ 137,273 $ 126,979
Major components of the Company’s deferred tax assets (liabilities) at December 31 are as follows: 2011 2010 Deferred Tax Assets:
Reserve for sales returns $ 186 $ 234 Reserve for doubtful accounts 42 25 Reserve for inventory obsolescence 3,082 3,407 Reserve for marketing development fund 4,485 7,216 Capitalization of inventory costs 972 998 State franchise tax 4,817 4,512 Accrued compensation 256 334 Accrued other liabilities 487 488 Deferred revenue 51,477 52,711 Stock-based compensation 16,605 13,260 Comprehensive income - 978 Securities impairment 2,402 2,114 Amortization of graphic design (52) 63 Foreign net operating loss carryforward 7,511 3,928 Prepaid supplies 3,159 -
Total gross deferred tax assets $ 95,429 $ 90,268 Deferred Tax Liabilities:
Amortization of trademarks $ (7,911) $ (7,082) Depreciation (7,340) (4,562)
Total gross deferred tax liabilities (15,251) (11,644)
Valuation Allowance (5,174) (3,377) Net deferred tax assets $ 75,004 $ 75,247
During the second fiscal quarter of 2010, the Company established a full valuation allowance against a deferred
tax asset, resulting from cumulative net operating losses incurred by a foreign subsidiary of the Company. The effect of the valuation allowance and its related impact on the Company’s overall tax rate was to increase the Company’s provision for income taxes by $1.8 million and $3.4 million for the year ended December 31, 2011 and 2010, respectively. At December 31, 2011, the Company had net operating loss carryforwards of approximately $48.5 million. Of this amount, $48.1 million may be carried forward indefinitely. The remaining $0.4 million will begin to expire in 2017.
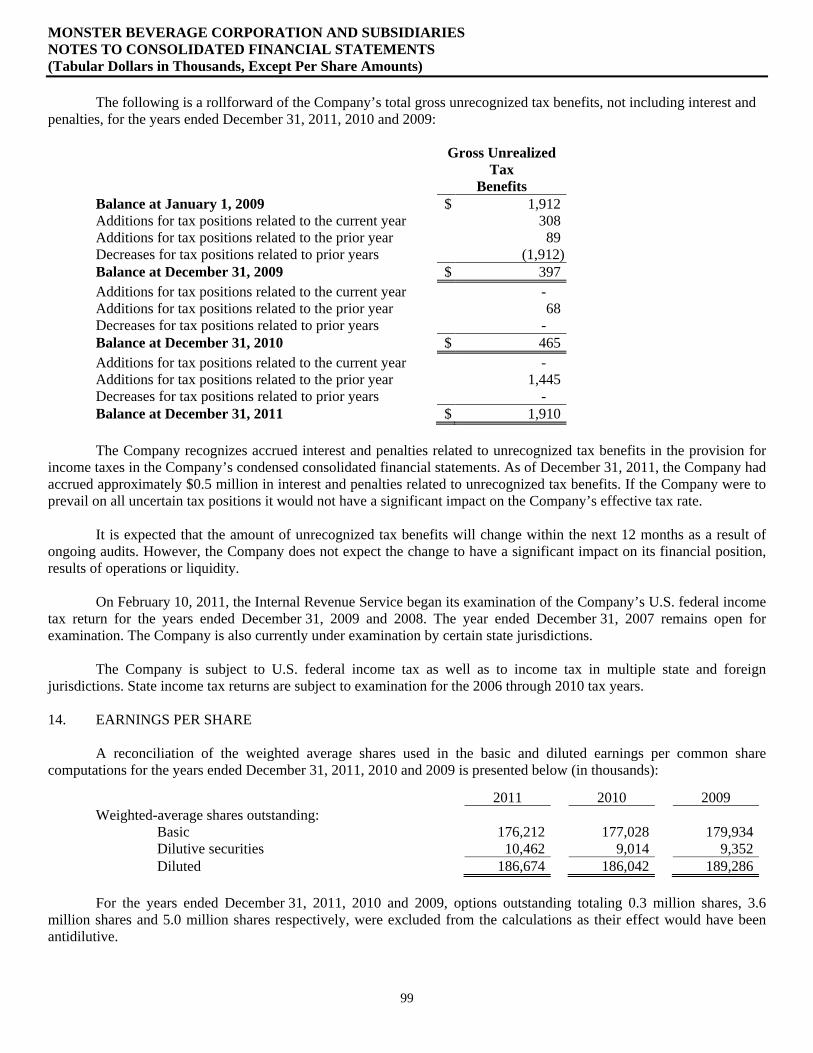
MONSTER BEVERAGE CORPORATION AND SUBSIDIARIES NOTES TO CONSOLIDATED FINANCIAL STATEMENTS (Tabular Dollars in Thousands, Except Per Share Amounts)
99
The following is a rollforward of the Company’s total gross unrecognized tax benefits, not including interest and penalties, for the years ended December 31, 2011, 2010 and 2009:
Gross Unrealized Tax
Benefits Balance at January 1, 2009 $ 1,912 Additions for tax positions related to the current year 308 Additions for tax positions related to the prior year 89 Decreases for tax positions related to prior years (1,912) Balance at December 31, 2009 $ 397 Additions for tax positions related to the current year - Additions for tax positions related to the prior year 68 Decreases for tax positions related to prior years - Balance at December 31, 2010 $ 465 Additions for tax positions related to the current year - Additions for tax positions related to the prior year 1,445 Decreases for tax positions related to prior years - Balance at December 31, 2011 $ 1,910
The Company recognizes accrued interest and penalties related to unrecognized tax benefits in the provision for
income taxes in the Company’s condensed consolidated financial statements. As of December 31, 2011, the Company had accrued approximately $0.5 million in interest and penalties related to unrecognized tax benefits. If the Company were to prevail on all uncertain tax positions it would not have a significant impact on the Company’s effective tax rate.
It is expected that the amount of unrecognized tax benefits will change within the next 12 months as a result of
ongoing audits. However, the Company does not expect the change to have a significant impact on its financial position, results of operations or liquidity.
On February 10, 2011, the Internal Revenue Service began its examination of the Company’s U.S. federal income
tax return for the years ended December 31, 2009 and 2008. The year ended December 31, 2007 remains open for examination. The Company is also currently under examination by certain state jurisdictions.
The Company is subject to U.S. federal income tax as well as to income tax in multiple state and foreign
jurisdictions. State income tax returns are subject to examination for the 2006 through 2010 tax years. 14. EARNINGS PER SHARE
A reconciliation of the weighted average shares used in the basic and diluted earnings per common share computations for the years ended December 31, 2011, 2010 and 2009 is presented below (in thousands):
2011 2010 2009 Weighted-average shares outstanding:
Basic 176,212 177,028 179,934 Dilutive securities 10,462 9,014 9,352 Diluted 186,674 186,042 189,286
For the years ended December 31, 2011, 2010 and 2009, options outstanding totaling 0.3 million shares, 3.6
million shares and 5.0 million shares respectively, were excluded from the calculations as their effect would have been antidilutive.
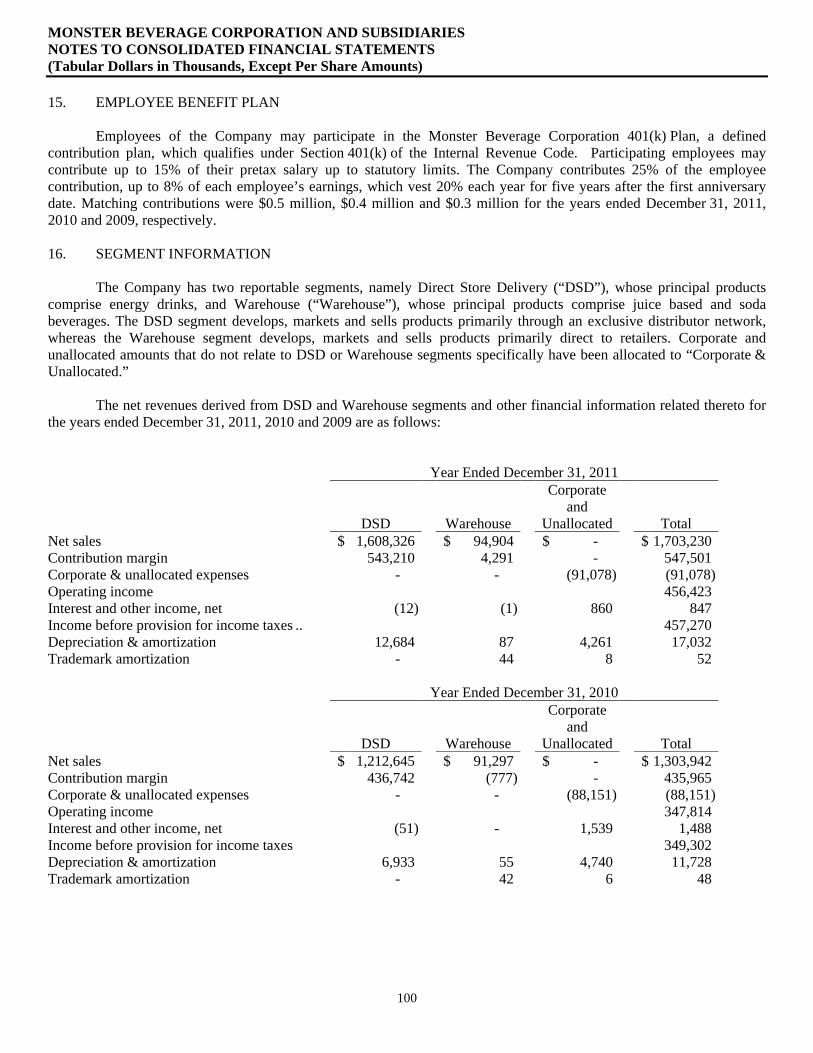
MONSTER BEVERAGE CORPORATION AND SUBSIDIARIES NOTES TO CONSOLIDATED FINANCIAL STATEMENTS (Tabular Dollars in Thousands, Except Per Share Amounts)
100
15. EMPLOYEE BENEFIT PLAN Employees of the Company may participate in the Monster Beverage Corporation 401(k) Plan, a defined
contribution plan, which qualifies under Section 401(k) of the Internal Revenue Code. Participating employees may contribute up to 15% of their pretax salary up to statutory limits. The Company contributes 25% of the employee contribution, up to 8% of each employee’s earnings, which vest 20% each year for five years after the first anniversary date. Matching contributions were $0.5 million, $0.4 million and $0.3 million for the years ended December 31, 2011, 2010 and 2009, respectively. 16. SEGMENT INFORMATION
The Company has two reportable segments, namely Direct Store Delivery (“DSD”), whose principal products comprise energy drinks, and Warehouse (“Warehouse”), whose principal products comprise juice based and soda beverages. The DSD segment develops, markets and sells products primarily through an exclusive distributor network, whereas the Warehouse segment develops, markets and sells products primarily direct to retailers. Corporate and unallocated amounts that do not relate to DSD or Warehouse segments specifically have been allocated to “Corporate & Unallocated.”
The net revenues derived from DSD and Warehouse segments and other financial information related thereto for
the years ended December 31, 2011, 2010 and 2009 are as follows:
Year Ended December 31, 2011
DSD Warehouse
Corporate and
Unallocated Total Net sales $ 1,608,326 $ 94,904 $ - $ 1,703,230 Contribution margin 543,210 4,291 - 547,501 Corporate & unallocated expenses - - (91,078) (91,078) Operating income 456,423 Interest and other income, net (12) (1) 860 847 Income before provision for income taxes .. 457,270 Depreciation & amortization 12,684 87 4,261 17,032 Trademark amortization - 44 8 52
Year Ended December 31, 2010
DSD Warehouse
Corporate and
Unallocated Total Net sales $ 1,212,645 $ 91,297 $ - $ 1,303,942 Contribution margin 436,742 (777) - 435,965 Corporate & unallocated expenses - - (88,151) (88,151) Operating income 347,814 Interest and other income, net (51) - 1,539 1,488 Income before provision for income taxes 349,302 Depreciation & amortization 6,933 55 4,740 11,728 Trademark amortization - 42 6 48
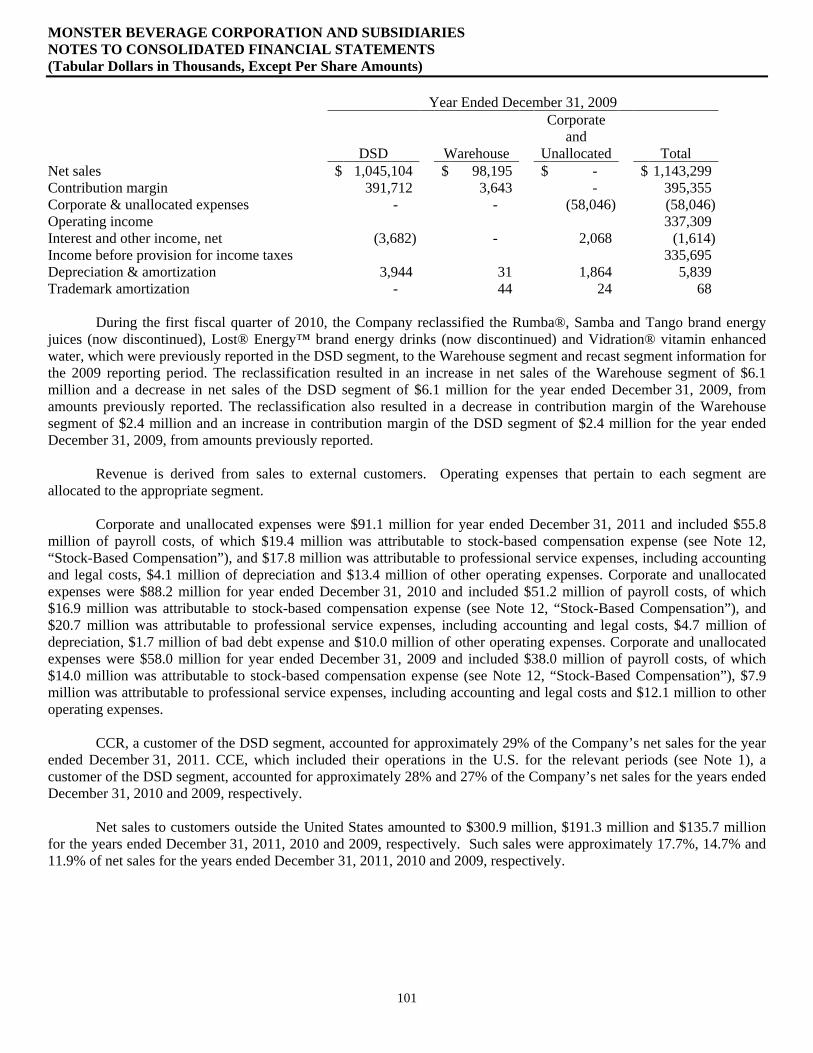
MONSTER BEVERAGE CORPORATION AND SUBSIDIARIES NOTES TO CONSOLIDATED FINANCIAL STATEMENTS (Tabular Dollars in Thousands, Except Per Share Amounts)
101
Year Ended December 31, 2009
DSD Warehouse
Corporate and
Unallocated Total Net sales $ 1,045,104 $ 98,195 $ - $ 1,143,299 Contribution margin 391,712 3,643 - 395,355 Corporate & unallocated expenses - - (58,046) (58,046) Operating income 337,309 Interest and other income, net (3,682) - 2,068 (1,614) Income before provision for income taxes 335,695 Depreciation & amortization 3,944 31 1,864 5,839 Trademark amortization - 44 24 68
During the first fiscal quarter of 2010, the Company reclassified the Rumba®, Samba and Tango brand energy
juices (now discontinued), Lost® Energy™ brand energy drinks (now discontinued) and Vidration® vitamin enhanced water, which were previously reported in the DSD segment, to the Warehouse segment and recast segment information for the 2009 reporting period. The reclassification resulted in an increase in net sales of the Warehouse segment of $6.1 million and a decrease in net sales of the DSD segment of $6.1 million for the year ended December 31, 2009, from amounts previously reported. The reclassification also resulted in a decrease in contribution margin of the Warehouse segment of $2.4 million and an increase in contribution margin of the DSD segment of $2.4 million for the year ended December 31, 2009, from amounts previously reported.
Revenue is derived from sales to external customers. Operating expenses that pertain to each segment are
allocated to the appropriate segment. Corporate and unallocated expenses were $91.1 million for year ended December 31, 2011 and included $55.8
million of payroll costs, of which $19.4 million was attributable to stock-based compensation expense (see Note 12, “Stock-Based Compensation”), and $17.8 million was attributable to professional service expenses, including accounting and legal costs, $4.1 million of depreciation and $13.4 million of other operating expenses. Corporate and unallocated expenses were $88.2 million for year ended December 31, 2010 and included $51.2 million of payroll costs, of which $16.9 million was attributable to stock-based compensation expense (see Note 12, “Stock-Based Compensation”), and $20.7 million was attributable to professional service expenses, including accounting and legal costs, $4.7 million of depreciation, $1.7 million of bad debt expense and $10.0 million of other operating expenses. Corporate and unallocated expenses were $58.0 million for year ended December 31, 2009 and included $38.0 million of payroll costs, of which $14.0 million was attributable to stock-based compensation expense (see Note 12, “Stock-Based Compensation”), $7.9 million was attributable to professional service expenses, including accounting and legal costs and $12.1 million to other operating expenses.
CCR, a customer of the DSD segment, accounted for approximately 29% of the Company’s net sales for the year
ended December 31, 2011. CCE, which included their operations in the U.S. for the relevant periods (see Note 1), a customer of the DSD segment, accounted for approximately 28% and 27% of the Company’s net sales for the years ended December 31, 2010 and 2009, respectively.
Net sales to customers outside the United States amounted to $300.9 million, $191.3 million and $135.7 million
for the years ended December 31, 2011, 2010 and 2009, respectively. Such sales were approximately 17.7%, 14.7% and 11.9% of net sales for the years ended December 31, 2011, 2010 and 2009, respectively.
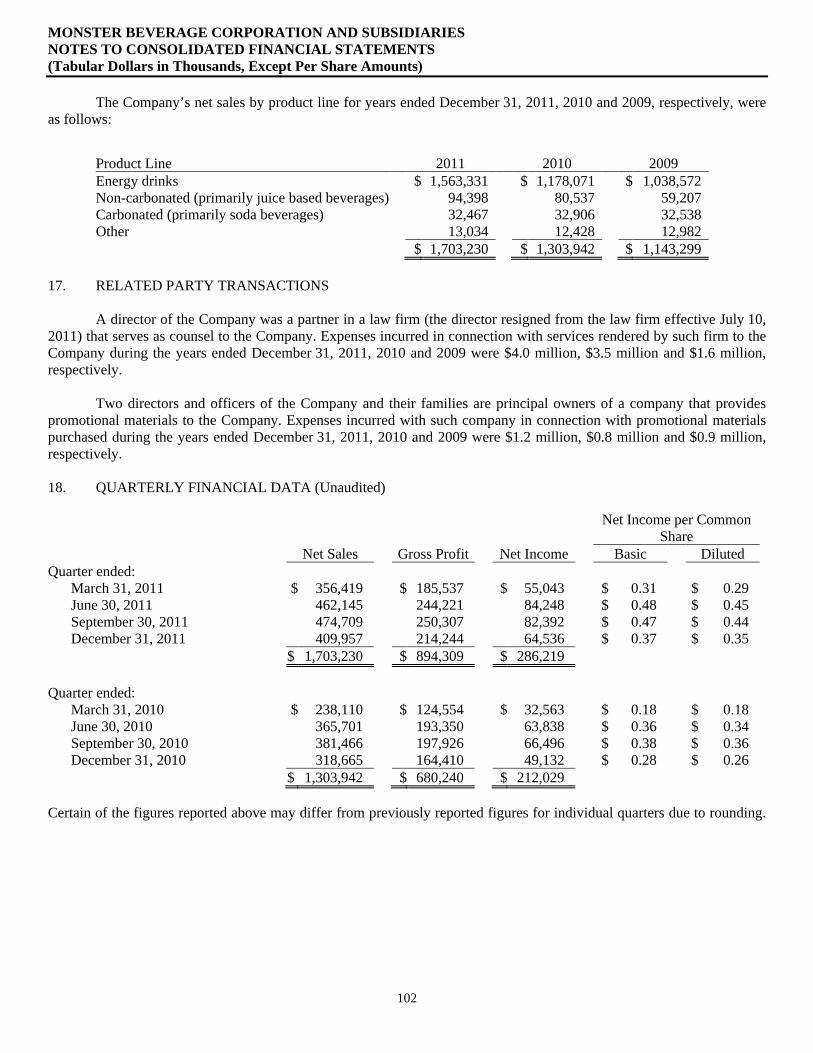
MONSTER BEVERAGE CORPORATION AND SUBSIDIARIES NOTES TO CONSOLIDATED FINANCIAL STATEMENTS (Tabular Dollars in Thousands, Except Per Share Amounts)
102
The Company’s net sales by product line for years ended December 31, 2011, 2010 and 2009, respectively, were as follows:
Product Line 2011 2010 2009 Energy drinks $ 1,563,331 $ 1,178,071 $ 1,038,572 Non-carbonated (primarily juice based beverages) 94,398 80,537 59,207 Carbonated (primarily soda beverages) 32,467 32,906 32,538 Other 13,034 12,428 12,982 $ 1,703,230 $ 1,303,942 $ 1,143,299
17. RELATED PARTY TRANSACTIONS
A director of the Company was a partner in a law firm (the director resigned from the law firm effective July 10,
2011) that serves as counsel to the Company. Expenses incurred in connection with services rendered by such firm to the Company during the years ended December 31, 2011, 2010 and 2009 were $4.0 million, $3.5 million and $1.6 million, respectively.
Two directors and officers of the Company and their families are principal owners of a company that provides
promotional materials to the Company. Expenses incurred with such company in connection with promotional materials purchased during the years ended December 31, 2011, 2010 and 2009 were $1.2 million, $0.8 million and $0.9 million, respectively.
18. QUARTERLY FINANCIAL DATA (Unaudited) Net Income per Common Share Net Sales Gross Profit Net Income Basic Diluted Quarter ended:
March 31, 2011 $ 356,419 $ 185,537 $ 55,043 $ 0.31 $ 0.29 June 30, 2011 462,145 244,221 84,248 $ 0.48 $ 0.45 September 30, 2011 474,709 250,307 82,392 $ 0.47 $ 0.44 December 31, 2011 409,957 214,244 64,536 $ 0.37 $ 0.35
$ 1,703,230 $ 894,309 $ 286,219 Quarter ended:
March 31, 2010 $ 238,110 $ 124,554 $ 32,563 $ 0.18 $ 0.18 June 30, 2010 365,701 193,350 63,838 $ 0.36 $ 0.34 September 30, 2010 381,466 197,926 66,496 $ 0.38 $ 0.36 December 31, 2010 318,665 164,410 49,132 $ 0.28 $ 0.26
$ 1,303,942 $ 680,240 $ 212,029 Certain of the figures reported above may differ from previously reported figures for individual quarters due to rounding.
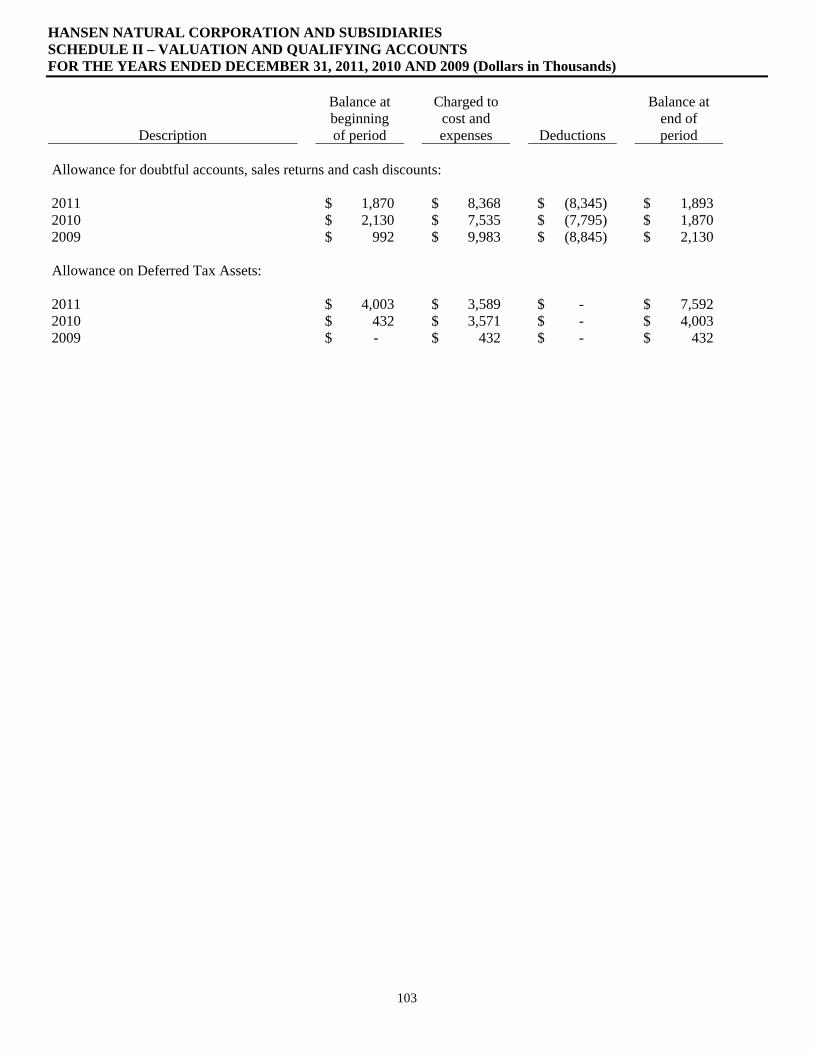
HANSEN NATURAL CORPORATION AND SUBSIDIARIES SCHEDULE II – VALUATION AND QUALIFYING ACCOUNTS FOR THE YEARS ENDED DECEMBER 31, 2011, 2010 AND 2009 (Dollars in Thousands)
103
Description
Balance at beginning of period
Charged to cost and expenses Deductions
Balance at end of period
Allowance for doubtful accounts, sales returns and cash discounts:
2011 $ 1,870 $ 8,368 $ (8,345) $ 1,893 2010 $ 2,130 $ 7,535 $ (7,795) $ 1,870 2009 $ 992 $ 9,983 $ (8,845) $ 2,130 Allowance on Deferred Tax Assets:
2011 $ 4,003 $ 3,589 $ - $ 7,592 2010 $ 432 $ 3,571 $ - $ 4,003 2009 $ - $ 432 $ - $ 432

104
NOTES
36323 Inside.pdf 1 4/19/12 12:43 PM

36323 outside.pdf 1 4/6/12 11:00 PM