Embed Size (px)
Citation preview

www.iifiir.org [email protected] #refrigeration
35th Informatory Note on Refrigeration Technologies / November 2017
The impact of the refrigeration sector on climate change
The IIR publishes Informatory Notes designed to meet the needs of decision-makers worldwide, on a regular basis. These notes summarize knowledge in key refrigeration-technology and refrigera-tion-application domains. Each note puts forward future priority developmental axes and provides IIR recommendations in this context.
As shown in this Informatory Note, the refrigeration sector, including air conditioning, heat pumps and cryogenics, accounts for 7.8% of global greenhouse gas emissions (based on IIR estimates for 2014). Among these emissions, 37% are direct emissions of CFCs, HCFCs and HFCs, and 63% are indirect emissions related to the production and transport of the energy consumed by refrigeration systems (CO2 emissions mainly). The Kigali Amendment to the Montreal Protocol adopted in 2016, intended to progressively reduce the production and consumption of HFCs, should allow to avoid an increase in average temperatures between 0.1 °C and 0.3 °C by 2100.
The refrigeration sector is expected to grow in the decades to come. This growth must be sus-tainable, with limited impact on climate change. With this in mind, the IIR presents a series of recommendations.
This Informatory Note was prepared by Didier Coulomb (Director General of the IIR), Jean-Luc Dupont (Head of the Scientific and Technical Information Department) and Valentin Morlet (Informatory Note writer), and was reviewed by several experts from the IIR network.
2
International Institute of Refrigeration - Informatory Note
IntroductionRefrigeration plays an essential and growing role in the global economy, with significant
contributions made in food, health, thermal comfort and environmental protection areas.The refrigeration sector includes refrigeration systems (as well as cryogenic systems),
air-conditioning and heat pumping systems. The total number of these systems in operation worldwide is roughly 3 billion [1].
The sector is expected to grow in the decades to come, particularly in developing coun-tries, where demand for refrigeration is rising sharply. This growth must be sustainable, with limited impact on the environment, and climate change in particular.
In light of this, the IIR has produced this Informatory Note with the aim of evaluating the impact that the refrigeration sector has on climate change. This evaluation is essential to clarify the environmental issues resulting from refrigeration.
This Informatory Note first presents an estimate of greenhouse gas (GHG) emissions related to the refrigeration sector:
• direct emissions of GHG refrigerants generated mainly by leakage or non-controlled disposal from refrigeration systems, mainly chlorofluorocarbons (CFCs), hydrochloro-fluorocarbons (HCFCs) and hydrofluorocarbons (HFCs);
• indirect emissions generated by GHGs produced in the generation of the energy that these systems require to operate.
To integrate direct and indirect emissions into one single indicator, different metrics exist, such as Total Equivalent Warming Impact (TEWI) and Life Cycle Climate Performance (LCCP). LCCP “Ref [2]” is the most comprehensive and is used here.
This Informatory Note also includes forecasts of future direct GHG emissions related to the refrigeration sector. It particularly focuses on the potential advantages of the implementa-tion of the recent Kigali Amendment, which plans a gradual reduction of HFC consumption and production worldwide (see Table 1).
Estimates presented in this Informatory Note are detailed in the document “Annexes to the 35th Note” available on the IIR website. (http://bit.ly/IIRnote)
1. Methodology1.1. Direct and indirect emissions
Greenhouse gas emissions in the refrigeration sector can be divided into two groups: direct emissions and indirect emissions.
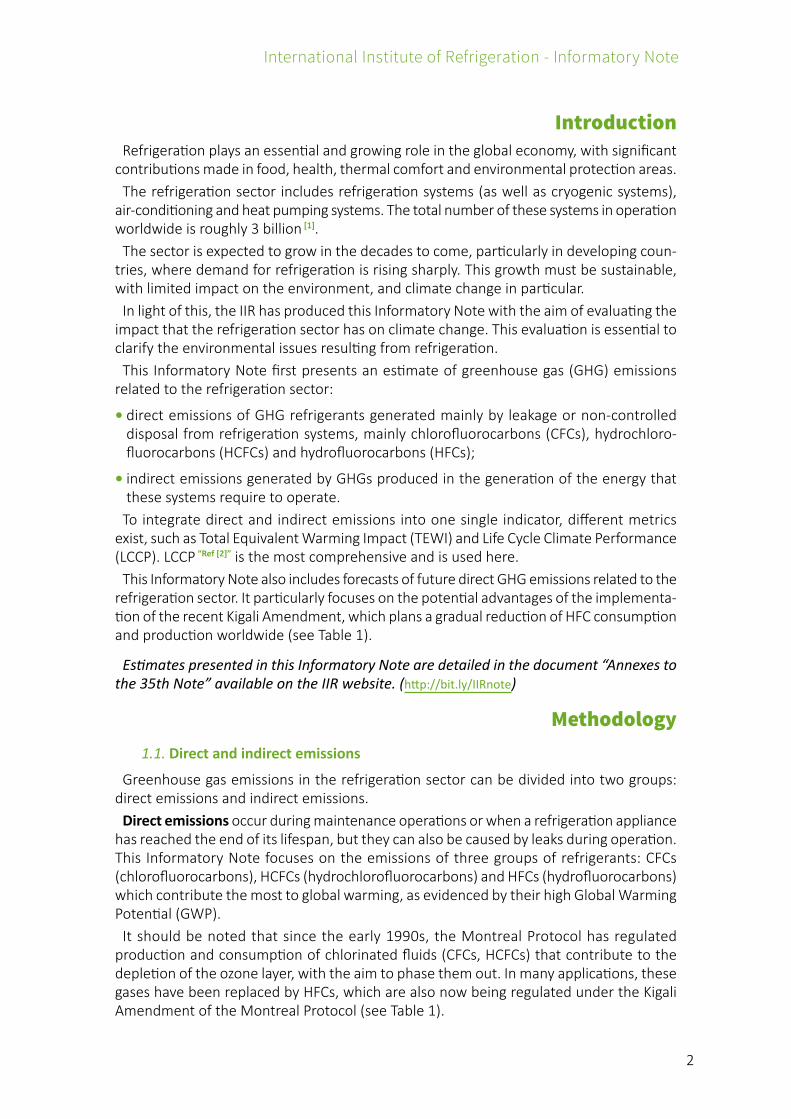
Direct emissions occur during maintenance operations or when a refrigeration appliance has reached the end of its lifespan, but they can also be caused by leaks during operation. This Informatory Note focuses on the emissions of three groups of refrigerants: CFCs (chlorofluorocarbons), HCFCs (hydrochlorofluorocarbons) and HFCs (hydrofluorocarbons) which contribute the most to global warming, as evidenced by their high Global Warming Potential (GWP).
It should be noted that since the early 1990s, the Montreal Protocol has regulated production and consumption of chlorinated fluids (CFCs, HCFCs) that contribute to the depletion of the ozone layer, with the aim to phase them out. In many applications, these gases have been replaced by HFCs, which are also now being regulated under the Kigali Amendment of the Montreal Protocol (see Table 1).
3
International Institute of Refrigeration - Informatory Note
Indirect emissions are generated from the production of energy required to drive refrig-eration systems.
• The electricity generation required to operate systems (see Annex D, Annex F). CO2 emis-sions are primarily generated by the combustion of different types of fuel. Methane (CH4) emissions are primarily generated by coal mining, and also largely by natural gas extraction. Nitrous oxide (N2O) emissions are significantly generated by coal combustion.
• Automotive air conditioning leads to over-consumption of fuel (see Annex E) and, in turn, generates additional CO2 and N2O emissions.
• Other sources of indirect emissions exist, such as refrigerated transport and ab- and adsorption systems that use fuel combustion as a heat source. However, in light of the number of units in service, the emissions from these systems are negligible compared to others (see Annex E).
In addition to direct and indirect emissions, the LCCP calculation also takes into account emissions that result from the manufacture of materials and refrigerants, and those that occur during decommissioning of appliances at the end of their lifespans. Based on the data of the 32nd IIR Informatory Note on LCCP [2], the impact of these emissions is consid-ered to be negligible.
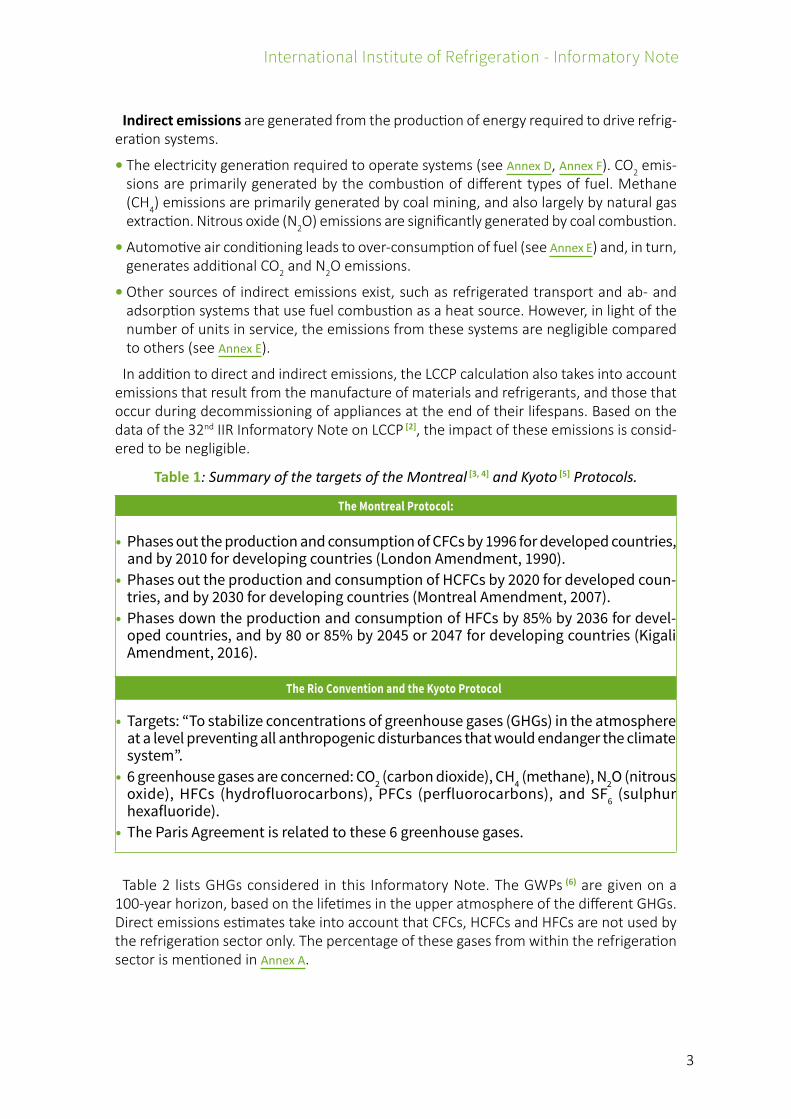
Table 1: Summary of the targets of the Montreal [3, 4] and Kyoto [5] Protocols.
The Montreal Protocol:
• Phases out the production and consumption of CFCs by 1996 for developed countries, and by 2010 for developing countries (London Amendment, 1990).
• Phases out the production and consumption of HCFCs by 2020 for developed coun-tries, and by 2030 for developing countries (Montreal Amendment, 2007).
• Phases down the production and consumption of HFCs by 85% by 2036 for devel-oped countries, and by 80 or 85% by 2045 or 2047 for developing countries (Kigali Amendment, 2016).
The Rio Convention and the Kyoto Protocol:
• Targets: “To stabilize concentrations of greenhouse gases (GHGs) in the atmosphere at a level preventing all anthropogenic disturbances that would endanger the climate system”.
• 6 greenhouse gases are concerned: CO2 (carbon dioxide), CH4 (methane), N2O (nitrous oxide), HFCs (hydrofluorocarbons), PFCs (perfluorocarbons), and SF6 (sulphur hexafluoride).
• The Paris Agreement is related to these 6 greenhouse gases.
Table 2 lists GHGs considered in this Informatory Note. The GWPs (6) are given on a 100-year horizon, based on the lifetimes in the upper atmosphere of the different GHGs. Direct emissions estimates take into account that CFCs, HCFCs and HFCs are not used by the refrigeration sector only. The percentage of these gases from within the refrigeration sector is mentioned in Annex A.

4
International Institute of Refrigeration - Informatory Note
Table 2: List of GHGs emitted by the refrigeration sector.
Substance GWP100 [6] Lifetime (in years) [6]
Direct emissions
CFCCFC-11 4,660 45.0CFC12 10,200 100.0
CFC-115 7,670 1,020.0
HCFCHCFC-22 1,760 11.9
HCFC-123 79 1.3HCFC-124 527 5.4
HFC
HFC-32 677 5.2HFC-125 3,170 28.2
HFC-134a 1,300 13.4HFC-143a 4,800 47.1HFC-152a 138 1.5
Indirect emissionsCO2 1 there is no distinctive lifetime
CH4 28 12.4N2O 265 121
1.2. Concepts used to evaluate the impact of emissions
1.2.1. Radiative forcingThe Intergovernmental Panel on Climate Change (IPCC) defines radiative forcing [7] as the
rate of energy change per unit area of the globe as measured at the top of the troposphere, calculated in watts per square metre. It “denotes an externally imposed perturbation in the radiative energy budget of the Earth’s climate system. Such a perturbation can be brought about by secular changes in the concentrations of radiatively active species (e.g., CO2, aerosols), changes in the solar irradiance incident upon the planet, or other changes that affect the radiative energy absorbed by the surface (e.g., changes in surface reflection properties). This imbalance in the radiation budget has the potential to lead to equilibrium state of the climate system” [8]. To indicate humankind’s responsibility for the phenomenon, the year 1750, which marks the start of the industrial era, was chosen as the reference year. Therefore, a gas that has the same radiation capacity today as it did in 1750 has a radiative forcing of 0.
While its definition and validity are accepted by the scientific community, it should be stressed that radiative forcing is an instantaneous value since it depends on the current atmospheric concentration of a gas which results from its past emissions and its atmos-pheric lifetime.
To summarise, radiative forcing provides a very good indication of the impact of a gas on climate change at a given moment, (i.e. the impact of the previous emissions at the given moment). However, it does not estimate the total impact over time of current emissions.
1.2.2. GWPTo estimate the impact on climate change of current emissions, it would be necessary
to take climate mechanisms into account, which are still not sufficiently well-known. As a result, it is currently very difficult to accurately predict the total impact of a gas from the time it is emitted until its atmospheric decay.
5
International Institute of Refrigeration - Informatory Note
The IPCC [9] accepted the concept of GWP to compare different GHGs and to provide an order-of-magnitude estimate of their long-term impact. GWP is a fairly simple index: it is defined as the time-integrated global mean radiative forcing due to a pulse emission of a mass of gas, relative to a pulse emission of an equal mass of the reference gas CO2.
GWP takes into account the radiative forcing of a gas, its lifetime and changes in its con-centration over time (significant uncertainties also surround this topic). In multiplying the mass emissions of a GHG by its GWP, we obtain the CO2-equivalent of these emissions. This unit of measure makes it possible to compare different GHGs by converting their emissions into a common unit.
GWP has some limitations. Time horizon, which is chosen by the user, influences the results obtained. Time horizon is generally accepted as 100 years (GWP100). Some oppo-nents of HFCs object to using GWP100 and opt instead for GWP20 which, according to them, is more consistent with the average lifetime of HFCs (21.7 years) [10].
This Informatory Note uses GWP100 to obtain long-term estimates. Given the lifetime of certain gases (CO2 in particular), a 20-year time horizon would not be long enough. It could also lead to overestimations of the real impact of short-lived gases [11].
Furthermore, other indicators such as GTP, iGTP, and TEMP [12, 13, 14, 15, 16] have been devel-oped, but no consensus has been reached on replacing GWP [17, 18].
2. Estimating the impact of refrigeration on climate change
2.1. Estimating the impact of past emissions with radiative forcing
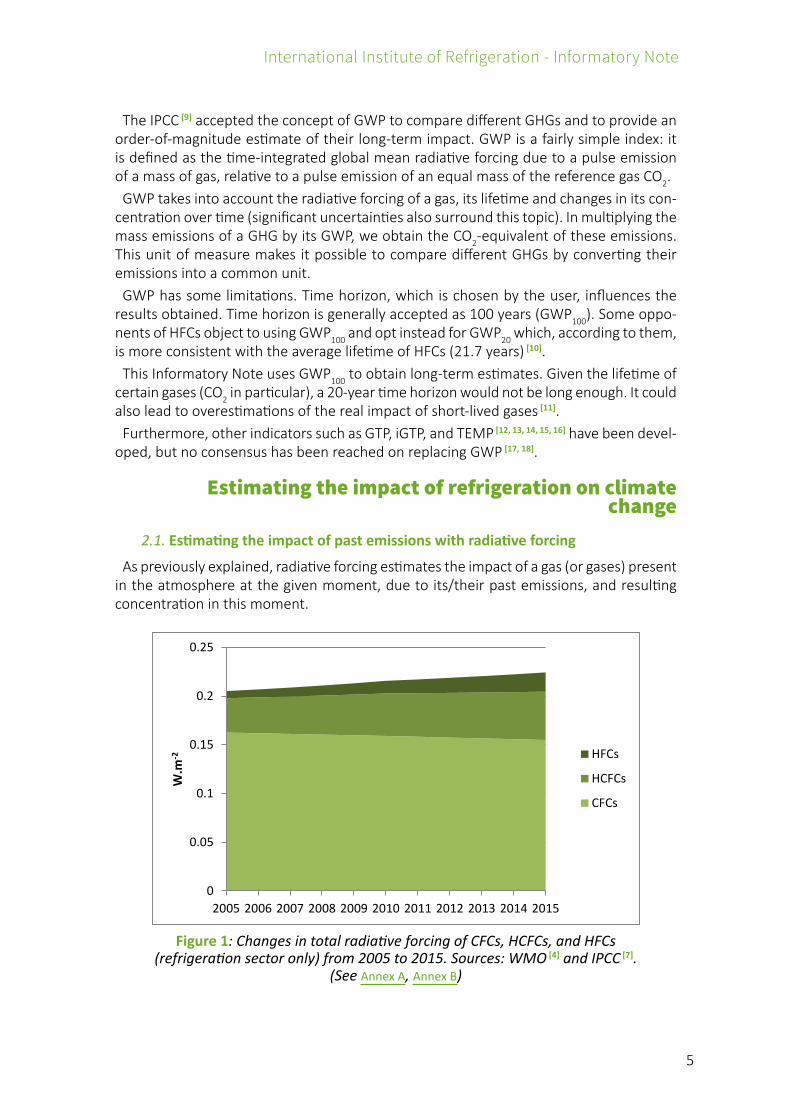
As previously explained, radiative forcing estimates the impact of a gas (or gases) present in the atmosphere at the given moment, due to its/their past emissions, and resulting concentration in this moment.
0
0.05
0.1
0.15
0.2
0.25
2005 2006 2007 2008 2009 2010 2011 2012 2013 2014 2015
W.m
-2 HFCs
HCFCs
CFCs
Figure 1: Changes in total radiative forcing of CFCs, HCFCs, and HFCs (refrigeration sector only) from 2005 to 2015. Sources: WMO [4] and IPCC [7].
(See Annex A, Annex B)

6
International Institute of Refrigeration - Informatory Note
Figure 1 shows that CFCs account for the majority of radiative forcing from refrigerants (69% in 2015 – 0.16 W.m-2). This may seem surprising at first glance, given that CFCs have been regulated by the Montreal Protocol since 1987, and that since 2010, their production has been phased out in all countries (Article 5 and Non-article 5). On the other hand, this makes sense when taking the atmospheric lifetime of CFCs into account. CFC emissions peaked in the 1990s, but continue to form a substantial amount of the radiative forcing budget today. However, their impact is decreasing. This clearly reveals the positive effect of the Montreal Protocol. That being said, it is fair to assume that CFCs will continue to account for a significant proportion of the total radiative forcing [19] for many decades to come.
In the case of HCFCs, a slight increase in radiative forcing values can be noted. It is expected to stabilise in 2020, before decreasing thereafter [19], as a result of the Montreal Protocol phase-out schedule and due to their relatively short lifetimes (around 10 years).
For the moment, the radiative forcing impact of HFCs can be considered relatively small. However, it is important to note that the radiative forcing of HFCs has increased by a factor of 2.7 in less than 10 years, and would continue to increase due to the replacement of CFCs and HCFCs. This illustrates the importance of the Kigali Amendment to phase-down HFCs.
In 2015, as shown in Figure 1, direct emissions had a total radiative forcing of 0.23 W.m-2. In contrast, indirect emissions had a total radiative forcing of 0.14 W.m-2 (see IIR esti-mates in Annex B). It is therefore apparent that past direct emissions had a larger impact on climate change in 2015 than past indirect emissions.
Based on these estimates, another figure worth noting is that in 2015, 12% of total atmospheric radiative forcing is attributed to the refrigeration sector. While this data is relevant to quantify the impact of past emissions, it does not at all reflect the impact of current and future emissions. This factor is discussed in the following section.
2.2. Estimating the impact of current emissions with GWP
2.2.1. Global emissionsThe purpose of this section is to quantify the total impact of all current emissions being
generated by the refrigeration sector. Here, GWP100 is used to convert the emissions of different gases into a common scale of CO2-equivalents. In the following, and unless oth-erwise specified, all emission estimates are yearly values.
It is important to compare the direct (CFCs, HCFCs and HFCs) and indirect (primarily CO2) emissions generated by the refrigeration sector to assess its impact on climate change.
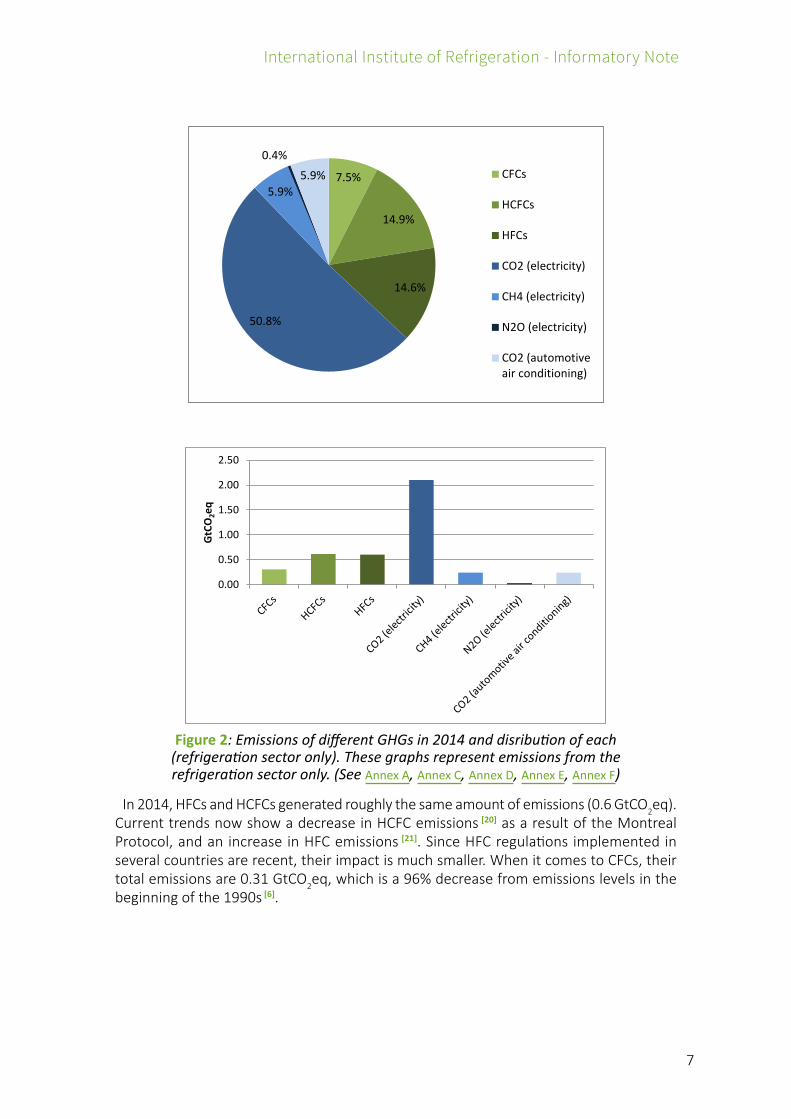
The graphs below, based on IIR estimates (see Annex C), show that the direct emissions of the refrigeration sector are equal to around 1.53 GtCO2eq, or 37% of the total emissions of the sector.
7
International Institute of Refrigeration - Informatory Note
7.5%
14.9%
14.6%
50.8%
5.9%
0.4%
5.9% CFCs
HCFCs
HFCs
CO2 (electricity)
CH4 (electricity)
N2O (electricity)
CO2 (automotiveair conditioning)
0.00
0.50
1.00
1.50
2.00
2.50
GtC
O2e
q
Figure 2: Emissions of different GHGs in 2014 and disribution of each (refrigeration sector only). These graphs represent emissions from the refrigeration sector only. (See Annex A, Annex C, Annex D, Annex E, Annex F)
In 2014, HFCs and HCFCs generated roughly the same amount of emissions (0.6 GtCO2eq). Current trends now show a decrease in HCFC emissions [20] as a result of the Montreal Protocol, and an increase in HFC emissions [21]. Since HFC regulations implemented in several countries are recent, their impact is much smaller. When it comes to CFCs, their total emissions are 0.31 GtCO2eq, which is a 96% decrease from emissions levels in the beginning of the 1990s [6].
8
International Institute of Refrigeration - Informatory Note
Indirect emissions generated by energy produced for the refrigeration sector are equal to around 2.61 GtCO2eq, or 63% of the total emissions of the sector (see IIR estimates in Annex D, Annex E, Annex F).
The highest indirect emissions are those generated by the electricity production for the refrigeration sector: total indirect emissions total of 2.37 GtCO2eq (CO2
[22, 23]: 2.10 GtCO2eq; CH4
[24, 25, 26]:0.24 GtCO2eq; N2O [22]: 0.02 GtCO2eq). Consumption of fuel [1, 22, 27] due to the
use of automotive air conditioning is significant, since it accounts for 9.3% of total indirect emissions (0.24 GtCO2eq).
Overall, 4.14 GtCO2eq, representing 7.8% of global greenhouse gases emissions, are attributed to the refrigeration sector.
2.2.2. Regional emissionsIn this section, we provide estimates of regional and national greenhouse gases emissions
generated by refrigeration use. We based these estimates on data from the regional and national reports to the UNFCCC [28] within the framework of the Kyoto Protocol and from specific studies on certain countries (see Annex G).
0 250 500 750 1000 1250
China
USA
EU-28
India
Japan
Russia
MtCO2eq
Direct emissions
Indirect emissions
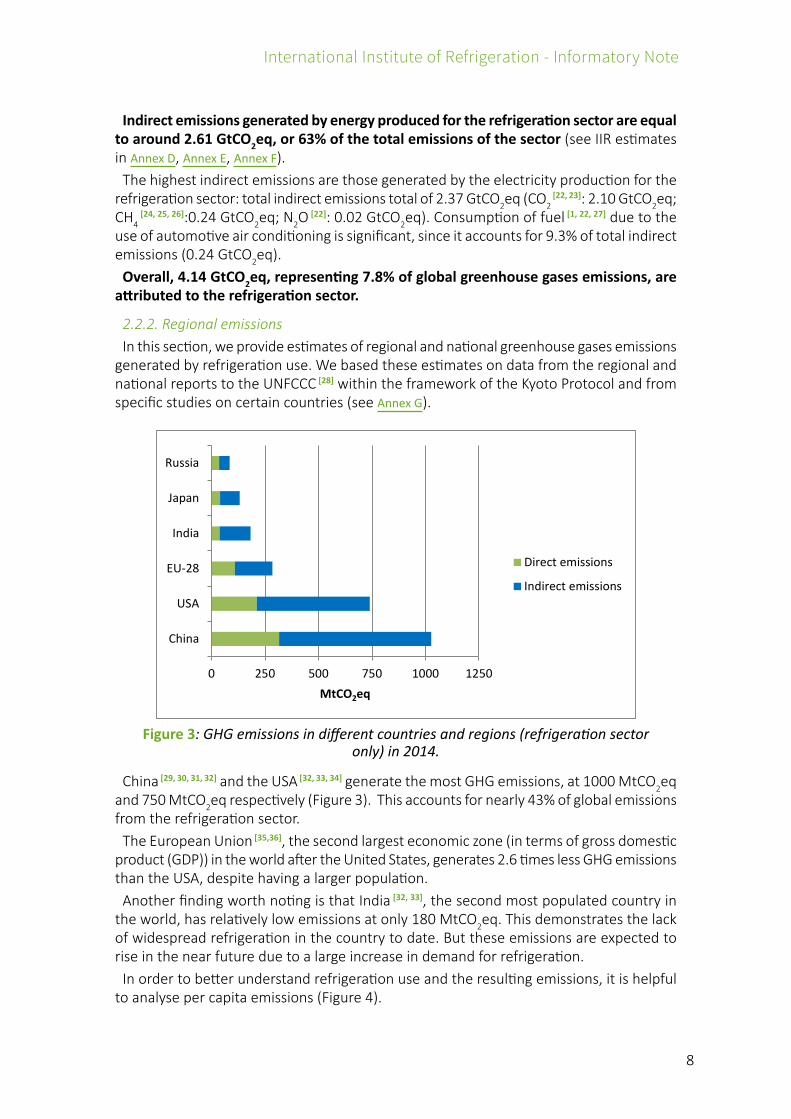
Figure 3: GHG emissions in different countries and regions (refrigeration sector only) in 2014.
China [29, 30, 31, 32] and the USA [32, 33, 34] generate the most GHG emissions, at 1000 MtCO2eq and 750 MtCO2eq respectively (Figure 3). This accounts for nearly 43% of global emissions from the refrigeration sector.
The European Union [35,36], the second largest economic zone (in terms of gross domestic product (GDP)) in the world after the United States, generates 2.6 times less GHG emissions than the USA, despite having a larger population.
Another finding worth noting is that India [32, 33], the second most populated country in the world, has relatively low emissions at only 180 MtCO2eq. This demonstrates the lack of widespread refrigeration in the country to date. But these emissions are expected to rise in the near future due to a large increase in demand for refrigeration.
In order to better understand refrigeration use and the resulting emissions, it is helpful to analyse per capita emissions (Figure 4).

9
International Institute of Refrigeration - Informatory Note
0 1000 2000 3000 4000 5000
Qatar
USA
Japan
China
Russia
EU-28
kgCO2eq/habitant
Direct emissions
Indirect emissions
Figure 4: GHG emissions per capita in different countries and regions (refrigeration sector only) in 2014.
Among the countries studied, Qatar’s refrigeration sector generates the most per capita GHG emissions, with 4500 kgCO2eq per capita [28]. Next is the USA with 2300 kgCO2eq per capita. These figures show the impact of warm climates on refrigeration needs, particularly air conditioning, and of the energy sources currently used for electricity production.
It is important to note that in the case of China, as opposed to the other countries included in Figure 4, a significant portion of the population has limited access to refrigeration technologies. This is especially true for those living in rural zones. This explains China’s relatively low per capita emissions figure. In the case of Europe and Russia, per capita emissions figures are relatively similar, at approximately 550 kgCO2 per capita.
We can also note that the ratio of direct to indirect emissions varies fairly significantly from country to country. When looking at European countries, this variation is striking. In Germany [35], where the majority of electricity production comes from fossil fuels, indi-rect emissions account for 75% of GHG emissions from the refrigeration sector. On the other hand, in France [35], a country that relies primarily on nuclear energy for electricity production, indirect emissions account for only 39% of these emissions. In Iceland, where electricity is produced almost exclusively from renewable energies, this figure is even lower at just 6% [35].
These figures reflect the situation in 2014, which can differ from the more recent past (for instance in Japan [28] following shutting down the nuclear plants due to the 2011 earthquake) and could change in the near future.
2.3. Emissions forecasts
This section aims at predicting future emissions trends in the refrigeration sector, and, specifically, to assess the impact of the Kigali Amendment on these trends. This is done by comparing emissions trends – while taking the implementation of the Amendment into account – with baseline (business-as-usual) scenarios developed by Velders et al. [21], in which the Kigali Amendment is not taken into consideration. These scenarios are based on several different socio-economic models.
10
International Institute of Refrigeration - Informatory Note
0
0.5
1
1.5
2
2.5
3
3.5
4
4.5
2010 2020 2030 2040 2050
GtC
O2e
q BAU (Velders)
Kigali Amendment
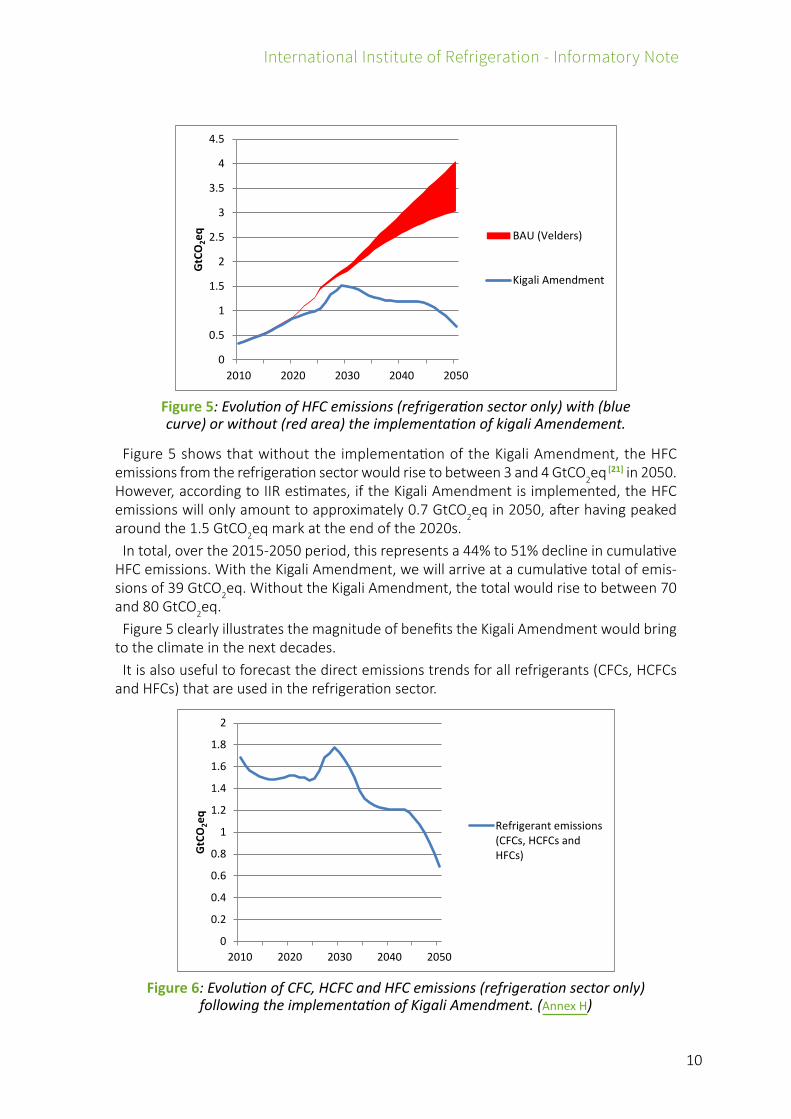
Figure 5: Evolution of HFC emissions (refrigeration sector only) with (blue curve) or without (red area) the implementation of kigali Amendement.
Figure 5 shows that without the implementation of the Kigali Amendment, the HFC emissions from the refrigeration sector would rise to between 3 and 4 GtCO2eq [21] in 2050. However, according to IIR estimates, if the Kigali Amendment is implemented, the HFC emissions will only amount to approximately 0.7 GtCO2eq in 2050, after having peaked around the 1.5 GtCO2eq mark at the end of the 2020s.
In total, over the 2015-2050 period, this represents a 44% to 51% decline in cumulative HFC emissions. With the Kigali Amendment, we will arrive at a cumulative total of emis-sions of 39 GtCO2eq. Without the Kigali Amendment, the total would rise to between 70 and 80 GtCO2eq.
Figure 5 clearly illustrates the magnitude of benefits the Kigali Amendment would bring to the climate in the next decades.
It is also useful to forecast the direct emissions trends for all refrigerants (CFCs, HCFCs and HFCs) that are used in the refrigeration sector.
0
0.2
0.4
0.6
0.8
1
1.2
1.4
1.6
1.8
2
2010 2020 2030 2040 2050
GtC
O2e
q
Refrigerant emissions(CFCs, HCFCs andHFCs)
Figure 6: Evolution of CFC, HCFC and HFC emissions (refrigeration sector only) following the implementation of Kigali Amendment. (Annex H)

11
International Institute of Refrigeration - Informatory Note
The initial significant finding in Figure 6 forecasts (refrigeration sector) is the drop in refrigerants emissions in 2050 compared to 2015. In fact, emissions drop from 1.5 GtCO2eq in 2015 to 0.7 GtCO2eq in 2050. This decline can be traced back to the effectiveness of the Montreal Protocol and its various amendments.
It must be emphasised that without the implementation of the Kigali amendment, global refrigerant emissions would continue to rise.
It should also be noted that, at the signature of the Kigali Amendment, many organisations and political leaders suggested that the planned regulation of HFCs, once effective, would prevent the global average temperature increasing by up to 0.5 °C [37, 38, 39] by the end of the century. This is to be compared with the target of the Paris Agreement, which is to “keep the increase of global average temperature to well below 2 °C above pre-industrial levels”. [40] The 0.5 °C figure actually came from a publication that dates from 2013 [41], in which the authors estimated that without regulation, HFC emissions could contribute to a rise in average temperatures between 0.35 °C and 0.5 °C by 2100. In addition, the publication was based on a controversial study from 2009 [42], which overestimated future HFC emissions.
Currently, several scientists [43, 44] now estimate that, without regulation, the maximum impact of HFCs on the global average temperature would be a rise between 0.1 °C and 0.3 °C by 2100. The Kigali Amendment should, then, allow a temperature reduction in this range (and not a reduction of 0.5 °C).
3. ConclusionEstimates included in this Informatory Note indicate that 12% of global radiative forcing
is currently attributed to the refrigeration sector (including refrigeration systems as well as air-conditioning, heat-pumping and cryogenic systems). While this indicator may be useful in quantifying the impact of past emissions, it does not reflect the impact of current and future emissions.
To estimate the impact of emissions from the refrigeration sector on climate change, we have chosen to use 100 year horizon (GWP100).
Based on these values, the refrigeration sector accounts for 7.8% of global GHG emis-sions (based on 2014 estimates).
Indirect emissions account for 63% of these GHG emissions. Direct emissions from GHG refrigerants account for 37%, although these figures vary from country to country and change over time.
Regarding direct emissions, it is important to continue the successful initiatives of the Montreal Protocol on CFCs and HCFCs. In addition, controlling emissions of high GWP HFCs is now a priority [42, 45], notably under the Kigali Amendment [3].
According to IIR estimates, the implementation of the Kigali Amendment will reduce overall global HFC emissions by 44% to 51% between 2015 and 2050 (compared with a regulation-free scenario) [21].
It is important to underline the fact that by regulating the use of HFCs, the Kigali Amendment will prevent a substantial increase of average temperatures between 0.1 °C and 0.3 °C by 2100. It should be noted that the frequently referenced figure of 0.5 °C is an overestimate. This result must be put into perspective with the objective of the Paris Agreement, which is to limit the rise in global average temperature to well below 2 °C above pre-industrial levels.
12
International Institute of Refrigeration - Informatory Note
Today, there are many alternatives to high-GWP refrigerants [46, 47] with comparable or supe-rior energy efficiencies that can help reduce direct emissions. Examples include ammonia, CO2, hydrocarbons and HFOs. It should be taken into account, however, that these alterna-tive refrigerants may present certain disadvantages and safety risks such as flammability, toxicity, and high working pressure. Such disadvantages and risks should be considered, from the design of refrigeration facilities to the training and certification of operators.
Alternative technologies to mechanical compression, without refrigerants, can also be developed and have a positive impact.
Indirect emissions, which are predominant, are mainly influenced by two factors:
• the energy efficiency of refrigeration systems;
• the primary energy required to produce electricity (coal, oil, gas, nuclear energy, renew-able energy, etc.) and the efficiency of the transport of electricity.
While the potential to improve energy efficiency is ultimately limited by the laws of ther-modynamics as well as cost-related constraints, it remains very important to seek further efficiency increases through research and technical innovations. Solutions to limit energy losses can still be implemented, such as energy recovery systems or better insulation. Another significant potential is in the rational use of air conditioning and smart control strategies, e.g. selecting comfortable temperatures that are not too low in summer, while avoiding unnecessarily cooling empty rooms.
When it comes to primary energy sources, the potential to reduce emissions is much higher. However, this depends very little on the refrigeration sector itself, and much more on national energy policies. Electricity production from fossil fuels must be reduced.
The nature of the gases emitted means that the reduction of direct emissions and that of indirect emissions will have different consequences for climate change. Nevertheless, they are linked. In fact, contrary to HFCs and HCFCs, which have a lifetime in the atmosphere of some twenty years, CO2 has a lifetime of several centuries, and plays a role in many climate mechanisms [11, 48]. Although reducing the direct emissions of these gases will have a substantial positive impact on the short and medium term, regulating CO2 emissions would have an impact on a longer term.
The world’s first priority in combating climate change should be to reduce CO2 emissions. Here, the refrigeration sector has a role to play by producing systems that are more energy efficient. Efforts to reduce direct emissions must be pursued vigorously and must not be neglected as they will play an important part in the limitation of global warming.

Copyright © 2017 IIR/IIF All rights reserved/Tous droits réservés
RecommendationsTaking into account the growing demand for refrigeration, including air conditioning, par-
ticularly in developing countries, use of this technology is expected to develop considerably. The initiatives that have been undertaken to reduce GHG emissions must be followed to limit this technology’s impact on climate change.
With regard to direct emissions (37% of the sector’s total emissions), the IIR encourages governments and the different actors in the sector to cooperate to make the Kigali Agree-ment a success. The IIR also recommends that HCFC and HFC refrigerants, which have a high impact on global warming, are replaced with refrigerants that have a low impact on global warming as soon as possible. Efforts are also needed in containment and recovery, particularly for alternative refrigerants with a significant impact on global warming or presenting a safety risk (flammability, toxicity).
The sector’s indirect emissions (63%) have the strongest impact on the climate. Govern-ments must encourage the use of renewable energy and promote energy efficiency at all levels of the economy, as well as educational programs on the rational use of energy. It remains essential to continue research and development of alternative refrigerants and alternative refrigeration methods to achieve high energy efficiency and cost effectiveness of these novel technologies.
Thanks to its various scientific conferences, publications and international network of experts, the IIR will play a leading role in these initiatives to limit global warming and promote sustainable development.

14
International Institute of Refrigeration - Informatory Note
4. References[1] IIR, COULOMB Didier, DUPONT Jean-Luc, PICHARD Audrey. The Role of Refrigeration in the
Global Economy. 29th Informatory Note on Refrigeration Technologies [online]. 2015. Available on: <http://www.iifiir.org/userfiles/file/publications/notes/NoteTech_29_EN.pdf> (Accessed 13/10/2017)
[2] IIR, HWANG Yunho. Harmonization of Life Cycle Climate Performance Methodology 32nd Informatory Note on Refrigeration Technologies [online]. 2016. Available on: <http://www.iifiir.org/userfiles/file/publications/notes/NoteTech_32_EN.pdf> (Accessed 13/10/2017)
[3] CLARK Ezra, WAGNER Sonja. The Kigali Amendment to the Montreal Protocol: HFC Phase Down. OzonAction Fact Sheet [online]. 2016. Available on: <http://bit.ly/OzonAction-FactSheet-Kigali> (Accessed 13/10/2017)
[4] IIR. Summary sheet on the Montreal Protocol. IIR Summary Sheet [online]. 2017. Available on: <http://bit.ly/IIR-Summary-Montreal-EN> (Accessed 13/10/2017)
[5] IIR. Summary sheet on the Kyoto Protocol. IIR Summary Sheet [online]. 2017. Available on: <http://www.iifiir.org/userfiles/file/webfiles/regulation_files/Kyoto_EN.pdf> (Accessed 13/10/2017)
[6] WMO, UNEP, National OCEANIC AND ATMOSPHERIC ADMINISTRATION, NATIONAL AERONAUTICS AND SPACE ADMINISTRATION, EUROPEAN COMMISSION. Scientific Assessment of Ozone Depletion: 2014 [online]. WMO Global Ozone Reasearch and Monitoring Project - Report No. 56. Geneva, 2014. 92 pages. Available on: <http://bit.ly/WMO-Scientific-Assessment> (Accessed 13/10/2017)
[7] SOLOMON Susan, QIN Dahe, MANNING Martin, et al. Climate Change 2007 - The physical science basis [online]. Contribution of working group I - Fourth assessment report - Frequently asked questions. Geneva, 2007. 43 pages. Available on: <https://www.ipcc.ch/pdf/assessment-report/ar4/wg1/ar4-wg1-faqs.pdf> (Accessed 13/10/2017)
[8] BOUCHER O., HAIGH J., HAUGLUSTAINE D., et al. Climate Change 2001 - The physical science basis [online]. Contribution of working group I - Third assessment report - Radiative forcing. Geneva, 2001. 68 pages. Available on: <http://www.ipcc.ch/ipccreports/tar/wg1/pdf/TAR-06.PDF#page=5>
[9] MYRHE Gunnar, SHINDELL Drew, BRÉON François-Marie, et al. Anthropogenic and natural radiative forcing [online]. In: Climate Change 2013 - The Physical Science Basis. Genève, 2013. Available on: <http://bit.ly/GIEC-Anthropogenic-Natural-Radiative-Forcing> (Accessed 13/10/2017)
[10] MATÉ Janos, KANTER David. The benefits of basing policies on the 20-year GWP of HFCs. In: Greenpeace International website [online]. 2011. Available on: <http://bit.ly/Greenpeace-Benefits-20years-GWP> (Accessed 13/10/2017)
[11] ALLEN Myles. Short-Lived Promise? The Science and Policy of Cumulative and Short-Lived Climate Pollutants. Oxford Martin Policy Paper [online]. 2015. Available on: <http://www.oxford-martin.ox.ac.uk/downloads/briefings/Short_Lived_Promise.pdf> (Accessed 13/10/2017)
[12] TANAKA Katsumasa, O’NEILL Brian, ROKITYANSKIY Dmitry et al. Evaluating global warming potentials with historical temperature. Climatic Change [online]. 2009. Available on: <http://bit.ly/Evaluating-GWP-with-Historical-Temperature> (Accessed 13/10/2017)
[13] FUGLESTVEDT Jan, SHINE Keith, BERNTSEN Terje, et al. Transport impacts on atmos-phere and climate: Metrics. Atmosheric Environment [online]. 2010. Available on: <https://doi.org/10.1016/j.atmosenv.2009.04.044> (Accessed 13/10/2017)
[14] PETERS Glen, AAMAAS Borgar, BERNTSEN Terje, et al. The integrated global temperature change potential (iGTP) and relationships between emission metrics. Environmental Research Letters. [online]. 2011. Available on: <http://bit.ly/IGTM-and-relationships-between-emission-metrics> (Accessed 13/10/2017)
15
International Institute of Refrigeration - Informatory Note
[15] EKHOLM Tommi, LINDROOS Tomi J., SAVOLAINEN Ilkka. Robustness of climate metrics under climate policy ambiguity. Environmental Science & Policy [online]. 2013. Available on: <http://dx.doi.org/10.1016/j.envsci.2013.03.006> (Accessed 13/10/2017)
[16] LEDGARD Stewart, REISINGER Andy. Implications of alternative greenhouse gas metrics for life cycle assessments of livestock food products. In: Proceedings of the 9th International Conference on Life Cycle Assessment in the Agri-Food Sector, October 8-10 2014, San Francisco, California, USA. pp.683-692. [online]. Available on: <http://www.lcafood2014.org/papers/102.pdf> (Accessed 13/10/2017)
[17] WMO, UNEP. IPCC expert meeting on the science of alternative metrics [online]. Meeting Report. Oslo, 2009. 82 pages. Available on: <https://www.ipcc.ch/pdf/supporting-material/expert-meeting-metrics-oslo.pdf> (Accessed 13/10/2017)
[18] KUIJPERS Lambert. The use of the gwp indicator in refrigerant selection. In: Proceedings of the Ammonia Refrigeration Technology Conference, April 14-16 2011, Ohrid, Macedonia. [online]. Available on: <http://bit.ly/Kuijpers-Fridoc-2011-EN> (Accessed 13/10/2017)
[19] RIGBY Matt, PRINN R. G., O’DOHERTY S., et al. Recent and future trends in synthetic green-house gas radiative forcing. Geophysical Researc Letters [online]. 2014. Available on: <http://doi.wiley.com/10.1002/2013GL059099> (Accessed 13/10/2017)
[20] MONTZKA Stephen A., MCFARLAND M., ANDERSEN S. O., et al. Recent trends in global emissions of hydrochlorofluorocarbons and hydrofluorocarbons: reflecting on the 2007 adjust-ments to the Montreal Protocol. Journal of Physical Chemistry A [online]. 2011. Available on: <http://pubs.acs.org/doi/abs/10.1021/jp5097376> (Accessed 13/10/2017)
[21] VELDERS Guus, FAHEY David, DANIEL John, et al. Future atmospheric abundances and cli-mate forcings from scenarios of global and regional hydrofluorocarbon (HFC) emissions. Atmosheric Environment [online]. 2014. Available on: <https://doi.org/10.1016/j.atmosenv.2015.10.071> (Accessed 13/10/2017)
[22] IEA. CO2 emissions from fuel combustion. In: International Energy Agency website [online]. 2016. Available on: <http://bit.ly/IEA-CO2-Emission-Fuel-2016> (Accessed 13/10/2017)
[23] IEA. Key electricity trends electricity summary. In: International Energy Agency website [online]. 2016. Available on: <http://bit.ly/IEA-Electricity-Trends-2016> (Accessed 13/10/2017)
[24] SAUNOIS Marielle, BOUSQUET Philippe, POULTER Ben, et al. The global methane budget 2000-2012. Earth System Science Data [online]. 2016. Available on: <http://www.earth-syst-sci-data.net/8/697/2016/> (Accessed 13/10/2017)
[25] MCCABE David, GEERTSMA Meleah, MATTHEWS Nathan, et al. Waste not - Common sense ways to reduce methane pollution from the oil and natural gas industry. In: NRDC website [online]. 2015. Available on: <https://www.nrdc.org/sites/default/files/ene_14111901b.pdf> (Accessed 13/10/2017)
[26] IEA. World: balances for 2014 in ktoe on a net calorific value basis [online]. IEA Statistic report. Paris, 2014. Available on: <http://bit.ly/IEA-Rapport-2014> (Accessed 13/10/2014)
[27] OICA. Vehicles in Use. In: OICA website [online]. 2015. Available on: < http://www.oica.net/wp-content/uploads//Total_in-use-All-Vehicles.pdf> (Accessed 13/10/2017)
[28] UNFCCC. National Reports. In: UNFCCC website [online]. Available on: <http://unfccc.int/national_reports/items/1408.php> (Accessed 13/10/2017)
[29] LI Zhifang, BIE Pengju, WANG Ziyuan, et al. Estimated HCFC-22 emissions for 1990-2050 in China and the increasing contribution to global emissions. Atmoshere Environment [online]. 2016. Available on: <http://dx.doi.org/10.1016/j.atmosenv.2016.02.038> (Accessed 13/10/2017)

16
International Institute of Refrigeration - Informatory Note
[30] FANG Xuekun, VELDERS Guus, RAVISHANKARA A. R., et al. Hydrofluorocarbon (HFC) Emissions in China: An inventory for 2005-2013 and projections to 2050. Environmental Science & Technology [online]. 2016. Available on: <http://pubs.acs.org/doi/pdf/10.1021/acs.est.5b04376> (Accessed 13/10/2017)
[31] AN XingQing, HENNE Stephan, YAO Bo, et al. Estimating emissions of HCFC-22 and CFC-11 in China by atmospheric observations and inverse modeling. Science China Chemistry [online]. 2012. Available on: <https://link.springer.com/article/10.1007/s11426-012-4624-8> (Accessed 13/10/2017)
[32] FORTEMS-CHEINEY Audrey, SAUNOIS M., PISON I., et al. Increase in HFC-134a emissions in response to the success of the Montreal Protocol. Journal of Geophysical Research Atmospheres [online]. 2015. Available on: <http://onlinelibrary.wiley.com/doi/10.1002/2015JD023741/full> (Accessed 13/10/2017)
[33] SIMMONDS Paul, DERWENT R. G., MANNING A. J., et al. USA Emissions estimates of CH3CHF2, CH2FCF3, CH3CF3 and CH2F2 based on in situ observations at Mace Head. Atmospheric Environment [en ligne]. 2015. Available on: <http://dx.doi.org/10.1016/j.atmosenv.2015.01.010> (Accessed 13/10/2017)
[34] MILLET Dylan, ATLAS Elliot, BLAKE Donald, et al. Halocarbon emissions from the United States and Mexico and their Global Warming Potential. Environmental Science & Technology [online]. 2009. Available on: <http://pubs.acs.org/doi/abs/10.1021/es802146j> (Accessed 13/10/2017)
[35] GRAZIOSI F., ARDUINI J., FURLANI F., et al. European Emissions of the powerful greenhouse gases hydrofluorocarbons inferred from atmospheric measurements and their comparison with annual national reports to UNFCCC. Atmosheric Environment [online]. 2017. Available on: <http://dx.doi.org/10.1016/j.atmosenv.2017.03.029> (Accessed 13/10/2017)
[36] GRAZIOSI F., ARDUINI J., FURLANI F., et al. European emissions of HCFC-22 based on eleven years of high frequency atmospheric measurements and a Bayesian inversion method. Atmospheric Environment [online]. 2015. Available on: <http://dx.doi.org/10.1016/j.atmosenv.2015.04.042> (Accessed 13/10/2017)
[37] MCGRATH Matt. Climate Change: “Monumental” deal to Cut HFCs, fastest growing greenhouse gases. In: BBC website [online]. 2016. Available on: <http://www.bbc.com/news/sci-ence-environment-37665529> (Accessed 13/10/2017)
[38] VIDAL John. Kigali deal on HFCs is big step in fighting climate change. In: Guardian website [online]. 2016. Available on: <https://www.theguardian.com/environment/2016/oct/15/kigali-deal-hfcs-climate-change> (Accessed 13/10/2017)
[39] DONIGER David. Countries adopt Kigali Amendment to phase down HFCs. In: NRDC website [online]. 2016. Available on: <https://www.nrdc.org/experts/david-doniger/countries-adopt-kigali-amendment-phase-down-hfcs> (Accessed 13/10/2017)
[40] UNFCCC. Accord de Paris. In: UNFCC website [online]. 2015. Available on: <http://unfccc.int/resource/docs/2015/cop21/fre/l09f.pdf> (Accessed 13/10/2017)
[41] XU Y., ZAELKE D., VELDERS Guus, et al. The role of HFCs in mitigating 21st century climate change. Atmosphere Chemistry and Physics [online]. 2013. Available on: <https://www.atmos-chem-phys.net/13/6083/2013> (Accessed 13/10/2017)
[42] VELDERS Guus, FAHEY D. W., DANIEL J. S., et al. The large contribution of projected HFC emissions to future climate forcing. Proceedings of the National Academy of Science [online]. 2009. Available on: <https://www.ncbi.nlm.nih.gov/pmc/articles/PMC2700150> (Accessed 13/10/2017)

17
International Institute of Refrigeration - Informatory Note
[43] ROGELJ Joeri, SCHAEFFER Michiel, MEINSHAUSEN Malte, et al. Disentangling the effects of CO2 and short-lived climate forcer mitigation. Proceedings of the National Academy of Science [online]. 2014 Available on: <https://www.ncbi.nlm.nih.gov/pmc/articles/PMC4246330> (Accessed 13/10/2017)
[44] DOYLE Alister. Benefits of greenhouse gas pact may fall short of high hopes. In: Reuters website [en ligne]. 2016. Available on: <http://www.reuters.com/article/us-un-climatechange-idUSK-BN12G0FN> (Accessed 13/10/2017)
[45] GSCHREY Barbara, SCHWARZ Winfried, ELSNER Cornelia. Global projection of F-gas emis-sions shows high increase until 2050. Greenhouse Gas Measurement and Management [online]. 2009. Available on: < http://bit.ly/Gschrey2011> (Accessed 13/10/2017)
[46] IIF, KAUFFELD Michael. Frigorigènes alternatifs : les options actuelles sur le long terme et leurs applications. 31e Note d’Information sur les technologies du froid. [online]. 2016. Available on: <http://www.iifiir.org/userfiles/file/publications/notes/NoteTech_31_FR.pdf> (Accessed 13/10/2017)
[47] KUIJPERS Lambert. HFC phase-down schedules under the “Kigali” amended Montreal Protocol ; potential impacts to the choice of alternatives. In: Proceedings of the 7th Conference on Ammonia and CO2 Refrigeration Technology, May 11-13 2017, Ohrid, Macedonia. [online]. Available on <http://bit.ly/Fridoc-Kuijpers-2017-EN>
[48] BOWERMAN Niel, FRAME David, HUTINGFORD Chris, et al. The role of short-lived climate pollutants in meeting temperature goals. Nature Climate Change [online] 2013. Available on <http://dx.doi.org/10.1038/nclimate2034> (Accessed 13/10/2017)