Embed Size (px)
Citation preview

3303_Cvr.indd 1 4/9/19 1:09 PM

The cover was printed on French Paper Kraft-tone Cover.Responsibly produced using Hydro Electric power from 100% post-consumer waste.
3303_Cvr.indd 2 4/10/19 2:43 PM

To explore key stories of the past year and find out what’s ahead, visit Target.com/abullseyeview. You can view our Annual Report online at Target.com/annualreport.
(Note: Reflects amounts attributable to continuing operations. 2017 was a 53-week year.)
Welcome to our2018 Annual Report
Financial Highlights
Total 2018 Sales: $74,433 Million
Hardlines
17%
Total RevenueIn Millions
’13 ’14 ’15 ’16 ’17 ’18
2018 Growth: 3.6%Five-year CAGR: 1.1%
$71,
279
$72,
618
$74,
494
$70,
271
$72,
714
$75,
356
Operating IncomeIn Millions
’13 ’14 ’15 ’16 ’17 ’18
2018 Growth: -2.7%Five-year CAGR: -3.0%
$4,
779
$4,
535
$4,
878
$4,
864
$4,
224
$4,
110
Net EarningsIn Millions
’13 ’14 ’15 ’16 ’17 ’18
2018 Growth: 0.8%Five-year CAGR: 1.7%
$2,6
94
$2,4
49
$3,3
21
$2,6
66
$2,9
08
$2,9
30
Diluted EPS
’13 ’14 ’15 ’16 ’17 ’18
2018 Growth: 4.0%Five-year CAGR: 5.5%
$4.2
0
$3.8
3
$5.2
5
$4.5
8
$5.2
9
$5.5
0
Home Furnishings& Décor
19%
Apparel &Accessories
20%
Food & Beverage
20%
Beauty & HouseholdEssentials
24%


Brian Cornell, Chairman and CEO
Target 2018 Annual Report
Two years ago, we laid out an ambitious investment agenda to transform our company – by reimagining our stores, reinventing our supply chain and fulfillment capabilities, repositioning our owned brand portfolio and investing in our team. And as I look back on our performance in 2018, I could not be more proud of all that our team accomplished.
In 2018, comparable sales rose an industry-leading 5 percent, driven entirely by growth in traffic. We gained market share in every major category. And we established a record high for our earnings per share.
Today, I can say with great confidence that the strategy we laid out two years ago is working. Our guests love what they see. And in this intensely competitive landscape, Target is right where we want to be: among the top performers in the industry.
But, anyone who follows retail knows that we operate in an incredibly dynamic marketplace. So if we want to stay on top as a brand our guests love, shop and admire, we know we have more work to do. Rest assured, our team understands that better than anyone. Our goal isn’t to deliver only incremental gains or to string together a couple of strong quarters. Our goal is to build a better company, powered by a durable and defensible business model that delivers strong, profitable growth for years to come.
As we look to the future, that means you can expect Target to keep investing and growing.
Last year, we said we wanted to become America’s easiest place to shop. And our team delivered, as Target became the first retailer to offer same-day and Drive Up fulfillment capabilities coast-to-coast. In the year ahead, we’ll continue to invest and expand our network, focusing on elevating our service experience and driving greater adoption among our guests.
In the last two years, we remodeled more than 400 stores, and we’re on track to deliver 600 additional remodels by the end of 2020. And, we’re still thoughtfully adding to our store footprint. In 2018, we opened more than two dozen small-format stores. This year, we’re planning to add nearly 30 more – zeroing in on high-traffic urban locations and college campuses.
Last year, we undertook an ambitious redesign of our stores-operating model – redefining thousands of roles to deliver better guest service. We raised our minimum wage for U.S. team members to $12 an hour. And we raised it again in early 2019 – to $13 – as we move toward our commitment to a minimum $15 an hour by the end of 2020.
Digital channels continue to play a key role in our overall sales growth. In 2018, comparable digital sales grew 36 percent, capping the fifth-straight year in which our digital growth has topped 25 percent. Today, Target’s digital performance is delivering more than $5 billion in annual sales – and driving additional growth across the business. In the year ahead, you can expect that we’ll keep investing in digital capabilities – from artificial intelligence to virtual reality – that will elevate the shopping experience and give our guests new reasons to choose Target.
Finally, when we introduced our investment agenda at the beginning of 2017, we said we’d deliver more than a dozen new brands in 18 months. As of today, we’ve more than doubled that number, and our team is still going strong. Recently, Fast Company named Target one of the world’s most innovative companies, specifically for our brand work. In 2019, Target will deliver a steady stream of newness and exclusives across our assortment as we continue to launch brands and introduce new partnerships.
Taken together, we expect these initiatives will power a financial model that is designed to consistently generate low-single digit sales growth, mid-single digit growth in operating income, and high-single digit growth in earnings per share. This financial model is also designed to generate strong cash flow and return on invested capital that will not only sustain, but fuel our performance in the years ahead.
So as we move into 2019, we aren’t slowing down our efforts to adapt, create, innovate and inspire. I want to thank our teams in stores and property management, in merchandising, in supply chain, in marketing and communications; our product designers and sourcing experts; our data scientists, digital and technology teams; our teams in finance, strategy, legal and HR – everyone across Target. This is the team that will continue serving our guests, creating value for our shareholders and leading this industry for many years to come.

Financial Summary 20182017 2016 2015
2014 (b)
FINANCIAL RESULTS (in millions)
Sales (c) $ 74,433 $ 71,786 $ 69,414 $ 73,717 $ 72,618
Other revenue 923 928 857 777 —
Total revenue 75,356 72,714 70,271 74,494 72,618
Cost of sales 53,299 51,125 49,145 52,241 51,506
Selling, general and administrative expenses (SG&A) 15,723 15,140 14,217 15,406 14,676
Depreciation and amortization (exclusive of depreciation included in cost of sales) 2,224 2,225 2,045 1,969 1,901
Operating income 4,110 4,224 4,864 4,878 4,535
Net interest expense (d) 461 653 991 607 882
Net other (income) / expense (e) (27) (59) (88) (652) —
Earnings from continuing operations before income taxes 3,676 3,630 3,961 4,923 3,653
Provision for income taxes (f) 746 722 1,295 1,602 1,204
Net earnings from continuing operations 2,930 2,908 2,666 3,321 2,449
Discontinued operations, net of tax 7 6 68 42 (4,085)
Net earnings / (loss) $ 2,937 $ 2,914 $ 2,734 $ 3,363 $ (1,636)
PER SHARE
Basic earnings / (loss) per share
Continuing operations $ 5.54 $ 5.32 $ 4.61 $ 5.29 3.86
Discontinued operations 0.01 0.01 0.12 0.07 (6.44)
Net earnings / (loss) per share $ 5.55 $ 5.32 $ 4.73 $ 5.35 $ (2.58)
Diluted earnings / (loss) per share
Continuing operations $ 5.50 $ 5.29 $ 4.58 $ 5.25 $ 3.83
Discontinued operations 0.01 0.01 0.12 0.07 (6.38)
Net earnings / (loss) per share $ 5.51 $ 5.29 $ 4.69 $ 5.31 $ (2.56)
Cash dividends declared $ 2.54 $ 2.46 $ 2.36 $ 2.20 $ 1.99
FINANCIAL POSITION (in millions)
Total assets $ 41,290 $ 40,303 $ 38,724 $ 40,262 $ 41,172
Capital expenditures (g) $ 3,516 $ 2,533 $ 1,547 $ 1,438 $ 1,786
Long-term debt, including current portion (g) $ 11,275 $ 11,398 $ 12,591 $ 12,760 $ 12,725
Net debt (g)(h) $ 10,506 $ 10,267 $ 11,481 $ 9,752 $ 11,205
Shareholders’ investment $ 11,297 $ 11,651 $ 10,915 $ 12,957 $ 13,997
FINANCIAL RATIOS (g)
Comparable sales growth (i) 5.0% 1.3% (0.5 )% 2.1% 1.3%
Gross margin (% of sales) 28.4% 28.8% 29.2 % 29.1% 29.1%
SG&A (% of total revenue) 20.9% 20.8% 20.2 % 20.7% 20.0%
Operating income margin (% of total revenue) 5.5% 5.8% 6.9 % 6.5% 6.2%
OTHER
Common shares outstanding (in millions) 517.8 541.7 556.2 602.2 640.2
Operating cash flow provided by continuing operations (in millions) $ 5,970 $ 6,861 $ 5,337 $ 5,254 $ 5,157
Revenue per square foot (g)(j) $ 314 $ 298 $ 293 $ 310 $ 302
Retail square feet (in thousands) (g) 239,581 239,355 239,502 239,539 239,963
Square footage growth (g) 0.1% (0.1)% — % (0.2)% — %
Total number of stores (g) 1,844 1,822 1,802 1,792 1,790
Total number of distribution centers (g) 40 41 40 40 38
(a) Consisted of 53 weeks.(b) The financial summary data for fiscal years 2017, 2016, and 2015 reflect the adoption of Accounting Standards Update (ASU) No. 2014-09—Revenue from Contracts with Customers (Topic
606). The financial summary data for fiscal years 2017 and 2016 reflect the adoption of Accounting Standards Update (ASU) No. 2016-02—Leases (Topic 842). The financial summary data for fiscal year 2015 does not reflect adoption of Topic 842 and the financial summary data for fiscal 2014 does not reflect adoption of Topic 606 and Topic 842. Note 2 to the Consolidated Financial Statements in Form 10-K, Item 8, provides additional information.
(c) The 2016 sales decline is primarily due to the December 2015 sale of our pharmacy and clinic businesses (Pharmacy Transaction) to CVS Pharmacy, Inc. 2015 and 2014 sales include $3,815 million and $4,148 million, respectively, related to our former pharmacy and clinic businesses.
(d) Includes losses on early retirement of debt of $123 million, $422 million, and $285 million for 2017, 2016, and 2014, respectively.(e) For 2015, includes the gain on the sale of our pharmacy and clinic businesses.(f) For 2018 and 2017, includes $36 million and $343 million, respectively, of discrete tax benefits related to the Tax Cuts and Jobs Act enacted in December 2017.(g) Represents amounts attributable to continuing operations.(h) Including current portion of long-term debt and other borrowings, net of short-term investments of $769 million, $1,131 million, $1,110 million, $3,008 million, and $1,520 million in 2018, 2017,
2016, 2015, and 2014, respectively. Management believes this measure is an indicator of our level of financial leverage because short-term investments are available to pay debt maturity obligations. For 2017 and earlier, only short-term investments held by U.S. entities were used to calculate net debt because amounts held by entities located outside the U.S. were restricted for use.
(i) See definition of comparable sales in Form 10-K, Item 7, Management’s Discussion and Analysis of Financial Condition and Results of Operations.(j) Represents revenue per square foot which is calculated using rolling four quarters average square feet. In 2017, revenue per square foot was calculated excluding the 53rd week in order to
provide a more useful comparison to other years. Using total reported revenue for 2017 (including the 53rd week) resulted in revenue per square foot of $303. The 2016 decrease is primarily due to the Pharmacy Transaction. Our former pharmacy and clinic businesses contributed approximately $16 to 2015 revenue per square foot. Revenue per square foot for 2014 does not include profit sharing under our credit card program agreement which was classified as a reduction of SG&A expenses prior to adoption of Topic 606.
Target 2018 Annual Report
as adjusted (a)(b) as adjusted (b) as adjusted (b)

UNITED STATESSECURITIES AND EXCHANGE COMMISSION
Washington, D.C. 20549FORM 10-K
(Mark One)ANNUAL REPORT PURSUANT TO SECTION 13 OR 15(d) OF THE SECURITIES EXCHANGE ACT OF 1934
For the fiscal year ended February 2, 2019OR
TRANSITION REPORT PURSUANT TO SECTION 13 OR 15(d) OF THE SECURITIES EXCHANGE ACT OF 1934For the transition period from to
Commission file number 1-6049
TARGET CORPORATION(Exact name of registrant as specified in its charter)
Minnesota(State or other jurisdiction ofincorporation or organization)
41-0215170(I.R.S. EmployerIdentification No.)
1000 Nicollet Mall, Minneapolis, Minnesota(Address of principal executive offices)
55403(Zip Code)
Registrant's telephone number, including area code: 612/304-6073Securities Registered Pursuant To Section 12(B) Of The Act:
Title of Each Class Name of Each Exchange on Which RegisteredCommon Stock, par value $0.0833 per share New York Stock Exchange
Securities registered pursuant to Section 12(g) of the Act: None
Indicate by check mark if the registrant is a well-known seasoned issuer, as defined in Rule 405 of the Securities Act. Yes No Indicate by check mark if the registrant is not required to file reports pursuant to Section 13 or Section 15(d) of the Act. Yes No Note – Checking the box above will not relieve any registrant required to file reports pursuant to Section 13 or 15(d) of the Exchange Act from their obligations under those Sections.Indicate by check mark whether the registrant (1) has filed all reports required to be filed by Section 13 or 15(d) of the Securities Exchange Act of 1934 during the preceding 12 months (or for such shorter period that the registrant was required to file such reports), and (2) has been subject to such filing requirements for the past 90 days. Yes No Indicate by check mark whether the registrant has submitted electronically every Interactive Data File required to be submitted pursuant to Rule 405 of Regulation S-T (§232.405 of this chapter) during the preceding 12 months (or for such shorter period that the registrant was required to submit such files). Yes No Indicate by check mark if disclosure of delinquent filers pursuant to Item 405 of Regulation S-K (§229.405 of this chapter) is not contained herein, and will not be contained, to the best of registrant's knowledge, in definitive proxy or information statements incorporated by reference in Part III of this Form 10-K or any amendment to this Form 10-K. Indicate by check mark whether the registrant is a large accelerated filer, an accelerated filer, a non-accelerated filer, smaller reporting company, or an emerging growth company (as defined in Rule 12b-2 of the Exchange Act).
Large accelerated filer Accelerated filer Non-accelerated filer Smaller reporting company Emerging growth company
If an emerging growth company, indicate by check mark if the registrant has elected not to use the extended transition period for complying with any new or revised financial accounting standards provided pursuant to Section 13(a) of the Exchange Act.
Indicate by check mark whether the registrant is a shell company (as defined in Rule 12b-2 of the Act). Yes No The aggregate market value of the voting stock held by non-affiliates of the registrant as of August 4, 2018, was $42,763,636,334 based on the closing price of $81.45 per share of Common Stock as reported on the New York Stock Exchange Composite Index.Indicate the number of shares outstanding of each of registrant's classes of Common Stock, as of the latest practicable date. Total shares of Common Stock, par value $0.0833, outstanding at March 7, 2019, were 516,333,213.
DOCUMENTS INCORPORATED BY REFERENCEPortions of Target's Proxy Statement for the Annual Meeting of Shareholders to be held on June 12, 2019, are incorporated into Part III.

1
TABLE OF CONTENTS
PART IItem 1 BusinessItem 1A Risk FactorsItem 1B Unresolved Staff CommentsItem 2 PropertiesItem 3 Legal ProceedingsItem 4 Mine Safety DisclosuresItem 4A Executive Officers
PART IIItem 5 Market for Registrant's Common Equity, Related Stockholder Matters and Issuer
Purchases of Equity SecuritiesItem 6 Selected Financial DataItem 7 Management's Discussion and Analysis of Financial Condition and Results of
OperationsItem 7A Quantitative and Qualitative Disclosures About Market RiskItem 8 Financial Statements and Supplementary DataItem 9 Changes in and Disagreements with Accountants on Accounting and Financial
DisclosureItem 9A Controls and ProceduresItem 9B Other Information
PART IIIItem 10 Directors, Executive Officers and Corporate GovernanceItem 11 Executive CompensationItem 12 Security Ownership of Certain Beneficial Owners and Management and
Related Stockholder MattersItem 13 Certain Relationships and Related Transactions, and Director IndependenceItem 14 Principal Accountant Fees and Services
PART IVItem 15 Exhibits, Financial Statement Schedules
Signatures
25
1011121213
1416
173132
646464
6565
656565
6670

2
PART IItem 1. Business
General
Target Corporation (Target, the Corporation or the Company) was incorporated in Minnesota in 1902. We offer our customers, referred to as "guests," everyday essentials and fashionable, differentiated merchandise at discounted prices. Our ability to deliver a preferred shopping experience to our guests is supported by our supply chain and technology, our devotion to innovation, our loyalty offerings and suite of fulfillment options, and our disciplined approach to managing our business and investing in future growth. We operate as a single segment designed to enable guests to purchase products seamlessly in stores or through our digital channels. Since 1946, we have given 5 percent of our profit to communities.
Financial Highlights
For information on key financial highlights, see Item 6, Selected Financial Data, and Item 7, Management's Discussion and Analysis of Financial Condition and Results of Operations (MD&A).
Seasonality
A larger share of annual revenues and earnings traditionally occurs in the fourth quarter because it includes the November and December holiday sales period.
Merchandise
We sell a wide assortment of general merchandise and food. The majority of our general merchandise stores offer an edited food assortment, including perishables, dry grocery, dairy, and frozen items. Nearly all of our stores larger than 170,000 square feet offer a full line of food items comparable to traditional supermarkets. Our small format stores, generally smaller than 50,000 square feet, offer curated general merchandise and food assortments. Our digital channels include a wide merchandise assortment, including many items found in our stores, along with a complementary assortment.
A significant portion of our sales is from national brand merchandise. Approximately one-third of 2018 sales is related to our owned and exclusive brands, including but not limited to the following:
Owned BrandsA New Day™ JoyLab™ Smartly™Archer Farms® Knox Rose™ Smith & Hawken®Art Class™ Kona Sol™ Sonia Kashuk®Ava & Viv® Made By Design™ Spritz™Boots & Barkley® Market Pantry® Sutton & Dodge®Bullseye's Playground™ Opalhouse™ Threshold™Cat & Jack™ Original Use™ Universal Thread™Cloud Island™ Pillowfort™ up & up®Embark® Prologue™ Who What Wear™Gilligan & O'Malley® Project 62™ Wild Fable™Goodfellow & Co.™ Room Essentials® Wine Cube®heyday™ Shade & Shore™ Wondershop™Hyde & Eek! Boutique™ Simply Balanced™ Xhilaration®
Exclusive BrandsC9 by Champion® Hand Made Modern® Kid Made Modern®DENIZEN® from Levi's® Hearth & Hand™ with Magnolia Nate Berkus™ for TargetFieldcrest® Isabel Maternity™ by Ingrid & Isabel® Oh Joy!® for TargetGenuine Kids® from OshKosh® Just One You® made by carter's® Umbro™ for Target

3
We also sell merchandise through periodic exclusive design and creative partnerships and generate revenue from in-store amenities such as Target Café and leased or licensed departments such as Target Optical, Starbucks, and other food service offerings. CVS Pharmacy, Inc. (CVS) operates pharmacies and clinics in our stores under a perpetual operating agreement from which we generate annual occupancy income.
Distribution
The vast majority of merchandise is distributed to our stores through our network of 40 distribution centers. Common carriers ship general merchandise to and from our distribution centers. Vendors or third party distributors ship certain food items and other merchandise directly to our stores. Merchandise sold through our digital channels is distributed to our guests via common carriers (from stores, distribution centers, vendors, and third party distributors), delivery via our wholly-owned subsidiary, Shipt, Inc. (Shipt), and through guest pick-up at our stores. Using our stores as fulfillment points allows improved product availability and delivery times and also reduces shipping costs.
Employees
At February 2, 2019, we employed approximately 360,000 full-time, part-time and seasonal employees, referred to as "team members." Because of the seasonal nature of the retail business, employment levels peak in the holiday season. We offer a broad range of company-paid benefits to our team members. Eligibility for and the level of benefits vary depending on team members' full-time or part-time status, compensation level, date of hire, and/or length of service. Company-paid benefits include a 401(k) plan, medical and dental plans, disability insurance, paid vacation, tuition reimbursement, various team member assistance programs, life insurance, a pension plan (closed to new participants, with limited exceptions), and merchandise and other discounts. We believe our team member relations are good.
Working Capital
Effective inventory management is key to our ongoing success, and we use various techniques including demand forecasting and planning and various forms of replenishment management. We achieve effective inventory management by staying in-stock in core product offerings, maintaining positive vendor relationships, and carefully planning inventory levels for seasonal and apparel items to minimize markdowns.
The Liquidity and Capital Resources section in MD&A provides additional details.
Competition
We compete with traditional and internet retailers, including off-price general merchandise retailers, apparel retailers, wholesale clubs, category specific retailers, drug stores, supermarkets, and other forms of retail commerce. Our ability to positively differentiate ourselves from other retailers and provide compelling value to our guests largely determines our competitive position within the retail industry.
Intellectual Property
Our brand image is a critical element of our business strategy. Our principal trademarks, including Target, SuperTarget and our "Bullseye Design," have been registered with the United States (U.S.) Patent and Trademark Office. We also seek to obtain and preserve intellectual property protection for our owned brands.
Geographic Information
Nearly all of our revenues are generated within the U.S. The vast majority of our property and equipment is located within the U.S.

4
Available Information
Our Annual Report on Form 10-K, quarterly reports on Form 10-Q, current reports on Form 8-K, and amendments to those reports filed or furnished pursuant to Section 13(a) or 15(d) of the Exchange Act are available free of charge at investors.target.com as soon as reasonably practicable after we file such material with, or furnish it to, the U.S. Securities and Exchange Commission (SEC). Our Corporate Governance Guidelines, Code of Ethics, Corporate Responsibility Report, and the charters for the committees of our Board of Directors are also available free of charge in print upon request or at investors.target.com.

5
Item 1A. Risk Factors Our business is subject to many risks. Set forth below are the material risks we face. Risks are listed in the categories where they primarily apply, but other categories may also apply.
Competitive and Reputational Risks
Our continued success is dependent on positive perceptions of Target which, if eroded, could adversely affect our business and our relationships with our guests and team members.
We believe that one of the reasons our guests prefer to shop at Target, our team members choose Target as a place of employment, and our vendors choose to do business with us is the reputation we have built over many years for serving our four primary constituencies: guests, team members, shareholders, and the communities in which we operate. To be successful in the future, we must continue to preserve Target's reputation. Reputational value is based in large part on perceptions, and broad access to social media makes it easy for anyone to provide public feedback that can influence perceptions of Target. It may be difficult to control negative publicity, regardless of whether it is accurate. Target’s position or perceived lack of position on social, environmental, public policy or other sensitive issues, and any perceived lack of transparency about those matters, could harm our reputation with certain groups or guests. While reputations may take decades to build, negative incidents can quickly erode trust and confidence and can result in consumer boycotts, governmental investigations, or litigation. In addition, vendors and others with whom we do business may affect our reputation. For example, CVS operates clinics and pharmacies within our stores, and our guests’ perceptions of and experiences with CVS may affect our reputation. Negative reputational incidents could adversely affect our business through lost sales, loss of new store and development opportunities, or team member retention and recruiting difficulties.
If we are unable to positively differentiate ourselves from other retailers, our results of operations could be adversely affected.
In the past, we have been able to compete successfully by differentiating our guests’ shopping experience through a careful combination of price, merchandise assortment, store environment, convenience, guest service, loyalty programs, and marketing efforts. Guest perceptions regarding the cleanliness and safety of our stores, the functionality, reliability, and speed of our digital channels and fulfillment options, our in-stock levels, and the value of our promotions are among the factors that affect our ability to compete. In addition, our ability to create a personalized guest experience through the collection and use of accurate and relevant guest data is important to our ability to differentiate from other retailers. No single competitive factor is dominant, and actions by our competitors on any of these factors or the failure of our strategies could adversely affect our sales, gross margins, and expenses.
Our owned and exclusive brand products help differentiate us from other retailers, generally carry higher margins than equivalent national brand products and represent a significant portion of our overall sales. If we are unable to successfully develop, support, and evolve our owned and exclusive brands, if one or more of these brands experiences a loss of consumer acceptance or confidence, or if we are unable to successfully protect our intellectual property rights, our sales and gross margins could be adversely affected.
The retail industry's continuing migration to digital channels has affected the ways we differentiate ourselves from other retailers. In particular, consumers are able to quickly and conveniently comparison shop and determine real-time product availability using digital tools, which can lead to decisions based solely on price or the functionality of the digital tools. Consumers may also use third-party channels or devices, such as voice assistants and smart home devices, to initiate shopping searches and place orders, which could sometimes make us dependent on the capabilities and search algorithms of those third parties to reach those consumers. Any difficulties in executing our differentiation efforts, actions by our competitors in response to these efforts, or failures by vendors in managing their own channels, content and technology systems to support these efforts could adversely affect our sales, gross margins, and expenses.

6
If we are unable to successfully provide a relevant and reliable experience for our guests across multiple channels, our sales, results of operations and reputation could be adversely affected.
Our business has evolved from an in-store experience to interaction with guests across multiple channels (in-store, online, mobile, social media, voice assistants, and smart home devices, among others). Our guests are using those channels to shop with us and provide feedback and public commentary about our business. We must anticipate and meet changing guest expectations and counteract developments and investments by our competitors. Our evolving retailing efforts include implementing technology, software and processes to be able to conveniently and cost-effectively fulfill guest orders directly from any point within our system of stores and distribution centers and from our vendors. We also need to collect accurate, relevant, and usable guest data to personalize our offerings. Providing flexible fulfillment options and implementing new technology is complex and may not meet expectations for accurate order fulfillment, faster and guaranteed delivery times, low-price or free shipping, and desired payment methods. Even when we are successful in meeting expectations for fulfillment, if we are unable to offset increased costs of fulfilling orders outside of our traditional in-store channel with efficiencies, cost-savings or expense reductions, our results of operations could be adversely affected.
If we do not anticipate and respond quickly to changing consumer preferences, our sales and profitability could suffer.
A large part of our business is dependent on our ability to make trend right decisions and effectively manage our inventory in a broad range of merchandise categories, including apparel, accessories, home décor, electronics, toys, seasonal offerings, food, and other merchandise. If we do not obtain accurate and relevant data on guest preferences, predict changing consumer tastes, preferences, spending patterns and other lifestyle decisions, emphasize the correct categories, implement competitive and effective pricing and promotion strategies, or personalize our offerings to our guests, we may experience lost sales, spoilage, and increased inventory markdowns, which could adversely affect our results of operations by reducing our profitability.
Investments and Infrastructure Risks
If our capital investments in remodeling existing stores, building new stores, and improving technology and supply chain infrastructure do not achieve appropriate returns, our competitive position, financial condition and results of operations could be adversely affected.
Our business depends, in part, on our ability to remodel existing stores and build new stores in a manner that achieves appropriate returns on our capital investment. Our current store remodel program is larger than historic levels and is being implemented using a custom approach based on the condition of each store and characteristics of the surrounding neighborhood. When building new stores, we compete with other retailers and businesses for suitable locations for our stores. Many of our expected new store sites are smaller, non-standard footprints located in fully developed markets, which require changes to our supply chain practices and are generally more time-consuming, expensive and uncertain undertakings than expansion into undeveloped suburban and ex-urban markets. Pursuing the wrong remodel or new store opportunities and any delays, cost increases, disruptions or other uncertainties related to those opportunities could adversely affect our results of operations.
We are currently making, and expect to continue to make, significant investments in technology and selective acquisitions to improve guest experiences across multiple channels and improve our supply chain and inventory management systems. The effectiveness of these investments can be less predictable than remodeling stores, and might not provide the anticipated benefits or desired rates of return. In addition, if we are unable to successfully protect any intellectual property rights resulting from our investments, the value received from those investments may be eroded, which could adversely affect our financial condition.
Pursuing the wrong investment opportunities, being unable to make new concepts scalable, making an investment commitment significantly above or below our needs, or failing to effectively incorporate acquired businesses into our business could result in the loss of our competitive position and adversely affect our financial condition or results of operations.

7
A significant disruption in our computer systems and our inability to adequately maintain and update those systems could adversely affect our operations and negatively affect our guests.
We rely extensively on our computer systems to manage and account for inventory, process guest transactions, manage and maintain the privacy of guest data, communicate with our vendors and other third parties, service Target-branded credit and debit card accounts, and summarize and analyze results. We also rely on continued and unimpeded access to the Internet to use our computer systems. Our systems are subject to damage or interruption from power outages, telecommunications failures, computer viruses, malicious attacks, security breaches, and catastrophic events. If our systems are damaged or fail to function properly or reliably, we may incur substantial repair or replacement costs, experience data loss or theft and impediments to our ability to manage inventories or process guest transactions, and encounter lost guest confidence, which could require additional promotional activities to attract guests and otherwise adversely affect our results of operations.
We continually invest to maintain and update our computer systems. Implementing significant system changes increases the risk of computer system disruption. The potential problems and interruptions associated with implementing technology initiatives, as well as providing training and support for those initiatives, could disrupt or reduce our operational efficiency, and could negatively impact guest experience and guest confidence.
Data Security and Privacy Risks
If our efforts to provide information security are unsuccessful or if we are unable to meet increasingly demanding regulatory requirements, we may face additional costly government enforcement actions and private litigation, and our reputation and results of operations could suffer.
We regularly receive and store information about our guests, team members, vendors and other third parties. We have programs in place to detect, contain, and respond to data security incidents. However, because the techniques used to obtain unauthorized access, disable or degrade service, or sabotage systems change frequently and may be difficult to detect for long periods of time, we may be unable to anticipate these techniques or implement adequate preventive measures. In addition, hardware, software, or applications we develop or procure from third parties may contain defects in design or manufacture or other problems that could unexpectedly compromise information security. Unauthorized parties may also attempt to gain access to our systems or facilities, or those of third parties with whom we do business, through fraud, trickery, or other forms of deceiving our team members, contractors, and vendors.
Prior to 2013, all data security incidents we encountered were insignificant. Our 2013 data breach was significant and went undetected for several weeks. Both we and our vendors have had data security incidents since the 2013 data breach; however, to date these other incidents have not been material to our results of operations. Based on the prominence and notoriety of the 2013 data breach, even minor additional data security incidents could draw greater scrutiny. If we, our vendors, or other third parties with whom we do business experience additional significant data security incidents or fail to detect and appropriately respond to significant incidents, we could be exposed to additional government enforcement actions and private litigation. In addition, our guests could lose confidence in our ability to protect their information, discontinue using our REDcards or loyalty programs, or stop shopping with us altogether, which could adversely affect our sales, reputation and results of operations.
The legal and regulatory environment regarding information security, cybersecurity, and privacy is increasingly demanding and has enhanced requirements for handling personal data. Complying with new data protection requirements may cause us to incur substantial costs, require changes to our business practices, limit our ability to obtain data used to provide a differentiated guest experience, and expose us to further litigation and regulatory risks, each of which could adversely affect our results of operations.
Supply Chain and Third Party Risks
Changes in our relationships with our vendors, changes in tax or trade policy, interruptions in our supply chain or increased commodity or supply chain costs could adversely affect our results of operations.
We are dependent on our vendors to supply merchandise to our distribution centers, stores, and guests. As we continue to add capabilities, operating our fulfillment network becomes more complex and challenging. If our fulfillment network does not operate properly or if a vendor fails to deliver on its commitments, we could experience merchandise out-of-stocks, delivery delays or increased delivery costs, which could lead to lost sales and decreased guest confidence, and adversely affect our results of operations.

8
A large portion of our merchandise is sourced, directly or indirectly, from outside the U.S., with China as our single largest source, so any major changes in tax or trade policy, such as the imposition of additional tariffs or duties on imported products, could require us to take certain actions, such as raising prices on products we sell, which could adversely affect our results of operations.
Political or financial instability, currency fluctuations, the outbreak of pandemics, labor unrest, transport capacity and costs, port security, weather conditions, natural disasters or other events that could slow or disrupt port activities and affect foreign trade are beyond our control and could materially disrupt our supply of merchandise, increase our costs, and/or adversely affect our results of operations. There have been periodic labor disputes impacting the U.S. ports that have caused us to make alternative arrangements to continue the flow of inventory, and if these types of disputes recur, worsen, or occur in other countries through which we source products, it may have a material impact on our costs or inventory supply. Changes in the costs of procuring commodities used in our merchandise or the costs related to our supply chain, could adversely affect our results of operations.
A disruption in relationships with third party service providers could adversely affect our operations.
We rely on third parties to support our business, including portions of our technology infrastructure, development and support, our digital platforms and fulfillment operations, credit and debit card transaction processing, extensions of credit for our 5% REDcard Rewards loyalty program, the clinics and pharmacies operated by CVS within our stores, the infrastructure supporting our guest contact centers, aspects of our food offerings, and delivery services. If we are unable to contract with third parties having the specialized skills needed to support those strategies or integrate their products and services with our business, or if they fail to meet our performance standards and expectations, then our reputation and results of operations could be adversely affected. For example, if our guests unfavorably view CVS’s operations, our ability to discontinue the relationship is limited and our results of operations could be adversely affected.
Legal, Regulatory, Global and Other External Risks
Our earnings depend on the state of macroeconomic conditions and consumer confidence in the U.S.
Nearly all of our sales are in the U.S., making our results highly dependent on U.S. consumer confidence and the health of the U.S. economy. In addition, a significant portion of our total sales is derived from stores located in five states: California, Texas, Florida, Minnesota and Illinois, resulting in further dependence on local economic conditions in these states. Deterioration in macroeconomic conditions or consumer confidence could negatively affect our business in many ways, including slowing sales growth, reducing overall sales, and reducing gross margins.
These same considerations impact the success of our credit card program. Although we no longer own a consumer credit card receivables portfolio, we share in the profits generated by the credit card program with TD Bank Group (TD), which owns the receivables generated by our proprietary credit cards. Deterioration in macroeconomic conditions or changes in consumer preferences concerning our credit card program could adversely affect the volume of new credit accounts, the amount of credit card program balances, and the ability of credit card holders to pay their balances. These conditions could result in us receiving lower profit sharing payments.
Uncharacteristic or significant weather conditions, alone or together with natural disasters, could adversely affect our operations.
Uncharacteristic or significant weather conditions can affect consumer shopping patterns, particularly in apparel and seasonal items, which could lead to lost sales or greater than expected markdowns and adversely affect our short-term results of operations. In addition, our three largest states by total sales are California, Texas and Florida, areas where natural disasters are more prevalent. Natural disasters in those states or in other areas where our sales are concentrated could result in significant physical damage to or closure of one or more of our stores, distribution centers or key vendors, and cause delays in the distribution of merchandise from our vendors to our distribution centers, stores, and guests, which could adversely affect our results of operations by increasing our costs and lowering our sales.
9
We rely on a large, global and changing workforce of team members, contractors and temporary staffing. If we do not effectively manage our workforce and the concentration of work in certain global locations, our labor costs and results of operations could be adversely affected.
With over 300,000 team members, our workforce costs represent our largest operating expense, and our business is dependent on our ability to attract, train, and retain the appropriate mix of qualified team members, contractors, and temporary staffing and effectively organize and manage those resources as our business and strategic priorities change. Many team members are in entry-level or part-time positions with historically high turnover rates. Our ability to meet our changing labor needs while controlling our costs is subject to external factors such as labor laws and regulations, unemployment levels, prevailing wage rates, benefit costs, changing demographics, and our reputation and relevance within the labor market. If we are unable to attract and retain a workforce meeting our needs, our operations, guest service levels, support functions, and competitiveness could suffer and our results of operations could be adversely affected. We are periodically subject to labor organizing efforts. If we become subject to one or more collective bargaining agreements in the future, it could adversely affect our labor costs and how we operate our business. We also have support offices in India and China, and any extended disruption of our operations in those locations, whether due to labor difficulties or otherwise, could adversely affect our operations and financial results.
Failure to address product safety and sourcing concerns could adversely affect our sales and results of operations.
If our merchandise offerings do not meet applicable safety standards or Target's or our guests’ expectations regarding safety, supply chain transparency and responsible sourcing, we could experience lost sales and increased costs and be exposed to legal and reputational risk. All of our vendors must comply with applicable product safety laws, and we are dependent on them to ensure that the products we buy comply with all safety standards. Events that give rise to actual, potential or perceived product safety concerns, including food or drug contamination, could expose us to government enforcement action or private litigation and result in costly product recalls and other liabilities. Our sourcing vendors must also meet our expectations across multiple areas of social compliance, including supply chain transparency and responsible sourcing. We have a social compliance audit process, but we are also dependent on our vendors to ensure that the products we buy comply with our standards. Negative guest perceptions regarding the safety of the products we sell and events that give rise to actual, potential or perceived compliance concerns could hurt our reputation, result in lost sales, cause our guests to seek alternative sources for their needs, and make it difficult and costly for us to regain the confidence of our guests.
Our failure to comply with federal, state, local, and international laws, or changes in these laws could increase our costs, reduce our margins, and lower our sales.
Our business is subject to a wide array of laws and regulations in the U.S. and other countries in which we operate. Our expenses could increase, and our operations could be adversely affected by significant legislative changes or other legal developments on workforce-related issues, including an employer's obligation to recognize collective bargaining units, the process by which collective bargaining agreements are negotiated or imposed, the classification of exempt and non-exempt employees, the distinction between employees and contractors, minimum wage requirements, advance scheduling notice requirements, and health care mandates. Changes in the legal or regulatory environment affecting data privacy and information security, product safety, payment methods and related fees, responsible sourcing, supply chain transparency, or environmental protection, among others, could cause our expenses to increase without an ability to pass through any increased expenses through higher prices. In addition, if we fail to comply with other applicable laws and regulations, including wage and hour laws, the Foreign Corrupt Practices Act and local anti-bribery laws, we could be subject to reputation and legal risk, including government enforcement action and class action civil litigation, which could adversely affect our results of operations by increasing our costs, reducing our margins, and lowering our sales.
Financial Risks
Increases in our effective income tax rate could adversely affect our business, results of operations, liquidity, and net income.
A number of factors influence our effective income tax rate, including changes in tax law and related regulations, tax treaties, interpretation of existing laws, and our ability to sustain our reporting positions on examination. Changes in any of those factors could change our effective tax rate, which could adversely affect our net income. In addition, our operations outside of the U.S. may cause greater volatility in our effective tax rate.

10
If we are unable to access the capital markets or obtain bank credit, our financial position, liquidity, and results of operations could suffer.
We are dependent on a stable, liquid, and well-functioning financial system to fund our operations and capital investments. Our continued access to financial markets depends on multiple factors including the condition of debt capital markets, our operating performance, and maintaining strong credit ratings. If rating agencies lower our credit ratings, it could adversely affect our ability to access the debt markets, our cost of funds, and other terms for new debt issuances. Each of the credit rating agencies reviews its rating periodically, and there is no guarantee our current credit rating will remain the same. In addition, we use a variety of derivative products to manage our exposure to market risk, principally interest rate and equity price fluctuations. Disruptions or turmoil in the financial markets could reduce our ability to fund our operations and capital investments, and lead to losses on derivative positions resulting from counterparty failures, which could adversely affect our financial position and results of operations.
Item 1B. Unresolved Staff Comments
Not applicable.
11
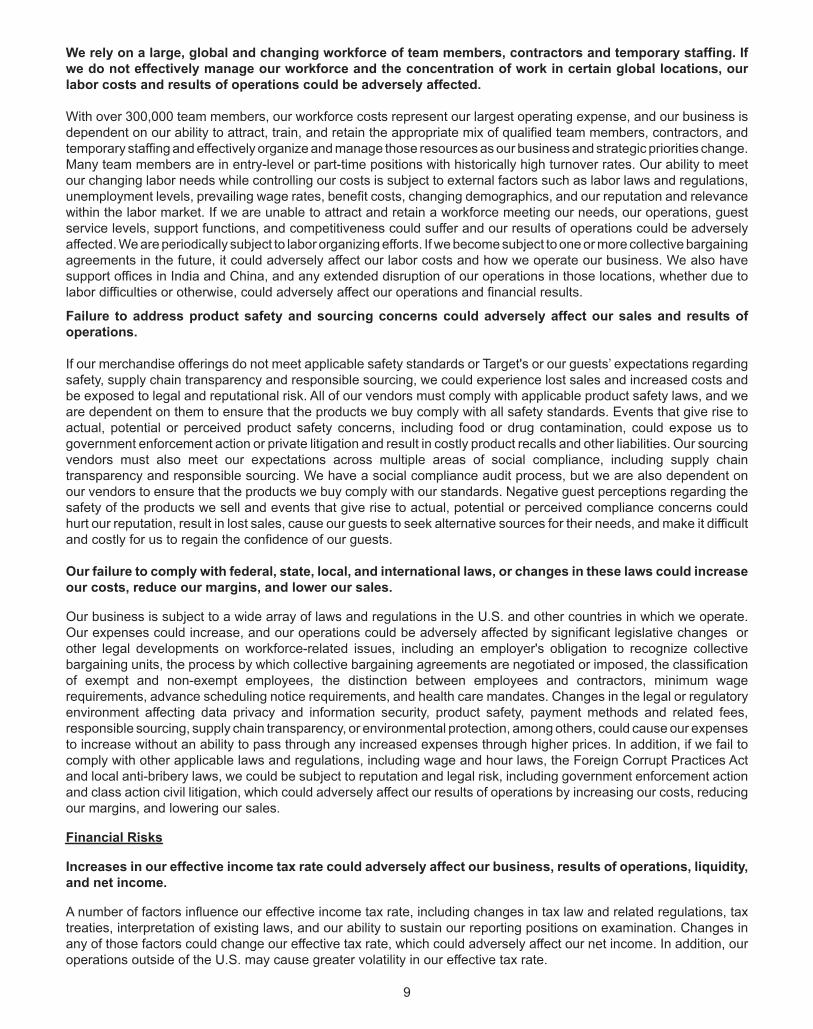
Item 2. Properties
Stores at February 2, 2019 Stores
Retail Sq. Ft.(in thousands) Stores
Retail Sq. Ft.(in thousands)
Alabama 22 3,132 Montana 7 777Alaska 3 504 Nebraska 14 2,006Arizona 47 6,187 Nevada 17 2,242Arkansas 9 1,165 New Hampshire 9 1,148California 287 36,042 New Jersey 47 5,992Colorado 42 6,245 New Mexico 10 1,185Connecticut 20 2,672 New York 82 10,134Delaware 3 440 North Carolina 51 6,540District of Columbia 1 179 North Dakota 4 554Florida 123 17,015 Ohio 63 7,703Georgia 50 6,820 Oklahoma 15 2,168Hawaii 7 1,111 Oregon 20 2,312Idaho 6 664 Pennsylvania 75 9,094Illinois 94 11,926 Rhode Island 4 517Indiana 31 4,174 South Carolina 19 2,359Iowa 20 2,835 South Dakota 5 580Kansas 17 2,385 Tennessee 30 3,816Kentucky 13 1,551 Texas 150 20,919Louisiana 15 2,120 Utah 14 1,979Maine 5 630 Vermont 1 60Maryland 39 4,860 Virginia 59 7,714Massachusetts 46 5,388 Washington 37 4,329Michigan 53 6,370 West Virginia 6 755Minnesota 73 10,315 Wisconsin 36 4,430Mississippi 6 743 Wyoming 2 187Missouri 35 4,608
Total 1,844 239,581
Stores and Distribution Centers at February 2, 2019Stores
DistributionCenters (a)
Owned 1,525 33Leased 161 7Owned buildings on leased land 158 —Total 1,844 40
(a) The 40 distribution centers have a total of 51,688 thousand square feet.
We own our corporate headquarters buildings located in and around Minneapolis, Minnesota, and we lease and own additional office space elsewhere in the U.S. We also lease office space in 11 countries for various support functions. Our properties are in good condition, well maintained, and suitable to carry on our business.
For additional information on our properties, see the Capital Expenditures section in MD&A and Notes 11 and 18 of Item 8, Financial Statements and Supplementary Data (the Financial Statements).

12
Item 3. Legal Proceedings
The following proceedings are being reported pursuant to Item 103 of Regulation S-K:
The Federal Securities Law Class Actions and ERISA Class Actions defined below relate to certain prior disclosures by Target about its expansion of retail operations into Canada (the Canada Disclosure). Target intends to continue to vigorously defend these actions.
Federal Securities Law Class Actions
On May 17, 2016 and May 24, 2016, Target Corporation and certain present and former officers were named as defendants in two purported federal securities law class actions filed in the U.S. District Court for the District of Minnesota (the Court). The lead plaintiff filed a Consolidated Amended Class Action Complaint (First Complaint) on November 14, 2016, alleging violations of Sections 10(b) and 20(a) of the Securities Exchange Act of 1934, as amended, and Rule 10b-5 relating to the Canada Disclosure and naming Target, its former chief executive officer, its present chief operating officer, and the former president of Target Canada as defendants. On March 19, 2018, the Court denied the plaintiff's motion to alter or amend the final judgment issued on July 31, 2017, dismissing the Federal Securities Law Class Actions. On April 18, 2018, the plaintiff appealed the Court's final judgment. That appeal has not yet been heard or decided.
ERISA Class Actions
On July 12, 2016 and July 15, 2016, Target Corporation, the Plan Investment Committee and Target’s current chief operating officer were named as defendants in two purported Employee Retirement Income Security Act of 1974 (ERISA) class actions filed in the Court. The plaintiffs filed an Amended Class Action Complaint (the First ERISA Class Action) on December 14, 2016, alleging violations of Sections 404 and 405 of ERISA relating to the Canada Disclosure and naming Target, the Plan Investment Committee, and seven present or former officers as defendants. The plaintiffs sought to represent a class consisting of all persons who were participants in or beneficiaries of the Target Corporation 401(k) Plan or the Target Corporation Ventures 401(k) Plan (collectively, the Plans) at any time between February 27, 2013 and May 19, 2014 and whose Plan accounts included investments in Target stock. The plaintiffs sought damages, an injunction and other unspecified equitable relief, and attorneys’ fees, expenses, and costs, based on allegations that the defendants breached their fiduciary duties by failing to take action to prevent Plan participants from continuing to purchase Target stock during the class period at prices that allegedly were artificially inflated. After the Court dismissed the First ERISA Class Action on July 31, 2017, the plaintiffs filed a new ERISA Class Action (the Second ERISA Class Action) with the Court on August 30, 2017, which had substantially similar allegations, defendants, class representation, and damages sought as the First ERISA Class Action, except that the class period was extended to August 6, 2014. On June 15, 2018, the Court granted the motion by Target and the other defendants to dismiss the Second ERISA Class Action. On July 16, 2018, the plaintiffs appealed the Court's dismissal. That appeal has not yet been heard or decided.
The following governmental enforcement proceedings relating to environmental matters are reported pursuant to instruction 5(C) of Item 103 of Regulation S-K because they involve potential monetary sanctions in excess of $100,000:
On February 27, 2015, the California Attorney General sent us a letter alleging, based on a series of compliance checks, that we have not achieved compliance with California’s environmental laws and the provisions of the injunction that was part of a settlement reached in 2011. On December 5, 2018, the Alameda County Superior Court entered judgment approving a settlement regarding those allegations. The settlement requires Target to pay $4.4 million for civil penalties, enforcement costs and supplemental environmental projects, and spend $3 million on certain past and future additional internal compliance measures.
For a description of other legal proceedings, see Note 15 of the Financial Statements.
Item 4. Mine Safety Disclosures
Not applicable.
13
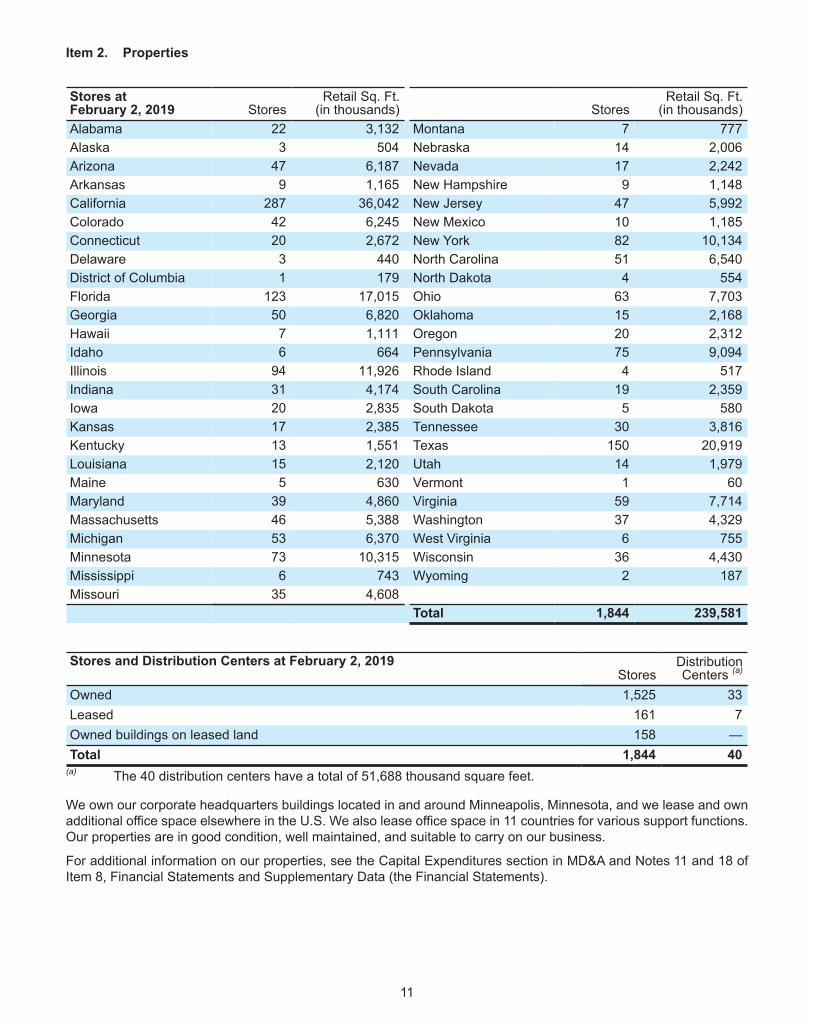
Item 4A. Executive Officers
Executive officers are elected by, and serve at the pleasure of, the Board of Directors. There are no family relationships between any of the officers named and any other executive officer or member of the Board of Directors, or any arrangement or understanding pursuant to which any person was selected as an officer.
Name Title and Business Experience Age
Brian C. Cornell Chairman of the Board and Chief Executive Officer since August 2014. Chief Executive Officer of PepsiCo Americas Foods, a division of PepsiCo, Inc., a multinational food and beverage corporation, from March 2012 to July 2014.
60
Rick H. Gomez Executive Vice President and Chief Marketing & Digital Officer since January 2019. Executive Vice President and Chief Marketing Officer from January 2017 to January 2019. Senior Vice President, Brand and Category Marketing from April 2013 to January 2017.
49
Melissa K. Kremer Executive Vice President and Chief Human Resources Officer since January 2019. Senior Vice President, Talent and Organizational Effectiveness from October 2017 to January 2019. Vice President, Human Resources, Merchandising, Strategy & Innovation, from September 2015 to October 2017. From February 2012 until September 2015, Ms. Kremer held several leadership positions in Human Resources, supporting Merchandising, Target.com & Mobile, Enterprise Strategy & Multichannel.
41
Don H. Liu Executive Vice President, Chief Legal & Risk Officer and Corporate Secretary since October 2017. Executive Vice President, Chief Legal Officer and Corporate Secretary from August 2016 to September 2017. Executive Vice President, General Counsel and Corporate Secretary of Xerox Corporation from July 2014 to August 2016, and Senior Vice President, General Counsel and Corporate Secretary from March 2007 to July 2014.
57
Stephanie A.Lundquist
Executive Vice President and President, Food & Beverage since January 2019. Executive Vice President and Chief Human Resources Officer from February 2016 to January 2019. Senior Vice President, Human Resources from January 2015 to February 2016. Senior Vice President, Stores and Distribution Human Resources from February 2014 to January 2015.
43
Michael E.McNamara
Executive Vice President and Chief Information Officer since January 2019. Executive Vice President and Chief Information & Digital Officer from September 2016 to January 2019. Executive Vice President and Chief Information Officer from June 2015 to September 2016. Officer of Tesco PLC, a multinational grocery and general merchandise retailer, from March 2011 to May 2015.
54
John J. Mulligan Executive Vice President and Chief Operating Officer since September 2015. Executive Vice President and Chief Financial Officer from April 2012 to August 2015.
53
Minsok Pak Executive Vice President and Chief Strategy & Innovation Officer since August 2017. Senior Vice President of Shopper Marketing & Channel Development, LEGO Retail, LEGO Group, a developer and producer of toys, from April 2016 to July 2017. Partner, Digital Transformation, McKinsey & Company, a global management consulting firm, from April 2014 to April 2016. Managing Director, Actium Corporation, a private equity firm, from June 2010 to April 2014.
50
Janna A. Potts Executive Vice President and Chief Stores Officer since January 2016. Senior Vice President, Stores and Supply Chain Human Resources from February 2015 to January 2016. Senior Vice President, Target Canada Stores and Distribution from March 2014 to January 2015.
51
Cathy R. Smith Executive Vice President and Chief Financial Officer since September 2015. Executive Vice President and Chief Financial Officer of Express Scripts Holding Company, a pharmacy benefit manager, from February 2014 to December 2014.
55
Mark J. Tritton Executive Vice President and Chief Merchandising Officer since June 2016. President of Nordstrom Product Group, of Nordstrom Inc., a fashion specialty retailer, from June 2009 to June 2016.
55
Laysha L. Ward Executive Vice President and Chief External Engagement Officer since January 2017. Chief Corporate Social Responsibility Officer from December 2014 to January 2017. President, Community Relations and Target Foundation from July 2008 to December 2014.
51

14
PART II
Item 5. Market for the Registrant's Common Equity, Related Stockholder Matters and Issuer Purchases of Equity Securities
Our common stock is listed on the New York Stock Exchange under the symbol "TGT." We are authorized to issue up to 6,000,000,000 shares of common stock, par value $0.0833, and up to 5,000,000 shares of preferred stock, par value $0.01. At March 7, 2019, there were 14,331 shareholders of record. Dividends declared per share for each fiscal quarter during 2018 and 2017 are disclosed in Note 26 of the Financial Statements.
On September 20, 2016, our Board of Directors authorized a $5 billion share repurchase program. We began repurchasing shares under this authorization during the fourth quarter of 2016. There is no stated expiration for the share repurchase program. Under this program, we repurchased 48.6 million shares of common stock through February 2, 2019, at an average price of $69.13, for a total investment of $3.4 billion. The table below presents information with respect to Target common stock purchases made during the three months ended February 2, 2019, by Target or any "affiliated purchaser" of Target, as defined in Rule 10b-18(a)(3) under the Exchange Act.
Period
Total Numberof Shares
Purchased
AveragePrice
Paid perShare
Total Number ofShares Purchasedas Part of Publicly
Announced Programs
Dollar Value ofShares that May
Yet Be PurchasedUnder Publicly
Announced Programs
November 4, 2018 through December 1, 2018
Open market and privately negotiated purchases — $ — — $ 1,808,949,841
December 2, 2018 through January 5, 2019
Open market and privately negotiated purchases 1,242,920 64.83 1,242,920 1,728,366,804
October 2018 ASR (a) 2,224,074 77.98 2,224,074 1,731,980,648
January 6, 2019 through February 2, 2019
Open market and privately negotiated purchases 1,285,280 69.74 1,285,280 1,642,349,966
Total 4,752,274 $ 72.31 4,752,274 $ 1,642,349,966(a) Represents the incremental shares received upon final settlement of the accelerated share repurchase (ASR)
agreement initiated in third quarter 2018.
15
Fiscal Years Ended
February 1,
2014January 31,
2015January 30,
2016January 28,
2017February 3,
2018February 2,
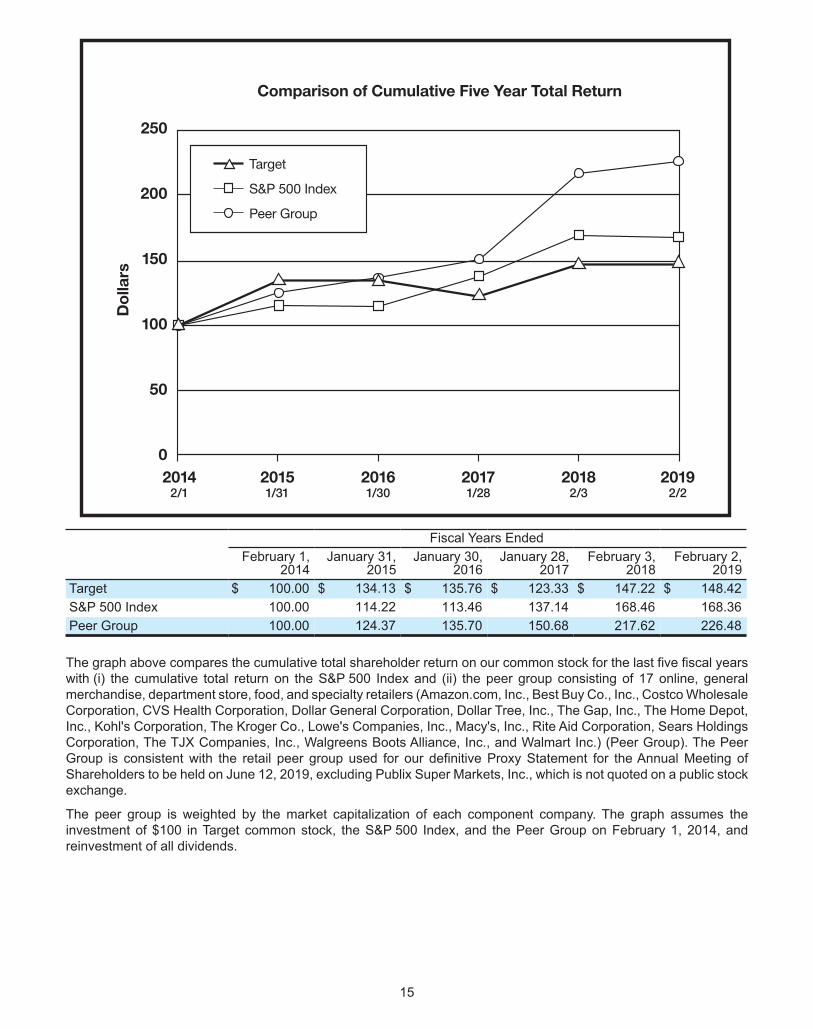
2019Target $ 100.00 $ 134.13 $ 135.76 $ 123.33 $ 147.22 $ 148.42S&P 500 Index 100.00 114.22 113.46 137.14 168.46 168.36Peer Group 100.00 124.37 135.70 150.68 217.62 226.48
The graph above compares the cumulative total shareholder return on our common stock for the last five fiscal years with (i) the cumulative total return on the S&P 500 Index and (ii) the peer group consisting of 17 online, general merchandise, department store, food, and specialty retailers (Amazon.com, Inc., Best Buy Co., Inc., Costco Wholesale Corporation, CVS Health Corporation, Dollar General Corporation, Dollar Tree, Inc., The Gap, Inc., The Home Depot, Inc., Kohl's Corporation, The Kroger Co., Lowe's Companies, Inc., Macy's, Inc., Rite Aid Corporation, Sears Holdings Corporation, The TJX Companies, Inc., Walgreens Boots Alliance, Inc., and Walmart Inc.) (Peer Group). The Peer Group is consistent with the retail peer group used for our definitive Proxy Statement for the Annual Meeting of Shareholders to be held on June 12, 2019, excluding Publix Super Markets, Inc., which is not quoted on a public stock exchange.
The peer group is weighted by the market capitalization of each component company. The graph assumes the investment of $100 in Target common stock, the S&P 500 Index, and the Peer Group on February 1, 2014, and reinvestment of all dividends.
250
200
150
100
50
02014
2/120151/31
20161/30
20171/28
20182/3
20192/2
Comparison of Cumulative Five Year Total Return
Do
llars
Target
S&P 500 Index
Peer Group

16
Item 6. Selected Financial Data
For the Fiscal Year
(millions, except per share data) 20182017
As Adjusted (a)(b)2016
As Adjusted (b)2015
As Adjusted (b) 2014 (b)
Sales $ 74,433 $ 71,786 $ 69,414 $ 73,717 $ 72,618Total revenue 75,356 72,714 70,271 74,494 72,618Net Earnings / (Loss)Continuing operations 2,930 2,908 2,666 3,321 2,449Discontinued operations 7 6 68 42 (4,085)
Net earnings / (loss) 2,937 2,914 2,734 3,363 (1,636)Basic Earnings / (Loss) Per Share Continuing operations 5.54 5.32 4.61 5.29 3.86Discontinued operations 0.01 0.01 0.12 0.07 (6.44)
Basic earnings / (loss) per share 5.55 5.32 4.73 5.35 (2.58)Diluted Earnings / (Loss) Per ShareContinuing operations 5.50 5.29 4.58 5.25 3.83Discontinued operations 0.01 0.01 0.12 0.07 (6.38)
Diluted earnings / (loss) per share 5.51 5.29 4.69 5.31 (2.56)Cash dividends declared per share 2.54 2.46 2.36 2.20 1.99
As of
February 2,2019
February 3, 2018
As Adjusted (b)
January 28, 2017
As Adjusted (b)January 30,
2016 (b)January 31,
2015 (b)
Total assets 41,290 40,303 38,724 40,262 41,172Long-term debt, including current portion 11,275 11,398 12,591 12,760 12,725
Note: This information should be read in conjunction with MD&A and the Financial Statements. Per share amounts may not foot due to rounding. (a) Consisted of 53 weeks.(b) The selected financial data for fiscal years 2017, 2016, and 2015 and as of February 3, 2018 and January 28,
2017, reflect the adoption of Accounting Standards Update (ASU) No. 2014-09—Revenue from Contracts with Customers (Topic 606). The selected financial data for fiscal years 2017 and 2016 and as of February 3, 2018 and January 28, 2017, reflect the adoption of ASU No. 2016-02—Leases (Topic 842). Note 2 of the Financial Statements provides additional information. The selected financial data for fiscal year 2014 and as of January 30, 2016, and January 31, 2015, do not reflect adoption of Topic 606 and Topic 842.

17
Item 7. Management's Discussion and Analysis of Financial Condition and Results of Operations
Executive Summary
Fiscal 2018 included the following notable items:
• GAAP earnings per share from continuing operations were $5.50.• Adjusted earnings per share were $5.39.• Total revenue increased 3.6 percent, driven by a comparable sales increase and sales from new stores, partially
offset by fiscal 2017 containing 53 weeks.• Comparable sales increased 5.0 percent, driven by a 5.0 percent increase in traffic.
Comparable store sales grew 3.2 percent. Comparable digital channel sales increased 36 percent, contributing 1.8 percentage points to comparable
sales growth.• We returned $3.4 billion to shareholders through dividends and share repurchases.
As described in Note 2 to the Financial Statements, certain prior-year amounts have been adjusted to reflect the impact of adopting Accounting Standards Update (ASU) No. 2014-09—Revenue from Contracts with Customers (Topic 606), ASU No. 2016-02—Leases (Topic 842), and ASU No. 2017-07—Compensation – Retirement Benefits (Topic 715) throughout this document to conform to the current year presentation.
Sales were $74,433 million for 2018, an increase of $2,647 million or 3.7 percent from the prior year, due to a comparable sales increase of 5.0 percent and the contribution from new stores, partially offset by the impact of the extra week in 2017. Operating income in 2018 decreased by $114 million or 2.7 percent from 2017 to $4,110 million. The Analysis of Results of Operations discussion provides more information. Operating cash flow provided by continuing operations was $5,970 million for 2018, a decrease of $891 million, or 13.0 percent, from $6,861 million for 2017. Refer to the Cash Flows discussion within the Liquidity and Capital Resources section of MD&A on page 24 for additional information.
Earnings Per Share From Continuing Operations
Percent Change
20182017
As Adjusted (a)(b)2016
As Adjusted (b) 2018/2017 2017/2016GAAP diluted earnings per share $ 5.50 $ 5.29 $ 4.58 4.0% 15.5 %Adjustments (0.10) (0.60) 0.42 Adjusted diluted earnings per share $ 5.39 $ 4.69 $ 5.00 15.1% (6.3)%
Note: Amounts may not foot due to rounding. Adjusted diluted earnings per share from continuing operations (Adjusted EPS), a non-GAAP metric, excludes the impact of certain items. Management believes that Adjusted EPS is useful in providing period-to-period comparisons of the results of our continuing operations. A reconciliation of non-GAAP financial measures to GAAP measures is provided on page 21.(a) Consisted of 53 weeks.(b) Lease standard adoption resulted in a $0.03 and $0.02 reduction in GAAP and Adjusted EPS, respectively,
for 2017, and a less than $0.01 and $0.01 reduction in GAAP and Adjusted EPS, respectively, for 2016.
We report after-tax return on invested capital (ROIC) from continuing operations because we believe ROIC provides a meaningful measure of our capital-allocation effectiveness over time. For the trailing twelve months ended February 2, 2019, ROIC was 14.7 percent, compared with 15.4 percent for the trailing twelve months ended February 3, 2018. Excluding the discrete impacts of the Tax Cuts and Jobs Act (Tax Act), ROIC was 14.6 percent and 13.6 percent for the trailing twelve months ended February 2, 2019, and February 3, 2018, respectively. A reconciliation of ROIC is provided on page 23.

18
Analysis of Results of Operations
Percent Change
(dollars in millions) 20182017
As Adjusted (a)2016
As Adjusted 2018/2017 2017/2016Sales $ 74,433 $ 71,786 $ 69,414 3.7 % 3.4 %Other revenue 923 928 857 (0.5) 8.3Total revenue 75,356 72,714 70,271 3.6 3.5Cost of sales 53,299 51,125 49,145 4.3 4.0SG&A expenses 15,723 15,140 14,217 3.9 6.5Depreciation and amortization (exclusive of
depreciation included in cost of sales) 2,224 2,225 2,045 (0.1) 8.8Operating income $ 4,110 $ 4,224 $ 4,864 (2.7)% (13.1)%
(a) Consisted of 53 weeks.
Rate Analysis 20182017
As Adjusted (a)2016
As Adjusted
Gross margin rate 28.4% 28.8% 29.2%SG&A expense rate 20.9 20.8 20.2Depreciation and amortization (exclusive of depreciation included in
cost of sales) expense rate 3.0 3.1 2.9Operating income margin rate 5.5 5.8 6.9
Note: Gross margin rate is calculated as gross margin (sales less cost of sales) divided by sales. All other rates are calculated by dividing the applicable amount by total revenue.(a) Consisted of 53 weeks.
Sales
Sales include all merchandise sales, net of expected returns, and gift card breakage. Note 3 of the Financial Statements defines gift card "breakage". Comparable sales is a measure that highlights the performance of our stores and digital channel sales by measuring the change in sales for a period over the comparable, prior-year period of equivalent length. Comparable sales include all sales, except sales from stores open less than 13 months, digital acquisitions we have owned less than 13 months, stores that have been closed, and digital acquisitions that we no longer operate. Comparable sales measures vary across the retail industry. As a result, our comparable sales calculation is not necessarily comparable to similarly titled measures reported by other companies. Digital channel sales include all sales initiated through mobile applications and our websites. Our stores fulfill the majority of digital channel sales, including through store pick up or drive up and delivery via our wholly owned subsidiary, Shipt. Digital channel sales may also be fulfilled through our distribution centers, our vendors, or other third parties.
The increase in 2018 sales compared with 2017 is due to a 5.0 percent comparable sales increase and the contribution from new stores, partially offset by the extra week in 2017, which contributed $1,167 million of sales, or 1.6 percent of 2017 sales. The increase in 2017 sales is due to a comparable sales increase of 1.3 percent, the extra week in 2017, and the contribution from new stores. The extra week contributed 1.7 percentage points of increase over 2016. Inflation did not materially affect sales in any period presented.
Comparable Sales 2018 2017 2016Comparable sales change 5.0% 1.3% (0.5)%Drivers of change in comparable sales
Number of transactions 5.0 1.6 (0.8)Average transaction amount 0.1 (0.3) 0.3
Note: Amounts may not foot due to rounding.

19
Contribution to Comparable Sales Change 2018 2017 2016Stores channel comparable sales change 3.2% 0.1% (1.5)%Digital channel percentage points contribution to comparable sales
change 1.8 1.2 1.0Total comparable sales change 5.0% 1.3% (0.5)%Note: Amounts may not foot due to rounding.
Sales by Channel 2018 2017 2016Stores originated 92.9% 94.5% 95.6%Digitally originated 7.1 5.5 4.4Total 100% 100% 100%
Note 3 to the Financial Statements provides sales by product category. The collective interaction of a broad array of macroeconomic, competitive, and consumer behavioral factors, as well as sales mix and transfer of sales to new stores makes further analysis of sales metrics infeasible.
TD Bank Group (TD) offers credit to qualified guests through Target-branded credit cards: the Target Credit Card and the Target MasterCard Credit Card (Target Credit Cards). Additionally, we offer a branded proprietary Target Debit Card. Collectively, we refer to these products as REDcards®. Guests receive a 5 percent discount on nearly all purchases and free shipping when they use a REDcard at Target. We monitor the percentage of purchases that are paid for using REDcards (REDcard Penetration) because our internal analysis has indicated that a meaningful portion of incremental purchases on our REDcards are also incremental sales for Target.
REDcard Penetration 2018 2017 2016Target Debit Card 13.0% 13.1% 13.0%Target Credit Cards 10.9 11.3 11.2Total REDcard Penetration 23.8% 24.5% 24.2%
Note: Amounts may not foot due to rounding. In 2018, we refined our calculation of REDcard Penetration. The prior period amounts have been updated to conform with the current methodology, resulting in an increase of 0.2 percentage points to the Total REDcard Penetration for 2017 and 2016.
Gross Margin Rate
Our gross margin rate was 28.4 percent in 2018, 28.8 percent in 2017, and 29.2 percent in 2016. The 2018 decrease was primarily due to increased digital fulfillment and supply chain costs. The benefit of merchandising strategies, including cost savings initiatives and efforts to improve pricing and promotions, was partially offset by the impact of our sales mix.
20
The 2017 decrease was primarily due to increased digital fulfillment costs and supply chain costs. Benefits from cost savings initiatives were offset by net investments in pricing and promotions.
Selling, General and Administrative Expense Rate
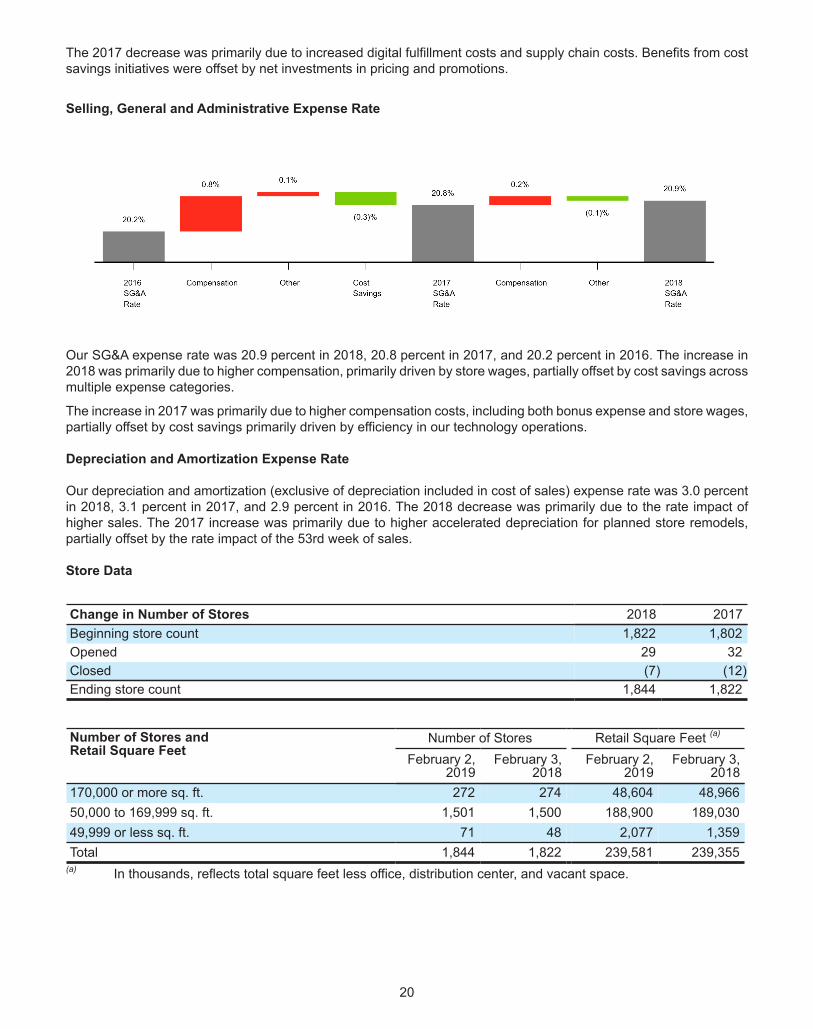
Our SG&A expense rate was 20.9 percent in 2018, 20.8 percent in 2017, and 20.2 percent in 2016. The increase in 2018 was primarily due to higher compensation, primarily driven by store wages, partially offset by cost savings across multiple expense categories.
The increase in 2017 was primarily due to higher compensation costs, including both bonus expense and store wages, partially offset by cost savings primarily driven by efficiency in our technology operations.
Depreciation and Amortization Expense Rate
Our depreciation and amortization (exclusive of depreciation included in cost of sales) expense rate was 3.0 percent in 2018, 3.1 percent in 2017, and 2.9 percent in 2016. The 2018 decrease was primarily due to the rate impact of higher sales. The 2017 increase was primarily due to higher accelerated depreciation for planned store remodels, partially offset by the rate impact of the 53rd week of sales.
Store Data
Change in Number of Stores 2018 2017Beginning store count 1,822 1,802Opened 29 32Closed (7) (12)Ending store count 1,844 1,822
Number of Stores andRetail Square Feet
Number of Stores Retail Square Feet (a)
February 2,2019
February 3,2018
February 2,2019
February 3,2018
170,000 or more sq. ft. 272 274 48,604 48,96650,000 to 169,999 sq. ft. 1,501 1,500 188,900 189,03049,999 or less sq. ft. 71 48 2,077 1,359Total 1,844 1,822 239,581 239,355
(a) In thousands, reflects total square feet less office, distribution center, and vacant space.

21
Other Performance Factors
Net Interest Expense
Net interest expense from continuing operations was $461 million, $653 million, and $991 million for 2018, 2017, and 2016, respectively. Net interest expense for 2017 and 2016 included losses on early retirement of debt of $123 million and $422 million, respectively.
Provision for Income Taxes
Our 2018 effective income tax rate from continuing operations increased to 20.3 percent from 19.9 percent in 2017, primarily due to lower discrete favorable benefits of the Tax Act, which were $36 million in 2018 compared with $343 million in 2017, and less rate benefit from our global sourcing operations in 2018 compared with 2017. The lower 2018 benefit of discrete Tax Act-related items was substantially offset by the full-year benefit of a 21 percent federal statutory rate in 2018 compared with a 33.7 percent blended federal statutory rate in 2017.
Our 2017 effective income tax rate from continuing operations decreased to 19.9 percent, from 32.7 percent in 2016, driven primarily by the impact of the Tax Act.
Note 19 of the Financial Statements provides additional information.
Reconciliation of Non-GAAP Financial Measures to GAAP Measures
To provide additional transparency, we have disclosed non-GAAP adjusted diluted earnings per share from continuing operations (Adjusted EPS). This metric excludes certain items presented below. We believe this information is useful in providing period-to-period comparisons of the results of our continuing operations. This measure is not in accordance with, or an alternative to, generally accepted accounting principles in the U.S. (GAAP). The most comparable GAAP measure is diluted earnings per share from continuing operations. Adjusted EPS should not be considered in isolation or as a substitution for analysis of our results as reported under GAAP. Other companies may calculate Adjusted EPS differently than we do, limiting the usefulness of the measure for comparisons with other companies.
20182017
As Adjusted (a)(b)2016
As Adjusted (b)
(millions, except per share data) PretaxNet of
Tax
PerShare
Amounts PretaxNet of
Tax
PerShare
Amounts PretaxNet of
Tax
PerShare
AmountsGAAP diluted earnings per share from
continuing operations $ 5.50 $ 5.29 $ 4.58Adjustments
Tax Act (c) $ — $ (36) $ (0.07) $ — $ (343) $ (0.62) $ — $ — $ —Loss on early retirement of debt — — — 123 75 0.14 422 257 0.44Other (d) — — — (5) (3) (0.01) (4) (2) —Other income tax matters (e) — (18) (0.03) — (57) (0.10) — (7) (0.01)
Adjusted diluted earnings per share fromcontinuing operations $ 5.39 $ 4.69 $ 5.00
Note: Amounts may not foot due to rounding.(a) Consisted of 53 weeks.(b) Lease standard adoption resulted in a $0.03 and $0.02 reduction in GAAP and Adjusted EPS, respectively,
for 2017, and a less than $0.01 and $0.01 reduction in GAAP and Adjusted EPS, respectively, for 2016. Referto Note 2 to the Consolidated Financial Statements.
(c) Represents discrete items related to the Tax Act. Refer to the Provision for Income Taxes discussion withinMD&A and Note 19 of the Financial Statements.
(d) For 2017, represents an insurance recovery related to the 2013 data breach. For 2016, represents items relatedto the 2015 sale of our pharmacy and clinic businesses.
(e) Represents income from certain income tax matters not related to current period operations.

22
Earnings from continuing operations before interest expense and income taxes (EBIT) and earnings before interest expense, income taxes, depreciation and amortization (EBITDA) are non-GAAP financial measures which we believe provide meaningful information about our operational efficiency compared with our competitors by excluding the impact of differences in tax jurisdictions and structures, debt levels, and, for EBITDA, capital investment. These measures are not in accordance with, or an alternative for, GAAP. The most comparable GAAP measure is net earnings from continuing operations. EBIT and EBITDA should not be considered in isolation or as a substitution for analysis of our results as reported under GAAP. Other companies may calculate EBIT and EBITDA differently, limiting the usefulness of the measure for comparisons with other companies.
EBIT and EBITDA Percent Change
(dollars in millions) 20182017
As Adjusted (a)(b)2016
As Adjusted (b) 2018/2017 2017/2016Net earnings from continuing operations $ 2,930 $ 2,908 $ 2,666 0.7 % 9.1 %+ Provision for income taxes 746 722 1,295 3.5 (44.3)+ Net interest expense 461 653 991 (29.3) (34.1)EBIT (b) $ 4,137 $ 4,283 $ 4,952 (3.4)% (13.5)%+ Total depreciation and amortization (c) 2,474 2,476 2,318 (0.1) 6.8EBITDA (b) $ 6,611 $ 6,759 $ 7,270 (2.2)% (7.0)%
(a) Consisted of 53 weeks.(b) Adoption of the new accounting standards resulted in a $29 million and $17 million decrease in EBIT and a
$2 million and $3 million increase in EBITDA for 2017 and 2016, respectively.(c) Represents total depreciation and amortization, including amounts classified within Depreciation and
Amortization and within Cost of Sales.

23
We have also disclosed after-tax ROIC, which is a ratio based on GAAP information. We believe this metric is useful in assessing the effectiveness of our capital allocation over time. Other companies may calculate ROIC differently, limiting the usefulness of the measure for comparisons with other companies.
After-Tax Return on Invested Capital
Trailing Twelve Months
Numerator(dollars in millions)
February 2,2019
February 3, 2018
As Adjusted (a)
Operating income $ 4,110 $ 4,224+ Net other income / (expense) 27 59EBIT 4,137 4,283+ Operating lease interest (b) 83 79- Income taxes (c)(d) 856 867Net operating profit after taxes $ 3,364 $ 3,495
Denominator(dollars in millions)
February 2,2019
February 3, 2018
As Adjusted
January 28, 2017
As Adjusted
Current portion of long-term debt and other borrowings $ 1,052 $ 281 $ 1,729+ Noncurrent portion of long-term debt 10,223 11,117 10,862+ Shareholders' equity 11,297 11,651 10,915+ Operating lease liabilities (e) 2,170 2,072 1,970- Cash and cash equivalents 1,556 2,643 2,512- Net assets of discontinued operations (f) — 2 62Invested capital $ 23,186 $ 22,476 $ 22,902Average invested capital (g) $ 22,831 $ 22,689
After-tax return on invested capital (d)(h) 14.7% 15.4%After-tax return on invested capital excluding discrete impacts
of Tax Act (d) 14.6% 13.6%(a) Consisted of 53 weeks.(b) Represents the add-back to operating income driven by the hypothetical interest expense we would incur if
the property under our operating leases were owned or accounted for as finance leases. Calculated using thediscount rate for each lease and recorded as a component of rent expense within SG&A Expenses. Operatinglease interest is added back to Operating Income in the ROIC calculation to control for differences in capitalstructure between us and our competitors.
(c) Calculated using the effective tax rates for continuing operations, which were 20.3 percent and 19.9 percentfor the trailing twelve months ended February 2, 2019, and February 3, 2018, respectively. For the trailingtwelve months ended February 2, 2019, and February 3, 2018, includes tax effect of $839 million and $851million, respectively, related to EBIT, and $17 million and $16 million, respectively, related to operating leaseinterest.
(d) The effective tax rate for the trailing twelve months ended February 2, 2019, and February 3, 2018, includesdiscrete tax benefits of $36 million and $343 million, respectively, related to the Tax Act.
(e) Total short-term and long-term operating lease liabilities included within Accrued and Other Current Liabilitiesand Noncurrent Operating Lease Liabilities on the Consolidated Statements of Financial Position.
(f) Included in Other Assets and Liabilities on the Consolidated Statements of Financial Position.(g) Average based on the invested capital at the end of the current period and the invested capital at the end of
the comparable prior period.(h) Adoption of the new lease standard reduced ROIC by approximately 0.5 percentage points for all periods
presented.

24
Analysis of Financial Condition
Liquidity and Capital Resources
Our period-end cash and cash equivalents balance decreased to $1,556 million from $2,643 million in 2017 primarily because we repatriated cash previously held by entities located outside the U.S. and deployed it during 2018 in support of our business objectives. Our cash and cash equivalents balance includes short-term investments of $769 million and $1,906 million as of February 2, 2019, and February 3, 2018, respectively. Our investment policy is designed to preserve principal and liquidity of our short-term investments. This policy allows investments in large money market funds or in highly rated direct short-term instruments that mature in 60 days or less. We also place dollar limits on our investments in individual funds or instruments.
Capital Allocation
We follow a disciplined and balanced approach to capital allocation based on the following priorities, ranked in order of importance: first, we fully invest in opportunities to profitably grow our business, create sustainable long-term value, and maintain our current operations and assets; second, we maintain a competitive quarterly dividend and seek to grow it annually; and finally, we return any excess cash to shareholders by repurchasing shares within the limits of our credit rating goals.
Operating Cash Flows
Operating cash flow provided by continuing operations was $5,970 million in 2018 compared with $6,861 million in 2017 and $5,337 million in 2016. The 2018 operating cash flow decrease was primarily due to a larger increase in inventory in 2018 compared with 2017, partially offset by lower income tax payments in 2018 due to the Tax Act.
The 2017 operating cash flow increase was due to increased payables leverage primarily driven by changes in vendor payment terms in 2017, partially offset by an inventory increase in 2017 compared with a decrease during 2016. The operating cash flow increase was also partially due to the payment of approximately $500 million of taxes during 2016 related to the sale of our pharmacy and clinic businesses.
Inventory
Year-end inventory was $9,497 million, compared with $8,597 million in 2017. We increased inventory in 2018 to support higher sales, including market share opportunities in toys and baby-related merchandise. In addition, inventory levels were increased to support new brand launches and our efforts to improve in-stock levels.

25
Capital Expenditures
Capital expenditures increased in 2018 from the prior year primarily due to increased investments in existing stores as we further accelerated our current store remodel program. This investment acceleration follows an increase in 2017 as we accelerated our store remodel program.
In addition to these cash investments, we entered into leases related to new stores in 2018, 2017, and 2016 with total future minimum lease payments of $473 million, $438 million, and $550 million, respectively.
We expect capital expenditures in 2019 at a level consistent with 2018 as we continue the current store remodel program, open additional small-format stores, and make other investments in our business. We also expect to continue our current rate of investment in store leases.
Dividends
We paid dividends totaling $1,335 million ($2.52 per share) in 2018 and $1,338 million ($2.44 per share) in 2017, a per share increase of 3.3 percent. We declared dividends totaling $1,347 million ($2.54 per share) in 2018, a per share increase of 3.3 percent over 2017. We declared dividends totaling $1,356 million ($2.46 per share) in 2017, a per share increase of 4.2 percent over 2016. We have paid dividends every quarter since our 1967 initial public offering, and it is our intent to continue to do so in the future.
Share Repurchases
During 2018, 2017, and 2016 we returned $2,067 million, $1,026 million, and $3,686 million, respectively, to shareholders through share repurchase. See Part II, Item 5 of this Annual Report on Form 10-K and Note 21 to the Financial Statements for more information.

26
Financing
Our financing strategy is to ensure liquidity and access to capital markets, to maintain a balanced spectrum of debt maturities, and to manage our net exposure to floating interest rate volatility. Within these parameters, we seek to minimize our borrowing costs. Our ability to access the long-term debt and commercial paper markets has provided us with ample sources of liquidity. Our continued access to these markets depends on multiple factors, including the condition of debt capital markets, our operating performance, and maintaining strong credit ratings. As of February 2, 2019, our credit ratings were as follows:
Credit Ratings Moody's Standard and Poor's FitchLong-term debt A2 A A-Commercial paper P-1 A-1 F2
If our credit ratings were lowered, our ability to access the debt markets, our cost of funds, and other terms for new debt issuances could be adversely impacted. Each of the credit rating agencies reviews its rating periodically and there is no guarantee our current credit ratings will remain the same as described above.
In 2018, we funded our holiday sales period working capital needs through internally generated funds and the issuance of commercial paper. In 2017, we funded our holiday sales period working capital needs through internally generated funds.
We have additional liquidity through a committed $2.5 billion revolving credit facility obtained through a group of banks. In October 2018, we extended this credit facility by one year to October 2023. No balances were outstanding at any time during 2018, 2017, or 2016.
Most of our long-term debt obligations contain covenants related to secured debt levels. In addition to a secured debt level covenant, our credit facility also contains a debt leverage covenant. We are, and expect to remain, in compliance with these covenants. Additionally, at February 2, 2019, no notes or debentures contained provisions requiring acceleration of payment upon a credit rating downgrade, except that certain outstanding notes allow the note holders to put the notes to us if within a matter of months of each other we experience both (i) a change in control and (ii) our long-term credit ratings are either reduced and the resulting rating is non-investment grade, or our long-term credit ratings are placed on watch for possible reduction and those ratings are subsequently reduced and the resulting rating is non-investment grade.
Note 16 of the Financial Statements provides more information about financing activities.
We believe our sources of liquidity will continue to be adequate to maintain operations, finance anticipated expansion and strategic initiatives, fund debt maturities, pay dividends, and execute purchases under our share repurchase program for the foreseeable future. We continue to anticipate ample access to commercial paper and long-term financing.

27
Commitments and Contingencies
Contractual Obligations as of Payments Due by PeriodFebruary 2, 2019 Less than 1-3 3-5 After 5(millions) Total 1 Year Years Years YearsRecorded contractual obligations:
Long-term debt (a) $ 10,336 $ 1,002 $ 2,150 $ 63 $ 7,121Finance lease liabilities (b) 1,461 98 196 193 974Operating lease liabilities (b) 2,904 245 470 443 1,746Deferred compensation (c) 518 59 116 111 232Real estate liabilities (d) 121 121 — — —Tax contingencies (e) — — — — —
Unrecorded contractual obligations: Interest payments – long-term debt 5,893 407 724 628 4,134Purchase obligations (f) 992 532 170 75 215Real estate obligations (g) 1,013 487 59 67 400Future contributions to retirement plans (h) — — — — —
Contractual obligations $ 23,238 $ 2,951 $ 3,885 $ 1,580 $ 14,822(a) Represents principal payments only. See Note 16 of the Financial Statements for further information.(b) Finance and operating lease payments include $127 million and $778 million, respectively, related to options
to extend lease terms that are reasonably certain of being exercised. See Note 18 of the Financial Statements for further information.
(c) The timing of deferred compensation payouts is estimated based on payments currently made to former employees and retirees and the projected timing of future retirements.
(d) Real estate liabilities include costs incurred but not paid related to the construction or remodeling of real estate and facilities.
(e) Estimated tax contingencies of $334 million, including interest and penalties and primarily related to continuing operations, are not included in the table above because we are not able to make reasonably reliable estimates of the period of cash settlement. See Note 19 of the Financial Statements for further information.
(f) Purchase obligations include all legally binding contracts such as firm minimum commitments for inventory purchases, merchandise royalties, equipment purchases, marketing-related contracts, software acquisition/license commitments, and service contracts. We issue inventory purchase orders in the normal course of business, which represent authorizations to purchase that are cancelable by their terms. We do not consider purchase orders to be firm inventory commitments; therefore, they are excluded from the table above. If we choose to cancel a purchase order, we may be obligated to reimburse the vendor for unrecoverable outlays incurred prior to cancellation. We also issue trade letters of credit in the ordinary course of business, which are excluded from this table as these obligations are conditioned on terms of the letter of credit being met.
(g) Real estate obligations include legally binding minimum lease payments for leases signed but not yet commenced, and commitments for the purchase, construction, or remodeling of real estate and facilities.
(h) We have not included obligations under our pension plans in the contractual obligations table above because no additional amounts are required to be funded as of February 2, 2019. Our historical practice regarding these plans has been to contribute amounts necessary to satisfy minimum pension funding requirements, plus periodic discretionary amounts determined to be appropriate.
Off Balance Sheet Arrangements: Other than the unrecorded contractual obligations noted above, we do not have any arrangements or relationships with entities that are not consolidated into the financial statements.

28
Critical Accounting Estimates
Our consolidated financial statements are prepared in accordance with GAAP, which requires us to make estimates and apply judgments that affect the reported amounts. In the Notes to Consolidated Financial Statements, we describe the significant accounting policies used in preparing the consolidated financial statements. Our management has discussed the development, selection, and disclosure of our critical accounting estimates with the Audit & Finance Committee of our Board of Directors. The following items require significant estimation or judgment:
Inventory and cost of sales: The vast majority of our inventory is accounted for under the retail inventory accounting method using the last-in, first-out method. Our inventory is valued at the lower of cost or market. We reduce inventory for estimated losses related to shrink and markdowns. Our shrink estimate is based on historical losses verified by physical inventory counts. Historically, our actual physical inventory count results have shown our estimates to be reliable. Market adjustments for markdowns are recorded when the salability of the merchandise has diminished. We believe the risk of inventory obsolescence is largely mitigated because our inventory typically turns in less than three months. Inventory was $9,497 million and $8,597 million at February 2, 2019 and February 3, 2018, respectively, and is further described in Note 9 of the Financial Statements.
Vendor income: We receive various forms of consideration from our vendors (vendor income), principally earned as a result of volume rebates, markdown allowances, promotions, and advertising allowances. Substantially all vendor income is recorded as a reduction of cost of sales.
We establish a receivable for vendor income that is earned but not yet received. Based on the agreements in place, this receivable is computed by estimating when we have completed our performance and when the amount is earned. The majority of the year-end vendor income receivables are collected within the following fiscal quarter, and we do not believe there is a reasonable likelihood that the assumptions used in our estimate will change significantly. Historically, adjustments to our vendor income receivable have not been material. Vendor income receivable was $468 million and $416 million at February 2, 2019 and February 3, 2018, respectively. Vendor income is described further in Note 5 of the Financial Statements.
Long-lived assets: Long-lived assets are reviewed for impairment whenever events or changes in circumstances indicate that the carrying amounts may not be recoverable. The evaluation is performed at the lowest level of identifiable cash flows independent of other assets, which is primarily at the store level. An impairment loss would be recognized when estimated undiscounted future cash flows from the operation and/or disposition of the assets are less than their carrying amount. Measurement of an impairment loss would be based on the excess of the carrying amount of the asset group over its fair value. Fair value is measured using discounted cash flows or independent opinions of value, as appropriate. We recorded impairments of $92 million, $91 million, and $43 million in 2018, 2017, and 2016, respectively, which are described further in Note 11 of the Financial Statements.
We applied the hindsight practical expedient for measurement of lease assets and liabilities, and associated leasehold improvement assets, in our adoption of ASU No. 2016-02—Leases (Topic 842), which required significant judgment to determine the reasonably certain lease term for existing leases in transition to the new standard. Using hindsight shortened lease terms for many leases. Operating lease assets and liabilities were $1,965 million and $2,170 million, respectively, at February 2, 2019. Finance lease assets and liabilities were $872 million and $1,021 million, respectively, at February 2, 2019. Leases are described further in Notes 2 and 18 of the Financial Statements.
Insurance/self-insurance: We retain a substantial portion of the risk related to certain general liability, workers' compensation, property loss, and team member medical and dental claims. However, we maintain stop-loss coverage to limit the exposure related to certain risks. Liabilities associated with these losses include estimates of both claims filed and losses incurred but not yet reported. We use actuarial methods which consider a number of factors to estimate our ultimate cost of losses. General liability and workers' compensation liabilities are recorded at our estimate of their net present value; other liabilities referred to above are not discounted. Our workers' compensation and general liability accrual was $423 million and $419 million at February 2, 2019 and February 3, 2018, respectively. We believe that the amounts accrued are appropriate; however, our liabilities could be significantly affected if future occurrences or loss developments differ from our assumptions. For example, a 5 percent increase or decrease in average claim costs would impact our self-insurance expense by $21 million in 2018. Historically, adjustments to our estimates have not been material. Refer to Item 7A, Quantitative and Qualitative Disclosures About Market Risk, for further disclosure of the market risks associated with these exposures. We maintain insurance coverage to limit our exposure to certain events, including network security matters.

29
Income taxes: We pay income taxes based on the tax statutes, regulations, and case law of the various jurisdictions in which we operate. Significant judgment is required in determining the timing and amounts of deductible and taxable items, and in evaluating the ultimate resolution of tax matters in dispute with tax authorities.
We recognized the income tax effects of the Tax Act in our 2018 and 2017 financial statements in accordance with Staff Accounting Bulletin No. 118, which provides SEC staff guidance for the application of ASC Topic 740, Income Taxes. Note 19 of the Financial Statements provides additional information.
The benefits of uncertain tax positions are recorded in our financial statements only after determining it is likely the uncertain tax positions would withstand challenge by taxing authorities. We periodically reassess these probabilities and record any changes in the financial statements as appropriate. Liabilities for uncertain tax positions, including interest and penalties, were $334 million and $363 million at February 2, 2019 and February 3, 2018, respectively, and primarily relate to continuing operations. We believe the resolution of these matters will not have a material adverse impact on our consolidated financial statements. Income taxes are described further in Note 19 of the Financial Statements.
Pension accounting: We maintain a funded, qualified defined benefit pension plan, as well as several smaller and unfunded nonqualified plans for certain current and retired team members. The costs for these plans are determined based on actuarial calculations using the assumptions described in the following paragraphs. Eligibility and the level of benefits varies depending on team members' full-time or part-time status, date of hire, age, and/or length of service. The benefit obligation and related expense for these plans are determined based on actuarial calculations using assumptions about the expected long-term rate of return, the discount rate, and compensation growth rates. The assumptions, with adjustments made for any significant plan or participant changes, are used to determine the period-end benefit obligation and establish expense for the next year.
Our 2018 expected long-term rate of return on plan assets of 6.30 percent is determined by the portfolio composition, historical long-term investment performance, and current market conditions. A 1 percentage point decrease in our expected long-term rate of return would increase annual expense by $39 million.
The discount rate used to determine benefit obligations is adjusted annually based on the interest rate for long-term high-quality corporate bonds, using yields for maturities that are in line with the duration of our pension liabilities. Our benefit obligation and related expense will fluctuate with changes in interest rates. A 1 percentage point decrease to the weighted average discount rate would increase annual expense by $68 million.
Based on our experience, we use a graduated compensation growth schedule that assumes higher compensation growth for younger, shorter-service pension-eligible team members than it does for older, longer-service pension-eligible team members.
Pension benefits are further described in Note 24 of the Financial Statements.
Legal and other contingencies: We believe the accruals recorded in our consolidated financial statements properly reflect loss exposures that are both probable and reasonably estimable. We do not believe any of the currently identified claims or litigation may materially affect our results of operations, cash flows, or financial condition. However, litigation is subject to inherent uncertainties, and unfavorable rulings could occur. If an unfavorable ruling were to occur, it may cause a material adverse impact on the results of operations, cash flows, or financial condition for the period in which the ruling occurs, or future periods. Refer to Note 15 of the Financial Statements for further information on contingencies.
New Accounting Pronouncements
Refer to Note 2, Note 3, and Note 18, of the Financial Statements for a description of new accounting pronouncements related to revenues, leases, and pension expense. We do not expect any other recently issued accounting pronouncements will have a material effect on our financial statements.

30
Forward-Looking Statements
This report contains forward-looking statements, which are based on our current assumptions and expectations. These statements are typically accompanied by the words "expect," "may," "could," "believe," "would," "might," "anticipates," or words of similar import. The principal forward-looking statements in this report include: our financial performance, statements regarding the adequacy of and costs associated with our sources of liquidity, the continued execution of our share repurchase program, our expected capital expenditures and new lease commitments, the impact of changes in the expected effective income tax rate on net income, including those resulting from the Tax Act, the expected compliance with debt covenants, the expected impact of new accounting pronouncements, our intentions regarding future dividends, contributions and payments related to our pension plan, the expected returns on pension plan assets, the expected timing and recognition of compensation expenses, the effects of macroeconomic conditions, the adequacy of our reserves for general liability, workers' compensation and property loss, the expected outcome of, and adequacy of our reserves for investigations, inquiries, claims and litigation, expected changes to our contractual obligations and liabilities, the expected ability to recognize deferred tax assets and liabilities and the timing of such recognition, the resolution of tax matters, the expected impact of changes in information technology systems, and changes in our assumptions and expectations.
All such forward-looking statements are intended to enjoy the protection of the safe harbor for forward-looking statements contained in the Private Securities Litigation Reform Act of 1995, as amended. Although we believe there is a reasonable basis for the forward-looking statements, our actual results could be materially different. The most important factors which could cause our actual results to differ from our forward-looking statements are set forth on our description of risk factors in Item 1A to this Form 10-K, which should be read in conjunction with the forward-looking statements in this report. Forward-looking statements speak only as of the date they are made, and we do not undertake any obligation to update any forward-looking statement.

31
Item 7A. Quantitative and Qualitative Disclosures About Market Risk
At February 2, 2019, our exposure to market risk was primarily from interest rate changes on our debt obligations, some of which are at a London Interbank Offered Rate (LIBOR)-plus floating-rate. Our interest rate exposure is primarily due to differences between our floating rate debt obligations compared to our floating rate short-term investments. At February 2, 2019, our floating rate debt exceeded our floating rate short-term investments by approximately $700 million. Based on our balance sheet position at February 2, 2019, the annualized effect of a 0.1 percentage point increase in floating interest rates on our floating rate debt obligations, net of our floating rate short-term investments, would not be significant. In general, we expect our floating rate debt to exceed our floating rate short-term investments over time, but that may vary in different interest rate environments. See further description of our debt and derivative instruments in Notes 16 and 17 to the Financial Statements.
We record our general liability and workers' compensation liabilities at net present value; therefore, these liabilities fluctuate with changes in interest rates. Based on our balance sheet position at February 2, 2019, the annualized effect of a 0.5 percentage point decrease in interest rates would be to decrease earnings before income taxes by $6 million.
In addition, we are exposed to market return fluctuations on our qualified defined benefit pension plans. The value of our pension liabilities is inversely related to changes in interest rates. A 1 percentage point decrease to the weighted average discount rate would increase annual expense by $68 million. To protect against declines in interest rates, we hold high-quality, long-duration bonds and interest rate swaps in our pension plan trust. At year-end, we had hedged 60 percent of the interest rate exposure of our funded status.
As more fully described in Notes 12 and 23 to the Financial Statements, we are exposed to market returns on accumulated team member balances in our nonqualified, unfunded deferred compensation plans. We control the risk of offering the nonqualified plans by making investments in life insurance contracts and prepaid forward contracts on our own common stock that substantially offset our economic exposure to the returns on these plans.
There have been no other material changes in our primary risk exposures or management of market risks since the prior year.

32
Item 8. Financial Statements and Supplementary Data
Report of Management on the Consolidated Financial Statements
Management is responsible for the consistency, integrity, and presentation of the information in the Annual Report. The consolidated financial statements and other information presented in this Annual Report have been prepared in accordance with accounting principles generally accepted in the United States and include necessary judgments and estimates by management.
To fulfill our responsibility, we maintain comprehensive systems of internal control designed to provide reasonable assurance that assets are safeguarded and transactions are executed in accordance with established procedures. The concept of reasonable assurance is based upon recognition that the cost of the controls should not exceed the benefit derived. We believe our systems of internal control provide this reasonable assurance.
The Board of Directors exercised its oversight role with respect to the Corporation's systems of internal control primarily through its Audit Committee, which is comprised of independent directors. The Committee oversees the Corporation's systems of internal control, accounting practices, financial reporting and audits to assess whether their quality, integrity, and objectivity are sufficient to protect shareholders' investments.
In addition, our consolidated financial statements have been audited by Ernst & Young LLP, independent registered public accounting firm, whose report also appears on this page.
Brian C. CornellChairman and Chief Executive Officer
March 13, 2019
Cathy R. SmithExecutive Vice President andChief Financial Officer
Report of Independent Registered Public Accounting Firm
To the Shareholders and the Board of Directors ofTarget Corporation
Opinion on the Financial Statements
We have audited the accompanying consolidated statements of financial position of Target Corporation (the Corporation) as of February 2, 2019and February 3, 2018, the related consolidated statements of operations, comprehensive income, cash flows and shareholders' investment for each of the three years in the period ended February 2, 2019, and the related notes (collectively referred to as the "consolidated financial statements"). In our opinion, the consolidated financial statements present fairly, in all material respects, the financial position of the Corporation at February 2, 2019 and February 3, 2018, and the results of its operations and its cash flows for each of the three years in the period ended February 2, 2019, in conformity with U.S. generally accepted accounting principles.
We also have audited, in accordance with the standards of the Public Company Accounting Oversight Board (United States) (PCAOB), the Corporation's internal control over financial reporting as of February 2, 2019, based on criteria established in Internal Control-Integrated Frameworkissued by the Committee of Sponsoring Organizations of the Treadway Commission (2013 framework) and our report dated March 13, 2019, expressed an unqualified opinion thereon.
Adoption of New Accounting Standards
ASU No. 2014-09As discussed in Note 2 to the consolidated financial statements, the Corporation changed its method for recognizing revenue in 2018 due to the adoption of ASU No. 2014-09, Revenue from Contracts with Customers (Topic 606), as amended, effective February 4, 2018, using the full retrospective approach.
ASU No. 2016-02As discussed in Note 2 to the consolidated financial statements, the Corporation changed its method of accounting for leases in 2018 due to the adoption of ASU No. 2016-02, Leases (Topic 842), as amended, effective February 4, 2018, using the modified retrospective approach.
Basis for Opinion
These financial statements are the responsibility of the Corporation’s management. Our responsibility is to express an opinion on the Corporation's financial statements based on our audits. We are a public accounting firm registered with the PCAOB and are required to be independent with respect to the Corporation in accordance with the U.S. federal securities laws and the applicable rules and regulations of the Securities and Exchange Commission and the PCAOB.
We conducted our audits in accordance with the standards of the PCAOB. Those standards require that we plan and perform the audit to obtain reasonable assurance about whether the financial statements are free of material misstatement, whether due to error or fraud. Our audits included performing procedures to assess the risks of material misstatement of the financial statements, whether due to error or fraud, and performing procedures that respond to those risks. Such procedures included examining, on a test basis, evidence regarding the amounts and disclosures in the financial statements. Our audits also included evaluating the accounting principles used and significant estimates made by management, as well as evaluating the overall presentation of the financial statements. We believe that our audits provide a reasonable basis for our opinion.

33
We have served as the Corporation's auditor since 1931.
Minneapolis, MinnesotaMarch 13, 2019

34
Report of Management on Internal Control over Financial Reporting
Our management is responsible for establishing and maintaining adequate internal control over financial reporting, as such term is defined in Exchange Act Rules 13a-15(f). Under the supervision and with the participation of our management, including our chief executive officer and chief financial officer, we assessed the effectiveness of our internal control over financial reporting as of February 2, 2019, based on the framework in Internal Control—Integrated Framework (2013), issued by the Committee of Sponsoring Organizations of the Treadway Commission (2013 framework). Based on our assessment, we conclude that the Corporation's internal control over financial reporting is effective based on those criteria.
Our internal control over financial reporting as of February 2, 2019, has been audited by Ernst & Young LLP, the independent registered public accounting firm who has also audited our consolidated financial statements, as stated in their report which appears on this page.
Brian C. CornellChairman and Chief Executive Officer
March 13, 2019
Cathy R. SmithExecutive Vice President andChief Financial Officer
Report of Independent Registered Public Accounting Firm
To the Shareholders and the Board of Directors ofTarget Corporation
Opinion on Internal Control over Financial Reporting
We have audited Target Corporation’s internal control over financial reporting as of February 2, 2019, based on criteria established in Internal Control—Integrated Framework issued by the Committee of Sponsoring Organizations of the Treadway Commission (2013 framework) (the COSO criteria). In our opinion, Target Corporation (the Corporation) maintained, in all material respects, effective internal control over financial reporting as of February 2, 2019, based on the COSO criteria.
We also have audited, in accordance with the standards of the Public Company Accounting Oversight Board (United States) (PCAOB), the consolidated statements of financial position of the Corporation as of February 2, 2019 and February 3, 2018, the related consolidated statements of operations, comprehensive income, cash flows and shareholders' investment for each of the three years in the period ended February 2, 2019, and the related notes and our report dated March 13, 2019 expressed an unqualified opinion thereon.
Basis for Opinion
The Corporation’s management is responsible for maintaining effective internal control over financial reporting and for its assessment of the effectiveness of internal control over financial reporting included in the accompanying Report of Management on Internal Control over Financial Reporting. Our responsibility is to express an opinion on the Corporation’s internal control over financial reporting based on our audit. We are a public accounting firm registered with the PCAOB and are required to be independent with respect to the Corporation in accordance with the U.S. federal securities laws and the applicable rules and regulations of the Securities and Exchange Commission and the PCAOB.
We conducted our audit in accordance with the standards of the PCAOB. Those standards require that we plan and perform the audit to obtain reasonable assurance about whether effective internal control over financial reporting was maintained in all material respects.
Our audit included obtaining an understanding of internal control over financial reporting, assessing the risk that a material weakness exists, testing and evaluating the design and operating effectiveness of internal control based on the assessed risk, and performing such other procedures as we considered necessary in the circumstances. We believe that our audit provides a reasonable basis for our opinion.
Definition and Limitations of Internal Control Over Financial Reporting
A company’s internal control over financial reporting is a process designed to provide reasonable assurance regarding the reliability of financial reporting and the preparation of financial statements for external purposes in accordance with generally accepted accounting principles. A company’s internal control over financial reporting includes those policies and procedures that (1) pertain to the maintenance of records that, in reasonable detail, accurately and fairly reflect the transactions and dispositions of the assets of the company; (2) provide reasonable assurance that transactions are recorded as necessary to permit preparation of financial statements in accordance with generally accepted accounting principles, and that receipts and expenditures of the company are being made only in accordance with authorizations of management and directors of the company; and (3) provide reasonable assurance regarding prevention or timely detection of unauthorized acquisition, use, or disposition of the company’s assets that could have a material effect on the financial statements.
Because of its inherent limitations, internal control over financial reporting may not prevent or detect misstatements. Also, projections of any evaluation of effectiveness to future periods are subject to the risk that controls may become inadequate because of changes in conditions, or that the degree of compliance with the policies or procedures may deteriorate.
Minneapolis, MinnesotaMarch 13, 2019

35
Consolidated Statements of Operations
(millions, except per share data) 20182017
As Adjusted (a)2016
As Adjusted (a)
Sales $ 74,433 $ 71,786 $ 69,414Other revenue 923 928 857Total revenue 75,356 72,714 70,271Cost of sales 53,299 51,125 49,145Selling, general and administrative expenses 15,723 15,140 14,217Depreciation and amortization (exclusive of depreciation included in cost
of sales) 2,224 2,225 2,045Operating income 4,110 4,224 4,864Net interest expense 461 653 991Net other (income) / expense (27) (59) (88)Earnings from continuing operations before income taxes 3,676 3,630 3,961Provision for income taxes 746 722 1,295Net earnings from continuing operations 2,930 2,908 2,666Discontinued operations, net of tax 7 6 68Net earnings $ 2,937 $ 2,914 $ 2,734Basic earnings per share
Continuing operations $ 5.54 $ 5.32 $ 4.61Discontinued operations 0.01 0.01 0.12
Net earnings per share $ 5.55 $ 5.32 $ 4.73Diluted earnings per share
Continuing operations $ 5.50 $ 5.29 $ 4.58Discontinued operations 0.01 0.01 0.12
Net earnings per share $ 5.51 $ 5.29 $ 4.69Weighted average common shares outstanding
Basic 528.6 546.8 577.6Diluted 533.2 550.3 582.5
Antidilutive shares — 4.1 0.1Note: Per share amounts may not foot due to rounding.
See accompanying Notes to Consolidated Financial Statements.(a) Refer to Note 2 regarding the adoption of new accounting standards for revenue recognition, leases, and
pensions.

36
Consolidated Statements of Comprehensive Income
(millions) 20182017
As Adjusted (a)2016
As Adjusted (a)
Net earnings $ 2,937 $ 2,914 $ 2,734Other comprehensive (loss) / income, net of tax
Pension and other benefit liabilities, net of tax (52) 2 (13)Currency translation adjustment and cash flow hedges, net of tax (6) 6 4
Other comprehensive (loss) / income (58) 8 (9)Comprehensive income $ 2,879 $ 2,922 $ 2,725
See accompanying Notes to Consolidated Financial Statements.(a) Refer to Note 2 regarding the adoption of new accounting standards for revenue recognition, leases, and
pensions.

37
Consolidated Statements of Financial Position
(millions, except footnotes)February 2,
2019
February 3, 2018
As Adjusted (a)
AssetsCash and cash equivalents $ 1,556 $ 2,643Inventory 9,497 8,597Other current assets 1,466 1,300
Total current assets 12,519 12,540Property and equipment
Land 6,064 6,095Buildings and improvements 29,240 28,131Fixtures and equipment 5,912 5,623Computer hardware and software 2,544 2,645Construction-in-progress 460 440Accumulated depreciation (18,687) (18,398)Property and equipment, net 25,533 24,536
Operating lease assets 1,965 1,884Other noncurrent assets 1,273 1,343Total assets $ 41,290 $ 40,303Liabilities and shareholders' investmentAccounts payable $ 9,761 $ 8,677Accrued and other current liabilities 4,201 4,094Current portion of long-term debt and other borrowings 1,052 281
Total current liabilities 15,014 13,052Long-term debt and other borrowings 10,223 11,117Noncurrent operating lease liabilities 2,004 1,924Deferred income taxes 972 693Other noncurrent liabilities 1,780 1,866
Total noncurrent liabilities 14,979 15,600Shareholders' investment
Common stock 43 45Additional paid-in capital 6,042 5,858Retained earnings 6,017 6,495Accumulated other comprehensive loss (805) (747)Total shareholders' investment 11,297 11,651
Total liabilities and shareholders' investment $ 41,290 $ 40,303Common Stock Authorized 6,000,000,000 shares, $0.0833 par value; 517,761,600 shares issued and outstanding at February 2, 2019; 541,681,670 shares issued and outstanding at February 3, 2018.Preferred Stock Authorized 5,000,000 shares, $0.01 par value; no shares were issued or outstanding at February 2, 2019 or February 3, 2018.
See accompanying Notes to Consolidated Financial Statements.(a) Refer to Note 2 regarding the adoption of new accounting standards for revenue recognition, leases, and
pensions.

38
Consolidated Statements of Cash Flows
(millions) 20182017
As Adjusted (a)2016
As Adjusted (a)
Operating activitiesNet earnings $ 2,937 $ 2,914 $ 2,734Earnings from discontinued operations, net of tax 7 6 68Net earnings from continuing operations 2,930 2,908 2,666Adjustments to reconcile net earnings to cash provided by operations:
Depreciation and amortization 2,474 2,476 2,318Share-based compensation expense 132 112 113Deferred income taxes 322 (188) 40Loss on debt extinguishment — 123 422Noncash losses / (gains) and other, net 95 208 (11)Changes in operating accounts:
Inventory (900) (348) 293Other assets (299) (156) 56Accounts payable 1,127 1,307 (166)Accrued and other liabilities 89 419 (394)
Cash provided by operating activities—continuing operations 5,970 6,861 5,337Cash provided by operating activities—discontinued operations 3 74 107Cash provided by operations 5,973 6,935 5,444Investing activities
Expenditures for property and equipment (3,516) (2,533) (1,547)Proceeds from disposal of property and equipment 85 31 46Cash paid for acquisitions, net of cash assumed — (518) —Other investments 15 (55) 28
Cash required for investing activities (3,416) (3,075) (1,473)Financing activities
Additions to long-term debt — 739 1,977Reductions of long-term debt (281) (2,192) (2,649)Dividends paid (1,335) (1,338) (1,348)Repurchase of stock (2,124) (1,046) (3,706)Stock option exercises 96 108 221
Cash required for financing activities (3,644) (3,729) (5,505)Net (decrease) / increase in cash and cash equivalents (1,087) 131 (1,534)Cash and cash equivalents at beginning of period 2,643 2,512 4,046Cash and cash equivalents at end of period $ 1,556 $ 2,643 $ 2,512Supplemental information
Interest paid, net of capitalized interest $ 476 $ 678 $ 999Income taxes paid 373 934 1,514Leased assets obtained in exchange for new finance lease liabilities 130 139 252Leased assets obtained in exchange for new operating lease liabilities 246 212 148
See accompanying Notes to Consolidated Financial Statements.
(a) Refer to Note 2 regarding the adoption of new accounting standards for revenue recognition, leases, andpensions.

39
Consolidated Statements of Shareholders' Investment
(millions)
CommonStock
Shares
StockPar
Value
AdditionalPaid-inCapital
RetainedEarnings
As Adjusted (a)
Accumulated OtherComprehensive(Loss) / Income Total
January 30, 2016 602.2 $ 50 $ 5,348 $ 8,196 $ (629) $ 12,965Adoption of ASC Topic 842 (Leases) — — — (43) — (43)Net earnings — — — 2,734 — 2,734Other comprehensive loss — — — — (9) (9)Dividends declared — — — (1,359) — (1,359)Repurchase of stock (50.9) (4) — (3,682) — (3,686)Stock options and awards 4.9 — 313 — — 313January 28, 2017 556.2 $ 46 $ 5,661 $ 5,846 $ (638) $ 10,915Net earnings — — — 2,914 — 2,914Other comprehensive income — — — — 8 8Dividends declared — — — (1,356) — (1,356)Repurchase of stock (17.6) (1) — (1,026) — (1,027)Stock options and awards 3.1 — 197 — — 197Reclassification of tax effects to
retained earnings — — — 117 (117) —February 3, 2018 541.7 $ 45 $ 5,858 $ 6,495 $ (747) $ 11,651Net earnings — — — 2,937 — 2,937Other comprehensive loss — — — — (58) (58)Dividends declared — — — (1,347) — (1,347)Repurchase of stock (27.2) (2) — (2,068) — (2,070)Stock options and awards 3.3 — 184 — — 184February 2, 2019 517.8 $ 43 $ 6,042 $ 6,017 $ (805) $ 11,297
We declared $2.54, $2.46, and $2.36 dividends per share for the twelve months ended February 2, 2019, February 3, 2018, and January 28, 2017, respectively.
See accompanying Notes to Consolidated Financial Statements.(a) Refer to Note 2 regarding the adoption of new accounting standards for revenue recognition, leases, and
pensions.

40
Notes to Consolidated Financial Statements
1. Summary of Accounting Policies
Organization We are a general merchandise retailer selling products to our guests through our stores and digital channels.
We operate as a single segment that includes all of our continuing operations, which are designed to enable guests to purchase products seamlessly in stores or through our digital channels. Nearly all of our revenues are generated in the United States (U.S.). The vast majority of our long-lived assets are located within the U.S.
Consolidation The consolidated financial statements include the balances of Target and its subsidiaries after elimination of intercompany balances and transactions. All material subsidiaries are wholly owned. We consolidate variable interest entities where it has been determined that Target is the primary beneficiary of those entities' operations.
Use of estimates The preparation of our consolidated financial statements in conformity with U.S. generally accepted accounting principles (GAAP) requires management to make estimates and assumptions affecting reported amounts in the consolidated financial statements and accompanying notes. Actual results may differ significantly from those estimates.
Fiscal year Our fiscal year ends on the Saturday nearest January 31. Unless otherwise stated, references to years in this report relate to fiscal years, rather than to calendar years. Fiscal 2018 ended February 2, 2019, and consisted of 52 weeks. Fiscal 2017 ended February 3, 2018, and consisted of 53 weeks. Fiscal 2016 ended January 28, 2017, and consisted of 52 weeks. Fiscal 2019 will end February 1, 2020, and will consist of 52 weeks.
Accounting policies Our accounting policies are disclosed in the applicable Notes to the Consolidated Financial Statements. Certain prior-year amounts have been reclassified to conform to the current year presentation. Note 2 provides information about our adoption of new accounting standards for revenue recognition, leases, and pensions.
2. Accounting Standards Adopted
Revenue Recognition
We adopted Accounting Standards Update (ASU) No. 2014-09—Revenue from Contracts with Customers (Topic 606), as amended, as of February 4, 2018, using the full retrospective approach. The new standard did not materially affect our consolidated net earnings, financial position, or cash flows. The new standard resulted in minor changes to the timing of recognition of revenues for certain promotional gift card programs.
For 2017 and 2016, we reclassified profit-sharing income under our credit card program agreement to Other Revenue from Selling, General and Administrative Expenses (SG&A Expenses). In addition, we reclassified certain advertising, rental, and other miscellaneous revenues, none of which was individually significant, from Sales and SG&A Expenses to Other Revenue.
Leases
We adopted ASU No. 2016-02—Leases (Topic 842), as amended, as of February 4, 2018, using the modified retrospective approach. The modified retrospective approach provides a method for recording existing leases at adoption and in comparative periods that approximates the results of a full retrospective approach. In addition, we elected the package of practical expedients permitted under the transition guidance within the new standard, which among other things, allowed us to carry forward the historical lease classification. We also elected the practical expedient related to land easements, allowing us to carry forward our accounting treatment for land easements on existing agreements.
In addition, we elected the hindsight practical expedient to determine the lease term for existing leases. Our election of the hindsight practical expedient resulted in the shortening of lease terms for certain existing leases and the useful lives of corresponding leasehold improvements. In our application of hindsight, we evaluated the performance of the leased stores and the associated markets in relation to our overall real estate strategies, which resulted in the determination that most renewal options would not be reasonably certain in determining the expected lease term.

41
Adoption of the new standard resulted in the recording of additional net lease assets and lease liabilities of approximately $1.3 billion and $1.4 billion respectively, as of February 4, 2018. The difference between the additional lease assets and lease liabilities, net of the deferred tax impact, was recorded as an adjustment to retained earnings. The standard did not materially impact our consolidated net earnings and had no impact on cash flows.
Pensions
In 2018, we adopted ASU No. 2017-07—Compensation – Retirement Benefits (Topic 715) using the full retrospective approach. The new standard requires employers to disaggregate and present separately the current service cost component from the other components of net benefit cost within the Consolidated Statement of Operations. For 2017 and 2016, we reclassified $(59) million and $(88) million, respectively, of non-service cost components of net benefit cost to Net Other (Income) / Expense from SG&A Expenses on our Consolidated Statements of Operations.
Effect of Accounting Standards Adoption on Consolidated Statement of Operations
2017As
PreviouslyReported
Effect of the Adoption of
ASC Topic 606(Revenue
Recognition)
ASC Topic 842(Leases)
ASU 2017-07
(Pension)(millions, except per share data) (unaudited)2017
As AdjustedSales $ 71,879 $ (93) (a) $ — $ — $ 71,786Other revenue — 928
(a)— — 928
Total revenue 71,879 835 — — 72,714Cost of sales 51,125 — — — 51,125Selling, general and administrative expenses 14,248 835
(a)(2)
(b)59
(c)15,140
Depreciation and amortization (exclusive ofdepreciation included in cost of sales) 2,194 — 31
(b)— 2,225
Operating income 4,312 — (29) (59) 4,224Net interest expense 666 — (13)
(b)— 653
Net other (income) / expense — — — (59)(c)
(59)Earnings from continuing operations before income
taxes 3,646 — (16) — 3,630Provision for income taxes 718 (2) 6 — 722Net earnings from continuing operations 2,928 2 (22) — 2,908Discontinued operations, net of tax 6 — — — 6Net earnings $ 2,934 $ 2 $ (22) $ — $ 2,914Basic earnings per share
Continuing operations $ 5.35 $ 5.32Discontinued operations 0.01 0.01
Net earnings per share $ 5.36 $ 5.32Diluted earnings per share
Continuing operations $ 5.32 $ 5.29Discontinued operations 0.01 0.01
Net earnings per share $ 5.33 $ 5.29
Note: 2017 was a 53-week year. Per share amounts may not foot due to rounding. The sum of "As Previously Reported" amounts and effects of the adoption of the new standards may not equal "As Adjusted" amounts due to rounding.
Footnote explanations are provided on page 42.
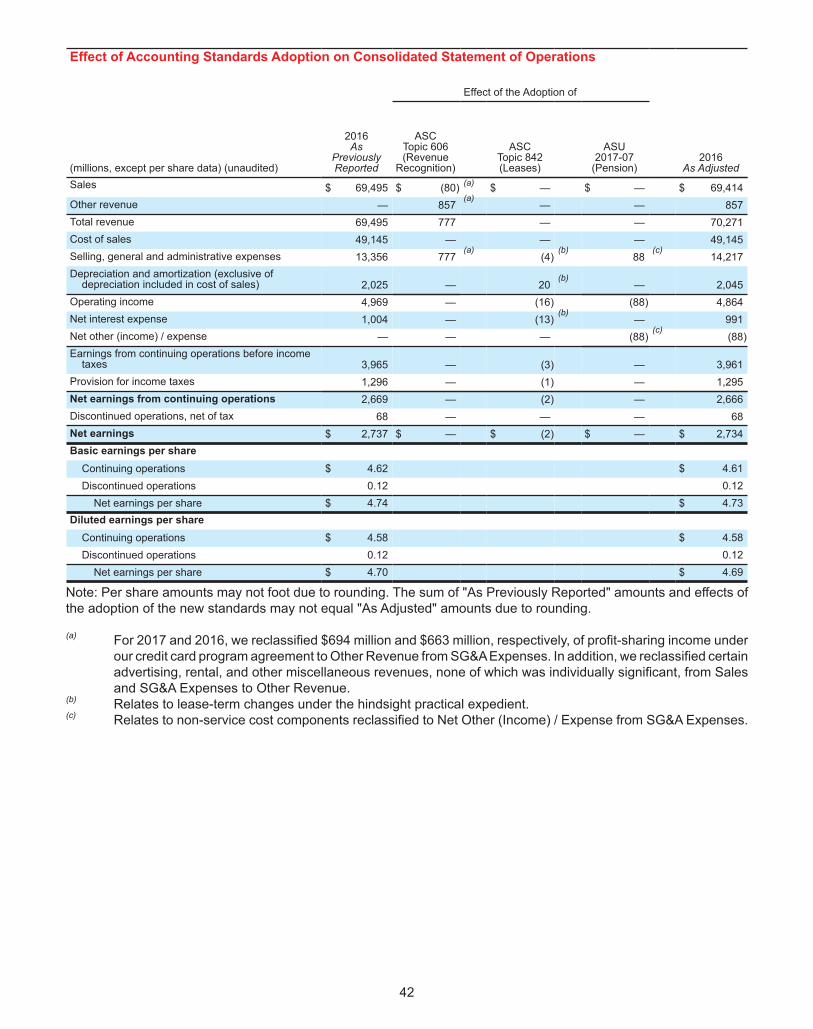
42
Effect of Accounting Standards Adoption on Consolidated Statement of Operations
2016As
PreviouslyReported
Effect of the Adoption of
ASC Topic 606(Revenue
Recognition)
ASCTopic 842(Leases)
ASU 2017-07
(Pension)(millions, except per share data) (unaudited)2016
As AdjustedSales $ 69,495 $ (80) (a) $ — $ — $ 69,414Other revenue — 857
(a)— — 857
Total revenue 69,495 777 — — 70,271Cost of sales 49,145 — — — 49,145Selling, general and administrative expenses 13,356 777
(a)(4)
(b)88
(c)14,217
Depreciation and amortization (exclusive ofdepreciation included in cost of sales) 2,025 — 20
(b)— 2,045
Operating income 4,969 — (16) (88) 4,864Net interest expense 1,004 — (13)
(b)— 991
Net other (income) / expense — — — (88)(c)
(88)Earnings from continuing operations before income
taxes 3,965 — (3) — 3,961Provision for income taxes 1,296 — (1) — 1,295Net earnings from continuing operations 2,669 — (2) — 2,666Discontinued operations, net of tax 68 — — — 68Net earnings $ 2,737 $ — $ (2) $ — $ 2,734Basic earnings per share
Continuing operations $ 4.62 $ 4.61Discontinued operations 0.12 0.12
Net earnings per share $ 4.74 $ 4.73Diluted earnings per share
Continuing operations $ 4.58 $ 4.58Discontinued operations 0.12 0.12
Net earnings per share $ 4.70 $ 4.69
Note: Per share amounts may not foot due to rounding. The sum of "As Previously Reported" amounts and effects of the adoption of the new standards may not equal "As Adjusted" amounts due to rounding.
(a) For 2017 and 2016, we reclassified $694 million and $663 million, respectively, of profit-sharing income underour credit card program agreement to Other Revenue from SG&A Expenses. In addition, we reclassified certainadvertising, rental, and other miscellaneous revenues, none of which was individually significant, from Salesand SG&A Expenses to Other Revenue.
(b) Relates to lease-term changes under the hindsight practical expedient.(c) Relates to non-service cost components reclassified to Net Other (Income) / Expense from SG&A Expenses.

43
Effect of Accounting Standards Adoption on Consolidated Statement of Financial Position
Effect of the Adoption of
(millions) (unaudited)
February 3,2018
As Previously Reported
ASCTopic 606(Revenue
Recognition)
ASCTopic 842(Leases)
February 3,2018
As Adjusted
Assets
Cash and cash equivalents $ 2,643 $ — $ — $ 2,643Inventory 8,657 (60) (a) — 8,597Other current assets 1,264 60 (a) (24) (b) 1,300
Total current assets 12,564 — (24) 12,540Property and equipment
Land 6,095 — — 6,095Buildings and improvements 28,396 — (265) (c) 28,131Fixtures and equipment 5,623 — — 5,623Computer hardware and software 2,645 — — 2,645Construction-in-progress 440 — — 440Accumulated depreciation (18,181) — (217) (c) (18,398)Property and equipment, net 25,018 — (482) 24,536
Operating lease assets — — 1,884 (d) 1,884Other noncurrent assets 1,417 — (74) (e) 1,343Total assets $ 38,999 $ — $ 1,304 $ 40,303Liabilities and shareholders’ investment
Accounts payable $ 8,677 $ — $ — $ 8,677Accrued and other current liabilities 4,254 (14) (k) (146) (f) 4,094Current portion of long-term debt and other
borrowings 270 — 11 (g) 281Total current liabilities 13,201 (14) (135) 13,052
Long-term debt and other borrowings 11,317 — (200) (g) 11,117Noncurrent operating lease liabilities — — 1,924 (h) 1,924Deferred income taxes 713 4 (24) 693Other noncurrent liabilities 2,059 — (192) (i) 1,866
Total noncurrent liabilities 14,089 4 1,508 15,600Shareholders’ investment
Common stock 45 — — 45Additional paid-in capital 5,858 — — 5,858Retained earnings 6,553 10 (k) (69) (j) 6,495Accumulated other comprehensive loss (747) — — (747)Total shareholders’ investment 11,709 10 (69) 11,651
Total liabilities and shareholders’ investment $ 38,999 $ — $ 1,304 $ 40,303Note: The sum of "As Previously Reported" amounts and effects of the adoption of the new standards may not equal "As Adjusted" amounts due to rounding. (a) Represents estimated merchandise returns, which were reclassified from Inventory to Other Current Assets. (b) Represents prepaid rent reclassified to Operating Lease Assets. (c) Represents impact of changes in finance lease terms and related leasehold improvements (net of accumulated
depreciation) under the hindsight practical expedient and derecognition of approximately $135 million of non-Target owned properties that were consolidated under previously existing build-to-suit accounting rules.
(d) Represents capitalization of operating lease assets and reclassification of leasehold acquisition costs, straight-line rent accrual, and tenant incentives.
44
(e) Represents reclassification of leasehold acquisition costs to Operating Lease Assets.(f) Represents reclassification of straight-line rent accrual to Operating Lease Assets, partially offset by recognition
of the current portion of operating lease liabilities.(g) Represents the impact of changes in financing lease terms for certain leases due to the election of the hindsight
practical expedient.(h) Represents recognition of operating lease liabilities. (i) Represents derecognition of approximately $135 million of liabilities related to non-Target owned properties
that were consolidated under previously existing build-to-suit accounting rules and reclassification of tenant incentives to Operating Lease Assets.
(j) Represents the retained earnings impact of lease-term changes due to the use of hindsight, primarily from the shortening of lease terms for certain existing leases and useful lives of corresponding leasehold improvements.
(k) Primarily represents the impact of a change in timing of revenue recognition for certain promotional gift card programs.
3. Revenues
General merchandise sales represent the vast majority of our revenues. We also earn revenues from a variety of other sources, most notably credit card profit sharing income from our arrangement with TD Bank Group (TD).
During 2018, we reclassified certain income streams, including credit card profit sharing income, to Other Revenue on our Consolidated Statements of Operations and conformed prior periods. Note 2 provides additional information.
Revenues(millions) 2018 2017 2016Apparel and accessories $ 15,004 $ 14,662 $ 14,304Beauty and household essentials 17,726 17,025 16,550Food and beverage 14,585 14,256 13,831Hardlines 12,709 12,062 11,507Home furnishings and décor 14,298 13,672 13,130Other 111 109 92
Sales 74,433 71,786 69,414
Credit card profit sharing 673 694 663Other 250 234 194
Other revenue 923 928 857
Total revenue $ 75,356 $ 72,714 $ 70,271
Merchandise sales – We record almost all retail store revenues at the point of sale. Digital channel originated sales may include shipping revenue and are recorded upon delivery to the guest or upon guest pickup at the store. Total revenues do not include sales tax because we are a pass-through conduit for collecting and remitting sales taxes. Generally, guests may return national brand merchandise within 90 days of purchase and owned and exclusive brands within one year of purchase. Sales are recognized net of expected returns, which we estimate using historical return patterns and our expectation of future returns. As of February 2, 2019, February 3, 2018, and January 28, 2017, the liability for estimated returns was $116 million, $110 million, and $103 million, respectively. We have not historically had material adjustments to our returns estimates.
We routinely enter into arrangements with vendors whereby we do not purchase or pay for merchandise until the merchandise is ultimately sold to a guest. Under the vast majority of these arrangements, which represent less than 5 percent of consolidated sales, we record revenue and related costs gross. We concluded that we are the principal in these transactions for a number of reasons, most notably because we 1) control the overall economics of the transactions, including setting the sales price and realizing the majority of cash flows from the sale, 2) control the relationship with the customer, and 3) are responsible for fulfilling the promise to provide goods to the customer. Merchandise received under these arrangements is not included in Inventory in our Consolidated Statements of Financial Position because the purchase and sale of this inventory are virtually simultaneous.

45
Revenue from Target gift card sales is recognized upon gift card redemption, which is typically within one year of issuance. Our gift cards do not expire. Based on historical redemption rates, a small and relatively stable percentage of gift cards will never be redeemed, referred to as "breakage." Estimated breakage revenue is recognized over time in proportion to actual gift card redemptions.
(millions)February 3,
2018
Gift Cards Issued During
Current Period But Not
Redeemed (a)
RevenueRecognized
FromBeginning
LiabilityFebruary 2,
2019Gift card liability $ 727 $ 645 $ (532) $ 840
(a) Net of estimated breakage.
Guests receive a 5 percent discount on nearly all purchases and receive free shipping at Target.com when they use their Target Debit Card, Target Credit Card, or Target MasterCard (REDcards). The discount is included as a sales reduction in our Consolidated Statements of Operations and was $953 million, $933 million, and $899 million in 2018, 2017, and 2016, respectively.
Credit card profit sharing – We receive payments under a credit card program agreement with TD. Under the agreement, we receive a percentage of the profits generated by the Target Credit Card and Target MasterCard receivables in exchange for performing account servicing and primary marketing functions. TD underwrites, funds, and owns Target Credit Card and Target MasterCard receivables, controls risk management policies, and oversees regulatory compliance.
Other – Includes rental income, advertising, membership fees, and other miscellaneous revenues, none of which are individually significant.
4. Cost of Sales and Selling, General and Administrative Expenses
The following table illustrates the primary items classified in each major expense category:
Cost of Sales Selling, General and Administrative ExpensesTotal cost of products sold including• Freight expenses associated with moving merchandise from our vendors to and between our distribution centers and our retail stores• Vendor income that is not reimbursement of specific, incremental, and identifiable costsInventory shrinkMarkdownsOutbound shipping and handling expenses associated with sales to our guestsPayment term cash discountsDistribution center costs, including compensation and benefits costs and depreciationImport costs
Compensation and benefit costs for stores and headquartersOccupancy and operating costs of retail and headquarters facilitiesAdvertising, offset by vendor income that is a reimbursement of specific, incremental, and identifiable costsPre-opening and exit costs of stores and other facilitiesCredit cards servicing expensesCosts associated with accepting 3rd party bank issued payment cardsLitigation and defense costs and related insurance recoveryOther administrative costs
Note: The classification of these expenses varies across the retail industry.

46
5. Consideration Received from Vendors
We receive consideration for a variety of vendor-sponsored programs, such as volume rebates, markdown allowances, promotions, and advertising allowances and for our compliance programs, referred to as "vendor income." Additionally, under our compliance programs, vendors are charged for merchandise shipments that do not meet our requirements (violations), such as late or incomplete shipments. Substantially all consideration received is recorded as a reduction of Cost of Sales.
We establish a receivable for vendor income that is earned but not yet received. Based on provisions of the agreements in place, this receivable is computed by estimating the amount earned when we have completed our performance. We perform detailed analyses to determine the appropriate level of the receivable in the aggregate. The majority of year-end receivables associated with these activities are collected within the following fiscal quarter. We have not historically had significant write-offs for these receivables.
6. Advertising Costs
Advertising costs, which primarily consist of newspaper circulars, digital advertisements, and media broadcast, are generally expensed at first showing or distribution of the advertisement.
Advertising Costs (millions) 2018 2017 2016Gross advertising costs $ 1,494 $ 1,476 $ 1,503Vendor income — (19) (38)Net advertising costs $ 1,494 $ 1,457 $ 1,465
7. Fair Value Measurements
Fair value measurements are reported in one of three levels based on the lowest level of significant input used: Level 1 (unadjusted quoted prices in active markets); Level 2 (observable market inputs, other than quoted prices included in Level 1); and Level 3 (unobservable inputs that cannot be corroborated by observable market data).
Fair Value Measurements - Recurring Basis Fair Value at
(millions) ClassificationPricing
CategoryFebruary 2,
2019February 3,
2018Assets
Short-term investments (a) Cash and Cash Equivalents Level 1 $ 769 $ 1,906Prepaid forward contracts (b) Other Current Assets Level 1 19 23Interest rate swaps (c) Other Noncurrent Assets Level 2 10 —
LiabilitiesInterest rate swaps (c) Other Current Liabilities Level 2 3 —Interest rate swaps (c) Other Noncurrent Liabilities Level 2 — 6
(a) Carrying value approximates fair value because maturities are less than three months.(b) Initially valued at transaction price. Subsequently valued by reference to the market price of Target common
stock.(c) Valuations are based on observable inputs to the valuation model (e.g., interest rates and credit spreads). See
Note 17 for additional information on interest rate swaps.
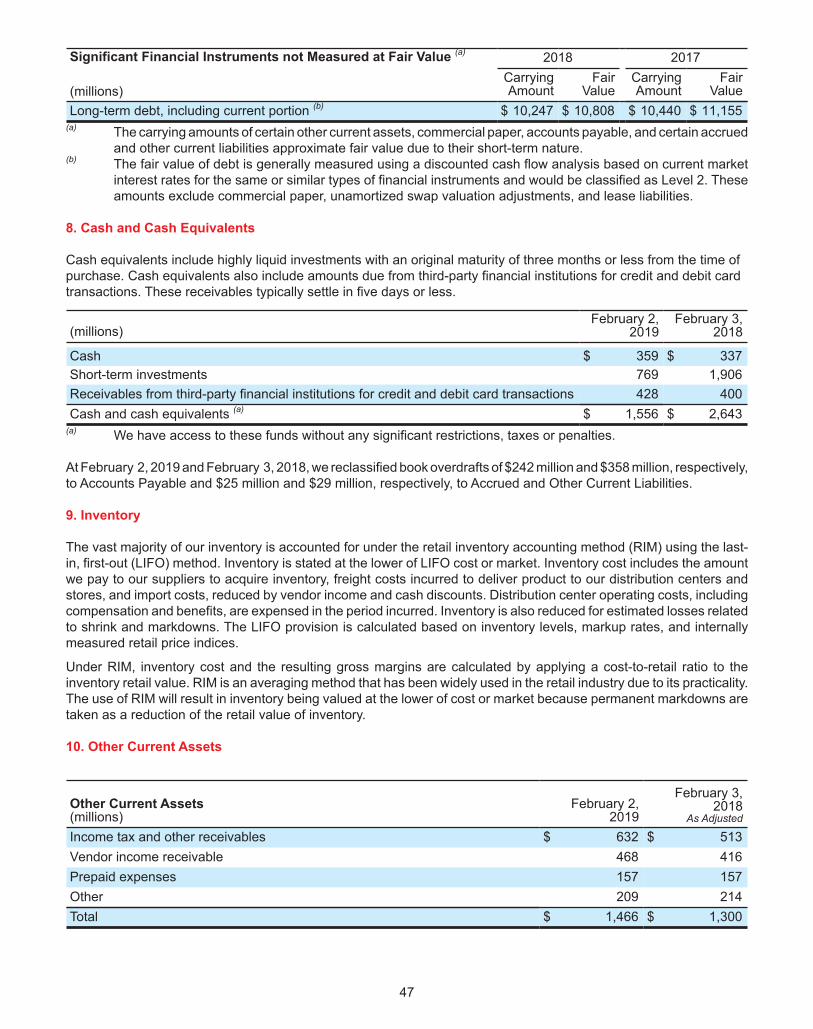
47
Significant Financial Instruments not Measured at Fair Value (a)
(millions)
2018 2017CarryingAmount
FairValue
CarryingAmount
FairValue
Long-term debt, including current portion (b) $ 10,247 $ 10,808 $ 10,440 $ 11,155(a) The carrying amounts of certain other current assets, commercial paper, accounts payable, and certain accrued
and other current liabilities approximate fair value due to their short-term nature.(b) The fair value of debt is generally measured using a discounted cash flow analysis based on current market
interest rates for the same or similar types of financial instruments and would be classified as Level 2. Theseamounts exclude commercial paper, unamortized swap valuation adjustments, and lease liabilities.
8. Cash and Cash Equivalents
Cash equivalents include highly liquid investments with an original maturity of three months or less from the time of purchase. Cash equivalents also include amounts due from third-party financial institutions for credit and debit card transactions. These receivables typically settle in five days or less.
(millions)February 2,
2019February 3,
2018
Cash $ 359 $ 337Short-term investments 769 1,906Receivables from third-party financial institutions for credit and debit card transactions 428 400Cash and cash equivalents (a) $ 1,556 $ 2,643
(a) We have access to these funds without any significant restrictions, taxes or penalties.
At February 2, 2019 and February 3, 2018, we reclassified book overdrafts of $242 million and $358 million, respectively, to Accounts Payable and $25 million and $29 million, respectively, to Accrued and Other Current Liabilities.
9. Inventory
The vast majority of our inventory is accounted for under the retail inventory accounting method (RIM) using the last-in, first-out (LIFO) method. Inventory is stated at the lower of LIFO cost or market. Inventory cost includes the amount we pay to our suppliers to acquire inventory, freight costs incurred to deliver product to our distribution centers and stores, and import costs, reduced by vendor income and cash discounts. Distribution center operating costs, including compensation and benefits, are expensed in the period incurred. Inventory is also reduced for estimated losses related to shrink and markdowns. The LIFO provision is calculated based on inventory levels, markup rates, and internally measured retail price indices.
Under RIM, inventory cost and the resulting gross margins are calculated by applying a cost-to-retail ratio to the inventory retail value. RIM is an averaging method that has been widely used in the retail industry due to its practicality. The use of RIM will result in inventory being valued at the lower of cost or market because permanent markdowns are taken as a reduction of the retail value of inventory.
10. Other Current Assets
Other Current Assets(millions)
February 2,2019
February 3, 2018
As Adjusted
Income tax and other receivables $ 632 $ 513Vendor income receivable 468 416Prepaid expenses 157 157Other 209 214Total $ 1,466 $ 1,300

48
11. Property and Equipment
Property and equipment, including assets acquired under finance leases, is depreciated using the straight-line method over estimated useful lives or lease terms if shorter. We amortize leasehold improvements purchased after the beginning of the initial lease term over the shorter of the assets' useful lives or a term that includes the original lease term, plus any renewals that are reasonably certain at the date the leasehold improvements are acquired. Depreciation expense for 2018, 2017, and 2016 was $2,460 million, $2,462 million, and $2,305 million, respectively, including depreciation expense included in Cost of Sales. For income tax purposes, accelerated depreciation methods are generally used. Repair and maintenance costs are expensed as incurred. Facility pre-opening costs, including supplies and payroll, are expensed as incurred.
Estimated Useful Lives Life (Years)Buildings and improvements 8-39Fixtures and equipment 2-15Computer hardware and software 2-7
We review long-lived assets for impairment when events or changes in circumstances—such as a decision to relocate or close a store or distribution center, make significant software changes or discontinue projects—indicate that the asset's carrying value may not be recoverable. We recognized impairment losses of $92 million, $91 million, and $43 million during 2018, 2017, and 2016, respectively. The impairment losses primarily resulted from planned or completed store closures, and for 2017, supply chain changes. For asset groups classified as held for sale, the carrying value is compared with the fair value less cost to sell. We estimate fair value by obtaining market appraisals, valuations from third party brokers, or other valuation techniques. Impairments are recorded in SG&A Expenses on the Consolidated Statements of Operations.
12. Other Noncurrent Assets
Other Noncurrent Assets(millions)
February 2,2019
February 3, 2018
As Adjusted
Goodwill and intangible assets $ 699 $ 709Company-owned life insurance investments, net of loans 380 383Pension asset 11 46Other 183 205Total $ 1,273 $ 1,343
13. Goodwill and Intangible Assets
Goodwill totaled $633 million and $630 million at February 2, 2019 and February 3, 2018, respectively. In December 2017, we acquired Shipt, Inc., an online same-day delivery service platform, for approximately $550 million. We identified intangible assets of $40 million, primarily related to the tradename, customer relationships, and shopper lists, net tangible assets of $10 million, and goodwill of $500 million. The goodwill recorded primarily represents the value of significantly accelerating our ability to provide same-day delivery services to our guests.
No impairments were recorded in 2018, 2017, or 2016 as a result of the annual goodwill impairment tests performed.
Intangible assets, net of accumulated amortization, totaled $66 million and $79 million as of February 2, 2019, and February 3, 2018, respectively, primarily related to trademarks and customer relationships. We use both accelerated and straight-line methods to amortize definite-lived intangible assets over 4 to 15 years. The weighted average life of intangible assets was 8 years at February 2, 2019. Amortization expense was $14 million, $14 million, and $13 millionin 2018, 2017, and 2016, respectively, and is estimated to be less than $15 million annually through 2023.
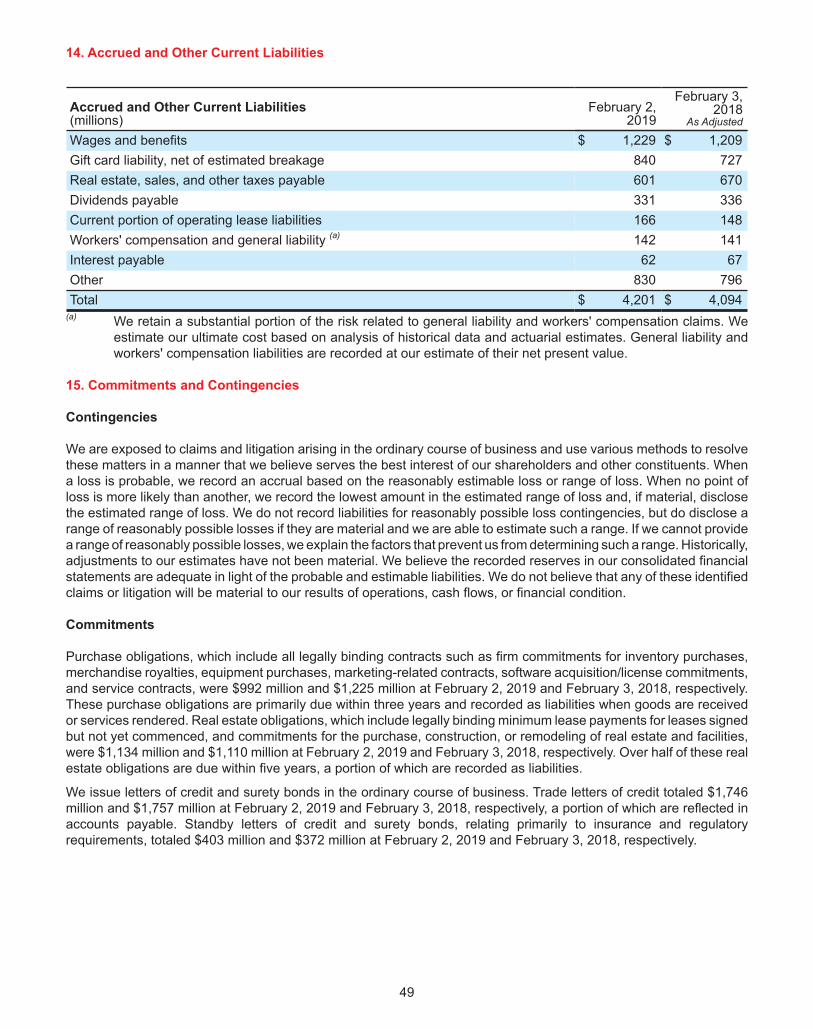
49
14. Accrued and Other Current Liabilities
Accrued and Other Current Liabilities(millions)
February 2,2019
February 3, 2018
As Adjusted
Wages and benefits $ 1,229 $ 1,209Gift card liability, net of estimated breakage 840 727Real estate, sales, and other taxes payable 601 670Dividends payable 331 336Current portion of operating lease liabilities 166 148Workers' compensation and general liability (a) 142 141Interest payable 62 67Other 830 796Total $ 4,201 $ 4,094
(a) We retain a substantial portion of the risk related to general liability and workers' compensation claims. Weestimate our ultimate cost based on analysis of historical data and actuarial estimates. General liability andworkers' compensation liabilities are recorded at our estimate of their net present value.
15. Commitments and Contingencies
Contingencies
We are exposed to claims and litigation arising in the ordinary course of business and use various methods to resolve these matters in a manner that we believe serves the best interest of our shareholders and other constituents. When a loss is probable, we record an accrual based on the reasonably estimable loss or range of loss. When no point of loss is more likely than another, we record the lowest amount in the estimated range of loss and, if material, disclose the estimated range of loss. We do not record liabilities for reasonably possible loss contingencies, but do disclose a range of reasonably possible losses if they are material and we are able to estimate such a range. If we cannot provide a range of reasonably possible losses, we explain the factors that prevent us from determining such a range. Historically, adjustments to our estimates have not been material. We believe the recorded reserves in our consolidated financial statements are adequate in light of the probable and estimable liabilities. We do not believe that any of these identified claims or litigation will be material to our results of operations, cash flows, or financial condition.
Commitments
Purchase obligations, which include all legally binding contracts such as firm commitments for inventory purchases, merchandise royalties, equipment purchases, marketing-related contracts, software acquisition/license commitments, and service contracts, were $992 million and $1,225 million at February 2, 2019 and February 3, 2018, respectively. These purchase obligations are primarily due within three years and recorded as liabilities when goods are received or services rendered. Real estate obligations, which include legally binding minimum lease payments for leases signed but not yet commenced, and commitments for the purchase, construction, or remodeling of real estate and facilities, were $1,134 million and $1,110 million at February 2, 2019 and February 3, 2018, respectively. Over half of these real estate obligations are due within five years, a portion of which are recorded as liabilities.
We issue letters of credit and surety bonds in the ordinary course of business. Trade letters of credit totaled $1,746 million and $1,757 million at February 2, 2019 and February 3, 2018, respectively, a portion of which are reflected in accounts payable. Standby letters of credit and surety bonds, relating primarily to insurance and regulatory requirements, totaled $403 million and $372 million at February 2, 2019 and February 3, 2018, respectively.

50
16. Commercial Paper and Long-Term Debt
At February 2, 2019, the carrying value and maturities of our debt portfolio were as follows:
Debt Maturities February 2, 2019(dollars in millions) Rate (a) BalanceDue 2019-2023 3.4% $ 3,207Due 2024-2028 3.3 2,179Due 2029-2033 6.6 561Due 2034-2038 6.8 1,109Due 2039-2043 4.0 1,465Due 2044-2048 3.7 1,726Total notes and debentures 4.1 10,247Swap valuation adjustments 7Finance lease liabilities 1,021Less: Amounts due within one year (1,052)Long-term debt and other borrowings $ 10,223
(a) Reflects the weighted average stated interest rate as of year-end.
Required Principal Payments (millions) 2019 2020 2021 2022 2023Total required principal payments $ 1,002 $ 1,094 $ 1,056 $ 63 $ —
In October 2017, we issued unsecured fixed rate debt of $750 million at 3.9 percent that matures in November 2047. In addition to debt repaid at its maturity during 2017, during October 2017, we repurchased $344 million of debt before its maturity at a market value of $463 million. We recognized a loss on early retirement of approximately $123 million, which was recorded in Net Interest Expense in our Consolidated Statements of Operations.
In April 2016, we issued unsecured fixed rate debt of $1 billion at 2.5 percent that matures in April 2026 and $1 billionat 3.625 percent that matures in April 2046. In addition to debt repaid at its maturity during 2016, during the first half of 2016, we repurchased $1,389 million of debt before its maturity at a market value of $1,800 million. We recognized a loss on early retirement of approximately $422 million, which was recorded in Net Interest Expense in our Consolidated Statements of Operations.
We obtain short-term financing from time to time under our commercial paper program.
Commercial Paper(dollars in millions) 2018 2017 2016Maximum daily amount outstanding during the year $ 658 $ — $ 89Average amount outstanding during the year 63 — 1Amount outstanding at year-end — — —Weighted average interest rate 2.00% —% 0.43%
In October 2018, we extended a committed $2.5 billion revolving credit facility by one year to October 2023. No balances were outstanding under our credit facility at any time during 2018, 2017, or 2016.
Substantially all of our outstanding borrowings are senior, unsecured obligations. Most of our long-term debt obligations contain covenants related to secured debt levels. In addition to a secured debt level covenant, our credit facility also contains a debt leverage covenant. We are, and expect to remain, in compliance with these covenants, which have no practical effect on our ability to pay dividends.

51
17. Derivative Financial Instruments
Our derivative instruments primarily consist of interest rate swaps, which we use to mitigate interest rate risk. As a result of our use of derivative instruments, we have counterparty credit exposure to large global financial institutions. We monitor this concentration of counterparty credit risk on an ongoing basis. Note 7 provides the fair value and classification of these instruments.
During 2018, we entered into two interest rate swaps, each with a notional amount of $250 million, under which we pay a variable rate and receive a fixed rate. We designated these swaps as fair value hedges. Under the swap agreements, we pay a floating rate equal to 1-month London Interbank Offered Rate (LIBOR) and receive a weighted average fixed rate of 2.9 percent. The agreements have a weighted average remaining maturity of 6.3 years. Under the two previously existing swap agreements, which mature during 2019, we pay a floating rate equal to 3-month LIBOR and receive a weighted average fixed rate of 1.8 percent. With the addition of the two swaps entered into during 2018, as of February 2, 2019, four interest rate swaps with notional amounts totaling $1,500 million were designated as fair value hedges. As of February 3, 2018, two interest rate swaps with notional amounts totaling $1,000 million were designated as fair value hedges. No ineffectiveness was recognized in 2018 or 2017.
$10 million of interest rate swap-related assets were classified within Other Noncurrent Assets and $3 million of interest rate swap-related liabilities were classified within Other Current Liabilities as of February 2, 2019. $6 million of designated interest rate swap-related liabilities were classified within Other Noncurrent Liabilities as of February 3, 2018.
We recorded expense of $3 million during 2018 and income of $9 million and $24 million during 2017 and 2016, respectively, within Net Interest Expense on our Consolidated Statements of Operations related to periodic payments, valuation adjustments, and amortization of gains or losses on our interest rate swaps.
18. Leases
We lease certain retail stores, warehouses, distribution centers, office space, land, and equipment. Leases with an initial term of 12 months or less are not recorded on the balance sheet; we recognize lease expense for these leases on a straight-line basis over the lease term. For lease agreements entered into or reassessed after the adoption of Topic 842, we combine lease and nonlease components.
Most leases include one or more options to renew, with renewal terms that can extend the lease term from one to 50years or more. The exercise of lease renewal options is at our sole discretion. Certain leases also include options to purchase the leased property. The depreciable life of assets and leasehold improvements are limited by the expected lease term, unless there is a transfer of title or purchase option reasonably certain of exercise.
Certain of our lease agreements include rental payments based on a percentage of retail sales over contractual levels and others include rental payments adjusted periodically for inflation. Our lease agreements do not contain any material residual value guarantees or material restrictive covenants.
We rent or sublease certain real estate to third parties. Our lease and sublease portfolio consists mainly of operating leases with CVS Pharmacy Inc. (CVS) for space within our stores.

52
Leases(millions) Classification
February 2,2019
February 3,2018
AssetsOperating Operating Lease Assets $ 1,965 $ 1,884Finance Buildings and Improvements, net of Accumulated
Depreciation (a)872 836
Total leased assets $ 2,837 $ 2,720LiabilitiesCurrent
Operating Accrued and Other Current Liabilities $ 166 $ 148Finance Current Portion of Long-term Debt and Other Borrowings 53 80
NoncurrentOperating Noncurrent Operating Lease Liabilities 2,004 1,924Finance Long-term Debt and Other Borrowings 968 885
Total lease liabilities $ 3,191 $ 3,037Note: As most of our leases do not provide an implicit rate, we use our incremental borrowing rate based on the information available at commencement date in determining the present value of lease payments. We use the incremental borrowing rate on January 31, 2016, for operating leases that commenced prior to that date. (a) Finance lease assets are recorded net of accumulated amortization of $371 million and $317 million as of
February 2, 2019 and February 3, 2018, respectively.
Lease Cost(millions) Classification 2018 2017 2016Operating lease cost (a) SG&A Expenses $ 251 $ 221 $ 199Finance lease cost
Amortization of leased assets Depreciation and Amortization (b) 65 63 87Interest on lease liabilities Net Interest Expense 42 42 36
Sublease income (c) Other Revenue (11) (9) (7)Net lease cost $ 347 $ 317 $ 315
(a) Includes short-term leases and variable lease costs, which are immaterial.(b) Supply chain-related amounts are included in Cost of Sales.(c) Sublease income excludes rental income from owned properties of $47 million for 2018, 2017, and 2016,
which is included in Other Revenue.
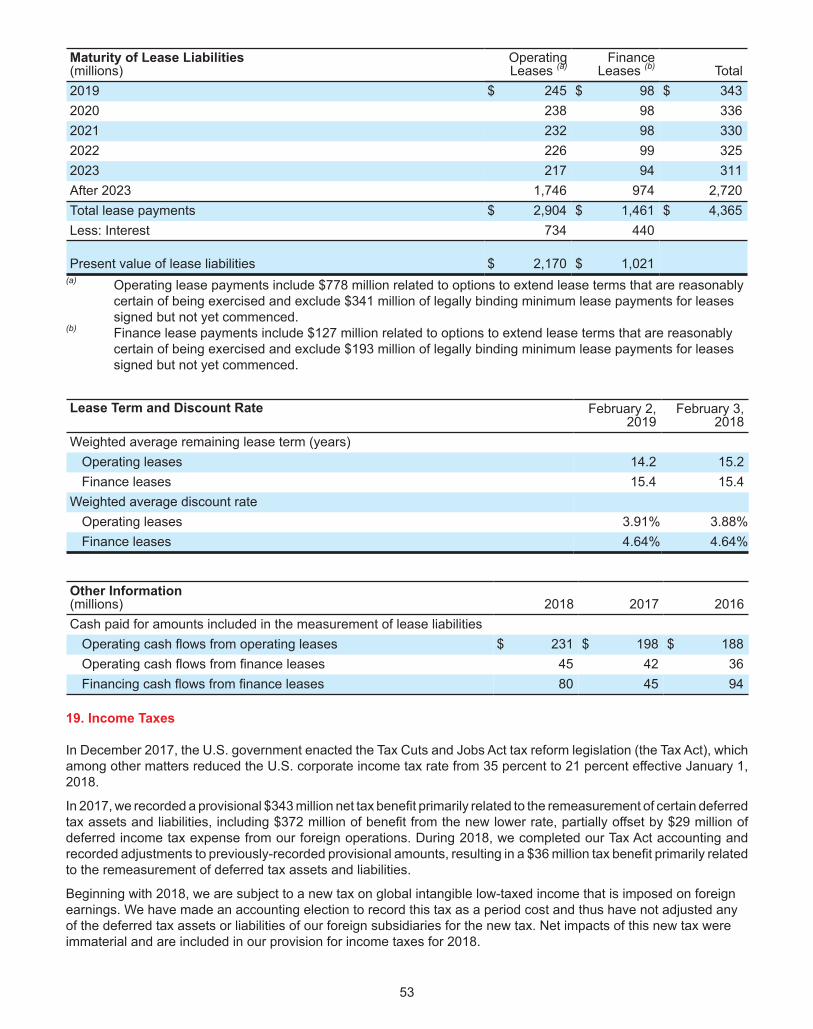
53
Maturity of Lease Liabilities(millions)
Operating Leases (a)
Finance Leases (b) Total
2019 $ 245 $ 98 $ 3432020 238 98 3362021 232 98 3302022 226 99 3252023 217 94 311After 2023 1,746 974 2,720Total lease payments $ 2,904 $ 1,461 $ 4,365Less: Interest 734 440
Present value of lease liabilities $ 2,170 $ 1,021(a) Operating lease payments include $778 million related to options to extend lease terms that are reasonably
certain of being exercised and exclude $341 million of legally binding minimum lease payments for leasessigned but not yet commenced.
(b) Finance lease payments include $127 million related to options to extend lease terms that are reasonablycertain of being exercised and exclude $193 million of legally binding minimum lease payments for leasessigned but not yet commenced.
Lease Term and Discount Rate February 2,2019
February 3,2018
Weighted average remaining lease term (years)Operating leases 14.2 15.2Finance leases 15.4 15.4
Weighted average discount rateOperating leases 3.91% 3.88%Finance leases 4.64% 4.64%
Other Information(millions) 2018 2017 2016Cash paid for amounts included in the measurement of lease liabilities
Operating cash flows from operating leases $ 231 $ 198 $ 188Operating cash flows from finance leases 45 42 36Financing cash flows from finance leases 80 45 94
19. Income Taxes
In December 2017, the U.S. government enacted the Tax Cuts and Jobs Act tax reform legislation (the Tax Act), which among other matters reduced the U.S. corporate income tax rate from 35 percent to 21 percent effective January 1, 2018.
In 2017, we recorded a provisional $343 million net tax benefit primarily related to the remeasurement of certain deferred tax assets and liabilities, including $372 million of benefit from the new lower rate, partially offset by $29 million of deferred income tax expense from our foreign operations. During 2018, we completed our Tax Act accounting and recorded adjustments to previously-recorded provisional amounts, resulting in a $36 million tax benefit primarily related to the remeasurement of deferred tax assets and liabilities.
Beginning with 2018, we are subject to a new tax on global intangible low-taxed income that is imposed on foreign earnings. We have made an accounting election to record this tax as a period cost and thus have not adjusted any of the deferred tax assets or liabilities of our foreign subsidiaries for the new tax. Net impacts of this new tax were immaterial and are included in our provision for income taxes for 2018.

54
Earnings from continuing operations before income taxes were $3,676 million, $3,630 million, and $3,961 million during 2018, 2017, and 2016, respectively, including $734 million, $722 million, and $336 million earned by our foreign entities subject to tax outside of the U.S.
Tax Rate Reconciliation – Continuing Operations2018
2017As Adjusted
2016As Adjusted
Federal statutory rate 21.0% 33.7% 35.0%State income taxes, net of the federal tax benefit 3.6 2.2 2.7International (1.3) (4.6) (2.6)Tax Act (a) (1.0) (9.5) —Excess tax benefit related to share-based payments (0.3) (0.1) (0.6)Federal tax credits (1.1) (0.8) (0.7)Other (0.6) (1.0) (1.1)Effective tax rate 20.3% 19.9% 32.7%
(a) Represents the discrete benefit of remeasuring our net deferred tax liabilities at the new lower U.S. corporateincome tax rate.
Provision for Income Taxes(millions) 2018
2017As Adjusted
2016As Adjusted
Current:Federal $ 257 $ 746 $ 1,108State 116 105 141International 51 59 6
Total current 424 910 1,255Deferred:
Federal 263 (229) 20State 57 27 21International 2 14 (1)
Total deferred 322 (188) 40Total provision $ 746 $ 722 $ 1,295

55
Net Deferred Tax Asset / (Liability)(millions)
February 2,2019
February 3, 2018
As Adjusted
Gross deferred tax assets: Accrued and deferred compensation $ 248 $ 262Accruals and reserves not currently deductible 181 162Self-insured benefits 114 109Deferred occupancy income 157 164Leased assets 92 87Other 40 42
Total gross deferred tax assets 832 826Gross deferred tax liabilities:
Property and equipment (1,557) (1,264)Inventory (140) (130)Other (95) (91)
Total gross deferred tax liabilities (1,792) (1,485)Total net deferred tax liability $ (960) $ (659)
Deferred tax assets and liabilities are recognized for the future tax consequences attributable to temporary differences between financial statement carrying amounts of existing assets and liabilities and their respective tax bases. Deferred tax assets and liabilities are measured using enacted income tax rates in effect for the year the temporary differences are expected to be recovered or settled. Tax rate changes affecting deferred tax assets and liabilities are recognized at the enactment date. We recognized a net tax benefit of $36 million and $372 million in 2018 and 2017, respectively, primarily because we remeasured our net deferred tax liabilities using the new lower U.S. corporate tax rate.
Beginning in 2017, due to changes effected by the Tax Act and other reasons, we have not asserted indefinite reinvestment in our foreign operations. Because of this change, we recorded a deferred tax charge of $29 million during 2017.
We file a U.S. federal income tax return and income tax returns in various states and foreign jurisdictions. The U.S. Internal Revenue Service has completed exams on the U.S. federal income tax returns for years 2015 and prior. With few exceptions, we are no longer subject to state and local or non-U.S. income tax examinations by tax authorities for years before 2009.
Reconciliation of Liability for Unrecognized Tax Benefits(millions) 2018 2017 2016Balance at beginning of period $ 325 $ 153 $ 153Additions based on tax positions related to the current year 58 112 12Additions for tax positions of prior years 10 142 6Reductions for tax positions of prior years (91) (71) (16)Settlements (2) (11) (2)Balance at end of period $ 300 $ 325 $ 153
If we were to prevail on all unrecognized tax benefits recorded, $252 million of the $300 million reserve would benefit the effective tax rate. In addition, the reversal of accrued penalties and interest would also benefit the effective tax rate. Interest and penalties associated with unrecognized tax benefits are recorded within income tax expense. During the years ended February 2, 2019, February 3, 2018, and January 28, 2017, we recorded an expense / (benefit) from accrued penalties and interest of $3 million, $(12) million, and $1 million, respectively. As of February 2, 2019, February 3, 2018, and January 28, 2017 total accrued interest and penalties were $32 million, $29 million, and $45 million, respectively.

56
It is reasonably possible that the amount of the unrecognized tax benefits with respect to our other unrecognized tax positions will increase or decrease during the next twelve months; however, an estimate of the amount or range of the change cannot be made at this time.
20. Other Noncurrent Liabilities
Other Noncurrent Liabilities(millions)
February 2,2019
February 3, 2018
As Adjusted
Deferred occupancy income (a) $ 570 $ 600Deferred compensation 472 503Income tax 312 332Workers' compensation and general liability 281 278Pension benefits 40 41Other 105 112Total $ 1,780 $ 1,866
(a) To be amortized evenly through 2038.
21. Share Repurchase
We periodically repurchase shares of our common stock under a board-authorized repurchase program through a combination of open market transactions, accelerated share repurchase (ASR) arrangements and other privately negotiated transactions with financial institutions.
In an ASR arrangement, in exchange for an up-front payment, we receive an initial delivery of shares of our common stock and at settlement may receive additional shares, cash, or a combination of both. The total number of shares ultimately repurchased and, therefore, the average repurchase price paid per share, is determined upon settlement of the ASR based on the volume-weighted average price of our common stock during the term of the contract, less an agreed-upon discount. We retire shares in the period they are received and account for the up-front payment as a reduction to shareholders’ equity.
Share Repurchases(millions, except per share data) 2018 2017 2016Total number of shares purchased 27.2 17.6 50.9Average price paid per share $ 75.88 $ 58.44 $ 72.35Total investment $ 2,067 $ 1,026 $ 3,686
22. Share-Based Compensation
We maintain a long-term incentive plan (the Plan) for key team members and non-employee members of our Board of Directors. The Plan allows us to grant equity-based compensation awards, including stock options, stock appreciation rights, performance share units, restricted stock units, restricted stock awards, or a combination of awards (collectively, share-based awards). The number of unissued common shares reserved for future grants under the Plan was 19.3 million and 24.5 million at February 2, 2019 and February 3, 2018, respectively.
Compensation expense associated with share-based awards is recognized on a straight-line basis over the required service period and reflects estimated forfeitures. Share-based compensation expense recognized in SG&A Expenses was $134 million, $115 million, and $116 million in 2018, 2017, and 2016, respectively. The related income tax benefit was $26 million, $26 million, and $43 million in 2018, 2017, and 2016, respectively.

57
Restricted Stock Units
We issue restricted stock units and performance-based restricted stock units generally with three-year cliff or four-year graduated vesting from the grant date (collectively restricted stock units) to certain team members. The final number of shares issued under performance-based restricted stock units is based on our total shareholder return relative to a retail peer group over a three-year performance period. We also regularly issue restricted stock units to our Board of Directors, which vest quarterly over a one-year period and are settled in shares of Target common stock upon departure from the Board. The fair value for restricted stock units is calculated based on the stock price on the date of grant, incorporating an analysis of the total shareholder return performance measure where applicable. The weighted average grant date fair value for restricted stock units was $72.65, $56.19, and $74.05 in 2018, 2017, and 2016, respectively.
Restricted Stock Unit Activity Total Nonvested UnitsRestricted
Stock (a)Grant Date
Fair Value (b)
February 3, 2018 3,763 $ 64.35Granted 2,269 72.65Forfeited (485) 66.25Vested (1,732) 68.62February 2, 2019 3,815 $ 66.86
(a) Represents the number of shares of restricted stock units, in thousands. For performance-based restrictedstock units, assumes attainment of maximum payout rates as set forth in the performance criteria. Applyingactual or expected payout rates, the number of outstanding restricted stock units and performance-basedrestricted stock units at February 2, 2019 was 3,708 thousand.
(b) Weighted average per unit.
The expense recognized each period is partially dependent upon our estimate of the number of shares that will ultimately be issued. At February 2, 2019, there was $125 million of total unrecognized compensation expense related to restricted stock units, which is expected to be recognized over a weighted average period of 2.7 years. The fair value of restricted stock units vested and converted to shares of Target common stock was $119 million, $87 million, and $75 million in 2018, 2017, and 2016, respectively.
Performance Share Units
We issue performance share units to certain team members that represent shares potentially issuable in the future. Issuance is based upon our performance relative to a retail peer group over a three-year performance period on certain measures including sales growth, return on invested capital, and EPS growth. The fair value of performance share units is calculated based on the stock price on the date of grant. The weighted average grant date fair value for performance share units was $70.94, $55.93, and $71.37 in 2018, 2017, and 2016, respectively.
Performance Share Unit Activity Total Nonvested UnitsPerformance
Share Units (a)Grant Date
Fair Value (b)
February 3, 2018 3,824 $ 68.23Granted 1,121 70.94Forfeited (741) 64.16Vested (581) 74.15February 2, 2019 3,623 $ 67.47
(a) Represents the number of performance share units, in thousands. Assumes attainment of maximum payoutrates as set forth in the performance criteria. Applying actual or expected payout rates, the number ofoutstanding performance share units at February 2, 2019 was 2,004 thousand.
(b) Weighted average per unit.

58
The expense recognized each period is partially dependent upon our estimate of the number of shares that will ultimately be issued. Future compensation expense for unvested awards could reach a maximum of $144 million assuming payout of all unvested awards. The unrecognized expense is expected to be recognized over a weighted average period of 1.2 years. The fair value of performance share units vested and converted to shares of Target common stock was $43 million in 2018, $30 million in 2017, and $1 million in 2016.
Stock Options
In May 2017, we granted price-vested stock options (price-vested options) to certain team members, which have met the market condition and will become exercisable in 2020 pending service condition achievement. Shares received upon exercise, net of exercise costs and taxes, are subject to a one-year post-exercise holding period. The fair value of the price-vested options was estimated using a lattice model.
Through 2013, we granted nonqualified stock options to certain team members. All are vested and currently exercisable.
Stock Option Activity Stock OptionsTotal Outstanding Exercisable
Number ofOptions (a)
ExercisePrice (b)
IntrinsicValue (c)
Number ofOptions (a)
ExercisePrice (b)
IntrinsicValue (c)
February 3, 2018 5,938 $ 54.53 $ 109 3,913 $ 53.97 $ 74Granted — —Expired/forfeited (89) 53.85Exercised/issued (1,859) 52.53February 2, 2019 3,990 $ 55.49 $ 63 2,039 $ 55.38 $ 32
(a) In thousands.(b) Weighted average per share.(c) Represents stock price appreciation subsequent to the grant date, in millions.
Stock Option Exercises(millions) 2018 2017 2016Cash received for exercise price $ 96 $ 109 $ 219Intrinsic value 50 34 103Income tax benefit 12 13 40
At February 2, 2019, there was $5 million of total unrecognized compensation expense related to nonvested price-vested options, which is expected to be recognized over a weighted average period of 1.3 years. The weighted average remaining life of exercisable options is 2.8 years, and the weighted average remaining life of all outstanding options is 4.0 years. No options vested in 2018 or 2017. The total fair value of options vested in 2016 was $9 million.
23. Defined Contribution Plans
Team members who meet eligibility requirements can participate in a defined contribution 401(k) plan by investing up to 80 percent of their eligible earnings, as limited by statute or regulation. We match 100 percent of each team member's contribution up to 5 percent of eligible earnings. Company match contributions are made to funds designated by the participant, none of which are based on Target common stock.
In addition, we maintain a nonqualified, unfunded deferred compensation plan for approximately 2,100 current and retired team members whose participation in our 401(k) plan is limited by statute or regulation. These team members choose from a menu of crediting rate alternatives that are generally the same as the investment choices in our 401(k) plan, but also includes a fund based on Target common stock. We credit an additional 2 percent per year to the accounts of all active participants, excluding executive officers, in part to recognize the risks inherent to their participation in this plan. We also maintain a frozen nonqualified, unfunded deferred compensation plan covering approximately 50 participants. Our total liability under these plans was $517 million and $542 million at February 2, 2019 and February 3, 2018, respectively.
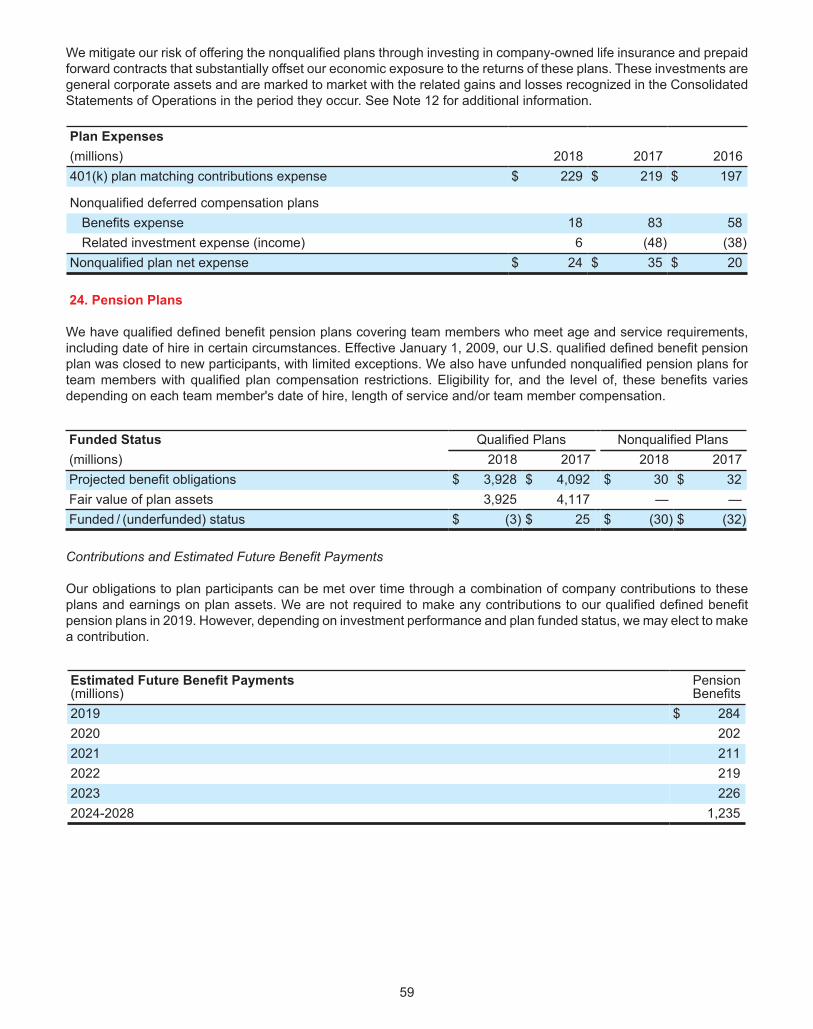
59
We mitigate our risk of offering the nonqualified plans through investing in company-owned life insurance and prepaid forward contracts that substantially offset our economic exposure to the returns of these plans. These investments are general corporate assets and are marked to market with the related gains and losses recognized in the Consolidated Statements of Operations in the period they occur. See Note 12 for additional information.
Plan Expenses (millions) 2018 2017 2016401(k) plan matching contributions expense $ 229 $ 219 $ 197
Nonqualified deferred compensation plans Benefits expense 18 83 58Related investment expense (income) 6 (48) (38)
Nonqualified plan net expense $ 24 $ 35 $ 20
24. Pension Plans
We have qualified defined benefit pension plans covering team members who meet age and service requirements, including date of hire in certain circumstances. Effective January 1, 2009, our U.S. qualified defined benefit pension plan was closed to new participants, with limited exceptions. We also have unfunded nonqualified pension plans for team members with qualified plan compensation restrictions. Eligibility for, and the level of, these benefits varies depending on each team member's date of hire, length of service and/or team member compensation.
Funded Status Qualified Plans Nonqualified Plans(millions) 2018 2017 2018 2017Projected benefit obligations $ 3,928 $ 4,092 $ 30 $ 32Fair value of plan assets 3,925 4,117 — —Funded / (underfunded) status $ (3) $ 25 $ (30) $ (32)
Contributions and Estimated Future Benefit Payments
Our obligations to plan participants can be met over time through a combination of company contributions to these plans and earnings on plan assets. We are not required to make any contributions to our qualified defined benefit pension plans in 2019. However, depending on investment performance and plan funded status, we may elect to make a contribution.
Estimated Future Benefit Payments(millions)
PensionBenefits
2019 $ 2842020 2022021 2112022 2192023 2262024-2028 1,235

60
Cost of Plans
Net Pension Benefits Expense(millions) Classification 2018 2017 2016Service cost benefits earned SG&A Expenses $ 95 $ 86 $ 87Interest cost on projected benefit obligation Net Other (Income) / Expense 146 140 134Expected return on assets Net Other (Income) / Expense (246) (250) (256)Amortization of losses Net Other (Income) / Expense 82 61 46Amortization of prior service cost Net Other (Income) / Expense (11) (11) (11)Settlement and special termination charges Net Other (Income) / Expense 4 1 2Total $ 70 $ 27 $ 2
Assumptions
Benefit Obligation Weighted Average Assumptions 2018 2017
Discount rate 4.28% 3.93%Average assumed rate of compensation increase 3.00 3.00
Net Periodic Benefit Expense Weighted Average Assumptions 2018 2017 2016
Discount rate 3.93% 4.40% 4.70%Expected long-term rate of return on plan assets 6.30 6.55 6.80Average assumed rate of compensation increase 3.00 3.00 3.00
The weighted average assumptions used to measure net periodic benefit expense each year are the rates as of the beginning of the year (i.e., the prior measurement date). Based on a stable asset allocation, our most recent compound annual rate of return on qualified plans' assets was 5.0 percent, 7.3 percent, 6.7 percent, and 6.0 percent for the 5-year, 10-year, 15-year, and 20-year time periods, respectively.
The market-related value of plan assets, which is used in calculating expected return on assets in net periodic benefit cost, is determined each year by adjusting the previous year's value by expected return, benefit payments, and cash contributions. The market-related value is adjusted for asset gains and losses in equal 20 percent adjustments over a 5-year period.
We review the expected long-term rate of return annually and revise it as appropriate. Additionally, we monitor the mix of investments in our portfolio to ensure alignment with our long-term strategy to manage pension cost and reduce volatility in our assets. Our 2018 expected annualized long-term rate of return assumptions were 6.5 percent for domestic equity securities, 7.5 percent for international equity securities, 4.5 percent for long-duration debt securities, 7.5 percent for balanced funds, and 8.5 percent for other investments. These estimates are a judgmental matter in which we consider the composition of our asset portfolio, our historical long-term investment performance, and current market conditions.

61
Benefit Obligation
Change in Projected Benefit Obligation Qualified Plans Nonqualified Plans(millions) 2018 2017 2018 2017Benefit obligation at beginning of period $ 4,092 $ 3,760 $ 32 $ 32Service cost 94 85 1 1Interest cost 145 139 1 1Actuarial (gain) / loss (168) 270 — 1Participant contributions 6 6 — —Benefits paid (241) (168) (4) (3)Benefit obligation at end of period (a) $ 3,928 $ 4,092 $ 30 $ 32
(a) Accumulated benefit obligation—the present value of benefits earned to date assuming no future salarygrowth—is materially consistent with the projected benefit obligation in each period presented.
Plan Assets
Change in Plan Assets Qualified Plans Nonqualified Plans(millions) 2018 2017 2018 2017Fair value of plan assets at beginning of period $ 4,117 $ 3,785 $ — $ —Actual return on plan assets (66) 493 — —Employer contributions 109 1 4 3Participant contributions 6 6 — —Benefits paid (241) (168) (4) (3)Fair value of plan assets at end of period $ 3,925 $ 4,117 $ — $ —
Our asset allocation policy is designed to reduce the long-term cost of funding our pension obligations. The plan invests with both passive and active investment managers depending on the investment. The plan also seeks to reduce the risk associated with adverse movements in interest rates by employing an interest rate hedging program, which may include the use of interest rate swaps, total return swaps, and other instruments.
Asset Category Current Targeted Actual AllocationAllocation 2018 2017
Domestic equity securities (a) 14% 13% 16%International equity securities 9 9 10Debt securities 45 47 44Balanced funds 23 24 23Other (b) 9 7 7Total 100% 100% 100%
(a) Equity securities include our common stock in amounts substantially less than 1 percent of total plan assetsin both periods presented.
(b) Other assets include private equity, mezzanine and high-yield debt, natural resources and timberland funds,multi-strategy hedge funds, derivative instruments, and real estate.

62
Fair Value Measurements Fair Value at
(millions)Pricing
CategoryJanuary 31,
2019January 31,
2018Cash and cash equivalents Level 1 $ 3 $ 4Government securities (a) Level 2 631 531Fixed income (b) Level 2 1,123 1,145Derivatives Level 2 12 19
1,769 1,699Investments valued using NAV per share (c)
Cash and cash equivalents 100 185Common collective trusts 828 966Fixed Income 54 55Balanced funds 952 959Private equity funds 84 97Other 138 156
Total plan assets $ 3,925 $ 4,117(a) Investments in government securities and long-term government bonds.(b) Investments in corporate and municipal bonds.(c) In accordance with Subtopic 820-10, certain investments that are measured at fair value using the net asset
value per share (or its equivalent) practical expedient have not been classified in the fair value hierarchy. Thefair value amounts presented in this table are intended to permit reconciliation of the fair value hierarchy tothe amounts presented in the statement of financial position.
Position Valuation TechniqueCash and cash equivalents Carrying value approximates fair value.
Government securities and fixed income
Valued using matrix pricing models and quoted prices of securities with similarcharacteristics.
Derivatives Swap derivatives - Valuations are based on observable inputs to the valuation model (e.g., interest rates and credit spreads). Model inputs are changed only when corroborated by market data. A credit risk adjustment is made on each swap using observable market credit spreads.
Option derivatives - Valued at transaction price initially. Subsequent valuations are based on observable inputs to the valuation model (e.g., underlying investments).
Amounts Included in Shareholders' Equity
Amounts in Accumulated Other Comprehensive Income(millions) 2018 2017Net actuarial loss $ 1,060 $ 1,001Prior service credits (24) (35)Amounts in Accumulated Other Comprehensive Income (a)(b) $ 1,036 $ 966
(a) $772 million and $720 million, net of tax, at the end of 2018 and 2017, respectively.(b) We expect 2019 net pension expense to include amortization expense of $51 million ($38 million, net of tax)
related to net actuarial loss and prior service credit balances included in Accumulated Other ComprehensiveIncome.

63
25. Accumulated Other Comprehensive Income
(millions)Cash Flow
Hedges
CurrencyTranslationAdjustment
Pension andOther
Benefit TotalFebruary 3, 2018 $ (14) $ (13) $ (720) $ (747)Other Comprehensive Income / (Loss) before
reclassifications, net of tax — (7) (107) (114)Amounts reclassified from AOCI, net of tax 1 (a) — 55 (b) 56February 2, 2019 $ (13) $ (20) $ (772) $ (805)
(a) Represents amortization of gains and losses on cash flow hedges, net of taxes, which is recorded in Net Interest Expense on the Consolidated Statements of Operations.
(b) Represents amortization of pension gains and losses, net of $19 million of taxes, which is recorded in SG&A Expenses on the Consolidated Statements of Operations. See Note 24 for additional information.
26. Quarterly Results (Unaudited)
Due to the seasonal nature of our business, fourth quarter operating results typically represent a substantially larger share of total year revenues and earnings because they include the November and December holiday sales period. We follow the same accounting policies for preparing quarterly and annual financial data. The table below summarizes quarterly results for 2018 and 2017:
Quarterly Results First Quarter Second Quarter Third Quarter Fourth Quarter Total Year(millions, except per share data) 2018 2017 2018 2017 2018 2017 2018 2017 (a) 2018 2017 (a)
Sales $ 16,556 $ 15,995 $ 17,552 $ 16,410 $ 17,590 $ 16,647 $ 22,734 $ 22,734 $ 74,433 $ 71,786Other revenue 225 228 224 224 231 227 243 249 923 928Total revenue 16,781 16,223 17,776 16,634 17,821 16,874 22,977 22,983 75,356 72,714Cost of sales 11,625 11,199 12,239 11,419 12,535 11,712 16,900 16,795 53,299 51,125Selling, general, and administrative
expenses 3,545 3,353 3,865 3,601 3,937 3,733 4,376 4,454 15,723 15,140Depreciation and amortization
(exclusive of depreciationincluded in cost of sales) 570 516 539 521 530 582 584 605 2,224 2,225
Operating income 1,041 1,155 1,133 1,093 819 847 1,117 1,129 4,110 4,224Net interest expense 121 140 115 131 115 251 110 131 461 653Net other (income) / expense (7) (15) (4) (15) (9) (15) (7) (14) (27) (59)Earnings from continuing operations
before income taxes 927 1,030 1,022 977 713 611 1,014 1,012 3,676 3,630Provision for income taxes 210 355 223 307 97 135 216 (76) 746 722Net earnings from continuing
operations 717 675 799 670 616 476 798 1,088 2,930 2,908
Discontinued operations, net oftax 1 3 — 1 6 2 1 (1) 7 6
Net earnings $ 718 $ 678 $ 799 $ 671 $ 622 $ 478 $ 799 $ 1,087 $ 2,937 $ 2,914Basic earnings per share
Continuing operations $ 1.34 $ 1.22 $ 1.50 $ 1.22 $ 1.17 $ 0.87 $ 1.53 $ 2.01 $ 5.54 $ 5.32Discontinued operations — 0.01 — — 0.01 — — — 0.01 0.01
Net earnings per share $ 1.34 $ 1.23 $ 1.50 $ 1.22 $ 1.18 $ 0.88 $ 1.54 $ 2.01 $ 5.55 $ 5.32Diluted earnings per share
Continuing operations $ 1.33 $ 1.21 $ 1.49 $ 1.21 $ 1.16 $ 0.87 $ 1.52 $ 1.99 $ 5.50 $ 5.29Discontinued operations — 0.01 — — 0.01 — — — 0.01 0.01
Net earnings per share $ 1.33 $ 1.22 $ 1.49 $ 1.22 $ 1.17 $ 0.87 $ 1.52 $ 1.99 $ 5.51 $ 5.29Dividends declared per share $ 0.62 $ 0.60 $ 0.64 $ 0.62 $ 0.64 $ 0.62 $ 0.64 $ 0.62 $ 2.54 $ 2.46
Note: Per share amounts are computed independently for each of the quarters presented. The sum of the quarters may not equal the total year amount due to the impact of changes in average quarterly shares outstanding and all other quarterly amounts may not equal the total year due to rounding. 2017 amounts are adjusted to conform with current year presentation. Refer to Note 2.(a) The fourth quarter and full year 2018 consisted of 13 weeks and 52 weeks, respectively, compared with 14 weeks and 53 weeks in the
comparable prior-year periods.

64
Item 9. Changes in and Disagreements with Accountants on Accounting and Financial Disclosure
Not applicable.
Item 9A. Controls and Procedures
Changes in Internal Control Over Financial Reporting
During the most recently completed fiscal quarter, the following change to our information technology systems materially affected, or is reasonably likely to materially affect, our internal control over financial reporting:
• We are in the process of a broad migration of many mainframe-based systems and middleware products to amodern platform, including systems supporting inventory and supply chain-related transactions.
During the most recently completed fiscal quarter, no other change in our internal control over financial reporting materially affected, or is reasonably likely to materially affect, our internal control over financial reporting.
Evaluation of Disclosure Controls and Procedures
As of the end of the period covered by this Annual Report, we conducted an evaluation, under supervision and with the participation of management, including the chief executive officer and chief financial officer, of the effectiveness of the design and operation of our disclosure controls and procedures pursuant to Rules 13a-15 and 15d-15 of the Securities Exchange Act of 1934, as amended (Exchange Act). Based upon that evaluation, our chief executive officer and chief financial officer concluded that our disclosure controls and procedures are effective at a reasonable assurance level. Disclosure controls and procedures are defined by Rules 13a-15(e) and 15d-15(e) of the Exchange Act as controls and other procedures that are designed to ensure that information required to be disclosed by us in reports filed with the SEC under the Exchange Act is recorded, processed, summarized and reported within the time periods specified in the SEC's rules and forms. Disclosure controls and procedures include, without limitation, controls and procedures designed to ensure that information required to be disclosed by us in reports filed under the Exchange Act is accumulated and communicated to our management, including our principal executive and principal financial officers, or persons performing similar functions, as appropriate, to allow timely decisions regarding required disclosure.
For the Report of Management on Internal Control and the Report of Independent Registered Public Accounting Firm on Internal Control over Financial Reporting, see Item 8, Financial Statements and Supplementary Data.
Item 9B. Other Information
Not applicable.

65
PART III
Certain information required by Part III is incorporated by reference from Target's definitive Proxy Statement for the Annual Meeting of Shareholders to be held on June 12, 2019 (our Proxy Statement). Except for those portions specifically incorporated in this Form 10-K by reference to the Proxy Statement, no other portions of the Proxy Statement are deemed to be filed as part of this Form 10-K.
Item 10. Directors, Executive Officers and Corporate Governance
The following sections of the Proxy Statement are incorporated herein by reference:
• Item one--Election of directors• Stock ownership information--Section 16(a) beneficial ownership reporting compliance• General information about corporate governance and the Board of Directors
Business ethics and conduct Committees
• Questions and answers about our Annual Meeting and voting--Question 14
See also Item 4A, Executive Officers of Part I of this Form 10-K.
Item 11. Executive Compensation
The following sections of the Proxy Statement are incorporated herein by reference:
• Compensation Discussion and Analysis• Compensation tables• Human Resources & Compensation Committee Report
Item 12. Security Ownership of Certain Beneficial Owners and Management and Related Stockholder Matters
The following sections of the Proxy Statement are incorporated herein by reference:
• Stock ownership information-- Beneficial ownership of directors and officers Beneficial ownership of Target’s largest shareholders
• Compensation tables--Equity compensation plan information
Item 13. Certain Relationships and Related Transactions, and Director Independence
The following sections of the Proxy Statement are incorporated herein by reference:
• General information about corporate governance and the Board of Directors-- Policy on transactions with related persons Director independence Committees
Item 14. Principal Accountant Fees and Services
The following section of the Proxy Statement is incorporated herein by reference:
• Item two-- Ratification of appointment of Ernst & Young LLP as independent registered public accounting firm-audit and non-audit fees

66
PART IV
Item 15. Exhibits, Financial Statement Schedules
The following information required under this item is filed as part of this report:
a) Financial Statements
• Consolidated Statements of Operations for the Years Ended February 2, 2019, February 3, 2018, and January 28, 2017
• Consolidated Statements of Comprehensive Income for the Years Ended February 2, 2019, February 3, 2018, and January 28, 2017
• Consolidated Statements of Financial Position at February 2, 2019 and February 3, 2018• Consolidated Statements of Cash Flows for the Years Ended February 2, 2019, February 3, 2018, and
January 28, 2017• Consolidated Statements of Shareholders' Investment for the Years Ended February 2, 2019, February 3,
2018, and January 28, 2017• Notes to Consolidated Financial Statements• Report of Independent Registered Public Accounting Firm on Consolidated Financial Statements
Financial Statement Schedules
None.
Other schedules have not been included either because they are not applicable or because the information isincluded elsewhere in this Report.

67
b) Exhibits
(3)A Amended and Restated Articles of Incorporation (as amended through June 9, 2010) (1)B Bylaws (as amended through November 11, 2015) (2)
(4)A Indenture, dated as of August 4, 2000 between Target Corporation and Bank One Trust Company, N.A. (3)
B First Supplemental Indenture dated as of May 1, 2007 to Indenture dated as of August 4, 2000 between Target Corporation and The Bank of New York Trust Company, N.A. (as successor in interest to Bank One Trust Company N.A.) (4)
C Target agrees to furnish to the Commission on request copies of other instruments with respect tolong-term debt.
(10)A * Target Corporation Executive Officer Cash Incentive Plan (5)B * Target Corporation Long-Term Incentive Plan (as amended and restated effective June 8, 2011) (6)C * Amended and Restated Target Corporation 2011 Long-Term Incentive Plan (as amended and
restated effective September 1, 2017) (7)D * Target Corporation SPP I (2016 Plan Statement) (as amended and restated effective April 3, 2016)
(8)E * Target Corporation SPP II (2016 Plan Statement) (as amended and restated effective April 3, 2016)
(9)F * Target Corporation SPP III (2014 Plan Statement) (as amended and restated effective January 1,
2014) (10)G * Amendment to Target Corporation SPP III (2014 Plan Statement) (effective April 3, 2016) (11)H * Target Corporation Officer Deferred Compensation Plan (as amended and restated effective
June 8, 2011) (12)I * Target Corporation Officer EDCP (2017 Plan Statement) (as amended and restated effective May
1, 2017) (13)J * Target Corporation Deferred Compensation Plan Directors (14)K * Target Corporation DDCP (2013 Plan Statement) (as amended and restated effective December 1,
2013) (15)L * Target Corporation Officer Income Continuation Plan (as amended and restated effective
September 1, 2017) (16)M * Target Corporation Executive Excess Long Term Disability Plan (as restated effective January 1,
2010) (17)N * Director Retirement Program (18)O * Target Corporation Deferred Compensation Trust Agreement (as amended and restated effective
January 1, 2009) (19)P * Amendment dated June 8, 2011 to Target Corporation Deferred Compensation Trust Agreement
(as amended and restated effective January 1, 2009) (20)Q * Amendment dated October 25, 2017 to Target Corporation Deferred Compensation Trust
Agreement (as amended and restated effective January 1, 2009) (21)R * Form of Amended and Restated Executive Non-Qualified Stock Option Agreement (22)S * Form of Restricted Stock Unit AgreementT * Form of Performance-Based Restricted Stock Unit AgreementU * Form of Performance Share Unit AgreementV * Form of Price-Vested Stock Option Agreement (23)W * Form of Non-Employee Director Non-Qualified Stock Option Agreement (24)X * Form of Non-Employee Director Restricted Stock Unit Agreement (25)Y * Form of Cash Retention Award (26)
AA * Aircraft Time Sharing Agreement as of March 13, 2015 among Target Corporation and Brian C. Cornell (27)
BB * Transition Agreement dated January 7, 2019 (28)

68
CC Five-Year Credit Agreement dated as of October 5, 2016 among Target Corporation, Bank of America, N.A. as Administrative Agent and the Banks listed therein (29)
DD Extension Amendment dated August 7, 2017 to Five-Year Credit Agreement among Target Corporation, Bank of America, N.A. as Administrative Agent and the Banks listed therein (30)
EE Second Extension Amendment dated August 6, 2018 to Five-Year Credit Agreement among Target Corporation, Bank of America, N.A. as Administrative Agent and the Banks listed therein (31)
FF ‡ Credit Card Program Agreement dated October 22, 2012 among Target Corporation, Target Enterprise, Inc. and TD Bank USA, N.A. (32)
GG ‡ First Amendment dated February 24, 2015 to Credit Card Program Agreement among Target Corporation, Target Enterprise, Inc. and TD Bank USA, N.A. (33)
HH ‡ Pharmacy Operating Agreement dated December 16, 2015 between Target Corporation and CVS Pharmacy, Inc. (34)
II ‡ First Amendment dated November 30, 2016 to Pharmacy Operating Agreement between Target Corporation and CVS Pharmacy, Inc. (35)
JJ Second Amendment dated January 9, 2018 to Pharmacy Operating Agreement between Target Corporation and CVS Pharmacy, Inc. (36)
(21) List of Subsidiaries(23) Consent of Independent Registered Public Accounting Firm(24) Powers of Attorney
(31)A Certification of the Chief Executive Officer Pursuant to Section 302 of the Sarbanes-Oxley Act of2002 (Q1) (Q2) (Q3) (10-K)
(31)B Certification of the Chief Financial Officer Pursuant to Section 302 of the Sarbanes-Oxley Act of2002 (Q1) (Q2) (Q3) (10-K)
(32)A Certification of the Chief Executive Officer Pursuant to Section 18 U.S.C. Section 1350 Pursuant toSection 906 of the Sarbanes-Oxley Act of 2002 (Q1) (Q2) (Q3) (10-K)
(32)B Certification of the Chief Financial Officer Pursuant to Section 18 U.S.C. Section 1350 Pursuant toSection 906 of the Sarbanes-Oxley Act of 2002 (Q1) (Q2) (Q3) (10-K)
101.INS XBRL Instance Document101.SCH XBRL Taxonomy Extension Schema101.CAL XBRL Taxonomy Extension Calculation Linkbase101.DEF XBRL Taxonomy Extension Definition Linkbase101.LAB XBRL Taxonomy Extension Label Linkbase101.PRE XBRL Taxonomy Extension Presentation Linkbase
Copies of exhibits will be furnished upon written request and payment of Registrant's reasonable expenses in furnishing the exhibits._____________________________________________________________________
‡ Certain portions of this exhibit have been omitted pursuant to a request for confidential treatment and have been filed separately with the Securities and Exchange Commission.
* Management contract or compensation plan or arrangement required to be filed as an exhibit to this Form 10-K.
(1) Incorporated by reference to Exhibit (3)A to Target's Form 8-K Report filed June 10, 2010.(2) Incorporated by reference to Exhibit (3)A to Target's Form 8-K Report filed November 12, 2015.(3) Incorporated by reference to Exhibit 4.1 to Target's Form 8-K Report filed August 10, 2000.(4) Incorporated by reference to Exhibit 4.1 to the Registrant's Form 8-K Report filed May 1, 2007.(5) Incorporated by reference to Exhibit (10)KK to Target's Form 8-K Report filed June 15, 2017.(6) Incorporated by reference to Exhibit (10)B to Target's Form 10-Q Report for the quarter ended July 30, 2011.(7) Incorporated by reference to Exhibit (10)C to Target's Form 10-Q Report for the quarter ended July 29, 2017.(8) Incorporated by reference to Exhibit (10)C to Target's Form 10-Q Report for the quarter ended April 30, 2016.(9) Incorporated by reference to Exhibit (10)D to Target's Form 10-Q Report for the quarter ended April 30, 2016.(10) Incorporated by reference to Exhibit (10)E to Target's Form 10-K Report for the year ended February 1, 2014.(11) Incorporated by reference to Exhibit (10)NN to Target's Form 10-Q Report for the quarter ended April 30, 2016.(12) Incorporated by reference to Exhibit (10)F to Target's Form 10-Q Report for the quarter ended July 30, 2011.(13) Incorporated by reference to Exhibit (10)I to Target's Form 10-K Report for the year ended January 28, 2017.(14) Incorporated by reference to Exhibit (10)I to Target's Form 10-K Report for the year ended February 3, 2007.

69
(15) Incorporated by reference to Exhibit (10)I to Target's Form 10-K Report for the year ended February 1, 2014.(16) Incorporated by reference to Exhibit (10)L to Target's Form 10-Q Report for the quarter ended July 29, 2017.(17) Incorporated by reference to Exhibit (10)A to Target's Form 10-Q Report for the quarter ended October 30, 2010.(18) Incorporated by reference to Exhibit (10)O to Target's Form 10-K Report for the year ended January 29, 2005.(19) Incorporated by reference to Exhibit (10)O to Target's Form 10-K Report for the year ended January 31, 2009.(20) Incorporated by reference to Exhibit (10)AA to Target's Form 10-Q Report for the quarter ended July 30, 2011.(21) Incorporated by reference to Exhibit (10)MM to Target's Form 10-Q Report for the quarter ended October 28, 2017.(22) Incorporated by reference to Exhibit (10)V to Target's Form 10-K Report for the year ended January 31, 2015.(23) Incorporated by reference to Exhibit (10)JJ to Target's Form 10-Q Report for the quarter ended April 29, 2017.(24) Incorporated by reference to Exhibit (10)EE to Target's Form 8-K Report filed January 11, 2012.(25) Incorporated by reference to Exhibit (10)X to Target's Form 10-K Report for the year ended February 3, 2018.(26) Incorporated by reference to Exhibit (10)W to Target's Form 10-K Report for the year ended February 2, 2013.(27) Incorporated by reference to Exhibit (10)HH to Target's Form 10-K Report for the year ended January 31, 2015.(28) Incorporated by reference to Exhibit (10)A to Target's Form 8-K Report filed January 10, 2019.(29) Incorporated by reference to Exhibit (10)O to Target's Form 10-Q Report for the quarter ended October 29, 2016.(30) Incorporated by reference to Exhibit (10)LL to Target's Form 10-Q Report for the quarter ended October 28, 2017.(31) Incorporated by reference to Exhibit (10)II to Target's Form 10-Q Report for the quarter ended November 3, 2018.(32) Incorporated by reference to Exhibit (10)X to Target's Form 10-Q/A Report for the quarter ended May 4, 2013.(33) Incorporated by reference to Exhibit (10)II to Target's Form 10-Q Report for the quarter ended May 2, 2015.(34) Incorporated by reference to Exhibit (10)KK to Target's Form 10-K Report for the year ended January 30, 2016.(35) Incorporated by reference to Exhibit (10)CC to Target's Form 10-K Report for the year ended January 28, 2017.(36) Incorporated by reference to Exhibit (10)HH to Target's Form 10-K Report for the year ended February 3, 2018.

70
SIGNATURES
Pursuant to the requirements of Section 13 or 15(d) of the Securities Exchange Act of 1934, Target has duly caused this report to be signed on its behalf by the undersigned, thereunto duly authorized.
TARGET CORPORATIONBy:
Dated: March 13, 2019Cathy R. Smith
Executive Vice President and Chief Financial Officer___________________________________________________________________________________________________________________
Pursuant to the requirements of the Securities Exchange Act of 1934, the report has been signed below by the following persons on behalf of Target and in the capacities and on the dates indicated.
Dated: March 13, 2019Brian C. Cornell
Chairman of the Board and Chief Executive Officer
Dated: March 13, 2019Cathy R. Smith
Executive Vice President and Chief Financial Officer
Dated: March 13, 2019
Robert M. Harrison Senior Vice President, Chief Accounting Officer
and Controller
ROXANNE S. AUSTINDOUGLAS M. BAKER, JR.GEORGE S. BARRETTCALVIN DARDENHENRIQUE DE CASTROROBERT L. EDWARDS
MELANIE L. HEALEYDONALD R. KNAUSSMONICA C. LOZANOMARY E. MINNICKKENNETH L. SALAZARDMITRI L. STOCKTON Constituting a majority of the Board of Directors
Cathy R. Smith, by signing her name hereto, does hereby sign this document pursuant to powers of attorney duly executed by the Directors named, filed with the Securities and Exchange Commission on behalf of such Directors, all in the capacities and on the date stated.
By:
Dated: March 13, 2019Cathy R. SmithAttorney-in-fact

Shareholder Information
Annual Meeting
Shareholder Information
Transfer Agent, Registrar andDividend Disbursing Agent
Stock Exchange Listing
Shareholder Assistance
Direct Stock Purchase/Dividend Reinvestment Plan
The Annual Meeting of Shareholders is scheduled for June 12, 2019 at 9:00 a.m. (Eastern Daylight Time) at Marriott Columbus University Area, 3100 Olentangy River Road, Columbus, OH 43202
Quarterly and annual shareholder information (including the Form 10-Q Quarterly Reports and Form 10-K Annual Report, which are filed with the Securities and Exchange Commission) is available at no charge to shareholders. To obtain copies of these materials, you may send an e-mail to [email protected], call 1-800-775-3110, or write to: Target Corporation, Attn: John Hulbert, VP, Investor Relations, 1000 Nicollet Mall (TPN-0841), Minneapolis, Minnesota 55403.
These documents as well as other information about Target Corporation, including our Code of Ethics, Corporate Governance Guidelines, Corporate Responsibility Report and Board of Director Committee Charters, are also available on the Internet at investors.target.com.
EQ Shareowner Services
Trading Symbol: TGTNew York Stock Exchange
For assistance regarding individual stock records, lost certificates, name or address changes, dividend or tax questions, call EQ Shareowner Services at 1-800-794-9871, access their website at www.shareowneronline.com or write to: EQ Shareowner Services, P.O. Box 64874, St. Paul, Minnesota 55164-0874.
EQ Shareowner Services administers a direct purchase plan that allows interested investors to purchase Target Corporation stock directly, rather than through a broker, and become a registered shareholder of the company. The program offers many features including dividend reinvestment. For detailed information regarding this program, call EQ Shareowner Services toll free at 1-800-794-9871 or write to: EQ Shareowner Services, P.O. Box 64874, St. Paul, Minnesota 55164-0874.
©2018 Target Brands, Inc. The Bullseye Design, Bullseye Dog, Cartwheel, CityTarget, Expect More. Pay Less., SuperTarget and Target are trademarks of Target Brands, Inc.
Directors & Management
Directors
Other Senior Officers
Roxanne S. AustinPresident, Austin Investment Advisors(2) (5)
Douglas M. Baker, Jr.Chairman and Chief Executive Officer, Ecolab Inc.(4) (5)
George S. BarrettFormer Chairman and Chief Executive Officer, Cardinal Health, Inc.(2) (5)
Brian C. CornellChairman and Chief Executive Officer, Target Corporation
Calvin DardenChairman, Darden Petroleum & Energy Solutions, LLC(2) (4)
Brian C. CornellChairman and Chief Executive Officer
Richard H. GomezExecutive Vice President and Chief Marketing & Digital Officer
Melissa K. KremerExecutive Vice President and Chief Human Resources Officer
Rich AgostinoSenior Vice President and Chief Information Security Officer
Kristi ArgyilanSenior Vice President, Marketing, Media and Measurement
John BauerSenior Vice President, Global Inventory Management
Dawn BlockSenior Vice President, Digital
Katie BoylanSenior Vice President and Chief Communications Officer
Frank BruniSenior Vice President, Food & Beverage, Supply Chain
Justin BurnsSenior Vice President, Stores
Jeff BurtSenior Vice President, Food & Beverage, Merchandising
Joe ContrucciSenior Vice President, Stores
Henrique De CastroFormer Chief Operating Officer, Yahoo! Inc.(1) (3)
Robert L. EdwardsFormer President and Chief Executive Officer, AB Acquisition LLC (Albertsons/Safeway)(1) (5)
Melanie L. HealeyFormer Group President, North America, The Procter & Gamble Company(2) (4)
Donald R. KnaussFormer Chairman and Chief Executive Officer, The Clorox Company(2) (3)
Monica C. LozanoPresident and Chief Executive Officer, The College Futures Foundation (1) (4)
Don H. LiuExecutive Vice President, Chief Legal & Risk Officer and Corporate Secretary
Stephanie A. LundquistExecutive Vice President and President, Food & Beverage
Mike McNamaraExecutive Vice President and Chief Information Officer
Brett CraigSenior Vice President, Merchandising Capabilities
Paritosh DesaiChief Data & Analytics Officer
Michael FiddelkeSenior Vice President, Transitions
William FoudySenior Vice President and President, Owned Brand Sourcing
Juan GalarragaSenior Vice President, Stores Operations
Julie GuggemosSenior Vice President, Owned Brand Management and Product Design
Ann GuginoSenior Vice President, Financial Planning and Analysis
Corey HaalandSenior Vice President, Treasurer
Robert HarrisonSenior Vice President, Chief Accounting Officer and Controller
Christina HenningtonSenior Vice President, General Merchandise Manager, Essentials, Beauty, Hardlines, and Services
Mary E. MinnickFormer Partner, Lion Capital LLP(1) (3)
Kenneth L. SalazarPartner, WilmerHale(3) (5)
Dmitri L. StocktonFormer Senior Vice President and Special Advisor to the Chairman of General Electric Company(1) (3)
(1) Audit and Finance Committee(2) Human Resources and Compensation Committee(3) Infrastructure and Investment Committee(4) Nominating and Governance Committee(5) Risk and Compliance Committee
John J. MulliganExecutive Vice President and Chief Operating Officer
Minsok PakExecutive Vice President and Chief Strategy & Innovation Officer
Janna A. PottsExecutive Vice President and Chief Stores Officer
Cathy R. SmithExecutive Vice President and Chief Financial Officer
Mark J. TrittonExecutive Vice President and Chief Merchandising Officer
Laysha L. WardExecutive Vice President and Chief External Engagement Officer
Cynthia HoSenior Vice President, Global Sourcing
Tim HotzeSenior Vice President, Network Planning and Global Intelligence
Yu-Ping KaoSenior Vice President, Stores
Scott KennedyPresident, Financial and Retail Services
Gemma KubatSenior Vice President, Supply Chain Engineering and Activation
Michelle MesenburgSenior Vice President, Marketing, Retail Brand Experience
Preston MosierSenior Vice President, Supply Chain Field Operations
Nik NayarSenior Vice President, Merchandising, Hardlines
Michael O’NeilSenior Vice President, Pay and Benefits
Tammy RedpathPresident, Target India
Carolyn SakstrupSenior Vice President, Marketing
Jill SandoSenior Vice President, General Merchandise Manager, Apparel and Accessories and Home
Mark SchindeleSenior Vice President, Target Properties
Samir ShahSenior Vice President, Stores
Cara SylvesterSenior Vice President, Merchandising, Home
Brad Taylor-WhiteSenior Vice President, Human Resources
Arthur ValdezExecutive Vice President, Chief Supply Chain and Logistics Officer
Todd WaterburySenior Vice President and Chief Creative Officer
William WhiteSenior Vice President, Marketing
Kamau WitherspoonSenior Vice President, Operations
Matt ZabelSenior Vice President, Enterprise Risk
Executive Officers


The cover was printed on French Paper Kraft-tone Cover.Responsibly produced using Hydro Electric power from 100% post-consumer waste.
3303_Cvr.indd 2 4/10/19 2:43 PM

3303_Cvr.indd 1 4/9/19 1:09 PM


![[Ex 3303-06e] Jahar Searches for Boston Exp](https://img.pdfslide.us/doc/110x75/56d6bf811a28ab3016968169/ex-3303-06e-jahar-searches-for-boston-exp.jpg)