Embed Size (px)
Citation preview

Impact Sciences, Inc. 3.3-1 Placer Vineyards Specific Plan Draft EIS USACE # 199900737 April 2013
3.3 AIR QUALITY
3.3.1 INTRODUCTION
This section covers the topic of air quality, describing existing conditions at and surrounding the project site, summarizes relevant regulations and policies, and analyzes the anticipated effects of implementing the Proposed Action and alternatives.
3.3.2 AFFECTED ENVIRONMENT
3.3.2.1 Regional Setting
The California Air Resources Board (CARB) has divided California into regional air basins according to topographic features. The proposed project is located in western Placer County, within the Placer County portion of the Sacramento Valley Air Basin (the Air Basin). This portion of the Air Basin is under the jurisdiction of the Placer County Air Pollution Control District (Air District) for issues related to air quality planning. The Air District works in conjunction with the Sacramento Metropolitan Air Quality Management District (SMAQMD) and other air pollution control districts within the Air Basin to address air quality in the region.
The primary factors that determine air quality in any region are the locations of air pollutant sources, the amount of pollutants emitted, and meteorological and topographical conditions affecting their dispersion. Atmospheric conditions, including wind speed, wind direction, and air temperature gradients, interact with the physical features of the landscape to determine the movement and dispersal of air pollutants.
The Air Basin includes Butte, Colusa, Glenn, Sacramento, Shasta, Sutter, Tehama, Yolo, and Yuba counties, the western urbanized portion of Placer County, and the eastern portion of Solano County. The Air Basin occupies 15,040 square miles and has a population of more than 2 million people. The Air Basin is bounded by the North Coast Ranges on the west and Northern Sierra Nevada Mountains on the east. The intervening terrain is flat and is often described as a bowl-shaped valley.
The Sacramento Valley Air Basin has a Mediterranean climate, characterized by hot dry summers and mild rainy winters. During the year the temperature may range from 20 to 115 degrees Fahrenheit with summer highs usually in the 90s and winter lows occasionally below freezing. Average annual rainfall is about 20 inches with snowfall being very rare. The prevailing winds are moderate in strength and vary from moist breezes from the south to dry land flows from the north (SMAQMD 2009).
The mountains surrounding the Sacramento Valley create a barrier to airflow, which can trap air pollutants in the valley when meteorological conditions are right and a temperature inversion exists. The highest frequency of air stagnation events occur in the autumn and early winter when large high-pressure cells lie over the valley. The lack of surface wind during these periods and the reduced vertical flow caused by less surface heating reduces the influx of outside air and allows air pollutants to become concentrated in the air. The surface concentrations of pollutants are highest when these conditions are combined with smoke from agricultural burning or when temperature inversions trap cool air, fog, and pollutants near the ground.

3.3 Air Quality
Impact Sciences, Inc. 3.3-2 Placer Vineyards Specific Plan Draft EIS USACE # 199900737 April 2013
The ozone season (May through October) in the Sacramento Valley is characterized by stagnant morning air or light winds with the Delta sea breeze arriving in the afternoon out of the southwest. Usually the evening breeze transports the airborne pollutants to the north out of the Sacramento Valley. During about half of the days from July to September, however, a phenomenon called the “Schultz Eddy” prevents this from occurring. Instead of allowing for the prevailing wind patterns to move north carrying the pollutants out of the valley, the Schultz Eddy causes the wind pattern and pollutants to circle back southward preventing dispersion and increasing the likelihood of federal and state air quality standards violations (SMAQMD 2009).
3.3.2.2 Ambient Air Quality Standards
Both the federal government and the State of California have established ambient air quality standards for several different pollutants. The United States Environmental Protection Agency (U.S. EPA) sets National Ambient Air Quality Standards for the following seven pollutants: carbon monoxide (CO), nitrogen dioxide (NO2), ozone (O3), sulfur dioxide (SO2), respirable particulate matter (PM10), fine particulate matter (PM2.5), and lead. These seven pollutants are commonly referred to as “criteria pollutants.” California Ambient Air Quality Standards have also been adopted for these pollutants, as well as for sulfates, visibility-reducing particles, hydrogen sulfide, and vinyl chloride. California standards are generally stricter than national standards. Each of the criteria pollutants that are relevant to the Proposed Action and that are of concern in the Air Basin is briefly described below. While reactive organic gases (ROGs) are not considered to be criteria air pollutants, they are widely emitted from land development projects and undergo photochemical reactions in the atmosphere to form O3; therefore, ROGs are also relevant to the Proposed Action and are of concern in the area (U.S. EPA n.d.c).
• Ozone (O3). O3 is a gas that is formed when ROGs and oxides of nitrogen (NOX) (both byproducts of internal combustion engine exhaust and other sources) undergo slow photochemical reactions in the presence of sunlight. Ozone concentrations are generally highest during the summer months when direct sunlight, light wind, and warm temperature conditions are favorable to the formation of this pollutant.
• Reactive Organic Gases (ROGs). ROGs are compounds composed primarily of atoms of hydrogen and carbon. Internal combustion associated with motor vehicle usage is the major source of hydrocarbons. Adverse effects on human health are not caused directly by ROGs, but rather by reactions of ROGs to form secondary air pollutants, including ozone. ROGs are also referred to as reactive organic compounds (ROCs) or volatile organic compounds (VOCs). ROGs themselves are not “criteria” pollutants; however, they contribute to formation of O3.
• Nitrogen Dioxide (NO2). NO2 is a reddish-brown, highly reactive gas that is formed in the ambient air through the oxidation of nitric oxide (NO). NO2 is also a byproduct of fuel combustion. The principal form of NOX produced by combustion is NO, but NO reacts quickly to form NO2, creating the mixture of NO and NO2 referred to as NOX. NO2 acts as an acute irritant and, in equal concentrations, is more injurious than NO. At atmospheric concentrations, however, NOX is only potentially irritating. NO2 absorbs blue light, the result of which is a brownish-red cast to the atmosphere and reduced visibility.
• Carbon Monoxide (CO). CO is a colorless, odorless gas produced by the incomplete combustion of fuels. CO concentrations tend to be the highest during winter mornings, with little to no wind,

3.3 Air Quality
Impact Sciences, Inc. 3.3-3 Placer Vineyards Specific Plan Draft EIS USACE # 199900737 April 2013
when surface-based inversions trap the pollutant at ground levels. CO is emitted directly from internal combustion engines. Motor vehicles operating at slow speeds are the primary source of CO in the basin. The highest ambient CO concentrations are generally found near congested transportation corridors and intersections.
• Sulfur Dioxide (SO2). SO2 is a colorless, extremely irritating gas or liquid. It enters the atmosphere as a pollutant mainly as a result of burning high-sulfur-content fuel oils and coal and from chemical processes occurring at chemical plants and refineries. When SO2 oxidizes in the atmosphere, it forms sulfates (SO4).
• Respirable Particulate Matter (PM10). PM10 consists of suspended particles or droplets 10 micrometers or smaller in diameter. Some sources of PM10, like pollen and windstorms, are naturally occurring. However, in populated areas, most PM10 is caused by road dust, diesel soot, combustion products, abrasion of tires and brakes, and construction activities.
• Fine Particulate Matter (PM2.5). PM2.5 is suspended particulate matter that is 2.5 micrometers or smaller in diameter. The sources of PM2.5 include fuel combustion from automobiles, power plants, wood burning, industrial processes, and diesel-powered vehicles such as buses and trucks. These fine particles are also formed in the atmosphere when gases such as sulfur dioxide, NOX, and ROGs are transformed in the air by chemical reactions.
A summary of state and federal ambient air quality standards and the effects of the exceedance of these standards on health are shown in Table 3.3-1, Ambient Air Quality Standards. For some pollutants, separate standards have been set for different periods. Most standards have been set to protect public health. For some pollutants, standards have been based on other values, such as protection of crops, protection of materials, or avoidance of nuisance conditions.
Table 3.3-1
Ambient Air Quality Standards
Air Pollutant
Concentration/Averaging Time
Most Relevant Health Effects
State Standard (California
Ambient Air Quality Standards )
Federal Primary Standard (National
Ambient Air Quality Standards )
Ozone 0.09 ppm, 1-hr. avg.
0.070 ppm, 8-hr avg.
0.075 ppm, 8-hr avg. (three-year average of annual 4th-highest daily maximum)
(a) Pulmonary function decrements and localized lung edema in humans and animals; (b) Risk to public health implied by alterations in pulmonary morphology and host defense in animals; (c) Increased mortality risk; (d) Risk to public health implied by altered connective tissue metabolism and altered pulmonary morphology in animals after long-term exposures and pulmonary function decrements in chronically exposed humans; (e) Vegetation damage; and (f) Property damage
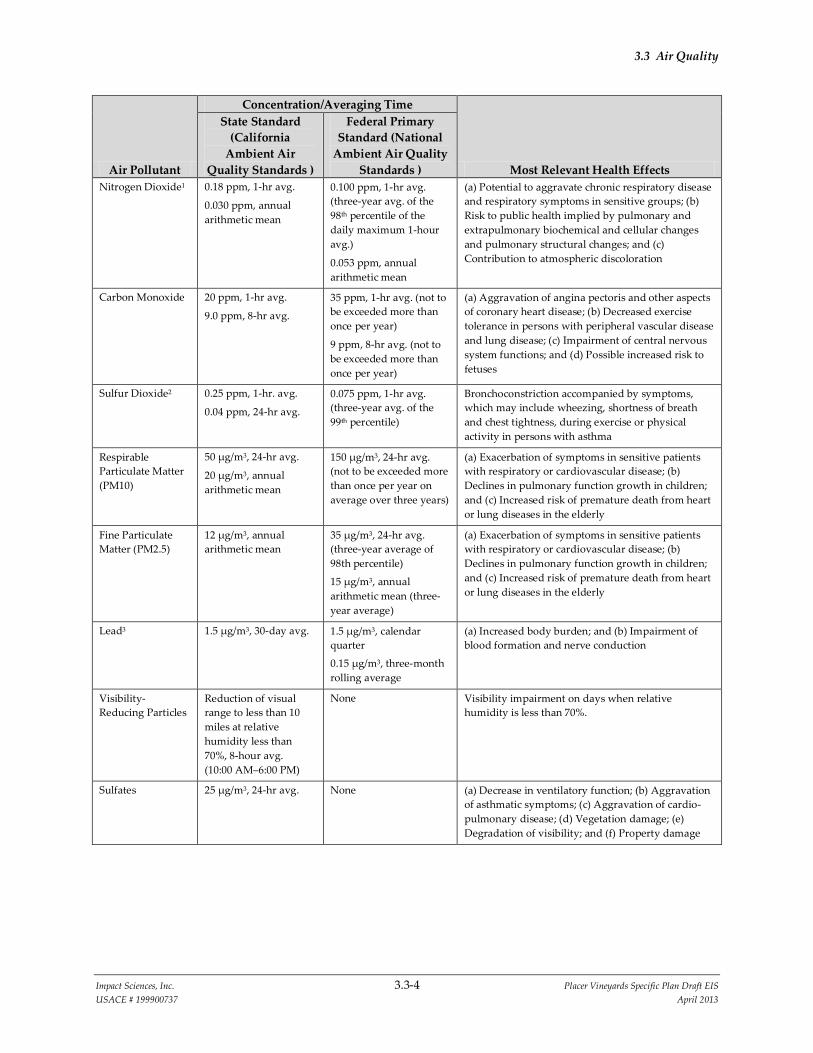
3.3 Air Quality
Impact Sciences, Inc. 3.3-4 Placer Vineyards Specific Plan Draft EIS USACE # 199900737 April 2013
Air Pollutant
Concentration/Averaging Time
Most Relevant Health Effects
State Standard (California
Ambient Air Quality Standards )
Federal Primary Standard (National
Ambient Air Quality Standards )
Nitrogen Dioxide1 0.18 ppm, 1-hr avg.
0.030 ppm, annual arithmetic mean
0.100 ppm, 1-hr avg. (three-year avg. of the 98th percentile of the daily maximum 1-hour avg.)
0.053 ppm, annual arithmetic mean
(a) Potential to aggravate chronic respiratory disease and respiratory symptoms in sensitive groups; (b) Risk to public health implied by pulmonary and extrapulmonary biochemical and cellular changes and pulmonary structural changes; and (c) Contribution to atmospheric discoloration
Carbon Monoxide 20 ppm, 1-hr avg.
9.0 ppm, 8-hr avg.
35 ppm, 1-hr avg. (not to be exceeded more than once per year)
9 ppm, 8-hr avg. (not to be exceeded more than once per year)
(a) Aggravation of angina pectoris and other aspects of coronary heart disease; (b) Decreased exercise tolerance in persons with peripheral vascular disease and lung disease; (c) Impairment of central nervous system functions; and (d) Possible increased risk to fetuses
Sulfur Dioxide2 0.25 ppm, 1-hr. avg.
0.04 ppm, 24-hr avg.
0.075 ppm, 1-hr avg. (three-year avg. of the 99th percentile)
Bronchoconstriction accompanied by symptoms, which may include wheezing, shortness of breath and chest tightness, during exercise or physical activity in persons with asthma
Respirable Particulate Matter (PM10)
50 µg/m3, 24-hr avg.
20 µg/m3, annual arithmetic mean
150 µg/m3, 24-hr avg. (not to be exceeded more than once per year on average over three years)
(a) Exacerbation of symptoms in sensitive patients with respiratory or cardiovascular disease; (b) Declines in pulmonary function growth in children; and (c) Increased risk of premature death from heart or lung diseases in the elderly
Fine Particulate Matter (PM2.5)
12 µg/m3, annual arithmetic mean
35 µg/m3, 24-hr avg. (three-year average of 98th percentile)
15 µg/m3, annual arithmetic mean (three-year average)
(a) Exacerbation of symptoms in sensitive patients with respiratory or cardiovascular disease; (b) Declines in pulmonary function growth in children; and (c) Increased risk of premature death from heart or lung diseases in the elderly
Lead3 1.5 µg/m3, 30-day avg. 1.5 µg/m3, calendar quarter
0.15 µg/m3, three-month rolling average
(a) Increased body burden; and (b) Impairment of blood formation and nerve conduction
Visibility-Reducing Particles
Reduction of visual range to less than 10 miles at relative humidity less than 70%, 8-hour avg. (10:00 AM–6:00 PM)
None Visibility impairment on days when relative humidity is less than 70%.
Sulfates 25 µg/m3, 24-hr avg. None (a) Decrease in ventilatory function; (b) Aggravation of asthmatic symptoms; (c) Aggravation of cardio-pulmonary disease; (d) Vegetation damage; (e) Degradation of visibility; and (f) Property damage

3.3 Air Quality
Impact Sciences, Inc. 3.3-5 Placer Vineyards Specific Plan Draft EIS USACE # 199900737 April 2013
Air Pollutant
Concentration/Averaging Time
Most Relevant Health Effects
State Standard (California
Ambient Air Quality Standards )
Federal Primary Standard (National
Ambient Air Quality Standards )
Hydrogen Sulfide 0.03 ppm, 1-hr avg. None Odor annoyance
Vinyl Chloride3 0.01 ppm, 24-hr avg. None Known carcinogen
Source: South Coast Air Quality Management District, Final Program Environmental Impact Report for the 2007 Air Quality Management Plan, (2007) Table 3.1-1, p. 3.1-3. µg/m3 = microgram per cubic meter. ppm = parts per million by volume. 1 On January 25, 2010, the U.S. EPA promulgated a new 1-hour NO2 standard. The new 1-hour standard is 0.100 parts per million (188
micrograms per cubic meter [µg/m3]) and became effective on April 12, 2010. 2 On June 3, 2010, the U.S. EPA issued a new 1-hour SO2 standard. The new 1-hour standard is 0.075 parts per million (196 µg/m3). The
U.S. EPA also revoked the existing 24-hour and annual standards citing a lack of evidence of specific health impacts from long-term exposures. The new 1-hour standard becomes effective 60 days after publication in the Federal Register.
3 CARB has identified lead and vinyl chloride as “toxic air contaminants” with no threshold level of exposure for adverse health effects determined. These actions allow for the implementation of control measures at levels below the ambient concentrations specified for these pollutants.
The U.S. EPA and CARB designate air basins or portions of air basins and counties as being in “attainment” or “nonattainment” for each of the criteria pollutants. Nonattainment areas are ranked (marginal, moderate, serious, severe, or extreme) according to the degree of nonattainment. Areas that do not meet the standards shown in Table 3.3-1 are classified as nonattainment areas. The National Ambient Air Quality Standards (other than O3, PM10, PM2.5, and those based on annual averages or arithmetic mean) are not to be exceeded more than once per year. The National Ambient Air Quality Standards for O3, PM10, and PM2.5 are based on statistical calculations over one- to three-year periods, depending on the pollutant. The California Ambient Air Quality Standards are not to be exceeded during a three-year period. Table 3.3-2, Placer County Attainment Status, presents the status of the Placer County portion of Air Basin with respect to the attainment of federal and state standards.
The determination of whether an area meets the state and federal standards is based on air quality monitoring data. Some areas are unclassified, which means there is insufficient monitoring data for determining attainment or nonattainment. Unclassified areas are typically treated as being in attainment. Because the attainment/nonattainment designation is pollutant specific, an area may be classified as nonattainment for one pollutant and attainment for another. Similarly, because the state and federal standards differ, an area could be classified as attainment for the federal standards of a pollutant and as nonattainment for the state standards of the same pollutant.

3.3 Air Quality
Impact Sciences, Inc. 3.3-6 Placer Vineyards Specific Plan Draft EIS USACE # 199900737 April 2013
Table 3.3-2
Placer County Attainment Status (Western Portion of County)
Pollutant Federal Standards State Standards Ozone 1-hour No federal standard Nonattainment/Serious
Ozone 8-hour Nonattainment/Severe-151 Nonattainment
Nitrogen Dioxide Attainment Attainment
Carbon Monoxide Unclassified/Attainment Unclassified/Attainment
Sulfur Dioxide Unclassified/Attainment Attainment
PM10 Attainment Nonattainment
PM2.5 Nonattainment Attainment
Lead Unclassified Attainment
Hydrogen Sulfide No federal standards Unclassified
Sulfates No federal standards Attainment
Visibility-Reducing Particulates No federal standards Unclassified
Sources: California Air Resources Board, “Area Designations Maps/State and National,” http://www.arb.ca.gov/desig/adm/adm.htm. 2012. U.S. Environmental Protection Agency, “Air Quality Maps,” http://www.epa.gov/region9/air/maps/index.html. 2012. 1 A formal request for voluntary reclassification from “serious” to “severe” for the 8-hour ozone nonattainment area with an associated
attainment deadline of June 15, 2019, was submitted by CARB to the U.S. EPA on February 14, 2008. The U.S. EPA approved the reclassification request on April 15, 2010.
3.3.2.3 Toxic Air Contaminants
In addition to criteria pollutants, CARB periodically assesses the health impacts and ambient levels of toxic air contaminants in California. The U.S. EPA assesses health impacts for hazardous air pollutants. A toxic air contaminant is defined by California Health and Safety Code (Health and Safety Code Section 397655):
“Toxic air contaminant” means an air pollutant which may cause or contribute to an increase in mortality or in serious illness, or which may pose a present or potential hazard to human health. A substance that is listed as a hazardous air pollutant pursuant to subsection (b) of Section 112 of the federal act (42 U.S.C. Sec. 7412(b)) is a toxic air contaminant.
As noted in the definition above, all U.S. EPA hazardous air pollutants are considered to be toxic air contaminants. CARB has assessed inhalation cancer risk for the state and has provided risk maps based on the Assessment System for Population Exposure Nationwide (ASPEN) dispersion model (U.S. EPA n.d.a). The ASPEN model is used in the U.S. EPA’s National Air Toxics Assessment study (U.S. EPA n.d.b). The risk maps depict inhalation cancer risk due to modeled outdoor toxic pollutant levels, and do not account for cancer risk due to other types of exposure (i.e., direct or ingestion). Based on CARB’s assessment, the largest contributor to inhalation cancer risk is diesel emissions, which is consistent with the result of other studies, such as the South Coast Air Quality Management District’s Multiple Air Toxics Exposure Study III (South Coast Air Quality Management District 2008).

3.3 Air Quality
Impact Sciences, Inc. 3.3-7 Placer Vineyards Specific Plan Draft EIS USACE # 199900737 April 2013
In 2004, CARB conducted a health risk assessment of airborne particulate matter emissions from diesel-fueled locomotives at the Union Pacific J.R. Davis Yard located in Roseville, California. The study found that the background cancer risk for the broader Sacramento region was 360 in 1 million for diesel particulate matter and 520 in 1 million for all toxic air contaminants (CARB 2004).
3.3.2.4 Ambient Air Monitoring
CARB has established and maintains a network of sampling stations in conjunction with local air pollution control districts (APCDs) and air quality management districts (AQMDs), private contractors, and the National Park Service. The monitoring station network provides air quality monitoring data, including real-time meteorological data and ambient pollutant levels, as well as historical data. The network in the Air Basin consists of 12 monitoring stations. The closest monitoring station to the project is located at 151 North Sunrise Boulevard in Roseville, located approximately 8 miles east of the project site. This station monitors ambient pollutant concentrations of O3, NO2, PM10, and PM2.5. The nearest station to the project site that monitors CO and SO2 is located at 7823 Blackfoot Way in North Highlands to the south of the project site.
Table 3.3-3, Ambient Pollutant Concentrations Registered Nearest to the Project Site, at the end of this section, lists the measured ambient pollutant concentrations and the exceedances of state and federal standards that have occurred at the above mentioned monitoring stations from 2008 through 2010, the most recent years for which data are available. As shown, the monitoring station in Roseville has registered values above state and federal standards for O3, the state standard for PM10, and the federal standard for PM2.5. The standards for CO, NO2, SO2, lead, and sulfate have not been exceeded anywhere within the basin for several years. Values for lead and sulfate are not presented in the table below since ambient concentrations are well below the state standards. Hydrogen sulfide, vinyl chloride, and visibility reducing particles were not monitored by CARB or the SMAQMD in the Air Basin during the period from 2008 to 2010.
3.3.3 REGULATORY FRAMEWORK – APPLICABLE LAWS, REGULATIONS, PLANS, AND POLICIES
Air quality within Placer County is addressed through the efforts of various federal, state, regional, and local government agencies. The agencies primarily responsible for improving the air quality within the County include the U.S. EPA, CARB, Air District, and the Sacramento Area Council of Governments (SACOG). The Placer County General Plan includes an Air Quality element, with goals and policies intended to improve air quality in the County. These agencies, their laws, regulations, rules, plans, and policies as they pertain to air quality and the Proposed Action are discussed below.

3.3 Air Quality
Impact Sciences, Inc. 3.3-8 Placer Vineyards Specific Plan Draft EIS USACE # 199900737 April 2013
Table 3.3-3
Ambient Pollutant Concentrations Registered Nearest to the Project Site
Pollutant Standards1 Year
2008 2009 2010 OZONE (O3)
Maximum 1-hour concentration monitored (ppm) 0.134 0.113 0.124
Maximum 8-hour concentration monitored (ppm) 0.107 0.101 0.105
Number of days exceeding state 1-hour standard 0.09 ppm 20 13 9
Number of days exceeding state 8-hour standard 0.070 ppm 38 32 21
Number of days exceeding federal 8-hour standard2 0.075 ppm 22 19 15
CARBON MONOXIDE (CO)
Maximum 8-hour concentration monitored (ppm) 1.90 1.66 1.16
Number of days exceeding state 8-hour standard 9.0 ppm 0 0 0
Number of days exceeding federal 8-hour standard 9 ppm 0 0 0
NITROGEN DIOXIDE (NO2)
Maximum 1-hour concentration monitored (ppm) 0.067 0.061 0.071
Annual average concentration monitored (ppm) 0.012 0.010 0.010
Number of days exceeding state 1-hour standard 0.18 ppm 0 0 0
Number of days exceeding state 1-hour standard3 0.100 ppm 0 0 0
PARTICULATE MATTER (PM10)
Maximum 24-hour concentration monitored (µg/m3) 74.2 33.5 36.3
Annual average concentration monitored (µg/m3) 22.7 17.9 15.4
Number of samples exceeding state standard 50 µg/m3 6 0 0
Number of samples exceeding federal standard 150 µg/m3 0 0 0
PARTICULATE MATTER (PM2.5)
Maximum 24-hour concentration monitored (µg/m3) 60.0 22.6 27.3
Annual average concentration monitored (µg/m3) 10.0 8.5 6.6
Number of samples exceeding federal standard 35 µg/m3 6 0 0
SULFUR DIOXIDE (SO2)
Maximum 24-hour concentration monitored (ppm) 0.002 0.002 0.002
Number of samples exceeding 24-hour state standard 0.04 ppm 0 0 0
Number of samples exceeding federal 24-hour standard 0.14 ppm 0 0 0
Sources: California Air Resource Board, “Air Quality Data Statistics,” http://www.arb.ca.gov/adam/welcome.html. U.S. Environmental Protection Agency, “Air Data: Access to Air Pollution Data,” http://www.epa.gov/air/data/. — No air quality data received for this year. 1 Parts by volume per million of air (ppm), micrograms per cubic meter of air (µg/m3), or annual arithmetic mean (aam). 2 Federal 8-hour O3 standard was revised to 0.075 ppm in March 2008. Statistics are based on the current standard. 3 The U.S. EPA has promulgated a new 1-hour National Ambient Air Quality Standards for NO2. The new 1-hour standard is 0.100 parts
per million (188 micrograms per cubic meter) and became effective on April 12, 2010.

3.3 Air Quality
Impact Sciences, Inc. 3.3-9 Placer Vineyards Specific Plan Draft EIS USACE # 199900737 April 2013
3.3.3.1 Federal Regulations
Clean Air Act
The U.S. EPA is responsible for enforcing the federal Clean Air Act (CAA) and the National Ambient Air
Quality Standards. The U.S. EPA regulates emission sources that are under the exclusive authority of the
federal government, such as aircraft, ships, and certain locomotives. The U.S. EPA also maintains
jurisdiction over emission sources beyond state waters (outer continental shelf), and establishes various emissions standards for vehicles sold in states other than California. These standards identify acceptable
levels of ambient concentrations for seven criteria pollutants: ozone (O3), CO, NO2, SO2, PM10, PM2.5,
and lead. The thresholds are considered to be the maximum concentrations of ambient (background) air
pollutants determined safe to protect the public health and welfare with an adequate margin of safety.
As part of its enforcement responsibilities, the U.S. EPA requires each state with areas that do not meet
the federal standards to prepare and submit a State Implementation Plan (SIP) that demonstrates the means to attain federal standards. The SIP must integrate federal, state, and local plan components and
regulations to identify specific measures to reduce pollution, using a combination of performance standards and market-based programs within the time frame identified in the SIP. The Air Quality
Attainment Plan (AQAP), prepared by the Air District in conjunction with other air pollution control
districts in the Air Basin, is the regulatory mechanism by which the Air District conforms to U.S. EPA
regulations. The Air District provides Triennial Progress Reports (TPRs) on air quality issues addressed by the AQAP, with the latest published in draft form in 2009.
The 1990 CAA Amendments were enacted to better protect the public’s health and create more efficient
methods for lowering pollutant emissions. The major areas of improvement addressed in the
amendments include National Ambient Air Quality Standards, air basin designations, automobile/heavy-
duty engine emissions, and hazardous air pollutants. The U.S. EPA has designated air basins as being in
attainment or nonattainment for each of the seven criteria pollutants. Nonattainment air basins for ozone are further ranked (marginal, moderate, serious, severe, or extreme) according to the degree of
nonattainment. CARB is required to describe in its SIP how the state will achieve federal standards by
specified dates for each air basin that has failed to attain a National Ambient Air Quality Standards for
any criteria pollutant.
The extent of mitigation implementation of a given SIP depends on the severity of the air quality
condition within the state or a specific air basin. Western Placer County is classified by the U.S. EPA as in serious nonattainment for the O3 standard, in nonattainment for the PM2.5 standard, and as attainment/unclassified for the other criteria pollutants, as summarized in Table 3.3-2, Placer County
Attainment Status, above.
The 1990 CAA Amendments addressed tailpipe emissions from automobiles, heavy-duty engines, and diesel fuel engines. The amendments established more stringent standards for hydrocarbons, NOX, and CO emissions in order to reduce the ozone and carbon monoxide levels in heavily populated areas.

3.3 Air Quality
Impact Sciences, Inc. 3.3-10 Placer Vineyards Specific Plan Draft EIS USACE # 199900737 April 2013
Under the 1990 CAA Amendments, new fuels were required to be less volatile, contain less sulfur (regarding diesel fuel), and have higher levels of oxygenates (oxygen-containing substances to improve fuel combustion). Due to the lack of a substantial reduction in hazardous emissions under the 1977 CAA, the 1990 CAA Amendments listed 189 hazardous air pollutants (HAPs), which are carcinogenic, mutagenic, and/or reproductive toxicants, to be reduced. The 1990 CAA Amendments regulate major stationary sources and area emissions sources requiring use of Maximum Achievable Control Technology to reduce HAP emissions and their associated health impacts.
3.3.3.2 State Regulations
California Clean Air Act
The California Clean Air Act (CCAA) established a legal mandate for air basins to achieve the California Ambient Air Quality Standards by the earliest practical date. The California Ambient Air Quality Standards, established by CARB, apply to the same seven pollutants as the National Ambient Air Quality Standards, as well as to sulfates, visibility-reducing particles, hydrogen sulfide, and vinyl chloride. California Ambient Air Quality Standards are more stringent than the National Ambient Air Quality Standards, and in the case of PM10 and SO2, far more stringent.
As a branch of the California Environmental Protection Agency, CARB oversees air quality monitoring, planning, and control throughout California. It is primarily responsible for implementing the CCAA, ensuring conformance with CAA requirements, and for regulating emissions from motor vehicles and consumer products within the state. In addition, CARB sets the California Ambient Air Quality Standards and control measures for toxic air contaminants (TACs). CARB approves the regional air quality management/attainment plans for incorporation into the SIP and is responsible for preparing those portions of the SIP related to mobile source emissions. CARB establishes new standards for vehicles sold in California and for various types of commercially available equipment. It also sets fuel specifications to further reduce vehicular emissions.
CARB also makes area designations for O3, CO, NO2, SO2, PM10, PM2.5, sulfates, lead, hydrogen sulfide, and visibility-reducing particles. Health and Safety Code Section 39607(e) requires CARB to establish and periodically review area designation criteria. These designation criteria provide the basis for CARB to designate areas of the state as “attainment,” “nonattainment,” or “unclassified” according to state standards. In addition, Health and Safety Code Section 39608 requires CARB to use the designation criteria to classify areas of the state and to annually review those area designations.
3.3.3.3 Local Plans, Policies, and Ordinances
Sacramento Area Council of Governments
The SACOG is an association of local governments in the Sacramento County region that provides transportation planning and funding for the region. Although SACOG is not an air quality management agency, it is responsible for several air quality planning issues. Specifically, as the designated Metropolitan Planning Organization for the Sacramento region, it is responsible, pursuant to

3.3 Air Quality
Impact Sciences, Inc. 3.3-11 Placer Vineyards Specific Plan Draft EIS USACE # 199900737 April 2013
Section 176(c) of the 1990 CAA Amendments, for providing current population, employment, travel, and congestion projections for regional air quality planning efforts.
Placer County Air Pollution Control District
The Air District has jurisdiction over most air quality matters within the Placer County portion of the Air Basin. The Air District regulates most stationary sources of air pollutants in Placer County, maintains ambient air quality monitoring stations at numerous locations, and collaborates in preparation of the air quality management/attainment plans for the area that are required under the CAA and CCAA. The Air District also prepares regular progress reports, the TPRs, which detail the results of efforts to improve air quality within Placer County and the Air Basin.
Sacramento Valley Air Basin Air Quality Plans
As shown in Table 3.3-2, the western portion of Placer County is in nonattainment for the federal standards for ozone (8-hour) and PM2.5. Western Placer County is also in nonattainment for the state standards of ozone (1-hour), ozone (8-hour), and PM10. Therefore, the Air District has assisted in preparing attainment plans for the area in order to demonstrate achievement of the state and federal ambient air quality standards for ozone, PM10, and PM2.5. The most recent plans include:
• Air Quality Attainment Plan
• Sacramento Regional Clean Air Plan for the 1-Hour National Ozone Standard
• Sacramento Region Clean Air Plan Update
• Sacramento Regional Nonattainment Area 8-Hour Ozone Rate-of-Progress Plan
• Sacramento Regional 8-Hour Ozone Attainment and Reasonable Further Progress Plan
The Air District must continuously monitor its progress in implementing these attainment plans and must periodically report to CARB and the U.S. EPA. It must also periodically revise its attainment plans to reflect new conditions and requirements in accordance with schedules mandated by the CAA and the CCAA. The following sections provide an overview of these five plans.
Air Quality Attainment Plan
The CCAA requires nonattainment areas to achieve and maintain the state ambient air quality standards by the earliest practicable date and local air districts to develop plans for attaining the state ozone, CO, SO2, and NO2 standards. In compliance with the CCAA, the Air District collaborated with other air pollution control districts in the Air Basin to prepare and submit the 1991 Air Quality Attainment Plan.
The CCAA also requires triennial assessments to report the extent of air quality improvement and the amounts of emission reductions achieved from control measures for the preceding three-year period. The Air District Board of Directors adopted the most recent Triennial Progress Report in 2006, with a draft version of the 2009 TPR published in 2010. The report identifies “all feasible measures” the Air District will study or adopt over the next three years. The report also describes historical trends in air quality, updates emissions inventories, and evaluates the Air District's implementation of air pollution control measures.

3.3 Air Quality
Impact Sciences, Inc. 3.3-12 Placer Vineyards Specific Plan Draft EIS USACE # 199900737 April 2013
Sacramento Regional Clean Air Plan
The Clean Air Plan was adopted in 1994 in compliance with the 1990 Amendments to the Federal Clean Air Act, which was developed cooperatively with all the districts in the Sacramento Region (El Dorado Air Pollution Control District, Feather River Air Quality Management District, Air District, Sacramento Metropolitan Air Quality Management District, and Yolo-Solano Air Quality Management District). The region could not show that it would meet federal 1-hour ozone standard by 1999; therefore, the deadline was extended to 2005 and the region accepted a designation of “severe nonattainment” for the federal 1-hour ozone standard, with additional emission requirements on stationary sources. As a "severe nonattainment" area, the Sacramento Region is required to submit a rate-of-progress milestone evaluation report. The 1999 and 2002 Milestone Reports include compliance demonstrations that the milestone requirement has been met for the Sacramento nonattainment area.
The federal CAA requires the region’s transportation plan to conform to the region’s ozone standards. Regions with a SIP must analyze the emissions anticipated from transportation plans and transportation improvement programs and ensure that they remain within the SIP’s emissions, demonstrating conformity with the federal CAA. Regions with a SIP have a “motor vehicle emissions budget” tied to the SIP. Transportation planners must analyze the emissions anticipated from transportation plans and transportation improvement programs and ensure that they remain within the SIP’s emissions budget (this is called demonstrating conformity). A conformity lapse for the Sacramento region began October 4, 2004, and an expedited new Clean Air Plan was prepared. The following section describes the Clean Air Plan update and plans to meet the 8-hour ozone standard, which the U.S. EPA promulgated in 1997.
Sacramento Region Clean Air Plan Update/Sacramento Regional Nonattainment Area 8-Hour Ozone
Rate-of-Progress Plan
The Sacramento Region Clean Air Plan Update/Sacramento Regional Nonattainment Area 8-Hour Ozone Rate-of-Progress Plan (8-Hour Ozone Plan) updates the region’s Clean Air Plan to addresses the conformity lapse through updates to the emission inventory and establishing new motor vehicle emission budgets. In addition to updating the Clean Air Plan, the Plan also fulfills the federal 8-hour ozone requirements for the 2002–2008 Rate-of-Progress Plan for the Sacramento regional nonattainment area.
In July 1997, U.S. EPA promulgated a new 8-hour standard for ozone. Key aspects of the 8-hour ozone rule are the new designations and nonattainment classifications and the revocation of the 1-hour ozone standard in June 2005. However, the new rule also addresses anti-backsliding provisions in the Clean Air Act, so 8-hour ozone nonattainment areas remain subject to control measure commitments that applied under the 1-hour ozone standard. The Sacramento region was designated as a “serious” nonattainment area for the federal 8-hour ozone standard with an attainment deadline of June 2013. The 8-Hour Ozone Plan addresses how the region will meet the federal 8-hour ozone standard by this attainment deadline.
Sacramento Regional 8-Hour Ozone Attainment and Reasonable Further Progress Plan
The 2009 Sacramento Regional 8-Hour Ozone Attainment and Reasonable Further Progress Plan was adopted on December 19, 2008 but has not been approved by the U.S. EPA. The Sacramento region was classified

3.3 Air Quality
Impact Sciences, Inc. 3.3-13 Placer Vineyards Specific Plan Draft EIS USACE # 199900737 April 2013
by the U.S. EPA as a “serious” nonattainment area on June 15, 2004, for the federal 8-hour ozone standard with an attainment deadline of June 15, 2013. However, since the Sacramento region needs to rely on the longer-term emission reduction strategies from state and federal mobile source control programs, the 2013 attainment date cannot be met. Consequently, on February 14, 2008, CARB, on behalf of the air districts in the Sacramento region, submitted a letter to U.S. EPA requesting a voluntary reclassification (bump-up) of the Sacramento federal nonattainment area from a “serious” to a “severe-15” 8-hour ozone nonattainment area with an extended attainment deadline of June 15, 2019.1 The U.S. EPA approved the reclassification request on April 15, 2010. The 8-Hour Ozone Attainment Plan includes the information and analyses to fulfill the CAA requirements for demonstrating reasonable further progress and attainment of the 1997 8-hour ozone National Ambient Air Quality Standards for the Sacramento region. The Plan also contains a Reasonable Further Progress (RFP) demonstration. The RFP demonstration shows that existing local, state, and federal controls are sufficient for the Sacramento Metropolitan Area to achieve the required minimum 3 percent per year reduction in ozone-precursor emissions. This RFP also sets the new transportation conformity budget for the Sacramento metropolitan transportation plan area.
PCAPCD Rules and Regulations
The Air District’s primary means of implementing its attainment plans is through its adopted rules and regulations. The Proposed Action would be subject to the following rules adopted by the Air District that are designed to reduce and control pollutant emissions throughout the Air Basin.
• Rule 202 (Visible Emissions): A person shall not discharge into the atmosphere from any single source of emission whatsoever any air contaminant for a period or periods aggregating more than three (3) minutes in any one (1) hour which is:
− As dark or darker in shade as that designated as No. 1 on the Ringelmann Chart, as published by the United States Bureau of Mines, or
− Of such opacity as to obscure an observer's view to a degree equal to or greater than does smoke described in Subsection (A) above.
• Rule 205 (Nuisance): A person shall not discharge from any source whatsoever such quantities of air contaminants or other material which cause injury, detriment, nuisance or annoyance to any considerable number of persons or to the public, or which endanger the comfort, repose, health or safety of any such persons or the public, or which cause to have a natural tendency to cause injury or damage to business or property.
• Rule 217 (Cutback and Emulsified Asphalt Paving Materials): A person shall not manufacture for sale nor use for paving, road construction or road maintenance any: rapid cure cutback asphalt; slow cure cutback asphalt containing organic compounds which evaporate at 500 °F or lower as determined by current American Society for Testing and Materials (ASTM) Method D402; medium cure cutback asphalt except as provided in Section 1.2.; or emulsified asphalt
1 In order to attain by June 15th, the prior year’s ozone season would need to be in attainment, making 2018 the
attainment demonstration analysis year.

3.3 Air Quality
Impact Sciences, Inc. 3.3-14 Placer Vineyards Specific Plan Draft EIS USACE # 199900737 April 2013
containing organic compounds which evaporate at 500 °F or lower as determined by current ASTM Method D244, in excess of 3 percent by volume.
• Rule 218 (Application of Architectural Coatings): No person shall manufacture, blend, or repackage for sale within the Air District; supply, sell, or offer for sale within Air District; or solicit for application or apply within the Air District, any architectural coating with a volatile organic carbon (VOC) content in excess of the corresponding specified manufacturer’s maximum recommendation.
• Rule 225 (Wood Burning Appliances): No person shall sell or supply new wood burning appliances unless it is a U.S. EPA phase II Certified wood burning appliance, pellet-fueled wood burning heater, masonry heater, or determined to meet the U.S. EPA standard for particulate matter emissions standards.
• Rule 228 (Fugitive Dust):
− Visible Emissions Not Allowed Beyond the Boundary Line: A person shall not cause or allow the emissions of fugitive dust from any active operation, open storage pile, or disturbed surface area (including disturbance as a result of the raising and/or keeping of animals or by vehicle use), such that the presence of such dust remains visible in the atmosphere beyond the boundary line of the emission source.
− Visible Emissions from Active Operations: In addition to the requirements of Rule 202, Visible Emissions, a person shall not cause or allow fugitive dust generated by active operations, an open storage pile, or a disturbed surface area, such that the fugitive dust is of such opacity as to obscure an observer's view to a degree equal to or greater than does smoke as dark or darker in shade as that designated as number 2 on the Ringelmann Chart, as published by the United States Bureau of Mines.
− Concentration Limit: A person shall not cause or allow PM10 levels to exceed 50 micrograms per cubic meter (µg/m3) (24-hour average) when determined, by simultaneous sampling, as the difference between upwind and downwind samples collected on high-volume particulate matter samplers or other U.S. EPA-approved equivalent method for PM10 monitoring.
− Track-Out onto Paved Public Roadways: Visible roadway dust as a result of active operations, spillage from transport trucks, and the track-out of bulk material onto public paved roadways shall be minimized and removed.
• The track-out of bulk material onto public paved roadways as a result of operations, or erosion, shall be minimized by the use of track-out and erosion control, minimization, and preventative measures, and removed within 1 hour from adjacent streets such material anytime track-out extends for a cumulative distance of greater than 50 feet onto any paved public road during active operations.
• All visible roadway dust tracked-out upon public paved roadways as a result of active operations shall be removed at the conclusion of each work day when active operations cease, or every 24 hours for continuous operations. Wet sweeping or a High Efficiency Particulate Air filter equipped vacuum device shall be used for roadway dust removal.
• Any material tracked-out, or carried by erosion, and clean-up water, shall be prevented from entering waterways or storm water inlets as required to comply water quality control requirements.

3.3 Air Quality
Impact Sciences, Inc. 3.3-15 Placer Vineyards Specific Plan Draft EIS USACE # 199900737 April 2013
− Minimum Dust Control Requirements: The following dust mitigation measures are to be initiated at the start and maintained throughout the duration of the construction or grading activity, including any construction or grading for road construction or maintenance.
• Unpaved areas subject to vehicle traffic must be stabilized by being kept wet, treated with a chemical dust suppressant, or covered.
• The speed of any vehicles and equipment traveling across unpaved areas must be no more than 15 miles per hour unless the road surface and surrounding area is sufficiently stabilized to prevent vehicles and equipment traveling more than 15 miles per hour from emitting dust exceeding Ringelmann 2 or visible emissions from crossing the project boundary line.
• Storage piles and disturbed areas not subject to vehicular traffic must be stabilized by being kept wet, treated with a chemical dust suppressant, or covered when material is not being added to or removed from the pile.
• Prior to any ground disturbance, including grading, excavating, and land clearing, sufficient water must be applied to the area to be disturbed to prevent emitting dust exceeding Ringelmann 2 and to minimize visible emissions from crossing the boundary line.
• Construction vehicles leaving the site shall be cleaned to prevent dust, silt, mud, and dirt, from being released or tracked off-site.
• When wind speeds are high enough to result in dust emissions crossing the boundary line, despite the application of dust mitigation measures, grading and earthmoving operations shall be suspended.
• No trucks are allowed to transport excavated material off-site unless the trucks are maintained such that no spillage can occur from holes or other openings in cargo compartments, and loads are either covered with tarps; or wetted and loaded such that the material does not touch the front, back, or sides of the cargo compartment at any point less than 6 inches from the top and that no point of the load extends above the top of the cargo compartment.
− Wind-Driven Fugitive Dust Control: A person shall take action(s), such as surface stabilization, establishment of a vegetative cover, or paving, to minimize wind-driven dust from inactive disturbed surface areas.
• Rule 501 (General Permit Requirement): Any person operating an article, machine, equipment or other contrivance, the use of which may cause, eliminate, reduce, or control the issuance of air contaminants, shall first obtain a written permit from the Air Pollution Control Officer. Stationary sources subject to the requirements of Rule 507, Federal Operating Permit Program, must also obtain a Title V permit pursuant to the requirements and procedures of that rule.
• Rule 508 (General Conformity): The conditions of the Code of Federal Regulations, Title 40, Chapter I, Subchapter C, Parts 6 and 51 in effect January 31, 1994, are made part of the Rules and Regulations of the Placer County Air Pollution Control District.
• Rule 509 (Traffic Conformity): The conditions of the Code of Federal Regulations, Title 40, Chapter I, Part 51, Subpart T, Sections 51.392 - 51.400, 51404, 51,410 - 51.450, 51.460, and 51.462, in effect December 27, 1993, are made part of the Rules and Regulations of the Placer County Air Pollution Control District.

3.3 Air Quality
Impact Sciences, Inc. 3.3-16 Placer Vineyards Specific Plan Draft EIS USACE # 199900737 April 2013
Placer County General Plan
The Placer County General Plan includes an Air Quality element, with goals and policies intended to improve air quality in the County. These policies generally mirror state and federal air quality rules and regulations. Policies in the General Plan Air Quality element relevant to the proposed action include:
Policy 6.F.6. The County shall require project-level environmental review to include identification of potential air quality impacts and designation of design and other appropriate mitigation measures or offset fees to reduce impacts. The County shall dedicate staff to work with project proponents and other agencies in identifying, ensuring the implementation of, and monitoring the success of mitigation measures.
Policy 6.F.7. The County shall encourage development to be located and designed to minimize direct and indirect air pollutants.
Policy 6.F.8. The County shall submit development proposals to the PCAPCD for review and comment in compliance with CEQA prior to consideration by the appropriate decision-making body.
Policy 6.F.9. In reviewing project applications, the County shall consider alternatives or amendments that reduce emissions of air pollutants.
Policy 6.F.10. The County may require new development projects to submit an air quality analysis for review and approval. Based on this analysis, the County shall require appropriate mitigation measures consistent with the PCAPCD’s 1991 Air Quality Attainment Plan (or updated edition).
Policy 6.G.3. The County shall encourage the use of alternate forms of transportation by incorporating public transit, bicycle, and pedestrian modes in County transportation planning and by requiring new development to provide adequate pedestrian and bikeway facilities.
Policy 6.G.4. The County shall consider instituting disincentives for single-occupant vehicle trips, including limitation in parking supply in areas where alternative transportation modes are available and other measures identified by the PCAPCD and incorporated into regional plans.
Policy 6.G.5. The County shall endeavor to secure adequate funding for transit services so that transit is a viable transportation alternative. New development shall pay its fair share of the cost of transit equipment and facilities required to serve new projects.

3.3 Air Quality
Impact Sciences, Inc. 3.3-17 Placer Vineyards Specific Plan Draft EIS USACE # 199900737 April 2013
Policy 6.G.6. The County shall require large new developments to dedicate land for and construct appropriate improvements for park-and-ride lots, if suitably located.
3.3.4 SIGNIFICANCE THRESHOLDS AND ANALYSIS METHODOLOGY
3.3.4.1 Significance Thresholds
The Air District has adopted thresholds for determining significant impacts on air quality. In accordance with guidance from the Council on Environmental Quality (40 CFR § 1506.2), the U.S. Army Corps of Engineers (USACE) considers local standards when determining significance of the impacts of a proposed action. Therefore, the USACE has used the thresholds developed by the local Air District to evaluate the impacts of the Proposed Action and its alternatives on air quality.
The Air District thresholds are presented below in Table 3.3-4 Placer County CEQA Significance Thresholds. These thresholds apply to both construction and operational emissions and were developed in order to allow the Air District meet its obligations under both the CAA and the California Environmental Quality Act (CEQA). If the emission rates of a particular pollutant associated with a proposed project are above these thresholds, the project is judged to potentially have a significant impact on air quality.2
Table 3.3-4
Placer County Air District Significance Thresholds
Pollutant Threshold
(lbs per day) ROG 82
NOx 82
PM10 82
CO 550
Source: Placer County APCD, (2012).
2 The PCAPCD has developed the approach to the assessment of air quality impacts which is based on mass
emissions of pollutants and does not require the estimation of pollutant concentrations. The air district (like all other air districts in the state) has developed thresholds of significance that are in pounds per day (or tons per year) that can be used to measure a project’s impact on regional air quality. Significance thresholds produced by the air districts are designed to ensure compliance with both NAAQS and CAAQS. The air districts use this approach because pollutants released at one point may be transported throughout the air basin, or even into neighboring air basins. Consequently, the focus of air districts in attaining ambient air standards is on overall basin-wide emissions. The most efficient way to protect regional air quality is to restrict emissions on a mass basis, and therefore guidelines developed by the air districts include significance thresholds using pounds per day as the preferred measure. This is discussed in the Placer County APCD CEQA guidelines (PCAPCD 2012).

3.3 Air Quality
Impact Sciences, Inc. 3.3-18 Placer Vineyards Specific Plan Draft EIS USACE # 199900737 April 2013
3.3.4.2 Analysis Methodology
URBEMIS2007 Environmental Management Software was used to estimate construction emissions and operational emissions from area and mobile sources associated with the Proposed Action. Construction was assumed to occur over a period of 18 years, beginning in 2013 and completing by 2025. Emissions during construction and operation were estimated using default values in URBEMIS2007. These emissions are primarily associated with combustion of natural gas, operation of landscape maintenance equipment, and evaporative emissions from architectural coatings and consumer products.
Localized CO concentration estimates were obtained from the Place Vineyards Specific Plan EIR. That EIR used the CALINE4 model and methodologies as developed by California Department of Transportation (Caltrans) for use with CALINE (California Department of Transportation 1989) to estimate CO concentrations. CO concentrations were modeled using traffic volumes and conditions from the traffic study performed for the EIR. Background CO concentrations for the area of the Proposed Action were included in the analysis, specifically 2.6 ppm for the 1-hour and 1.3 ppm for the 8-hour averaging periods for the 2015 and 2025 scenarios The 2025 values are considered conservative, because given the same assumptions, CO concentrations would be less in 2030 than in 2025 due to improvements in local air quality and reductions in average vehicle emissions.
Impacts due to exposure to TACs are generally assessed using a Health Risk Assessment (HRA), which quantifies the risk of chronic and acute health impacts including cancer. This process requires modeling with precise information regarding specific sources and TACs as well as receptor data. This level of detail is not available to date, so an HRA was not conducted for the Proposed Action and the impacts from TACs were analyzed qualitatively. This was done by identifying sensitive receptors such as schools and residences and comparing their location with either existing or potential sources of TACs, taking into consideration wind patterns in the area. Sources considered include industrial sites, commercial zones, and freeways and other major roadways.
Potential odor impacts were also analyzed qualitatively, examining the locations of existing and future odor sources relative to the receptors in the context of prevailing wind patterns.
With respect to the construction emissions of the alternatives (No Action and Alternatives 1 through 5), emissions were assumed to be proportional to acreage under development. For operations, emissions of the alternatives were assumed to be proportional to the number of residences and the area of non-residential buildings. All alternatives have very similar amounts of land area that would be developed and similar amounts of non-residential space. The number of residential units for all alternatives is identical to the number included in the Proposed Action. While the exact mix of types of residential units differs with each alternative (that is, the ratio of single-family homes to multi-family buildings is different), the difference is be expected to result in very minor changes in the overall emissions. Similarly, while the acreage that would be disturbed or developed varies somewhat with each alternative, the difference is minor and not expected to result in substantial differences in emissions from construction. Therefore, construction and operational emissions from all alternatives were assumed to be similar to the emissions from construction and operation of the Proposed Action.

3.3 Air Quality
Impact Sciences, Inc. 3.3-19 Placer Vineyards Specific Plan Draft EIS USACE # 199900737 April 2013
3.3.5 ENVIRONMENTAL CONSEQUENCES AND MITIGATION MEASURES
Impact AQ-1 Emissions Associated with Construction
No Action Alt.
Construction of the No Action Alternative would likely generate emissions of ROG, NOx, and PM10 in exceedance of thresholds and therefore are likely to result in a significant effect on air quality in the Air Basin.
Construction-related emissions can be distinguished as either on-site or off-site. On-site emissions generated during construction principally consist of exhaust emissions (NOX, sulfur oxides [SOX], CO, VOC, PM10, and PM2.5) from the operation of heavy-duty construction equipment, fugitive dust (PM10) from disturbed soil, and VOC emissions from asphaltic paving and painting. Off-site emissions during the construction phase normally consist of exhaust emissions and entrained paved road dust (PM10 and PM2.5) from worker commute trips, material delivery trips, and haul truck trips to and from the construction site.
Construction activities associated with the No Action Alternative would occur over a number of years, with portions of the area developed in phases. However, the exact timing and duration of these phases is not currently known as they will be determined by market conditions and other factors that are unpredictable over the course of development. The period over which construction of the No Action Alternative would occur is assumed for this EIS to extend from 2013 to 2030. Construction emissions were not separately modeled for the No Action Alternative. As shown in Table 3.3-5, Estimated Unmitigated Construction Emissions – Proposed Action Base Plan and Blueprint Scenarios emissions of ROG, NOx, and PM10 from the Proposed Action Base Plan and Blueprint scenarios are above the significance threshold. The No Action Alternative is substantially smaller than the Proposed Action Base Plan and Blueprint scenarios as it involves a mixed-use residential community of approximately 8,030 residential units and 24,000 residents compared to a community of 14,132 residential units under the Base Plan and about 21,631 residential units under the Blueprint scenario. However, given the size of the No Action Alternative, its construction would likely result in emissions of ROG and PM10 that are above significance thresholds. Therefore, the No Action Alternative would result in a significant effect on air quality in the Air Basin.
PVSP EIR Mitigation Measures 4.8-1a through 4.8-1e would be implemented to address the effect of the No Action Alternative on air quality. The USACE assumes that Placer County would impose the same mitigation measure on the No Action Alternative. PVSP EIR Mitigation Measures 4.8-1a through 4.8-1e would reduce fugitive dust and other sources of PM10 and PM2.5 emissions during construction. The County EIR determined that, while the mitigation measure would reduce construction emissions, the impact would not be reduced to a less than significant level for the Proposed Action (Placer County 2007). Construction emissions from the No Action Alternative would also likely

3.3 Air Quality
Impact Sciences, Inc. 3.3-20 Placer Vineyards Specific Plan Draft EIS USACE # 199900737 April 2013
not be reduced to be below the significance thresholds. The USACE finds, based on the estimated mitigated emissions reported for the Proposed Project, that after mitigation, emissions of ROG and PM10 would likely remain above the significance thresholds. Consequently, construction emissions are predicted to have a residual significant effect on air quality after mitigation.
Proposed Action (Base Plan and Blueprint Scenarios)
Construction of the Proposed Action would generate emissions of ROG, NOx, and PM10 that would exceed significance thresholds and therefore are likely to result in a significant effect on air quality in the Air Basin.
Construction activities associated with the Proposed Action would occur over a number of years, with portions of the area developed in phases. However, the exact timing and duration of these phases is not currently known as they will be determined by market conditions and other factors that are unpredictable over the course of development. The period over which construction of the full Proposed Action would occur is assumed for this EIS to extend from 2013 to 2030. Since emissions rates for construction are evaluated on a maximum rate per day, any extension of the construction schedule would result in emissions that are the same or less than for the shortest schedule. Consequently, the construction emissions of criteria pollutants shown in Table 3.3-5, Estimated Unmitigated Construction Emissions – Proposed Action Base Plan and Blueprint Scenarios are conservatively based on a construction schedule from 2013 to 2030, with total development averaged over that period.
Table 3.3-5
Estimated Unmitigated Construction Emissions – Proposed Action Base Plan and Blueprint Scenarios
Maximum Emissions in Any Construction Year
Emissions in Pounds per Day ROG NOX CO SOX PM10 PM2.5
Proposed Action – Base Plan scenario
1,306 116 129 0.13 520 113
Proposed Action – Blueprint scenario
2,052 141 176 0.20 788 170
Significance Threshold 82 82 550 -- 82 --
Source: Impact Sciences 2012. Emissions calculations are provided in Appendix 3.3.
As construction emissions of ROG, NOx, and PM10 for the Proposed Action are above significance thresholds, the Proposed Action is likely to result in a significant effect on air quality in the Air Basin.
PVSP EIR Mitigation Measures 4.8-1a through 4.8-1e would be implemented to address the effect of the Proposed Project on air quality. These measures were adopted by Placer

3.3 Air Quality
Impact Sciences, Inc. 3.3-21 Placer Vineyards Specific Plan Draft EIS USACE # 199900737 April 2013
County at the time of PVSP approval and will be enforced by the County. PVSP EIR Mitigation Measures 4.8-1a through 4.8-1e would reduce fugitive dust and other sources of PM10 and PM2.5 emissions during construction. The County determined that, while the mitigation measure would reduce construction emissions, but the impact would not be reduced to a less than significant level (Placer County 2007).The USACE agrees with the conclusion in the PVSP EIR and also finds, based on the estimated mitigated emissions reported in Table 3.3-6, Estimated Mitigated Construction Emissions – Proposed Action Base Plan and Blueprint Scenarios, that after mitigation, emissions of PM10 and PM2.5 would be greatly reduced but emissions of ROG, NOx, and PM10 would remain above the significance thresholds. Consequently, construction emissions are predicted to have a residual significant effect on air quality after mitigation.
Alts. 1 through 5
Construction emissions are roughly proportional to the land area to be graded as well as the total building area. Although the total area developed would be smaller under Alternatives 1 through 5, the total number of residential units would remain the same under the Proposed Action Base Plan or Blueprint scenario. Consequently, construction emissions for the alternatives were assumed to be essentially identical to the emissions for the Proposed Action Base Plan or Blueprint. Construction emissions under all alternatives would therefore also exceed significance thresholds for ROG, NOx, and PM10.
PVSP EIR Mitigation Measures 4.8-1a through 4.8-1e would be implemented to address the effect of Alternatives 1 through 5 on air quality. The USACE assumes that Placer County would impose the same mitigation measure on Alternatives 1 through 5 to address this effect. The USACE finds that the mitigation measure described above would not fully mitigate the effect of the alternatives. Consequently, construction emissions are predicted to have a residual significant effect on air quality after mitigation.
PVSP EIR Mitigation Measure 4.8-1a through PVSP EIR Mitigation Measure 4.8-1e: Construction Activities Emissions Reduction Measures
(Applicability – No Action, Proposed Action, and All Alternatives)
PVSP EIR Mitigation Measures 4.8-1a through 4.8-1e require a construction emission/dust control plan, strategies to reduce NOx and ROG, use of low-VOC architectural coatings, and construction traffic management. The full mitigation measure text is available in Appendix 3.0.

3.3 Air Quality
Impact Sciences, Inc. 3.3-22 Placer Vineyards Specific Plan Draft EIS USACE # 199900737 April 2013
Table 3.3-6
Estimated Mitigated Construction Emissions – Proposed Action Base Plan and Blueprint Scenarios
Alternative Maximum Emissions in Any Year, in Pounds per Day
ROG NOX CO SOX PM10 PM2.5 Proposed Action – Base Plan Scenario 1,306 116 129 0.13 273 62
Proposed Action – Blueprint Scenario 2,052 141 176 0.20 412 92
Significance Threshold 82 82 550 -- 82 --
Source: Impact Sciences, Inc. Emissions calculations are provided in Appendix 3.3.
Impact AQ-2 Criteria Pollutant Emissions Associated with Occupancy/Operation
No Action Alt.
Operation of the No Action Alternative would generate emissions of ROG, NOx, CO, and PM10 in exceedance of thresholds and therefore the alternative is likely to result in a significant effect on air quality.
Operational emissions would be generated by mobile and area sources as a result of normal day-to-day activity within the mixed-use regional community that would be developed under the No Action Alternative. Mobile source emissions would be generated by motor vehicles traveling to and from the area. Area emissions would be generated by the use of natural gas in space and water heating devices, the operation of landscape maintenance equipment, the use of consumer products, and the application of architectural coatings.
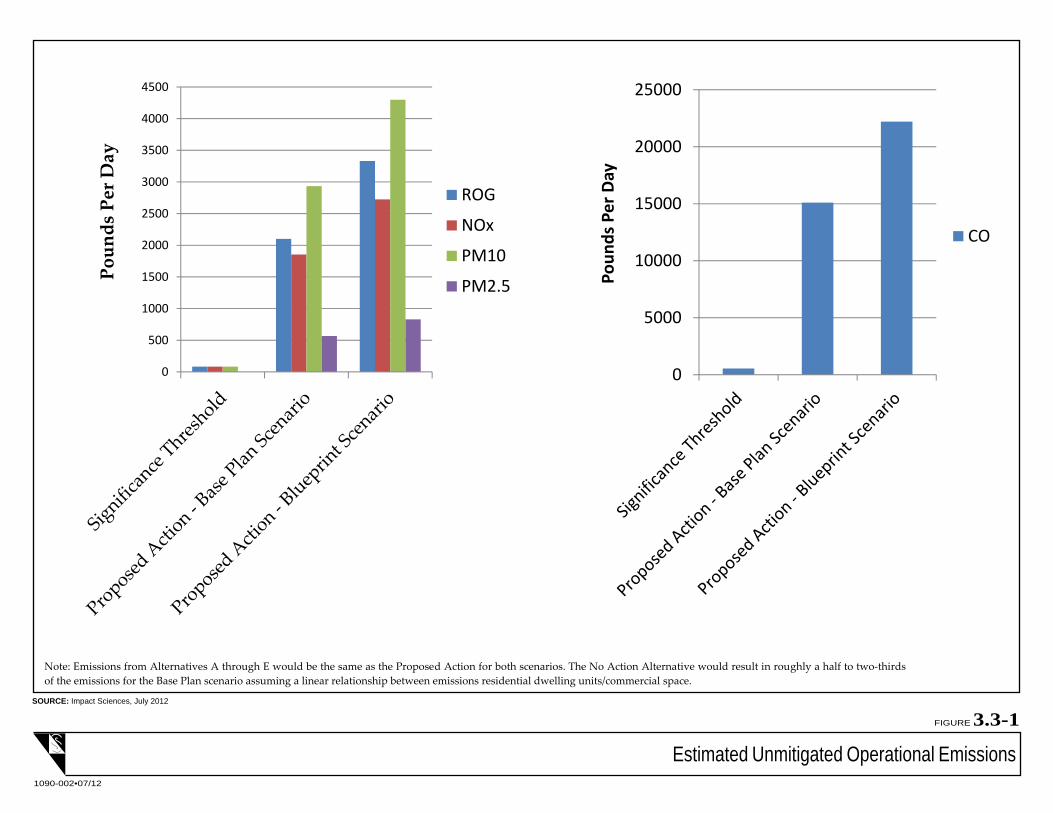
Operational emissions were not separately modeled for the No Action Alternative. URBEMIS2007 was used to quantify the Proposed Action’s mobile source and area source emissions. Table 3.3-7, Estimated Unmitigated Operational Emissions – Proposed Action Base Plan and Blueprint Scenarios, as well as Figure 3.3-1, Estimated Unmitigated Operational Emissions, shows the future operational emissions at full build out of the Proposed Action in 2030. Emissions of air pollutants other than SOx and PM2.5 would be substantial, and in all cases well above significance thresholds recommended by the Air District. As described above, the No Action Alternative would be smaller than the Proposed Action but operational emissions would likely exceed ROG, NOx, CO, and PM10 thresholds. Therefore, the No Action Alternative would likely result in a significant effect on air quality.
0
500
1000
1500
2000
2500
3000
3500
4000
4500
Poun
ds P
er D
ay
ROG
NOx
PM10
PM2.5
0
5000
10000
15000
20000
25000
Poun
ds P
er D
ay
CO
Note: Emissions from Alternatives A through E would be the same as the Proposed Action for both scenarios. The No Action Alternative would result in roughly a half to two-thirdsof the emissions for the Base Plan scenario assuming a linear relationship between emissions residential dwelling units/commercial space.
Estimated Unmitigated Operational Emissions
FIGURE 3.3-1
1090-002•07/12
SOURCE: Impact Sciences, July 2012
APPROXIMATE SCALE IN FEET
500 250 0 500
Legend:Project Boundary

3.3 Air Quality
Impact Sciences, Inc. 3.3-24 Placer Vineyards Specific Plan Draft EIS USACE # 199900737 April 2013
As stated in Section 3.5, Climate Change, PVSP EIR Mitigation Measures 4.13-1a through 4.13-1p would be implemented to reduce greenhouse gas emissions. In addition, PVSP EIR Mitigation Measures 4.8-3a through 4.8-3k will be implemented. The USACE assumes that Placer County would impose the same mitigation measure on the No Action Alternative to address this effect. PVSP EIR Mitigation Measures 4.8-3a through 4.8-3k would reduce operational emissions from the proposed development. The County determined that while the mitigation measures would reduce operational emissions, but the impact would not be reduced to a less than significant level (Placer County 2007). The USACE agrees with the conclusion in the PVSP EIR and also finds that implementation of PVSP EIR Mitigation Measures 4.13-1a through 4.13-1p and 4.8-3a through 4.8-3k would reduce emissions of criteria pollutants from project occupancy and operation but would be insufficient to reduce emission rates substantially. The No Action Alternative would therefore have a residual significant effect on air quality after mitigation.
Proposed Action (Base Plan and Blueprint Scenarios)
Operation of the Proposed Action would generate emissions of ROG, NOx, CO, and PM10 that would exceed significance thresholds and therefore are likely to result in a significant effect on air quality in the Air Basin.
URBEMIS2007 was used to quantify the Proposed Action’s mobile source and area source emissions. Table 3.3-7, Estimated Unmitigated Operational Emissions – Proposed Action Base Plan and Blueprint Scenarios, as well as Figure 3.3-1, Estimated Unmitigated Operational Emissions, shows the future operational emissions at full build out of the Proposed Action in 2030. The proposed site is currently designated agricultural land, and has minimal emission sources associated with some rural residential uses so baseline emissions were assumed to be negligible. Emissions shown are peak summer time values.
Emissions of air pollutants other than SOx and PM2.5 would be substantial, and in all cases well above significance thresholds recommended by the Air District. Emissions from operation of the Proposed Action would likely have a significant effect on air quality.
The Proposed Action would also implement PVSP EIR Mitigation Measures 4.13-1a through 4.13-1p to reduce vehicle traffic and energy use and PVSP EIR Mitigation Measures 4.8-3a through 4.8-3k to reduce operational emissions of criteria pollutants. PVSP EIR Mitigation Measures 4.8-3a through 4.8-3k were adopted by Placer County at the time of project approval and will be enforced by the County. The County determined that while the mitigation measures would reduce operational emissions, but the impact would not be reduced to a less than significant level (Placer County 2007). The USACE agrees with the conclusion in the PVSP EIR and also finds that implementation of PVSP EIR Mitigation Measures 4.13-1a through 4.13-1p and 4.8-3a through 4.8-3k would reduce emissions of criteria pollutants from project occupancy and operation but would be insufficient to reduce emission rates substantially. The Proposed Action would therefore have a residual significant effect on air quality after mitigation.

3.3 Air Quality
Impact Sciences, Inc. 3.3-25 Placer Vineyards Specific Plan Draft EIS USACE # 199900737 April 2013
Table 3.3-7
Estimated Unmitigated Operational Emissions – Proposed Action Base Plan and Blueprint Scenarios
Emissions Source Emissions in Pounds Per Day
ROG NOX CO SOX PM10 PM2.5 Proposed Action – Base Plan Scenario
Mobile Sources 1,356 1,686 14,862 17 2,933 565
Area Sources 745 167 239 0.01 0.7 0.7
Emissions Total 2,101 1,853 15,101 17 2,934 566
Proposed Action – Blueprint Scenario
Mobile Sources 1,999 2,468 21,875 25 4,297 828
Area Sources 1,332 267 330 0.01 1 1
Emissions Total 3,331 2,724 22,205 25 4,298 829
Significance Threshold 82 82 550 -- 82 --
Source: Impact Sciences 2012. Emissions calculations are provided in Appendix 3.3. Totals in table may not appear to add exactly due to rounding in the computer model calculations.
Alts. 1 through 5
As noted earlier, Alternatives 1 through 5 vary only slightly from the Proposed Action in the area to be developed but not in the amount of residential, public, commercial and other buildings that would be constructed. Any reductions in residential units or commercial acreage that may result from selection of any or all of the alternatives would be made up for on another parcel. Emissions from both area and mobile sources are proportional to the amount of development, specifically the number of residential units constructed and the total amount of commercial or other space built on the site. Consequently, emissions from the various alternatives would be almost identical to the emissions calculated for the Proposed Action. Emissions for all alternatives would substantially exceed the Air District significance thresholds and would likely have a significant effect on air quality in the area.
Alternatives 1 through 5 would also implement PVSP EIR Mitigation Measures 4.13-1a through 4.13-1p to reduce vehicle traffic and energy use and PVSP EIR Mitigation Measures 4.8-3a through 4.8-3k to reduce all operational emissions. The USACE assumes that Placer County would impose the same mitigation measures on Alternatives 1 through 5 to address this effect. The USACE finds that the mitigation measures described above would not fully mitigate the effect of the alternatives to a less than significant level. Consequently, operational emissions associated with Alternatives 1 through 5 individually or combined are predicted to have a residual significant effect on air quality after mitigation.

3.3 Air Quality
Impact Sciences, Inc. 3.3-26 Placer Vineyards Specific Plan Draft EIS USACE # 199900737 April 2013
PVSP EIR Mitigation Measure 4.8-3a through PVSP EIR Mitigation Measure 4.8-3k: Operational Emissions Reduction Measures
(Applicability – No Action, Proposed Action, and All Alternatives)
PVSP EIR Mitigation Measures 4.8-3a through 4.8-3k require a variety of design measures to reduce air pollution. The full mitigation measure text is available in Appendix 3.0.
Impact AQ-3 CO Hotspots
No Action Alt.
CO concentrations, from motor vehicle emissions, would be below both state and federal standards. Therefore, there would be a less than significant localized effect on air quality associated with the No Action Alternative.
Motor vehicles are a primary source of pollutants within the project vicinity. Traffic congested roadways and intersections have the potential to generate localized high levels of CO. Localized areas where ambient concentrations exceed state and/or federal standards are termed CO “hotspots.” Such hot spots are defined as locations where the ambient CO concentrations exceed the state or federal ambient air quality standards. Emissions of CO are produced in greatest quantities from vehicle combustion and are usually concentrated at or near ground level because CO does not readily disperse into the atmosphere. As a result, potential air quality impacts to sensitive receptors are assessed through an analysis of localized CO concentrations. Areas of vehicle congestion have the potential to create CO hotspots that exceed the state ambient air quality 1-hour standard of 20 ppm or the 8-hour standard of 9.0 ppm. The federal levels are less stringent than the state standards and are based on 1- and 8-hour standards of 35 and 9 ppm, respectively. Thus, an exceedance condition would occur based on the state standards prior to exceedance of the federal standard.
Operational emissions were not separately modeled for the No Action Alternative. The Proposed Action was evaluated utilizing the CALINE4 model developed by Caltrans to determine if it would cause or contribute to the formation of CO hotspots. The results of the CO hotspots analysis are presented in Table 3.3-8, Maximum 2025 Carbon Monoxide Concentrations – Cumulative Plus Proposed Action. CO concentrations are estimated to remain below both state and federal standards for all intersections for the Proposed Project. The No Action Alternative would construct a smaller project. Therefore, vehicle trips would be substantially less than those under the Proposed Action. Consequently, there would be a less than significant impact on air quality due to CO emissions associated with the No Action Alternative.

3.3 Air Quality
Impact Sciences, Inc. 3.3-27 Placer Vineyards Specific Plan Draft EIS USACE # 199900737 April 2013
Proposed Action (Base Plan and Blueprint Scenarios)
CO concentrations, which are a result of motor vehicle emissions, are estimated to remain below both state and federal standards for all intersections that would experience increases in traffic due to the Proposed Action. Consequently there would be a less than significant localized effect on air quality associated with the Proposed Action.
The Proposed Action was evaluated utilizing the CALINE4 model developed by Caltrans to determine if it would cause or contribute to the formation of CO hotspots. This analysis is based on the certified EIR performed for the PVSP previously, which assessed CO concentrations for the five intersections with the highest traffic volumes. Further details on the modeling process are available in that report. The results of the CO hotspots analysis are presented in Table 3.3-8, Maximum 2025 Carbon Monoxide Concentrations – Cumulative Plus Proposed Action.
Table 3.3-8
Maximum 2025 Carbon Monoxide Concentrations Cumulative Plus Proposed Action
Intersection 1-Hour 8-Hour 1. Fiddyment Road and Baseline Road 5.6 3.4
2. Walerga Road and PFE Road 5.1 3.1
3. Watt Avenue and Roseville Road 5.5 3.3
4. Watt Avenue and Elkhorn Blvd. 5.4 3.3
5. Watt Avenue and Baseline Road 5.3 3.2
Exceeds state 1-hour standard of 20 ppm? NO —
Exceeds federal 1-hour standard of 35 ppm? NO —
Exceeds state 8-hour standard of 9.0 ppm? — NO
Exceeds federal 8-hour standard of 9 ppm? — NO
CO concentrations are estimated to remain below both state and federal standards for all intersections. Consequently there would be a less than significant impact on air quality due to CO emissions associated with the Proposed Action.
Alts. 1 through 5
Traffic volumes for Alternatives 1 through 5 (individually or combined) are essentially the same as the traffic volumes predicted for the Proposed Action. Therefore, CO concentrations for the alternatives would be no greater than those estimated for the Proposed Action. The effect on air quality due to CO emissions would be less than significant for Alternatives 1 through 5 individually or combined.

3.3 Air Quality
Impact Sciences, Inc. 3.3-28 Placer Vineyards Specific Plan Draft EIS USACE # 199900737 April 2013
Impact AQ-4 Exposure to Toxic Air Contaminants
No Action Alt.
Existing sources of Toxic Air Contaminants (TACs) that could impact future residents of the project site are currently minimal. Furthermore, the No Action Alternative is a mixed-use residential community that will include only few sources of TACs, and any new sources would be subject to strict regulation. Therefore, the No Action Alternative would not expose sensitive populations to substantial TAC emissions and the effect would be less than significant.
Receptors are generally exposed to TACs through either (1) the construction of a source of TACs in proximity to a residence, workplace, school, or care facility or (2) the siting of such facilities within proximity to sources of TACs. Typical sources of TACs that might be associated with the No Action Alternative include freeways or other major roadways, certain commercial operations such as dry cleaners and auto repair, and construction and other heavy diesel equipment. The No Action Alternative has the potential to include new on-site sources of TACs in the commercial zones incorporated in the land use plan. These sources would generally be minor, for example dry cleaners, auto repair or parts shops, service stations, or paint booths. Regardless of size, any new source of TACs would be required to demonstrate that there would be no significant health risks associated with TAC emissions from the facility before commencing operation. This ensures that no on-site TAC sources would cause an adverse impact on receptors in the area, whether on- or off-site.
Receptors associated with the No Action Alternative would not be located near any existing significant sources of TACs. The existing land uses surrounding the site are primarily residential and rangeland, with no industrial sites or other significant sources of TACs. CARB has also provided planning guidance that recommends not locating sensitive receptors within 500 feet of a freeway or roadways with greater than 100,000 annual average daily traffic (AADT). No portion of the project site would be within 500 feet of a freeway or roadway with AADT of 100,000. Baseline Road has the highest AADT of the roads adjacent to the site, with an AADT well below 100,000. Therefore, the No Action Alternative is expected to result in a less than significant effect related to TACs. No mitigation is required.
Proposed Action (Base Plan and Blueprint Scenarios) and Alts. 1 through 5
Although the Proposed Action and Alternatives 1 through 5 would construct a larger project, the effect related to exposure to TACs would be substantially the same as discussed above for the No Action Alternative. The effect would be less than significant. No mitigation is required.

3.3 Air Quality
Impact Sciences, Inc. 3.3-29 Placer Vineyards Specific Plan Draft EIS USACE # 199900737 April 2013
Impact AQ-5 Exposure to Objectionable Odors
No Action Alt.
Odor impacts are generated when receptors are located downwind of or near sources of objectionable odors. Sources of these odors include facilities such as wastewater treatment plants, rendering plants, landfills, chemical plants, dairies, refineries, large agricultural operations, and composting.
Potential sources of odors include a lift station in the western portion of the No Action Alternative and possible expansion of the local wastewater treatment plants to treat wastewater generated by the No Action Alternative and other regional growth. If required, the lift station would be enclosed and is not considered a significant source of potential odors. Expansion of either the Dry Creek Wastewater Treatment Plant (DCWWTP) or the Sacramento Regional Wastewater Treatment Plant (SRWWTP) could potentially result in increased emissions of odors. However, the SRWWTP includes large buffer zones restricting any residential development nearby. The DCWWTP also includes buffer zones and is in a predominately non-residential area. Consequently, neither Wastewater Treatment Plant (WWTP) would be considered a significant source of odor impacts for the No Action Alternative. The effect associated with odors would be less than significant. No mitigation is required.
Proposed Action (Base Plan and Blueprint Scenarios) and Alts. 1 through 5
The effect related to exposure to odors would be substantially the same as discussed above for the No Action Alternative. The effect associated with odors would be less than significant. No mitigation is required.
Impact AQ-6 Indirect Effects on Air Quality from Off-Site Infrastructure Not Constructed as Part of the Project
No Action Alt., Proposed Action (Base Plan and Blueprint Scenarios), and Alts. 1 through 5
The construction activities associated with the off-site water pipeline infrastructure by the Placer County Water Agency (PCWA) which may be used by the No Action Alternative, Proposed Action, and Alternatives 1 through 5, would result in significant effects to air quality. There would be no operational air quality emissions.
Construction of the pipelines would generate exhaust emissions, primarily NOx, from equipment. In addition, there would be fugitive dust emissions due to excavation, grading, and exposed earth. The duration and extent of the construction is unknown. Therefore, average daily construction emissions cannot be estimated. Nonetheless, given the nonattainment status of the Air Basin with respect to ozone and particulate matter, the USACE conservatively assumes that the emissions would result in a significant

3.3 Air Quality
Impact Sciences, Inc. 3.3-30 Placer Vineyards Specific Plan Draft EIS USACE # 199900737 April 2013
impact. While standard construction-phase mitigation measures would reduce the emissions, the impact would not be fully mitigated and a residual impact would result.
3.3.6 GENERAL CONFORMITY
Under section 176(c)(1) of the federal Clean Air Act (CAA), federal agencies that ”engage in, support in any way or provide financial assistance for, license or permit, or approve any activity”(42 USC § 7506(c)) must demonstrate that such actions do not interfere with state and local plans to bring an area into attainment with the National Ambient Air Quality Standards.
The Proposed Action is located in the Sacramento Valley Air Basin (SVAB), an 11-county air basin. The western Placer County portion of the air basin is designated as nonattainment with respect to the national standards for 8-hour ozone and PM2.5. To address the air basin’s nonattainment status, the regional air districts, including the Placer County Air Pollution Control District (PCAPCD), have worked together to produce implementation plans for attainment of the national standards. The General Conformity Rule ensures a federal agency’s actions in a non-attainment area do not obstruct or conflict with a state or local implementation plan. The implementing regulations for the General Conformity Rule are found in Title 40 CFR, Part 51, Subpart W and Part 93, Subpart B. In addition, the PCAPCD has adopted the federal General Conformity regulations under Regulation 5, Rule 508.
Under the General Conformity regulations, both the direct and indirect emissions associated with a federal action must be evaluated. Subpart W defines direct emissions as:
[T]hose emissions of a criteria pollutant or its precursors that are caused or initiated by the Federal action and occur at the same time and place as the action (40 CFR § 51.852).
Indirect emissions are defined as:
[T]hose emissions of a criteria pollutant or its precursors that:
(1) Are caused by the Federal action, but may occur later in time and/or may be farther removed in distance from the action itself but are still reasonably foreseeable; and
(2) The Federal agency can practicably control and will maintain control over due to a continuing program responsibility of the Federal agency (40 CFR § 51.852).
A conformity determination is required for each criteria pollutant or precursor where the total of direct and indirect emissions of the criteria pollutant or precursor in a federal nonattainment or maintenance area would equal or exceed specified annual emission rates, referred to as de minimus thresholds, For ozone precursors, the de minimus thresholds depend on the severity of the nonattainment classification; for other pollutants, the threshold is set at 100 tons per year. The Air Basin was designated as “serious” nonattainment for ozone by the U.S. EPA in June 2004. However, due to concerns with meeting emissions reductions targets, the member air districts of the Sacramento Federal Nonattainment Area requested a voluntary reclassification to “severe,” which was approved by the U.S. EPA in June 2010. The relevant de minimus thresholds for the Air Basin are shown below in Table 3.3-9.

3.3 Air Quality
Impact Sciences, Inc. 3.3-31 Placer Vineyards Specific Plan Draft EIS USACE # 199900737 April 2013
Table 3.3-9
General Conformity De Minimus Thresholds
Pollutant Attainment Status Annual Emissions (ton/yr) NOX Nonattainment/Severe (Ozone) 25
VOC Nonattainment/Severe (Ozone) 25
PM2.5 (direct) Nonattainment 100
PM2.5 (NOX)1 Nonattainment 100
PM2.5 (VOC and NH3)2 Nonattainment 100
PM2.5 (SOX) Nonattainment 100 Notes: 1 NOX is included for PM2.5 unless determined not to be a significant precursor. However, the NOX threshold based on its contribution
to ozone is more stringent. 2 VOC and ammonia (NH3) are not included for PM2.5 unless determined to be a significant precursor. However, the VOC threshold
based on their contribution to ozone is more stringent. Only very minor emissions of ammonia would be emitted to the atmosphere as a result of the Proposed Action or its alternatives.
According to the General Conformity Rule, conformity analysis only applies to activities that trigger National Environmental Policy Act (NEPA) review.3 Where the federal action is a permit, license, or other approval for some aspect of a nonfederal undertaking, the relevant activity is the part, portion, or phase of the nonfederal undertaking that requires the federal permit, license, or approval. The USACE permit action is limited to filling of the waters of the U.S. on the project site and in the area of off-site improvements, and does not extend to other construction activities, nor will the USACE maintain control over those elements of the Proposed Action or alternatives that are associated with operation of facilities constructed under the Placer Vineyards Specific Plan. Accordingly, this evaluation will not consider the operational emissions from the development of the Specific Plan. Furthermore, with respect to construction emissions, the scope of the conformity analysis would be appropriately limited to the emissions associated with grading activities that would result in the filling of jurisdictional wetlands, any associated access roads and any staging areas necessary to conduct the filling activity. Other construction
3 As stated in 40 CFR Parts 6, 51, and 93 (FRL-4805-1), Determining Conformity of General Federal Actions to State
or Federal Implementation Plans, “the definition of “Federal action” is revised by adding the following sentence to the end of the definition in the proposal: Where the Federal action is a permit, license, or other approval for some aspect of a nonfederal undertaking, the relevant activity is the part, portion, or phase of the nonfederal undertaking that requires the Federal permit, license, or approval. The following examples illustrate the meaning of the revised definition. Assume, for example, that the COE issues a permit and that permitted fill activity represents one phase of a larger nonfederal undertaking; i.e., the construction of an office building by a nonfederal entity. Under the conformity rule, the COE would be responsible for addressing all emissions from that one phase of the overall office development undertaking that the COE permits; i.e., the fill activity at the wetland site. However, the COE is not responsible for evaluating all emissions from later phases of the overall office development (the construction, operation, and use of the office building itself), because later phases generally are not within the COE's continuing program responsibility and generally cannot be practicably controlled by the COE.”

3.3 Air Quality
Impact Sciences, Inc. 3.3-32 Placer Vineyards Specific Plan Draft EIS USACE # 199900737 April 2013
activities not associated with the filling of jurisdictional waters would not be included in the conformity calculations.
While grading would take place over a large area of the project site, only a small portion of the grading would involve the filling of jurisdictional waters, and only this small portion of the grading is required to be analyzed. However, since information was readily available for the effect of grading the site as a whole, the USACE analyzed this data. If this data had provided emissions greater than the threshold then further efforts to focus the analysis on the grading specific to the discharge of dredge or fill into waters of the US would have been warranted. In this case, the effects of the entire grading operations do not exceed the de minimis thresholds. Therefore the entire grading operations were analyzed even though the grading operations that are required to be analyzed are a small portion of the overall operation. Annual grading emissions for the Proposed Action were estimated by multiplying the modeled daily emissions by 260 days (assuming 52 weeks per year of construction, with five days per week of activity) and dividing the total by 2,000 to convert from pounds to tons. Emissions totals for the alternatives are essentially the same as those for the Proposed Action, so if the Proposed Action is determined to meet the conformity criteria then the alternatives would as well. The resultant average annual emissions for each nonattainment or maintenance pollutant are shown in Table 3.3-10. As the table shows, all emission values are less than the de minimus threshold for that pollutant. Based on this preliminary analysis, a detailed conformity analysis by the USACE is not required (40 CFR § 51.858). In addition, the direct emissions associated with the Proposed Action would not conflict with or obstruct implementation of the applicable air quality plan (i.e., SIP for the Sacramento Valley Air Basin).
Table 3.3-10
Direct Average Annual Grading Emissions
Source VOC
(tons/yr) NOX
(tons/yr) SOX
(tons/yr) PM2.5
(tons/yr) Proposed Action 1.04 8.4 0.00 14.3
Thresholds (tons/yr) 25 25 100 100
Exceeds Threshold? NO NO NO NO
Source: Impact Sciences, Inc. Emissions calculations are provided in Appendix 3.3.

3.3 Air Quality
Impact Sciences, Inc. 3.3-33 Placer Vineyards Specific Plan Draft EIS USACE # 199900737 April 2013
3.3.7 RESIDUAL SIGNIFICANT IMPACTS
The No Action Alternative, Proposed Action, and Alternatives 1 through 5 (individually or combined) would have significant residual impacts due to ROG, NOx, CO, and PM10 as emissions of these pollutants during operation and emissions of ROG, NOx, and PM10 during construction cannot be mitigated below the significance thresholds adopted by the Air District. Construction emissions would be limited to the years during which construction would occur. Operational emissions would likely continue to be significant over the life of the development.
3.3.8 REFERENCES California Air Resources Board. 2004. “Roseville Rail Yard Study,” 5.
County of Placer. 2006. “Revised Draft Environmental Impact Report for Placer Vineyards Specific Plan.” Quad Knopf.
Sacramento Metropolitan Air Quality Management District (SMAQMD). 2009. Guide to Air Quality Assessment in Sacramento County. 1–7, 1–8.
South Coast Air Quality Management District (SMAQMD). 2008. “MATES III: Multiple Air Toxics Exposure Study,” http://www.aqmd.gov/prdas/matesIII/matesIII.html.
U.S. Environmental Protection Agency (U.S. EPA). n.d.a. “The ASPEN Model,” http://www.epa.gov/ttn/atw/nata/aspen.html.
U.S. Environmental Protection Agency (USEPA). n.d.b. “National Air Toxics Assessments,” http://www.epa.gov/nata/.
U.S. Environmental Protection Agency. n.d.c. “Ground-level Ozone,” http://www.epa.gov/air/ozonepollution/.
U.S. Environmental Protection Agency. 40 CFR Parts 6, 51, and 93 (FRL-4805-1) Determining Conformity of General Federal Actions to State or Federal Implementation Plans. Tuesday, November 30, 1993