Embed Size (px)
Citation preview
1
Draft Police Department Community SurveyFinal Report
Prepared By
March 2021
2
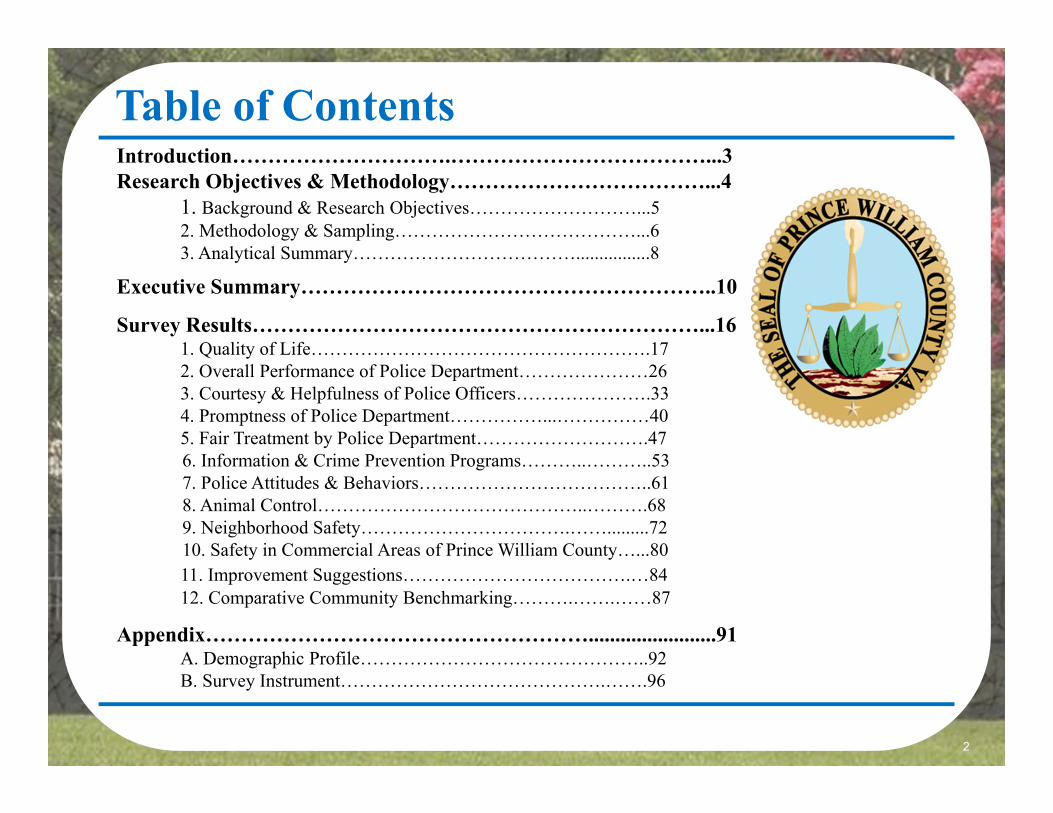
Introduction………………………….………………………………...3Research Objectives & Methodology………………………………...4
1. Background & Research Objectives………………………...52. Methodology & Sampling…………………………………...63. Analytical Summary………………………………................8
Executive Summary…………………………………………………..10
Survey Results………………………………………………………...161. Quality of Life……………………………………………….172. Overall Performance of Police Department…………………263. Courtesy & Helpfulness of Police Officers………………….334. Promptness of Police Department……………...……………405. Fair Treatment by Police Department……………………….476. Information & Crime Prevention Programs………..………..537. Police Attitudes & Behaviors………………………………..618. Animal Control……………………………………..……….689. Neighborhood Safety…………………………….…….........7210. Safety in Commercial Areas of Prince William County…...8011. Improvement Suggestions……………………………….…8412. Comparative Community Benchmarking……….…….……87
Appendix………………………………………………........................91A. Demographic Profile………………………………………..92B. Survey Instrument…………………………………….…….96
Table of Contents
3
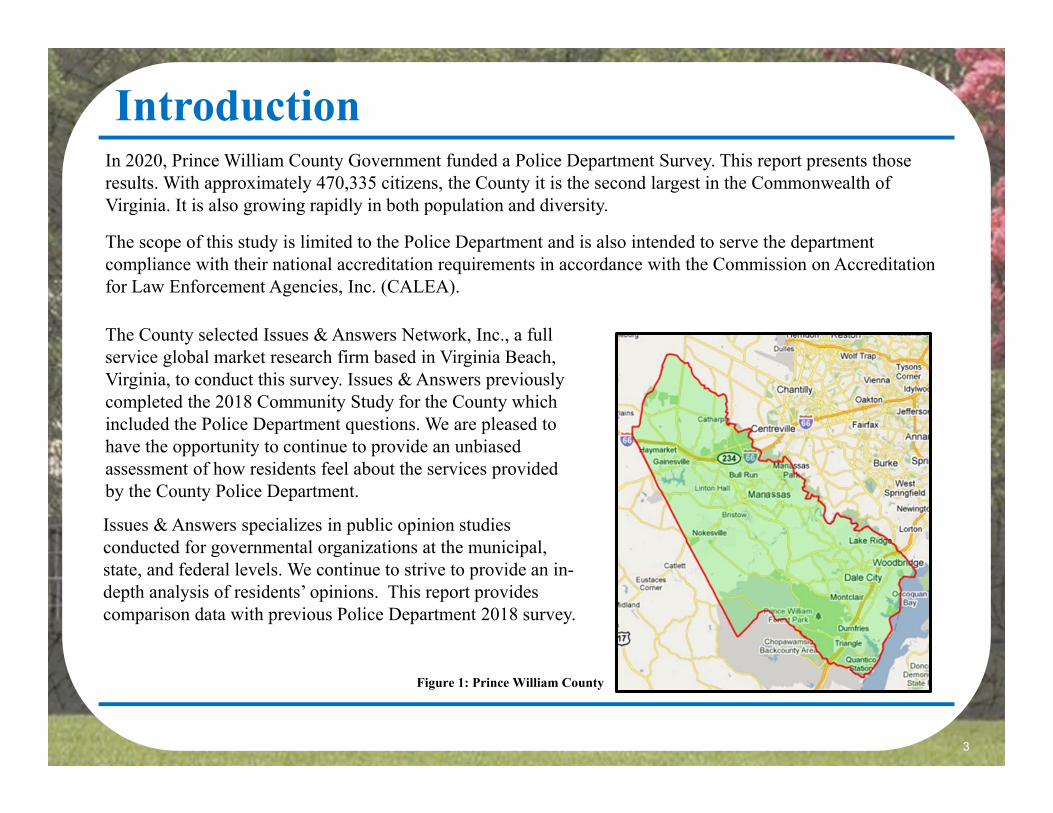
In 2020, Prince William County Government funded a Police Department Survey. This report presents those results. With approximately 470,335 citizens, the County it is the second largest in the Commonwealth of Virginia. It is also growing rapidly in both population and diversity.
The scope of this study is limited to the Police Department and is also intended to serve the department compliance with their national accreditation requirements in accordance with the Commission on Accreditation for Law Enforcement Agencies, Inc. (CALEA).
Introduction
Figure 1: Prince William County
Issues & Answers specializes in public opinion studies conducted for governmental organizations at the municipal, state, and federal levels. We continue to strive to provide an in-depth analysis of residents’ opinions. This report provides comparison data with previous Police Department 2018 survey.
The County selected Issues & Answers Network, Inc., a full service global market research firm based in Virginia Beach, Virginia, to conduct this survey. Issues & Answers previously completed the 2018 Community Study for the County which included the Police Department questions. We are pleased to have the opportunity to continue to provide an unbiased assessment of how residents feel about the services provided by the County Police Department.

4
Research Objectives & Methodology

5
• Prince William County conducts surveys with constituents not only to keep in touch with changes in their residents’ satisfaction with the quality of life but also to maintain focus on its strategic vision of being the “community of choice”. Community surveys have been fielded since the early 1990’s, initially on an annual basis and then in alternate years.
• The scope of this survey is the County’s Police Department. The research is to assess how residents feel about provided services and to meet the following objectives:
— Understand resident perceptions of the overall quality of life in Prince William County;— Quantify the satisfaction levels with the County’s Police Department; — Gauge citizens’ perceptions of and attitudes toward various aspects of the Police Department’s
services; and,— Identify areas of improvement as well as subgroups which may be underserved.
• This survey specifically measures:— Seven perceptions of police services;— Two measures of how safe residents feel in their neighborhood and in commercial areas of the
County; and,— The resident’s overall satisfaction with the quality of life in the area.
• The 2020 Police Department survey questionnaire is more compact than the Community Surveys. For consistency the same 10-point measurement scale that has been in use since 2014 is employed here. The 2020 Police Department survey instrument is included in the Appendix B of this report in its entirety.
Background & Research Objectives

6
Methodology:The 2020 Police Department survey was:• Conducted with 826 county residents; December 14, 2020 - January 2, 2021. • Designed as a telephone survey administered by a cadre of highly trained, professional interviewers, who
made calls to each of the randomly selected households on weeknights and weekends at various times of the day and evening hours.
• Surveys averaged 11 minutes in length and conducted in English (n=785) or Spanish (n=41).• Conducted using Computer-Assisted Telephone Interviewing software that kept track of each attempt made.
Sampling:• To obtain a representative sample of the population the sampling was structured to address all geographic
areas in the County, major age groups, and gender. Quotas were set (and tracked daily) to ensure representation to population proportions.
• To ensure that all residents had the ability to be included in the survey, a sample frame of landline and geo-targeted cell phone numbers as well as a targeted cell phone sample of Hispanic residents across the Countywas used.
• The smart cell phone sample was dialed more heavily to ensure the inclusion of younger residents which are the most difficult demographic to reach.
• U.S. postal codes in the sampling frame included overlap County boundaries, with screening questions in the survey confirming residence in the County.
• All sample lists were screened to eliminate businesses and non-working numbers.• In line with market research best practices, employees of the County were excluded from the survey.
Methodology & Sampling

7
Geographic Definitions: In this report, data are shown separately for different regions of the county. The definition of these regions is defined here. Region / Zip Code
Sample Type
Battlefield Belmont/Potomac
Broad Run Dale City Forest
Park Hoadly Old Bridge
Total201692014320137201552011920181
22191201362011020109
22193
22134221722202522026
2011120112
2219222125
Landline 50 26 28 31 15 32 27 209
Cell Phone 86 97 99 104 86 58 83 613
Total 136 123 127 135 101 90 110
Methodology & Sampling – cont’d.
Figure 2: Prince William County Regions
Please note that residents of the embedded independent cities of Manassas City and Manassas Park City were excluded from the survey. A full demographic profile of respondents can be found in Appendix A.
Due to weighting and rounding percentages may not add to 100%.
8
Analytical Summary:• In order to provide deeper context for the survey results and to track potential changes, this report includes
historical analyses, with comparative data from the 2018 Community Study. When comparing the overall current results to the previous survey year, statistically significant drops or lifts of are marked with arrows , where green symbols indicate observably higher scores and red – notably lower scores.
• Respondents were segmented into various sub-groups based on key demographics and the communities within the County in which they live, as defined by zip code blocks. This information was used to aid in analysis and present detailed findings, as appropriate. Whenever applicable, statistically appreciable differences among respondent segments were noted (in those instances, the results are marked with the following symbol: ).
• On many questions in the survey, respondents may have answered “not sure” or refused to respond. In some cases, this is because they do not have adequate information or personal experience of certain service aspects. “Not sure”/Refused responses were not included in the analysis of the distribution of responses.
• Data shown in the report are weighted by age, region and ethnicity to the 2018 Census estimates for the County. This weighting approach helps correct for sampling variation and to ensure projectability to the entire Prince William County population.
• The sample size for this study resulted in a very favorable sampling error of +/-3.4%, allowing for a reliable representation of the County. The findings discussed in the report are statistically significant at the 95% level of confidence.
• Due to weighting and rounding, percentages may not add to 100%.
Analytical Summary

9
Other Project Specifications/Details
• In response to the rapidly growing diversity across the County two questions were added to the Police Department survey. These two questions were not included in the 2018 Community Study and no comparison is provided. These two questions appear in the statistical demographic sections at the end of the survey instrument with the results displayed at the end of this report in the: Appendix A Demographic Profile.
— Sexual orientation— Disability status
Analytical Summary – cont’d.

10
Executive Summary
11
• Prince William County residents were very positive about the quality of life in the community and ratedeach of the metrics designed to gauge their satisfaction with the performance of the Police Department high.Results for the Police Survey showed markedly higher satisfaction than in the 2018 Community survey.– Currently, the overall satisfaction rates (i.e., rates combining those satisfied (5-7) and very satisfied (8-10) on a 10-point
scale) for the quality of life in the County (98%) and for the Police services (93%) were positive results.
• Importantly, lifts in average satisfaction levels occurred not only due to drops in the proportion ofdissatisfied residents, but also shifts away from the ratings of “satisfied” towards those of “very satisfied,”pointing to intensified positive perceptions. This indicated that Prince William County excels at the difficultart of maintaining and enhancing citizen satisfaction.– A total of 10 attributes included in both surveys were tested and compared against each other. All 10 attributes received a
higher average (mean) score in 2020 Police Study than the 2018 Community Study.
• An overview of resident satisfaction scores at a glance is included on the following page.
Executive Summary

12
Executive Summary – cont’d.
METRIC
2018 2020Change from
2018Very satisfied (8-10)
Average Rating (0-10)
Very satisfied (8-10)
Average Rating (0-10)
Quality of life in Prince William County 55% 7.5 68% 8.0 13%
Police Dept.’s overall performance meets community needs 67% 7.9 78% 8.4 11%
Officers are courteous and helpful to all community members 66% 7.9 79% 8.5 13%
Requests for Police Assistance receive prompt response 73% 8.2 81% 8.6 8%
Police Dept. treats everyone fairly regardless of race, gender, ethnic or national origin 61% 7.5 74% 8.3 13%
Police Dept. provides adequate information and crime prevention programs 58% 7.5 71% 8.2 13%
Police display positive attitudes and behaviors towards residents 67% 7.9 81% 8.6 14%
Animal Control effectively protects residents and animals 62% 7.6 74% 8.3 12%
You feel safe in your neighborhood 81% 8.5 84% 8.8 3%
You feel safe visiting commercial areas in the County 70% 8.1 79% 8.6 9%

13
• An overview of the survey results by demographic factors shows several prominent trends in the County: – Generally, satisfaction with the quality of life in the County and with the services of the local Police Department is directly
proportional to residents’ age. Residents aged 55+ were most likely to say they were very satisfied on the 10 attributes compared. The average satisfaction scores noted in the youngest resident segment (under the age of 34) fall below the overall County-wide scores, across all tested metrics.
– Coinciding with the age pattern, the length of residency is another differentiating factor, with the most-tenured residents (26+ years in the community) most likely to express satisfaction with the Police Department attributes tested.
– Just as in the 2018 Survey, Caucasian residents drove the positive perceptions of all Police service aspects, and of the overall quality of life. In nearly all cases, the average satisfaction scores noted for African American, Hispanic, or mixed ethnicity residents, fell below the overall average scores for the County. Moreover, with the exception of neighborhood safety, the average ratings of tested metrics African American residents expressed the lowest averages.
– Patterns based on educational attainment are not as clear as ethnicity, age and length of residency patterns, but it does appear that residents with some college education are more critical of the Police Department than their counterparts, with many of their average ratings falling below the County-wide scores.
Executive Summary – cont’d.
14
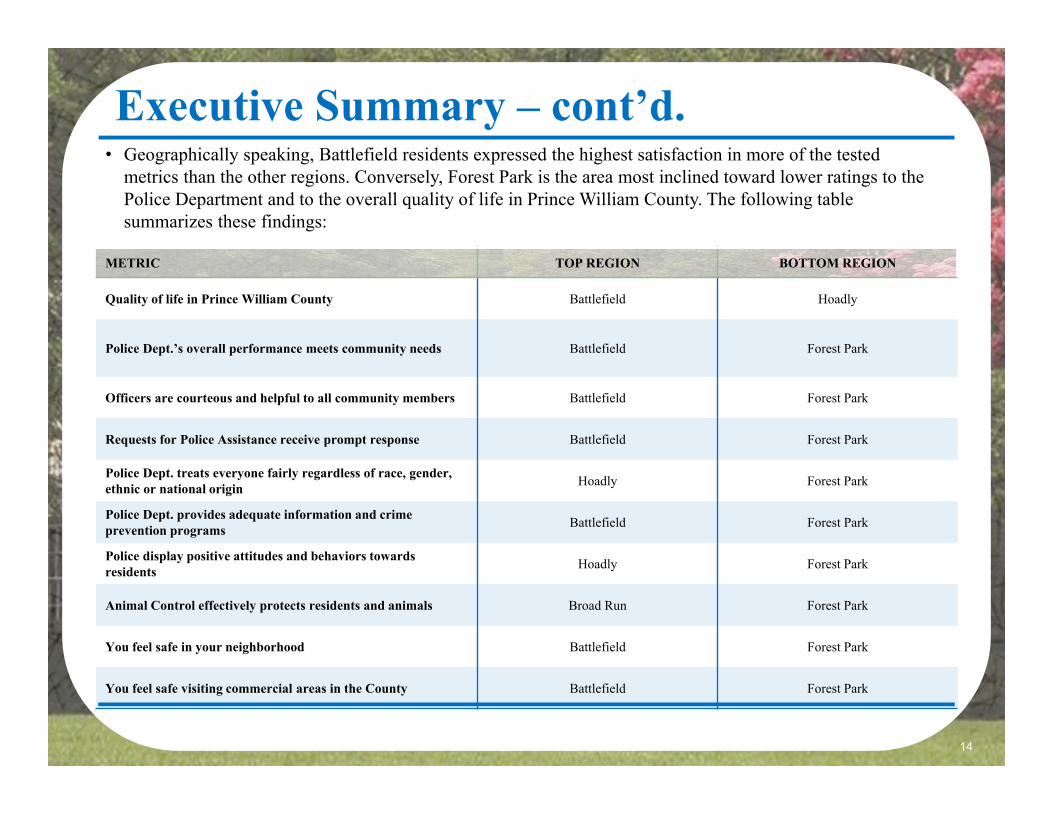
• Geographically speaking, Battlefield residents expressed the highest satisfaction in more of the tested metrics than the other regions. Conversely, Forest Park is the area most inclined toward lower ratings to the Police Department and to the overall quality of life in Prince William County. The following table summarizes these findings:
Executive Summary – cont’d.
METRIC TOP REGION BOTTOM REGION
Quality of life in Prince William County Battlefield Hoadly
Police Dept.’s overall performance meets community needs Battlefield Forest Park
Officers are courteous and helpful to all community members Battlefield Forest Park
Requests for Police Assistance receive prompt response Battlefield Forest Park
Police Dept. treats everyone fairly regardless of race, gender, ethnic or national origin Hoadly Forest Park
Police Dept. provides adequate information and crime prevention programs Battlefield Forest Park
Police display positive attitudes and behaviors towards residents Hoadly Forest Park
Animal Control effectively protects residents and animals Broad Run Forest Park
You feel safe in your neighborhood Battlefield Forest Park
You feel safe visiting commercial areas in the County Battlefield Forest Park
15
• Considering the survey results, there is not much room for improvement in terms of overall satisfaction, but the County could focus on maintaining the high scores, and on further conversion of the “satisfied” resident ratings into the “very satisfied” ones – something that is already a successful work in progress.
• With the healthy survey results in mind, there are also opportunities in targeting differences by demographic characteristics (such as the younger and newly relocated residents or ethnic minorities) and geographic areas (such as Forest Park) where ratings fall below the average on many researched aspects.
• Finally, consideration could be given to tackling some of the problems cited by residents as suggestions for improvement. While many insisted the County is already doing a good job, issues such as overcrowding and traffic have been repeated across other survey results and are currently voiced after concerns with policing.
Executive Summary – cont’d.

16
Survey Results
17
1. Quality of Life
18
Q1. [Base: Total respondents excluding “Not sure”/Refused responses] Overall, how satisfied would you say you are with the quality of life in Prince William County? Please use a scale from 0 to 10, where 0 means you are completely dissatisfied and 10 means you are completely satisfied. You can use any number between 0 and 10 to express how you feel.
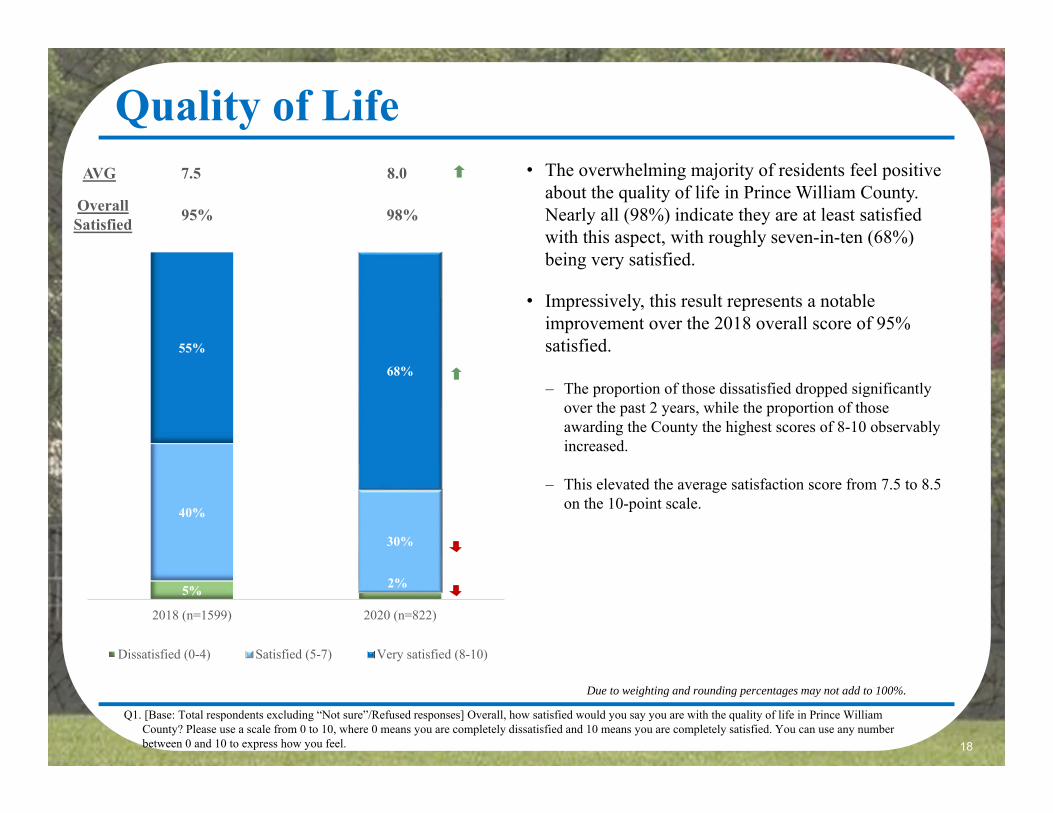
Quality of Life• The overwhelming majority of residents feel positive
about the quality of life in Prince William County. Nearly all (98%) indicate they are at least satisfied with this aspect, with roughly seven-in-ten (68%) being very satisfied.
• Impressively, this result represents a notable improvement over the 2018 overall score of 95% satisfied.
– The proportion of those dissatisfied dropped significantly over the past 2 years, while the proportion of those awarding the County the highest scores of 8-10 observably increased.
– This elevated the average satisfaction score from 7.5 to 8.5 on the 10-point scale.
5% 2%
40%
30%
55%
68%
2018 (n=1599) 2020 (n=822)
Dissatisfied (0-4) Satisfied (5-7) Very satisfied (8-10)
AVG 7.5 8.0
Overall Satisfied 95% 98%
Due to weighting and rounding percentages may not add to 100%.

19
AVG
7.5
8.4
7.4
8.3
7.6
7.8
7.4
8.0
7.5
7.9
7.1
7.8
7.8
7.8
59%
78%
51%
74%
57%
69%
50%
69%
58%
65%
50%
60%
61%
58%
Battlefield 2018 (n=266)
Battlefield 2020 (n=137)
Broad Run 2018 (n=247)
Broad Run 2020 (n=127)
Belmont/Potomac 2018(n=238)
Belmont/Potomac 2020(n=123)
Old Bridge 2018 (n=214)
Old Bridge 2020 (n=110)
Dale 2018 (n=261)
Dale 2020 (n=133)
Forest Park 2018 (n=194)
Forest Park 2020 (n=100)
Hoadly 2018 (n=174)
Hoadly 2020 (n=88
Quality of Life: Very Satisfied (8-10) by Region
EFG
A
B
C
D
E
F
G
Quality of Life – by Region
Q1. [Base: Total respondents excluding “Not sure”/Refused responses] Overall, how satisfied would you say you are with the quality of life in Prince WilliamCounty? Please use a scale from 0 to 10, where 0 means you are completely dissatisfied and 10 means you are completely satisfied. You can use any numberbetween 0 and 10 to express how you feel.
2020 Quality of Life
Bat
tlefie
ld
Bro
adR
un
Bel
mon
t/Po
tom
ac
Old
Bri
dge
Dal
e
Fore
st
Park
Hoa
dly
Very satisfied (8-10) 78% 74% 69% 69% 65% 60% 58%
Satisfied (5-7) 21% 25% 27% 31% 33% 36% 39%
Dissatisfied (0-4) 1% 1% 4% 1% 2% 4% 3%
= significant difference among regions
CDEFG
• The overall lift in residents’ satisfaction with the quality of life in the County is attributable to increases across all regions, with the exception of Hoadly.
– The most substantial increases are noted for Broad Run (+23 points), Battlefield and Old Bridge (+19 points each).
• This year, Battlefield leads the way, with more than three-quarters (78%) satisfied, which is significantly more than in any other area of the County.
– An average resident of Battlefield rates their satisfaction with the quality of life in the County as 8.4 on the 10-point scale.
FG CEFG
Due to weighting and rounding percentages may not add to 100%.
20
AVG
7.9
8.0
8.1
Quality of Life – by Age
Q1. [Base: Total respondents excluding “Not sure”/Refused responses] Overall, how satisfied would you say you are with the quality of life in Prince WilliamCounty? Please use a scale from 0 to 10, where 0 means you are completely dissatisfied and 10 means you are completely satisfied. You can use any numberbetween 0 and 10 to express how you feel.
65%
68%
73%
33%
30%
24%
2%
2%
3%
Age 18-34(n=261)
Age 35-54(n=345)
Age 55+(n=210)
Very satisfied (8-10) Satisfied (5-7) Dissatisfied (0-4)
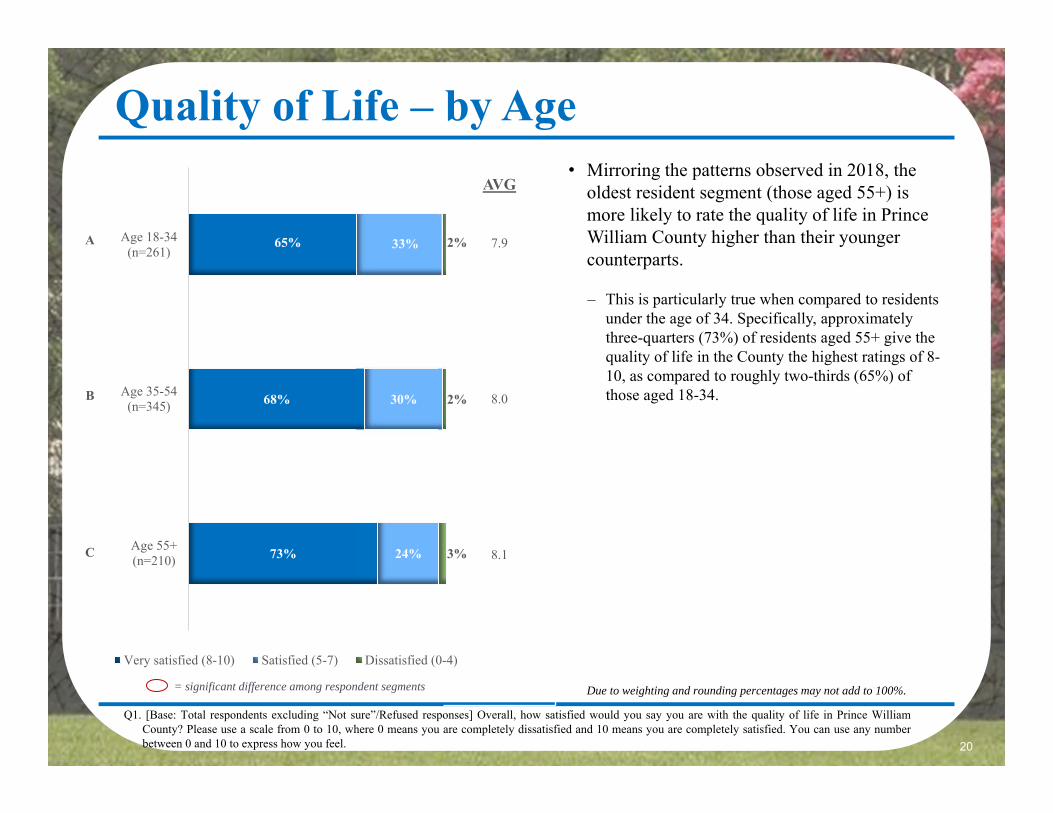
• Mirroring the patterns observed in 2018, the oldest resident segment (those aged 55+) is more likely to rate the quality of life in Prince William County higher than their younger counterparts.
– This is particularly true when compared to residents under the age of 34. Specifically, approximately three-quarters (73%) of residents aged 55+ give the quality of life in the County the highest ratings of 8-10, as compared to roughly two-thirds (65%) of those aged 18-34.
= significant difference among respondent segments
A
B
C
Due to weighting and rounding percentages may not add to 100%.

21
AVG
7.9
8.1
8.1
7.9
Quality of Life – by Length of Residency
Q1. [Base: Total respondents excluding “Not sure”/Refused responses] Overall, how satisfied would you say you are with the quality of life in Prince WilliamCounty? Please use a scale from 0 to 10, where 0 means you are completely dissatisfied and 10 means you are completely satisfied. You can use any numberbetween 0 and 10 to express how you feel.
66%
68%
70%
69%
32%
31%
29%
26%
3%
0%
2%
5%
0-5 years(n=178)
6-15 years(n=251)
16-25 years(n=238)
26+ years(n=156)
Very satisfied (8-10) Satisfied (5-7) Dissatisfied (0-4)
• Again, just as in 2018, residents in the County with the longest tenures (26+ years) are significantly more likely than those with shorter tenures to express dissatisfaction with the overall quality of life in the area.
– This being said, only 5% of these long-term residents give the County a rating of 4 or less on the 1-to-10 scale on this metric.
= significant difference among respondent segments
A
B
C
D BC
Due to weighting and rounding percentages may not add to 100%.

22
AVG
8.0
7.9
8.2
8.0
Quality of Life – by Education
Q1. [Base: Total respondents excluding “Not sure”/Refused responses] Overall, how satisfied would you say you are with the quality of life in Prince WilliamCounty? Please use a scale from 0 to 10, where 0 means you are completely dissatisfied and 10 means you are completely satisfied. You can use any numberbetween 0 and 10 to express how you feel.
68%
65%
72%
66%
28%
32%
27%
33%
5%
3%
0%
1%
High school orless (n=157)
Some college(n=191)
4-year collegegrad (n=254)
Grad degree(n=208)
Very satisfied (8-10) Satisfied (5-7) Dissatisfied (0-4)
• Residents’ satisfaction with the quality of life in Prince William County is inversely proportional to their educational attainment. While this metric receives high scores across all education segments, citizens who have a high school diploma or less are most likely to express dissatisfaction (5%), followed by those with some college (3%).
• On average, satisfaction with the quality of life peaks among respondents with a 4-year college degree (8.2 on the 10-point scale).
= significant difference among respondent segments
A
B
C
D
C
CD
B
<
Due to weighting and rounding percentages may not add to 100%.

23
AVG
8.2
8.0
8.1
7.7
7.9
Quality of Life – by Ethnicity
73%
69%
69%
68%
65%
27%
29%
30%
25%
33%
3%
2%
7%
2%
Asian (n=61)
Caucasian(n=431)
Hispanic(n=158)
Mixed (n=44)
AfricanAmerican(n=162)
Very satisfied (8-10) Satisfied (5-7) Dissatisfied (0-4)
• Asian residents are more likely to rate their overall Quality of Life very satisfied (73%).
• A total of 69% of Caucasian and Hispanic residents say they are very satisfied their Quality of life; closely followed by Mixed Ethnicity residents (68%).
– With that being said, the Ethnically Mixed residents are more likely to voice dissatisfaction with their overall quality of life at 7%.
Q2A. [Base: Total respondents excluding “Not sure”/Refused responses] How satisfied are you with the Prince William County’s Police Department’s overallperformance meets community needs? Please use a 0 to 10 scale, where 0 means completely dissatisfied and 10 means completely satisfied.
= significant difference among respondent segments
A
B
C
D
E
Due to weighting and rounding percentages may not add to 100%.

24
AVG
8.1
8.0
Quality of Life – by Presence of Children in Household
Q1. [Base: Total respondents excluding “Not sure”/Refused responses] Overall, how satisfied would you say you are with the quality of life in Prince WilliamCounty? Please use a scale from 0 to 10, where 0 means you are completely dissatisfied and 10 means you are completely satisfied. You can use any numberbetween 0 and 10 to express how you feel.
68%
68%
30%
29%
1%
3%
Childrenunder 18 in
the household(n=343)
No childrenunder 18 in
the household(n=479)
Very satisfied (8-10) Satisfied (5-7) Dissatisfied (0-4)
• Residents with no children under the age of 18 in the household are more likely than their counterparts to report dissatisfaction with the quality of life in Prince William County.
– A total of 3% of those with no children rate this metric between 0 and 4 on the 10-point scale, as compared to only 1% of those who do have kids at home.
= significant difference among respondent segments
A
B
Due to weighting and rounding percentages may not add to 100%.

25
• Only 7% of Prince William County residents (n=58) rate their overall satisfaction with quality of life in the area as 5 or less on the 10-point scale. These respondents cite a range of reasons for the relatively low ratings, but each issue is mentioned by only a handful of individuals.
• The table below summarizes residents’ reasons for dissatisfaction with the quality of life in the County.
Quality of Life – cont’d.
2020Reasons Why Rated Satisfaction with
Quality of Life in Prince William County as 5 on the 0-to-10 Scale*% N
Police issues 11% 6
Overpopulated/congested 9% 5
Crime 9% 5
Traffic 8% 5
Racial issues 6% 4
Programs for disabled 5% 3
Q1. [Base: Respondents who rated satisfaction with quality of life as 5 or less on 10-point scale] For what reasons do you feel that way?*Note: Responses with fewer than 5% of mentions are not shown
26
2. Overall Performance of Police Department
27
Q2A. [Base: Total respondents excluding “Not sure”/Refused responses] How satisfied are you with the Prince William County’s Police Department’s overallperformance meets community needs? Please use a 0 to 10 scale, where 0 means completely dissatisfied and 10 means completely satisfied.
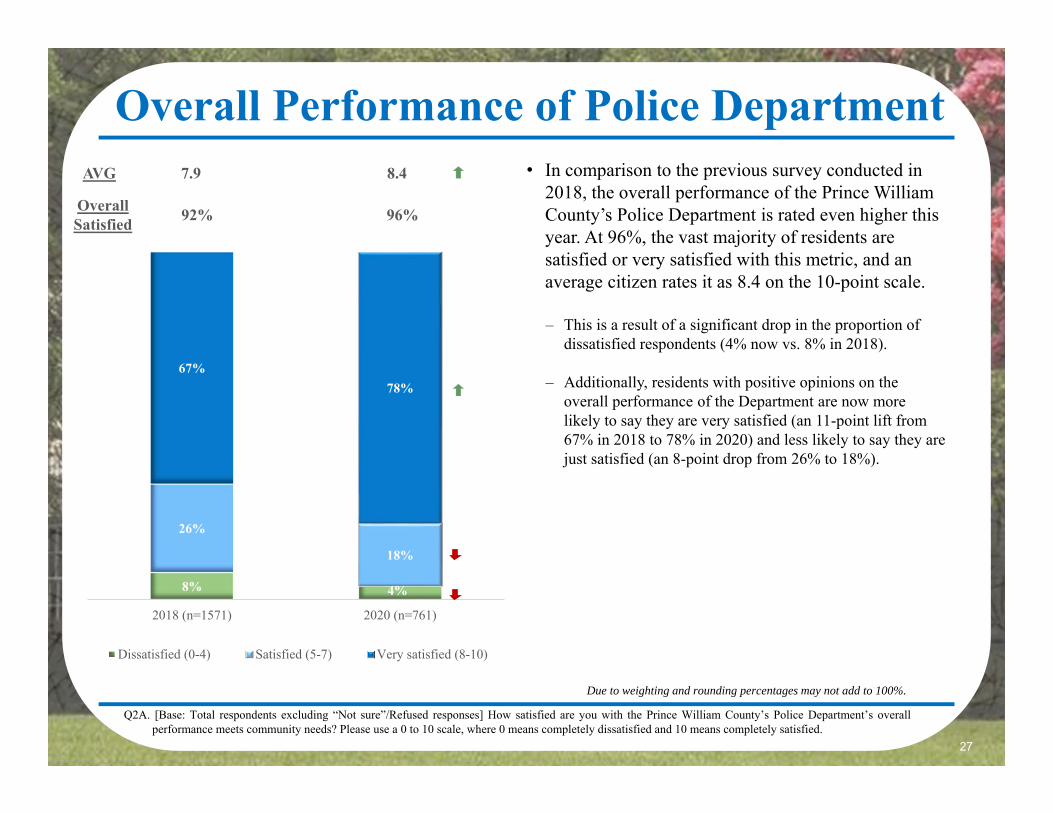
Overall Performance of Police Department• In comparison to the previous survey conducted in
2018, the overall performance of the Prince William County’s Police Department is rated even higher this year. At 96%, the vast majority of residents are satisfied or very satisfied with this metric, and an average citizen rates it as 8.4 on the 10-point scale.
– This is a result of a significant drop in the proportion of dissatisfied respondents (4% now vs. 8% in 2018).
– Additionally, residents with positive opinions on the overall performance of the Department are now more likely to say they are very satisfied (an 11-point lift from 67% in 2018 to 78% in 2020) and less likely to say they are just satisfied (an 8-point drop from 26% to 18%).
8% 4%
26%
18%
67%78%
2018 (n=1571) 2020 (n=761)
Dissatisfied (0-4) Satisfied (5-7) Very satisfied (8-10)
AVG 7.9 8.4
Overall Satisfied 92% 96%
Due to weighting and rounding percentages may not add to 100%.
28
AVG
7.7
8.7
8.1
8.5
7.7
8.3
7.6
8.5
8.1
8.3
8.1
8.3
7.8
7.8
A
B
C
D
E
F
G
60%
86%
75%
82%
64%
80%
61%
80%
71%
77%
73%
73%
65%
66%
Battlefield 2018 (n=262)
Battlefield 2020 (n=127)
Hoadly 2018 (n=171)
Hoadly 2020 (n=83)
Old Bridge 2018 (n=211)
Old Bridge 2020 (n=95)
Broad Run 2018 (n=242)
Broad Run 2020 (n=119)
Dale 2018 (n=255)
Dale 2020 (n=127)
Belmont/Potomac 2018(n=231)
Belmont/Potomac 2020(n=114)
Forest Park 2018 (n=194)
Forest Park 2020 (n=93)
Overall Performance of Police Dept.: Very Satisfied (8-10) by Region
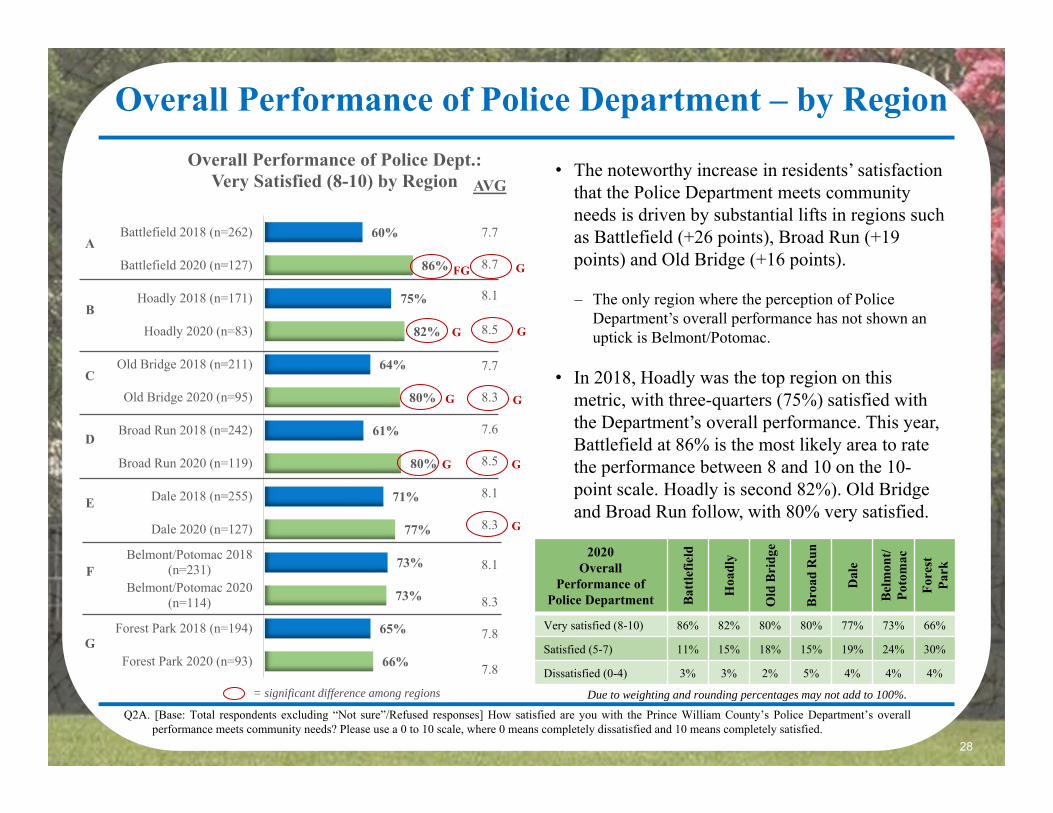
Overall Performance of Police Department – by Region
• The noteworthy increase in residents’ satisfaction that the Police Department meets community needs is driven by substantial lifts in regions such as Battlefield (+26 points), Broad Run (+19 points) and Old Bridge (+16 points).
– The only region where the perception of Police Department’s overall performance has not shown an uptick is Belmont/Potomac.
• In 2018, Hoadly was the top region on this metric, with three-quarters (75%) satisfied with the Department’s overall performance. This year, Battlefield at 86% is the most likely area to rate the performance between 8 and 10 on the 10-point scale. Hoadly is second 82%). Old Bridge and Broad Run follow, with 80% very satisfied.
2020 Overall
Performance of Police Department B
attle
field
Hoa
dly
Old
Bri
dge
Bro
ad R
un
Dal
e
Bel
mon
t/Po
tom
ac
Fore
st
Park
Very satisfied (8-10) 86% 82% 80% 80% 77% 73% 66%
Satisfied (5-7) 11% 15% 18% 15% 19% 24% 30%
Dissatisfied (0-4) 3% 3% 2% 5% 4% 4% 4%
Q2A. [Base: Total respondents excluding “Not sure”/Refused responses] How satisfied are you with the Prince William County’s Police Department’s overallperformance meets community needs? Please use a 0 to 10 scale, where 0 means completely dissatisfied and 10 means completely satisfied.
= significant difference among regions
G
G
FG
G
G
G
G
G
G
Due to weighting and rounding percentages may not add to 100%.

29
AVG
7.9
8.6
8.7
Overall Performance of Police Department – by Age
• In line with the 2018 findings, older County residents are more likely than their younger counterparts to express satisfaction with the overall performance of the Police Department.
– In 2020, the relationship is directly proportional. That is the likelihood to be satisfied with the overall performance of the Department increases in proportion to citizens’ age. Specifically, 85% of those age 55+ are very satisfied with this aspect of life in Prince William County, as compared to 83% of those age 35-54 and two-thirds (66%) of those under the age of 35.
Q2A. [Base: Total respondents excluding “Not sure”/Refused responses] How satisfied are you with the Prince William County’s Police Department’s overallperformance meets community needs? Please use a 0 to 10 scale, where 0 means completely dissatisfied and 10 means completely satisfied.
66%
83%
85%
28%
15%
12%
6%
2%
2%
Age 18-34(n=241)
Age 35-54(n=318)
Age 55+(n=197)
Very satisfied (8-10) Satisfied (5-7) Dissatisfied (0-4)
A
B
C
A
A
BC
A
A
= significant difference among respondent segments Due to weighting and rounding percentages may not add to 100%.
E

30
AVG
8.2
8.3
8.3
8.8
Overall Performance of Police Department – by Length of Residency
• Mirroring the patterns found for the age segments, the length of residency in the County is directly proportional to the levels of satisfaction with the Police Department’s overall performance.
– To illustrate, 85% of residents with 26+ years of tenure in Prince William County are very satisfied that the Police Department’s performance meeting community needs.
– In comparison, approximately three-quarters of those with shorter tenures feel this way (77% among those with residency of 16-25 years and 75% among those with residency of 6-15 years and 76% for those shorter than 6 years).
Q2A. [Base: Total respondents excluding “Not sure”/Refused responses] How satisfied are you with the Prince William County’s Police Department’s overallperformance meets community needs? Please use a 0 to 10 scale, where 0 means completely dissatisfied and 10 means completely satisfied.
76%
75%
77%
85%
19%
20%
20%
14%
6%
4%
3%
2%
0-5 years(n=155)
6-15 years(n=230)
16-25 years(n=225)
26+ years(n=151)
Very satisfied (8-10) Satisfied (5-7) Dissatisfied (0-4)
= significant difference among respondent segments
A
B
C
D ABCB
Due to weighting and rounding percentages may not add to 100%.
31
AVG
8.5
8.3
8.4
8.4
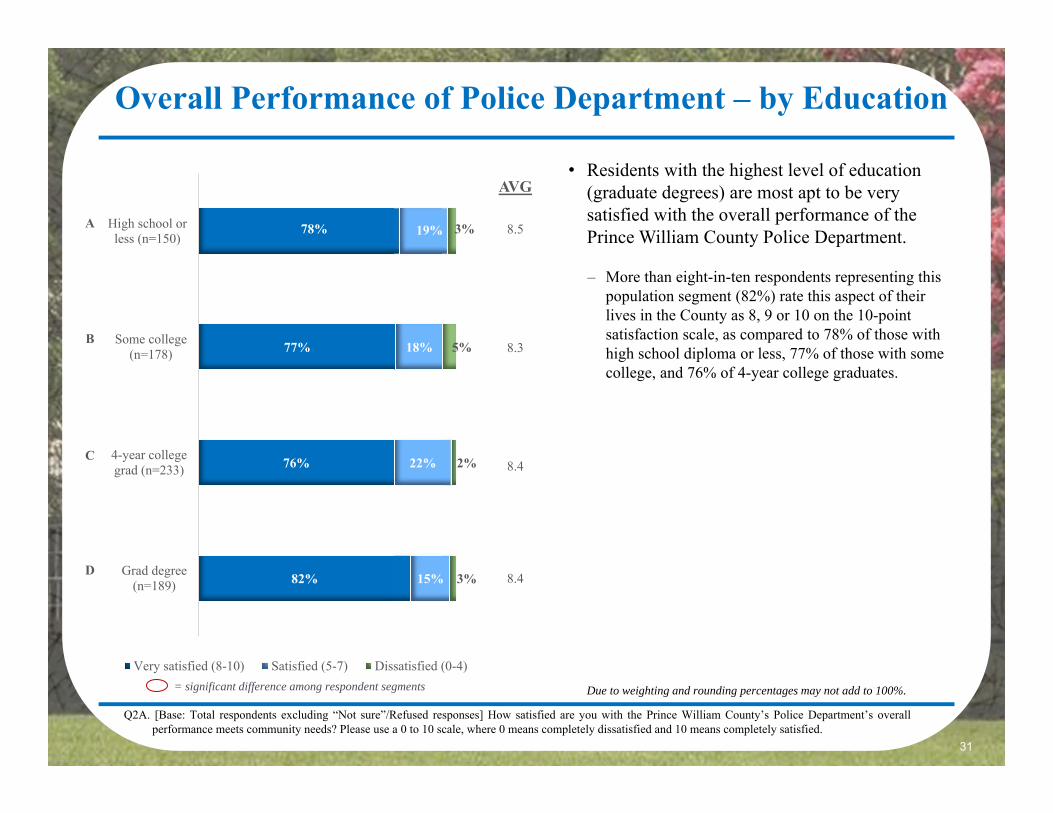
Overall Performance of Police Department – by Education
• Residents with the highest level of education (graduate degrees) are most apt to be very satisfied with the overall performance of the Prince William County Police Department.
– More than eight-in-ten respondents representing this population segment (82%) rate this aspect of their lives in the County as 8, 9 or 10 on the 10-point satisfaction scale, as compared to 78% of those with high school diploma or less, 77% of those with some college, and 76% of 4-year college graduates.
Q2A. [Base: Total respondents excluding “Not sure”/Refused responses] How satisfied are you with the Prince William County’s Police Department’s overallperformance meets community needs? Please use a 0 to 10 scale, where 0 means completely dissatisfied and 10 means completely satisfied.
78%
77%
76%
82%
19%
18%
22%
15%
3%
5%
2%
3%
High school orless (n=150)
Some college(n=178)
4-year collegegrad (n=233)
Grad degree(n=189)
Very satisfied (8-10) Satisfied (5-7) Dissatisfied (0-4)
A
B
C
D
= significant difference among respondent segments Due to weighting and rounding percentages may not add to 100%.

32
AVG
8.5
8.6
8.1
8.0
7.9
Overall Performance of Police Department – by Ethnicity
85%
82%
74%
72%
67%
12%
15%
18%
21%
30%
3%
3%
8%
7%
4%
Asian (n=53)
Caucasian(n=411)
Mixed (n=39)
Hispanic(n=147)
AfricanAmerican(n=148)
Very satisfied (8-10) Satisfied (5-7) Dissatisfied (0-4)
• More than two-thirds (67%) of African American residents, Mixed (74%), and (72%) of Hispanic residents say they are very satisfied with the overall performance of the Police Department. This is notably fewer than Asian 85% and Caucasian (82%) residents.– This being said, African Americans (4%), Hispanics (7%),
and Mixed Ethnicity (8%) voice dissatisfaction with the overall performance of the Police Department.
• Similar pattern is noted among African Americans in the 2018 survey where African Americans are more likely to share lukewarm sentiments.
Q2A. [Base: Total respondents excluding “Not sure”/Refused responses] How satisfied are you with the Prince William County’s Police Department’s overallperformance meets community needs? Please use a 0 to 10 scale, where 0 means completely dissatisfied and 10 means completely satisfied.
= significant difference among respondent segments
A
B
C
D
E
EE
DE DE
BB
AB
Due to weighting and rounding percentages may not add to 100%.

33
3. Courtesy & Helpfulness of Police Officers
34
Q2B. [Base: Total respondents excluding “Not sure”/Refused responses] How satisfied are you that Prince William’s Police officers are courteous and helpful to allcommunity members? Please use a 0 to 10 scale, where 0 means completely dissatisfied and 10 means completely satisfied.
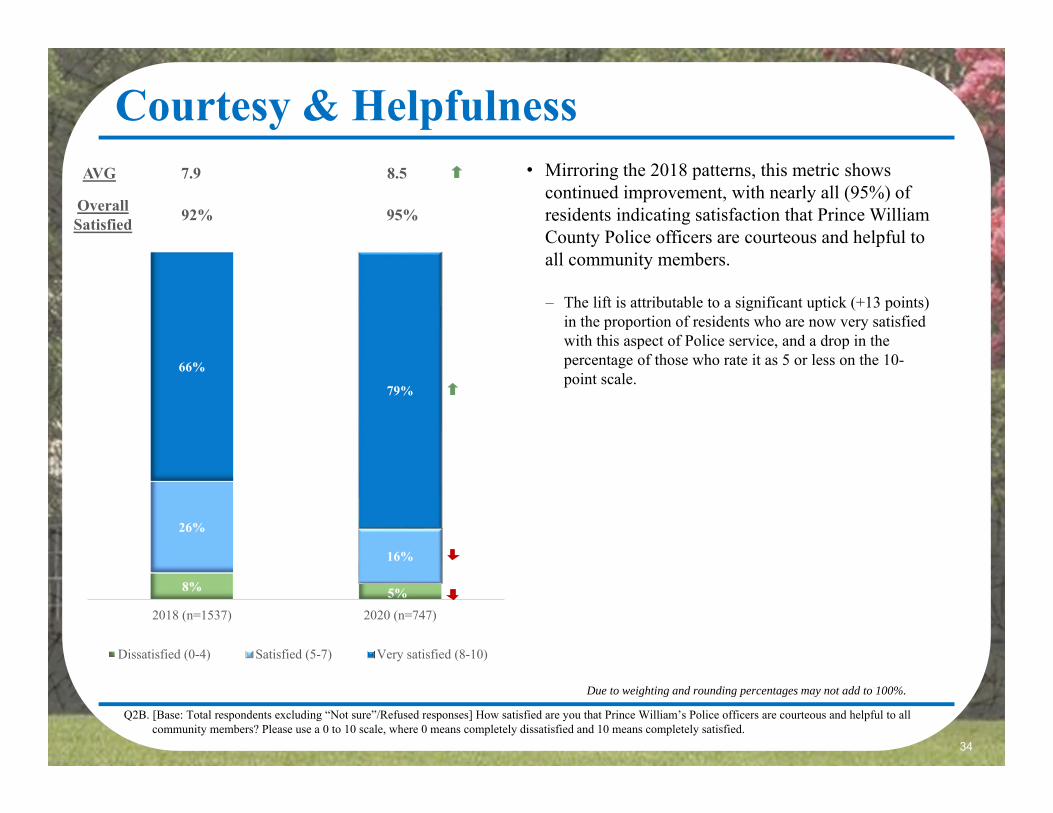
Courtesy & Helpfulness• Mirroring the 2018 patterns, this metric shows
continued improvement, with nearly all (95%) of residents indicating satisfaction that Prince William County Police officers are courteous and helpful to all community members.
– The lift is attributable to a significant uptick (+13 points) in the proportion of residents who are now very satisfied with this aspect of Police service, and a drop in the percentage of those who rate it as 5 or less on the 10-point scale.
8% 5%
26%
16%
66%
79%
2018 (n=1537) 2020 (n=747)
Dissatisfied (0-4) Satisfied (5-7) Very satisfied (8-10)
AVG 7.9 8.5
Overall Satisfied 92% 95%
Due to weighting and rounding percentages may not add to 100%.

35
AVG
7.7
8.9
8.0
8.8
7.6
8.6
8.0
8.5
8.1
8.5
7.9
8.4
7.6
8.0
62%
88%
69%
86%
61%
80%
69%
79%
73%
76%
66%
74%
63%
72%
Battlefield 2018 (n=253)
Battlefield 2020 (n=120)
Hoadly 2018 (n=172)
Hoadly 2020 (n=84)
Broad Run 2018 (n=235)
Broad Run 2020 (n=117)
Belmont/Potomac 2018(n=228)
Belmont/Potomac 2020(n=110)
Dale 2018 (n=248)
Dale 2020 (n=123)
Old Bridge 2018 (n=208)
Old Bridge 2020 (n=97)
Forest Park 2018 (n=190)
Forest Park 2020 (n=91)
Courtesy & Helpfulness of Officers: Very Satisfied (8-10) by Region
G
EFG
A
B
C
D
E
F
G
Courtesy & Helpfulness – by Region• The improvement noted in the County-wide courtesy and
helpfulness score is reflected in lifts across all regions. The most substantial upticks, however, are observed in Battlefield (+26 points), Broad Run (+19 points) and Hoadly (+17 points).
• In 2018, Dale, Hoadly and Belmont/Potomac were the leading regions on this metric. This 2020 survey shows some reshuffling with Battlefield and Broad Run regions joining in the top three. Battlefield residents (88%) are most likely to be very satisfied with the courtesy and helpfulness of Police officers, followed by Hoadly (86%) and Broad Run (80%).
2020 Courtesy
& Helpfulness
Bat
tlefie
ld
Hoa
dly
Bro
ad R
un
Bel
mon
t/Po
tom
ac
Dal
e
Old
Bri
dge
Fore
st
Park
Very satisfied (8-10) 88% 86% 80% 79% 76% 74% 72%
Satisfied (5-7) 11% 11% 16% 16% 21% 23% 14%
Dissatisfied (0-4) 2% 3% 5% 5% 3% 4% 14%
= significant difference among regions
Q2B. [Base: Total respondents excluding “Not sure”/Refused responses] How satisfied are you that Prince William’s Police officers are courteous and helpful to allcommunity members? Please use a 0 to 10 scale, where 0 means completely dissatisfied and 10 means completely satisfied.
FG
EFG

36
Courtesy & Helpfulness – by Age• As observed with previously discussed metrics,
residents’ likelihood to express satisfaction that Prince William County Police officers are courteous and helpful to all community members is directly proportional to their age.
– Specifically, nine-in-ten residents aged 55+ (90%) are very satisfied with this aspect of Police service, as compared to 82% of those aged 35-54 and approximately two-thirds (68%) of those younger than 34.
– Those in the youngest age bracket 18 – 34 are most apt to express dissatisfaction with this metric (10%).
= significant difference among respondent segments
Q2B. [Base: Total respondents excluding “Not sure”/Refused responses] How satisfied are you that Prince William’s Police officers are courteous and helpful to allcommunity members? Please use a 0 to 10 scale, where 0 means completely dissatisfied and 10 means completely satisfied.
68%
82%
90%
22%
16%
7%
10%
2%
3%
Age 18-34(n=234)
Age 35-54(n=318)
Age 55+(n=289)
Very satisfied (8-10) Satisfied (5-7) Dissatisfied (0-4)
A
B
C
C
A
AB
AVG
8.0
8.7
9.0
C
BC
A
AB
Due to weighting and rounding percentages may not add to 100%.

37
80%
77%
76%
87%
12%
19%
19%
10%
8%
4%
5%
2%
0-5 years(n=150)
6-15 years(n=229)
16-25 years(n=220)
26+ years(n=148)
Very satisfied (8-10) Satisfied (5-7) Dissatisfied (0-4)
Courtesy & Helpfulness – by Length of Residency
= significant difference among respondent segments
Q2B. [Base: Total respondents excluding “Not sure”/Refused responses] How satisfied are you that Prince William’s Police officers are courteous and helpful to allcommunity members? Please use a 0 to 10 scale, where 0 means completely dissatisfied and 10 means completely satisfied.
AVG
8.5
8.5
8.4
9.0
AD
A
B
C
D ABCBC
D
D
• Once again, the most tenured County residents (26+ years) are the most likely to be very satisfied with Prince William County Police officers’ courtesy and helpfulness to all community members.
– To illustrate, 87% of residents with the longest tenures give the County ratings of 8, 9 or 10 on the 10-point scale.
– Those with the shortest tenures (0-5 years) rate very satisfied at 80% while this group are also most apt to express dissatisfaction with this metric (8%).
– In comparison, just over three-quarters of those residing in Prince William County for 6-25 years are very satisfied.
Due to weighting and rounding percentages may not add to 100%.
38
AVG
8.7
8.4
8.6
8.6
D
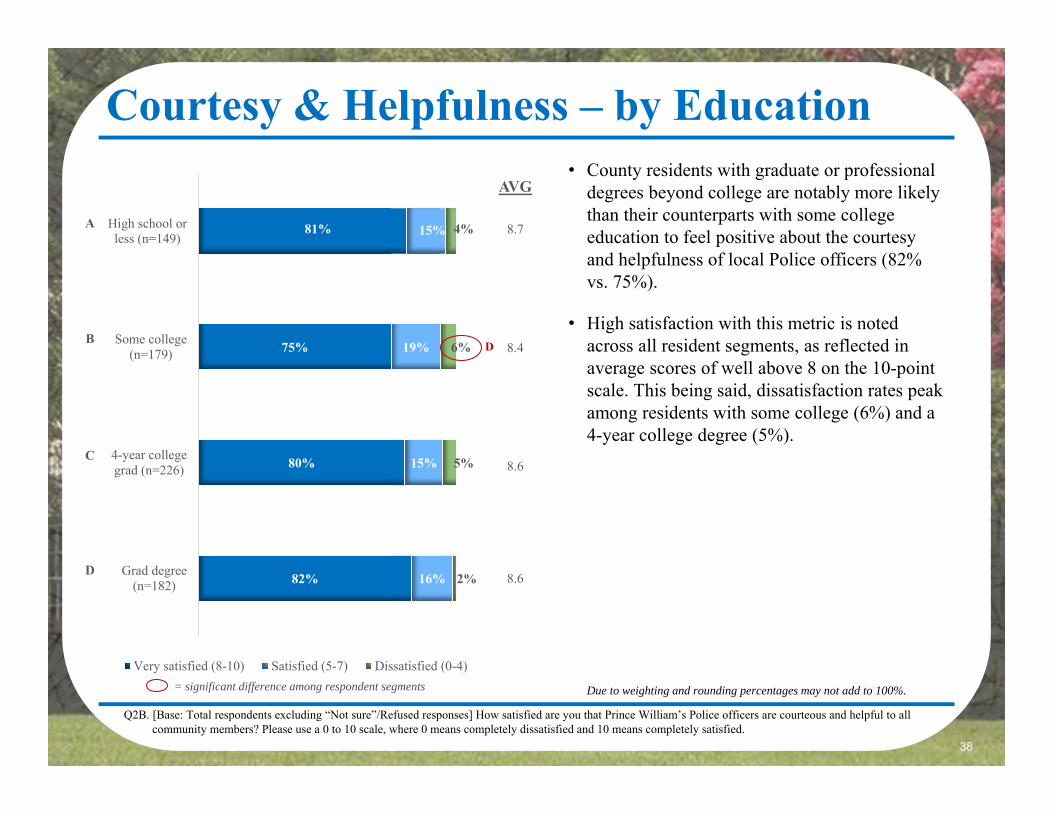
Courtesy & Helpfulness – by Education
Q2B. [Base: Total respondents excluding “Not sure”/Refused responses] How satisfied are you that Prince William’s Police officers are courteous and helpful to allcommunity members? Please use a 0 to 10 scale, where 0 means completely dissatisfied and 10 means completely satisfied.
• County residents with graduate or professional degrees beyond college are notably more likely than their counterparts with some college education to feel positive about the courtesy and helpfulness of local Police officers (82% vs. 75%).
• High satisfaction with this metric is noted across all resident segments, as reflected in average scores of well above 8 on the 10-point scale. This being said, dissatisfaction rates peak among residents with some college (6%) and a 4-year college degree (5%).
81%
75%
80%
82%
15%
19%
15%
16%
4%
6%
5%
2%
High school orless (n=149)
Some college(n=179)
4-year collegegrad (n=226)
Grad degree(n=182)
Very satisfied (8-10) Satisfied (5-7) Dissatisfied (0-4)
A
B
C
D
= significant difference among respondent segments Due to weighting and rounding percentages may not add to 100%.
39
AVG
8.8
8.7
8.3
8.1
8.1
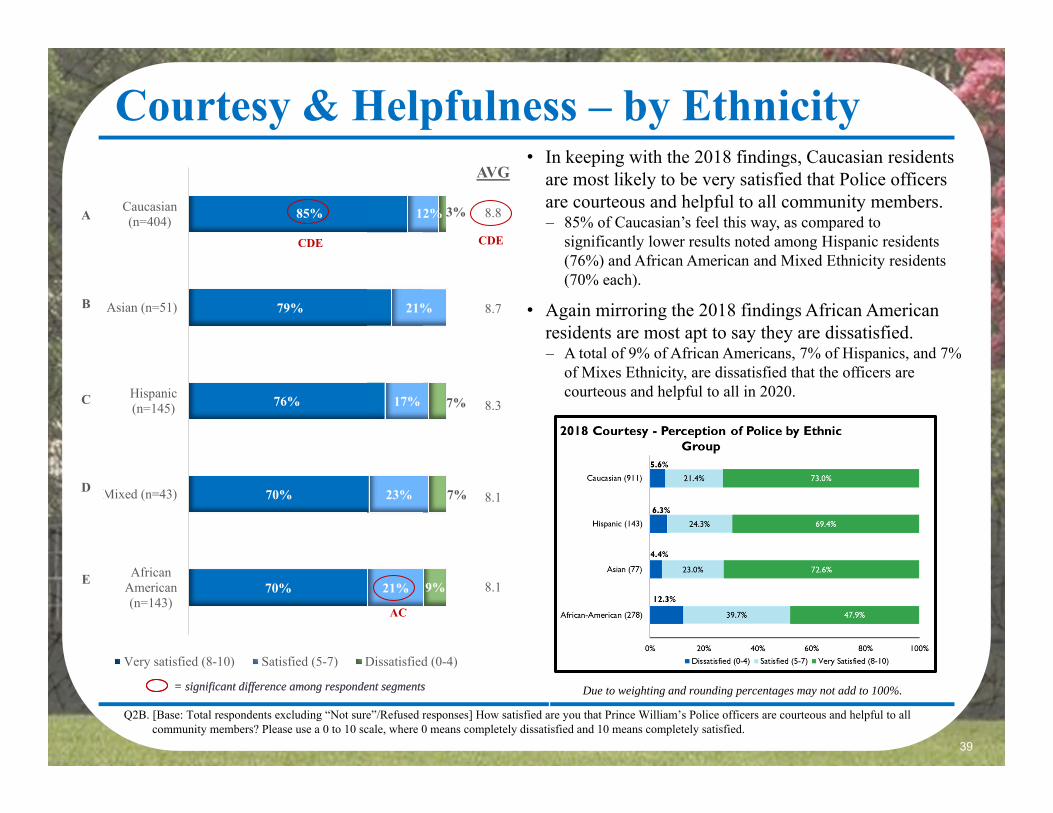
Courtesy & Helpfulness – by Ethnicity• In keeping with the 2018 findings, Caucasian residents
are most likely to be very satisfied that Police officers are courteous and helpful to all community members. – 85% of Caucasian’s feel this way, as compared to
significantly lower results noted among Hispanic residents (76%) and African American and Mixed Ethnicity residents (70% each).
• Again mirroring the 2018 findings African American residents are most apt to say they are dissatisfied. – A total of 9% of African Americans, 7% of Hispanics, and 7%
of Mixes Ethnicity, are dissatisfied that the officers are courteous and helpful to all in 2020.
= significant difference among respondent segments
Q2B. [Base: Total respondents excluding “Not sure”/Refused responses] How satisfied are you that Prince William’s Police officers are courteous and helpful to allcommunity members? Please use a 0 to 10 scale, where 0 means completely dissatisfied and 10 means completely satisfied.
85%
79%
76%
70%
70%
12%
21%
17%
23%
21%
3%
7%
7%
9%
Caucasian(n=404)
Asian (n=51)
Hispanic(n=145)
Mixed (n=43)
AfricanAmerican(n=143)
Very satisfied (8-10) Satisfied (5-7) Dissatisfied (0-4)
= significant difference among respondent segments
A
B
C
D
E
CDE
AC
CDE
Due to weighting and rounding percentages may not add to 100%.
40
4. Promptness of Police Department

41
Q2C. [Base: Total respondents excluding “Not sure”/Refused responses] How satisfied are you that requests for Prince William’s Police Assistance receive promptresponse? Please use a 0 to 10 scale, where 0 means completely dissatisfied and 10 means completely satisfied.
Promptness• In keeping with the prevailing pattern, the perception
of Prince William County Police promptness has improved since 2018. At present, nearly all (97%) of the County residents are satisfied or very satisfied that requests for Police Assistance receive prompt response.
– The 3-point lift is attributable to an observable drop in the proportion of residents dissatisfied with the Department’s promptness (3% now vs. 6% in 2018).
– Additionally, there has been a shift away from the satisfied ratings (5-7 on the 10-point scale) to very satisfied ratings (8 and above). To illustrate, more than eight-in-ten residents (81%) are now very satisfied, as compared to 73% noted in the previous survey.
6% 3%
21%16%
73%81%
2018 (n=1481) 2020 (n=699)
Dissatisfied (0-4) Satisfied (5-7) Very satisfied (8-10)
AVG 8.2 8.6
Overall Satisfied 94% 97%
Due to weighting and rounding percentages may not add to 100%.

42
AVG
7.8
8.8
8.2
8.8
8.3
8.6
8.1
8.6
8.4
8.6
8.4
8.4
7.9
8.2
68%
87%
73%
85%
75%
84%
79%
84%
81%
79%
76%
78%
72%
65%
Battlefield 2018 (n=276)
Battlefield 2020 (n=111)
Broad Run 2018 (n=220)
Broad Run 2020 (n=113)
Old Bridge 2018 (n=255)
Old Bridge 2020 (n=84)
Hoadly 2018 (n=174)
Hoadly 2020 (n=75)
Dale 2018 (n=238)
Dale 2020 (n=119)
Belmont/Potomac 2018(n=177)
Belmont/Potomac 2020(n=109)
Forest Park 2018 (n=186)
Forest Park 2020 (n=84)
Promptness of Police Dept.: Very Satisfied (8-10) by Region
G
G
G
G
G
A
B
C
D
E
F
G
Promptness – by Region• The County-wide increase in residents’ satisfaction
with the Police Department’s prompt response is attributable mostly to dramatic lifts in regions such as Battlefield (+19) points since 2018), Broad Run (+12 points), and Old Bridge (+9 points).
• This being said, some regions experienced a decline in satisfaction.– Dale, which was a leading region on this metric in the
previous survey, now shows a drop of 2 points.– A drop of 7 points is noted in Forest Park.
• At present, Battlefield (87%), Broad Run (85%), Old Bridge (84%), and Hoadly (84%), are the most likely regions to be very satisfied that requests for Police Assistance receive prompt response.
2020 Responsiveness
Bat
tlefie
ld
Bro
ad R
un
Old
Bri
dge
Hoa
dly
Dal
e
Bel
mon
t/Po
tom
ac
Fore
st
Park
Very satisfied (8-10) 87% 85% 84% 84% 79% 78% 65%
Satisfied (5-7) 11% 13% 15% 13% 18% 17% 29%
Dissatisfied (0-4) 2% 2% 1% 3% 3% 5% 6%
= significant difference among regions
Q2C. [Base: Total respondents excluding “Not sure”/Refused responses] How satisfied are you that requests for Prince William’s Police Assistance receive promptresponse? Please use a 0 to 10 scale, where 0 means completely dissatisfied and 10 means completely satisfied.
G
Due to weighting and rounding percentages may not add to 100%.
43
76%
81%
87%
19%
17%
11%
5%
2%
2%
Age 18-34(n=219)
Age 35-54(n=302)
Age 55+(n=175)
Very satisfied (8-10) Satisfied (5-7) Dissatisfied (0-4)
AVG
8.3
8.6
8.9
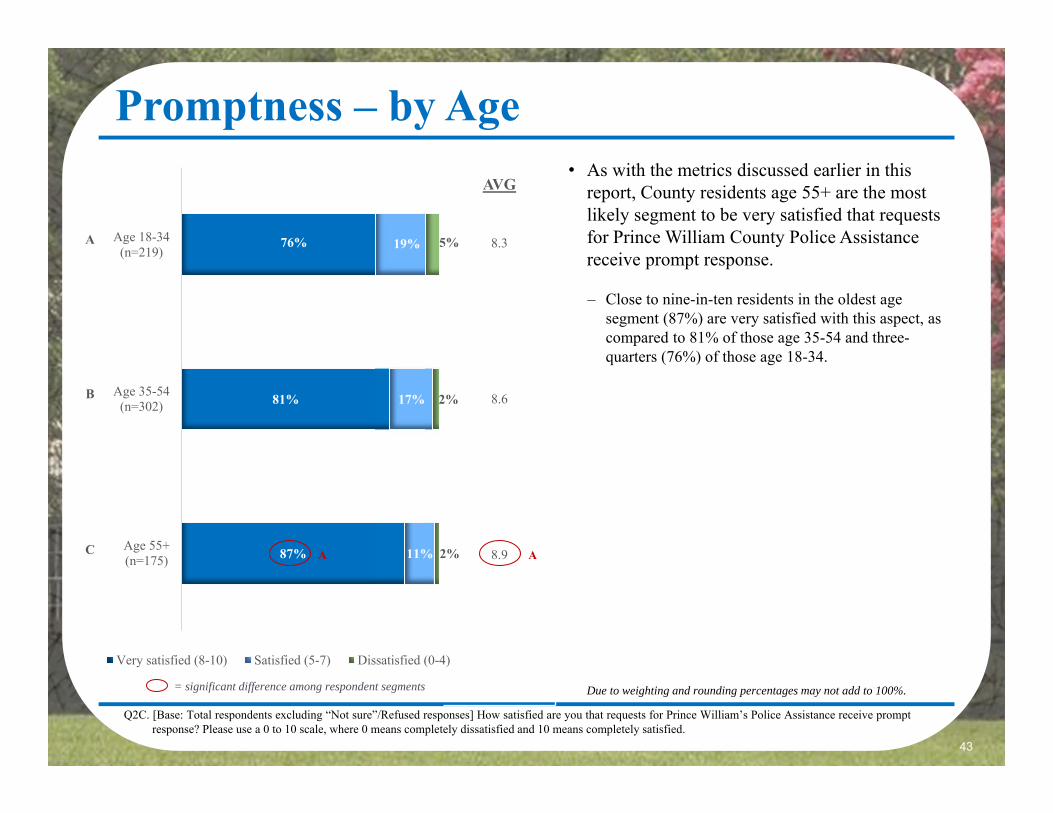
Promptness – by Age• As with the metrics discussed earlier in this
report, County residents age 55+ are the most likely segment to be very satisfied that requests for Prince William County Police Assistance receive prompt response.
– Close to nine-in-ten residents in the oldest age segment (87%) are very satisfied with this aspect, as compared to 81% of those age 35-54 and three-quarters (76%) of those age 18-34.
= significant difference among respondent segments
Q2C. [Base: Total respondents excluding “Not sure”/Refused responses] How satisfied are you that requests for Prince William’s Police Assistance receive promptresponse? Please use a 0 to 10 scale, where 0 means completely dissatisfied and 10 means completely satisfied.
A
B
C A A
Due to weighting and rounding percentages may not add to 100%.

44
Promptness – by Length of Residency• In keeping with the previously discussed
metrics, residents with the longest tenure in the County (26+ years) are most inclined to be very satisfied that requests for Prince William County Police Department receive prompt response.
– 86% in the most tenured segment are very satisfied with this aspect, as compared to 79% of those living in the County between 6 and 25 years, and 82% of those who have arrived up to 5 years ago.
• On the flip side, residents with the shortest tenure (up to 5 years) are most likely to be dissatisfied with this aspect of Police service.
– A total of 6% of these respondents rate the Department’s responsiveness as 0-4 on the 10-point scale, as compared to 3% among those residing in the County for 6-25 years and only 1% of those who have lived in the community for longer than that.
= significant difference among respondent segments
Q2C. [Base: Total respondents excluding “Not sure”/Refused responses] How satisfied are you that requests for Prince William’s Police Assistance receive promptresponse? Please use a 0 to 10 scale, where 0 means completely dissatisfied and 10 means completely satisfied.
82%
79%
79%
86%
12%
19%
18%
13%
6%
3%
3%
1%
0-5 years(n=131)
6-15 years(n=218)
16-25 years(n=213)
26+ years(n=137)
Very satisfied (8-10) Satisfied (5-7) Dissatisfied (0-4)
AVG
8.5
8.5
8.5
8.9
A
B
C
D ABC
D
Due to weighting and rounding percentages may not add to 100%.

45
AVG
8.7
8.4
8.8
8.5
B
Responsiveness – by Education• County residents with some college coursework
are most apt to express dissatisfaction that requests for Prince William County Police Assistance receive prompt response.– A total of 5% of these respondents rate the
Department’s promptness 0-4 on the 10-point scale. This is the highest proportion among all educational attainment levels, particularly when compared to residents with a 4-year college degree, 1% of whom report dissatisfaction.
• With averages of 8.8 and 8.7 on the 1-to-10 scale, residents with a high school diploma or less, and those with a 4-year college degree, award the Department the highest ratings on this metric.
Q2C. [Base: Total respondents excluding “Not sure”/Refused responses] How satisfied are you that requests for Prince William’s Police Assistance receive promptresponse? Please use a 0 to 10 scale, where 0 means completely dissatisfied and 10 means completely satisfied.
82%
75%
84%
82%
16%
20%
15%
15%
3%
5%
1%
3%
High school orless (n=142)
Some college(n=167)
4-year collegegrad (n=207)
Grad degree(n=174)
Very satisfied (8-10) Satisfied (5-7) Dissatisfied (0-4)
A
B
C
D
B
C
= significant difference among respondent segments Due to weighting and rounding percentages may not add to 100%.
46
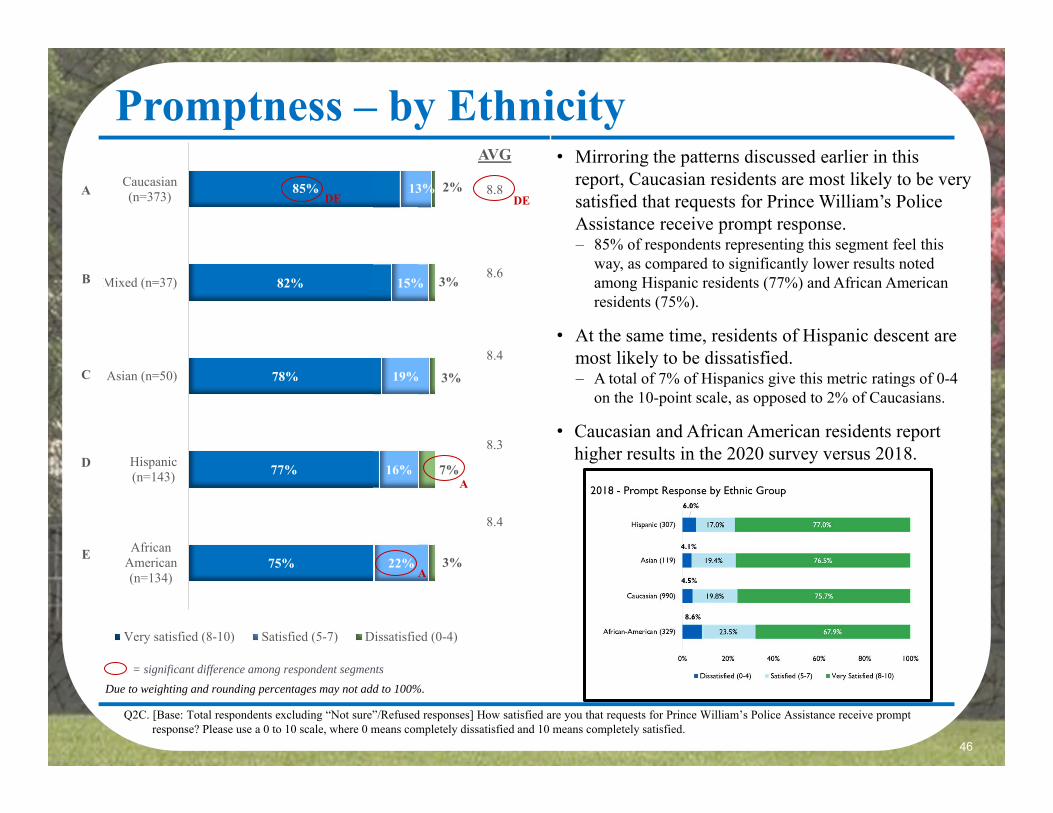
Promptness – by Ethnicity• Mirroring the patterns discussed earlier in this
report, Caucasian residents are most likely to be very satisfied that requests for Prince William’s Police Assistance receive prompt response. – 85% of respondents representing this segment feel this
way, as compared to significantly lower results noted among Hispanic residents (77%) and African American residents (75%).
• At the same time, residents of Hispanic descent are most likely to be dissatisfied. – A total of 7% of Hispanics give this metric ratings of 0-4
on the 10-point scale, as opposed to 2% of Caucasians.
• Caucasian and African American residents report higher results in the 2020 survey versus 2018.
Q2C. [Base: Total respondents excluding “Not sure”/Refused responses] How satisfied are you that requests for Prince William’s Police Assistance receive promptresponse? Please use a 0 to 10 scale, where 0 means completely dissatisfied and 10 means completely satisfied.
AVG
8.8
8.6
8.4
8.3
8.4
85%
82%
78%
77%
75%
13%
15%
19%
16%
22%
2%
3%
3%
7%
3%
Caucasian(n=373)
Mixed (n=37)
Asian (n=50)
Hispanic(n=143)
AfricanAmerican(n=134)
Very satisfied (8-10) Satisfied (5-7) Dissatisfied (0-4)
A
B
C
D
E
DEDE
A
= significant difference among respondent segments
A
Due to weighting and rounding percentages may not add to 100%.
47
5. Fair Treatment by Police Department

48
Q2D. [Base: Total respondents excluding “Not sure”/Refused responses] How satisfied are you that the Prince William’s Police Department treats everyone fairlyregardless of race, gender, ethnic or national origin? Please use a 0 to 10 scale, where 0 means completely dissatisfied and 10 means completely satisfied.
Fair Treatment • In comparison to the 2018 survey, a significant
improvement is noted in the level of satisfaction with Prince William County Police Department treating everyone fairly regardless of race, gender, ethnic or national origin.
– The 5% lift is a result of a decrease in reported dissatisfaction (from 12% in 2018 to 7% in 2020).
– Additionally, County residents are now more likely to say they are very satisfied with this metric (a 13-point gain) and less likely to report lukewarm ratings of 5-7 on the 10-point scale (a 10-point decrease).
12% 7%
28%
18%
61%
74%
2018 (n=1482) 2020 (n=713)
Dissatisfied (0-4) Satisfied (5-7) Very satisfied (8-10)
AVG 7.5 8.3
Overall Satisfied 88% 93%
Due to weighting and rounding percentages may not add to 100%.

49
67%
84%
59%
81%
61%
76%
63%
73%
61%
72%
59%
70%
57%
64%
Hoadly 2018 (n=165)
Hoadly 2020 (n=79)
Battlefield 2018 (n=243)
Battlefield 2020 (n=117)
Belmont/Potomac 2018(n=228)
Belmont/Potomac 2020(n=108)
Dale 2018 (n=239)
Dale 2020 (n=117)
Broad Run 2018 (n=228)
Broad Run 2020 (n=116)
Old Bridge 2018 (n=195)
Old Bridge 2020 (n=92)
Forest Park 2018 (n=185)
Forest Park 2020 (n=81)
Fair Treatment by Police Dept.: Very Satisfied (8-10) by Region AVG
7.8
8.7
7.5
8.7
7.6
8.4
7.7
8.2
7.4
8.2
7.4
8.1
7.2
7.6
DEFG
A
B
C
D
E
F
G
Fair Treatment – by Region• Lifts in satisfaction with fair treatment by Police
are noted across all regions in the County.
– The largest upticks are observed in Battlefield (+22 points), Hoadly (+17 points), and Belmont/Potomac (+15 points).
• Just as in 2018, Hoadly is the leading region on this metric, with 84% of the residents expressing satisfaction that the Police Department treats everyone fairly regardless of race, gender, ethnic or national origin.
– This result is significantly higher than satisfaction levels recorded in Dale (73%), Broad Run (72%), Old Bridge (70%) and Forest Park (64%).
2020 Fair Treatment H
oadl
y
Bat
tlefie
ld
Bel
mon
t/Po
tom
ac
Dal
e
Bro
ad R
un
Old
Bri
dge
Fore
st
Park
Very satisfied (8-10) 84% 81% 76% 73% 72% 70% 64%
Satisfied (5-7) 12% 16% 18% 18% 22% 22% 16%
Dissatisfied (0-4) 3% 4% 6% 9% 6% 8% 19%
= significant difference among regions
Q2D. [Base: Total respondents excluding “Not sure”/Refused responses] How satisfied are you that the Prince William’s Police Department treats everyone fairlyregardless of race, gender, ethnic or national origin? Please use a 0 to 10 scale, where 0 means completely dissatisfied and 10 means completely satisfied.
G
G
G

50
AVG
7.7
8.5
8.8
A
Fair Treatment – by Age• In keeping with the discussion of previous
metric patterns, likelihood to be satisfied with fair treatment by Prince William County Police Department is directly proportional to residents’ age.
– Specifically, 86% of those age 55+ are very satisfied that the Department treats everyone fairly, as compared to 79% of those age 35-54 and 61% of those age 18-34.
– Conversely, the youngest resident segment is the most likely one to be dissatisfied with this metric. A total of 13% of those under the age of 35 rate this aspect as only 0-4 on the 10-point scale, as opposed to 6% among those age 35-54 and 2% among those age 55+.
Q2D. [Base: Total respondents excluding “Not sure”/Refused responses] How satisfied are you that the Prince William’s Police Department treats everyone fairlyregardless of race, gender, ethnic or national origin? Please use a 0 to 10 scale, where 0 means completely dissatisfied and 10 means completely satisfied.
A
B
C AAB
61%
79%
86%
26%
16%
12%
13%
6%
2%
Age 18-34(n=232)
Age 35-54(n=299)
Age 55+(n=178)
Very satisfied (8-10) Satisfied (5-7) Dissatisfied (0-4)
A
AB
BC BC
C
= significant difference among respondent segments Due to weighting and rounding percentages may not add to 100%.
51
AVG
8.2
8.3
8.0
8.8
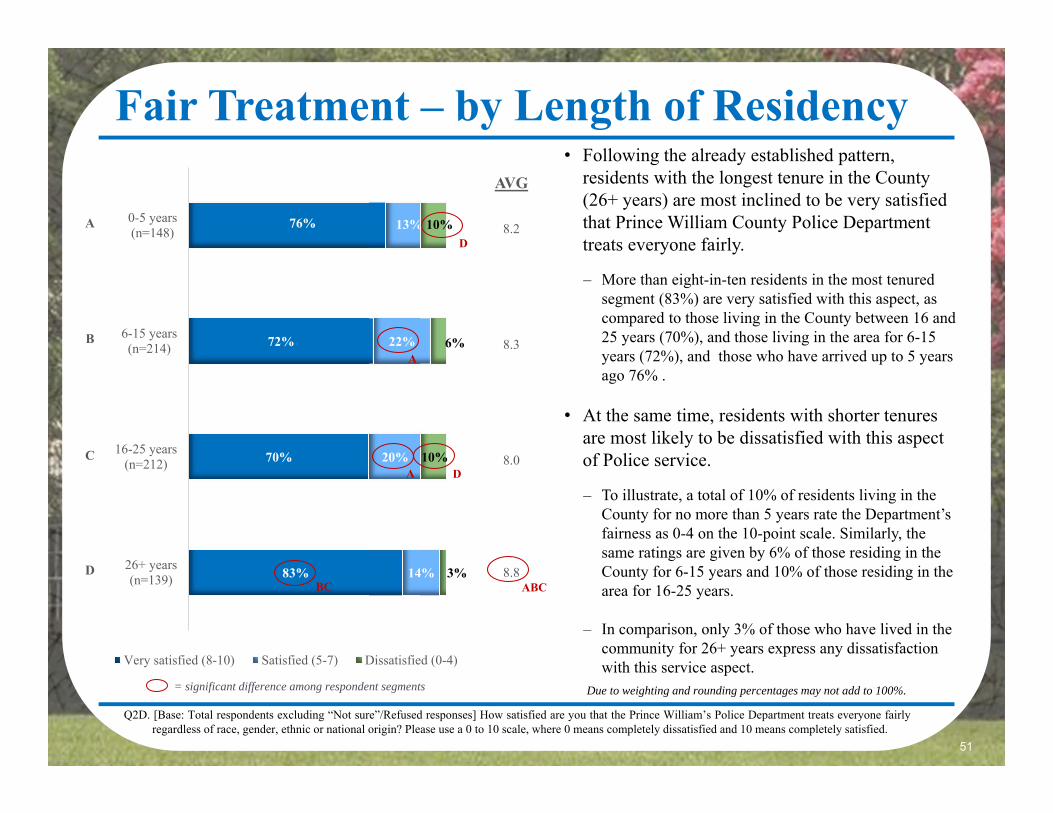
Fair Treatment – by Length of Residency• Following the already established pattern,
residents with the longest tenure in the County (26+ years) are most inclined to be very satisfied that Prince William County Police Department treats everyone fairly.
– More than eight-in-ten residents in the most tenured segment (83%) are very satisfied with this aspect, as compared to those living in the County between 16 and 25 years (70%), and those living in the area for 6-15 years (72%), and those who have arrived up to 5 years ago 76% .
• At the same time, residents with shorter tenures are most likely to be dissatisfied with this aspect of Police service.
– To illustrate, a total of 10% of residents living in the County for no more than 5 years rate the Department’s fairness as 0-4 on the 10-point scale. Similarly, the same ratings are given by 6% of those residing in the County for 6-15 years and 10% of those residing in the area for 16-25 years.
– In comparison, only 3% of those who have lived in the community for 26+ years express any dissatisfaction with this service aspect.
Q2D. [Base: Total respondents excluding “Not sure”/Refused responses] How satisfied are you that the Prince William’s Police Department treats everyone fairlyregardless of race, gender, ethnic or national origin? Please use a 0 to 10 scale, where 0 means completely dissatisfied and 10 means completely satisfied.
= significant difference among respondent segments
76%
72%
70%
83%
13%
22%
20%
14%
10%
6%
10%
3%
0-5 years(n=148)
6-15 years(n=214)
16-25 years(n=212)
26+ years(n=139)
Very satisfied (8-10) Satisfied (5-7) Dissatisfied (0-4)
A
B
C
DABC
D
D
A
A
BC
Due to weighting and rounding percentages may not add to 100%.
52
AVG
8.7
8.6
7.5
7.9
7.5
Q2D. [Base: Total respondents excluding “Not sure”/Refused responses] How satisfied are you that the Prince William’s Police Department treats everyone fairlyregardless of race, gender, ethnic or national origin? Please use a 0 to 10 scale, where 0 means completely dissatisfied and 10 means completely satisfied.
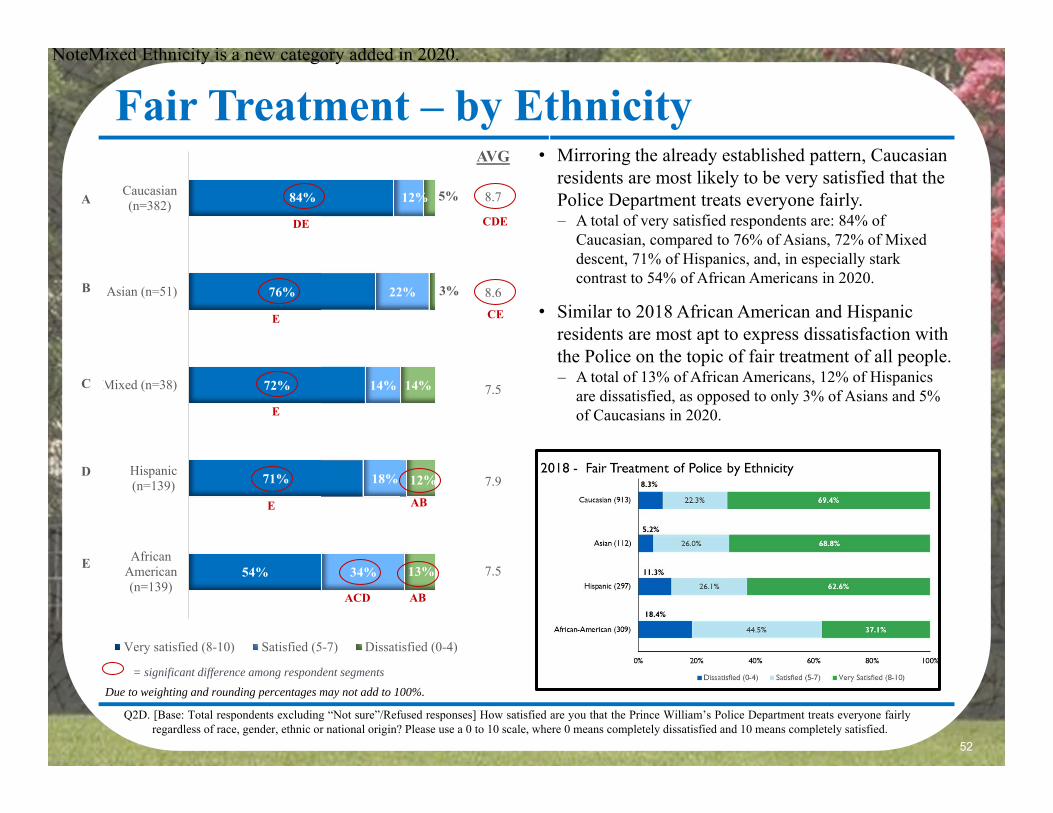
Fair Treatment – by Ethnicity• Mirroring the already established pattern, Caucasian
residents are most likely to be very satisfied that the Police Department treats everyone fairly. – A total of very satisfied respondents are: 84% of
Caucasian, compared to 76% of Asians, 72% of Mixed descent, 71% of Hispanics, and, in especially stark contrast to 54% of African Americans in 2020.
• Similar to 2018 African American and Hispanic residents are most apt to express dissatisfaction with the Police on the topic of fair treatment of all people.– A total of 13% of African Americans, 12% of Hispanics
are dissatisfied, as opposed to only 3% of Asians and 5% of Caucasians in 2020.
84%
76%
72%
71%
54%
12%
22%
14%
18%
34%
5%
3%
14%
12%
13%
Caucasian(n=382)
Asian (n=51)
Mixed (n=38)
Hispanic(n=139)
AfricanAmerican(n=139)
Very satisfied (8-10) Satisfied (5-7) Dissatisfied (0-4)
A
B
C
D
E
= significant difference among respondent segments
CDE
CE
DE
E
E
E
ACD
AB
AB
Due to weighting and rounding percentages may not add to 100%.
NoteMixed Ethnicity is a new category added in 2020.

53
6. Information & Crime Prevention Programs
54
Q2E. [Base: Total respondents excluding “Not sure”/Refused responses] How satisfied are you that the Prince William Police Department provides adequateinformation and crime prevention programs? Please use a 0 to 10 scale, where 0 means completely dissatisfied and 10 means completely satisfied.
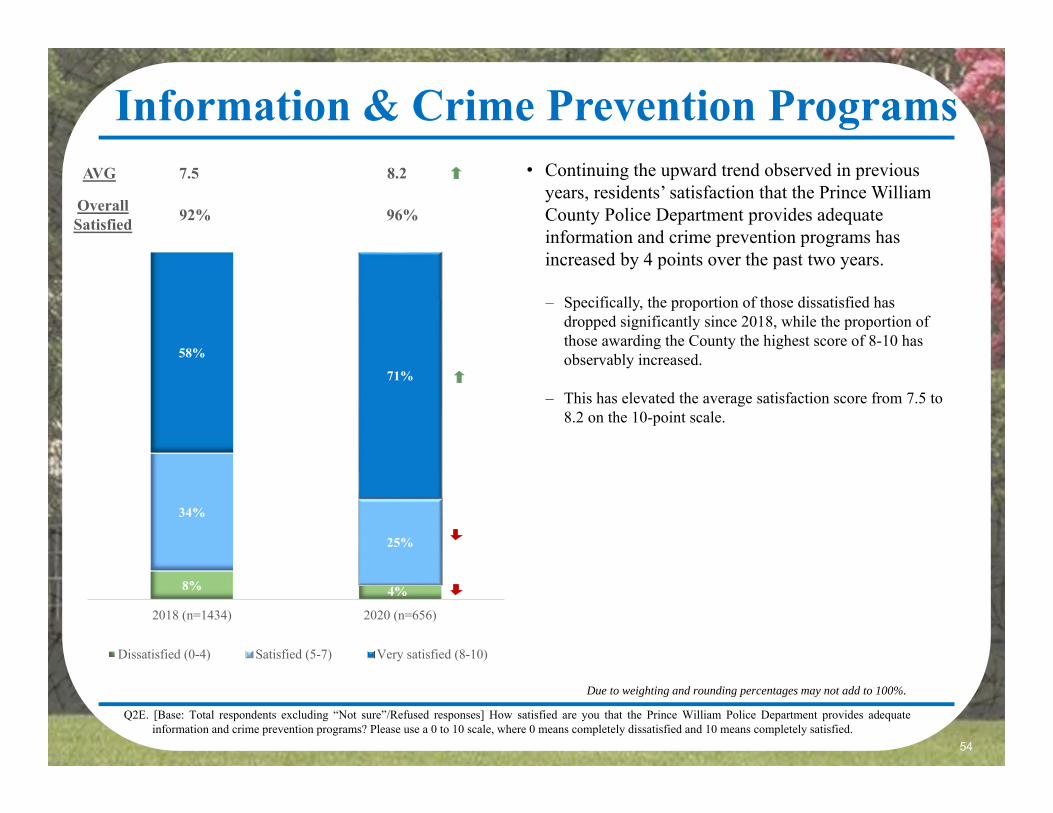
Information & Crime Prevention Programs• Continuing the upward trend observed in previous
years, residents’ satisfaction that the Prince William County Police Department provides adequate information and crime prevention programs has increased by 4 points over the past two years.
– Specifically, the proportion of those dissatisfied has dropped significantly since 2018, while the proportion of those awarding the County the highest score of 8-10 has observably increased.
– This has elevated the average satisfaction score from 7.5 to 8.2 on the 10-point scale.
8% 4%
34%
25%
58%
71%
2018 (n=1434) 2020 (n=656)
Dissatisfied (0-4) Satisfied (5-7) Very satisfied (8-10)
AVG 7.5 8.2
Overall Satisfied 92% 96%
Due to weighting and rounding percentages may not add to 100%.

55
57%
82%
61%
71%
56%
71%
58%
71%
67%
69%
53%
68%
53%
58%
Battlefield 2018 (n=233)
Battlefield 2020 (n=103)
Hoadly 2018 (n=157)
Hoadly 2020 (n=71)
Broad Run 2018 (n=226)
Broad Run 2020 (n=104)
Belmont/Potomac 2018(n=211)
Belmont/Potomac 2020(n=105)
Dale 2018 (n=240)
Dale 2020 (n=108)
Old Bridge 2018 (n=187)
Old Bridge 2020 (n=82)
Forest Park 2018 (n=178)
Forest Park 2020 (n=81)
Information & Crime Prevention: Very Satisfied (8-10) by Region
A
B
C
D
E
F
G
AVG
7.4
8.8
7.6
8.2
7.6
8.0
7.9
8.2
7.5
8.2
7.7
7.9
7.1
7.6
Information & Crime Prevention Programs – by Region
• The County-wide increase in satisfaction that Prince William County Police Department provides adequate information and crime prevention programs is reflected across all regions, with the largest gains noted in Battlefield (+25 points), Broad Run (+15 points), and Old Bridge (+15 points).
• While Dale and Hoadly were the leading regions on this metric in 2018, they are now outperformed by Battlefield which boasts 82% of very satisfied residents.
2020 Information
& Crime Prevention Programs B
attle
field
Hoa
dly
Bro
ad R
un
Bel
mon
t/Po
tom
ac
Dal
e
Old
Bri
dge
Fore
st
Park
Very satisfied (8-10) 82% 71% 71% 71% 69% 68% 58%
Satisfied (5-7) 17% 28% 22% 26% 28% 27% 33%
Dissatisfied (0-4) 1% 1% 7% 4% 2% 5% 9%= significant difference among regions
Q2E. [Base: Total respondents excluding “Not sure”/Refused responses] How satisfied are you that the Prince William Police Department provides adequateinformation and crime prevention programs? Please use a 0 to 10 scale, where 0 means completely dissatisfied and 10 means completely satisfied.
BCDEFG
G
EFG
Due to weighting and rounding percentages may not add to 100%.
G

56
65%
71%
78%
27%
26%
22%
8%
3%
1%
Age 18-34(n=204)
Age 35-54(n=280)
Age 55+(n=168)
Very satisfied (8-10) Satisfied (5-7) Dissatisfied (0-4)
Information & Crime Prevention Programs – by Age
• Just as with the previously discussed metrics, residents’ satisfaction that the Prince William County Police Department provides adequate information and crime prevention programs is directly proportional to their age, meaning that those in older categories are more likely to express positive opinions on this matter.
– To illustrate, 78% of residents age 55+ are very satisfied with the information and crime prevention programs, as compared to 71% of those age 35-54 and 65% of those age 18-34.
– On the flip side, the youngest resident segment is most inclined to feel dissatisfied. Specifically, 8% of those age 18-34 voice negative sentiments, vs. 3% of those age 35-54 and only 1% of those age 55+.
Q2E. [Base: Total respondents excluding “Not sure”/Refused responses] How satisfied are you that the Prince William Police Department provides adequateinformation and crime prevention programs? Please use a 0 to 10 scale, where 0 means completely dissatisfied and 10 means completely satisfied.
AVG
7.9
8.1
8.6<
A
B
C A
BC
AB
C
= significant difference among respondent segments Due to weighting and rounding percentages may not add to 100%.

57
AVG
7.9
8.2
8.2
8.4
63%
70%
74%
75%
28%
26%
23%
24%
9%
4%
3%
2%
0-5 years(n=136)
6-15 years(n=210)
16-25 years(n=185)
26+ years(n=125)
Very satisfied (8-10) Satisfied (5-7) Dissatisfied (0-4)
CD
Information & Crime Prevention Programs – by Length of Residency
• As with previous metrics, residents with the longest tenure in the County (26+ years) are most inclined to be very satisfied that Prince William Police Department provides adequate information and crime prevention programs.
– Three-quarters (75%) of the most tenured segment is very satisfied with this aspect, as compared to less than two-thirds (63%) of those who have arrived 5 years ago or more recently.
– Conversely, at 9%, residents with the shortest tenure (5 years or less) are the most likely respondent category to rate the Department’s programs as 0-4 on the 10-point scale.
Q2E. [Base: Total respondents excluding “Not sure”/Refused responses] How satisfied are you that the Prince William Police Department provides adequateinformation and crime prevention programs? Please use a 0 to 10 scale, where 0 means completely dissatisfied and 10 means completely satisfied.
= significant difference among respondent segments
A
B
C
D AA
A
Due to weighting and rounding percentages may not add to 100%.
58
Information & Crime Prevention Programs – by Education
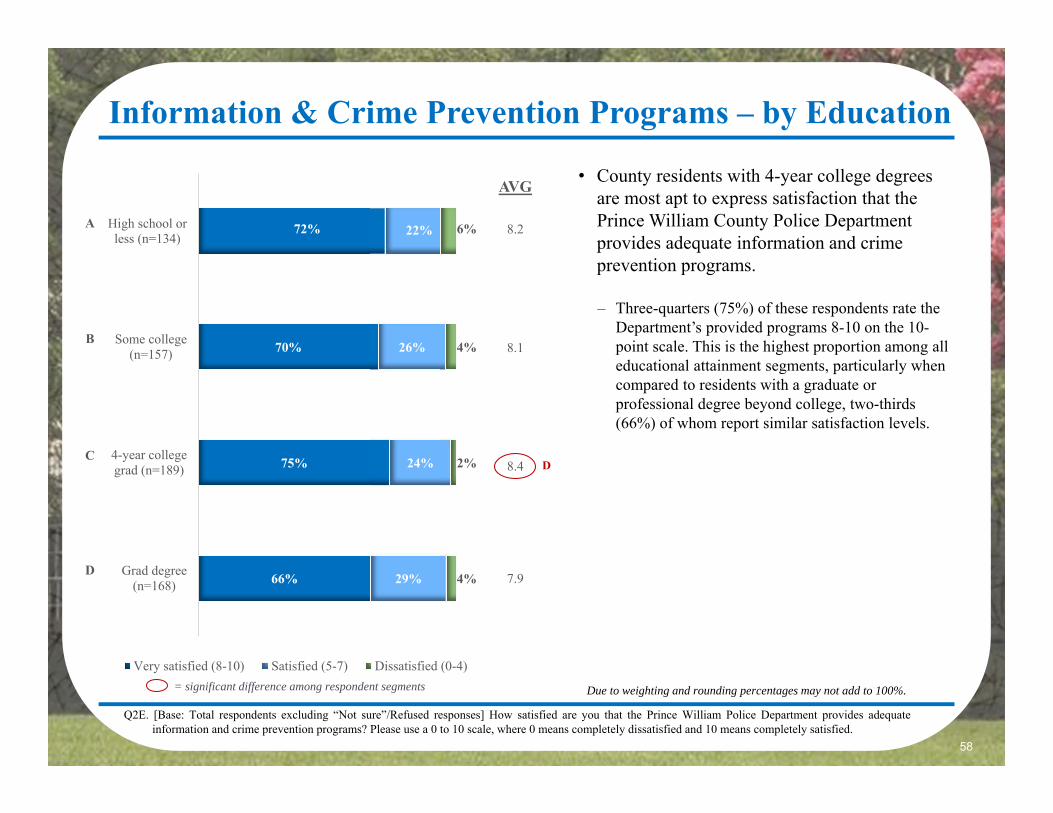
• County residents with 4-year college degrees are most apt to express satisfaction that the Prince William County Police Department provides adequate information and crime prevention programs.
– Three-quarters (75%) of these respondents rate the Department’s provided programs 8-10 on the 10-point scale. This is the highest proportion among all educational attainment segments, particularly when compared to residents with a graduate or professional degree beyond college, two-thirds (66%) of whom report similar satisfaction levels.
Q2E. [Base: Total respondents excluding “Not sure”/Refused responses] How satisfied are you that the Prince William Police Department provides adequateinformation and crime prevention programs? Please use a 0 to 10 scale, where 0 means completely dissatisfied and 10 means completely satisfied.
= significant difference among respondent segments
AVG
8.2
8.1
8.4
7.9
72%
70%
75%
66%
22%
26%
24%
29%
6%
4%
2%
4%
High school orless (n=134)
Some college(n=157)
4-year collegegrad (n=189)
Grad degree(n=168)
Very satisfied (8-10) Satisfied (5-7) Dissatisfied (0-4)
A
B
C
D
D
Due to weighting and rounding percentages may not add to 100%.

59
A
B
C
D
E
Information & Crime Prevention Programs – by Ethnicity
Q2E. [Base: Total respondents excluding “Not sure”/Refused responses] How satisfied are you that the Prince William Police Department provides adequateinformation and crime prevention programs? Please use a 0 to 10 scale, where 0 means completely dissatisfied and 10 means completely satisfied.
AVG
8.5
8.2
8.4
8.0
7.3
77%
75%
71%
69%
52%
22%
19%
30%
23%
38%
1%
6%
9%
10%
Caucasian(n=353)
Mixed (n=38)
Asian (n=49)
Hispanic(n=134)
AfricanAmerican(n=116)
Very satisfied (8-10) Satisfied (5-7) Dissatisfied (0-4)
E
DE
= significant difference among respondent segments
E
DE
E
ABD A
E
Due to weighting and rounding percentages may not add to 100%.
A
• As with the previously discussed metrics mirroring 2018 results, Caucasian residents are most likely to be very satisfied that the Police Department provides adequate information and crime prevention programs. – Over three quarters of Caucasians (77%), and Mixed
Ethnicity (75%) residents are very satisfied with this service aspect, as compared to 69% of Hispanics and 52% of African Americans.
• At the same time, African American and Hispanic residents are most apt to express dissatisfaction with the Department’s programs.– A total of 10% of African Americans and 9% of Hispanics
give this metric rating of 0-4 on the 10-point scale, as opposed to 0% of Asians and only 1% of Caucasians.

60
Information & Crime Prevention Programs – by Income
Q2E. [Base: Total respondents excluding “Not sure”/Refused responses] How satisfied are you that the Prince William Police Department provides adequateinformation and crime prevention programs? Please use a 0 to 10 scale, where 0 means completely dissatisfied and 10 means completely satisfied.
= significant difference among respondent segments
AVG
8.4
7.9
8.1
8.3
75%
68%
69%
72%
22%
25%
26%
27%
3%
7%
5%
1%
<$50K(n=119)
$50K-<$100K(n=167)
$100K-<$150K(n=118)
$150K+(n=142)
Very satisfied (8-10) Satisfied (5-7) Dissatisfied (0-4)
A
B
C
D
D
D
• County residents with the lowest income level (under $50K per year) are most apt to be very satisfied with the Police Department’s information and crime prevention programs.
– To illustrate, three quarters of residents (75%) representing this segment rate the Department as 8-10 on the 10-point satisfaction scale. This is higher than the middle income categories of $50K-<$100K (68%) and $100K-<$150K (69%), as well as the top income category of $150K+ per year (72%).
– At the same time, those with middle income levels are most likely to voice dissatisfaction with this service aspect. Specifically, 7% of those earning $50K-<$100K per year and 5% of those earning $100K-<$150K per year rate the provided programs as 4 or less on the 10-point scale.
– In comparison, only 3% of the lowest income (<$50K) residents and 1% of the top income ($150K+) residents share these views.
Due to weighting and rounding percentages may not add to 100%.

61
7. Police Attitudes& Behaviors

62
Q2F. [Base: Total respondents excluding “Not sure”/Refused responses] How satisfied are you that the Prince William’s Police display positive attitudes andbehaviors towards residents? Please use a 0 to 10 scale, where 0 means completely dissatisfied and 10 means completely satisfied.
Police Attitudes & Behaviors• Residents’ satisfaction that the Prince William
County Police display positive attitudes and behaviors towards them has also improved, with 96% expressing positive views on this metric.
– This 4-point lift is attributable to a drop in the proportion of dissatisfied residents, from 8% in 2018 to 4% in 2020.
– The impressive uptick in the average score, from 7.9 to 8.6 on the 10-point scale, is driven by a shift from “satisfied” responses (a 10-point drop) to “very satisfied” responses (a 14-point gain).
8% 4%
25%
15%
67%
81%
2018 (n=1550) 2020 (n=747)
Dissatisfied (0-4) Satisfied (5-7) Very satisfied (8-10)
AVG 7.9 8.6
Overall Satisfied 92% 96%
Due to weighting and rounding percentages may not add to 100%.
63
A
B
C
D
E
F
G
72%
87%
65%
86%
66%
82%
73%
82%
64%
79%
67%
78%
65%
73%
Hoadly 2018 (n=169)
Hoadly 2020 (n=82)
Battlefield 2018 (n=252)
Battlefield 2020 (n=124)
Broad Run 2018 (n=237)
Broad Run 2020 (n=119)
Dale 2018 (n=253)
Dale 2020 (n=123)
Belmont/Potomac 2018(n=232)
Belmont/Potomac 2020(n=112)
Old Bridge 2018 (n=208)
Old Bridge 2020 (n=94)
Forest Park 2018 (n=196)
Forest Park 2020 (n=88)
Police Attitudes & Behaviors: Very Satisfied (8-10) by Region AVG
8.2
8.8
7.7
8.9
7.8
8.6
8.1
8.4
7.9
8.6
8.0
8.3
7.7
8.1
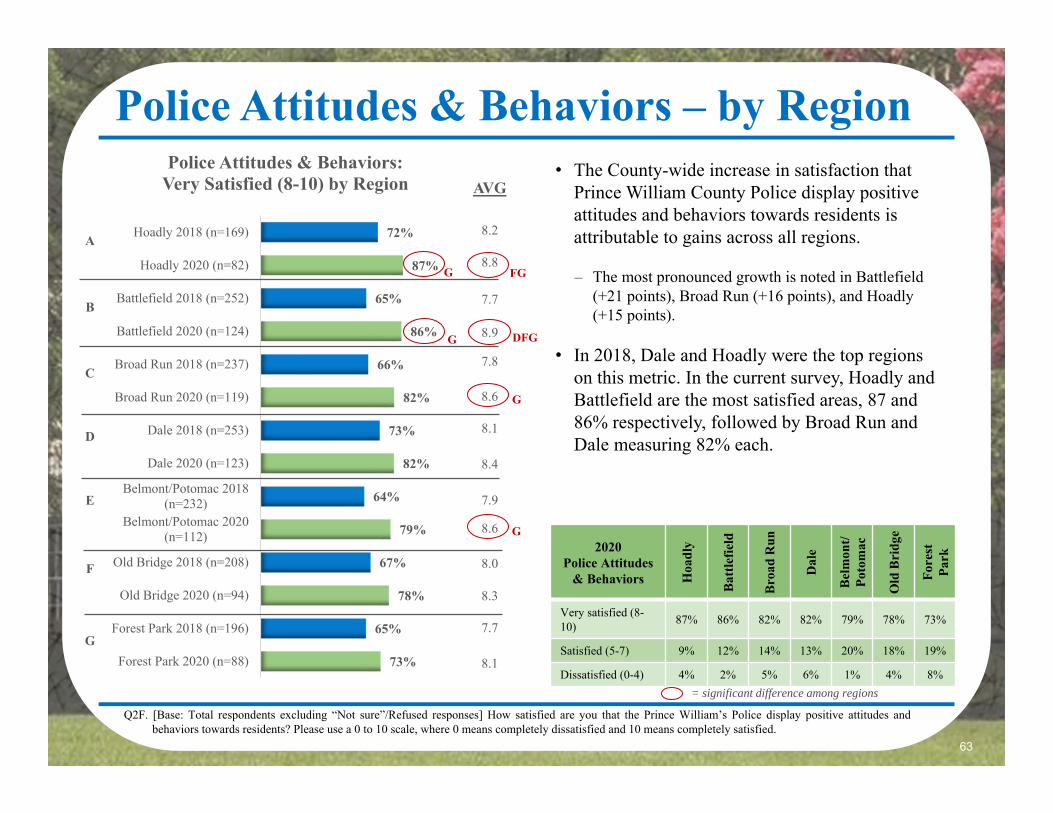
Police Attitudes & Behaviors – by Region• The County-wide increase in satisfaction that
Prince William County Police display positive attitudes and behaviors towards residents is attributable to gains across all regions.
– The most pronounced growth is noted in Battlefield (+21 points), Broad Run (+16 points), and Hoadly(+15 points).
• In 2018, Dale and Hoadly were the top regions on this metric. In the current survey, Hoadly and Battlefield are the most satisfied areas, 87 and 86% respectively, followed by Broad Run and Dale measuring 82% each.
2020 Police Attitudes
& Behaviors Hoa
dly
Bat
tlefie
ld
Bro
ad R
un
Dal
e
Bel
mon
t/Po
tom
ac
Old
Bri
dge
Fore
st
Park
Very satisfied (8-10) 87% 86% 82% 82% 79% 78% 73%
Satisfied (5-7) 9% 12% 14% 13% 20% 18% 19%
Dissatisfied (0-4) 4% 2% 5% 6% 1% 4% 8%= significant difference among regions
Q2F. [Base: Total respondents excluding “Not sure”/Refused responses] How satisfied are you that the Prince William’s Police display positive attitudes andbehaviors towards residents? Please use a 0 to 10 scale, where 0 means completely dissatisfied and 10 means completely satisfied.
DFG
FGG
G
G
G

64
AVG
8.2
8.7
8.8
Police Attitudes & Behaviors – by Age• In keeping with the established pattern,
residents’ satisfaction that the Prince William County Police display positive attitudes and behaviors towards them is directly proportional to their age, meaning that those in older categories are more likely to express positive opinions on this matter.
– To illustrate, approximately nine-in-ten residents age 55+ (88%) are very satisfied with this aspect, as compared to 86% of those age 35-54 and 71% of those age 18-34.
– Conversely, the youngest resident segment is most inclined to feel dissatisfied. Specifically, 6% of those age 18-34 voice negative sentiments, vs. 3% of their older counterparts.
= significant difference among respondent segments
Q2F. [Base: Total respondents excluding “Not sure”/Refused responses] How satisfied are you that the Prince William’s Police display positive attitudes andbehaviors towards residents? Please use a 0 to 10 scale, where 0 means completely dissatisfied and 10 means completely satisfied.
71%
86%
88%
23%
12%
10%
6%
3%
3%
Age 18-34(n=236)
Age 35-54(n=314)
Age 55+(n=191)
Very satisfied (8-10) Satisfied (5-7) Dissatisfied (0-4)
BC
A
B
C
A
A
A
A
BC
Due to weighting and rounding percentages may not add to 100%.

65
Police Attitudes & Behaviors – by Length of Residency
• As with previous metrics, citizens with the longest tenure in the area (26+ years) are most to be very satisfied that Prince William County Police display positive attitudes and behaviors towards residents.
– Close to nine-in-ten (87%) of the most tenured residents are very satisfied with this aspect, which is significantly higher than the 77% noted among those living in the County for the past 16-25 years.
– Interestingly, the highest proportion of dissatisfied respondents (5%) is observed among those with 16-25 year tenure.
= significant difference among respondent segments
Q2F. [Base: Total respondents excluding “Not sure”/Refused responses] How satisfied are you that the Prince William’s Police display positive attitudes andbehaviors towards residents? Please use a 0 to 10 scale, where 0 means completely dissatisfied and 10 means completely satisfied.
AVG
8.6
8.6
8.3
8.9
83%
81%
77%
87%
13%
15%
18%
12%
5%
3%
5%
2%
0-5 years(n=152)
6-15 years(n=227)
16-25 years(n=223)
26+ years(n=143)
Very satisfied (8-10) Satisfied (5-7) Dissatisfied (0-4)
A
B
C
D
BCC
D D
Due to weighting and rounding percentages may not add to 100%.

66
Police Attitudes & Behaviors – by Education• County residents with graduate or professional
degrees beyond college are the least likely segment to feel dissatisfied with the Police officers’ attitudes and behaviors towards citizens.
– Only 1% of this segment report ratings of 0-4 on the 10-point scale, as compared to 4% among 4-year college graduates, 6% among those with some college and 5% among those with a high school diploma or less.
= significant difference among respondent segments
Q2F. [Base: Total respondents excluding “Not sure”/Refused responses] How satisfied are you that the Prince William’s Police display positive attitudes andbehaviors towards residents? Please use a 0 to 10 scale, where 0 means completely dissatisfied and 10 means completely satisfied.
AVG
8.7
8.4
8.6
8.7
81%
79%
82%
83%
14%
15%
14%
16%
5%
6%
4%
1%
High school orless (n=148)
Some college(n=179)
4-year collegegrad (n=225)
Grad degree(n=184)
Very satisfied (8-10) Satisfied (5-7) Dissatisfied (0-4)
A
B
C
D B
D
D
D
Due to weighting and rounding percentages may not add to 100%.

67
Police Attitudes & Behaviors – by Ethnicity
Q2F. [Base: Total respondents excluding “Not sure”/Refused responses] How satisfied are you that the Prince William’s Police display positive attitudes andbehaviors towards residents? Please use a 0 to 10 scale, where 0 means completely dissatisfied and 10 means completely satisfied.
A
B
C
D
E
AVG
8.9
8.7
8.4
8.0
8.1
87%
86%
77%
75%
70%
10%
12%
18%
18%
25%
3%
3%
5%
8%
5%
Caucasian(n=402)
Asian (n=53)
Hispanic(n=146)
Mixed (n=39)
AfricanAmerican(n=143)
Very satisfied (8-10) Satisfied (5-7) Dissatisfied (0-4)
A
E
AB
CDECE
= significant difference among respondent segments Due to weighting and rounding percentages may not add to 100%.
• At 87%, Caucasian and 86%, Asian respondents are most likely to be very satisfied that the Police display positive attitudes and behaviors towards residents. This result is consistent with the previously discussed metrics, as well as with the 2018 trends.
• At the same time, African American, Hispanic and Mixed Ethnicity residents are most apt to award the County’s Police officers lukewarm ratings of 5-7 on the 10-point scale.– A quarter (25%) of African Americans and 18% of Hispanics
and Mixed Ethnicity are only satisfied with this metric, as opposed to 10% of Caucasians and 12% of Asians.
• Similar pattern of results were observed in 2018.

68
8. Animal Control
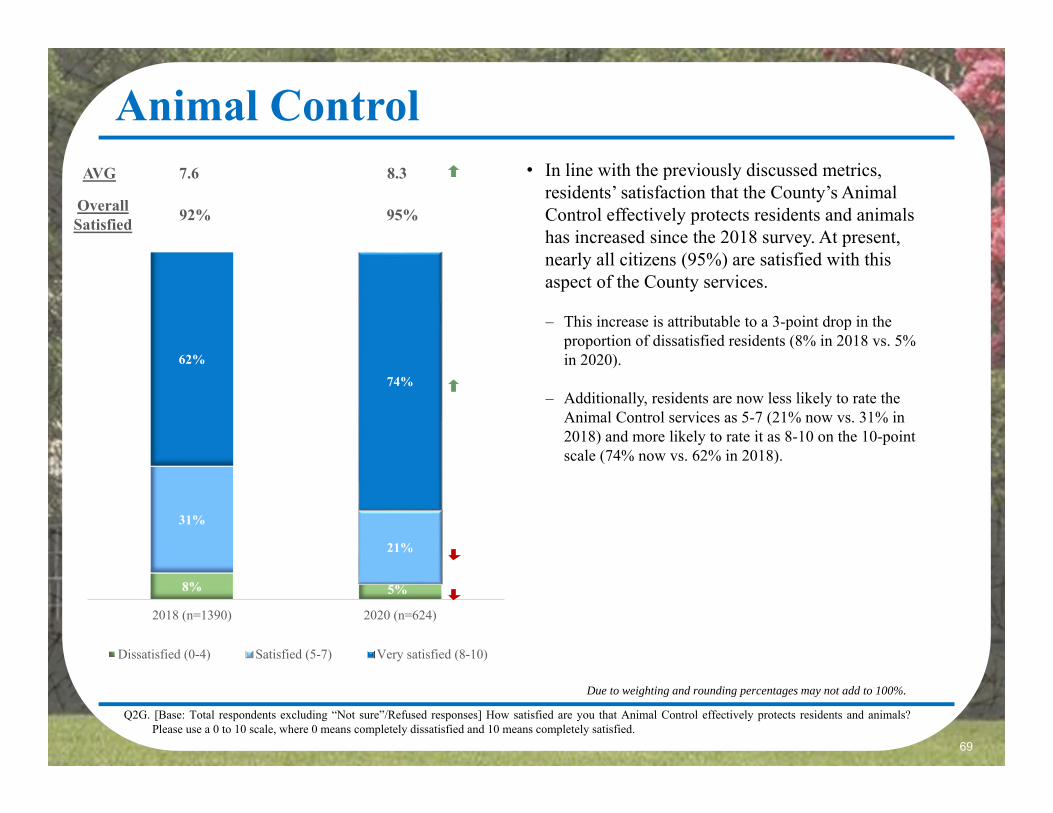
69
Q2G. [Base: Total respondents excluding “Not sure”/Refused responses] How satisfied are you that Animal Control effectively protects residents and animals?Please use a 0 to 10 scale, where 0 means completely dissatisfied and 10 means completely satisfied.
Animal Control• In line with the previously discussed metrics,
residents’ satisfaction that the County’s Animal Control effectively protects residents and animals has increased since the 2018 survey. At present, nearly all citizens (95%) are satisfied with this aspect of the County services.
– This increase is attributable to a 3-point drop in the proportion of dissatisfied residents (8% in 2018 vs. 5% in 2020).
– Additionally, residents are now less likely to rate the Animal Control services as 5-7 (21% now vs. 31% in 2018) and more likely to rate it as 8-10 on the 10-point scale (74% now vs. 62% in 2018).
8% 5%
31%
21%
62%
74%
2018 (n=1390) 2020 (n=624)
Dissatisfied (0-4) Satisfied (5-7) Very satisfied (8-10)
AVG 7.6 8.3
Overall Satisfied 92% 95%
Due to weighting and rounding percentages may not add to 100%.

70
A
B
C
D
E
F
G
61%
84%
58%
82%
66%
74%
66%
73%
60%
71%
62%
69%
60%
63%
Broad Run 2018 (n=210)
Broad Run 2020 (n=102)
Battlefield 2018 (n=227)
Battlefield 2020 (n=101)
Hoadly 2018 (n=158)
Hoadly 2020 (n=63)
Dale 2018 (n=229)
Dale 2020 (n=96)
Belmont/Potomac 2018 (n=203)
Belmont/Potomac 2020 (n=99)
Old Bridge 2018 (n=184)
Old Bridge 2020 (n=80)
Forest Park 2018 (n=175)
Forest Park 2020 (n=78)
Animal Control: Very Satisfied (8-10) by Region AVG
7.6
8.7
7.2
8.8
7.8
8.4
7.7
8.3
7.9
8.3
7.7
8.0
7.5
7.8
Animal Control – by Region• The overall increase in satisfaction that Animal
Control effectively protects residents and animals in the County is driven by gains across all regions, and particularly by the substantial lifts in Battlefield (+24 points) and Broad Run (+23 points).
– In the 2018 survey iteration, there were no noteworthy differences among satisfaction levels noted across the regions. In 2020, however, Broad Run and Battlefield are the obvious leaders on this metric, with more than eight-in-residents (84% and 82%, respectively) reporting they are very satisfied.
2020 Animal Control
Bro
ad R
un
Bat
tlefie
ld
Hoa
dly
Dal
e
Bel
mon
t/Po
tom
ac
Old
Bri
dge
Fore
st
Park
Very satisfied (8-10) 84% 82% 74% 73% 71% 69% 63%
Satisfied (5-7) 14% 16% 23% 20% 24% 24% 30%
Dissatisfied (0-4) 3% 2% 3% 7% 5% 7% 7%
= significant difference among regions
Q2G. [Base: Total respondents excluding “Not sure”/Refused responses] How satisfied are you that Animal Control effectively protects residents and animals?Please use a 0 to 10 scale, where 0 means completely dissatisfied and 10 means completely satisfied.
DEFGDEFG
EFG ADEFG
G

71
Animal Control – by Ethnicity• In keeping with the already established pattern,
Caucasian residents of Prince William County are among the most likely to be very satisfied that Animal Control effectively protects residents and animals. This high satisfaction level is shared with the Hispanic residents as well.
– A rating of just over or at three-quarters showing most of the Prince William County residents are very satisfied with this aspect of the County services. This result is higher than the 67% recorded among African American residents.
= significant difference among respondent segments
Q2G. [Base: Total respondents excluding “Not sure”/Refused responses] How satisfied are you that Animal Control effectively protects residents and animals?Please use a 0 to 10 scale, where 0 means completely dissatisfied and 10 means completely satisfied.
A
B
C
D
E
AVG
8.5
8.3
8.6
8.0
7.9
76%
76%
75%
75%
67%
20%
19%
25%
19%
25%
4%
5%
6%
9%
Caucasian(n=329)
Hispanic(n=131)
Asian (n=45)
Mixed (n=33)
AfricanAmerican(n=114)
Very satisfied (8-10) Satisfied (5-7) Dissatisfied (0-4)
E
Due to weighting and rounding percentages may not add to 100%.

72
9. Neighborhood Safety

73
Q2H. [Base: Total respondents excluding “Not sure”/Refused responses] How satisfied are you that you feel safe in your neighborhood? Please use a 0 to 10 scale,where 0 means completely dissatisfied and 10 means completely satisfied.
Neighborhood Safety• The overwhelming majority of Prince William
County residents feel safe in their neighborhoods. This metric has increased by 2 points since 2018, which is a continuation of an upward trend noted in the previous survey.
– The observed lift is a result of a simultaneous drop in dissatisfaction (5% in 2018 and 2% in 2020) and an uptick among those very satisfied (81% in 2018 and 84% now).
– The resulting average rating of 8.8 on a 10-point scale is an important indicator of a healthy, safe community.
5% 2%
15%14%
81% 84%
2018 (n=1595) 2020 (n=824)
Dissatisfied (0-4) Satisfied (5-7) Very satisfied (8-10)
AVG 8.5 8.8
Overall Satisfied 96% 98%
Due to weighting and rounding percentages may not add to 100%.

74
AVG
8.8
9.5
8.8
8.9
8.4
8.9
8.4
8.8
8.3
8.6
8.5
8.4
8.4
8.5
A
B
C
D
E
F
G
85%
88%
88%
81%
87%
76%
84%
74%
81%
81%
78%
81%
76%
Battlefield 2018 (n=266)
Battlefield 2020 (n=136)
Hoadly 2018 (n=174)
Hoadly 2020 (n=89)
Old Bridge 2018 (n=213)
Old Bridge 2020 (n=110)
Broad Run 2018 (n=247)
Broad Run 2020 (n=126)
Belmont/Potomac 2018(n=236)
Belmont/Potomac 2020(n=123)
Dale 2018 (n=261)
Dale 2020 (n=134)
Forest Park 2018 (n=194)
Forest Park 2020 (n=101)
Neighborhood Safety: Very Satisfied (8-10) by Region
Neighborhood Safety – by Region• The County-wide lift in the perception of safety of
the immediate neighborhood is driven by upticks in regions such as Battlefield (+10 points), Broad Run (+8 points), and Belmont/Potomac and Old Bridge (+6 points each).
• Despite the overall gains on this metric, two areas experience declines. These include Forest Park (-5 points) and Dale (-3 points).
• In 2018, Hoadly and Battlefield were the top regions in terms of satisfaction with neighborhood safety. This year that trend continues with Battlefield topping of the list at a impressive 95%, followed by Hoadly (88%) and Old Bridge (87%).
2020 Neighborhood
Safety
Bat
tlefie
ld
Hoa
dly
Old
Bri
dge
Bro
ad R
un
Bel
mon
t/Po
tom
ac
Dal
e
Fore
st
Park
Very satisfied (8-10) 95% 88% 87% 84% 81% 78% 76%
Satisfied (5-7) 5% 10% 12% 14% 15% 18% 23%
Dissatisfied (0-4) - 2% 1% 2% 4% 4% 2%= significant difference among regions
Q2H. [Base: Total respondents excluding “Not sure”/Refused responses] How satisfied are you that you feel safe in your neighborhood? Please use a 0 to 10 scale,where 0 means completely dissatisfied and 10 means completely satisfied.
BCDEFGBCDEFG
FG
FG FG
95%
FG
F

75
Neighborhood Safety – by Age• At 87%, residents age 35-54 are the most
likely to be very satisfied that they feel safe in their neighborhood. This result is significantly higher than the 80% noted among the youngest respondent segment, i.e., those under the age of 35.
– In comparison, residents age 18-34 are notably more likely than those age 35-54 to rate neighborhood safety as 5-7 on the 10-point satisfaction scale.
= significant difference among respondent segments
Q2H. [Base: Total respondents excluding “Not sure”/Refused responses] How satisfied are you that you feel safe in your neighborhood? Please use a 0 to 10 scale,where 0 means completely dissatisfied and 10 means completely satisfied.
AVG
8.7
8.9
8.9
80%
87%
84%
17%
11%
14%
2%
2%
2%
Age 18-34(n=263)
Age 35-54(n=345)
Age 55+(n=211)
Very satisfied (8-10) Satisfied (5-7) Dissatisfied (0-4)
A
B
C
A
B
Due to weighting and rounding percentages may not add to 100%.

76
Neighborhood Safety – by Length of Residency• Residents who have been living in Prince
William County for at least 16 years are most likely to be very satisfied that they feel safe in their neighborhood.
– At 87 - 86%, those residing in the County for 16+ years are more likely to be very satisfied than those living in the area for up to 5 years (79%).
– Dissatisfaction levels are very low, but they peak among residents with tenures less than 16 years. A total of 3% of those respondents rate neighborhood safety as only 0-4 on the 10-point scale.
= significant difference among respondent segments
Q2H. [Base: Total respondents excluding “Not sure”/Refused responses] How satisfied are you that you feel safe in your neighborhood? Please use a 0 to 10 scale,where 0 means completely dissatisfied and 10 means completely satisfied.
AVG
8.7
8.8
8.9
9.0
79%
84%
87%
86%
18%
13%
12%
12%
3%
3%
1%
1%
0-5 years(n=178)
6-15 years(n=251)
16-25 years(n=240)
26+ years(n=156)
Very satisfied (8-10) Satisfied (5-7) Dissatisfied (0-4)
A
B
C
D A
A
Due to weighting and rounding percentages may not add to 100%.

77
Neighborhood Safety – by Education• At 88%, residents with 4-year college degrees
are the most likely segment to say they are very satisfied with their neighborhood safety.
– This result is higher than the 82% reported among respondents with graduate / professional degrees beyond college or those with a high school or less education.
= significant difference among respondent segments
Q2H. [Base: Total respondents excluding “Not sure”/Refused responses] How satisfied are you that you feel safe in your neighborhood? Please use a 0 to 10 scale,where 0 means completely dissatisfied and 10 means completely satisfied.
AVG
8.7
8.9
8.9
8.7
82%
86%
88%
82%
15%
13%
11%
16%
4%
1%
2%
2%
High school orless (n=157)
Some college(n=192)
4-year collegegrad (n=255)
Grad degree(n=208)
Very satisfied (8-10) Satisfied (5-7) Dissatisfied (0-4)
A
B
C
D
D
Due to weighting and rounding percentages may not add to 100%.
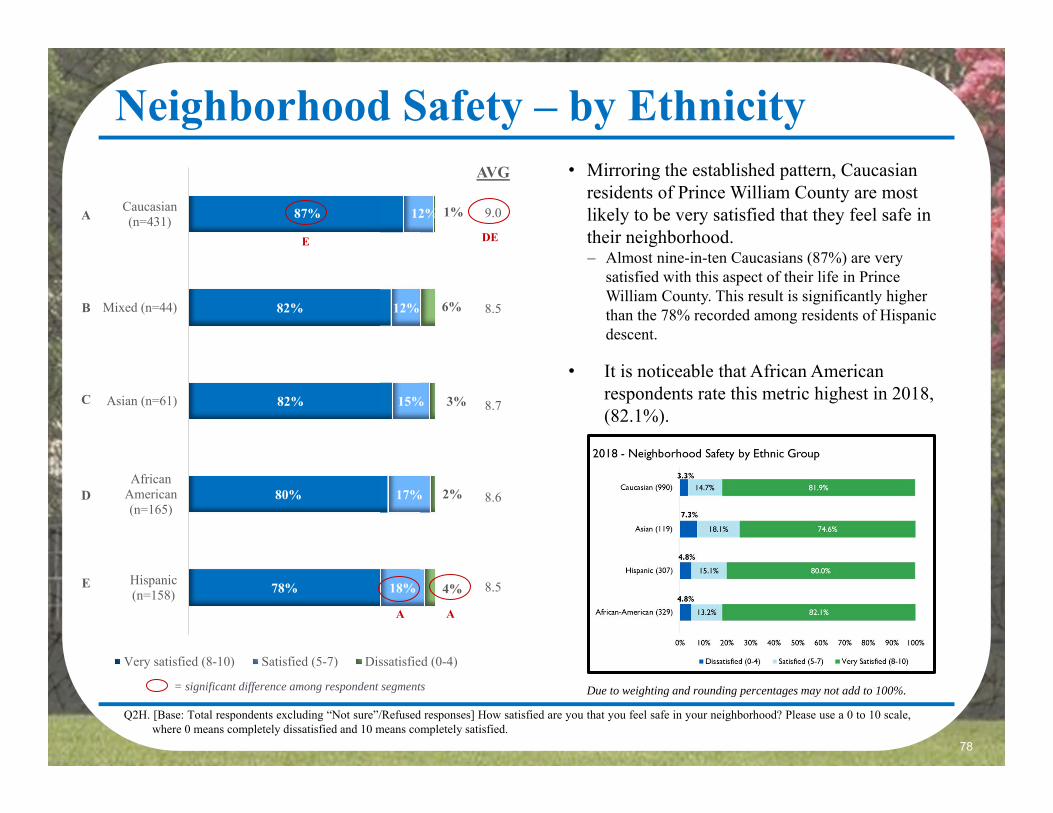
78
Neighborhood Safety – by Ethnicity
Q2H. [Base: Total respondents excluding “Not sure”/Refused responses] How satisfied are you that you feel safe in your neighborhood? Please use a 0 to 10 scale,where 0 means completely dissatisfied and 10 means completely satisfied.
• Mirroring the established pattern, Caucasian residents of Prince William County are most likely to be very satisfied that they feel safe in their neighborhood.– Almost nine-in-ten Caucasians (87%) are very
satisfied with this aspect of their life in Prince William County. This result is significantly higher than the 78% recorded among residents of Hispanic descent.
• It is noticeable that African American respondents rate this metric highest in 2018, (82.1%).
A
B
C
D
E
AVG
9.0
8.5
8.7
8.6
8.5
87%
82%
82%
80%
78%
12%
12%
15%
17%
18%
1%
6%
3%
2%
4%
Caucasian(n=431)
Mixed (n=44)
Asian (n=61)
AfricanAmerican(n=165)
Hispanic(n=158)
Very satisfied (8-10) Satisfied (5-7) Dissatisfied (0-4)
E DE
= significant difference among respondent segments
A
Due to weighting and rounding percentages may not add to 100%.
A

79
Neighborhood Safety – by Income
= significant difference among respondent segments
Q2H. [Base: Total respondents excluding “Not sure”/Refused responses] How satisfied are you that you feel safe in your neighborhood? Please use a 0 to 10 scale,where 0 means completely dissatisfied and 10 means completely satisfied.
AVG
8.6
8.6
9.0
9.0
77%
82%
88%
89%
20%
16%
11%
11%
4%
3%
1%
1%
<$50K(n=137)
$50K-<$100K(n=207)
$100K-<$150K(n=149)
$150K+(n=185)
Very satisfied (8-10) Satisfied (5-7) Dissatisfied (0-4)
A
B
C
D
• County residents in the top income brackets ($100K or more per year) are most likely to be very satisfied with their neighborhood safety.
– To illustrate, nearly nine-in-ten residents representing the $150K+ income segment (89%) rate the safety of their neighborhood as 8-10 on the 10-point satisfaction scale, and 88% of those with incomes ranging from $100K to $150K feel the same way.
– In comparison, just over three-quarters (77%) of residents with incomes below $50K are very satisfied with their neighborhood safety.
– The impressive average ratings of this metric noted in the $100K+ segments (9.0 on the 10-point scale) are some of the highest in this year’s study.
AB
AB
CD
A
AB
Due to weighting and rounding percentages may not add to 100%.

80
10. Safety in Commercial Areas of Prince William County

81
Q2I. [Base: Total respondents excluding “Not sure”/Refused responses] How satisfied are you that you feel safe when visiting commercial areas in Prince WilliamCounty? Please use a 0 to 10 scale, where 0 means completely dissatisfied and 10 means completely satisfied.
Safety in Commercial Areas• Residents feel safer now in commercial areas of the
County than they did two years ago.
– At present, an impressive 98% of respondents are satisfied that they feel safe when visiting commercial areas, compared to 96% noted in 2018.
– This result is attributable to further reduction in the proportion of dissatisfied residents (4% in 2018 vs. 2% now). Additionally, there has been some reshuffling in the overall satisfied category, with more residents now giving the response of very satisfied (a 9-point gain) and fewer saying they are just satisfied (a 6-point drop).
• Unlike with metrics discussed earlier in this report, no statistically significant differences among demographic segments are observed.
– While in 2018 Asian residents were the most likely to feel less safe when visiting commercial areas in Prince William County, this is no longer the case.
4% 2%
26%19%
70%79%
2018 (n=1588) 2020 (n=816)
Dissatisfied (0-4) Satisfied (5-7) Very satisfied (8-10)
AVG 8.1 8.6
Overall Satisfied 96% 98%
Due to weighting and rounding percentages may not add to 100%.

82
68%
87%
72%
84%
71%
78%
71%
78%
69%
77%
76%
74%
65%
74%
Battlefield 2018 (n=264)
Battlefield 2020 (n=135)
Old Bridge 2018 (n=213)
Old Bridge 2020 (n=108)
Broad Run 2018 (n=246)
Broad Run 2020 (n=126)
Dale 2018 (n=260)
Dale 2020 (n=133)
Belmont/Potomac 2018(n=237)
Belmont/Potomac 2020(n=123)
Hoadly 2018 (n=173)
Hoadly 2020 (n=89)
Forest Park 2018 (n=191)
Forest Park 2020 (n=98)
Safety in Commercial Areas: Very Satisfied (8-10) by Region
A
B
C
D
E
F
G
AVG
7.9
8.9
8.1
8.5
8.1
8.6
8.2
8.4
8.2
8.6
8.0
8.2
8.3
8.5
Safety in Commercial Areas – by Region• The County-wide increase in residents’
satisfaction that they feel safe when visiting commercial areas in Prince William County is reflected across all but one region – Hoadly.
– In comparison to the 2018 survey, the most substantial lifts can be seen in Battlefield (+19 points), Old Bridge (+12 points), and Forest Park (+9 points).
– Hoadly shows a 2-point drop on this aspect of life in the County when compared to the 2018 results.
– Consequently, Hoadly is pushed from the top position on this metric in 2018 to next to last, while Battlefield (6th in 2018) leads the way this year.
2020 Safety in
Commercial Areas
Bat
tlefie
ld
Old
Bri
dge
Bro
ad R
un
Dal
e
Bel
mon
t/Po
tom
ac
Hoa
dly
Fore
st
Park
Very satisfied (8-10) 87% 84% 78% 78% 77% 74% 74%
Satisfied (5-7) 11% 14% 22% 20% 20% 24% 27%
Dissatisfied (0-4) 2% 2% - 2% 2% 3% -
= significant difference among regions
Q2I. [Base: Total respondents excluding “Not sure”/Refused responses] How satisfied are you that you feel safe when visiting commercial areas in Prince WilliamCounty? Please use a 0 to 10 scale, where 0 means completely dissatisfied and 10 means completely satisfied.
CDEFG BDEFG
F
Due to weighting and rounding percentages may not add to 100%.
FG
C

83
Safety in Commercial Areas – by Ethnicity • There are no significant differences in how
satisfied residence are in feeling safe when visiting commercial areas in Prince William County in 2020.
• With that said, the Asian residents (82%) are most likely to say they are very satisfied with this aspect of their life in Prince William County. Interestingly, this result is the opposite ranking for Asians in 2018 where they were the least likely to be very satisfied.
A
B
C
D
E
AVG
8.8
8.6
8.5
8.5
8.1
82%
80%
79%
77%
74%
18%
19%
19%
22%
21%
2%
2%
1%
5%
Asian (n=61)
Caucasian(n=429)
AfricanAmerican(n=163)
Hispanic(n=157)
Mixed (n=42)
Very satisfied (8-10) Satisfied (5-7) Dissatisfied (0-4)
Due to weighting and rounding percentages may not add to 100%.
Q2I. [Base: Total respondents excluding “Not sure”/Refused responses] How satisfied are you that you feel safe when visiting commercial areas in Prince WilliamCounty? Please use a 0 to 10 scale, where 0 means completely dissatisfied and 10 means completely satisfied.
84
11. Improvement Suggestions

85
7%
6%
6%
3%
6%
4%
4%
4%
3%
3%
17%
5%
6%
5%
4%
3%
3%
3%
2%
3%
Nothing / doing a good job / satisfied
Community outreach
More patrols day and night/more police
Improve traffic
Safety
Improve/finish/build more roads
Control crime
Driving violations/speeding
Equality
More visible presence
Improve public transportation
Improve the educational system
Stop development
Increase communication betweencommunity leaders and residents
Lower taxes
Better community planning
2018 (n=1473) 2020 (n=826)
How to Make Prince William County a Better Place to Live• When asked about the one most important thing
the Prince William County should do to make it a better place to live, the largest proportion of residents (17%) thought it is already doing a good job and nothing more was needed. – This response is now given more than twice as often as
in 2018 (17% now vs. 7% two years ago), which is consistent with the increased satisfaction observed on all metrics in the current survey iteration.
• This year, the most frequently cited suggestions for improvement included community outreach (5%), more police and patrols (6%), improved traffic (5%) and safety (4%). – The list residents came up with this year is quite
different from the one developed in 2018. This being said, traffic, roads and crime control are the issues repeated in both surveys.
3. [Base: Total respondents who gave response] What us the ONE most important thing the County should do to make Prince William County a better place to live?*Note: Responses with fewer than 3% of mentions are not shown

86
How to Make Prince William County a Better Place to Live
Battlefield(A)
Belmont/Potomac
(B)
Broad Run (C)
Dale (D)
Forest Park (E)
Hoadly(F)
Old Bridge (G)
2018
(n
=245
)
2020
(n
=137
)
2018
(n
=228
)
2020
(n
=123
)
2018
(n=2
24)
2020
(n
=127
)
2018
(n=2
48)
2020
(n=1
34)
2018
(n
=180
)
2020
(n
=101
)
2018
(n
=151
)
2020
(n
=89)
2018
(n
=194
)
2020
(n
=110
)
Nothing/doing a good job/satisfied 6% 18% 7% 20% 8% 13% 8% 18% 6% 14% 3% 11% 7% 19%
Community outreach - 8% - 5% - 5% - 6% - 4% - 8% - 3%
More patrols/more police - 4% - 8% - 7% - 9% - 5% - - - 9%
Improve traffic 5% 3% 6% 6% 6% - 4% 5% 4% 5% 10% 7% 10% 10%
Safety - 6% - 3% - 9% - - - 5% - - - 7%
Improve/finish/build more roads 7% 3% 8% 4% 4% 6% 3% - 5% 3% 8% 7% 6% -
Control crime 2% - 3% 2% 4% - 6% 3% 4% 7% - 4% 3% 3%
Driving violations/speeding - - - - - 5% - 5% - - - 4% - -
Equality - - - - - 3% - 3% - - - 4% - 3%
More visible presence - - - - - 3% - 4% - 5% - 3% - 3%
• Residents of Belmont/Potomac, Old Bridge, Battlefield, and Dale are most likely to say “nothing needs to be improved in Prince William County”, at 20%, 18%, and 19%, respectively.
• At the same time, those living in Battlefield and Hoadly are more likely than others to suggest community outreach (8%).
• Respondents representing Old Bridge, on the other hand, are most concerned with improving traffic (10%) and introducing more police patrols (9%).
How to Make Prince William County a Better Place to Live – by Region
= significant difference among regions
3. [Base: Total respondents who gave response] What us the ONE most important thing the County should do to make Prince William County a better place to live?*Note: Responses with fewer than 3% of overall mentions are not shown
A
B
AE AE AE
CF CFCFCF
87
12. Comparative Community Benchmarking

88
Community BenchmarkingSatisfaction with Police Department
Timeliness of Police
Response
Police Courteous and
Helpful
Police Treat Everyone Fairly
Display Positive
Attitude/ Behaviors
Feelings of Safety in the
Neighborhood
OverallQuality of Life
Prince William County
96 97 95 93 96 98 98
Loudon County (2018)
86 ******** ******** ******** ******** 96 87
City of Roanoke
(2019)84 ******** ******** ******** ******** 88 72
Durham County (2019)
57 ******** ******** ******** ******** 86 (Day) 60 (Night) 64
Arlington County (2018)
85 ******** ******** ******** ******** 98 (Day) 87(Night) 86
VA Beach (2019) 91 ******** ******** ******** ******** 96 93
Kansas City, MO
(2019)58 43 ******** ******** ******** 59 62
Oklahoma City, OK
(2020)71 66 ******** 88 ******** 87 (Day)
57 (Night) 70

89
Community Benchmarking – cont’d.Satisfaction with Police Department
Timeliness of Police
Response
Police Courteous and
Helpful
Police Treat Everyone Fairly
Display Positive
Attitude/ Behaviors
Feelings of Safety in the
Neighborhood
Overall Quality of Life
Portland, OR (2019) ******** ******** ******** ******** ******** 57 (Night) ********
Austin, TX (2019) 66 ******** ******** ******** ******** 89 (Day)
73 (Night) 65
Sarasota County, FL
(2020) ******** ******** ******** ******** ******** ******** 96
Dakota County, MN
(2019)70 ******** ******** ******** ******** 87 80
Miami, FL (2019) 61 ******** ******** ******** ******** ******** 54
Raleigh, NC (2018) 74 ******** ******** ******** ******** 91 (Day)
75 (Night) 90
Sacramento,CA
(2019) 50 ******** ******** ******** ******** 82 62
Arlington City, TX
(2019)81 76 ******** ******** 81 89 (Day)
54 (Night) 68
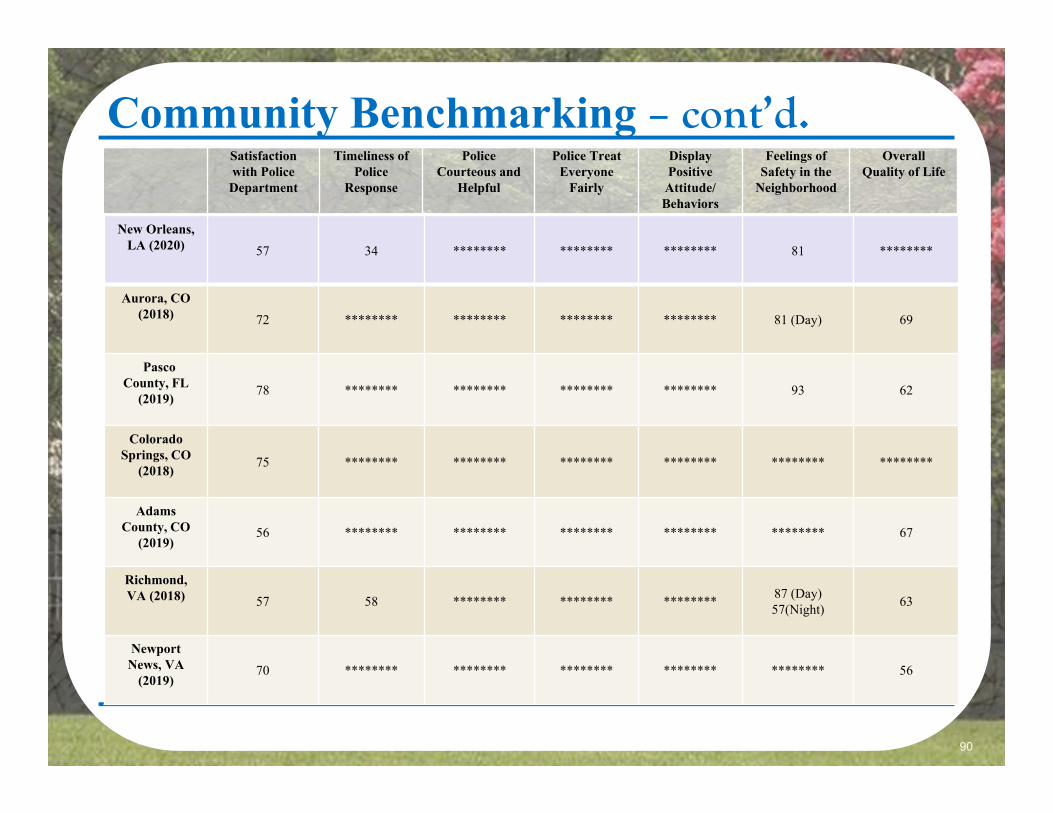
90
Community Benchmarking – cont’d.Satisfaction with Police Department
Timeliness of Police
Response
Police Courteous and
Helpful
Police Treat Everyone
Fairly
Display Positive
Attitude/ Behaviors
Feelings of Safety in the
Neighborhood
OverallQuality of Life
New Orleans, LA (2020) 57 34 ******** ******** ******** 81 ********
Aurora, CO (2018) 72 ******** ******** ******** ******** 81 (Day) 69
Pasco County, FL
(2019) 78 ******** ******** ******** ******** 93 62
Colorado Springs, CO
(2018) 75 ******** ******** ******** ******** ******** ********
Adams County, CO
(2019)56 ******** ******** ******** ******** ******** 67
Richmond,VA (2018) 57 58 ******** ******** ******** 87 (Day)
57(Night) 63
Newport News, VA
(2019)70 ******** ******** ******** ******** ******** 56
91
Appendices

92
A. Demographic Profile
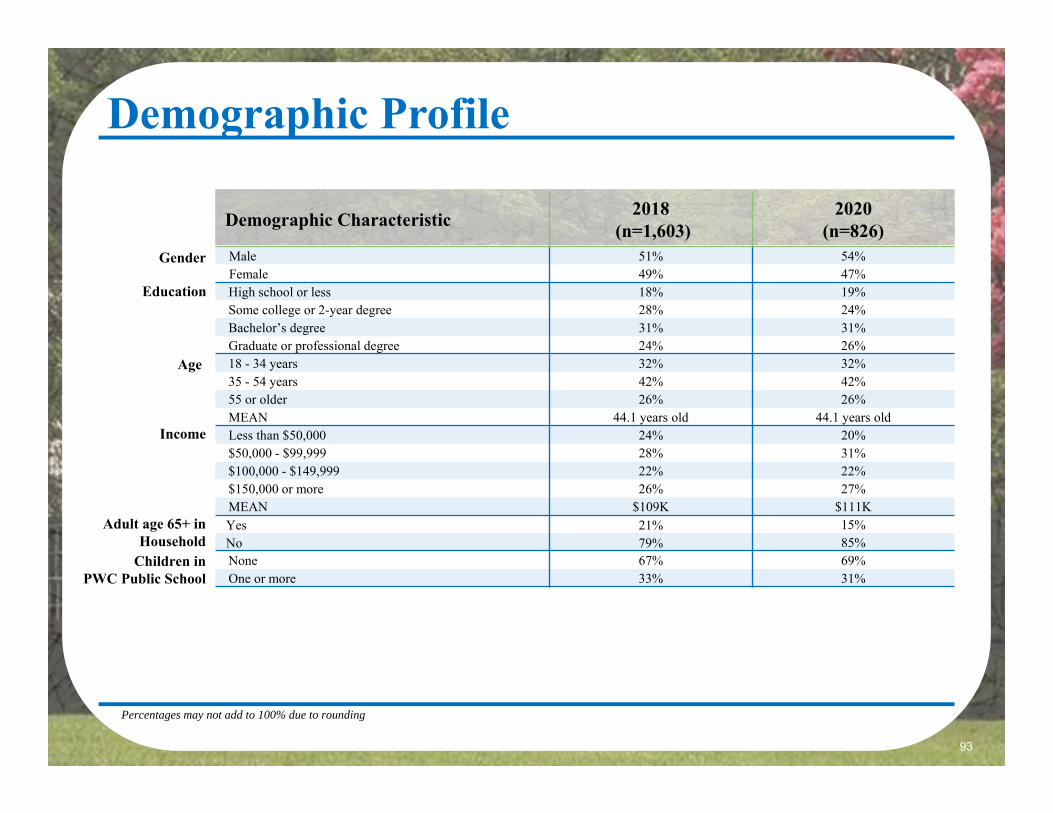
93
Demographic Profile
Percentages may not add to 100% due to rounding
Education
Gender
Age
Adult age 65+ in Household
Income
Children inPWC Public School
Demographic Characteristic 2018(n=1,603)
2020(n=826)
Male 51% 54%Female 49% 47%High school or less 18% 19%Some college or 2-year degree 28% 24%Bachelor’s degree 31% 31%Graduate or professional degree 24% 26%18 - 34 years 32% 32%35 - 54 years 42% 42%55 or older 26% 26%MEAN 44.1 years old 44.1 years oldLess than $50,000 24% 20%$50,000 - $99,999 28% 31%$100,000 - $149,999 22% 22%$150,000 or more 26% 27%MEAN $109K $111KYes 21% 15%No 79% 85%None 67% 69%One or more 33% 31%
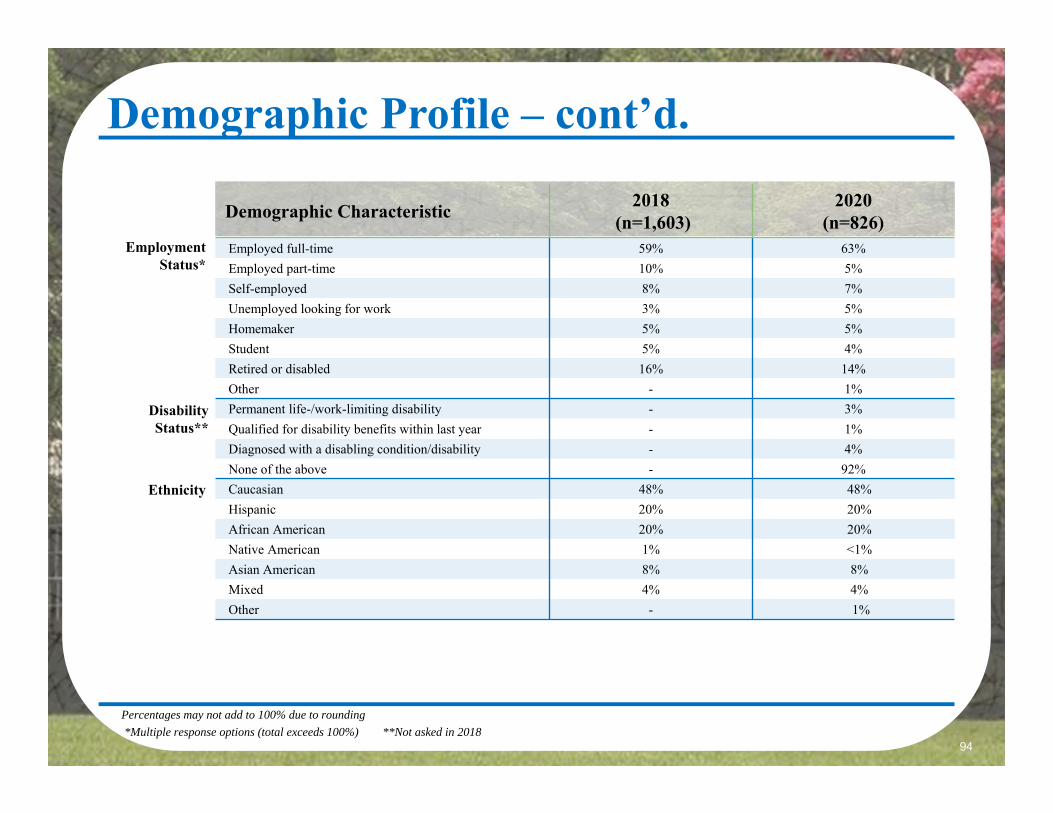
94
Demographic Characteristic 2018(n=1,603)
2020(n=826)
Employed full-time 59% 63%Employed part-time 10% 5%Self-employed 8% 7%Unemployed looking for work 3% 5%Homemaker 5% 5%Student 5% 4%Retired or disabled 16% 14%Other - 1%Permanent life-/work-limiting disability - 3%Qualified for disability benefits within last year - 1%Diagnosed with a disabling condition/disability - 4%None of the above - 92%Caucasian 48% 48%Hispanic 20% 20%African American 20% 20%Native American 1% <1%Asian American 8% 8%Mixed 4% 4%Other - 1%
Demographic Profile – cont’d.
Percentages may not add to 100% due to rounding*Multiple response options (total exceeds 100%) **Not asked in 2018
EmploymentStatus*
DisabilityStatus**
Ethnicity
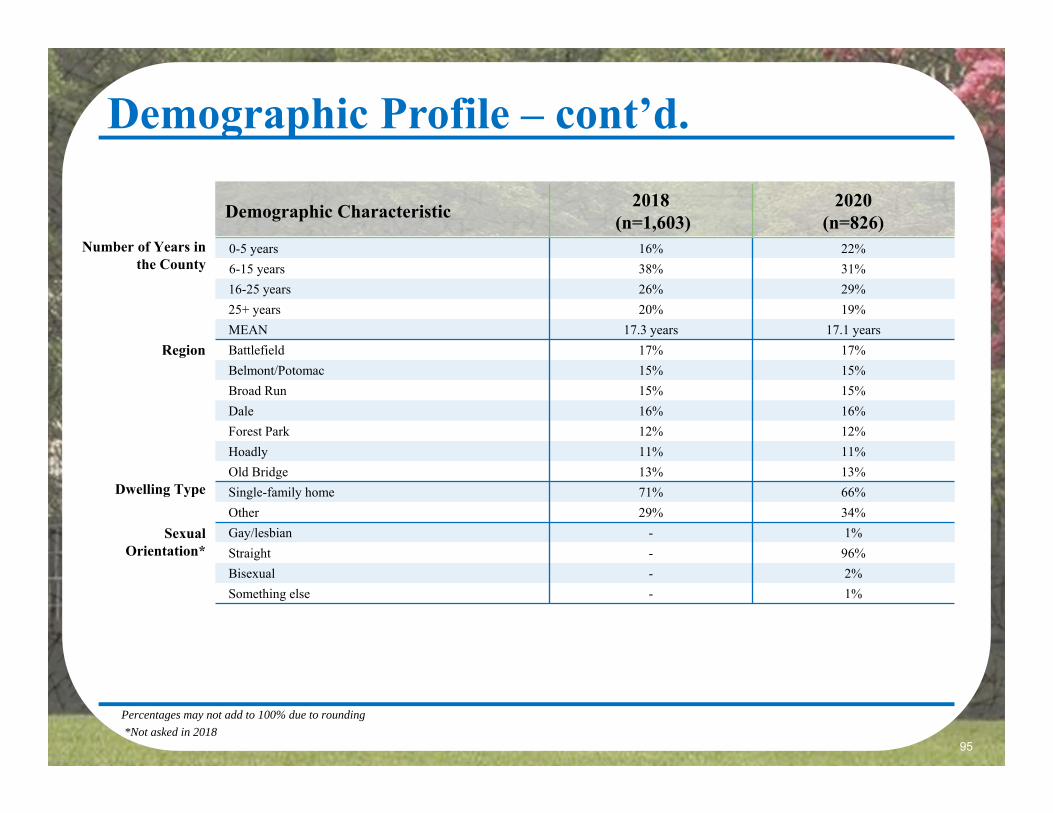
95
Demographic Characteristic 2018(n=1,603)
2020(n=826)
0-5 years 16% 22%6-15 years 38% 31%16-25 years 26% 29%25+ years 20% 19%MEAN 17.3 years 17.1 yearsBattlefield 17% 17%Belmont/Potomac 15% 15%Broad Run 15% 15%Dale 16% 16%Forest Park 12% 12%Hoadly 11% 11%Old Bridge 13% 13%Single-family home 71% 66%Other 29% 34%Gay/lesbian - 1%Straight - 96%Bisexual - 2%Something else - 1%
Demographic Profile – cont’d.
Percentages may not add to 100% due to rounding*Not asked in 2018
Number of Years in the County
Region
Dwelling Type
Sexual Orientation*
96
B. Survey Instrument
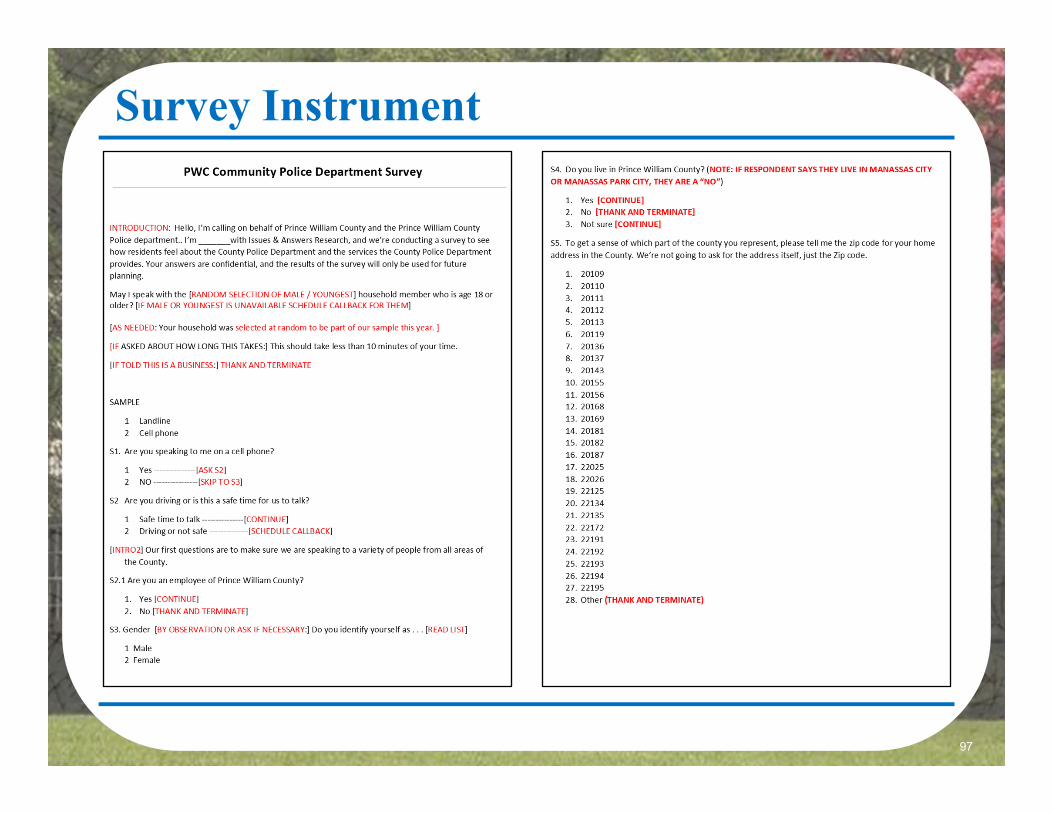
97
Survey Instrument

98
Survey Instrument – cont’d.
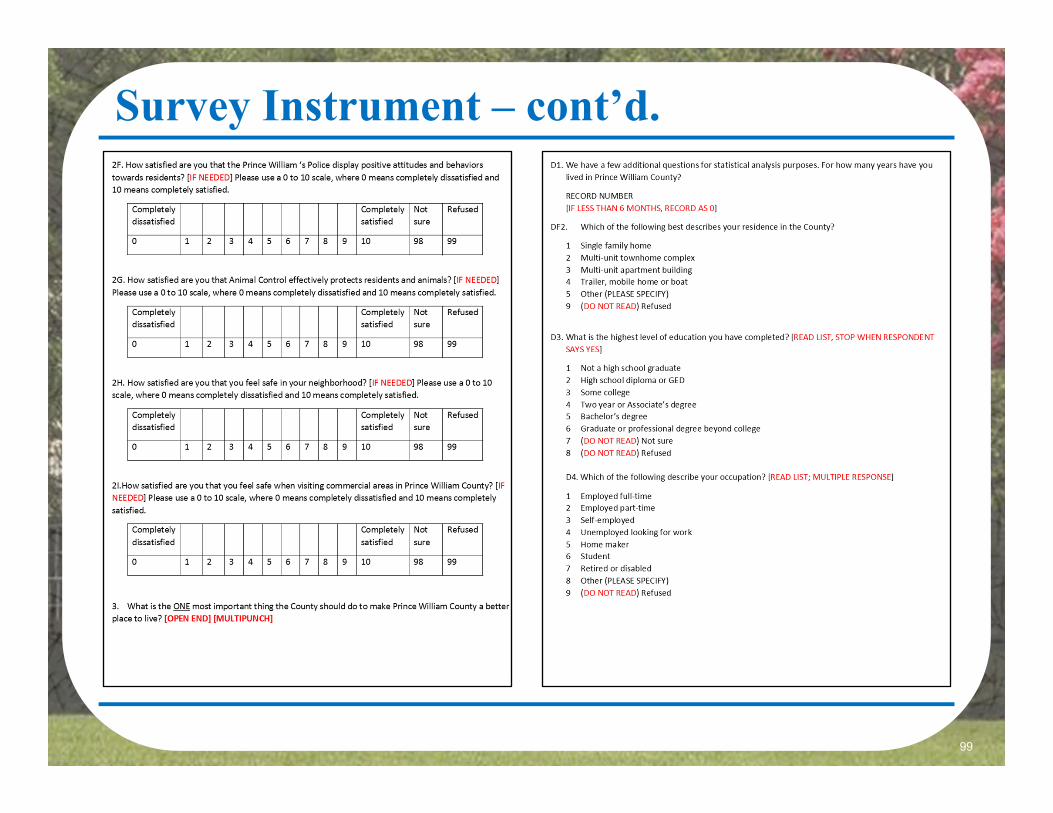
99
Survey Instrument – cont’d.

100
Survey Instrument – cont’d.