Embed Size (px)
Citation preview
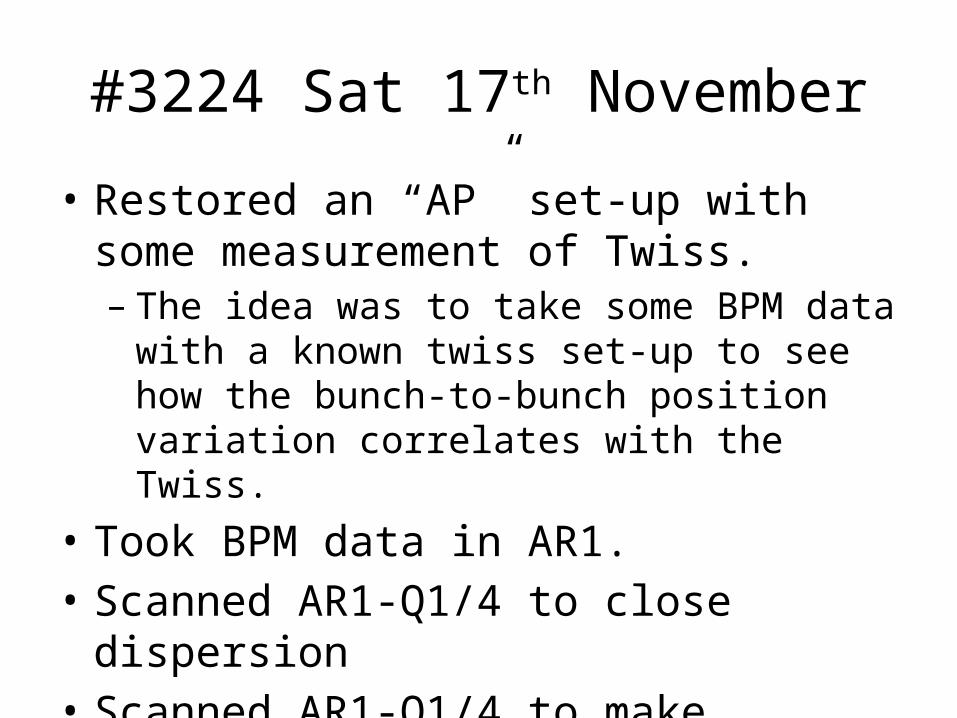
#3224 Sat 17th November
• Restored an “AP” set-up with some measurement of Twiss. – The idea was to take some BPM data with a
known twiss set-up to see how the bunch-to-bunch position variation correlates with the Twiss.
• Took BPM data in AR1.• Scanned AR1-Q1/4 to close dispersion • Scanned AR1-Q1/4 to make isochronous.
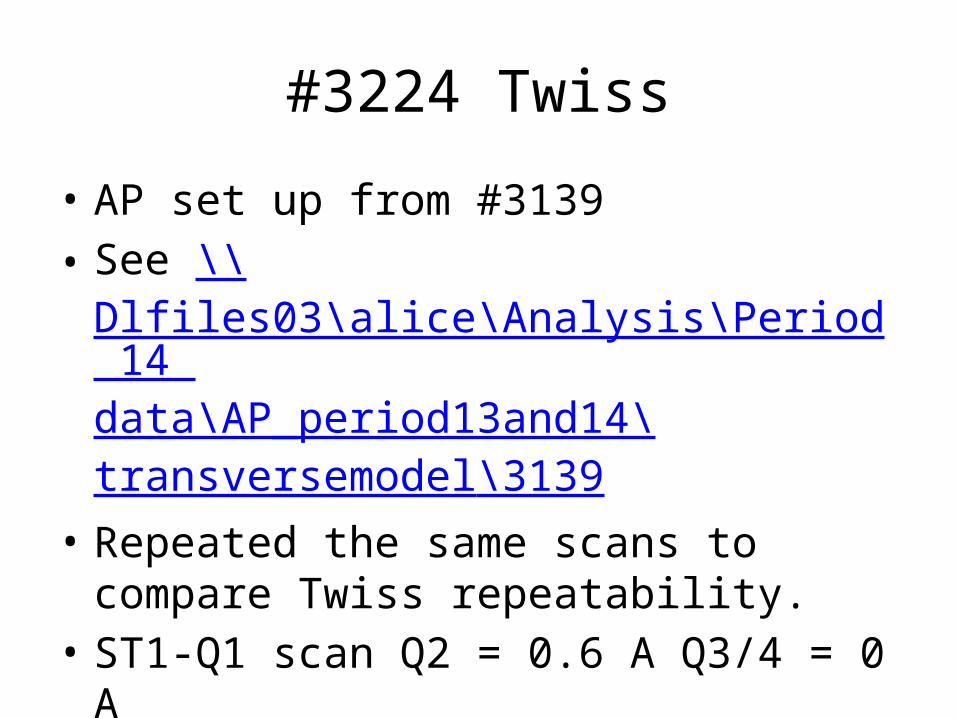
#3224 Twiss
• AP set up from #3139• See \\Dlfiles03\alice\Analysis\Period 14
data\AP_period13and14\transversemodel\3139
• Repeated the same scans to compare Twiss repeatability.
• ST1-Q1 scan Q2 = 0.6 A Q3/4 = 0 A• ST1-Q2 scan (0-1.4A) with Q1 = 0.40A.
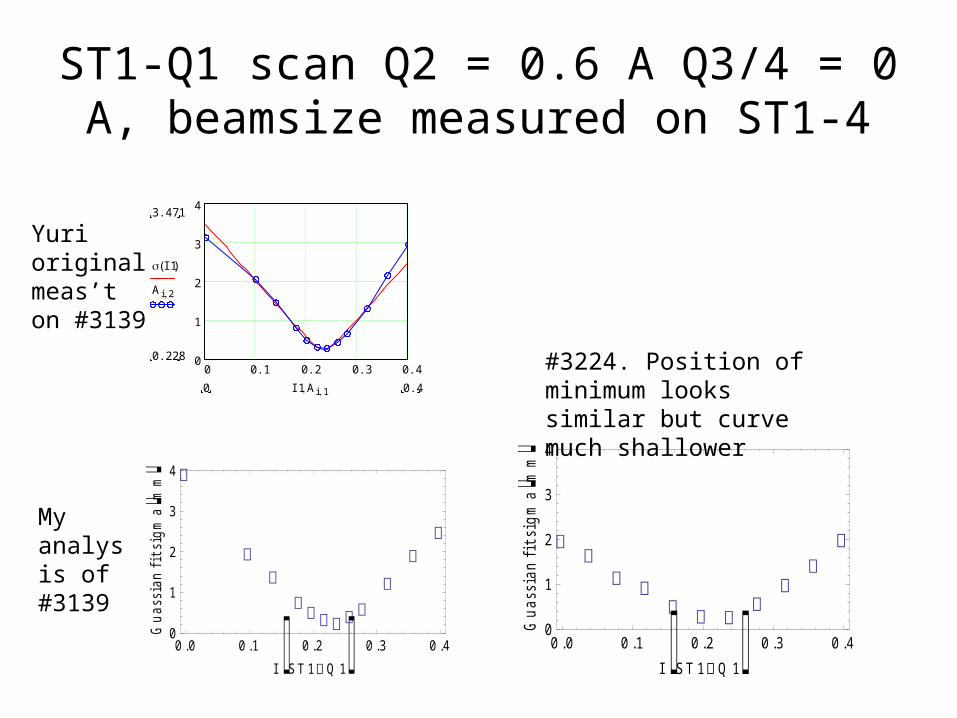
ST1-Q1 scan Q2 = 0.6 A Q3/4 = 0 A, beamsize measured on ST1-4
0 0.1 0.2 0.3 0.40
1
2
3
43.471
0.228
I1( )
Ai 2
0.40 I1 Ai 1
Yuri original meas’t on #3139
0 .0 0 .1 0 .2 0 .3 0 .40
1
2
3
4
I ST 1Q 1Guassianfitsigmamm
#3224. Position of minimum looks similar but curve much shallower
0 .0 0 .1 0 .2 0 .3 0 .40
1
2
3
4
I ST 1Q 1Guassianfitsigmamm
My analysis of #3139
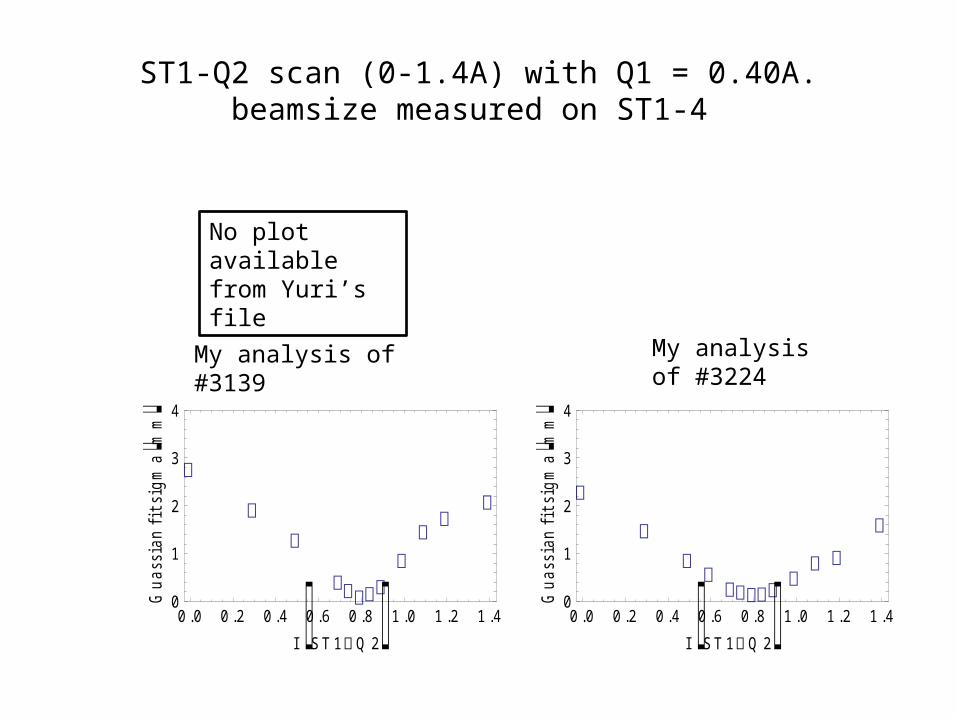
ST1-Q2 scan (0-1.4A) with Q1 = 0.40A. beamsize measured on ST1-4
No plot available from Yuri’s file
0 .0 0 .2 0 .4 0 .6 0 .8 1 .0 1 .2 1 .40
1
2
3
4
I ST 1Q 2Guassianfitsigmamm
0 .0 0 .2 0 .4 0 .6 0 .8 1 .0 1 .2 1 .40
1
2
3
4
I ST 1Q 2Guassianfitsigmamm
My analysis of #3139
My analysis of #3224
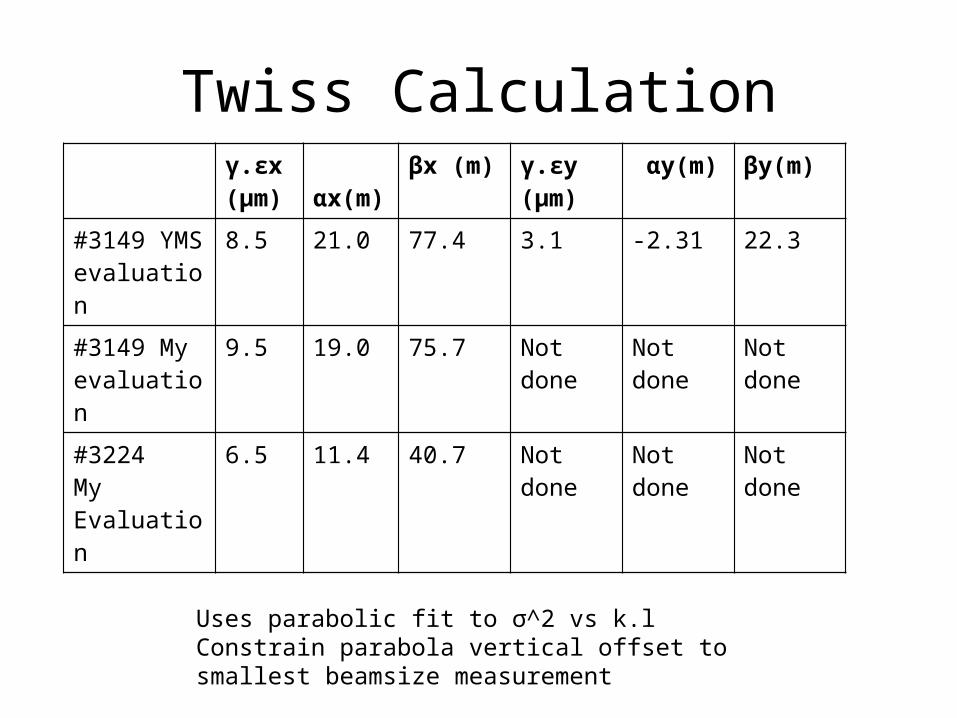
Twiss Calculationγ.εx (μm)
αx(m) βx (m) γ.εy (μm)
αy(m) βy(m)
#3149 YMS evaluation
8.5 21.0 77.4 3.1 -2.31 22.3
#3149 My evaluation
9.5 19.0 75.7 Not done Not done Not done
#3224My Evaluation
6.5 11.4 40.7 Not done Not done Not done
Uses parabolic fit to σ^2 vs k.lConstrain parabola vertical offset to smallest beamsize measurement
Twiss Conclusions
• NB: I didn’t go to divisor 20 like Yuri did. But I would expect the result (if any) of this would be to make my beamsizes on #3224 larger due to increased beam loading. However, my beamsizes are smaller.
• I set up phases “accurately” to match #3224 60pC; BC=-10/+15deg; Lc = crests. Pb=1.2kW.
• Comparison of the quad scan data suggests optics are not highly repeatable. Two months gap between measurements being compared. Maybe this is too long a gap.

Model vs Measure #3224
ST1-3 AR2-1
ST2-1
ST2-2
Model/measure agreement not too bad
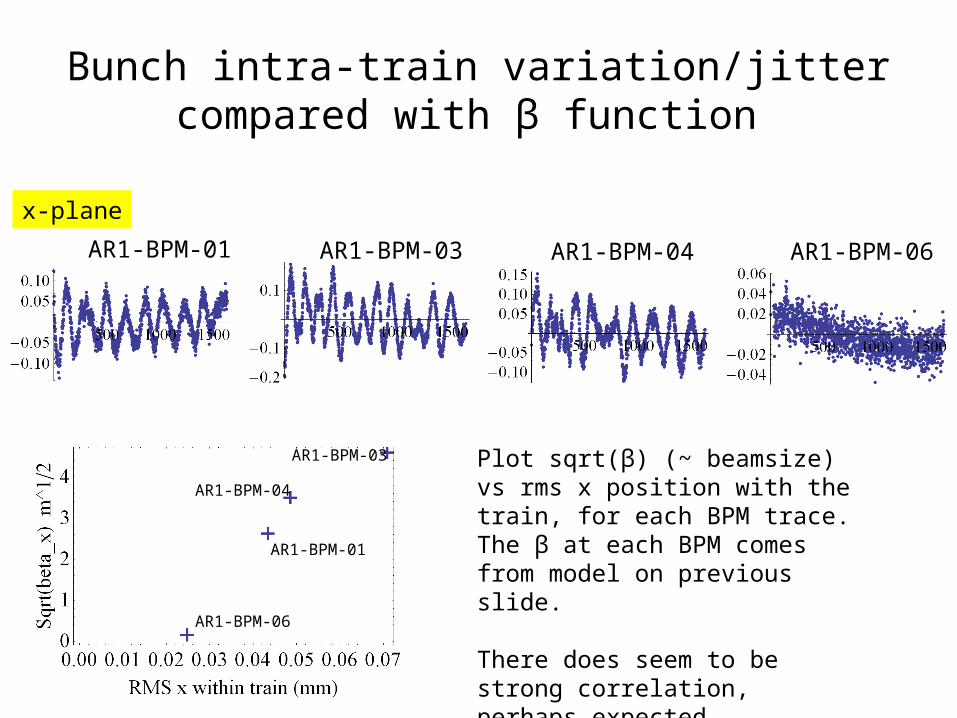
Bunch intra-train variation/jitter compared with β function
x-plane
AR1-BPM-01 AR1-BPM-03 AR1-BPM-04 AR1-BPM-06
Plot sqrt(β) (~ beamsize) vs rms x position with the train, for each BPM trace. The β at each BPM comes from model on previous slide.
There does seem to be strong correlation, perhaps expected. AR1-BPM-06
AR1-BPM-01
AR1-BPM-03
AR1-BPM-04
AR1 STUDIES
After Twiss evaluation, restore the #3139 “AP” set up and study dispersion and R56 of AR1

AR1 Dispersion Measured on AR1-BPM-06
Each plot is BPM x position vs beam energy
Vary AR1-Q1/4 from 1.9 to 2.4 in 8 steps
2.0 2.1 2.2 2.3 2.4
100
50
50
Dispersion (mm) vs AR1-Q1/4 current
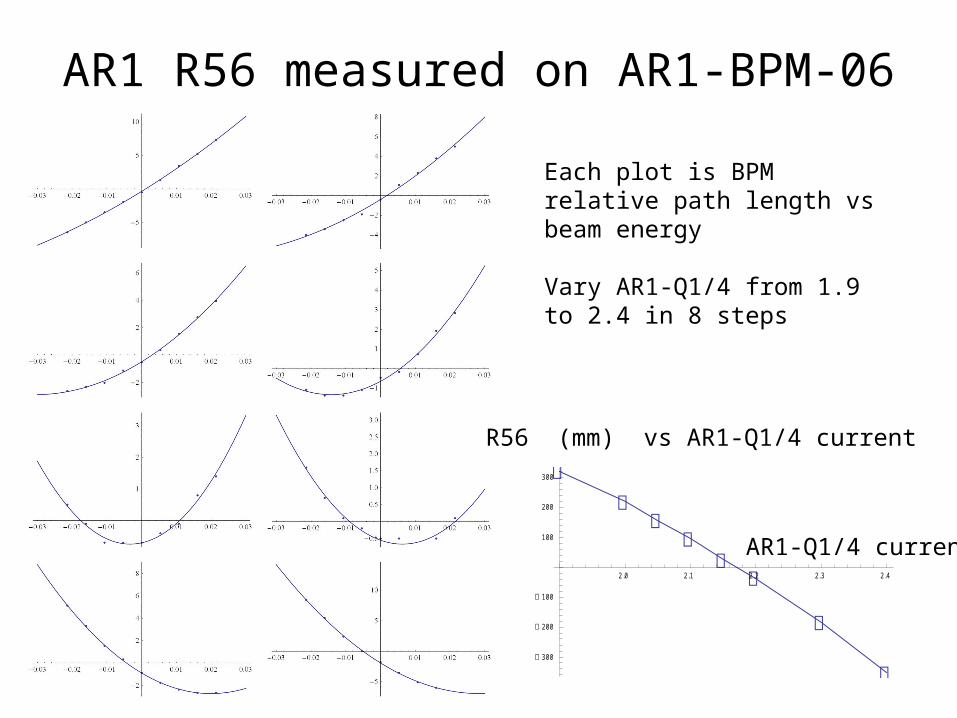
AR1 R56 measured on AR1-BPM-06 Each plot is BPM relative path length vs beam energy
Vary AR1-Q1/4 from 1.9 to 2.4 in 8 steps
R56 (mm) vs AR1-Q1/4 current
2.0 2.1 2.2 2.3 2.4
300
200
100
100
200
300
AR1-Q1/4 current
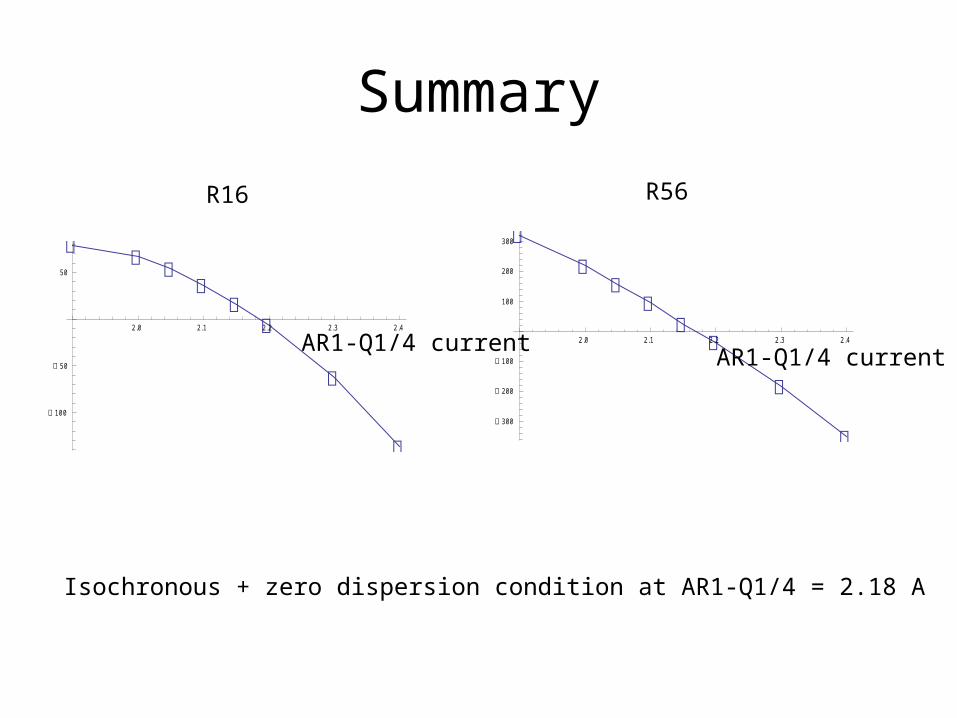
Summary
2.0 2.1 2.2 2.3 2.4
100
50
50
2.0 2.1 2.2 2.3 2.4
300
200
100
100
200
300
R16 R56
Isochronous + zero dispersion condition at AR1-Q1/4 = 2.18 A
AR1-Q1/4 current AR1-Q1/4 current