Embed Size (px)
DESCRIPTION
third lec
Citation preview
Surface Science January 28, 2015
Some surface structural techniques: LEED;
RHEED; X-ray; Scanning probe
References and sources:
Woodruff and Delchar (2nd ed.), pp 105-212
http://venables.asu.edu/grad/lectures.html
http://www.chem.qmul.ac.uk/surfaces/scc/
http://www.philiphofmann.net/Philip_Hofmann/SurfacePhysics.html
http://www.material.tohoku.ac.jp/~kaimenb/B_RHEED.html
Wikipedia (!)

There are many surface structural probes
• Diffraction methods
– Low energy electron diffraction (LEED)
– Photoelectron diffraction (Ph D)
– He scattering
– Reflection high energy electron diffraction
– X-ray diffraction
• Real space methods
– Scanning tunneling microscopy (STM)
– Atomic Force Microscopy (AFM)
– Ion scattering (MEIS, RBS)
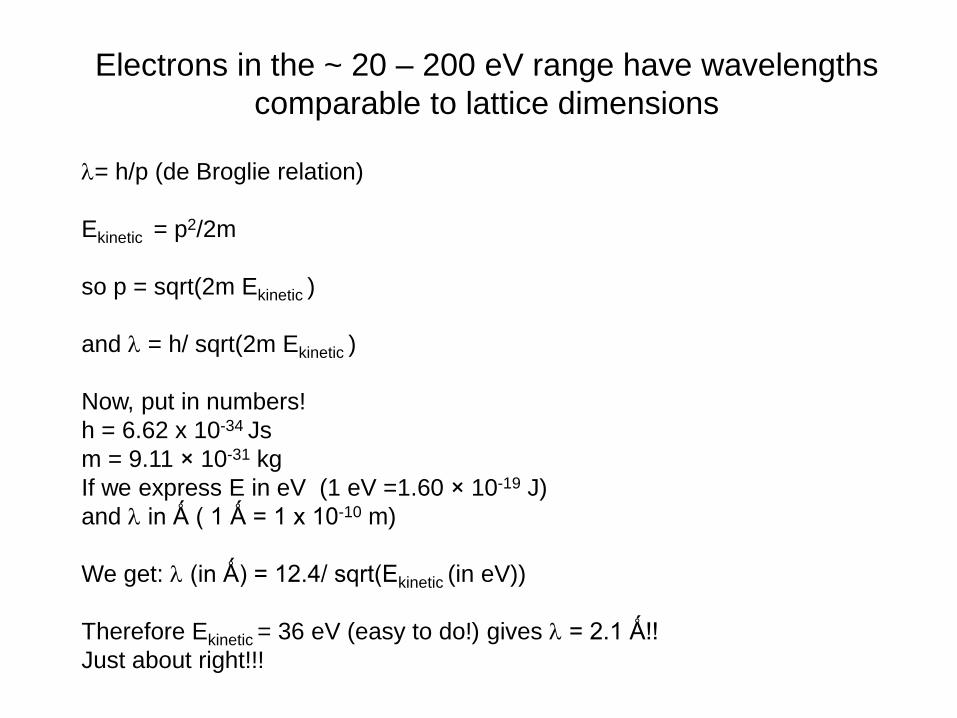
Electrons in the ~ 20 – 200 eV range have wavelengths
comparable to lattice dimensions
= h/p (de Broglie relation)
Ekinetic = p2/2m
so p = sqrt(2m Ekinetic )
and = h/ sqrt(2m Ekinetic )
Now, put in numbers!
h = 6.62 x 10⁻³⁴ Js
m = 9.11 × 10⁻³¹ kg
If we express E in eV (1 eV =1.60 × 10⁻¹⁹ J)
and in Ǻ ( 1 Ǻ = 1 x 10⁻¹⁰ m)
We get: (in Ǻ) = 12.4/ sqrt(Ekinetic (in eV))
Therefore Ekinetic = 36 eV (easy to do!) gives = 2.1 Ǻ!!
Just about right!!!

Basic idea of LEED: Scattering off a two
dimensional array of atoms.
If d = n, we get constructive interference!
What happens to Θ when is changed?
Why two dimensional, not 3D??
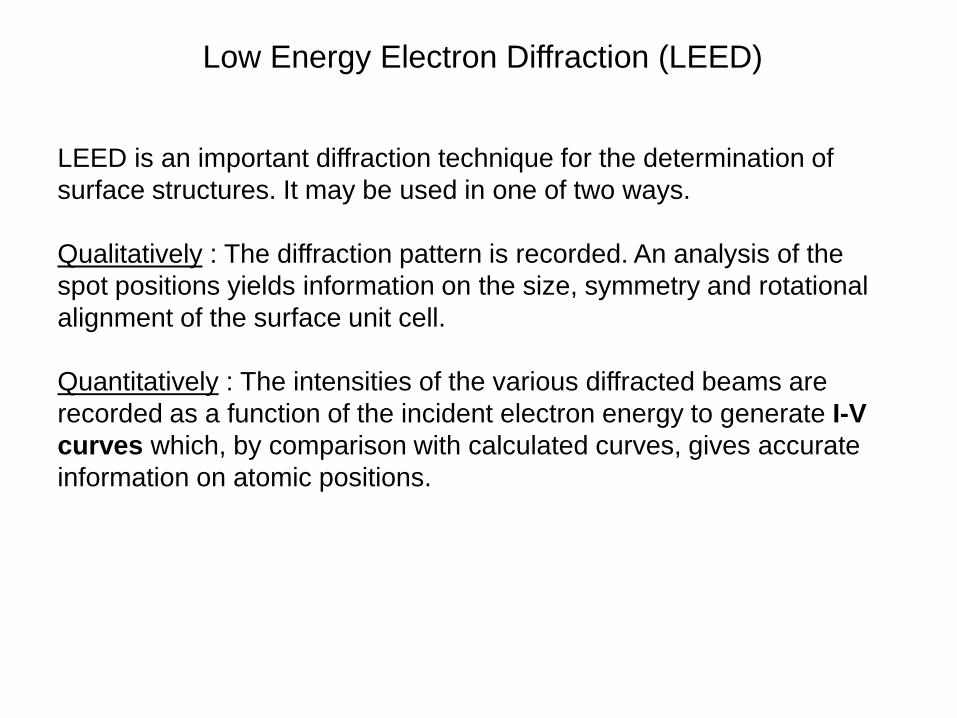
LEED is an important diffraction technique for the determination of
surface structures. It may be used in one of two ways.
Qualitatively : The diffraction pattern is recorded. An analysis of the
spot positions yields information on the size, symmetry and rotational
alignment of the surface unit cell.
Quantitatively : The intensities of the various diffracted beams are
recorded as a function of the incident electron energy to generate I-V
curves which, by comparison with calculated curves, gives accurate
information on atomic positions.
Low Energy Electron Diffraction (LEED)

Schematic picture of a LEED apparatus
Commercial LEED apparatus
LEED apparatus mounted in UHV chamber

LEED diffraction patterns from W(100) at two different energies

Real and reciprocal space pictures of unit cells

Superstructures

Interference between
different layers (single
scattering)
Note: Usually d12≠d23 etc
I-V curve (intensity profile) for Ni(100)
First complication: Scattering from different layers
parallel to the surface can interfere constructively or
destructively

From Hoffman, “Surface Physics, an Introduction”. The
substrate is bulk terminated at 100 K, but is reconstructed
at 300 K.

Second complication: Multiple scattering

The inspection of the LEED pattern gives a qualitative picture of the
surface periodicity i.e. the size of the surface unit cell and to a certain
degree of surface symmetries. It will give no information about the atomic
arrangement within a surface unit cell or the sites of adsorbed atoms.
A more quantitative analysis of LEED experimental data can be achieved
by analysis of I-V curves (measurements of the intensity versus incident
electron energy). These curves are then compared to computer
calculations based on the assumption of a particular model. The model is
changed in an iterative process until a satisfactory agreement between
experimental and theoretical curves is achieved. A quantitative measure
for this agreement is the so called reliability- or R-factor, for example:
and Voi is the imaginary part of the electron self-energy. In generally is considered as a good agreement, is considered mediocre and is considered a bad agreement. Figure 7 shows examples of the comparison between experimental I-V spectra and theoretical calculations.
where
and Voi is the imaginary part of the electron self-energy
How to get quantitative results from LEED
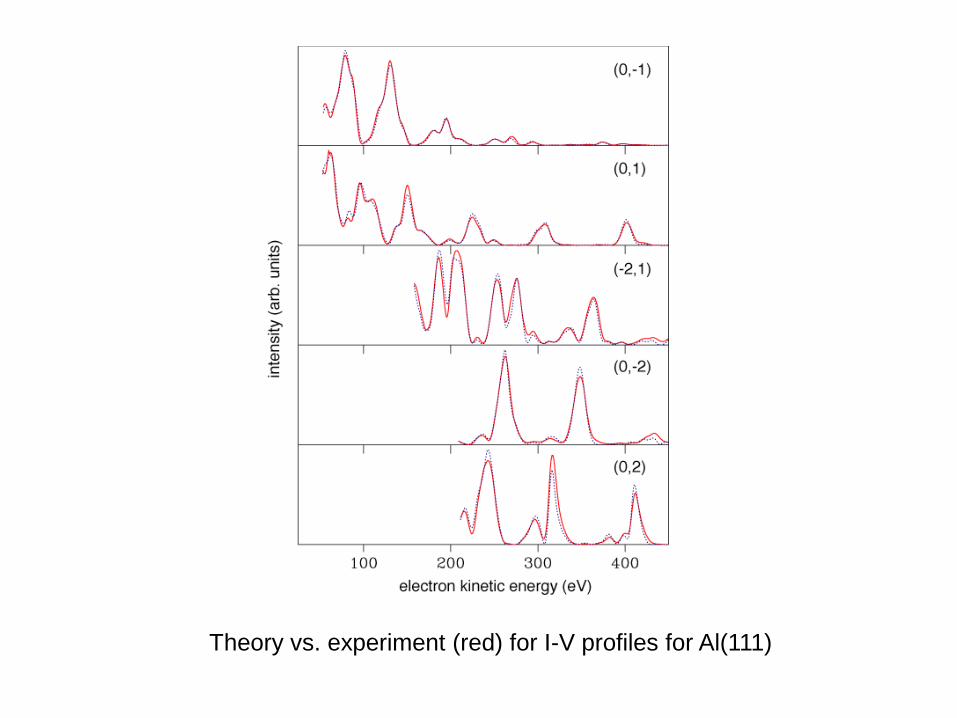
Theory vs. experiment (red) for I-V profiles for Al(111)

Surface structure of Bi2Se3 (dos Reis et al)
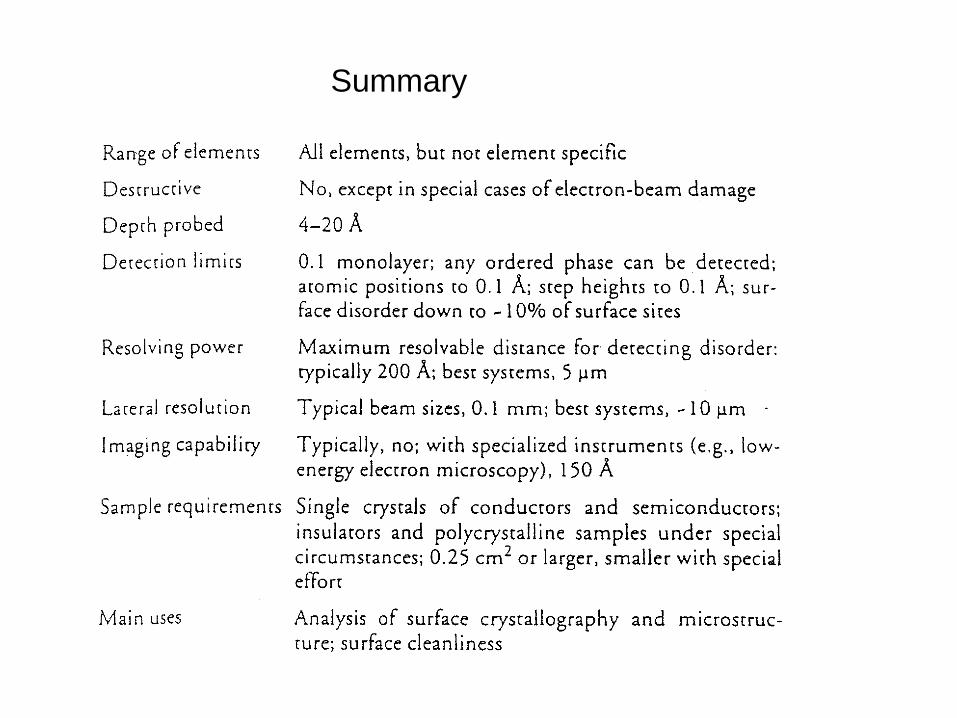
Summary

Reflection High Energy Electron Diffraction
(RHEED)
• High energy electrons (10 – 30 keV)
• Grazing incidence geometry
• Widely used to monitor epitaxial growth
• Not as well understood quantitatively as
LEED
• No energy filtering

MBE apparatus with RHEED

RHEED experimental geometry

(Schematic) origin of RHEED
oscillations
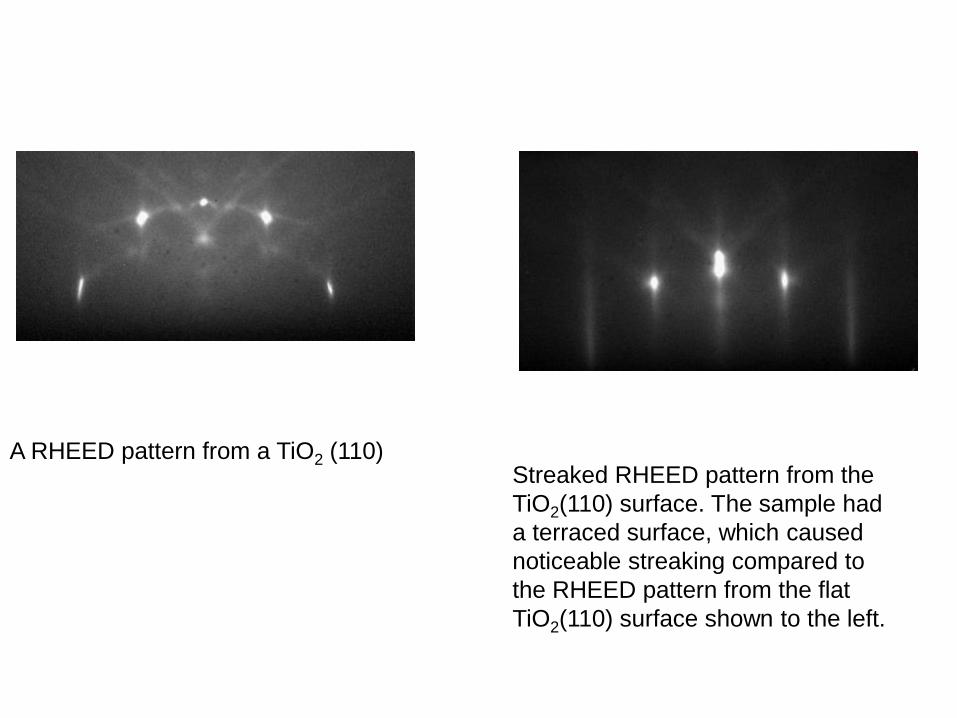
A RHEED pattern from a TiO2 (110) Streaked RHEED pattern from the
TiO2(110) surface. The sample had
a terraced surface, which caused
noticeable streaking compared to
the RHEED pattern from the flat
TiO2(110) surface shown to the left.

RHEED summary

Surface X-ray scattering
Diffraction condition
for a simple cubic
structure
Intensity variation along a
Crystal Truncation Rod
from a simple cubic lattice

Surface X-ray scattering
Advantage: Very simple
theory, single scattering
Disadvantage:
Synchrotron radiation
necessary (defines
divergence well)
Felici et al
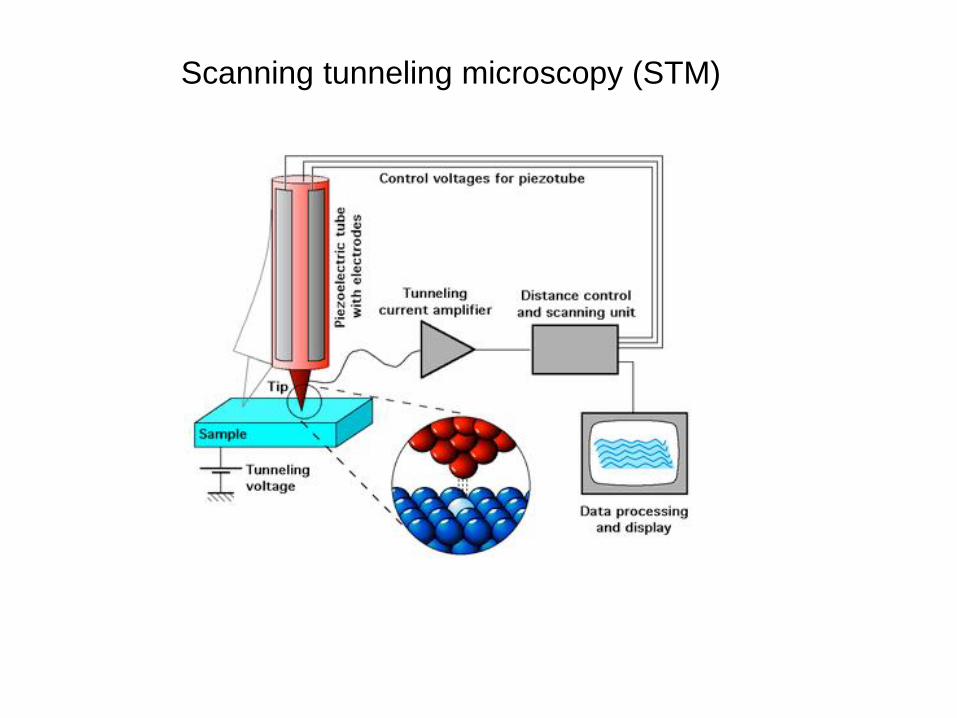
Scanning tunneling microscopy (STM)

Quantum tunneling

The STM measures charge density, not directly atomic positions

STM of Si(111) (7x7) at good (top left) and optimal (right) resolution
Calculated (left) STM pictures for the surface structure at right
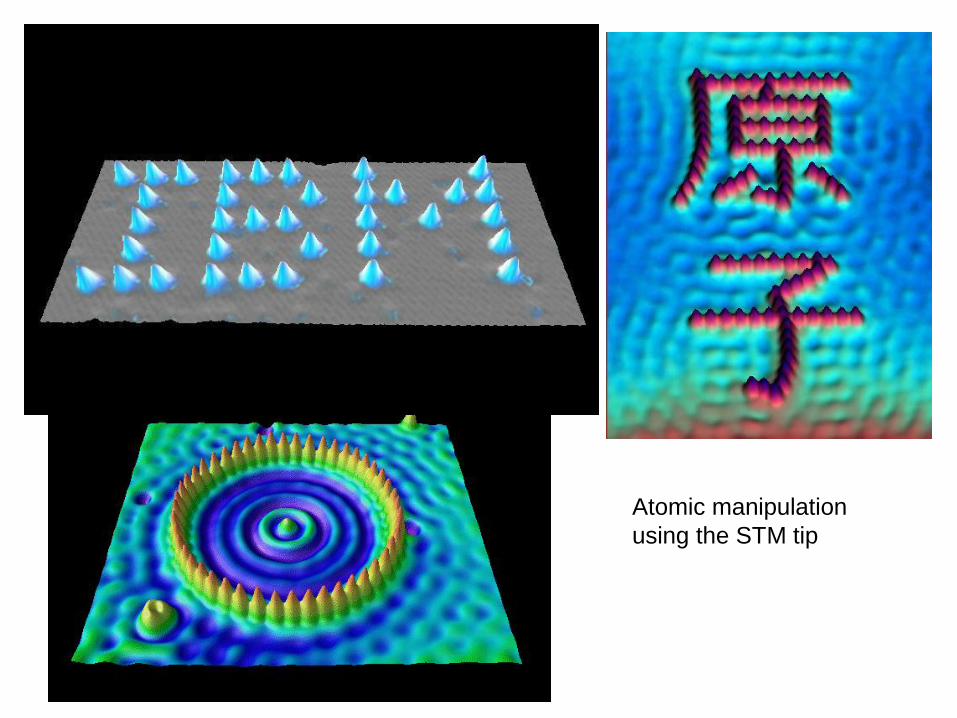
Atomic manipulation
using the STM tip


The influence of bias: Si(100) (1x2)
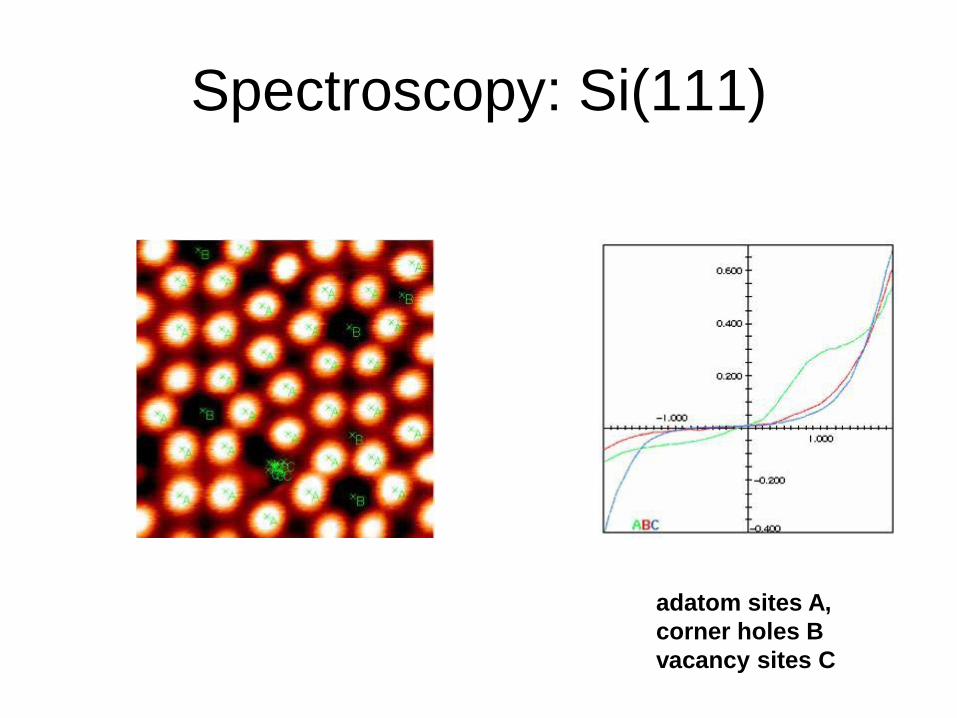
Spectroscopy: Si(111)
adatom sites A,
corner holes B
vacancy sites C

Atomic force microscopy (AFM)
AFM image of NaCl