Embed Size (px)
Citation preview
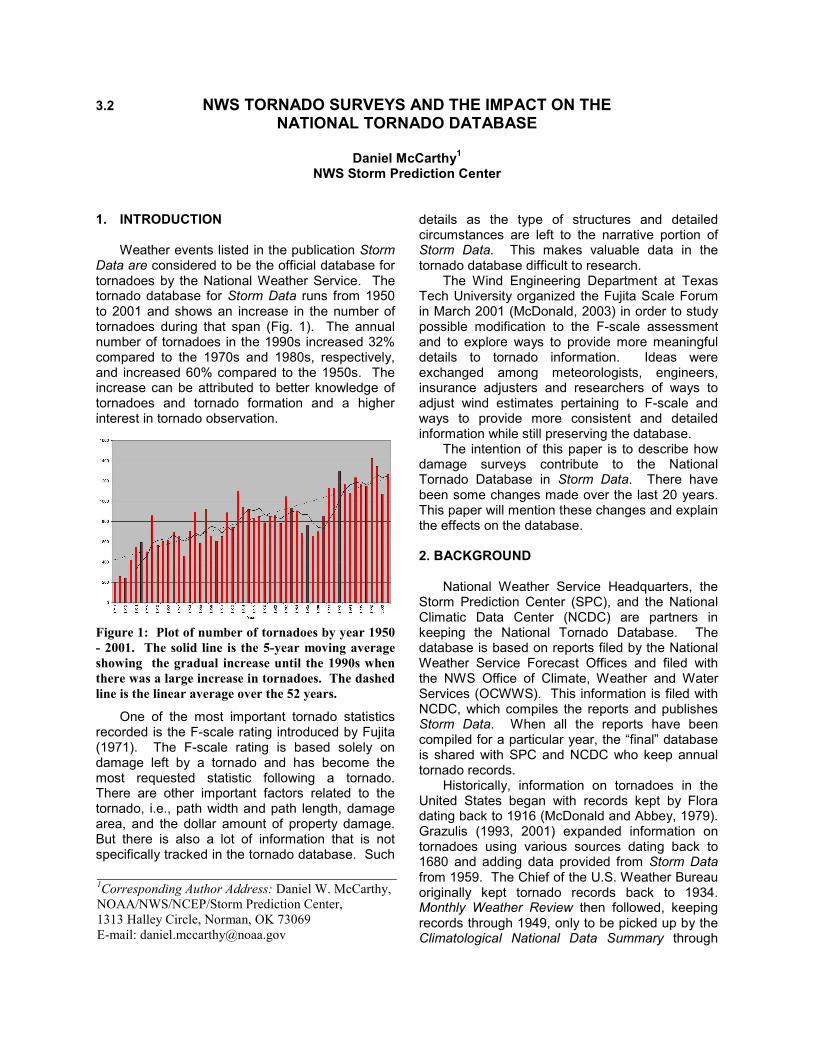
3.2 NWS TORNADO SURVEYS AND THE IMPACT ON THE NATIONAL TORNADO DATABASE Daniel McCarthy1 NWS Storm Prediction Center 1. INTRODUCTION Weather events listed in the publication Storm Data are considered to be the official database for tornadoes by the National Weather Service. The tornado database for Storm Data runs from 1950 to 2001 and shows an increase in the number of tornadoes during that span (Fig. 1). The annual number of tornadoes in the 1990s increased 32% compared to the 1970s and 1980s, respectively, and increased 60% compared to the 1950s. The increase can be attributed to better knowledge of tornadoes and tornado formation and a higher interest in tornado observation.
Figure 1: Plot of number of tornadoes by year 1950 - 2001. The solid line is the 5-year moving average showing the gradual increase until the 1990s when there was a large increase in tornadoes. The dashed line is the linear average over the 52 years.
One of the most important tornado statistics recorded is the F-scale rating introduced by Fujita (1971). The F-scale rating is based solely on damage left by a tornado and has become the most requested statistic following a tornado. There are other important factors related to the tornado, i.e., path width and path length, damage area, and the dollar amount of property damage. But there is also a lot of information that is not specifically tracked in the tornado database. Such
details as the type of structures and detailed circumstances are left to the narrative portion of Storm Data. This makes valuable data in the tornado database difficult to research. The Wind Engineering Department at Texas Tech University organized the Fujita Scale Forum in March 2001 (McDonald, 2003) in order to study possible modification to the F-scale assessment and to explore ways to provide more meaningful details to tornado information. Ideas were exchanged among meteorologists, engineers, insurance adjusters and researchers of ways to adjust wind estimates pertaining to F-scale and ways to provide more consistent and detailed information while still preserving the database. The intention of this paper is to describe how damage surveys contribute to the National Tornado Database in Storm Data. There have been some changes made over the last 20 years. This paper will mention these changes and explain the effects on the database. 2. BACKGROUND National Weather Service Headquarters, the Storm Prediction Center (SPC), and the National Climatic Data Center (NCDC) are partners in keeping the National Tornado Database. The database is based on reports filed by the National Weather Service Forecast Offices and filed with the NWS Office of Climate, Weather and Water Services (OCWWS). This information is filed with NCDC, which compiles the reports and publishes Storm Data. When all the reports have been compiled for a particular year, the “final” database is shared with SPC and NCDC who keep annual tornado records. Historically, information on tornadoes in the United States began with records kept by Flora dating back to 1916 (McDonald and Abbey, 1979). Grazulis (1993, 2001) expanded information on tornadoes using various sources dating back to 1680 and adding data provided from Storm Data from 1959. The Chief of the U.S. Weather Bureau originally kept tornado records back to 1934. Monthly Weather Review then followed, keeping records through 1949, only to be picked up by the Climatological National Data Summary through
1Corresponding Author Address: Daniel W. McCarthy, NOAA/NWS/NCEP/Storm Prediction Center, 1313 Halley Circle, Norman, OK 73069 E-mail: [email protected]
1959 (Tecson et al., 1979). Storm Data began listing all significant weather events beginning on January 1, 1959. Although Storm Data responsibility has passed through the National Severe Storms Forecast Center (NSSFC), Fujita and NCDC during its tenure, its format has remained unchanged during the past 52 years. The Nuclear Regulatory Commission (NRC) supported the NSSFC in reviewing over 17,000 tornado reports in the Climatological National Data Summary and Storm Data between 1950 and 1976 to develop tornado climatology in the United States The NSSFC employed the services of students in each state to review available local databases and cross reference newspaper articles to assess the tornado damage and assign the appropriate F-scale. The NRC also supported Dr. Ted Fujita at the University of Chicago to develop a tornado database. He developed the DAPPLE (Damage Area Per Path LEngth) method, which by 1978 contained information on nearly 25,000 tornadoes extending back to 1900 (Abbey and Fujita, 1979). Fujita=s work in developing the F-scale was enhanced by performing surface and aerial damage surveys. This led to more sophisticated means of supplying more information to the tornado database. A prime example of this is the work done in analyzing and surveying damage left after the Super Outbreak of April 3-4, 1974 (Dept. of Commerce, 1974). It took weeks to conduct this investigation, tracing and analyzing the damage paths of 148 tornadoes that occurred in parts of 13 states. It is one of the most detailed damage surveys ever performed. Fujita and his staff also provided detailed analysis on several other outbreaks, such as the Grand Island, NE tornadoes on July 3, 1980, the May 31, 1985, tornado outbreak over northeast Ohio and northwest Pennsylvania, and the Plainfield, IL tornado on August 28, 1990. In the early 1980s, the National Weather Service warning program was developed, consisting of a Warning Preparedness Meteorologist (WPM) at each of the 52 Weather Service Forecast Offices. The WPM was responsible to initiate and perform storm surveys on significant tornadoes that occurred within their state. This was enhanced as the NWS modernization began in 1988 with 121 forecast offices. Each office has a Warning Coordination Meteorologist (WCM) trained in conducting storm damage surveys on significant tornadoes occurring in their county warning areas.
3. DESCRIPTION OF THE DATA Storm Data is formatted in a 28 field format as shown in Table 1. The database contains all hazardous weather reports, including tornadoes, funnel clouds, waterspouts, hail, damaging winds,
blizzards, ice storms, etc. Once all the entries for Storm Data are filed by NWS Forecast Offices with NWS Headquarters for a particular year, the tornado data is forwarded to the SPC with funnel clouds and waterspouts filtered so that only individual tornado segments are listed. Tornadoes are segmented in three ways: 1) beginning and ending point within each county or state crossed, 2) skips not exceeding two miles or four minutes travel time, and/or 3) tornado turns sharply and may be more adequately described by segment-ing into individual pieces. The data is then shared with the SPC, which is tasked to format the NCDC tornado database and format a database that links together sequenced tornado segments to define a single tornado path across multiple counties and states. The data are then formatted into the fields listed in Table 2, converting times to Central Standard Time (CST) and placing them into hundredths of hours. Latitude and longitude are also adjusted to hundredths of degrees.
1. Sequence No. 15. End Azimuth
2. Segment No. 16. End Location
3. Event Type 17. Length
4. State 18. Width
5. Begin Date 19. F
6. Begin Time 20. Property Damage
7. County 21. Crop Damage
8. County Name 22. WFO
9. Begin Range 23. Deaths
10. Begin Azimuth 24. Latitude
11. Begin Location 25. Longitude
12. End Date 26. Latitude End
13. End Time 27. Longitude End
14. End Range 28. Tornado Matching #
Table 1: Fields in Storm Data
1. Year 11, No. States 21. Width
2. # (State) 12. State –Tor 22. Fatalities
3. State 13. Segment # 23. Injured
4. Month 14. Start Lat. 24. Damage
5. Day 15. Start
Long.
25. County
6. Date 16. Stop Lat. 26. F
7. Time 17. Stop
Long.
27. P Length
8. Zone(CST) 18. Length 28. P Width
9. Tornado # 19. Area
10. Type (=1) 20. F* Area
Table 2: Fields in the SPC Tornado Database
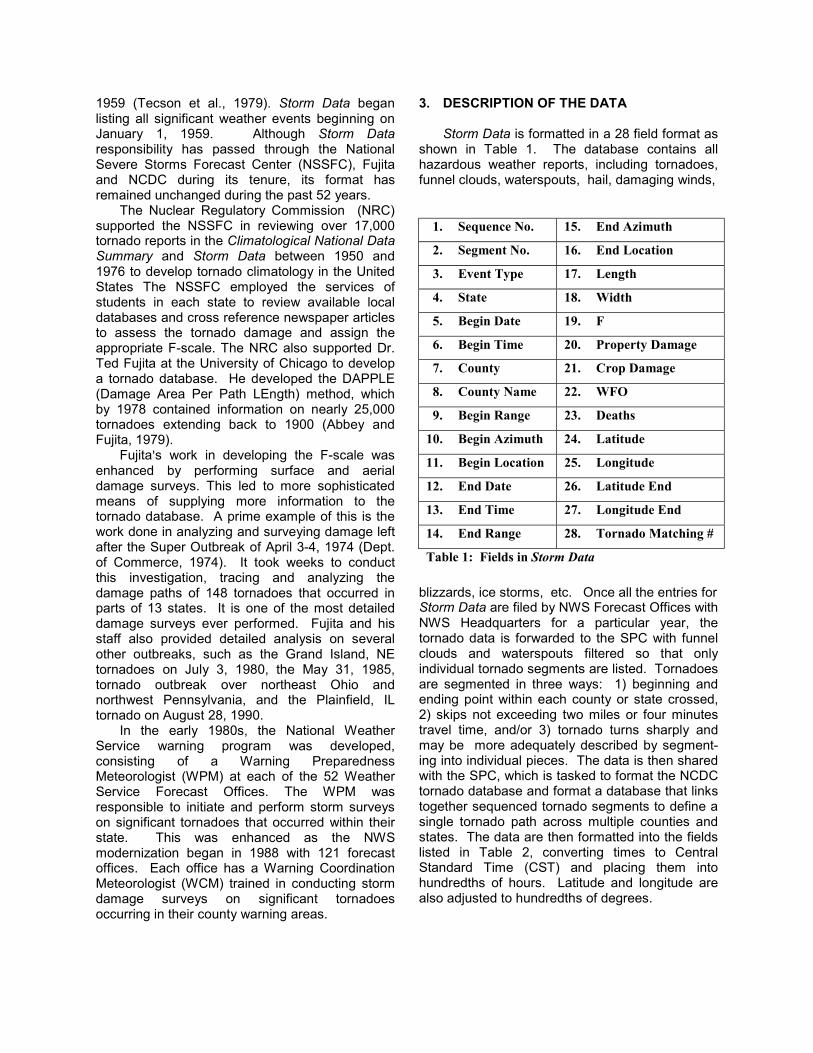
4. ANALYSIS OF THE DATA a. F-scale The F-scale was incorporated into the National Database in the middle 1970s after Fujita and his staff did an extensive evaluation of the Super Outbreak of April 3-4, 1974. Figure 2 shows the distribution of tornado damage ratings since 1950. There are more tornadoes with F1 and F2 rated damage than F0 damage prior to 1977. This is related to the NSSFC students researching the local data in newspapers to evaluate the damage mentioned previously. However, only more
serious damage is likely to be in newspaper accounts (Schaefer and Edwards, 1999). This trend was reversed in 1980 as the Warning Preparedness Program was launched. The number of tornadoes with F0 and F1 damage increased greatly after 1990 as local WFOs incorporated the services of more storm spotters. Also, beginning in 1982, procedures were updated that would assign a rating of F0 to tornadoes where the amount of damage was unknown or not observable. The number of tornadoes with damage rated F3 or greater remains very consistent during 52 years of data (Fig. 3). The data shows that only 6% of all tornado damage was rated F3 or worse during the last 52 years. Tornado damage rated F2 began decreasing in the late 1970s when damage surveys increased with the Warning Preparedness Program and has been consistent since that time.
ehF2nloAcodToFigure 2: Plot of F-scale ratings 1950-2001.
Figure 3: Plot of weak, strong and violent tornadoes. Weak tornadoes are those producing F0-F1 damage, strong tornadoes F2-F3 damage, and violent tornadoes are those producing F4-F5 damage.
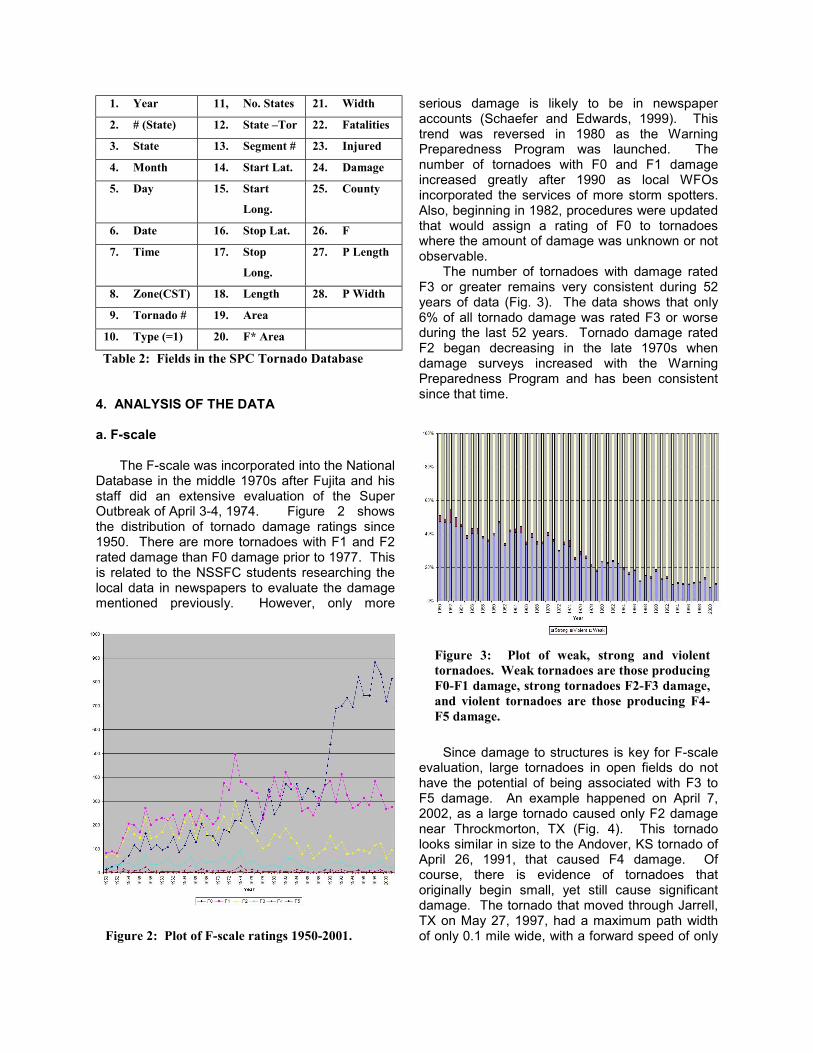
Since damage to structures is key for F-scale valuation, large tornadoes in open fields do not ave the potential of being associated with F3 to 5 damage. An example happened on April 7, 002, as a large tornado caused only F2 damage ear Throckmorton, TX (Fig. 4). This tornado oks similar in size to the Andover, KS tornado of pril 26, 1991, that caused F4 damage. Of ourse, there is evidence of tornadoes that riginally begin small, yet still cause significant amage. The tornado that moved through Jarrell, X on May 27, 1997, had a maximum path width f only 0.1 mile wide, with a forward speed of only
10 mph. The damage was rated F5 as many homes were removed from concrete slab foundations.
tornado is necessary (Schaefer et al., 2002). The
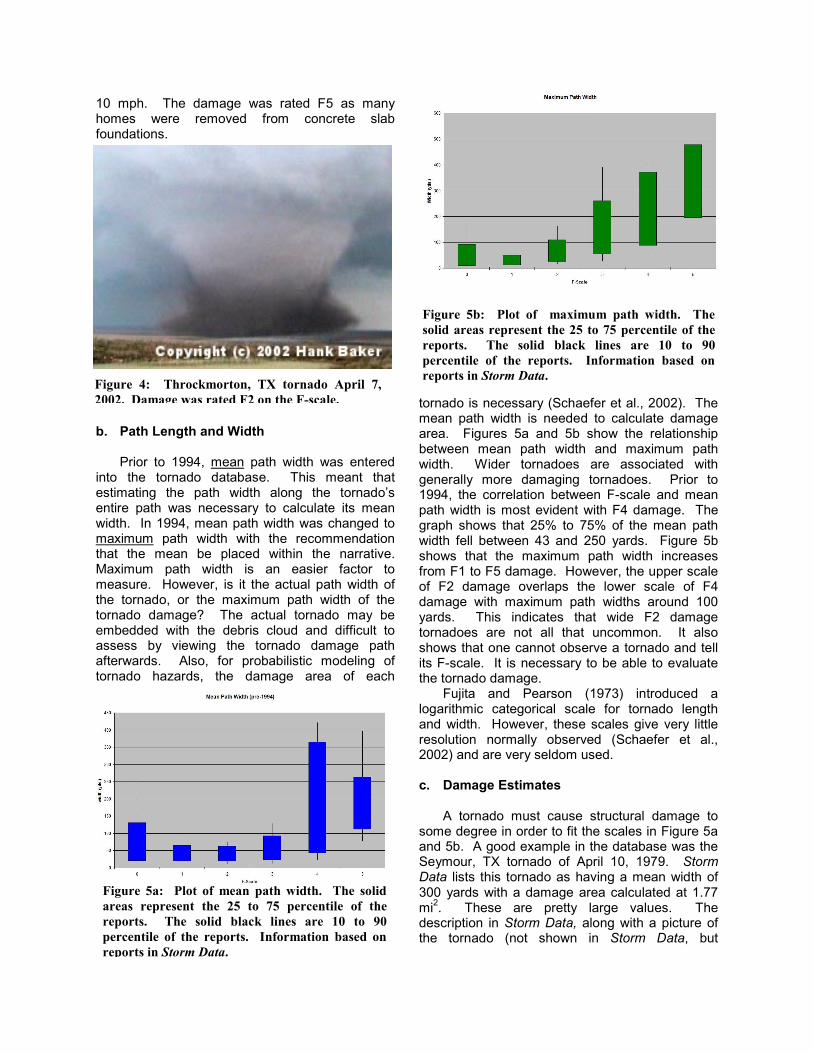
Figure 5b: Plot of maximum path width. The solid areas represent the 25 to 75 percentile of the reports. The solid black lines are 10 to 90 percentile of the reports. Information based on reports in Storm Data.
Figure 4: Throckmorton, TX tornado April 7,2002. Damage was rated F2 on the F-scale.
b. Path Length and Width Prior to 1994, mean path width was entered into the tornado database. This meant that estimating the path width along the tornado’s entire path was necessary to calculate its mean width. In 1994, mean path width was changed to maximum path width with the recommendation that the mean be placed within the narrative. Maximum path width is an easier factor to measure. However, is it the actual path width of the tornado, or the maximum path width of the tornado damage? The actual tornado may be embedded with the debris cloud and difficult to assess by viewing the tornado damage path afterwards. Also, for probabilistic modeling of tornado hazards, the damage area of each
mean path width is needed to calculate damage area. Figures 5a and 5b show the relationship between mean path width and maximum path width. Wider tornadoes are associated with generally more damaging tornadoes. Prior to 1994, the correlation between F-scale and mean path width is most evident with F4 damage. The graph shows that 25% to 75% of the mean path width fell between 43 and 250 yards. Figure 5b shows that the maximum path width increases from F1 to F5 damage. However, the upper scale of F2 damage overlaps the lower scale of F4 damage with maximum path widths around 100 yards. This indicates that wide F2 damage tornadoes are not all that uncommon. It also shows that one cannot observe a tornado and tell its F-scale. It is necessary to be able to evaluate the tornado damage. Fujita and Pearson (1973) introduced a logarithmic categorical scale for tornado length and width. However, these scales give very little resolution normally observed (Schaefer et al., 2002) and are very seldom used. c. Damage Estimates A tornado must cause structural damage to some degree in order to fit the scales in Figure 5a and 5b. A good example in the database was the Seymour, TX tornado of April 10, 1979. Storm Data lists this tornado as having a mean width of 300 yards with a damage area calculated at 1.77 mi2. These are pretty large values. The description in Storm Data, along with a picture of the tornado (not shown in Storm Data, but
Figure 5a: Plot of mean path width. The solidareas represent the 25 to 75 percentile of thereports. The solid black lines are 10 to 90percentile of the reports. Information based onreports in Storm Data.
included in Grazulis, 1993), led to an F2 rating. However, since there was little to damage structurally in a rural area, the F-scale rating could not be higher. While Fujita did supply descriptions in assessing damage using surrounding vegetation, they are rarely used, as indicated in the narratives in Storm Data. In 1996, another procedural change was incorporated into Storm Data, separating type of damage into two categories, property damage and crop damage, and assigning dollar amounts. Obviously, the cost of replacing property will be assessed higher than crop damage and assessing potential monetary loss from the loss of crops is difficult. Prior to 1996, a value was assigned to a monetary range. This makes researching the change in monetary amounts more challenging using Storm Data. One must realize when analyzing the data that the damage assessment is a subjective process. The estimate of property damage is based solely on figures supplied by an insurance company, if available. When an adjuster is not available, then the dollar estimate is obtained from emergency management, utility companies or newspaper articles. The F-scale is based on the damage witnessed. In the case of significant damage, there may be more than the NWS performing damage assessments. Other agencies, like FEMA, may also be present working to assign an F-scale. One problem that exists is that evaluation of damage may overlap between two levels of F-scale. For example, in the case of an overturned railroad car, how many feet it was moved may be the difference between F3 and F4 damage. F4 damage is described as:
“Whole frame houses leveled, leaving piles of debris; steel structures badly damaged; trees debarked by small flying debris; cars and trains thrown some distances or rolled considerable distances; large missiles generated.”
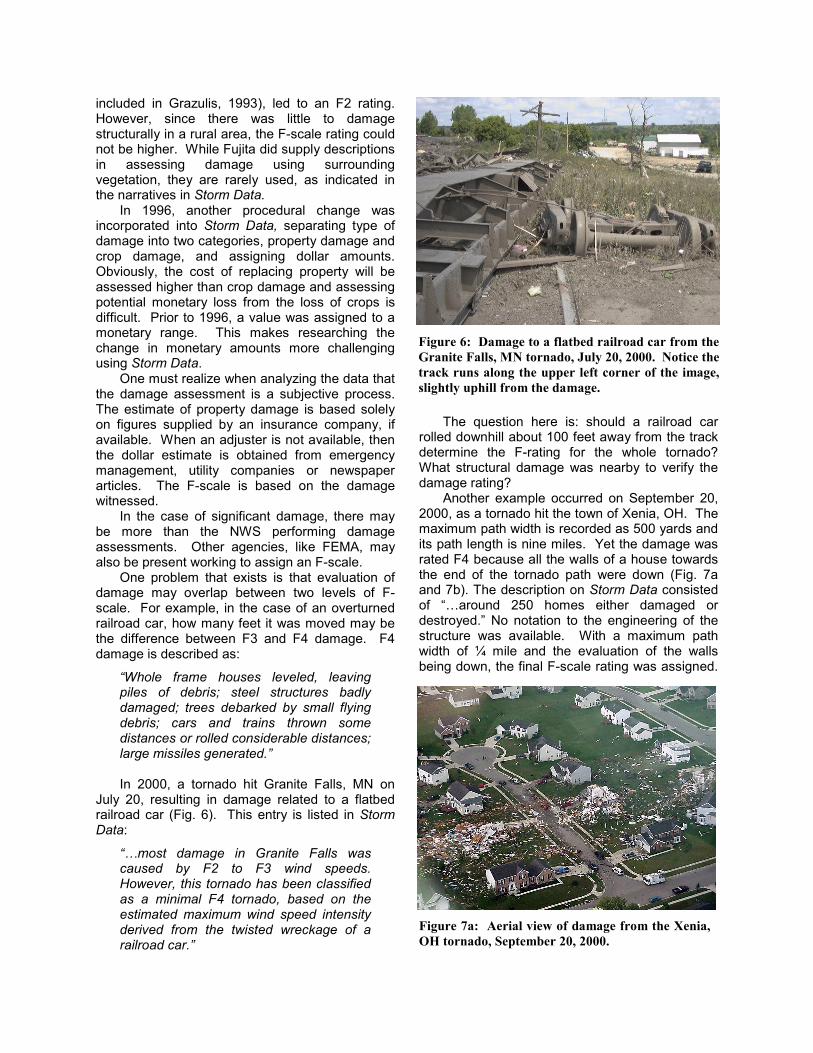
In 2000, a tornado hit Granite Falls, MN on July 20, resulting in damage related to a flatbed railroad car (Fig. 6). This entry is listed in Storm Data:
“…most damage in Granite Falls was caused by F2 to F3 wind speeds. However, this tornado has been classified as a minimal F4 tornado, based on the estimated maximum wind speed intensity derived from the twisted wreckage of a railroad car.”
Figure 6: Damage to a flatbed railroad car from theGranite Falls, MN tornado, July 20, 2000. Notice thetrack runs along the upper left corner of the image,slightly uphill from the damage.
The question here is: should a railroad car rolled downhill about 100 feet away from the track determine the F-rating for the whole tornado? What structural damage was nearby to verify the damage rating? Another example occurred on September 20, 2000, as a tornado hit the town of Xenia, OH. The maximum path width is recorded as 500 yards and its path length is nine miles. Yet the damage was rated F4 because all the walls of a house towards the end of the tornado path were down (Fig. 7a and 7b). The description on Storm Data consisted of “…around 250 homes either damaged or destroyed.” No notation to the engineering of the structure was available. With a maximum path width of ¼ mile and the evaluation of the walls being down, the final F-scale rating was assigned.
Figure 7a: Aerial view of damage from the Xenia,OH tornado, September 20, 2000.
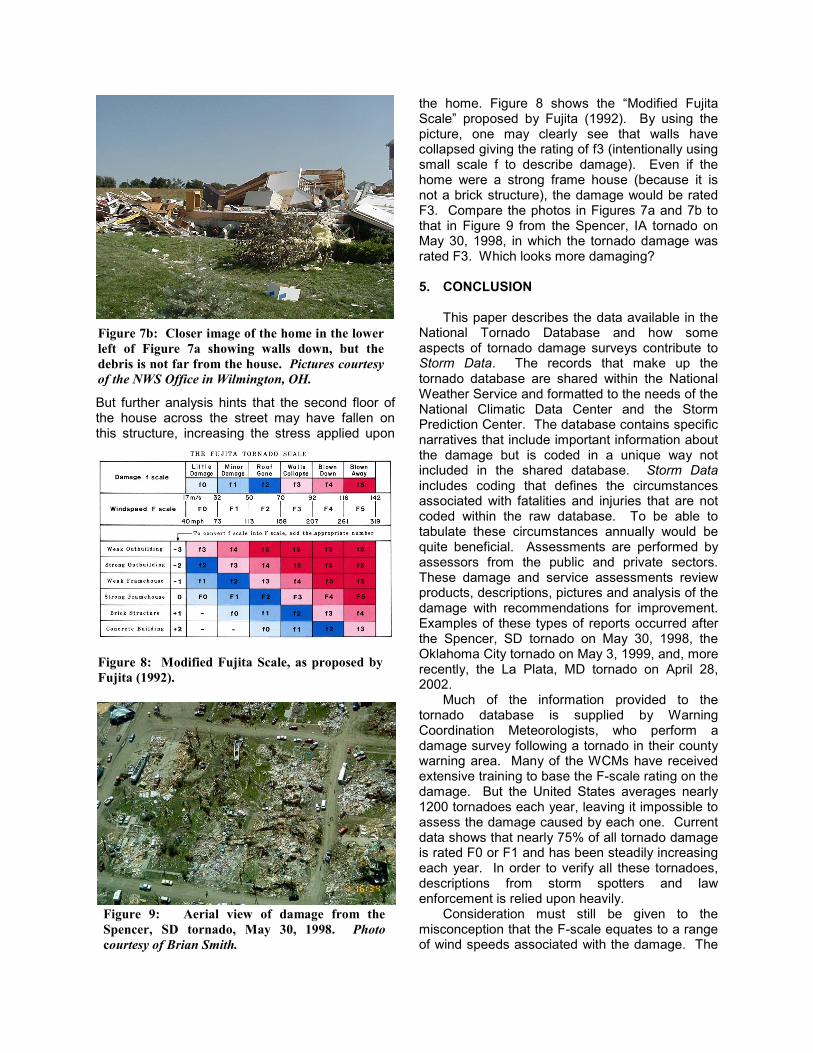
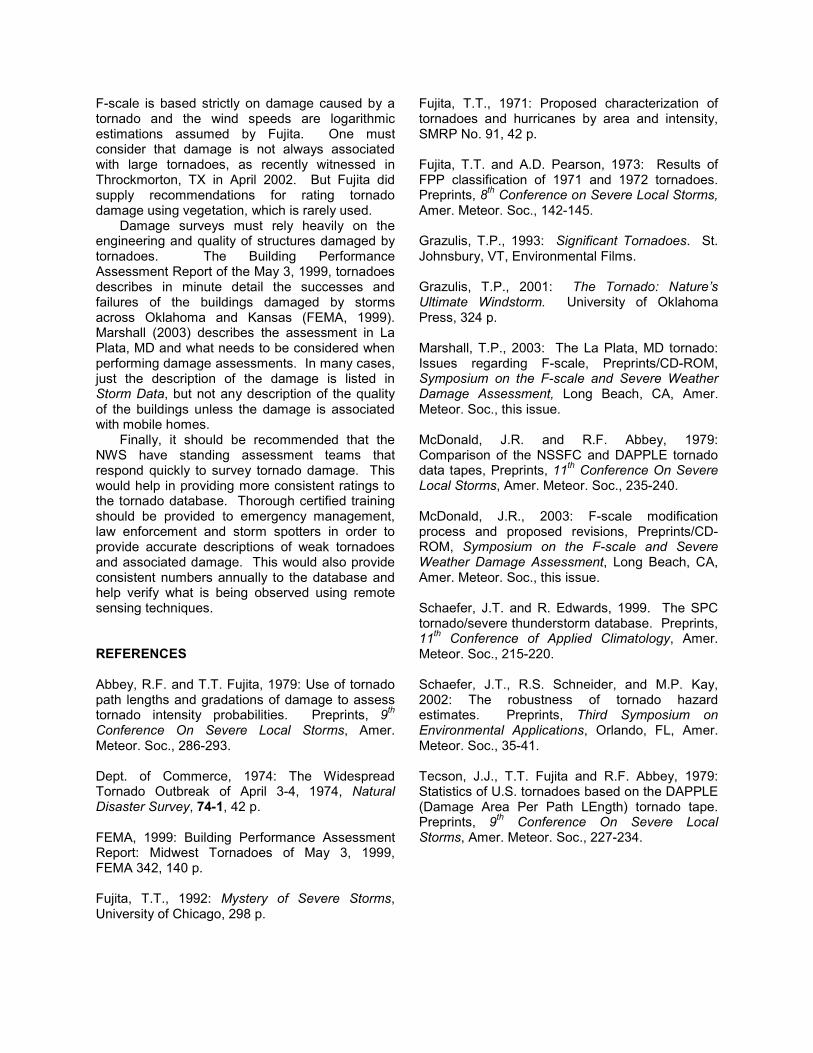
the home. Figure 8 shows the “Modified Fujita Scale” proposed by Fujita (1992). By using the picture, one may clearly see that walls have collapsed giving the rating of f3 (intentionally using small scale f to describe damage). Even if the home were a strong frame house (because it is not a brick structure), the damage would be rated F3. Compare the photos in Figures 7a and 7b to that in Figure 9 from the Spencer, IA tornado on May 30, 1998, in which the tornado damage was rated F3. Which looks more damaging? 5. CONCLUSION This paper describes the data available in the National Tornado Database and how some aspects of tornado damage surveys contribute to Storm Data. The records that make up the tornado database are shared within the National
Figure 7b: Closer image of the home in the lower left of Figure 7a showing walls down, but the debris is not far from the house. Pictures courtesy of the NWS Office in Wilmington, OH.
But further analysis hints that the second floor of the house across the street may have fallen on this structure, increasing the stress applied upon
Weather Service and formatted to the needs of the National Climatic Data Center and the Storm Prediction Center. The database contains specific narratives that include important information about the damage but is coded in a unique way not included in the shared database. Storm Data includes coding that defines the circumstances associated with fatalities and injuries that are not coded within the raw database. To be able to tabulate these circumstances annually would be quite beneficial. Assessments are performed by assessors from the public and private sectors. These damage and service assessments review products, descriptions, pictures and analysis of the
Figure 8: damage with recommendations for improvement. Examples of these types of reports occurred after the Spencer, SD tornado on May 30, 1998, the Oklahoma City tornado on May 3, 1999, and, more recently, the La Plata, MD tornado on April 28, 2002. Much of the information provided to the tornado database is supplied by Warning Coordination Meteorologists, who perform a damage survey following a tornado in their county warning area. Many of the WCMs have received extensive training to base the F-scale rating on the damage. But the United States averages nearly 1200 tornadoes each year, leaving it impossible to assess the damage caused by each one. Current data shows that nearly 75% of all tornado damage is rated F0 or F1 and has been steadily increasing each year. In order to verify all these tornadoes, descriptions from storm spotters and law enforcement is relied upon heavily. Consideration must still be given to the misconception that the F-scale equates to a range of wind speeds associated with the damage. TheFigure 9: Aerial view of damage from theSpencer, SD tornado, May 30, 1998. Photocourtesy of Brian Smith.
Figure 8: Modified Fujita Scale, as proposed byFujita (1992).
F-scale is based strictly on damage caused by a tornado and the wind speeds are logarithmic estimations assumed by Fujita. One must consider that damage is not always associated with large tornadoes, as recently witnessed in Throckmorton, TX in April 2002. But Fujita did supply recommendations for rating tornado damage using vegetation, which is rarely used. Damage surveys must rely heavily on the engineering and quality of structures damaged by tornadoes. The Building Performance Assessment Report of the May 3, 1999, tornadoes describes in minute detail the successes and failures of the buildings damaged by storms across Oklahoma and Kansas (FEMA, 1999). Marshall (2003) describes the assessment in La Plata, MD and what needs to be considered when performing damage assessments. In many cases, just the description of the damage is listed in Storm Data, but not any description of the quality of the buildings unless the damage is associated with mobile homes. Finally, it should be recommended that the NWS have standing assessment teams that respond quickly to survey tornado damage. This would help in providing more consistent ratings to the tornado database. Thorough certified training should be provided to emergency management, law enforcement and storm spotters in order to provide accurate descriptions of weak tornadoes and associated damage. This would also provide consistent numbers annually to the database and help verify what is being observed using remote sensing techniques. REFERENCES Abbey, R.F. and T.T. Fujita, 1979: Use of tornado path lengths and gradations of damage to assess tornado intensity probabilities. Preprints, 9th Conference On Severe Local Storms, Amer. Meteor. Soc., 286-293. Dept. of Commerce, 1974: The Widespread Tornado Outbreak of April 3-4, 1974, Natural Disaster Survey, 74-1, 42 p. FEMA, 1999: Building Performance Assessment Report: Midwest Tornadoes of May 3, 1999, FEMA 342, 140 p. Fujita, T.T., 1992: Mystery of Severe Storms, University of Chicago, 298 p.
Fujita, T.T., 1971: Proposed characterization of tornadoes and hurricanes by area and intensity, SMRP No. 91, 42 p. Fujita, T.T. and A.D. Pearson, 1973: Results of FPP classification of 1971 and 1972 tornadoes. Preprints, 8th Conference on Severe Local Storms, Amer. Meteor. Soc., 142-145. Grazulis, T.P., 1993: Significant Tornadoes. St. Johnsbury, VT, Environmental Films. Grazulis, T.P., 2001: The Tornado: Nature’s Ultimate Windstorm. University of Oklahoma Press, 324 p. Marshall, T.P., 2003: The La Plata, MD tornado: Issues regarding F-scale, Preprints/CD-ROM, Symposium on the F-scale and Severe Weather Damage Assessment, Long Beach, CA, Amer. Meteor. Soc., this issue. McDonald, J.R. and R.F. Abbey, 1979: Comparison of the NSSFC and DAPPLE tornado data tapes, Preprints, 11th Conference On Severe Local Storms, Amer. Meteor. Soc., 235-240. McDonald, J.R., 2003: F-scale modification process and proposed revisions, Preprints/CD-ROM, Symposium on the F-scale and Severe Weather Damage Assessment, Long Beach, CA, Amer. Meteor. Soc., this issue. Schaefer, J.T. and R. Edwards, 1999. The SPC tornado/severe thunderstorm database. Preprints, 11th Conference of Applied Climatology, Amer. Meteor. Soc., 215-220. Schaefer, J.T., R.S. Schneider, and M.P. Kay, 2002: The robustness of tornado hazard estimates. Preprints, Third Symposium on Environmental Applications, Orlando, FL, Amer. Meteor. Soc., 35-41. Tecson, J.J., T.T. Fujita and R.F. Abbey, 1979: Statistics of U.S. tornadoes based on the DAPPLE (Damage Area Per Path LEngth) tornado tape. Preprints, 9th Conference On Severe Local Storms, Amer. Meteor. Soc., 227-234.