Embed Size (px)
Citation preview

Contents
i
dex
1
2
3
4
5
6
7
8
9
A
In
ContentsIntroduction.................................................................................1Confirming Package Contents....................................................2Safety Information ......................................................................4Operating Precautions................................................................7Operating Procedure Descriptions in this Manual ....................12
Chapter 1 Overview ____________________________________13
1.1 Product Overview .......................................................13
1.2 Features .....................................................................14
1.3 Measurement Flowchart .............................................17Initial instrument preparations ...................................................19Install and connect the instrument, and turn the power on .......19Other preparations ....................................................................19Confirming Instrument Settings and Connecting to the Lines to be Measured .........................................................................20Start recording and analyze recorded measurement data. .......21
Chapter 2 Names and Functions of Parts and
Basic Setup _________________________________232.1 Panel and Operating Keys .........................................23
2.2 Basic Operations ........................................................27
2.3 Screen Configurations ................................................28
2.4 Common Screen Elements ........................................32
2.5 Internal Operating Status and Memory Usage ...........342.5.1 When Memory Partitioning is Disabled
(Partition: [No]) ........................................................342.5.2 Using Memory Partitioning (Partition: [ON]) ............35
Chapter 3 Measurement Preparations_________________37
3.1 Initial Instrument Preparations ...................................37Apply the appropriate label to the input terminals .....................37Apply the appropriate labels to the voltage measurement and clamp sensor leads. ..................................................................38
Contents
ii
Attach the strap. ....................................................................... 38Install the 9459 Battery Pack .................................................... 39Charge the 9459 Battery Pack .................................................. 40
3.2 Connecting the AC Adapter ....................................... 41
3.3 Connecting the Voltage Cords .................................. 42
3.4 Connecting Clamp Sensors ....................................... 44
3.5 Turning the Power On and Off ................................... 46
3.6 Other Preparations .................................................... 48Select the screen color scheme to match the input terminal labels ........................................................................................ 48Select the naming convention to be applied to each phase line measurement on the display. .................................................... 49
3.7 Auxiliary Function (KEY LOCK) ................................. 51
3.8 Auxiliary Function (Save screen image) ................... 52
Chapter 4 Pre-Measurement and System Settings ___ 53
4.1 Basic Setup (Typical Settings) ................................... 54
4.2 Selecting the Measurement Method (SYSTEM Screen)[MEASURE] ................................. 57Selecting the Line Frequency (Frequency) ............................... 58Setting the Wiring Method (Wiring) ........................................... 58Setting the Line Voltage (Nominal Line Voltage) of the Lines to be Measured ......................................................................... 59Selecting the Clamp Sensor Model and Current Range ........... 60Setting the PT Ratio (when measuring using a transformer) .... 61Setting the CT Ratio (when measuring using a transformer) .... 61Selecting the Voltage Harmonic Calculation Method ................ 62Selecting the Power Factor Calculation Method (PF Type) ...... 62
4.3 Setting the Recording Method [REC&EVENT] .......... 63Setting the Method for Recording to Internal Memory (Partition) .................................................................................. 63Setting the Recording Interval (Interval) ................................... 64Setting Demand Period ............................................................. 65Setting Recording Start and Stop Times .................................. 66
4.4 Setting Event Detection [REC&EVENT] .................... 67Start Event • Stop Event ........................................................... 68Manual Events .......................................................................... 68Setting Timed Events ................................................................ 69Setting Inrush Events ................................................................ 69Setting Transient Events ........................................................... 70Setting Voltage Swell, Dip and Interruption Events .................. 71
Contents
iii
dex
1
2
3
4
5
6
7
8
9
A
In
4.5 Changing Instrument System Settings [SYSTEM] .....72Displaying the Instrument's Version Number (Version) .............72Changing the Display Language (Language) ............................73Changing Screen Colors (Color) ...............................................73Enable or Disable Beep Sounds (Beep) ...................................74Setting the LCD Backlight Timeout (Backlight) .........................74Adjusting Screen Contrast (Contrast) .......................................75Setting the Clock (Clock) ...........................................................76Viewing the Serial Number ........................................................76
4.6 Initializing the Instrument (System Reset) ..................77
Chapter 5 Making Connections and Starting & Stopping Measurement _______________________________79
5.1 Pre-Operation Inspection ...........................................79
5.2 Connecting to the Lines to be Measured ...................81
5.3 Verifying Correct Wiring (Connection Check) ............86
5.4 Starting and Stopping Recording ...............................88Starting and Stopping Recording Without Memory Partitioning (Partition: OFF) .........................................................................89Starting and Stopping Recording with Partitioned Memory (Partition: ON) ...........................................................................92
5.5 Erasing Data ..............................................................93
5.6 Recovering From a Long-Term Power Outage ..........94
Chapter 6 Viewing Data________________________________95
6.1 Viewing Instantaneous Data (VIEW Screen) .............96Holding the Screen Display (Common to all VIEW screens) ....96Viewing Waveforms [WAVEFORM] ..........................................97Vector Display [VECTOR] .........................................................98Displaying Harmonics [HARMONICS] ......................................99Displaying the DMM Screen (voltage, current and instantaeous power values) [DMM] ..............................................................101
6.2 Displaying a Time Series Plot (TIME PLOT screen) 102Common Operations and Screen Items (Common to TIME PLOT screens) ..........................................102Displaying the Rms Fluctuation Graph [RMS] .........................103Displaying a Voltage Fluctuation Graph [DIP/SWELL] ............105Displaying a Demand Graph [DEMAND] ................................106Displaying an Energy Consumption Graph [ENERGY] ...........107
Contents
iv
6.3 Viewing Anomalous Phenomena (EVENT screen) . 108Viewing the [RMS WAVE] Screen .......................................... 108Viewing the [INRUSH] Screen ................................................ 109Detection Methods and Recording Contents of Events .......... 110Operations Common to the EVENT Screens ......................... 114Viewing Event Detection Details [DETAILS] ........................... 117Displaying Detected Event Waveforms [WAVEFORM] .......... 120Displaying Detected Voltage Fluctuation Events [RMS WAVE] 121Displaying Detected Inrush Current Events [INRUSH] ........... 122
6.4 Viewing Recorded Data ([REVIEW] State) .............. 1236.4.1 Viewing Only Data Recorded in Memory
Partition No. 1 ....................................................... 1236.4.2 Viewing Data Recorded in Multiple Memory
Partitions ............................................................... 124Analyzing TIME PLOT data .................................................... 125Analyzing EVENT data ........................................................... 125
Chapter 7 Viewing Data on a Computer______________127
7.1 Overview .................................................................. 1277.1.1 PC System Requirements .................................... 1287.1.2 Files on the CD ..................................................... 1297.1.3 Preparing to Run the Application Programs ......... 1297.1.4 Running the Application Programs ....................... 129
7.2 Installing JRE ........................................................... 130
7.3 Installing the Application Programs ......................... 132Uninstall Procedure ................................................................ 134
7.4 Connecting the Instrument and Computer with the Supplied USB Cable ................................................ 134
7.5 Starting the Instrument Application Programs ......... 138
Chapter 8 Specifications _____________________________139
8.1 General Specifications ............................................. 139
8.2 Detailed Specifications of Measurement Parameters 144
8.3 Event Specifications ................................................ 151
8.4 Function Specifications ........................................... 153
8.5 Calculation Formulas ............................................... 157
Contents
v
dex
1
2
3
4
5
6
7
8
9
A
In
Chapter 9 Maintenace and Service __________________ 165
9.1 Troubleshooting .......................................................165
9.2 Cleaning ...................................................................167
9.3 Battery Pack Replacement and Disposal .................168
9.4 Disposing of the Instrument .....................................170
Appendix ___________________________________ A1Appendix 1 Interval and Recording Time Settings ........................ A1
Appendix 2 Displayed and Measurement Ranges ........................ A4
Appendix 3 Power Range Structure .............................................. A5
Appendix 4 Clamp Sensor Combined Accuracy............................ A6
Appendix 5 List of Settings (Default Settings) ............................... A7
Appendix 6 Definitions................................................................... A8
Index __________________________________ Index 1

Contents
vi
Introduction
1
Thank you for purchasing the HIOKI "Model 3197 Power Quality Ana- lyzer." To obtain maximum performance from the instrument, please read this manual carefully, and keep it handy for future reference.
In this document, the “instrument” means the Model 3197 Power Quality Analyzer.
Optional clamp-on sensors (or clamp-on leakage sensors, (⇒ p.3)) are required to measure current with this instrument. These are called clamp sensors in the rest of this manual.Refer to the manual provided with the clamp sensors for details.
Registered trademarks
• Windows is a registered trademark of Microsoft Corporation in the United States and/or other countries.
• Sun, Sun Microsystems and Java are trademarks or registered trade-marks of Sun Microsystems, Inc. in the USA and other countries.
• Adobe and the Adobe Reader are trademarks of Adobe Systems Incorporated.
Introduction
Confirming Package Contents
2
Confirming Package Contents
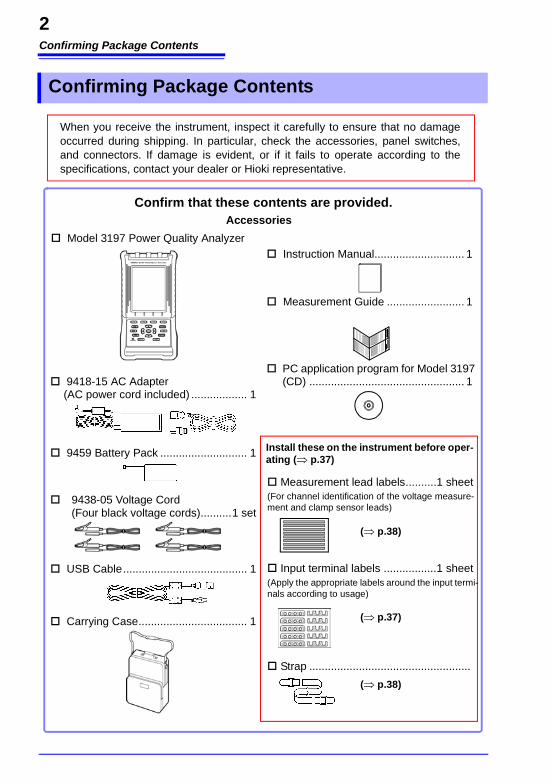
Instruction Manual............................. 1
Measurement Guide ......................... 1
PC application program for Model 3197 (CD) .................................................. 1
Model 3197 Power Quality Analyzer
Confirm that these contents are provided.Accessories
When you receive the instrument, inspect it carefully to ensure that no damage occurred during shipping. In particular, check the accessories, panel switches, and connectors. If damage is evident, or if it fails to operate according to the specifications, contact your dealer or Hioki representative.
9418-15 AC Adapter (AC power cord included) .................. 1
9459 Battery Pack ............................ 1
9438-05 Voltage Cord (Four black voltage cords)..........1 set
USB Cable........................................ 1
Carrying Case................................... 1
Install these on the instrument before oper-ating (⇒ p.37)
Measurement lead labels..........1 sheet(For channel identification of the voltage measure-ment and clamp sensor leads)
Input terminal labels .................1 sheet(Apply the appropriate labels around the input termi-nals according to usage)
Strap ....................................................
(⇒ p.38)
(⇒ p.37)
(⇒ p.38)
Confirming Package Contents
3
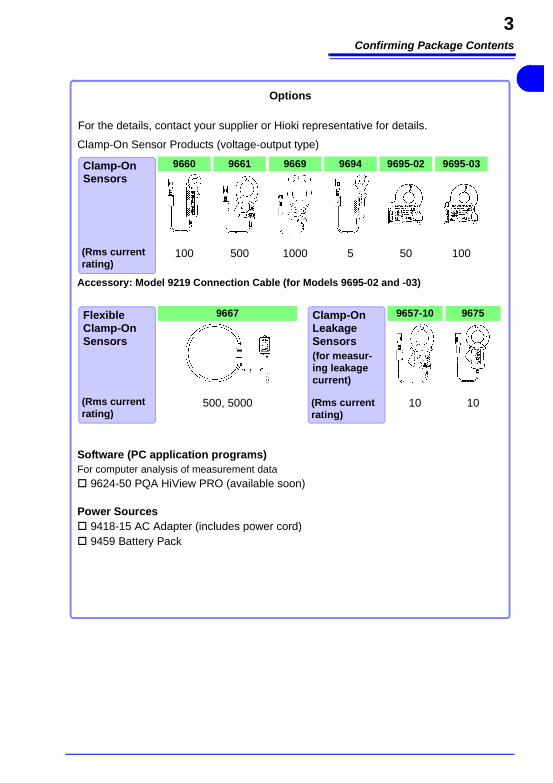
Options
For the details, contact your supplier or Hioki representative for details.
Clamp-On Sensor Products (voltage-output type)
Accessory: Model 9219 Connection Cable (for Models 9695-02 and -03)
Software (PC application programs)For computer analysis of measurement data
9624-50 PQA HiView PRO (available soon)
Power Sources 9418-15 AC Adapter (includes power cord) 9459 Battery Pack
9660 9661 9669 9694 9695-02 9695-03
100 500 1000 5 50 100
9667 9657-10 9675
500, 5000 10 10
Clamp-On Sensors
(Rms current rating)
Flexible Clamp-On Sensors
(Rms current rating)
Clamp-On Leakage Sensors (for measur-ing leakage current)
(Rms current rating)
Safety Information
4
This manual contains information and warnings essential for safe opera-tion of the instrument and for maintaining it in safe operating condition. Before using it, be sure to carefully read the following safety precautions.
The following symbols in this manual indicate the relative importance of cautions and warnings.
Safety Information
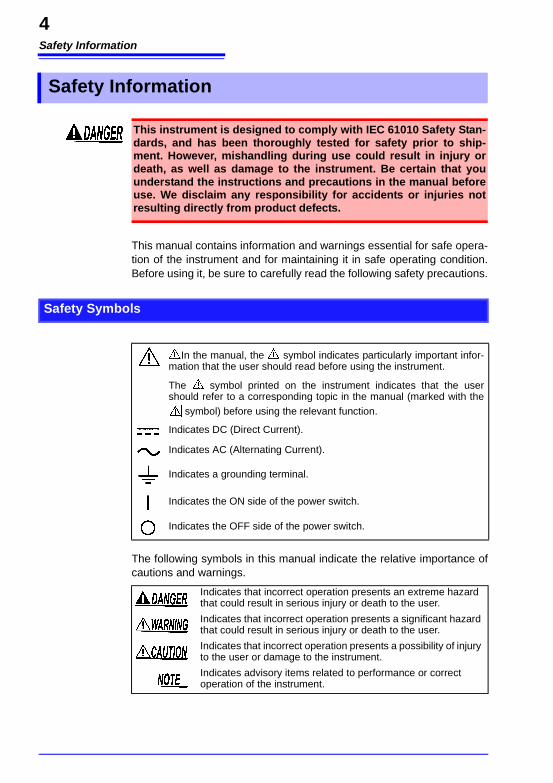
This instrument is designed to comply with IEC 61010 Safety Stan-dards, and has been thoroughly tested for safety prior to ship-ment. However, mishandling during use could result in injury or death, as well as damage to the instrument. Be certain that you understand the instructions and precautions in the manual before use. We disclaim any responsibility for accidents or injuries not resulting directly from product defects.
Safety Symbols
In the manual, the symbol indicates particularly important infor-mation that the user should read before using the instrument.
The symbol printed on the instrument indicates that the user should refer to a corresponding topic in the manual (marked with the
symbol) before using the relevant function.
Indicates DC (Direct Current).
Indicates AC (Alternating Current).
Indicates a grounding terminal.
Indicates the ON side of the power switch.
Indicates the OFF side of the power switch.
Indicates that incorrect operation presents an extreme hazard that could result in serious injury or death to the user.
Indicates that incorrect operation presents a significant hazard that could result in serious injury or death to the user.
Indicates that incorrect operation presents a possibility of injury to the user or damage to the instrument.
Indicates advisory items related to performance or correct operation of the instrument.
Safety Information
5
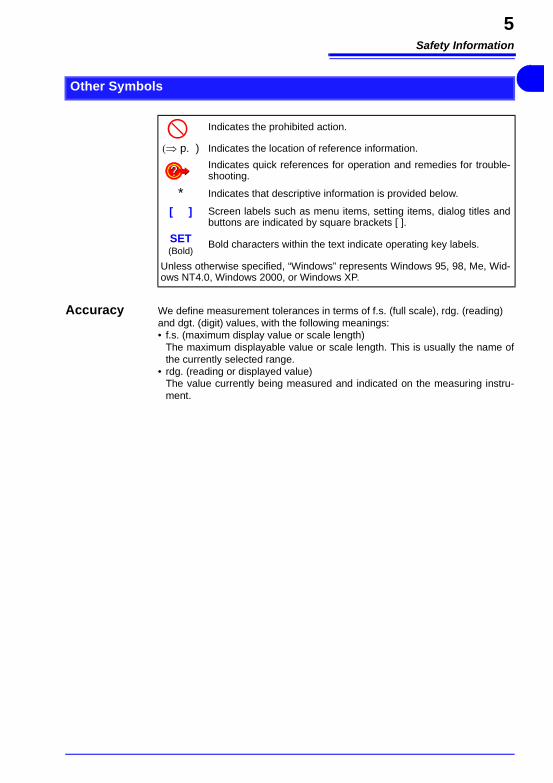
Accuracy We define measurement tolerances in terms of f.s. (full scale), rdg. (reading) and dgt. (digit) values, with the following meanings: • f.s. (maximum display value or scale length)
The maximum displayable value or scale length. This is usually the name of the currently selected range.
• rdg. (reading or displayed value) The value currently being measured and indicated on the measuring instru-ment.
Other Symbols
Indicates the prohibited action.
(⇒ p. ) Indicates the location of reference information.
Indicates quick references for operation and remedies for trouble-shooting.
* Indicates that descriptive information is provided below.
[ ] Screen labels such as menu items, setting items, dialog titles and buttons are indicated by square brackets [ ].
SET(Bold)
Bold characters within the text indicate operating key labels.
Unless otherwise specified, “Windows” represents Windows 95, 98, Me, Wid-ows NT4.0, Windows 2000, or Windows XP.
Safety Information
6
Measurement categories (Overvoltage categories)
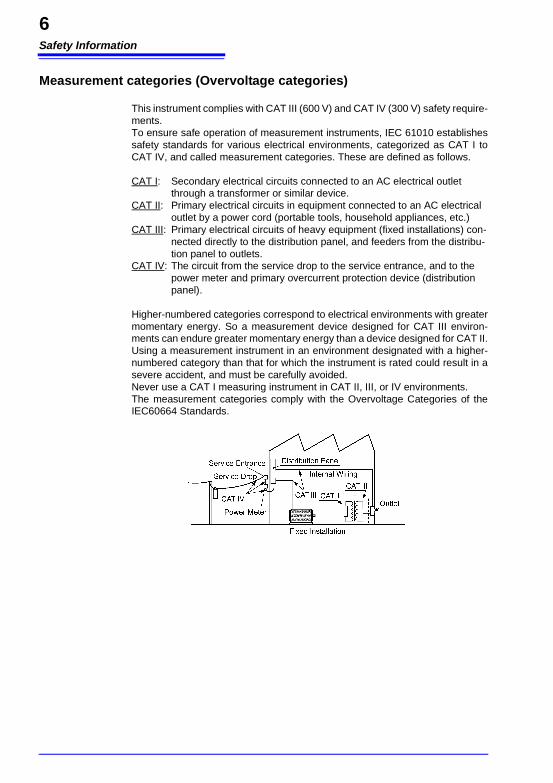
This instrument complies with CAT III (600 V) and CAT IV (300 V) safety require-ments.To ensure safe operation of measurement instruments, IEC 61010 establishes safety standards for various electrical environments, categorized as CAT I to CAT IV, and called measurement categories. These are defined as follows.
CAT I: Secondary electrical circuits connected to an AC electrical outlet through a transformer or similar device.
CAT II: Primary electrical circuits in equipment connected to an AC electrical outlet by a power cord (portable tools, household appliances, etc.)
CAT III: Primary electrical circuits of heavy equipment (fixed installations) con-nected directly to the distribution panel, and feeders from the distribu-tion panel to outlets.
CAT IV: The circuit from the service drop to the service entrance, and to the power meter and primary overcurrent protection device (distribution panel).
Higher-numbered categories correspond to electrical environments with greater momentary energy. So a measurement device designed for CAT III environ-ments can endure greater momentary energy than a device designed for CAT II. Using a measurement instrument in an environment designated with a higher-numbered category than that for which the instrument is rated could result in a severe accident, and must be carefully avoided. Never use a CAT I measuring instrument in CAT II, III, or IV environments. The measurement categories comply with the Overvoltage Categories of the IEC60664 Standards.
Operating Precautions
7
Follow these precautions to ensure safe operation and to obtain the full benefits of the various functions.
• Before using the instrument the first time, verify that it operates nor-mally to ensure that the no damage occurred during storage or ship-ping. If you find any damage, contact your dealer or Hioki representative.
• Before using the instrument, make sure that the insulation on the 9438-05 Voltage Cord and clamp sensor leads is undamaged, and that no bare conductors are improperly exposed. Using the instrument in such conditions could cause an electric shock, so contact your dealer or Hioki representative for replacements.
• Operating temperature and humidity: 0 to 40°C at 80% RH or less (non-condensating)
• Temperature and humidity range for guaranteed accuracy: 23±5°C, 80%RH or less
PlacementDo not place the instrument on an unstable or slanted surface.
Operating Precautions
Before Use
Instrument Installation
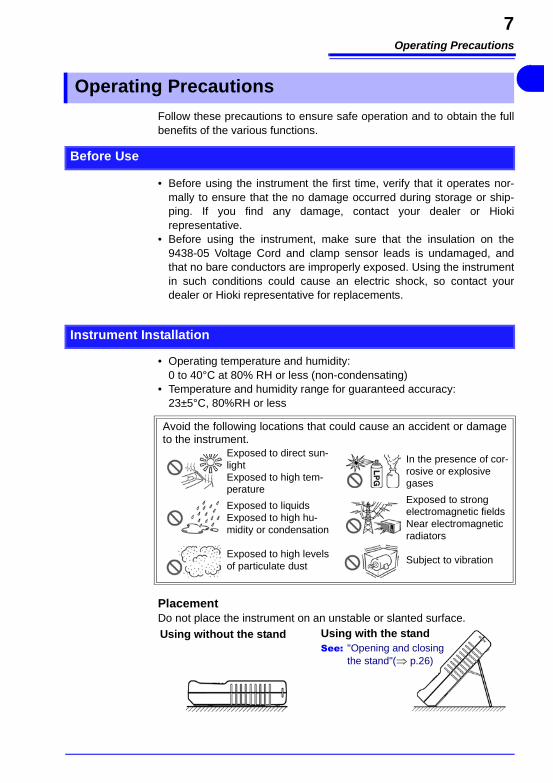
Avoid the following locations that could cause an accident or damage to the instrument.
Exposed to direct sun-lightExposed to high tem-perature
In the presence of cor-rosive or explosive gases
Exposed to liquidsExposed to high hu-midity or condensation
Exposed to strong electromagnetic fieldsNear electromagnetic radiators
Exposed to high levels of particulate dust
Subject to vibration
Using without the stand Using with the standSee: "Opening and closing
the stand"(⇒ p.26)
Operating Precautions
8
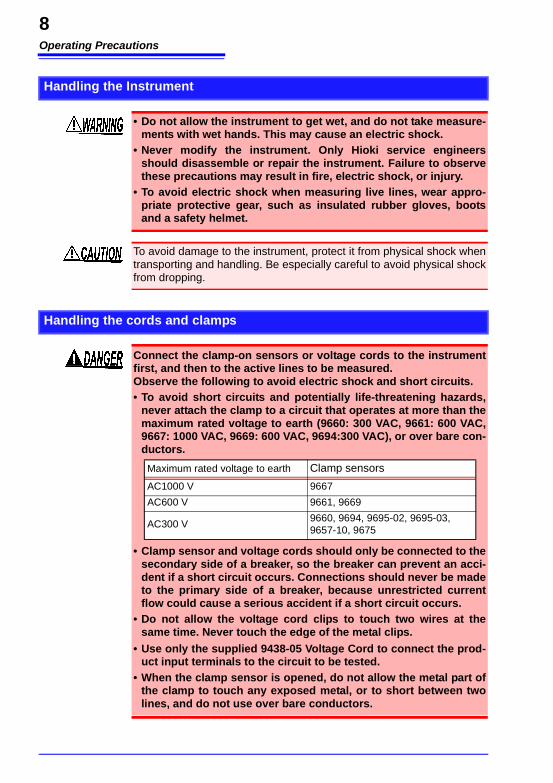
Handling the Instrument
• Do not allow the instrument to get wet, and do not take measure-ments with wet hands. This may cause an electric shock.
• Never modify the instrument. Only Hioki service engineers should disassemble or repair the instrument. Failure to observe these precautions may result in fire, electric shock, or injury.
• To avoid electric shock when measuring live lines, wear appro-priate protective gear, such as insulated rubber gloves, boots and a safety helmet.
To avoid damage to the instrument, protect it from physical shock when transporting and handling. Be especially careful to avoid physical shock from dropping.
Handling the cords and clamps
Connect the clamp-on sensors or voltage cords to the instrument first, and then to the active lines to be measured. Observe the following to avoid electric shock and short circuits.• To avoid short circuits and potentially life-threatening hazards,
never attach the clamp to a circuit that operates at more than the maximum rated voltage to earth (9660: 300 VAC, 9661: 600 VAC, 9667: 1000 VAC, 9669: 600 VAC, 9694:300 VAC), or over bare con-ductors.
• Clamp sensor and voltage cords should only be connected to the secondary side of a breaker, so the breaker can prevent an acci-dent if a short circuit occurs. Connections should never be made to the primary side of a breaker, because unrestricted current flow could cause a serious accident if a short circuit occurs.
• Do not allow the voltage cord clips to touch two wires at the same time. Never touch the edge of the metal clips.
• Use only the supplied 9438-05 Voltage Cord to connect the prod- uct input terminals to the circuit to be tested.
• When the clamp sensor is opened, do not allow the metal part of the clamp to touch any exposed metal, or to short between two lines, and do not use over bare conductors.
Maximum rated voltage to earth Clamp sensors
AC1000 V 9667
AC600 V 9661, 9669
AC300 V9660, 9694, 9695-02, 9695-03, 9657-10, 9675
Operating Precautions
9
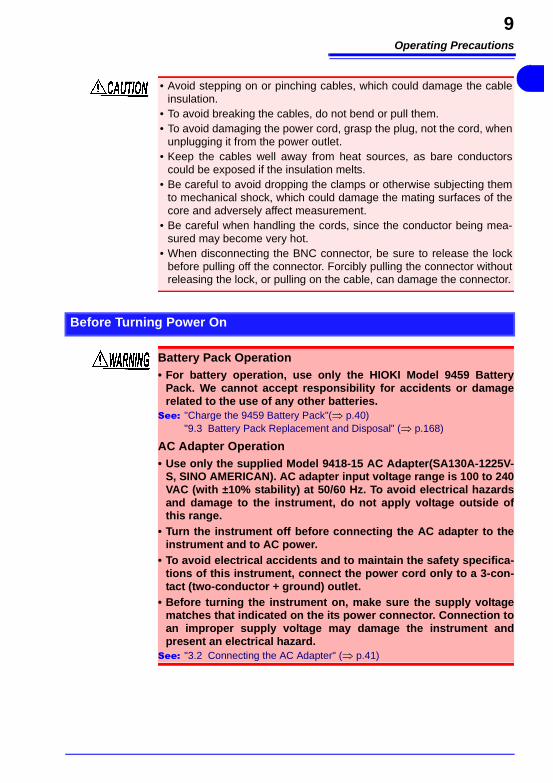
• Avoid stepping on or pinching cables, which could damage the cable insulation.
• To avoid breaking the cables, do not bend or pull them.• To avoid damaging the power cord, grasp the plug, not the cord, when
unplugging it from the power outlet.• Keep the cables well away from heat sources, as bare conductors
could be exposed if the insulation melts.• Be careful to avoid dropping the clamps or otherwise subjecting them
to mechanical shock, which could damage the mating surfaces of the core and adversely affect measurement.
• Be careful when handling the cords, since the conductor being mea-sured may become very hot.
• When disconnecting the BNC connector, be sure to release the lock before pulling off the connector. Forcibly pulling the connector without releasing the lock, or pulling on the cable, can damage the connector.
Before Turning Power On
Battery Pack Operation• For battery operation, use only the HIOKI Model 9459 Battery
Pack. We cannot accept responsibility for accidents or damage related to the use of any other batteries.
See: "Charge the 9459 Battery Pack"(⇒ p.40) "9.3 Battery Pack Replacement and Disposal" (⇒ p.168)
AC Adapter Operation• Use only the supplied Model 9418-15 AC Adapter(SA130A-1225V-
S, SINO AMERICAN). AC adapter input voltage range is 100 to 240 VAC (with ±10% stability) at 50/60 Hz. To avoid electrical hazards and damage to the instrument, do not apply voltage outside of this range.
• Turn the instrument off before connecting the AC adapter to the instrument and to AC power.
• To avoid electrical accidents and to maintain the safety specifica-tions of this instrument, connect the power cord only to a 3-con-tact (two-conductor + ground) outlet.
• Before turning the instrument on, make sure the supply voltage matches that indicated on the its power connector. Connection to an improper supply voltage may damage the instrument and present an electrical hazard.
See: "3.2 Connecting the AC Adapter" (⇒ p.41)
Operating Precautions
10
Input and Measurement Precautions
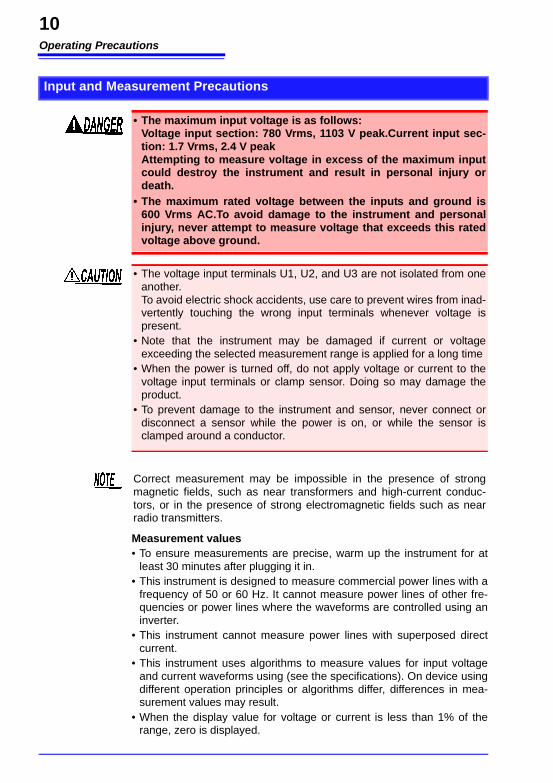
• The maximum input voltage is as follows: Voltage input section: 780 Vrms, 1103 V peak.Current input sec-tion: 1.7 Vrms, 2.4 V peak Attempting to measure voltage in excess of the maximum input could destroy the instrument and result in personal injury or death.
• The maximum rated voltage between the inputs and ground is 600 Vrms AC.To avoid damage to the instrument and personal injury, never attempt to measure voltage that exceeds this rated voltage above ground.
• The voltage input terminals U1, U2, and U3 are not isolated from one another. To avoid electric shock accidents, use care to prevent wires from inad-vertently touching the wrong input terminals whenever voltage is present.
• Note that the instrument may be damaged if current or voltage exceeding the selected measurement range is applied for a long time
• When the power is turned off, do not apply voltage or current to the voltage input terminals or clamp sensor. Doing so may damage the product.
• To prevent damage to the instrument and sensor, never connect or disconnect a sensor while the power is on, or while the sensor is clamped around a conductor.
Correct measurement may be impossible in the presence of strong magnetic fields, such as near transformers and high-current conduc-tors, or in the presence of strong electromagnetic fields such as near radio transmitters.
Measurement values• To ensure measurements are precise, warm up the instrument for at
least 30 minutes after plugging it in.• This instrument is designed to measure commercial power lines with a
frequency of 50 or 60 Hz. It cannot measure power lines of other fre-quencies or power lines where the waveforms are controlled using an inverter.
• This instrument cannot measure power lines with superposed direct current.
• This instrument uses algorithms to measure values for input voltage and current waveforms using (see the specifications). On device using different operation principles or algorithms differ, differences in mea-surement values may result.
• When the display value for voltage or current is less than 1% of the range, zero is displayed.
Operating Precautions
11
• The storage temperature range is -10 to 50°C at relative humidity not exceeding 80%.
• The battery pack should be removed when the instrument is stored. Store the battery pack in a cool place.
• The instrument should be recalibrated before use after long-term stor-age.
Using VT and CT
• When the voltage or current for the power line being measured exceeds the maximum rated input for this device, use an external PT or CT.
• When using an external PT or CT, make sure you use a device with a minimal phase difference. By setting the PT or CT ratio, you can read measurement values directly.
Instrument Storage
CD Handling
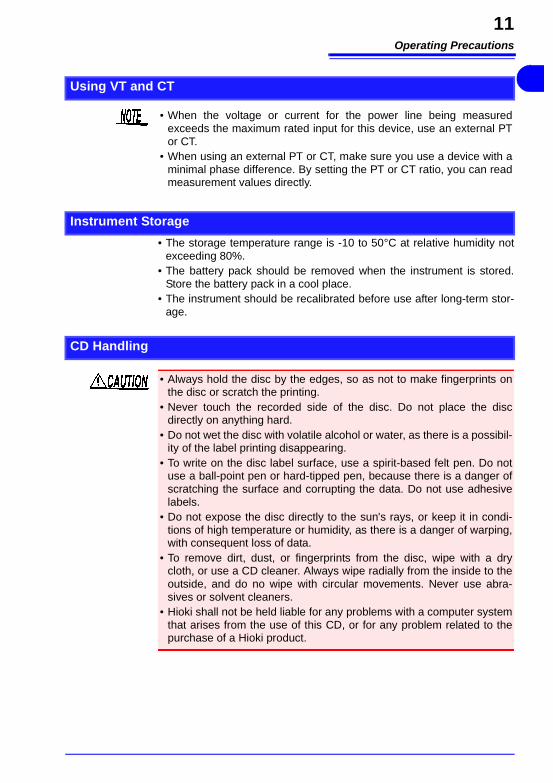
• Always hold the disc by the edges, so as not to make fingerprints on the disc or scratch the printing.
• Never touch the recorded side of the disc. Do not place the disc directly on anything hard.
• Do not wet the disc with volatile alcohol or water, as there is a possibil-ity of the label printing disappearing.
• To write on the disc label surface, use a spirit-based felt pen. Do not use a ball-point pen or hard-tipped pen, because there is a danger of scratching the surface and corrupting the data. Do not use adhesive labels.
• Do not expose the disc directly to the sun's rays, or keep it in condi-tions of high temperature or humidity, as there is a danger of warping, with consequent loss of data.
• To remove dirt, dust, or fingerprints from the disc, wipe with a dry cloth, or use a CD cleaner. Always wipe radially from the inside to the outside, and do no wipe with circular movements. Never use abra-sives or solvent cleaners.
• Hioki shall not be held liable for any problems with a computer system that arises from the use of this CD, or for any problem related to the purchase of a Hioki product.
Operating Procedure Descriptions in this Manual
12
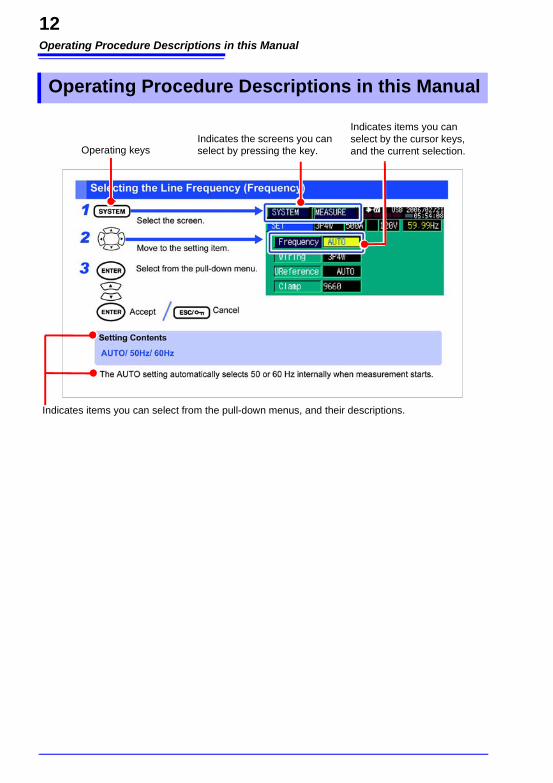
Operating Procedure Descriptions in this Manual
Operating keysIndicates the screens you can select by pressing the key.
Indicates items you can select by the cursor keys, and the current selection.
Indicates items you can select from the pull-down menus, and their descriptions.
1.1 Product Overview
13
1Overview Chapter 1
1.1 Product Overview
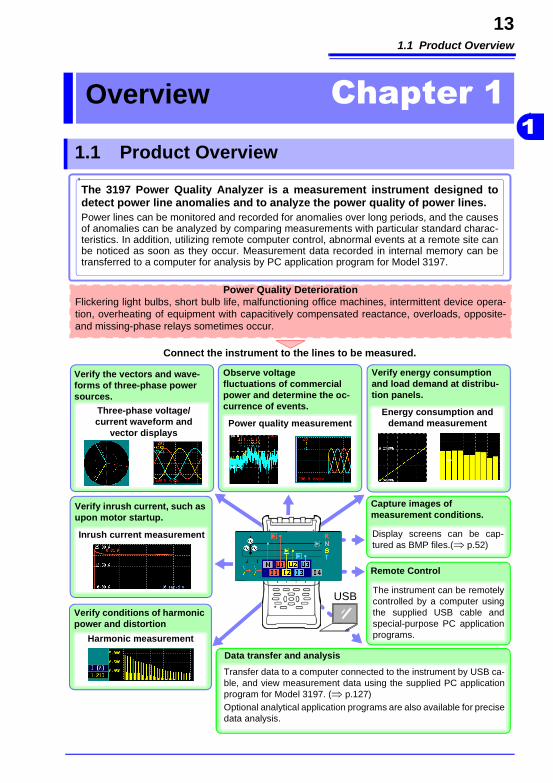
The 3197 Power Quality Analyzer is a measurement instrument designed to detect power line anomalies and to analyze the power quality of power lines.Power lines can be monitored and recorded for anomalies over long periods, and the causes of anomalies can be analyzed by comparing measurements with particular standard charac-teristics. In addition, utilizing remote computer control, abnormal events at a remote site can be noticed as soon as they occur. Measurement data recorded in internal memory can be transferred to a computer for analysis by PC application program for Model 3197.
Connect the instrument to the lines to be measured.
Power Quality DeteriorationFlickering light bulbs, short bulb life, malfunctioning office machines, intermittent device opera-tion, overheating of equipment with capacitively compensated reactance, overloads, opposite- and missing-phase relays sometimes occur.
Transfer data to a computer connected to the instrument by USB ca-ble, and view measurement data using the supplied PC application program for Model 3197. (⇒ p.127)Optional analytical application programs are also available for precise data analysis.
Verify the vectors and wave-forms of three-phase power sources.
Three-phase voltage/current waveform and
vector displays
Observe voltage fluctuations of commercial power and determine the oc-currence of events.
Power quality measurementEnergy consumption and
demand measurement
Remote Control
The instrument can be remotely controlled by a computer using the supplied USB cable and special-purpose PC application programs.
Verify inrush current, such as upon motor startup.
Inrush current measurement
Verify conditions of harmonic power and distortion
Harmonic measurement
Capture images of measurement conditions.
Display screens can be cap-tured as BMP files.(⇒ p.52)
Data transfer and analysis
USB
Verify energy consumption and load demand at distribu-tion panels.
1.2 Features
14
1.2 Features
Supports various power line wiring configurationsMeasures three channels of voltage and current. With just one instrument, measure voltage, current and power on single-phase 2-wire, single-phase 3-wire, three-phase 3-wire and three-phase 4-wire systems.Neutral current in three-phase 4-wire systems is available by calculation.
Vector multi-meter functionMeasurement line wiring connections can be checked from the initial screen.Verify phase detection (vector check), measure voltage and current, and check for miswired connections on a single screen.
Basic SetupUse "Basic Setup" to configure settings for the wiring configuration con-nections and the clamp sensors to be used. Standard line frequencies and voltages are detected and set automatically. The default settings can be used for detecting typical events.
Automatic data recording compression functionThis function begins recording at one-second intervals and automatically lengthens the recording interval to up to an hour as internal memory fills. This function helps to ensure that suitable data quantities are acquired for analysis, whether the overall measurement period is short or long. This function supports continuous measurement sessions of up to about 125 days.
Broad selection of clamp sensorsSelect from our present line of voltage-output type clamp sensors• Clamp-on sensor Models 9660, 9661, 9669, 9694, 9695-02, 9695-03• Clamp-on leak sensor Models 9657-10, 9675• Flexible clamp-on sensor Model 9667
1.2 Features
15
1
Simultaneous measurement of various power quality parametersThe following power quality parameters can be simultaneously mea-sured and recorded.• Transient overvoltage (impulse)• Voltage swells, voltage dips, interruptions, frequency, voltage, voltage
waveform peaks, current, current waveform peaks, active power, apparent power, reactive power, power factor, displacement power factor, voltage unbalance factor, harmonic voltage, harmonic current, harmonic power, fundamental voltage phase difference, fundamental current phase difference, total harmonic voltage distortion factor (THD-F), K factor, active power value, reactive power value, active power demand, reactive power demand
See: "Detecting Anomalies and Phenomena Due to Drops in Power Quality" (⇒ p.A8)
Display time series plots of rms values and voltage fluctuationsRecord and display fluctuations in various power quality parameters as a time series plot.Display and record calculated maximum, average and minimum values during each measurement interval. Rms voltage is calculated for one waveform shifted by half of a cycle, and is recorded and displayed as a time series plot of voltage fluctua-tions to detect voltage swell, voltage dip and interruption events.
Measure demand and energy consumptionMeasure polarity-specific demand parameters such as consumption, regeneration, lag, lead and energy consumption. Demand and energy consumption can be verified on a time series plot.
Event detection functionSet thresholds at which to detect and record events while measuring.Detected events can be analyzed using the event monitor, event list or event waveform display.Event detection is available for voltage swells, voltage dips (instanta-neous dips), interruptions, inrush current, transient overvoltage, timed and manually triggered events.
Measure inrush currentMeasure motor startup current. Rms current is recorded for 30 seconds and displayed graphically.
Internal memory with backup battery preserves recorded mea-surement dataMeasurement data is recorded into the 4 MB internal memory and retained by a lithium-ion battery that should not require replacement for about 10 years. So data is preserved even during power outages.
1.2 Features
16
Color LCD includedThe instrument includes a 4.7-inch color STN liquid crystal display.Numerical values, waveforms and graphs are clearly displayed.
Select from three display languagesSelect Japanese, English or Chinese display text. Help messages describing the settings appear in the selected language
Selectable channel (input terminal) colorsSelect from five channel color schemes.Match the screen display colors (waveforms, vectors and numerical val-ues) to the input terminal and measurement lead labels.
AC adapter and rechargeable battery pack includedThe AC adapter and NiMH rechargeable battery pack are included as standard accessories. The battery can be charged whether the instru-ment is turned on or off, and powers the instrument for up to six hours of continuous operation.
Hand-held designThe instrument weighs only 1.2 kg, and the rubber grip makes it comfort-ably hand portable.
USB 2.0 interface and PC application program for Model 3197are includedThe instrument can be remotely controlled, and data can be transferred and analyzed on a computer using the supplied USB cable and special-purpose PC application programs.
Detect wiring connectionsDetection of phases, disconnected voltage cords and reverse-connected clamp sensors can be determined from the Wiring Confirmation screen, so miswiring can be avoided when measuring.
Optional data analysis application programs (pending)Detailed analysis of measurement data recorded by the instrument is available with the optional Model 9624-50 PQA-HiView PRO data analy-sis application programs.
1.3 Measurement Flowchart
17
1
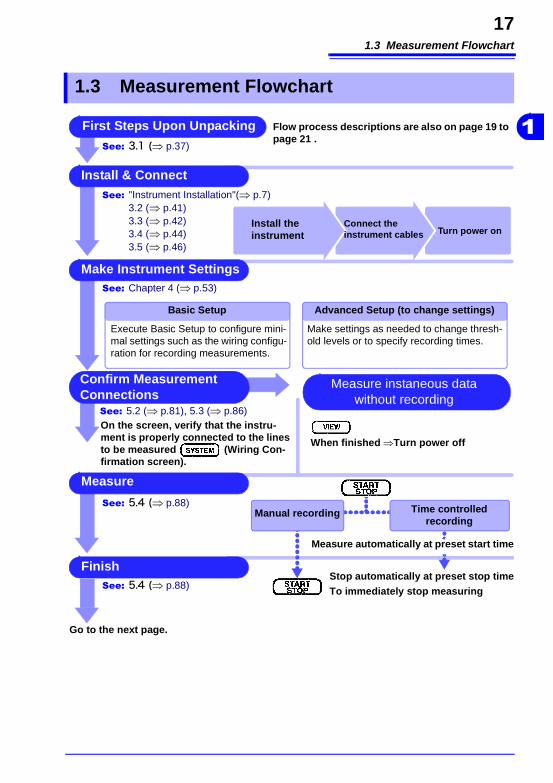
1.3 Measurement Flowchart
Install & Connect
Make Instrument Settings
Measure
Advanced Setup (to change settings)
Finish
Confirm Measurement Connections
On the screen, verify that the instru-ment is properly connected to the lines to be measured (Wiring Con-firmation screen).
Basic Setup
Execute Basic Setup to configure mini-mal settings such as the wiring configu-ration for recording measurements.
Make settings as needed to change thresh-old levels or to specify recording times.
First Steps Upon Unpacking
Stop automatically at preset stop timeTo immediately stop measuring
Manual recording
Measure automatically at preset start time
Install the instrument
Connect the instrument cables Turn power on
Time controlledrecording
See: 3.1 (⇒ p.37)
See: "Instrument Installation"(⇒ p.7) 3.2 (⇒ p.41) 3.3 (⇒ p.42) 3.4 (⇒ p.44) 3.5 (⇒ p.46)
See: Chapter 4 (⇒ p.53)
See: 5.2 (⇒ p.81), 5.3 (⇒ p.86)
See: 5.4 (⇒ p.88)
See: 5.4 (⇒ p.88)
When finished ⇒Turn power off
Measure instaneous data without recording
Flow process descriptions are also on page 19 to page 21 .
Go to the next page.
1.3 Measurement Flowchart
18
Finish
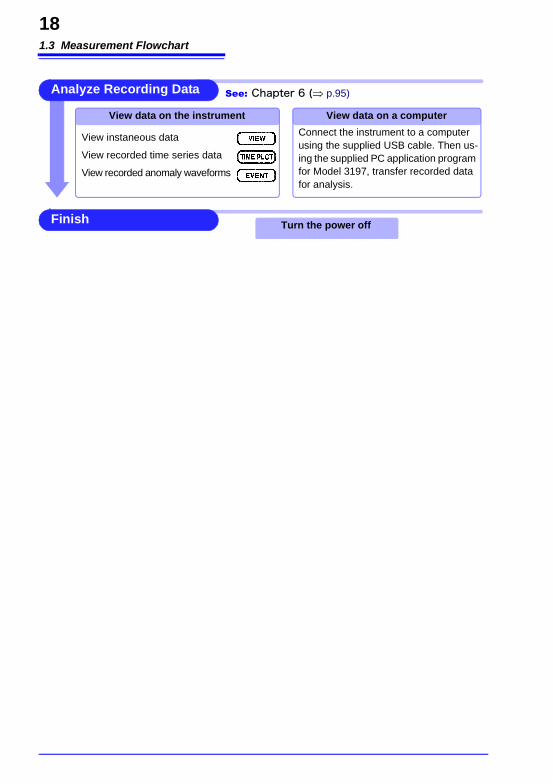
Analyze Recording Data
View data on the instrument
View instaneous data
View recorded time series data
View recorded anomaly waveforms
View data on a computer
Connect the instrument to a computer using the supplied USB cable. Then us-ing the supplied PC application program for Model 3197, transfer recorded data for analysis.
Turn the power off
See: Chapter 6 (⇒ p.95)
1.3 Measurement Flowchart
19
1
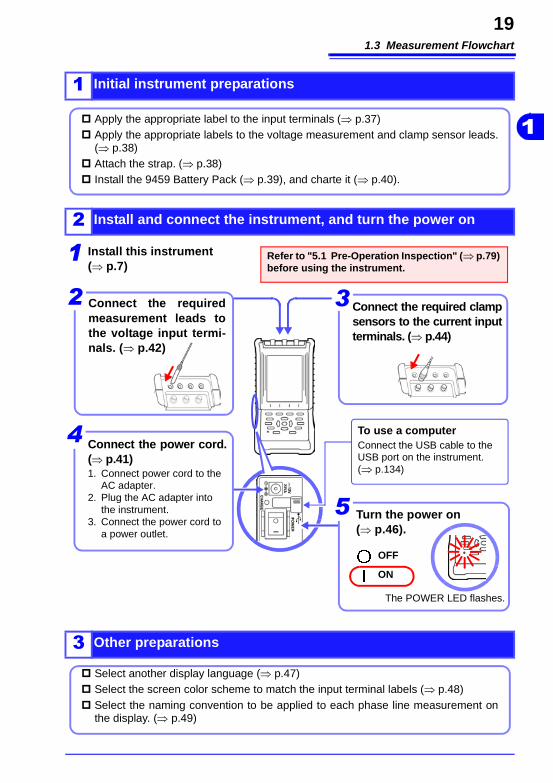
1 Initial instrument preparations
Apply the appropriate label to the input terminals (⇒ p.37)Apply the appropriate labels to the voltage measurement and clamp sensor leads.(⇒ p.38)Attach the strap. (⇒ p.38)Install the 9459 Battery Pack (⇒ p.39), and charte it (⇒ p.40).
2 Install and connect the instrument, and turn the power on
Install this instrument (⇒ p.7)
1 Refer to "5.1 Pre-Operation Inspection" (⇒ p.79)before using the instrument.
3 Connect the required clamp sensors to the current input terminals. (⇒ p.44)
To use a computerConnect the USB cable to the USB port on the instrument. (⇒ p.134)
Connect the power cord. (⇒ p.41)1. Connect power cord to the
AC adapter.2. Plug the AC adapter into
the instrument.3. Connect the power cord to
a power outlet.
4
2 Connect the required measurement leads to the voltage input termi-nals. (⇒ p.42)
Turn the power on (⇒ p.46).
OFF
ON
The POWER LED flashes.
5
3 Other preparations
Select another display language (⇒ p.47)Select the screen color scheme to match the input terminal labels (⇒ p.48)Select the naming convention to be applied to each phase line measurement on the display. (⇒ p.49)
1.3 Measurement Flowchart
20
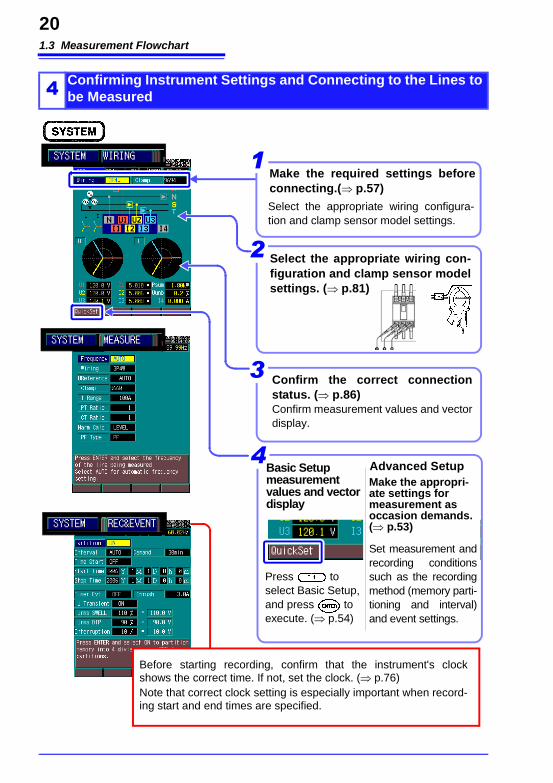
4 Confirming Instrument Settings and Connecting to the Lines to be Measured
Before starting recording, confirm that the instrument's clock shows the correct time. If not, set the clock. (⇒ p.76)Note that correct clock setting is especially important when record-ing start and end times are specified.
2 Select the appropriate wiring con-figuration and clamp sensor model settings. (⇒ p.81)
3 Confirm the correct connection status. (⇒ p.86)Confirm measurement values and vector display.
Press to select Basic Setup, and press to execute. (⇒ p.54)
Make the appropri-ate settings for measurement as occasion demands. (⇒ p.53)
Set measurement and recording conditions such as the recording method (memory parti-tioning and interval) and event settings.
4 Advanced Setup
Make the required settings before connecting.(⇒ p.57)
Select the appropriate wiring configura-tion and clamp sensor model settings.
1
Basic Setup measurement values and vector display
1.3 Measurement Flowchart
21
1
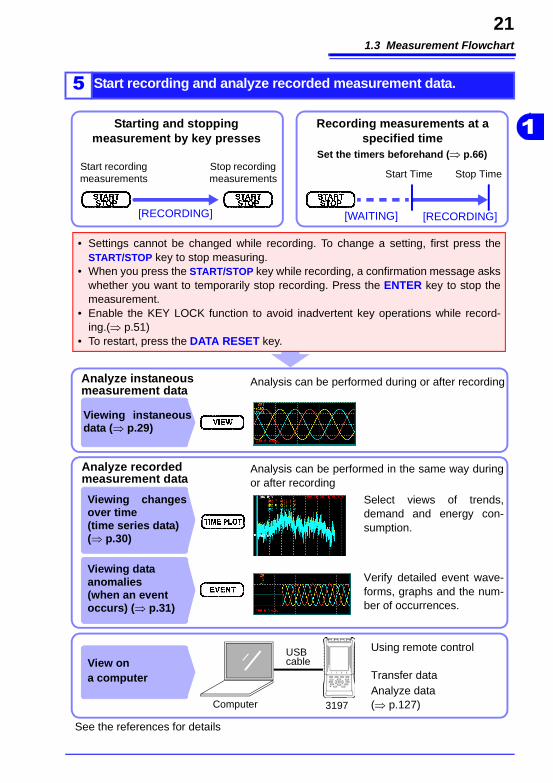
5 Start recording and analyze recorded measurement data.
Recording measurements at a specified time
Starting and stopping measurement by key presses
[RECORDING] [RECORDING][WAITING]
Start Time Stop Time
Set the timers beforehand (⇒ p.66)Start recording measurements
Stop recording measurements
Analyze instaneous measurement data
Select views of trends, demand and energy con-sumption.
Using remote control
Transfer data
Analysis can be performed during or after recording
Viewing data anomalies (when an event occurs) (⇒ p.31)
Viewing changes over time (time series data) (⇒ p.30)
Viewing instaneous data (⇒ p.29)
See the references for details
View on a computer
Analyze data (⇒ p.127)
• Settings cannot be changed while recording. To change a setting, first press the START/STOP key to stop measuring.
• When you press the START/STOP key while recording, a confirmation message asks whether you want to temporarily stop recording. Press the ENTER key to stop the measurement.
• Enable the KEY LOCK function to avoid inadvertent key operations while record-ing.(⇒ p.51)
• To restart, press the DATA RESET key.
Verify detailed event wave-forms, graphs and the num-ber of occurrences.
Analyze recorded measurement data
Analysis can be performed in the same way during or after recording
USB cable
Computer 3197

1.3 Measurement Flowchart
22
2.1 Panel and Operating Keys
23
2
Names and Functions of Parts and Basic Setup Chapter 2
2.1 Panel and Operating Keys
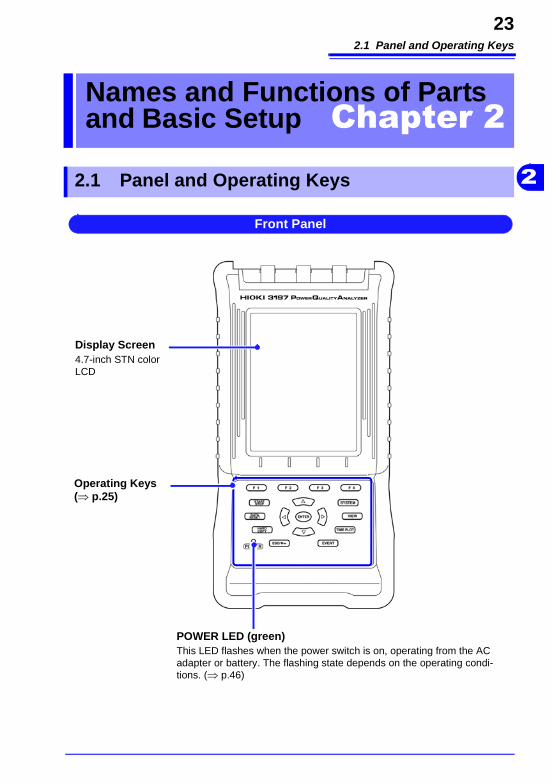
Front Panel
POWER LED (green)This LED flashes when the power switch is on, operating from the AC adapter or battery. The flashing state depends on the operating condi-tions. (⇒ p.46)
Operating Keys (⇒ p.25)
Display Screen4.7-inch STN color LCD
2.1 Panel and Operating Keys
24
POWER SwitchTurns the instrument on and off.
(⇒ p.46)
Power Off
Power On
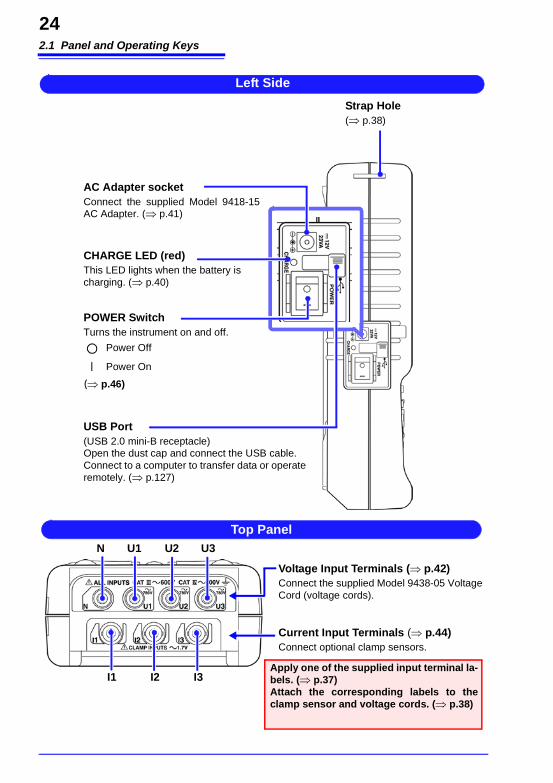
Left Side
AC Adapter socketConnect the supplied Model 9418-15 AC Adapter. (⇒ p.41)
USB Port(USB 2.0 mini-B receptacle)Open the dust cap and connect the USB cable.Connect to a computer to transfer data or operate remotely. (⇒ p.127)
CHARGE LED (red)This LED lights when the battery is charging. (⇒ p.40)
Strap Hole(⇒ p.38)
Voltage Input Terminals (⇒ p.42)Connect the supplied Model 9438-05 Voltage Cord (voltage cords).
Top Panel
Current Input Terminals (⇒ p.44)Connect optional clamp sensors.
Apply one of the supplied input terminal la-bels. (⇒ p.37)Attach the corresponding labels to the clamp sensor and voltage cords. (⇒ p.38)
N
I1 I3I2
U3U2U1
2.1 Panel and Operating Keys
25
2
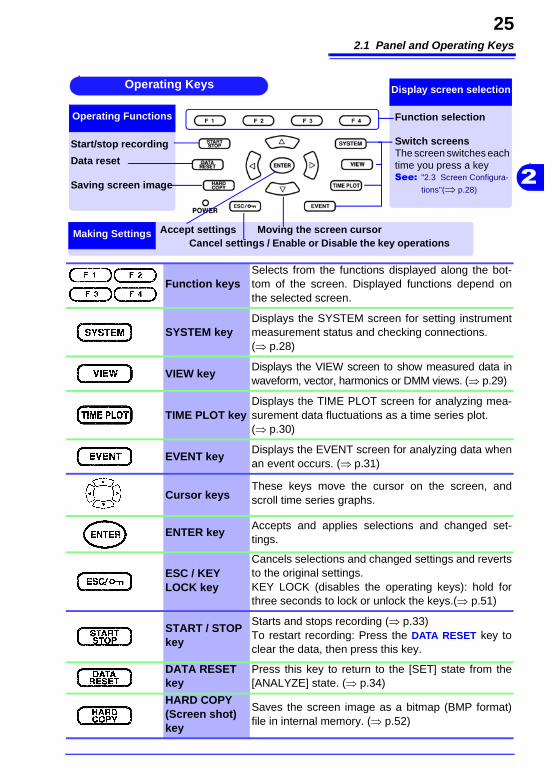
Function keysSelects from the functions displayed along the bot-tom of the screen. Displayed functions depend on the selected screen.
SYSTEM keyDisplays the SYSTEM screen for setting instrument measurement status and checking connections. (⇒ p.28)
VIEW keyDisplays the VIEW screen to show measured data in waveform, vector, harmonics or DMM views. (⇒ p.29)
TIME PLOT keyDisplays the TIME PLOT screen for analyzing mea-surement data fluctuations as a time series plot. (⇒ p.30)
EVENT keyDisplays the EVENT screen for analyzing data when an event occurs. (⇒ p.31)
Cursor keysThese keys move the cursor on the screen, and scroll time series graphs.
ENTER keyAccepts and applies selections and changed set-tings.
ESC / KEY LOCK key
Cancels selections and changed settings and reverts to the original settings.KEY LOCK (disables the operating keys): hold for three seconds to lock or unlock the keys.(⇒ p.51)
START / STOP key
Starts and stops recording (⇒ p.33)To restart recording: Press the DATA RESET key to clear the data, then press this key.
DATA RESET key
Press this key to return to the [SET] state from the [ANALYZE] state. (⇒ p.34)
HARD COPY (Screen shot) key
Saves the screen image as a bitmap (BMP format) file in internal memory. (⇒ p.52)
Operating Keys Display screen selection
Operating Functions
Making Settings
Switch screensThe screen switches each time you press a keySee: "2.3 Screen Configura-
tions"(⇒ p.28)
Function selection
Start/stop recording
Data reset
Saving screen image
Accept settingsCancel settings / Enable or Disable the key operations
Moving the screen cursor
2.1 Panel and Operating Keys
26
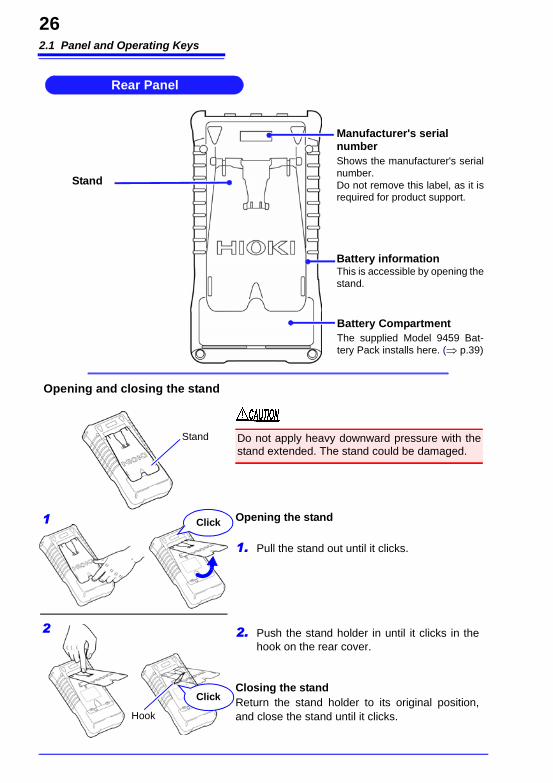
Rear Panel
Battery CompartmentThe supplied Model 9459 Bat-tery Pack installs here. (⇒ p.39)
Manufacturer's serial numberShows the manufacturer's serial number.Do not remove this label, as it is required for product support.
Stand
Opening and closing the stand
Do not apply heavy downward pressure with the stand extended. The stand could be damaged.
Opening the stand
1. Pull the stand out until it clicks.
2. Push the stand holder in until it clicks in the hook on the rear cover.
Closing the standReturn the stand holder to its original position, and close the stand until it clicks.
Click
Click
Battery informationThis is accessible by opening the stand.
Hook
Stand
1
2
2.2 Basic Operations
27
2
2.2 Basic Operations
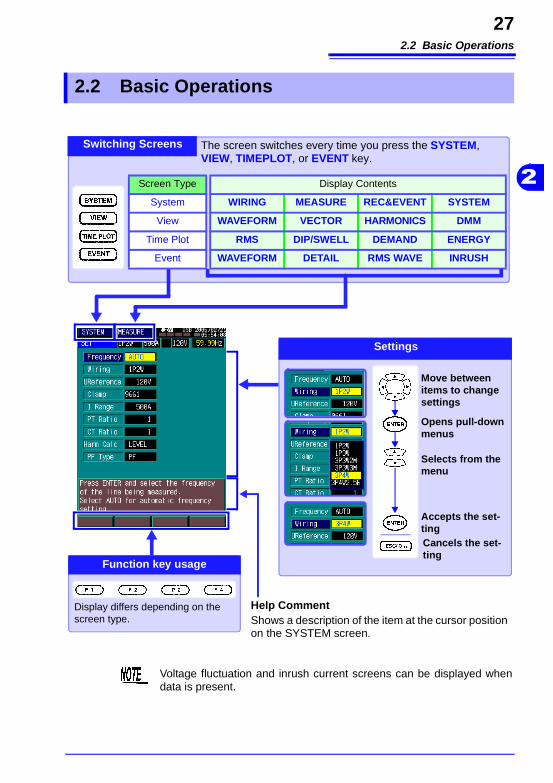
Voltage fluctuation and inrush current screens can be displayed when data is present.
Help CommentShows a description of the item at the cursor position on the SYSTEM screen.
The screen switches every time you press the SYSTEM, VIEW, TIMEPLOT, or EVENT key.
Settings
Switching Screens
Move between items to change settings
Opens pull-down menus
Selects from the menu
Accepts the set-tingCancels the set-ting
Function key usage
Display differs depending on the screen type.
Screen Type Display Contents
System WIRING MEASURE REC&EVENT SYSTEM
View WAVEFORM VECTOR HARMONICS DMM
Time Plot RMS DIP/SWELL DEMAND ENERGY
Event WAVEFORM DETAIL RMS WAVE INRUSH
2.3 Screen Configurations
28
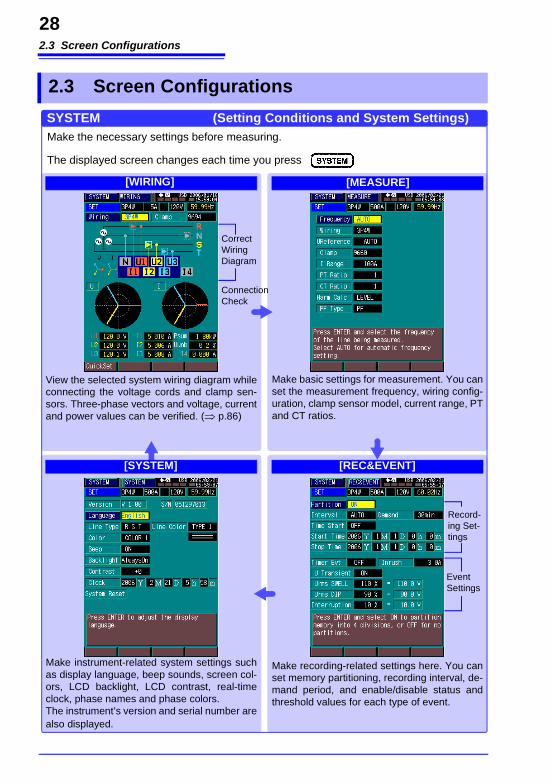
2.3 Screen Configurations
[WIRING]
SYSTEM (Setting Conditions and System Settings)
The displayed screen changes each time you press
Correct Wiring Diagram
View the selected system wiring diagram while connecting the voltage cords and clamp sen-sors. Three-phase vectors and voltage, current and power values can be verified. (⇒ p.86)
Make basic settings for measurement. You can set the measurement frequency, wiring config-uration, clamp sensor model, current range, PT and CT ratios.
Make recording-related settings here. You can set memory partitioning, recording interval, de-mand period, and enable/disable status and threshold values for each type of event.
Make instrument-related system settings such as display language, beep sounds, screen col-ors, LCD backlight, LCD contrast, real-time clock, phase names and phase colors.The instrument’s version and serial number are also displayed.
Make the necessary settings before measuring.
[MEASURE]
[SYSTEM] [REC&EVENT]
Event Settings
Record-ing Set-tings
Connection Check
2.3 Screen Configurations
29
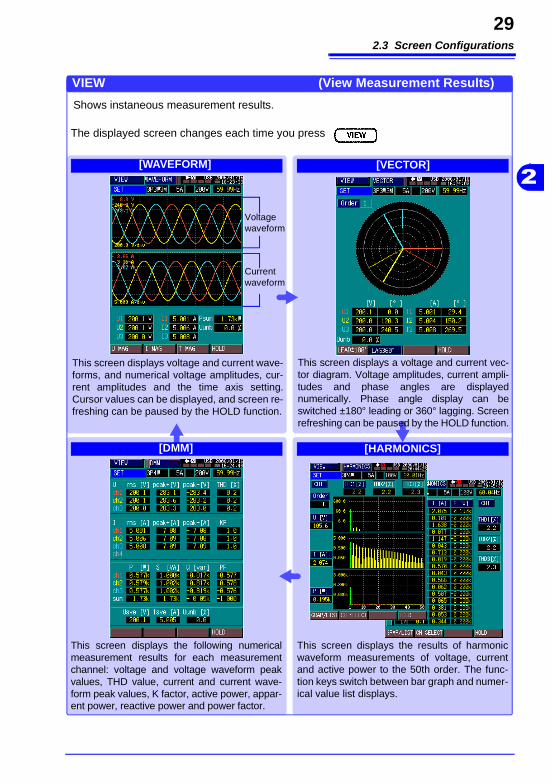
2[WAVEFORM] [VECTOR]
[DMM] [HARMONICS]
VIEW (View Measurement Results)
The displayed screen changes each time you press
This screen displays voltage and current wave-forms, and numerical voltage amplitudes, cur-rent amplitudes and the time axis setting. Cursor values can be displayed, and screen re-freshing can be paused by the HOLD function.
This screen displays a voltage and current vec-tor diagram. Voltage amplitudes, current ampli-tudes and phase angles are displayed numerically. Phase angle display can be switched ±180° leading or 360° lagging. Screen refreshing can be paused by the HOLD function.
This screen displays the results of harmonic waveform measurements of voltage, current and active power to the 50th order. The func-tion keys switch between bar graph and numer-ical value list displays.
This screen displays the following numerical measurement results for each measurement channel: voltage and voltage waveform peak values, THD value, current and current wave-form peak values, K factor, active power, appar-ent power, reactive power and power factor.
Shows instaneous measurement results.
Current waveform
Voltage waveform
2.3 Screen Configurations
30
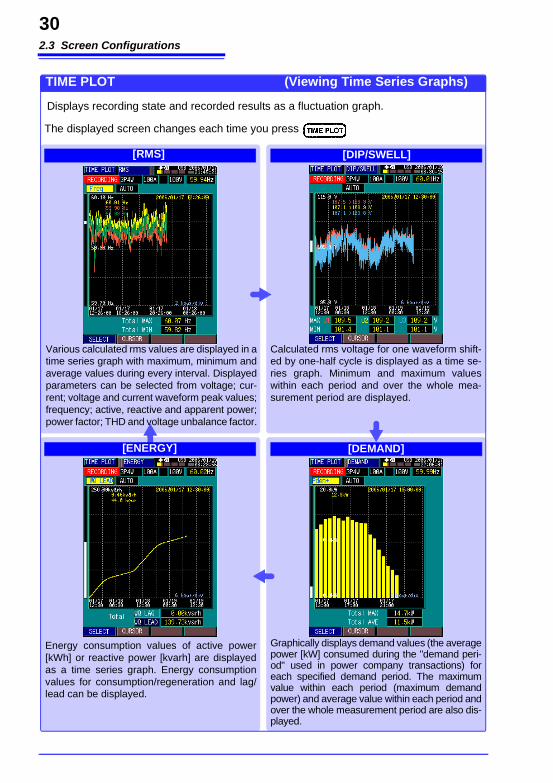
[RMS] [DIP/SWELL]
[ENERGY] [DEMAND]
TIME PLOT (Viewing Time Series Graphs)
The displayed screen changes each time you press
Various calculated rms values are displayed in a time series graph with maximum, minimum and average values during every interval. Displayed parameters can be selected from voltage; cur-rent; voltage and current waveform peak values; frequency; active, reactive and apparent power; power factor; THD and voltage unbalance factor.
Calculated rms voltage for one waveform shift-ed by one-half cycle is displayed as a time se-ries graph. Minimum and maximum values within each period and over the whole mea-surement period are displayed.
Graphically displays demand values (the average power [kW] consumed during the "demand peri-od" used in power company transactions) for each specified demand period. The maximum value within each period (maximum demand power) and average value within each period and over the whole measurement period are also dis-played.
Energy consumption values of active power [kWh] or reactive power [kvarh] are displayed as a time series graph. Energy consumption values for consumption/regeneration and lag/lead can be displayed.
Displays recording state and recorded results as a fluctuation graph.
2.3 Screen Configurations
31
2
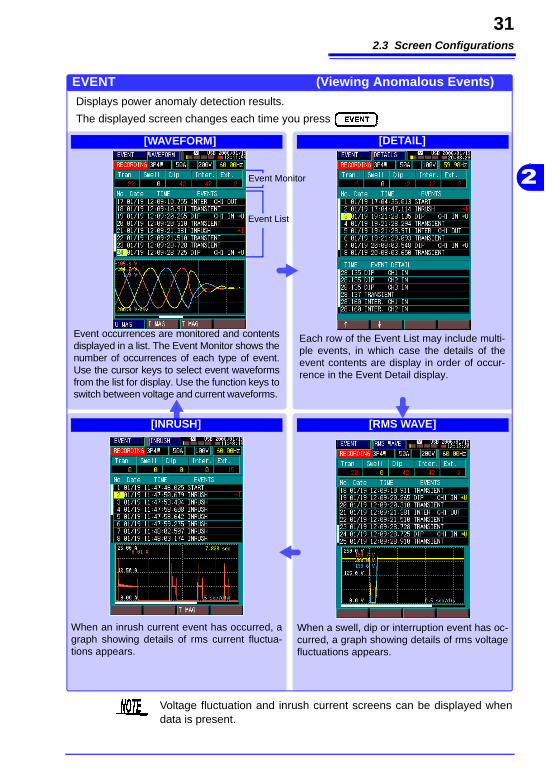
[DETAIL][WAVEFORM]
[INRUSH] [RMS WAVE]
Event occurrences are monitored and contents displayed in a list. The Event Monitor shows the number of occurrences of each type of event. Use the cursor keys to select event waveforms from the list for display. Use the function keys to switch between voltage and current waveforms.
EVENT (Viewing Anomalous Events)Displays power anomaly detection results.
The displayed screen changes each time you press
Each row of the Event List may include multi-ple events, in which case the details of the event contents are display in order of occur-rence in the Event Detail display.
When a swell, dip or interruption event has oc-curred, a graph showing details of rms voltage fluctuations appears.
When an inrush current event has occurred, a graph showing details of rms current fluctua-tions appears.
Event List
Event Monitor
Voltage fluctuation and inrush current screens can be displayed when data is present.
2.4 Common Screen Elements
32
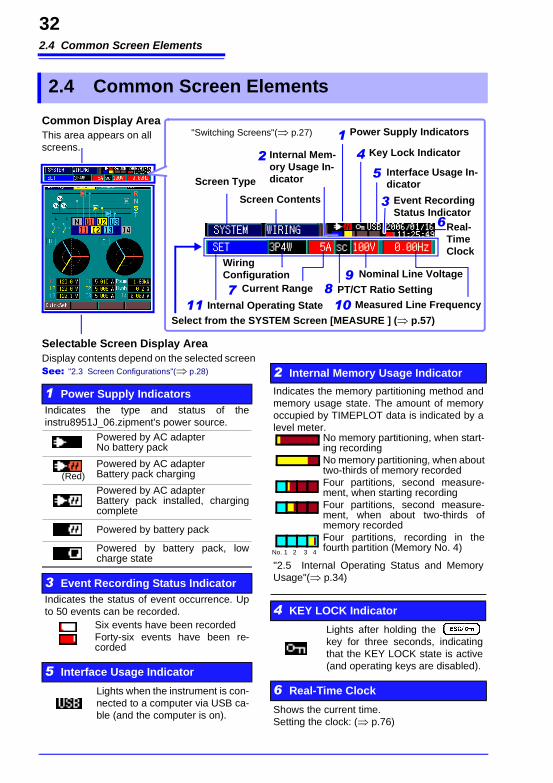
2.4 Common Screen Elements
Event Recording Status Indicator
1 Power Supply IndicatorsIndicates the type and status of the instru8951J_06.zipment's power source.
Powered by AC adapterNo battery pack
Powered by AC adapterBattery pack charging
Powered by AC adapterBattery pack installed, charging complete
Powered by battery pack
Powered by battery pack, low charge state
3 Event Recording Status IndicatorIndicates the status of event occurrence. Up to 50 events can be recorded.
5 Interface Usage Indicator
Lights when the instrument is con-nected to a computer via USB ca-ble (and the computer is on).
(Red)
Six events have been recordedForty-six events have been re-corded
2 Internal Memory Usage Indicator
Indicates the memory partitioning method and memory usage state. The amount of memory occupied by TIMEPLOT data is indicated by a level meter.
"2.5 Internal Operating Status and Memory Usage"(⇒ p.34)
4 KEY LOCK Indicator
Lights after holding the key for three seconds, indicating that the KEY LOCK state is active (and operating keys are disabled).
6 Real-Time Clock
Shows the current time. Setting the clock: (⇒ p.76)
No memory partitioning, when start-ing recordingNo memory partitioning, when about two-thirds of memory recordedFour partitions, second measure-ment, when starting recordingFour partitions, second measure-ment, when about two-thirds of memory recordedFour partitions, recording in the fourth partition (Memory No. 4)No. 1 2 3 4
Power Supply Indicators
Key Lock IndicatorInternal Mem-ory Usage In-dicator
1
Interface Usage In-dicator
Common Display AreaThis area appears on all screens.
4
Selectable Screen Display AreaDisplay contents depend on the selected screenSee: "2.3 Screen Configurations"(⇒ p.28)
Screen Type
6
Wiring Configuration
Screen Contents
"Switching Screens"(⇒ p.27)
Current Range
Internal Operating State Measured Line Frequency
Select from the SYSTEM Screen [MEASURE ] (⇒ p.57)
8 PT/CT Ratio Setting
2
7
5
10
Nominal Line Voltage
11
3
Real-Time Clock
9
2.4 Common Screen Elements
33
2
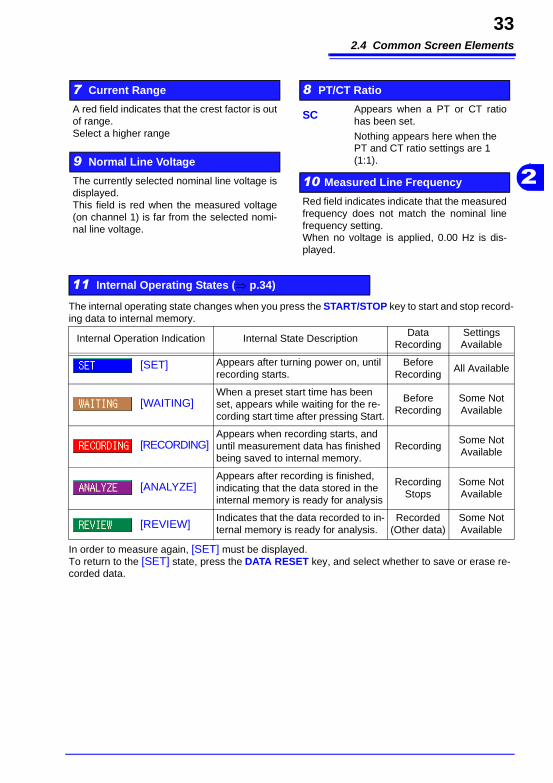
7 Current Range
A red field indicates that the crest factor is out of range.Select a higher range
9 Normal Line Voltage
The currently selected nominal line voltage is displayed.This field is red when the measured voltage (on channel 1) is far from the selected nomi-nal line voltage.
11 Internal Operating States (⇒ p.34)
8 PT/CT Ratio
SC Appears when a PT or CT ratio has been set.
Nothing appears here when the PT and CT ratio settings are 1 (1:1).
10 Measured Line Frequency
Red field indicates indicate that the measured frequency does not match the nominal line frequency setting.When no voltage is applied, 0.00 Hz is dis-played.
The internal operating state changes when you press the START/STOP key to start and stop record-ing data to internal memory.
In order to measure again, [SET] must be displayed.To return to the [SET] state, press the DATA RESET key, and select whether to save or erase re-corded data.
Internal Operation Indication Internal State DescriptionData
RecordingSettings Available
[SET] Appears after turning power on, until recording starts.
Before Recording
All Available
[WAITING]When a preset start time has been set, appears while waiting for the re-cording start time after pressing Start.
Before Recording
Some Not Available
[RECORDING]Appears when recording starts, and until measurement data has finished being saved to internal memory.
RecordingSome Not Available
[ANALYZE]Appears after recording is finished, indicating that the data stored in the internal memory is ready for analysis
Recording Stops
Some Not Available
[REVIEW]Indicates that the data recorded to in-ternal memory is ready for analysis.
Recorded (Other data)
Some Not Available
2.5 Internal Operating Status and Memory Usage
34
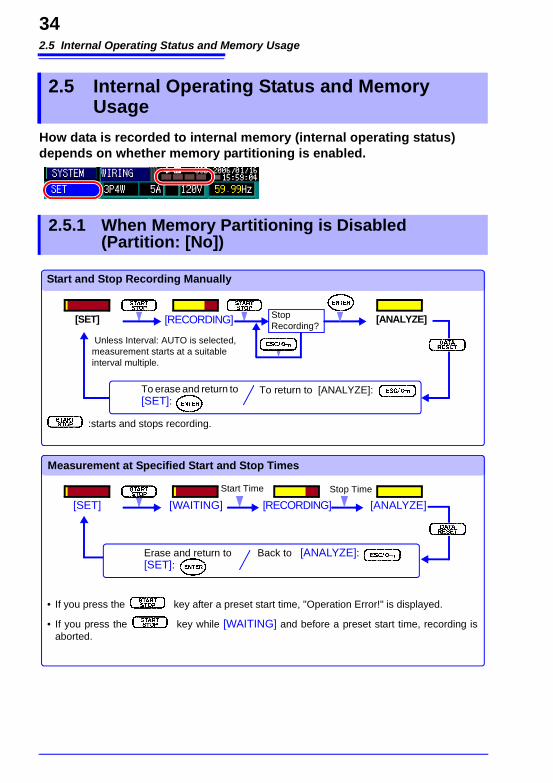
How data is recorded to internal memory (internal operating status) depends on whether memory partitioning is enabled.
2.5 Internal Operating Status and Memory Usage
2.5.1 When Memory Partitioning is Disabled (Partition: [No])
Start and Stop Recording Manually
Measurement at Specified Start and Stop Times
:starts and stops recording.
[SET] [RECORDING] [ANALYZE]
• If you press the key after a preset start time, "Operation Error!" is displayed.
• If you press the key while [WAITING] and before a preset start time, recording is aborted.
Unless Interval: AUTO is selected, measurement starts at a suitable interval multiple.
[SET] [WAITING] [ANALYZE][RECORDING]
Start Time Stop Time
Erase and return to [SET]:
To erase and return to [SET]:
To return to [ANALYZE]:
Stop Recording?
Back to [ANALYZE]:
2.5 Internal Operating Status and Memory Usage
35
2
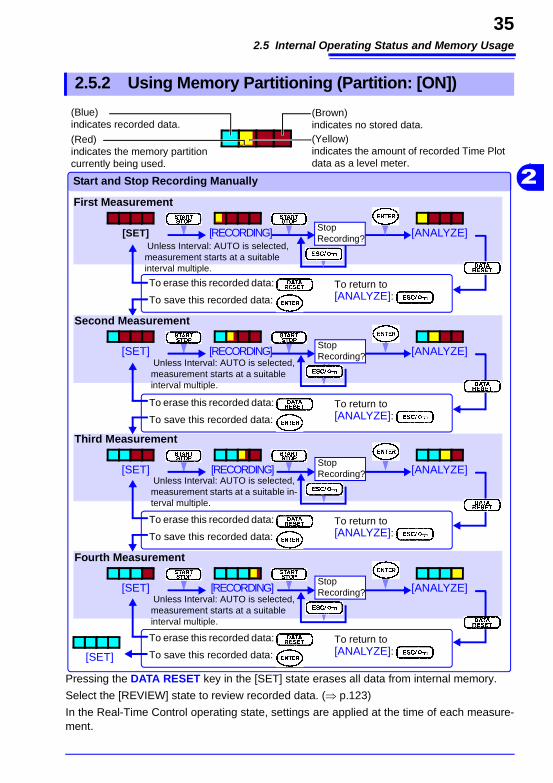
Pressing the DATA RESET key in the [SET] state erases all data from internal memory.
Select the [REVIEW] state to review recorded data. (⇒ p.123)
In the Real-Time Control operating state, settings are applied at the time of each measure-ment.
2.5.2 Using Memory Partitioning (Partition: [ON])
(Brown) indicates no stored data.
(Blue) indicates recorded data.
(Yellow) indicates the amount of recorded Time Plot data as a level meter.
Start and Stop Recording Manually
[SET] [RECORDING] [ANALYZE] Unless Interval: AUTO is selected, measurement starts at a suitable interval multiple.
To erase this recorded data: To return to [ANALYZE]:To save this recorded data:
First Measurement
[SET] [RECORDING] [ANALYZE]
No
Second Measurement
[SET] [RECORDING] [ANALYZE]
Third Measurement
[SET] [RECORDING] [ANALYZE]
Fourth Measurement
(Red) indicates the memory partition currently being used.
Stop Recording?
Unless Interval: AUTO is selected, measurement starts at a suitable interval multiple.
Stop Recording?
[SET]
Unless Interval: AUTO is selected, measurement starts at a suitable in-terval multiple.
Stop Recording?
Unless Interval: AUTO is selected, measurement starts at a suitable interval multiple.
Stop Recording?
To erase this recorded data: To return to [ANALYZE]:To save this recorded data:
To erase this recorded data: To return to [ANALYZE]:To save this recorded data:
To erase this recorded data: To return to [ANALYZE]:To save this recorded data:

2.5 Internal Operating Status and Memory Usage
36
3.1 Initial Instrument Preparations
37
3Perform the following before starting measurement the first time.
Measurement Preparations Chapter 3
3.1 Initial Instrument Preparations
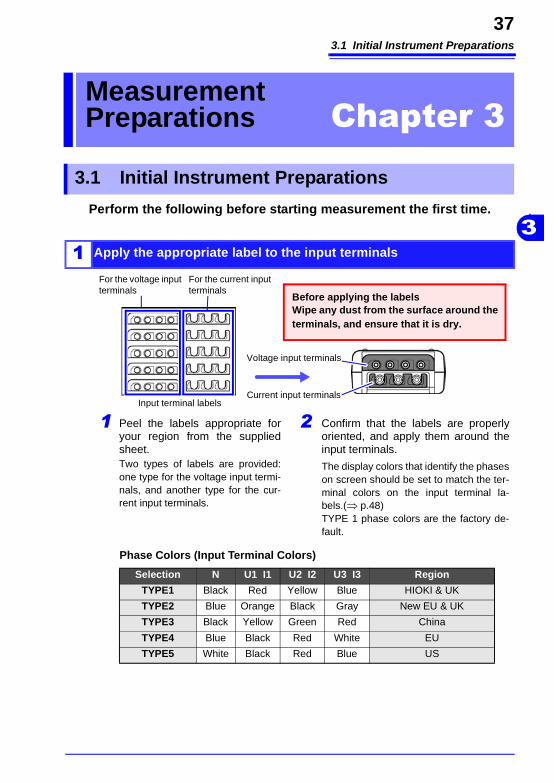
1 Apply the appropriate label to the input terminals
Confirm that the labels are properly oriented, and apply them around the input terminals.
Input terminal labels
Peel the labels appropriate for your region from the supplied sheet. Two types of labels are provided: one type for the voltage input termi-nals, and another type for the cur-rent input terminals.
1 2
Before applying the labelsWipe any dust from the surface around the terminals, and ensure that it is dry.
The display colors that identify the phases on screen should be set to match the ter-minal colors on the input terminal la-bels.(⇒ p.48)TYPE 1 phase colors are the factory de-fault.
For the voltage input terminals
For the current input terminals
Phase Colors (Input Terminal Colors)
Selection N U1 I1 U2 I2 U3 I3 Region
TYPE1 Black Red Yellow Blue HIOKI & UK
TYPE2 Blue Orange Black Gray New EU & UK
TYPE3 Black Yellow Green Red China
TYPE4 Blue Black Red White EU
TYPE5 White Black Red Blue US
Voltage input terminals
Current input terminals
3.1 Initial Instrument Preparations
38
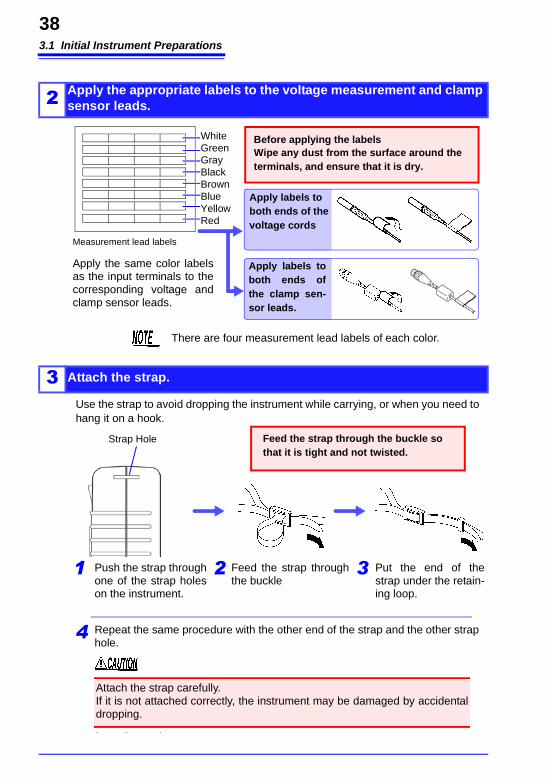
2 Apply the appropriate labels to the voltage measurement and clamp sensor leads.
3 Attach the strap.
Before applying the labelsWipe any dust from the surface around the terminals, and ensure that it is dry.
Measurement lead labels
Apply the same color labels as the input terminals to the corresponding voltage and clamp sensor leads.
Apply labels to both ends of the voltage cords
Apply labels to both ends of the clamp sen-sor leads.
WhiteGreenGrayBlackBrownBlueYellowRed
There are four measurement lead labels of each color.
Use the strap to avoid dropping the instrument while carrying, or when you need to hang it on a hook.
Feed the strap through the buckle so that it is tight and not twisted.
2 Feed the strap through the buckle
Put the end of the strap under the retain-ing loop.
3Push the strap through one of the strap holes on the instrument.
Repeat the same procedure with the other end of the strap and the other strap hole.
Attach the strap carefully.If it is not attached correctly, the instrument may be damaged by accidental dropping.
1
4
Strap Hole
3.1 Initial Instrument Preparations
39
3
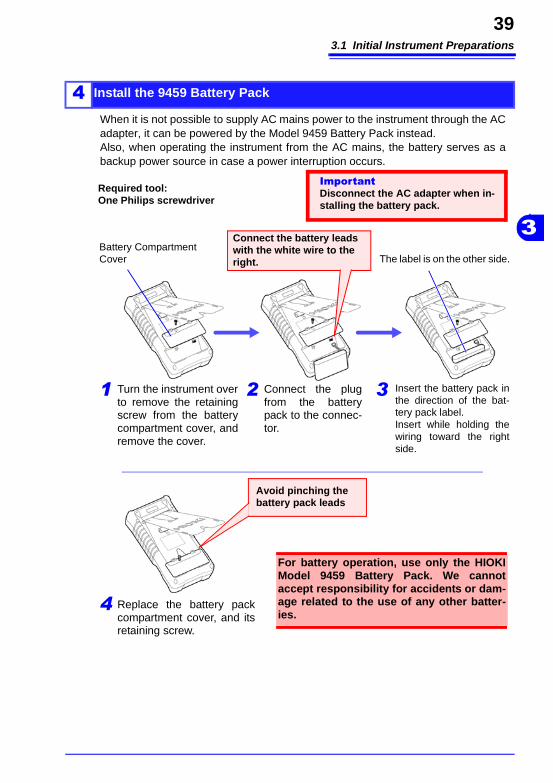
4 Install the 9459 Battery Pack
When it is not possible to supply AC mains power to the instrument through the AC adapter, it can be powered by the Model 9459 Battery Pack instead.Also, when operating the instrument from the AC mains, the battery serves as a backup power source in case a power interruption occurs.
1
Avoid pinching the battery pack leads
Turn the instrument over to remove the retaining screw from the battery compartment cover, and remove the cover.
2 Connect the plug from the battery pack to the connec-tor.
Insert the battery pack in the direction of the bat-tery pack label.Insert while holding the wiring toward the right side.
3
Required tool:One Philips screwdriver
ImportantDisconnect the AC adapter when in-stalling the battery pack.
Battery Compartment Cover
Connect the battery leads with the white wire to the right. The label is on the other side.
4 Replace the battery pack compartment cover, and its retaining screw.
For battery operation, use only the HIOKI Model 9459 Battery Pack. We cannot accept responsibility for accidents or dam-age related to the use of any other batter-ies.
3.1 Initial Instrument Preparations
40
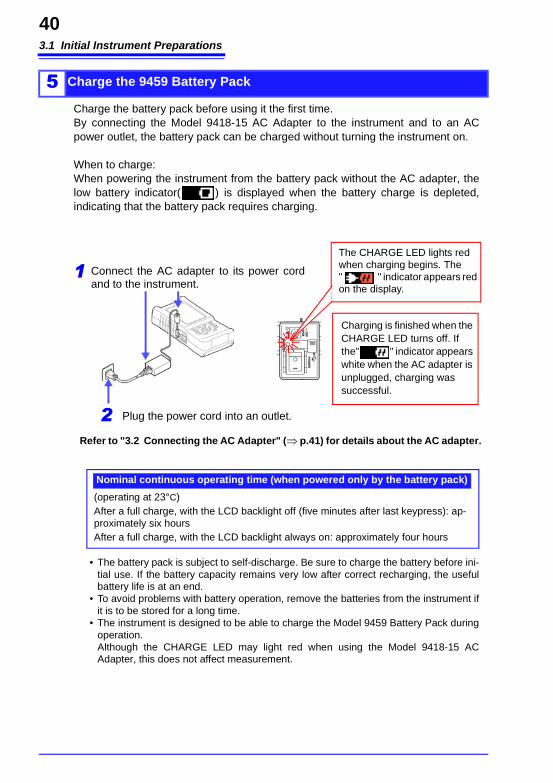
5 Charge the 9459 Battery Pack
Charge the battery pack before using it the first time.By connecting the Model 9418-15 AC Adapter to the instrument and to an AC power outlet, the battery pack can be charged without turning the instrument on.
When to charge:When powering the instrument from the battery pack without the AC adapter, the low battery indicator( ) is displayed when the battery charge is depleted, indicating that the battery pack requires charging.
1 Connect the AC adapter to its power cord and to the instrument.
2 Plug the power cord into an outlet.
The CHARGE LED lights red when charging begins. The " " indicator appears red on the display.
Charging is finished when the CHARGE LED turns off. If the" " indicator appears white when the AC adapter is unplugged, charging was successful.
Nominal continuous operating time (when powered only by the battery pack)
• The battery pack is subject to self-discharge. Be sure to charge the battery before ini-tial use. If the battery capacity remains very low after correct recharging, the useful battery life is at an end.
• To avoid problems with battery operation, remove the batteries from the instrument if it is to be stored for a long time.
• The instrument is designed to be able to charge the Model 9459 Battery Pack during operation. Although the CHARGE LED may light red when using the Model 9418-15 AC Adapter, this does not affect measurement.
Refer to "3.2 Connecting the AC Adapter" (⇒ p.41) for details about the AC adapter.
(operating at 23°C)After a full charge, with the LCD backlight off (five minutes after last keypress): ap-proximately six hoursAfter a full charge, with the LCD backlight always on: approximately four hours
3.2 Connecting the AC Adapter
41
3
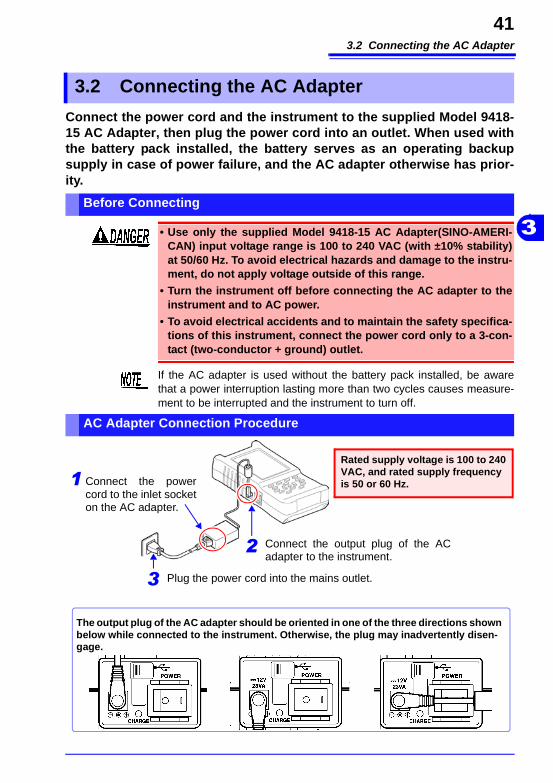
Connect the power cord and the instrument to the supplied Model 9418-15 AC Adapter, then plug the power cord into an outlet. When used with the battery pack installed, the battery serves as an operating backup supply in case of power failure, and the AC adapter otherwise has prior-ity.
3.2 Connecting the AC Adapter
Before Connecting
• Use only the supplied Model 9418-15 AC Adapter(SINO-AMERI-CAN) input voltage range is 100 to 240 VAC (with ±10% stability) at 50/60 Hz. To avoid electrical hazards and damage to the instru-ment, do not apply voltage outside of this range.
• Turn the instrument off before connecting the AC adapter to the instrument and to AC power.
• To avoid electrical accidents and to maintain the safety specifica-tions of this instrument, connect the power cord only to a 3-con-tact (two-conductor + ground) outlet.
If the AC adapter is used without the battery pack installed, be aware that a power interruption lasting more than two cycles causes measure-ment to be interrupted and the instrument to turn off.
AC Adapter Connection Procedure
The output plug of the AC adapter should be oriented in one of the three directions shown below while connected to the instrument. Otherwise, the plug may inadvertently disen-gage.
Connect the power cord to the inlet socket on the AC adapter.
Rated supply voltage is 100 to 240 VAC, and rated supply frequency is 50 or 60 Hz.1
2 Connect the output plug of the AC adapter to the instrument.
Plug the power cord into the mains outlet.3
3.3 Connecting the Voltage Cords
42
The color and number of voltage cords to use depends on the wiring configuration of the system being measured.Connect the supplied Model 9438-05 Voltage Cord Set to the voltage input terminals on the instrument.
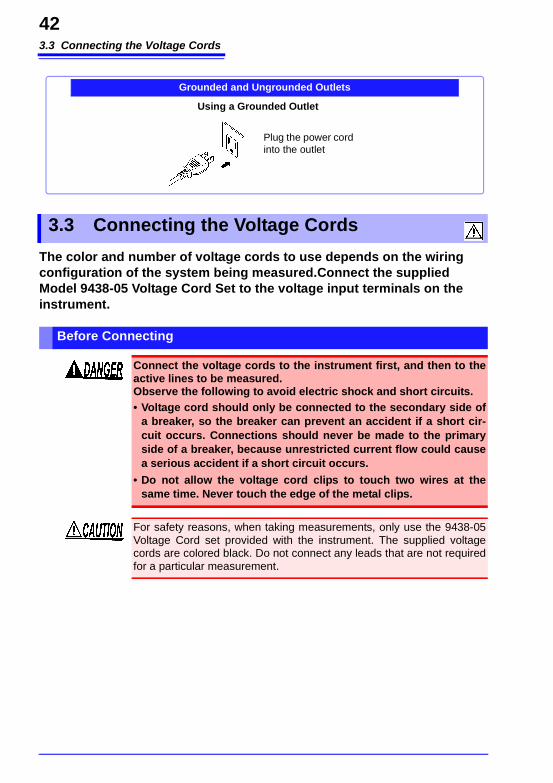
Grounded and Ungrounded Outlets
Plug the power cord into the outlet
Using a Grounded Outlet
3.3 Connecting the Voltage Cords
Before Connecting
Connect the voltage cords to the instrument first, and then to the active lines to be measured. Observe the following to avoid electric shock and short circuits.• Voltage cord should only be connected to the secondary side of
a breaker, so the breaker can prevent an accident if a short cir-cuit occurs. Connections should never be made to the primary side of a breaker, because unrestricted current flow could cause a serious accident if a short circuit occurs.
• Do not allow the voltage cord clips to touch two wires at the same time. Never touch the edge of the metal clips.
For safety reasons, when taking measurements, only use the 9438-05 Voltage Cord set provided with the instrument. The supplied voltage cords are colored black. Do not connect any leads that are not required for a particular measurement.
3.3 Connecting the Voltage Cords
43
3
Example: TYPE 1
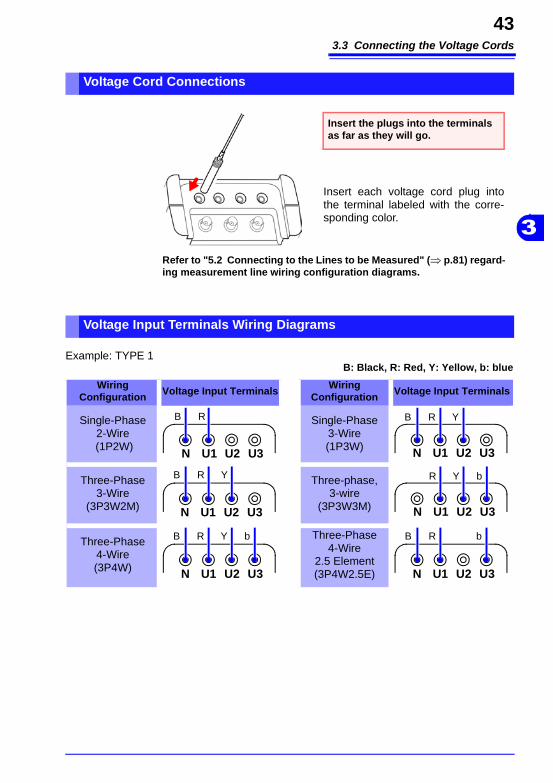
Voltage Cord Connections
Insert the plugs into the terminals as far as they will go.
Insert each voltage cord plug into the terminal labeled with the corre-sponding color.
Refer to "5.2 Connecting to the Lines to be Measured" (⇒ p.81) regard-ing measurement line wiring configuration diagrams.
Voltage Input Terminals Wiring Diagrams
B: Black, R: Red, Y: Yellow, b: blue
Wiring Configuration Voltage Input Terminals Wiring
Configuration Voltage Input Terminals
Single-Phase 2-Wire
(1P2W)
Single-Phase 3-Wire (1P3W)
Three-Phase 3-Wire
(3P3W2M)
Three-phase, 3-wire
(3P3W3M)
Three-Phase 4-Wire (3P4W)
Three-Phase 4-Wire
2.5 Element (3P4W2.5E)
N U1 U2 U3
B R
N U1 U2 U3
B R Y
N U1 U2 U3
B R Y
N U1 U2 U3
R Y b
N U1 U2 U3
B R Y b
N U1 U2 U3
B R b
3.4 Connecting Clamp Sensors
44
Connect the optional clamp sensors to the current input terminals on the instrument. The clamp sensors that are compatible with this instrument are voltage output types.Compatible clamp sensors provide about 0.5 Vrms output corresponding to full scale current. Refer to the instruction manual provided with the clamp sensors.
3.4 Connecting Clamp Sensors
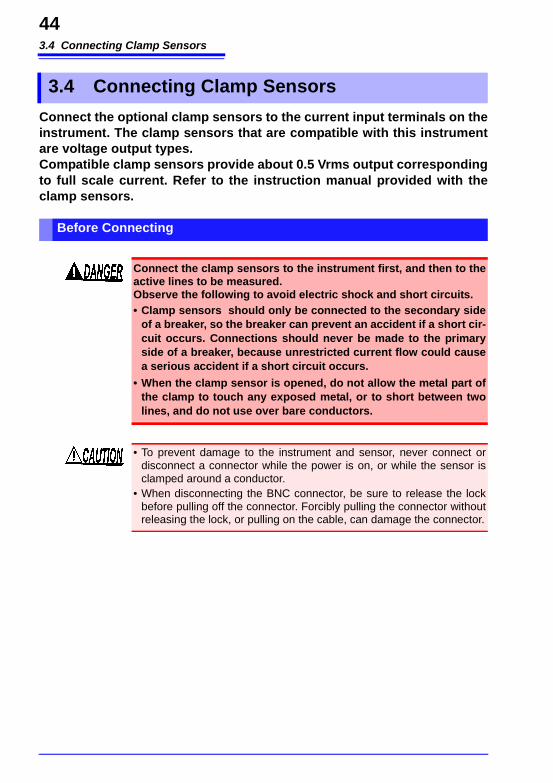
Before Connecting
Connect the clamp sensors to the instrument first, and then to the active lines to be measured. Observe the following to avoid electric shock and short circuits.• Clamp sensors should only be connected to the secondary side
of a breaker, so the breaker can prevent an accident if a short cir-cuit occurs. Connections should never be made to the primary side of a breaker, because unrestricted current flow could cause a serious accident if a short circuit occurs.
• When the clamp sensor is opened, do not allow the metal part of the clamp to touch any exposed metal, or to short between two lines, and do not use over bare conductors.
• To prevent damage to the instrument and sensor, never connect or disconnect a connector while the power is on, or while the sensor is clamped around a conductor.
• When disconnecting the BNC connector, be sure to release the lock before pulling off the connector. Forcibly pulling the connector without releasing the lock, or pulling on the cable, can damage the connector.
3.4 Connecting Clamp Sensors
45
3
Example: TYPE 1
Before taking measurements, confirm that the clamp sensor model set-ting is correct. (⇒ p.60)
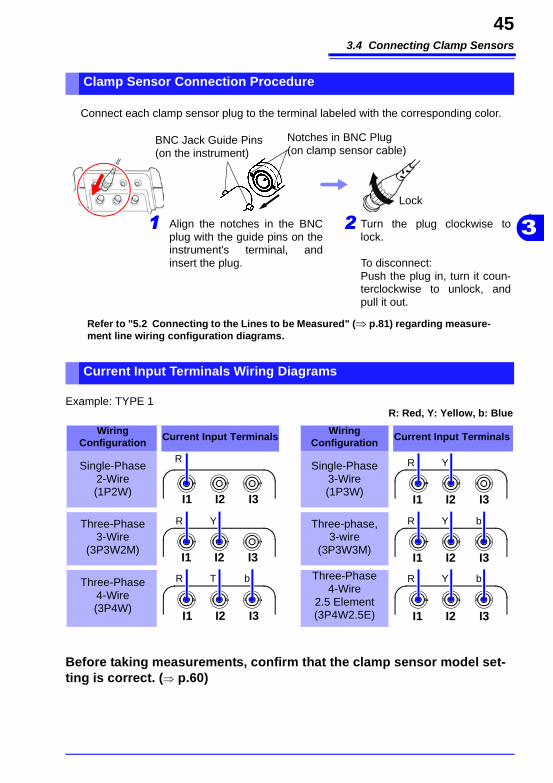
Clamp Sensor Connection Procedure
Connect each clamp sensor plug to the terminal labeled with the corresponding color.
Turn the plug clockwise to lock.
To disconnect: Push the plug in, turn it coun-terclockwise to unlock, and pull it out.
Lock
Notches in BNC Plug (on clamp sensor cable)
BNC Jack Guide Pins (on the instrument)
1 2Align the notches in the BNC plug with the guide pins on the instrument's terminal, and insert the plug.
Refer to "5.2 Connecting to the Lines to be Measured" (⇒ p.81) regarding measure-ment line wiring configuration diagrams.
Current Input Terminals Wiring Diagrams
R: Red, Y: Yellow, b: Blue
WiringConfiguration Current Input Terminals Wiring
Configuration Current Input Terminals
Single-Phase 2-Wire (1P2W)
Single-Phase 3-Wire (1P3W)
Three-Phase 3-Wire
(3P3W2M)
Three-phase, 3-wire
(3P3W3M)
Three-Phase 4-Wire (3P4W)
Three-Phase 4-Wire
2.5 Element (3P4W2.5E)
I1 I2 I3
R
I1 I2 I3
R Y
I1 I2 I3
R Y
I1 I2 I3
R Y b
I1 I2 I3
R T b
I1 I2 I3
R Y b
3.5 Turning the Power On and Off
46
3.5 Turning the Power On and Off
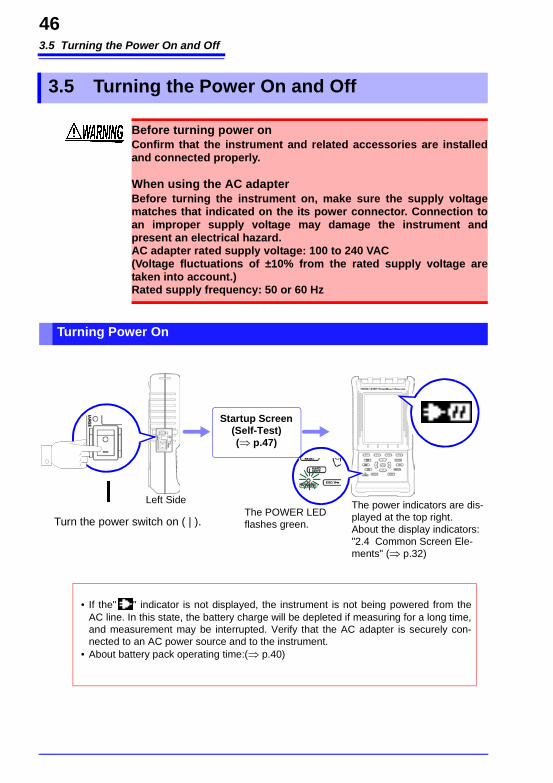
Before turning power onConfirm that the instrument and related accessories are installed and connected properly.
When using the AC adapterBefore turning the instrument on, make sure the supply voltage matches that indicated on the its power connector. Connection to an improper supply voltage may damage the instrument and present an electrical hazard. AC adapter rated supply voltage: 100 to 240 VAC (Voltage fluctuations of ±10% from the rated supply voltage are taken into account.) Rated supply frequency: 50 or 60 Hz
Turning Power On
Left Side
Turn the power switch on ( | ).
The power indicators are dis-played at the top right.About the display indicators: "2.4 Common Screen Ele-ments" (⇒ p.32)
• If the" " indicator is not displayed, the instrument is not being powered from the AC line. In this state, the battery charge will be depleted if measuring for a long time, and measurement may be interrupted. Verify that the AC adapter is securely con-nected to an AC power source and to the instrument.
• About battery pack operating time:(⇒ p.40)
The POWER LED flashes green.
Startup Screen (Self-Test)(⇒ p.47)
3.5 Turning the Power On and Off
47
3
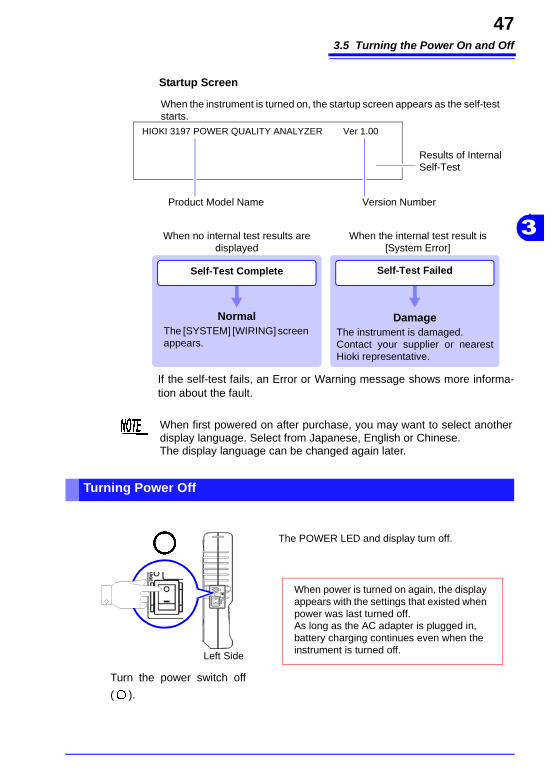
If the self-test fails, an Error or Warning message shows more informa-tion about the fault.
DamageThe instrument is damaged.Contact your supplier or nearest Hioki representative.
HIOKI 3197 POWER QUALITY ANALYZER Ver 1.00
Product Model Name Version Number
Startup Screen
When the instrument is turned on, the startup screen appears as the self-test starts.
Self-Test Complete Self-Test Failed
NormalThe [SYSTEM] [WIRING] screen appears.
When the internal test result is [System Error]
When no internal test results are displayed
Results of Internal Self-Test
When first powered on after purchase, you may want to select another display language. Select from Japanese, English or Chinese.The display language can be changed again later.
Turning Power Off
Left Side
Turn the power switch off
( ).
When power is turned on again, the display appears with the settings that existed when power was last turned off.As long as the AC adapter is plugged in, battery charging continues even when the instrument is turned off.
The POWER LED and display turn off.
3.6 Other Preparations
48
3.6 Other Preparations
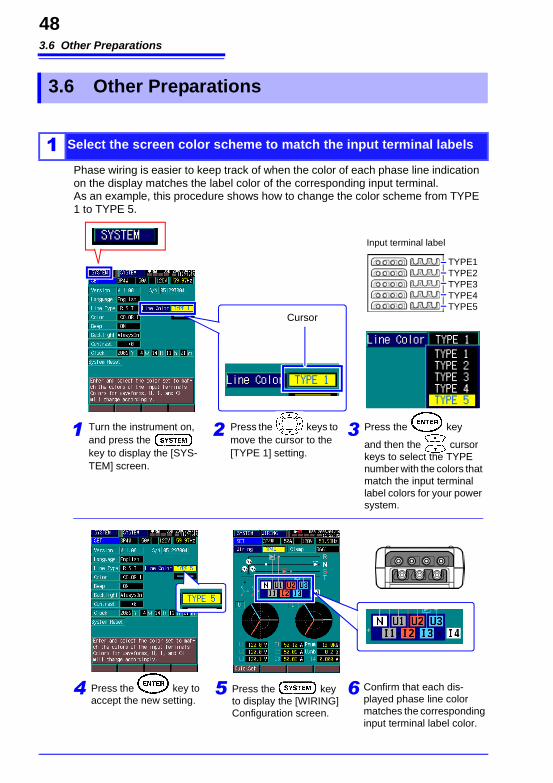
1 Select the screen color scheme to match the input terminal labels
Phase wiring is easier to keep track of when the color of each phase line indication on the display matches the label color of the corresponding input terminal.As an example, this procedure shows how to change the color scheme from TYPE 1 to TYPE 5.
1 Turn the instrument on, and press the key to display the [SYS-TEM] screen.
2 Press the key
and then the cursor keys to select the TYPE number with the colors that match the input terminal label colors for your power system.
3
Cursor
4 Press the key to accept the new setting.
5 Press the key to display the [WIRING] Configuration screen.
6 Confirm that each dis-played phase line color matches the corresponding input terminal label color.
Press the keys to move the cursor to the [TYPE 1] setting.
Input terminal label
TYPE1TYPE2TYPE3TYPE4TYPE5
3.6 Other Preparations
49
3
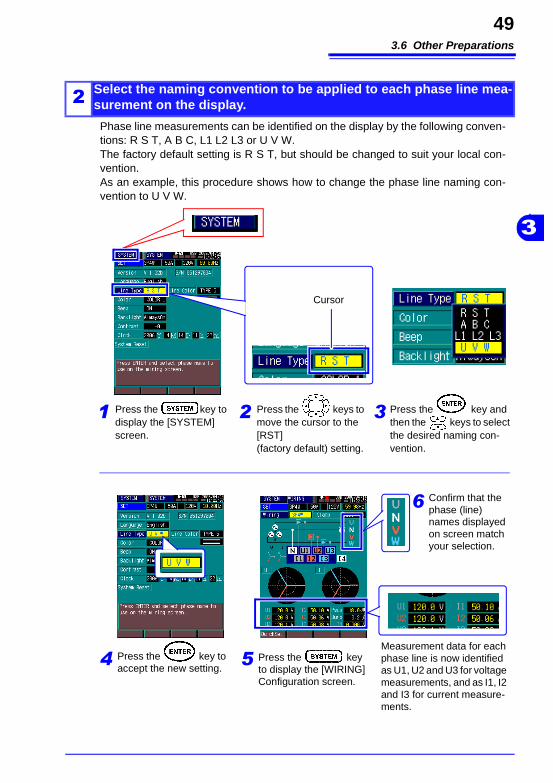
2 Select the naming convention to be applied to each phase line mea-surement on the display.
Phase line measurements can be identified on the display by the following conven-tions: R S T, A B C, L1 L2 L3 or U V W.The factory default setting is R S T, but should be changed to suit your local con-vention.As an example, this procedure shows how to change the phase line naming con-vention to U V W.
1 Press the key to display the [SYSTEM] screen.
2 Press the key and then the keys to select the desired naming con-vention.
3
Cursor
4 Press the key to accept the new setting.
5 Press the key to display the [WIRING] Configuration screen.
Measurement data for each phase line is now identified as U1, U2 and U3 for voltage measurements, and as I1, I2 and I3 for current measure-ments.
Press the keys to move the cursor to the [RST] (factory default) setting.
6 Confirm that the phase (line) names displayed on screen match your selection.
3.6 Other Preparations
50
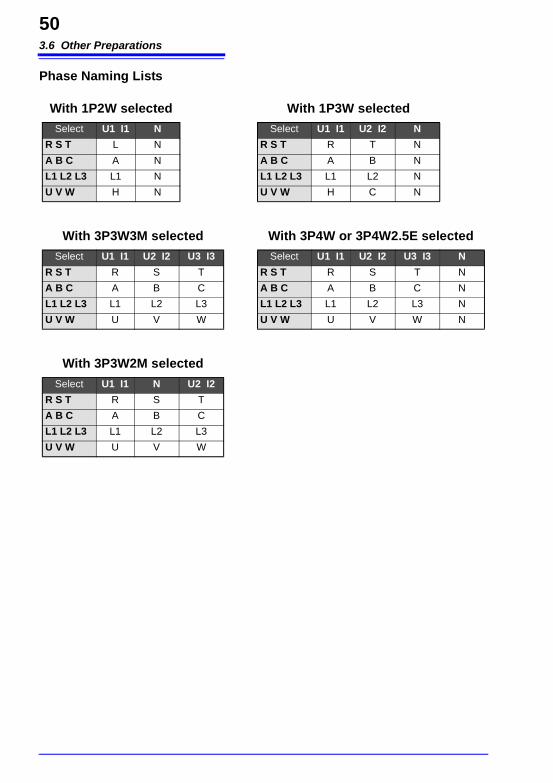
Phase Naming Lists
With 1P2W selected
Select U1 I1 N
R S T L N
A B C A N
L1 L2 L3 L1 N
U V W H N
With 3P3W3M selected
Select U1 I1 U2 I2 U3 I3
R S T R S T
A B C A B C
L1 L2 L3 L1 L2 L3
U V W U V W
With 3P3W2M selected
Select U1 I1 N U2 I2
R S T R S T
A B C A B C
L1 L2 L3 L1 L2 L3
U V W U V W
With 1P3W selected
Select U1 I1 U2 I2 N
R S T R T N
A B C A B N
L1 L2 L3 L1 L2 N
U V W H C N
With 3P4W or 3P4W2.5E selected
Select U1 I1 U2 I2 U3 I3 N
R S T R S T N
A B C A B C N
L1 L2 L3 L1 L2 L3 N
U V W U V W N
3.7 Auxiliary Function (KEY LOCK)
51
3
Use the KEY LOCK function to avoid inadvertent operations while recording.
3.7 Auxiliary Function (KEY LOCK)
• When the KEY LOCK function is enabled, all other key operations are disabled.
• The KEY LOCK state is retained when the instrument is turned off and back on.
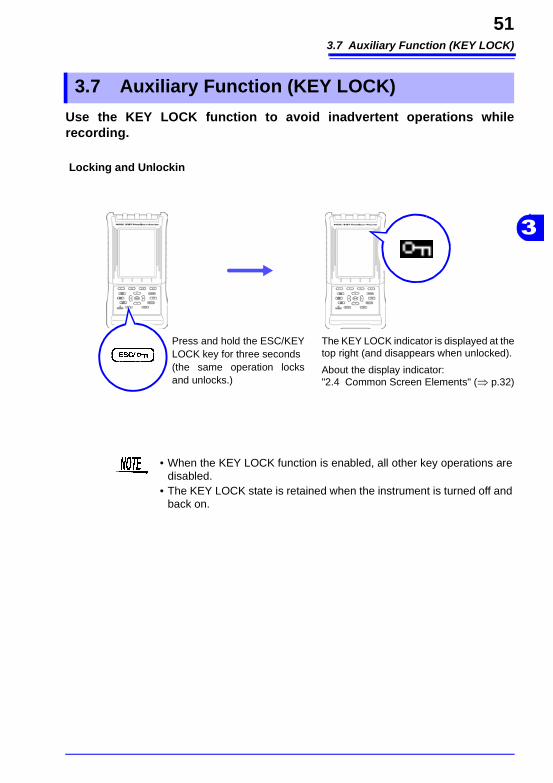
Locking and Unlockin
The KEY LOCK indicator is displayed at the top right (and disappears when unlocked).
About the display indicator: "2.4 Common Screen Elements" (⇒ p.32)
Press and hold the ESC/KEY LOCK key for three seconds (the same operation locks and unlocks.)
3.8 Auxiliary Function (Save screen image)
52
An image of the screen is stored as a bitmap (BMP format) file in internal memory.Saved screen images can be viewed by transferring to a computer. (⇒ p.127)
3.8 Auxiliary Function (Save screen image)
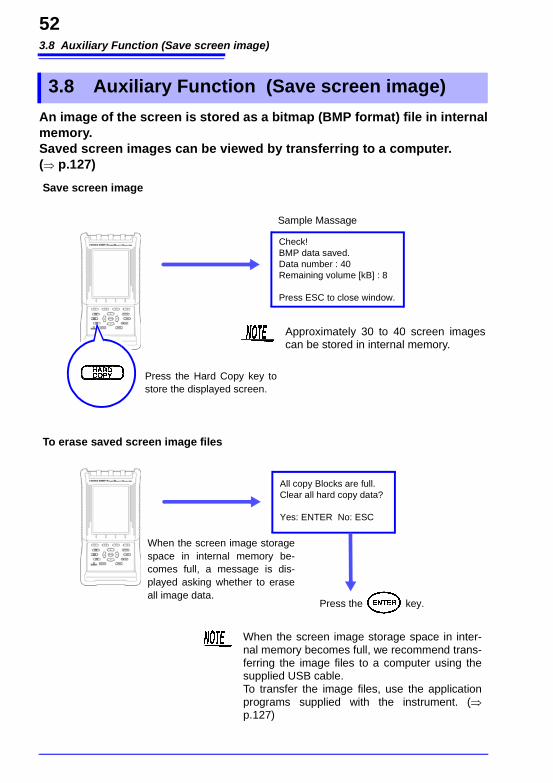
Press the Hard Copy key to store the displayed screen.
Save screen image
Approximately 30 to 40 screen images can be stored in internal memory.
Check!BMP data saved.Data number : 40Remaining volume [kB] : 8
Press ESC to close window.
Sample Massage
When the screen image storage space in internal memory be-comes full, a message is dis-played asking whether to erase all image data.
To erase saved screen image files
All copy Blocks are full.Clear all hard copy data?
Yes: ENTER No: ESC
When the screen image storage space in inter-nal memory becomes full, we recommend trans-ferring the image files to a computer using the supplied USB cable.To transfer the image files, use the application programs supplied with the instrument. (⇒p.127)
Press the key.
53
4
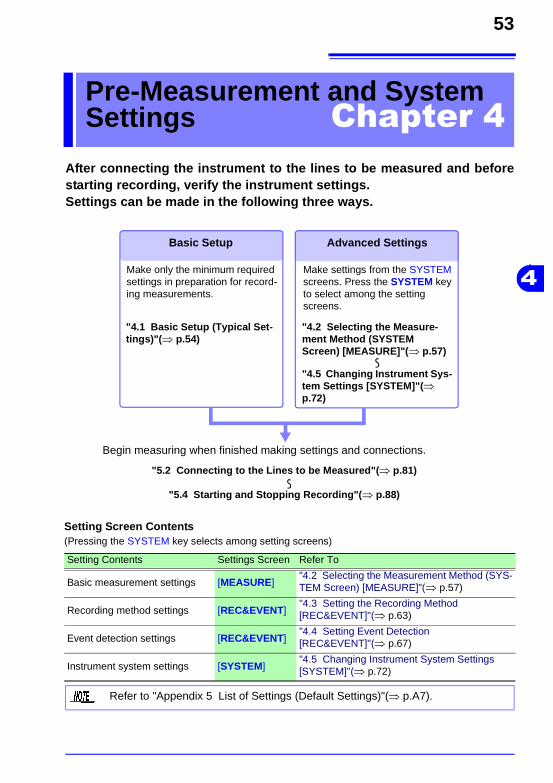
After connecting the instrument to the lines to be measured and before starting recording, verify the instrument settings.Settings can be made in the following three ways.
Pre-Measurement and System Settings Chapter 4
Setting Screen Contents(Pressing the SYSTEM key selects among setting screens)
Setting Contents Settings Screen Refer To
Basic measurement settings [MEASURE]"4.2 Selecting the Measurement Method (SYS-TEM Screen) [MEASURE]"(⇒ p.57)
Recording method settings [REC&EVENT]"4.3 Setting the Recording Method [REC&EVENT]"(⇒ p.63)
Event detection settings [REC&EVENT]"4.4 Setting Event Detection [REC&EVENT]"(⇒ p.67)
Instrument system settings [SYSTEM]"4.5 Changing Instrument System Settings [SYSTEM]"(⇒ p.72)
Advanced SettingsBasic Setup
Begin measuring when finished making settings and connections.
Make only the minimum required settings in preparation for record-ing measurements.
Make settings from the SYSTEM screens. Press the SYSTEM key to select among the setting screens.
"4.2 Selecting the Measure-ment Method (SYSTEM Screen) [MEASURE]"(⇒ p.57)
"4.5 Changing Instrument Sys-tem Settings [SYSTEM]"(⇒ p.72)
"4.1 Basic Setup (Typical Set-tings)"(⇒ p.54)
"5.2 Connecting to the Lines to be Measured"(⇒ p.81)
"5.4 Starting and Stopping Recording"(⇒ p.88)
Refer to "Appendix 5 List of Settings (Default Settings)"(⇒ p.A7).
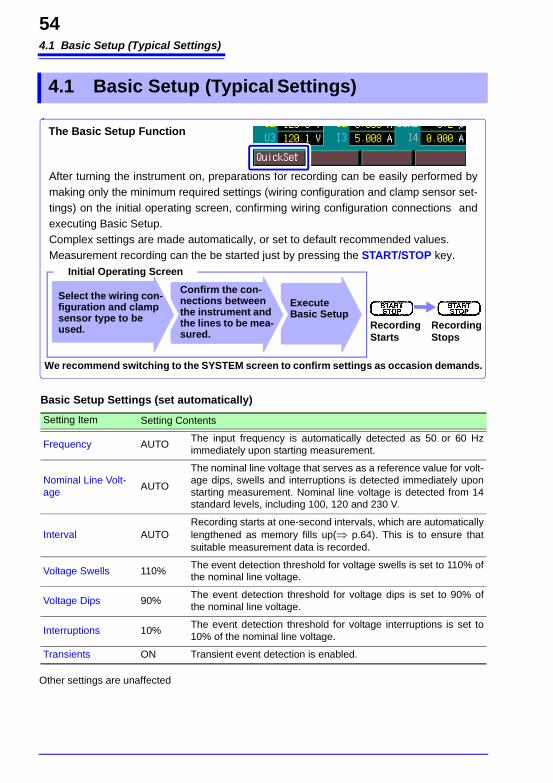
4.1 Basic Setup (Typical Settings)
54
Other settings are unaffected
4.1 Basic Setup (Typical Settings)
The Basic Setup Function
After turning the instrument on, preparations for recording can be easily performed by making only the minimum required settings (wiring configuration and clamp sensor set-tings) on the initial operating screen, confirming wiring configuration connections and executing Basic Setup. Complex settings are made automatically, or set to default recommended values.Measurement recording can the be started just by pressing the START/STOP key.
Execute Basic Setup
Recording Starts
Initial Operating Screen
We recommend switching to the SYSTEM screen to confirm settings as occasion demands.
Recording Stops
Select the wiring con-figuration and clamp sensor type to be used.
Confirm the con-nections between the instrument and the lines to be mea-sured.
Basic Setup Settings (set automatically)
Setting Item Setting Contents
Frequency AUTOThe input frequency is automatically detected as 50 or 60 Hz immediately upon starting measurement.
Nominal Line Volt-age
AUTO
The nominal line voltage that serves as a reference value for volt-age dips, swells and interruptions is detected immediately upon starting measurement. Nominal line voltage is detected from 14 standard levels, including 100, 120 and 230 V.
Interval AUTORecording starts at one-second intervals, which are automatically lengthened as memory fills up(⇒ p.64). This is to ensure that suitable measurement data is recorded.
Voltage Swells 110%The event detection threshold for voltage swells is set to 110% of the nominal line voltage.
Voltage Dips 90%The event detection threshold for voltage dips is set to 90% of the nominal line voltage.
Interruptions 10%The event detection threshold for voltage interruptions is set to 10% of the nominal line voltage.
Transients ON Transient event detection is enabled.
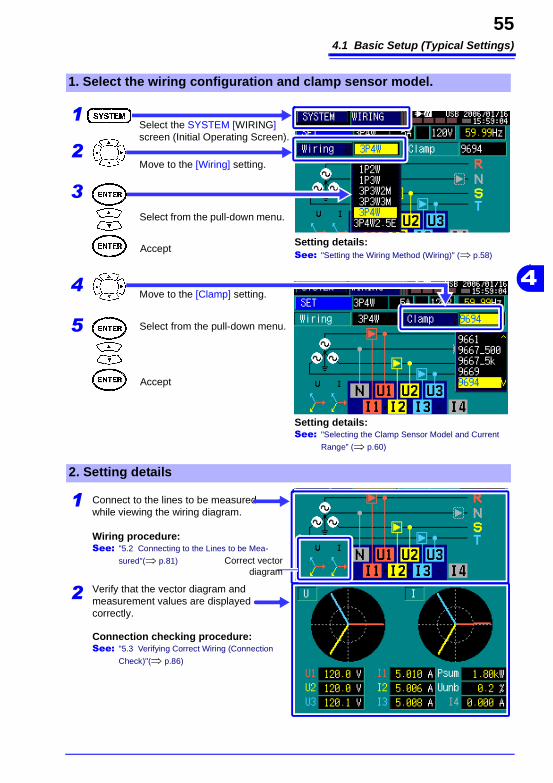
4.1 Basic Setup (Typical Settings)
55
4Accept
Move to the [Wiring] setting.
Select from the pull-down menu.
Select the SYSTEM [WIRING] screen (Initial Operating Screen).
1
2
3
1. Select the wiring configuration and clamp sensor model.
Setting details:See: "Setting the Wiring Method (Wiring)" (⇒ p.58)
4
5 Select from the pull-down menu.
Accept
Setting details:See: "Selecting the Clamp Sensor Model and Current
Range" (⇒ p.60)
Move to the [Clamp] setting.
1
2
2. Setting details
Connect to the lines to be measured while viewing the wiring diagram.
Wiring procedure:See: "5.2 Connecting to the Lines to be Mea-
sured"(⇒ p.81)
Verify that the vector diagram and measurement values are displayed correctly.
Connection checking procedure:See: "5.3 Verifying Correct Wiring (Connection
Check)"(⇒ p.86)
Correct vector diagram
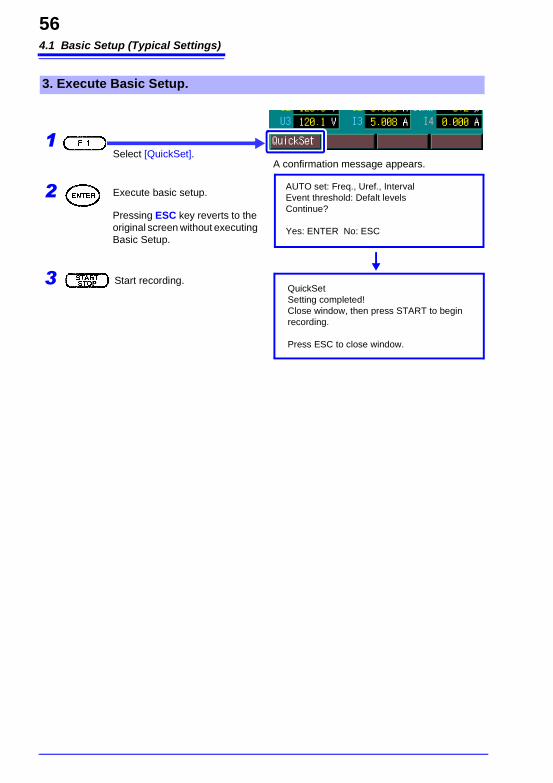
4.1 Basic Setup (Typical Settings)
56
Select [QuickSet].1
2 Execute basic setup.
A confirmation message appears.
QuickSetSetting completed!Close window, then press START to begin recording.
Press ESC to close window.
Start recording.3
Pressing ESC key reverts to the original screen without executing Basic Setup.
3. Execute Basic Setup.
AUTO set: Freq., Uref., IntervalEvent threshold: Defalt levelsContinue?
Yes: ENTER No: ESC
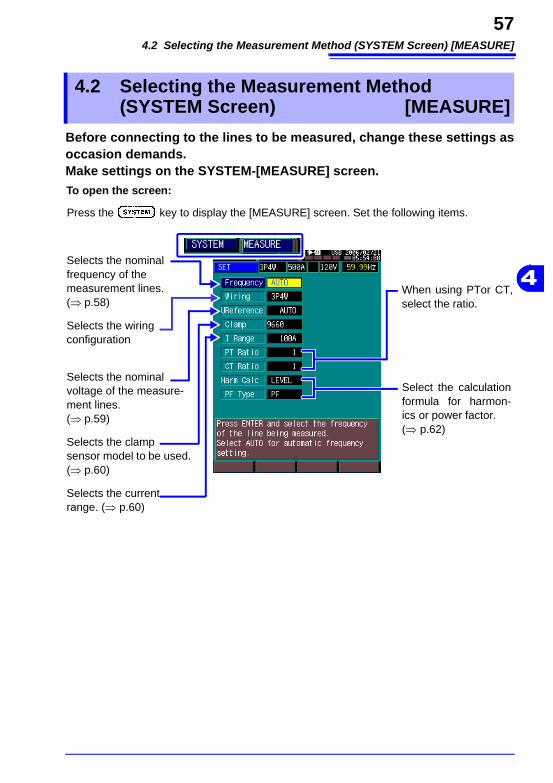
4.2 Selecting the Measurement Method (SYSTEM Screen) [MEASURE]
57
4
Before connecting to the lines to be measured, change these settings as occasion demands.Make settings on the SYSTEM-[MEASURE] screen.
4.2 Selecting the Measurement Method (SYSTEM Screen) [MEASURE]
Press the key to display the [MEASURE] screen. Set the following items.
When using PTor CT, select the ratio.
Select the calculation formula for harmon-ics or power factor. (⇒ p.62)
To open the screen:
Selects the nominal frequency of the measurement lines. (⇒ p.58)
Selects the wiring configuration
Selects the nominal voltage of the measure-ment lines. (⇒ p.59)
Selects the clamp sensor model to be used. (⇒ p.60)
Selects the current range. (⇒ p.60)
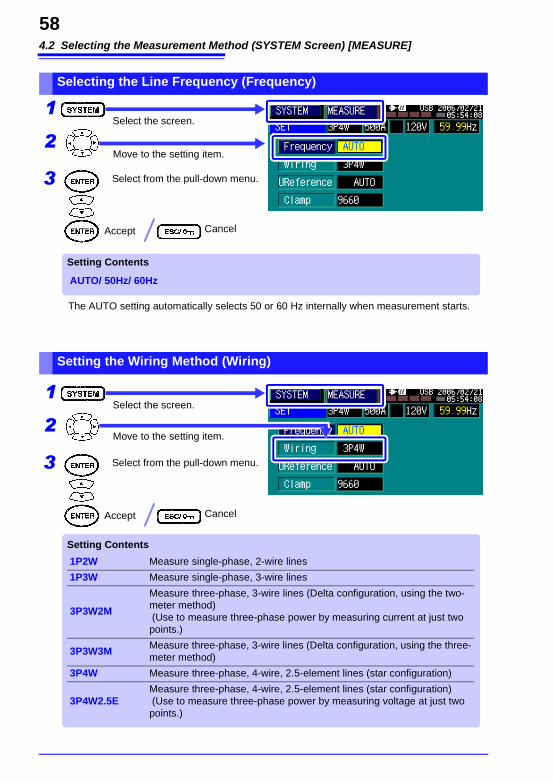
4.2 Selecting the Measurement Method (SYSTEM Screen) [MEASURE]
58
Selecting the Line Frequency (Frequency)
Move to the setting item.
Select the screen.1
2
Setting Contents
AUTO/ 50Hz/ 60Hz
Accept Cancel
Select from the pull-down menu.3
The AUTO setting automatically selects 50 or 60 Hz internally when measurement starts.
Setting the Wiring Method (Wiring)
Move to the setting item.
Select the screen.1
2
Setting Contents
1P2W Measure single-phase, 2-wire lines
1P3W Measure single-phase, 3-wire lines
3P3W2M
Measure three-phase, 3-wire lines (Delta configuration, using the two-meter method) (Use to measure three-phase power by measuring current at just two points.)
3P3W3M Measure three-phase, 3-wire lines (Delta configuration, using the three-meter method)
3P4W Measure three-phase, 4-wire, 2.5-element lines (star configuration)
3P4W2.5EMeasure three-phase, 4-wire, 2.5-element lines (star configuration) (Use to measure three-phase power by measuring voltage at just two points.)
Select from the pull-down menu.3
Accept Cancel
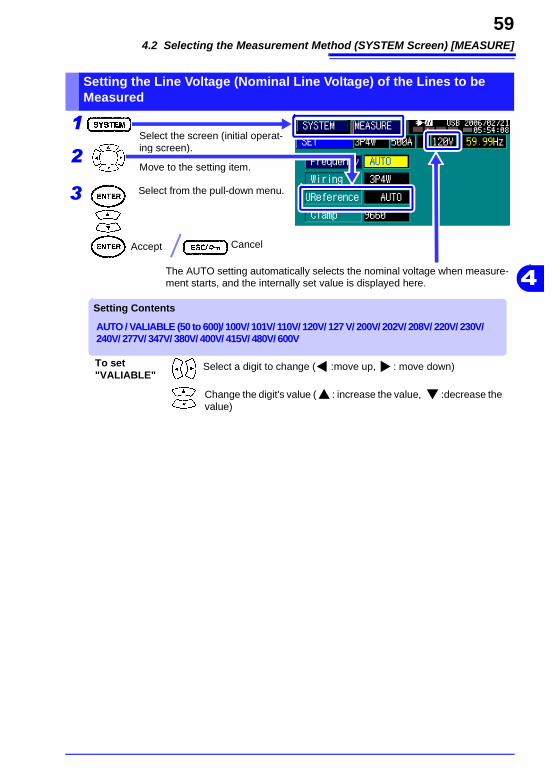
4.2 Selecting the Measurement Method (SYSTEM Screen) [MEASURE]
59
4
Setting the Line Voltage (Nominal Line Voltage) of the Lines to be Measured
Move to the setting item.
Select the screen (initial operat-ing screen).
1
2
Setting Contents
AUTO / VALIABLE (50 to 600)/ 100V/ 101V/ 110V/ 120V/ 127 V/ 200V/ 202V/ 208V/ 220V/ 230V/ 240V/ 277V/ 347V/ 380V/ 400V/ 415V/ 480V/ 600V
Select from the pull-down menu.3
Accept Cancel
To set "VALIABLE"
Select a digit to change ( :move up, : move down)
Change the digit's value ( : increase the value, :decrease the value)
The AUTO setting automatically selects the nominal voltage when measure-ment starts, and the internally set value is displayed here.
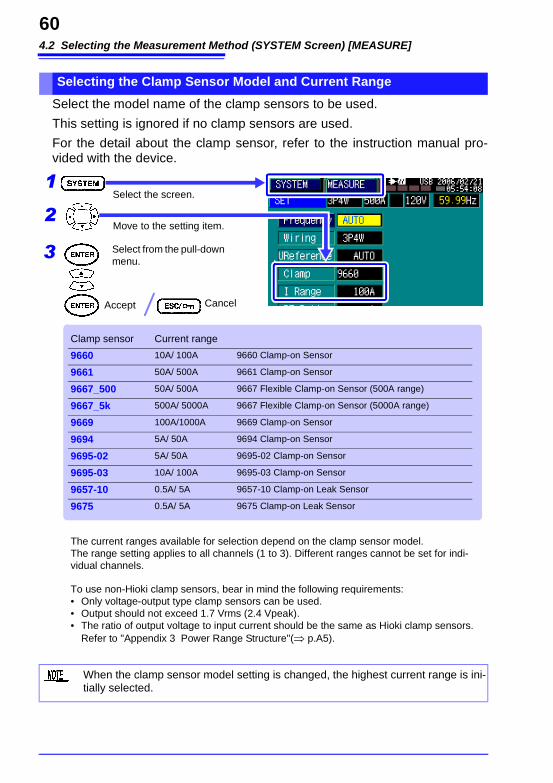
4.2 Selecting the Measurement Method (SYSTEM Screen) [MEASURE]
60
Select the model name of the clamp sensors to be used.
This setting is ignored if no clamp sensors are used.
For the detail about the clamp sensor, refer to the instruction manual pro-vided with the device.
Selecting the Clamp Sensor Model and Current Range
Move to the setting item.
Select the screen.1
2
Select from the pull-down menu.
3
Accept Cancel
Clamp sensor Current range
9660 10A/ 100A 9660 Clamp-on Sensor
9661 50A/ 500A 9661 Clamp-on Sensor
9667_500 50A/ 500A 9667 Flexible Clamp-on Sensor (500A range)
9667_5k 500A/ 5000A 9667 Flexible Clamp-on Sensor (5000A range)
9669 100A/1000A 9669 Clamp-on Sensor
9694 5A/ 50A 9694 Clamp-on Sensor
9695-02 5A/ 50A 9695-02 Clamp-on Sensor
9695-03 10A/ 100A 9695-03 Clamp-on Sensor
9657-10 0.5A/ 5A 9657-10 Clamp-on Leak Sensor
9675 0.5A/ 5A 9675 Clamp-on Leak Sensor
The current ranges available for selection depend on the clamp sensor model.The range setting applies to all channels (1 to 3). Different ranges cannot be set for indi-vidual channels.
To use non-Hioki clamp sensors, bear in mind the following requirements: • Only voltage-output type clamp sensors can be used.• Output should not exceed 1.7 Vrms (2.4 Vpeak).• The ratio of output voltage to input current should be the same as Hioki clamp sensors.
Refer to "Appendix 3 Power Range Structure"(⇒ p.A5).
When the clamp sensor model setting is changed, the highest current range is ini-tially selected.
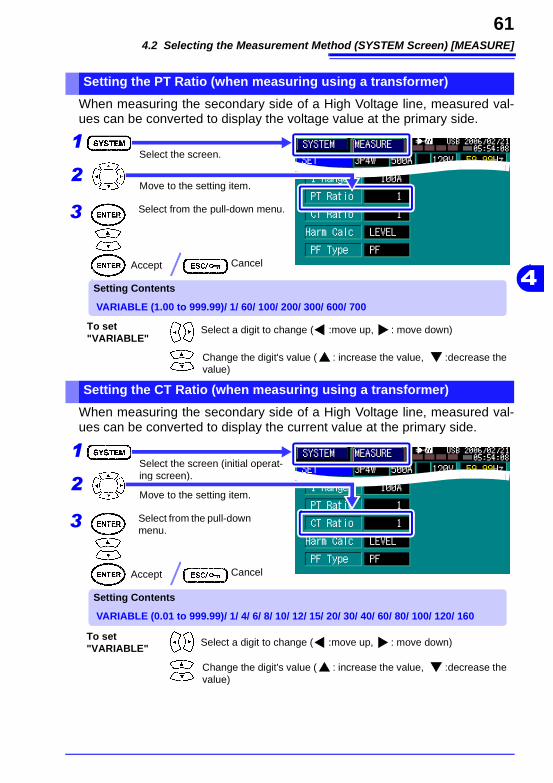
4.2 Selecting the Measurement Method (SYSTEM Screen) [MEASURE]
61
4
When measuring the secondary side of a High Voltage line, measured val-ues can be converted to display the voltage value at the primary side.
When measuring the secondary side of a High Voltage line, measured val-ues can be converted to display the current value at the primary side.
Setting the PT Ratio (when measuring using a transformer)
Move to the setting item.
Select the screen.1
2
Setting Contents
VARIABLE (1.00 to 999.99)/ 1/ 60/ 100/ 200/ 300/ 600/ 700
Select from the pull-down menu.3
Accept Cancel
To set "VARIABLE"
Select a digit to change ( :move up, : move down)
Change the digit's value ( : increase the value, :decrease the value)
Setting the CT Ratio (when measuring using a transformer)
Move to the setting item.
Select the screen (initial operat-ing screen).
1
2
Setting Contents
VARIABLE (0.01 to 999.99)/ 1/ 4/ 6/ 8/ 10/ 12/ 15/ 20/ 30/ 40/ 60/ 80/ 100/ 120/ 160
Select from the pull-down menu.
3
Accept Cancel
To set "VARIABLE"
Select a digit to change ( :move up, : move down)
Change the digit's value ( : increase the value, :decrease the value)
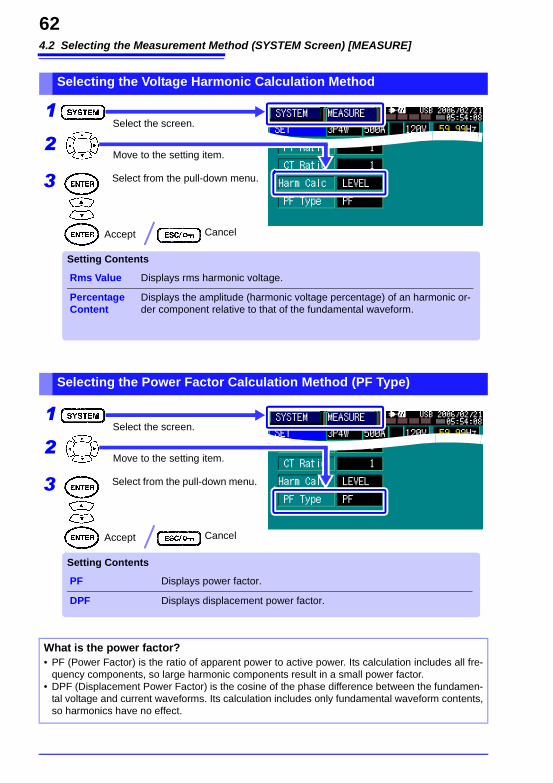
4.2 Selecting the Measurement Method (SYSTEM Screen) [MEASURE]
62
Selecting the Voltage Harmonic Calculation Method
Move to the setting item.
Select the screen.1
2
Setting Contents
Rms Value Displays rms harmonic voltage.
Percentage Content
Displays the amplitude (harmonic voltage percentage) of an harmonic or-der component relative to that of the fundamental waveform.
Select from the pull-down menu.3
Accept Cancel
Selecting the Power Factor Calculation Method (PF Type)
Move to the setting item.
Select the screen.1
2
Setting Contents
PF Displays power factor.
DPF Displays displacement power factor.
Select from the pull-down menu.3
Accept Cancel
What is the power factor?• PF (Power Factor) is the ratio of apparent power to active power. Its calculation includes all fre-
quency components, so large harmonic components result in a small power factor.• DPF (Displacement Power Factor) is the cosine of the phase difference between the fundamen-
tal voltage and current waveforms. Its calculation includes only fundamental waveform contents, so harmonics have no effect.
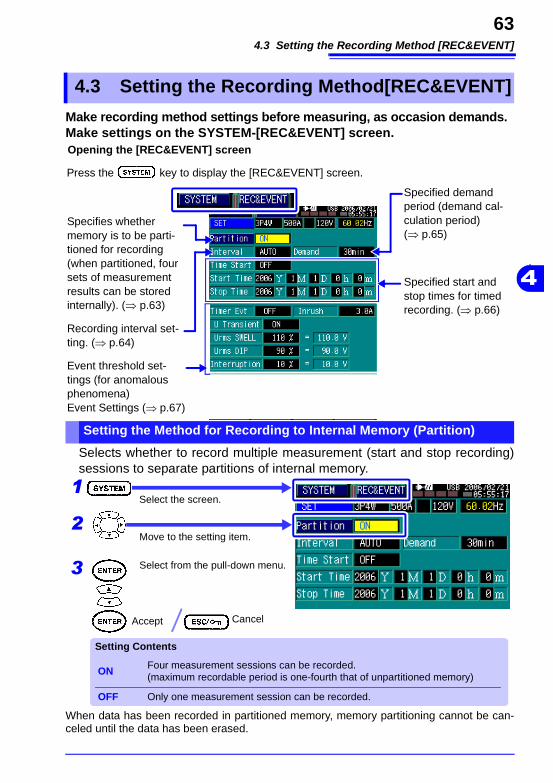
4.3 Setting the Recording Method [REC&EVENT]
63
4
Make recording method settings before measuring, as occasion demands.Make settings on the SYSTEM-[REC&EVENT] screen.
Selects whether to record multiple measurement (start and stop recording) sessions to separate partitions of internal memory.
When data has been recorded in partitioned memory, memory partitioning cannot be can-celed until the data has been erased.
4.3 Setting the Recording Method[REC&EVENT]
Press the key to display the [REC&EVENT] screen.
Specified demand period (demand cal-culation period) (⇒ p.65)
Specifies whether memory is to be parti-tioned for recording (when partitioned, four sets of measurement results can be stored internally). (⇒ p.63)
Recording interval set-ting. (⇒ p.64)
Event threshold set-tings (for anomalous phenomena) Event Settings (⇒ p.67)
Opening the [REC&EVENT] screen
Specified start and stop times for timed recording. (⇒ p.66)
Setting the Method for Recording to Internal Memory (Partition)
Move to the setting item.
Select the screen.1
2
Setting Contents
ON Four measurement sessions can be recorded.(maximum recordable period is one-fourth that of unpartitioned memory)
OFF Only one measurement session can be recorded.
Select from the pull-down menu.3
Accept Cancel
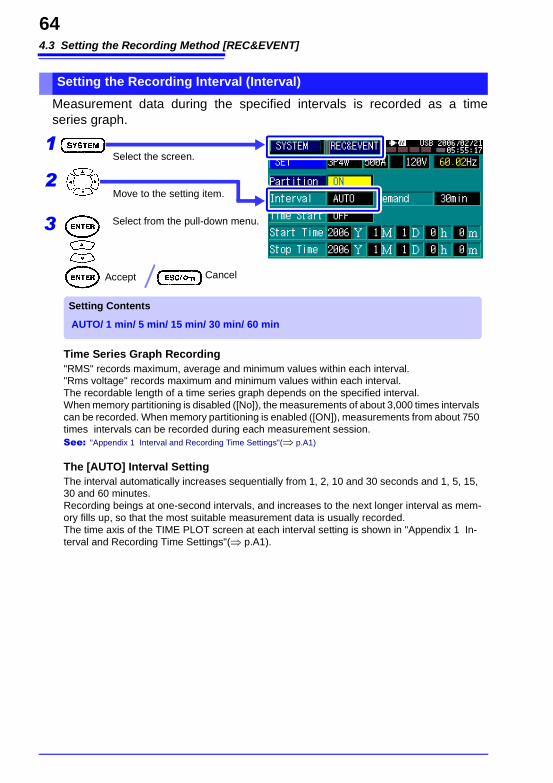
4.3 Setting the Recording Method [REC&EVENT]
64
Measurement data during the specified intervals is recorded as a time series graph.
Setting the Recording Interval (Interval)
Move to the setting item.
Select the screen.1
2
Setting Contents
AUTO/ 1 min/ 5 min/ 15 min/ 30 min/ 60 min
Select from the pull-down menu.3
Accept Cancel
Time Series Graph Recording "RMS" records maximum, average and minimum values within each interval."Rms voltage" records maximum and minimum values within each interval.The recordable length of a time series graph depends on the specified interval.When memory partitioning is disabled ([No]), the measurements of about 3,000 times intervals can be recorded. When memory partitioning is enabled ([ON]), measurements from about 750 times intervals can be recorded during each measurement session.See: "Appendix 1 Interval and Recording Time Settings"(⇒ p.A1)
The [AUTO] Interval Setting The interval automatically increases sequentially from 1, 2, 10 and 30 seconds and 1, 5, 15, 30 and 60 minutes.Recording beings at one-second intervals, and increases to the next longer interval as mem-ory fills up, so that the most suitable measurement data is usually recorded.The time axis of the TIME PLOT screen at each interval setting is shown in "Appendix 1 In-terval and Recording Time Settings"(⇒ p.A1).
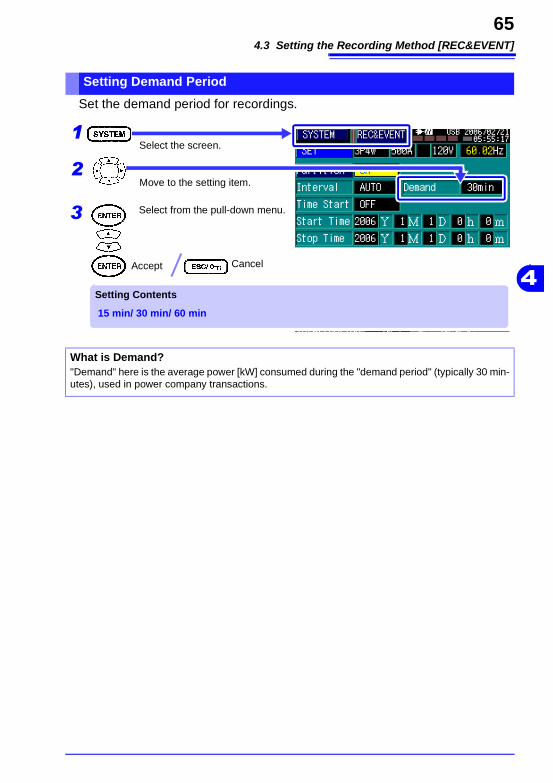
4.3 Setting the Recording Method [REC&EVENT]
65
4
Set the demand period for recordings.
Setting Demand Period
Move to the setting item.
Select the screen.1
2
Setting Contents
15 min/ 30 min/ 60 min
Select from the pull-down menu.3
Accept Cancel
What is Demand?"Demand" here is the average power [kW] consumed during the "demand period" (typically 30 min-utes), used in power company transactions.
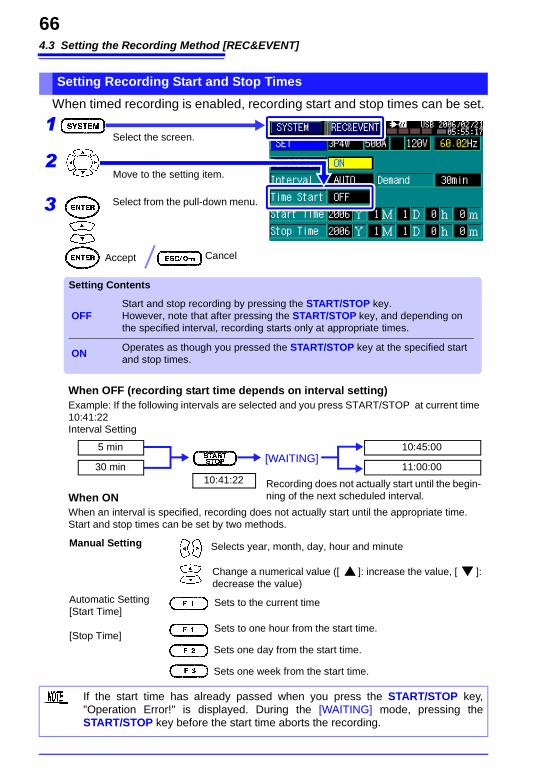
4.3 Setting the Recording Method [REC&EVENT]
66
When timed recording is enabled, recording start and stop times can be set.
Setting Recording Start and Stop Times
Move to the setting item.
Select the screen.1
2
Setting Contents
OFF Start and stop recording by pressing the START/STOP key.However, note that after pressing the START/STOP key, and depending on the specified interval, recording starts only at appropriate times.
ON Operates as though you pressed the START/STOP key at the specified start and stop times.
Select from the pull-down menu.3
Accept Cancel
When OFF (recording start time depends on interval setting)Example: If the following intervals are selected and you press START/STOP at current time 10:41:22Interval Setting
10:45:00
11:00:00
Recording does not actually start until the begin-ning of the next scheduled interval.
[WAITING]5 min
30 min
When ONWhen an interval is specified, recording does not actually start until the appropriate time.Start and stop times can be set by two methods.
Selects year, month, day, hour and minute
Change a numerical value ([ ]: increase the value, [ ]: decrease the value)
Automatic Setting[Start Time]
[Stop Time]
Manual Setting
Sets to the current time
Sets to one hour from the start time.
Sets one day from the start time.
Sets one week from the start time.
10:41:22
If the start time has already passed when you press the START/STOP key, "Operation Error!" is displayed. During the [WAITING] mode, pressing the START/STOP key before the start time aborts the recording.
4.4 Setting Event Detection [REC&EVENT]
67
4
With this instrument, an "event" is the detection of an anomaly (abnor-mal phenomena) that may occur on power lines.The detection criteria (Event Settings) are specified before recording measurements.When the specified criteria are satisfied while recording, the data is recorded as an event, and can be analyzed on the EVENT screen.Event settings are made on the SYSTEM-[REC&EVENT] screen.
This instrument supports eight types of events
See: Refer to: Event Details, "Detection Methods and Recording Contents of Events" (⇒ p.110)
Event Recording• Event criteria can be ORed together (logical sum).• Events are recorded when recording starts and stops, regardless of
criteria settings.• The instrument can record data from up to 50 events (in the Event List
and Event Waveforms).• Depending on the type of event, two recordings may occur: once when
a threshold is exceeded [IN] and again upon return [OUT].
4.4 Setting Event Detection [REC&EVENT]
Parameter that can be analyzed on the EVENT screen:
• View event occurrences on the Event Monitor.• View sequence, date, time and event parameter.• View the voltage or current event waveform.• On the detailed fluctuation graph, view rms fluctuations when an
event occurs.See: "Viewing Anomalous Phenomena (EVENT screen)" (⇒ p.108)
Manual Inrush CurrentTimer Transients
Voltage Swell Voltage DipInterruption Start, Stop
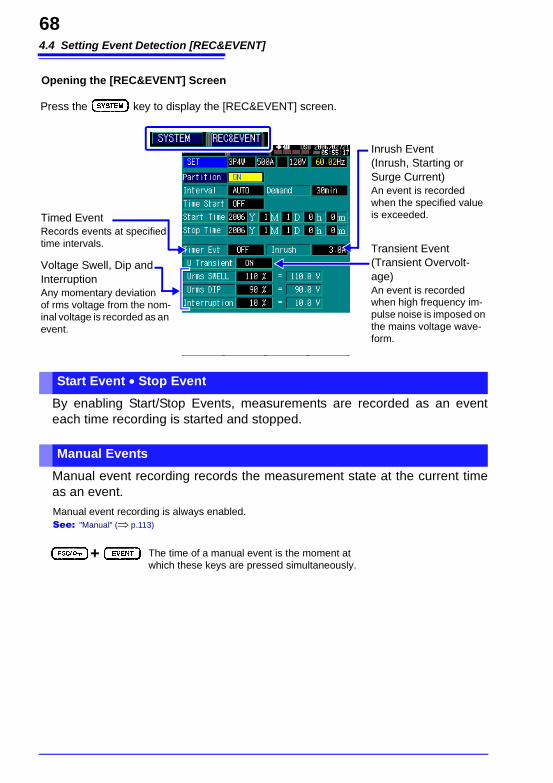
4.4 Setting Event Detection [REC&EVENT]
68
By enabling Start/Stop Events, measurements are recorded as an event each time recording is started and stopped.
Manual event recording records the measurement state at the current time as an event.
Press the key to display the [REC&EVENT] screen.
Timed EventRecords events at specified time intervals.
Voltage Swell, Dip and InterruptionAny momentary deviation of rms voltage from the nom-inal voltage is recorded as an event.
Opening the [REC&EVENT] Screen
Inrush Event (Inrush, Starting or Surge Current)An event is recorded when the specified value is exceeded.
Transient Event (Transient Overvolt-age)An event is recorded when high frequency im-pulse noise is imposed on the mains voltage wave-form.
Start Event • Stop Event
Manual Events
The time of a manual event is the moment at which these keys are pressed simultaneously.
Manual event recording is always enabled.See: "Manual" (⇒ p.113)
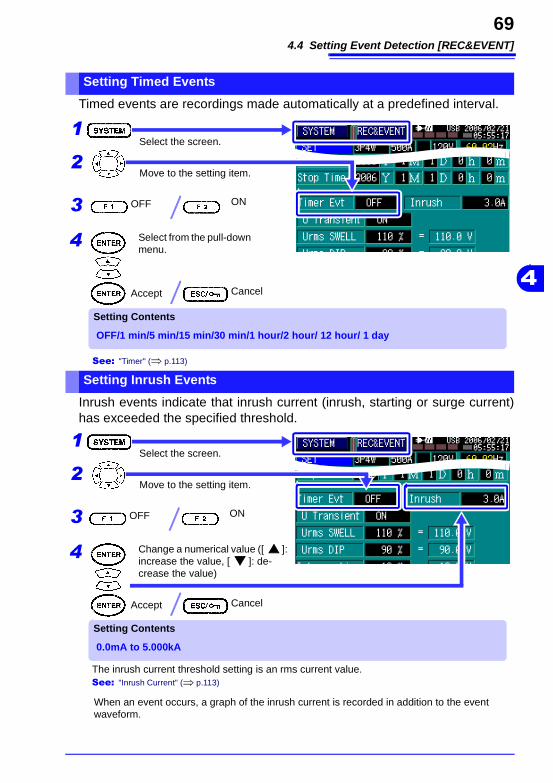
4.4 Setting Event Detection [REC&EVENT]
69
4
Timed events are recordings made automatically at a predefined interval.
Inrush events indicate that inrush current (inrush, starting or surge current) has exceeded the specified threshold.
Setting Timed Events
Move to the setting item.
Select the screen.1
2
Setting Contents
OFF/1 min/5 min/15 min/30 min/1 hour/2 hour/ 12 hour/ 1 day
Select from the pull-down menu.
4
Accept Cancel
3 OFF ON
See: "Timer" (⇒ p.113)
Setting Inrush Events
Move to the setting item.
Select the screen.1
2
Setting Contents
0.0mA to 5.000kA
Change a numerical value ([ ]: increase the value, [ ]: de-crease the value)
4
Accept Cancel
When an event occurs, a graph of the inrush current is recorded in addition to the event waveform.
3 OFF ON
The inrush current threshold setting is an rms current value.See: "Inrush Current" (⇒ p.113)
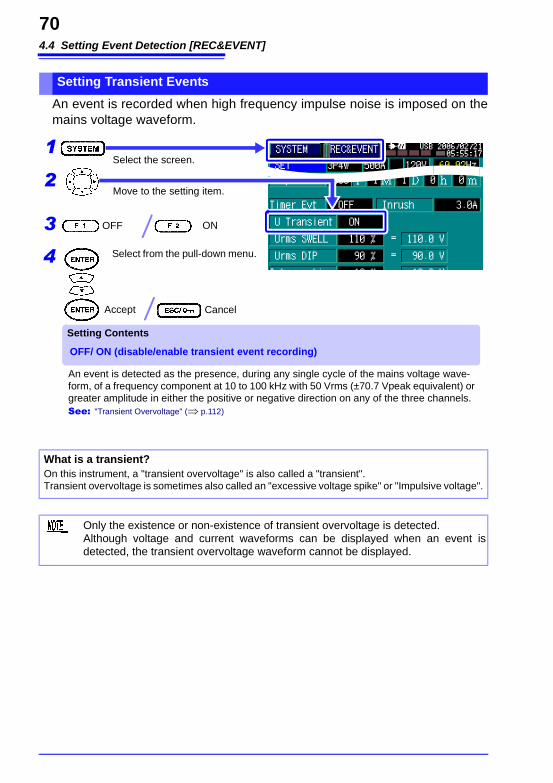
4.4 Setting Event Detection [REC&EVENT]
70
An event is recorded when high frequency impulse noise is imposed on the mains voltage waveform.
Setting Transient Events
Move to the setting item.
Select the screen.1
2
Setting Contents
OFF/ ON (disable/enable transient event recording)
Select from the pull-down menu.4
Accept Cancel
An event is detected as the presence, during any single cycle of the mains voltage wave-form, of a frequency component at 10 to 100 kHz with 50 Vrms (±70.7 Vpeak equivalent) or greater amplitude in either the positive or negative direction on any of the three channels.See: "Transient Overvoltage" (⇒ p.112)
3 OFF ON
What is a transient?On this instrument, a "transient overvoltage" is also called a "transient". Transient overvoltage is sometimes also called an "excessive voltage spike" or "Impulsive voltage".
Only the existence or non-existence of transient overvoltage is detected.Although voltage and current waveforms can be displayed when an event is detected, the transient overvoltage waveform cannot be displayed.
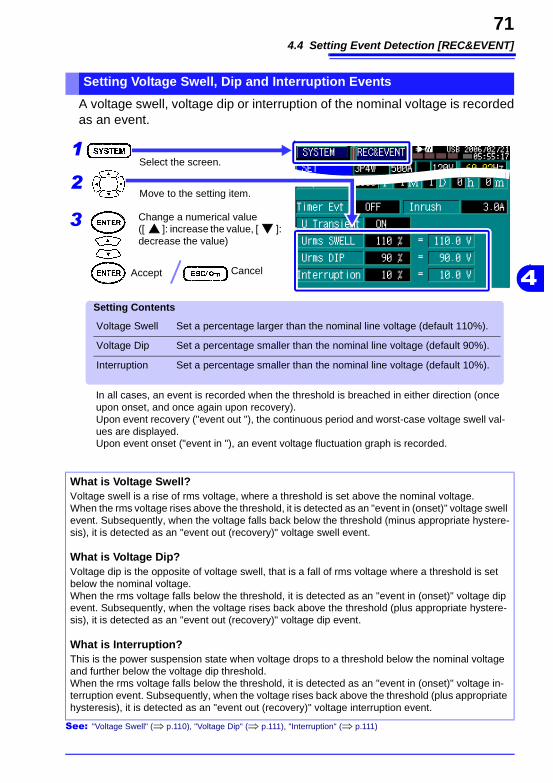
4.4 Setting Event Detection [REC&EVENT]
71
4
A voltage swell, voltage dip or interruption of the nominal voltage is recorded as an event.
See: "Voltage Swell" (⇒ p.110), "Voltage Dip" (⇒ p.111), "Interruption" (⇒ p.111)
Setting Voltage Swell, Dip and Interruption Events
Move to the setting item.
Select the screen.1
2
Setting Contents
Voltage Swell Set a percentage larger than the nominal line voltage (default 110%).
Voltage Dip Set a percentage smaller than the nominal line voltage (default 90%).
Interruption Set a percentage smaller than the nominal line voltage (default 10%).
Change a numerical value ([ ]: increase the value, [ ]: decrease the value)
3
Accept Cancel
In all cases, an event is recorded when the threshold is breached in either direction (once upon onset, and once again upon recovery). Upon event recovery ("event out "), the continuous period and worst-case voltage swell val-ues are displayed.Upon event onset ("event in "), an event voltage fluctuation graph is recorded.
What is Voltage Swell?Voltage swell is a rise of rms voltage, where a threshold is set above the nominal voltage. When the rms voltage rises above the threshold, it is detected as an "event in (onset)" voltage swell event. Subsequently, when the voltage falls back below the threshold (minus appropriate hystere-sis), it is detected as an "event out (recovery)" voltage swell event.
What is Voltage Dip?Voltage dip is the opposite of voltage swell, that is a fall of rms voltage where a threshold is set below the nominal voltage. When the rms voltage falls below the threshold, it is detected as an "event in (onset)" voltage dip event. Subsequently, when the voltage rises back above the threshold (plus appropriate hystere-sis), it is detected as an "event out (recovery)" voltage dip event.
What is Interruption?This is the power suspension state when voltage drops to a threshold below the nominal voltage and further below the voltage dip threshold.When the rms voltage falls below the threshold, it is detected as an "event in (onset)" voltage in-terruption event. Subsequently, when the voltage rises back above the threshold (plus appropriate hysteresis), it is detected as an "event out (recovery)" voltage interruption event.
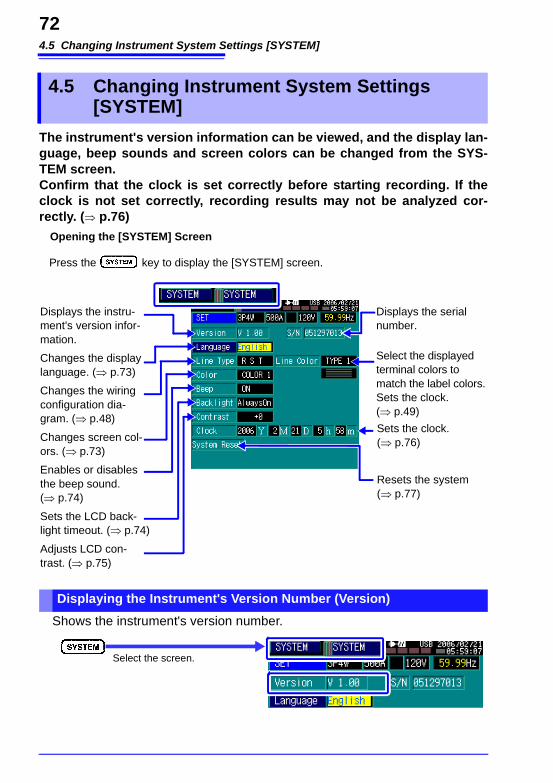
4.5 Changing Instrument System Settings [SYSTEM]
72
The instrument's version information can be viewed, and the display lan-guage, beep sounds and screen colors can be changed from the SYS-TEM screen. Confirm that the clock is set correctly before starting recording. If the clock is not set correctly, recording results may not be analyzed cor-rectly. (⇒ p.76)
Shows the instrument's version number.
4.5 Changing Instrument System Settings [SYSTEM]
Press the key to display the [SYSTEM] screen.
Displays the instru-ment's version infor-mation.
Changes the display language. (⇒ p.73)
Changes the wiring configuration dia-gram. (⇒ p.48)
Changes screen col-ors. (⇒ p.73)
Enables or disables the beep sound. (⇒ p.74)
Sets the LCD back-light timeout. (⇒ p.74)
Adjusts LCD con-trast. (⇒ p.75)
Opening the [SYSTEM] Screen
Sets the clock. (⇒ p.76)
Resets the system (⇒ p.77)
Select the displayed terminal colors to match the label colors.Sets the clock. (⇒ p.49)
Displays the serial number.
Displaying the Instrument's Version Number (Version)
Select the screen.
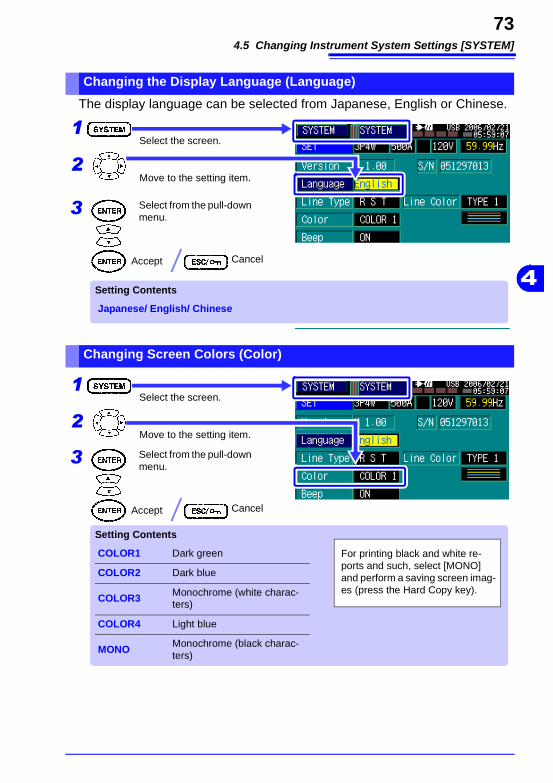
4.5 Changing Instrument System Settings [SYSTEM]
73
4
The display language can be selected from Japanese, English or Chinese.
Changing the Display Language (Language)
Move to the setting item.
Select the screen.1
2
Setting Contents
Japanese/ English/ Chinese
Select from the pull-down menu.
3
Accept Cancel
Changing Screen Colors (Color)
Move to the setting item.
Select the screen.1
2
Setting Contents
COLOR1 Dark green
COLOR2 Dark blue
COLOR3 Monochrome (white charac-ters)
COLOR4 Light blue
MONO Monochrome (black charac-ters)
Select from the pull-down menu.
3
Accept Cancel
For printing black and white re-ports and such, select [MONO] and perform a saving screen imag-es (press the Hard Copy key).
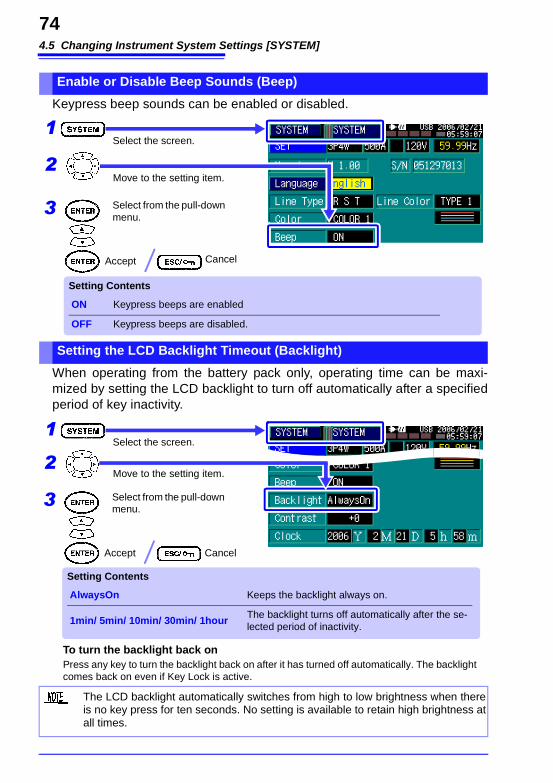
4.5 Changing Instrument System Settings [SYSTEM]
74
Keypress beep sounds can be enabled or disabled.
When operating from the battery pack only, operating time can be maxi-mized by setting the LCD backlight to turn off automatically after a specified period of key inactivity.
Enable or Disable Beep Sounds (Beep)
Move to the setting item.
Select the screen.1
2
Setting Contents
ON Keypress beeps are enabled
OFF Keypress beeps are disabled.
Select from the pull-down menu.
3
Accept Cancel
Setting the LCD Backlight Timeout (Backlight)
Move to the setting item.
Select the screen.1
2
Setting Contents
AlwaysOn Keeps the backlight always on.
1min/ 5min/ 10min/ 30min/ 1hour The backlight turns off automatically after the se-lected period of inactivity.
Select from the pull-down menu.
3
Accept Cancel
To turn the backlight back onPress any key to turn the backlight back on after it has turned off automatically. The backlight comes back on even if Key Lock is active.
The LCD backlight automatically switches from high to low brightness when there is no key press for ten seconds. No setting is available to retain high brightness at all times.
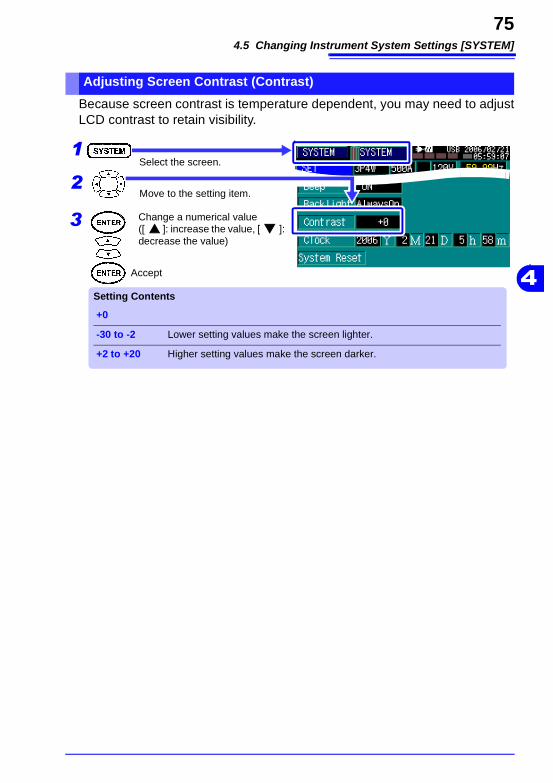
4.5 Changing Instrument System Settings [SYSTEM]
75
4
Because screen contrast is temperature dependent, you may need to adjust LCD contrast to retain visibility.
Adjusting Screen Contrast (Contrast)
Move to the setting item.
Select the screen.1
2
Setting Contents
+0
-30 to -2 Lower setting values make the screen lighter.
+2 to +20 Higher setting values make the screen darker.
Change a numerical value ([ ]: increase the value, [ ]: decrease the value)
3
Accept
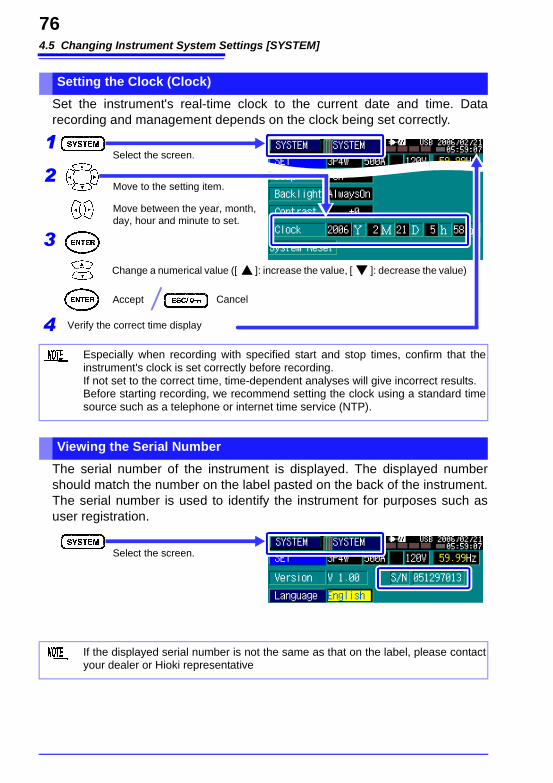
4.5 Changing Instrument System Settings [SYSTEM]
76
Set the instrument's real-time clock to the current date and time. Data recording and management depends on the clock being set correctly.
The serial number of the instrument is displayed. The displayed number should match the number on the label pasted on the back of the instrument. The serial number is used to identify the instrument for purposes such as user registration.
Setting the Clock (Clock)
Move to the setting item.
Select the screen.1
2
3
Accept Cancel
Change a numerical value ([ ]: increase the value, [ ]: decrease the value)
4 Verify the correct time display
Move between the year, month, day, hour and minute to set.
Especially when recording with specified start and stop times, confirm that the instrument's clock is set correctly before recording.If not set to the correct time, time-dependent analyses will give incorrect results.Before starting recording, we recommend setting the clock using a standard time source such as a telephone or internet time service (NTP).
Viewing the Serial Number
Select the screen.
If the displayed serial number is not the same as that on the label, please contact your dealer or Hioki representative
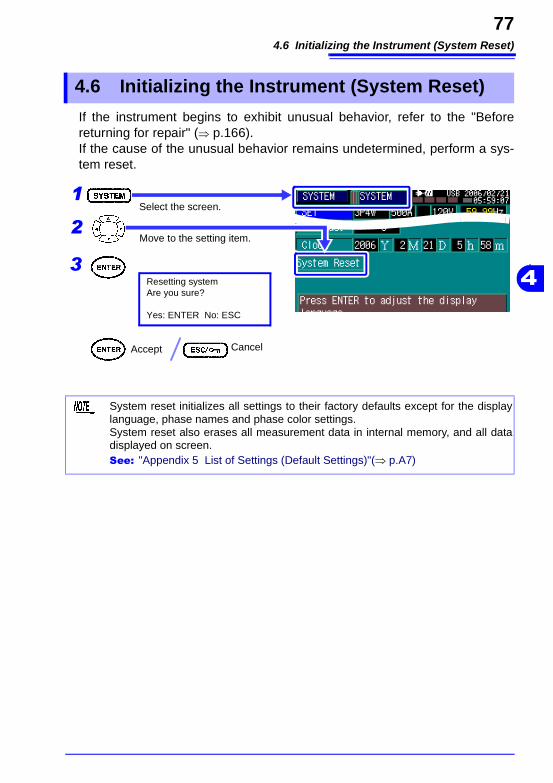
4.6 Initializing the Instrument (System Reset)
77
4
If the instrument begins to exhibit unusual behavior, refer to the "Before returning for repair" (⇒ p.166). If the cause of the unusual behavior remains undetermined, perform a sys-tem reset.
4.6 Initializing the Instrument (System Reset)
Move to the setting item.
Select the screen.1
2
3
Accept Cancel
Resetting systemAre you sure?
Yes: ENTER No: ESC
System reset initializes all settings to their factory defaults except for the display language, phase names and phase color settings.System reset also erases all measurement data in internal memory, and all data displayed on screen.See: "Appendix 5 List of Settings (Default Settings)"(⇒ p.A7)

4.6 Initializing the Instrument (System Reset)
78
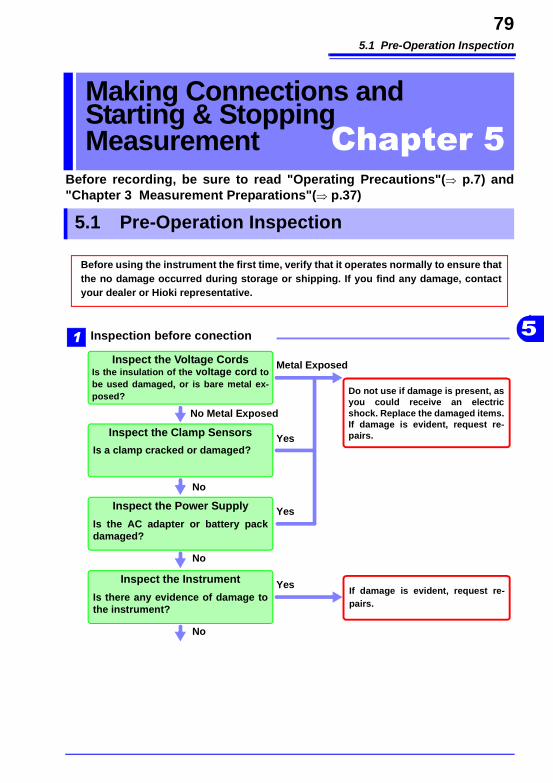
5.1 Pre-Operation Inspection
79
5
Before recording, be sure to read "Operating Precautions"(⇒ p.7) and "Chapter 3 Measurement Preparations"(⇒ p.37)
Making Connections and Starting & Stopping Measurement Chapter 5
5.1 Pre-Operation Inspection
Do not use if damage is present, as you could receive an electric shock. Replace the damaged items.If damage is evident, request re-pairs.
Metal ExposedInspect the Voltage Cords
Yes
1
No Metal Exposed
No
Inspection before conection
Inspect the Clamp Sensors
Is a clamp cracked or damaged?
Is the insulation of the voltage cord to be used damaged, or is bare metal ex-posed?
No
Inspect the Power Supply
Is the AC adapter or battery pack damaged?
Yes
No
Inspect the Instrument
Is there any evidence of damage to the instrument?
YesIf damage is evident, request re-pairs.
Before using the instrument the first time, verify that it operates normally to ensure that the no damage occurred during storage or shipping. If you find any damage, contact your dealer or Hioki representative.
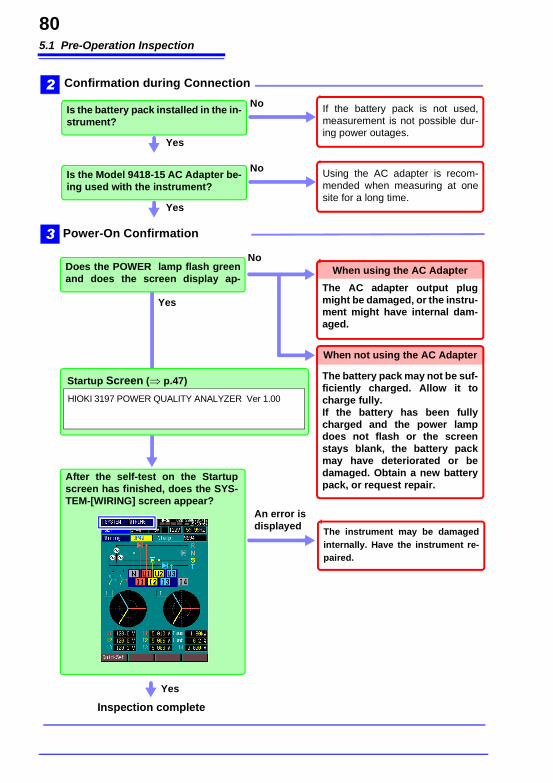
5.1 Pre-Operation Inspection
80
Power-On Confirmation
After the self-test on the Startup screen has finished, does the SYS-TEM-[WIRING] screen appear?
The instrument may be damaged internally. Have the instrument re-paired.
An error is displayed
Yes
Inspection complete
3
Does the POWER lamp flash green and does the screen display ap-
No
Yes
When using the AC Adapter
When not using the AC Adapter
The AC adapter output plug might be damaged, or the instru-ment might have internal dam-aged.
The battery pack may not be suf-ficiently charged. Allow it to charge fully.If the battery has been fully charged and the power lamp does not flash or the screen stays blank, the battery pack may have deteriorated or be damaged. Obtain a new battery pack, or request repair.
Startup Screen (⇒ p.47)
HIOKI 3197 POWER QUALITY ANALYZER Ver 1.00
If the battery pack is not used, measurement is not possible dur-ing power outages.
NoIs the battery pack installed in the in-strument?
2 Confirmation during Connection
Yes
Using the AC adapter is recom-mended when measuring at one site for a long time.
NoIs the Model 9418-15 AC Adapter be-ing used with the instrument?
Yes
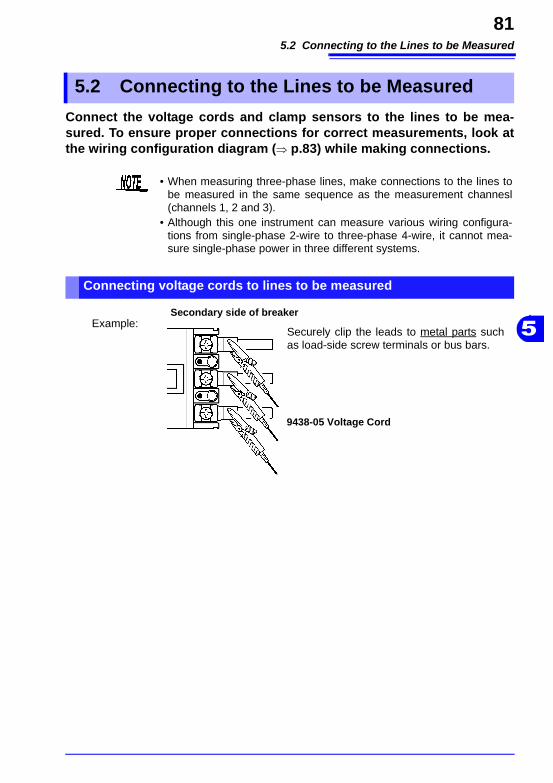
5.2 Connecting to the Lines to be Measured
81
5
Connect the voltage cords and clamp sensors to the lines to be mea-sured. To ensure proper connections for correct measurements, look at the wiring configuration diagram (⇒ p.83) while making connections.
5.2 Connecting to the Lines to be Measured
• When measuring three-phase lines, make connections to the lines to be measured in the same sequence as the measurement channesl (channels 1, 2 and 3).
• Although this one instrument can measure various wiring configura-tions from single-phase 2-wire to three-phase 4-wire, it cannot mea-sure single-phase power in three different systems.
Connecting voltage cords to lines to be measured
Securely clip the leads to metal parts such as load-side screw terminals or bus bars.
Example:Secondary side of breaker
9438-05 Voltage Cord
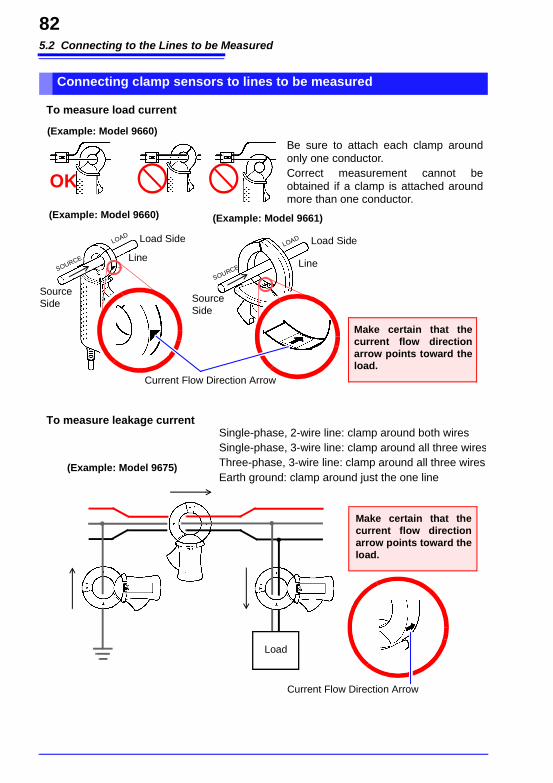
5.2 Connecting to the Lines to be Measured
82
Connecting clamp sensors to lines to be measured
OK
Be sure to attach each clamp around only one conductor.Correct measurement cannot be obtained if a clamp is attached around more than one conductor.
(Example: Model 9660)
Make certain that the current flow direction arrow points toward the load.
LOAD
SOURCE
(Example: Model 9661)
Source Side
Line
Load Side
(Example: Model 9660)
Source Side
Line
Load SideLOAD
SOURCE
Current Flow Direction Arrow
To measure load current
To measure leakage currentSingle-phase, 2-wire line: clamp around both wiresSingle-phase, 3-wire line: clamp around all three wiresThree-phase, 3-wire line: clamp around all three wiresEarth ground: clamp around just the one line
Make certain that the current flow direction arrow points toward the load.
(Example: Model 9675)
Load
Current Flow Direction Arrow
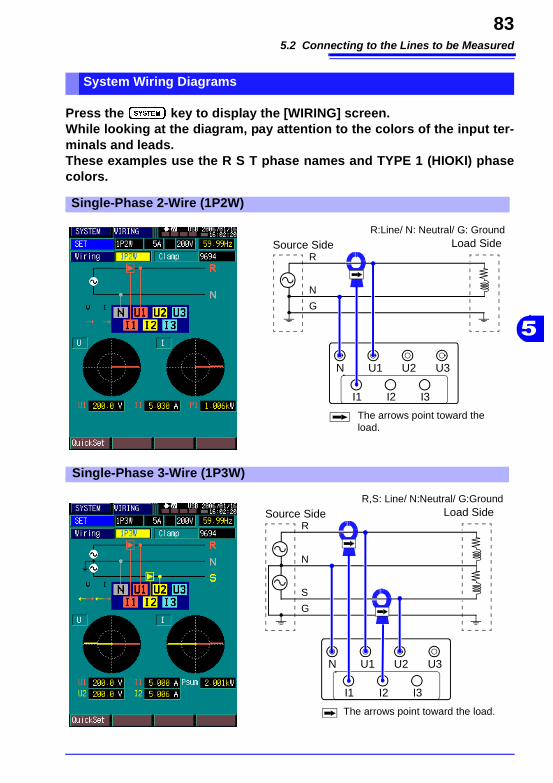
5.2 Connecting to the Lines to be Measured
83
5
Press the key to display the [WIRING] screen. While looking at the diagram, pay attention to the colors of the input ter-minals and leads.These examples use the R S T phase names and TYPE 1 (HIOKI) phase colors.
System Wiring Diagrams
N U1 U2 U3
I1 I2 I3
Source Side Load SideR
N
G
The arrows point toward the load.
R:Line/ N: Neutral/ G: Ground
Single-Phase 2-Wire (1P2W)
N U1 U2 U3
I1 I2 I3
Source Side Load SideR
The arrows point toward the load.
R,S: Line/ N:Neutral/ G:Ground
N
S
G
Single-Phase 3-Wire (1P3W)
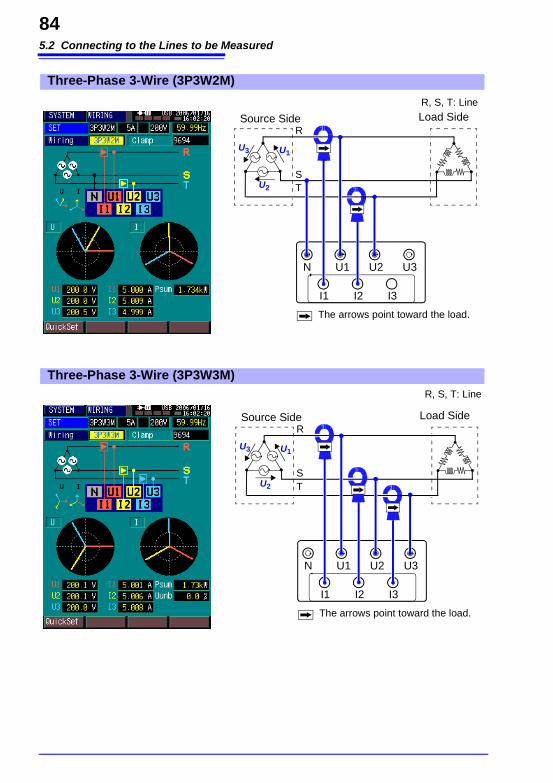
5.2 Connecting to the Lines to be Measured
84
N U1 U2 U3
I1 I2 I3
The arrows point toward the load.
Source Side Load SideR
STU2
U1U3
R, S, T: Line
Three-Phase 3-Wire (3P3W2M)
N U1 U2 U3
I1 I2 I3
The arrows point toward the load.
Source Side Load SideR
STU2
U1U3
R, S, T: Line
Three-Phase 3-Wire (3P3W3M)
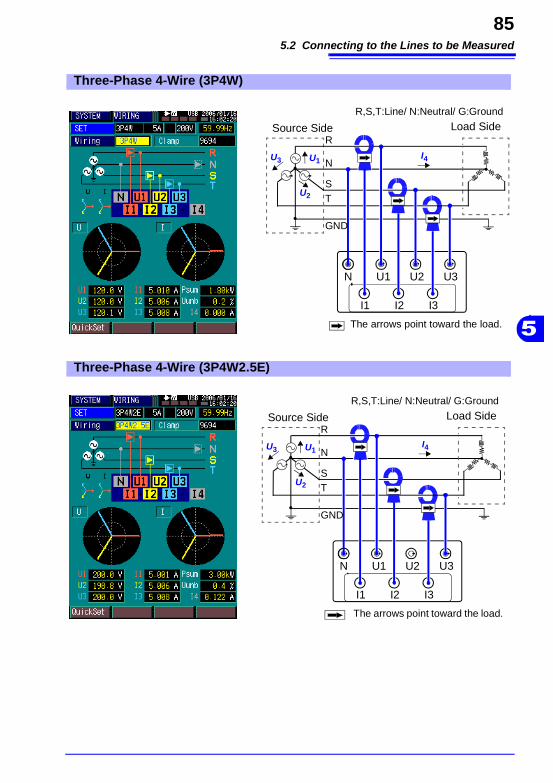
5.2 Connecting to the Lines to be Measured
85
5
R,S,T:Line/ N:Neutral/ G:Ground
N U1 U2 U3
I1 I2 I3
The arrows point toward the load.
Source Side Load SideR
ST
U2
U1U3 N
GND
I4
Three-Phase 4-Wire (3P4W)
R,S,T:Line/ N:Neutral/ G:Ground
N U1 U2 U3
I1 I2 I3
The arrows point toward the load.
Source Side Load SideR
ST
U2
U1U3 N
GND
I4
Three-Phase 4-Wire (3P4W2.5E)
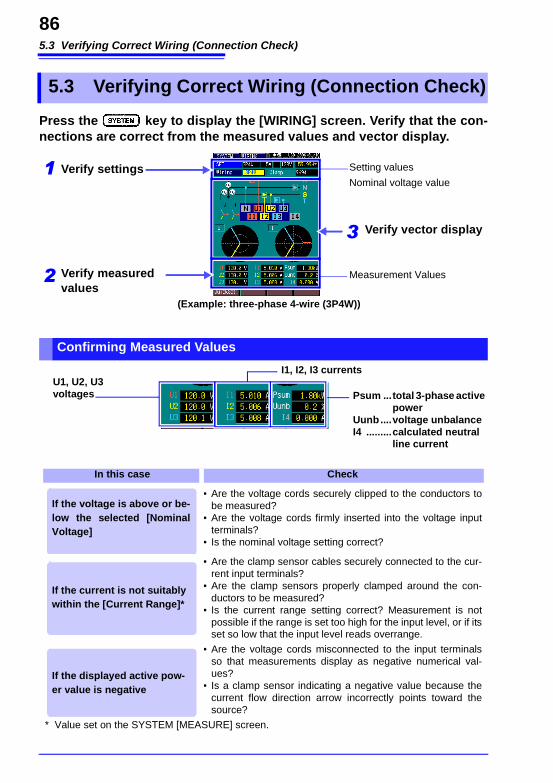
5.3 Verifying Correct Wiring (Connection Check)
86
Press the key to display the [WIRING] screen. Verify that the con-nections are correct from the measured values and vector display.
5.3 Verifying Correct Wiring (Connection Check)
Confirming Measured Values
(Example: three-phase 4-wire (3P4W))
1 Verify settings
Verify measured values
3 Verify vector display
Measurement Values
Setting values
Nominal voltage value
2
Psum ...total 3-phase active power
Uunb....voltage unbalanceI4 .........calculated neutral
line current
U1, U2, U3voltages
I1, I2, I3 currents
In this case Check
• Are the voltage cords securely clipped to the conductors to be measured?
• Are the voltage cords firmly inserted into the voltage input terminals?
• Is the nominal voltage setting correct?
• Are the clamp sensor cables securely connected to the cur-rent input terminals?
• Are the clamp sensors properly clamped around the con-ductors to be measured?
• Is the current range setting correct? Measurement is not possible if the range is set too high for the input level, or if its set so low that the input level reads overrange.
• Are the voltage cords misconnected to the input terminals so that measurements display as negative numerical val-ues?
• Is a clamp sensor indicating a negative value because the current flow direction arrow incorrectly points toward the source?
* Value set on the SYSTEM [MEASURE] screen.
If the voltage is above or be-low the selected [Nominal Voltage]
If the current is not suitably within the [Current Range]*
If the displayed active pow-er value is negative
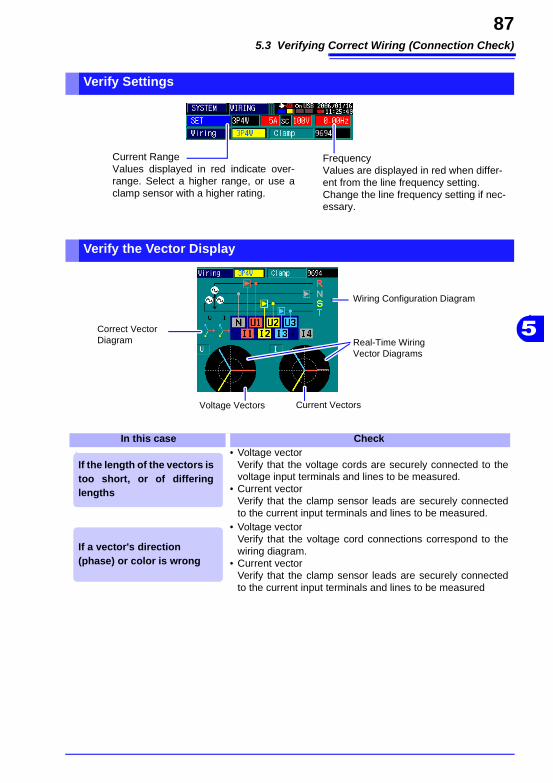
5.3 Verifying Correct Wiring (Connection Check)
87
5
Verify Settings
FrequencyValues are displayed in red when differ-ent from the line frequency setting. Change the line frequency setting if nec-essary.
Current RangeValues displayed in red indicate over-range. Select a higher range, or use a clamp sensor with a higher rating.
Verify the Vector Display
In this case Check• Voltage vector
Verify that the voltage cords are securely connected to the voltage input terminals and lines to be measured.
• Current vector Verify that the clamp sensor leads are securely connected to the current input terminals and lines to be measured.
• Voltage vector Verify that the voltage cord connections correspond to the wiring diagram.
• Current vector Verify that the clamp sensor leads are securely connected to the current input terminals and lines to be measured
Real-Time Wiring Vector Diagrams
Correct Vector Diagram
Voltage Vectors Current Vectors
Wiring Configuration Diagram
If the length of the vectors is too short, or of differing lengths
If a vector's direction (phase) or color is wrong
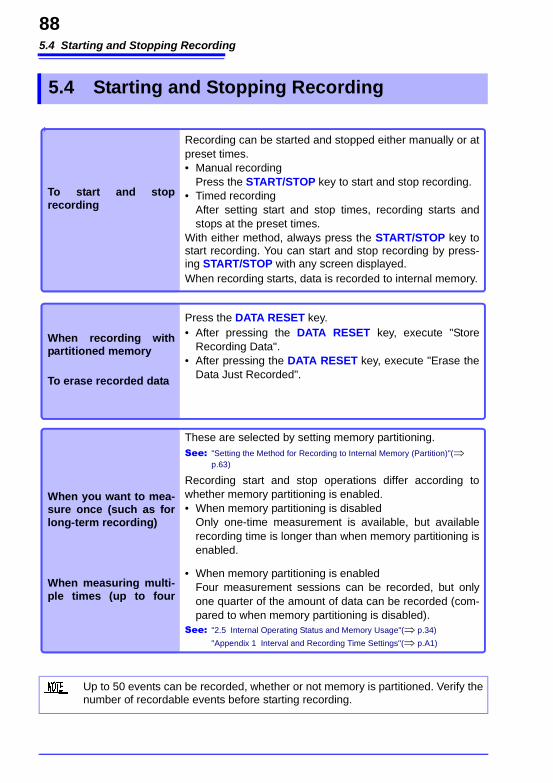
5.4 Starting and Stopping Recording
88
5.4 Starting and Stopping Recording
To start and stop recording
Recording can be started and stopped either manually or at preset times.• Manual recording
Press the START/STOP key to start and stop recording.• Timed recording
After setting start and stop times, recording starts and stops at the preset times.
With either method, always press the START/STOP key to start recording. You can start and stop recording by press-ing START/STOP with any screen displayed.When recording starts, data is recorded to internal memory.
When recording with partitioned memory
To erase recorded data
Press the DATA RESET key.• After pressing the DATA RESET key, execute "Store
Recording Data".• After pressing the DATA RESET key, execute "Erase the
Data Just Recorded".
When you want to mea-sure once (such as for long-term recording)
When measuring multi-ple times (up to four
These are selected by setting memory partitioning.See: "Setting the Method for Recording to Internal Memory (Partition)"(⇒
p.63)
Recording start and stop operations differ according to whether memory partitioning is enabled.• When memory partitioning is disabled
Only one-time measurement is available, but available recording time is longer than when memory partitioning is enabled.
• When memory partitioning is enabled Four measurement sessions can be recorded, but only one quarter of the amount of data can be recorded (com-pared to when memory partitioning is disabled).
See: "2.5 Internal Operating Status and Memory Usage"(⇒ p.34) "Appendix 1 Interval and Recording Time Settings"(⇒ p.A1)
Up to 50 events can be recorded, whether or not memory is partitioned. Verify the number of recordable events before starting recording.
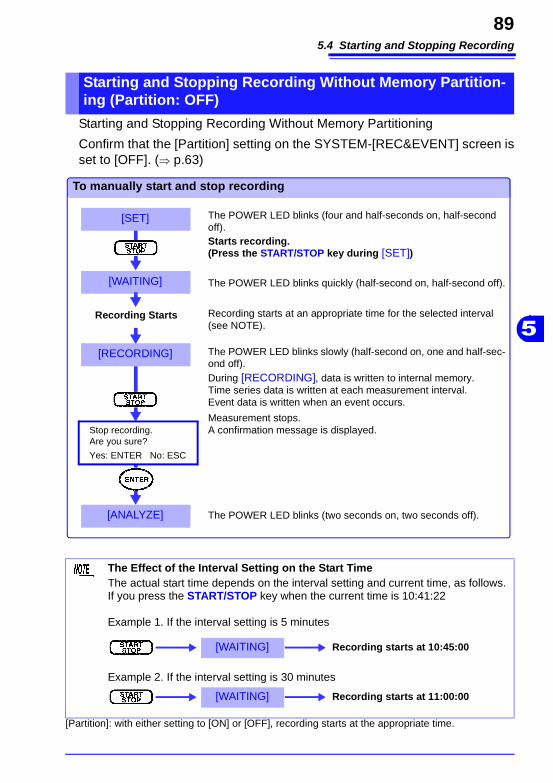
5.4 Starting and Stopping Recording
89
5
Starting and Stopping Recording Without Memory Partitioning
Confirm that the [Partition] setting on the SYSTEM-[REC&EVENT] screen is set to [OFF]. (⇒ p.63)
[Partition]: with either setting to [ON] or [OFF], recording starts at the appropriate time.
Starting and Stopping Recording Without Memory Partition-ing (Partition: OFF)
Measurement stops.A confirmation message is displayed.
[SET]
[WAITING]
[RECORDING]
[ANALYZE]
To manually start and stop recording
Recording Starts
Starts recording.(Press the START/STOP key during [SET])
The POWER LED blinks quickly (half-second on, half-second off).
Recording starts at an appropriate time for the selected interval (see NOTE).
The POWER LED blinks slowly (half-second on, one and half-sec-ond off).During [RECORDING], data is written to internal memory.Time series data is written at each measurement interval.Event data is written when an event occurs.
The POWER LED blinks (two seconds on, two seconds off).
Stop recording.Are you sure?
Yes: ENTER No: ESC
The POWER LED blinks (four and half-seconds on, half-second off).
The Effect of the Interval Setting on the Start TimeThe actual start time depends on the interval setting and current time, as follows.If you press the START/STOP key when the current time is 10:41:22
Example 1. If the interval setting is 5 minutes
Example 2. If the interval setting is 30 minutes
[WAITING] Recording starts at 10:45:00
[WAITING] Recording starts at 11:00:00
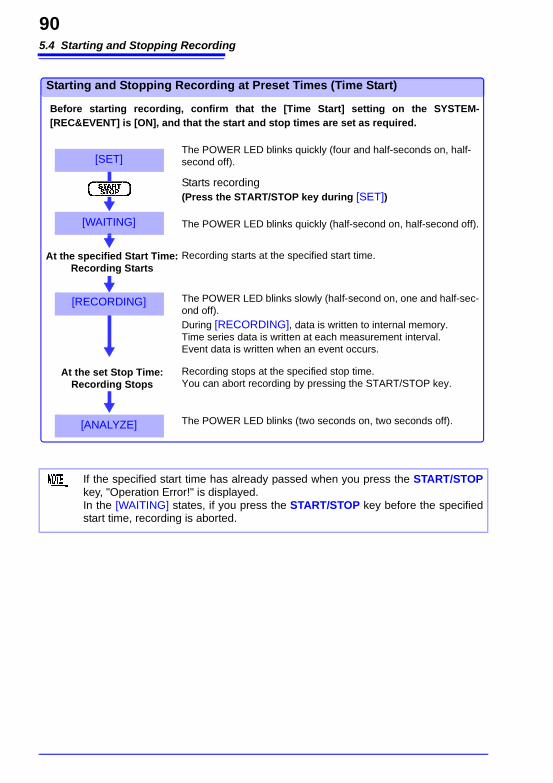
5.4 Starting and Stopping Recording
90
Recording stops at the specified stop time.You can abort recording by pressing the START/STOP key.
[SET]
[WAITING]
[RECORDING]
[ANALYZE]
Starting and Stopping Recording at Preset Times (Time Start)
At the specified Start Time: Recording Starts
Starts recording(Press the START/STOP key during [SET])
The POWER LED blinks quickly (half-second on, half-second off).
Recording starts at the specified start time.
The POWER LED blinks slowly (half-second on, one and half-sec-ond off).During [RECORDING], data is written to internal memory.Time series data is written at each measurement interval.Event data is written when an event occurs.
The POWER LED blinks (two seconds on, two seconds off).
Before starting recording, confirm that the [Time Start] setting on the SYSTEM-[REC&EVENT] is [ON], and that the start and stop times are set as required.
At the set Stop Time: Recording Stops
The POWER LED blinks quickly (four and half-seconds on, half-second off).
If the specified start time has already passed when you press the START/STOPkey, "Operation Error!" is displayed.In the [WAITING] states, if you press the START/STOP key before the specified start time, recording is aborted.
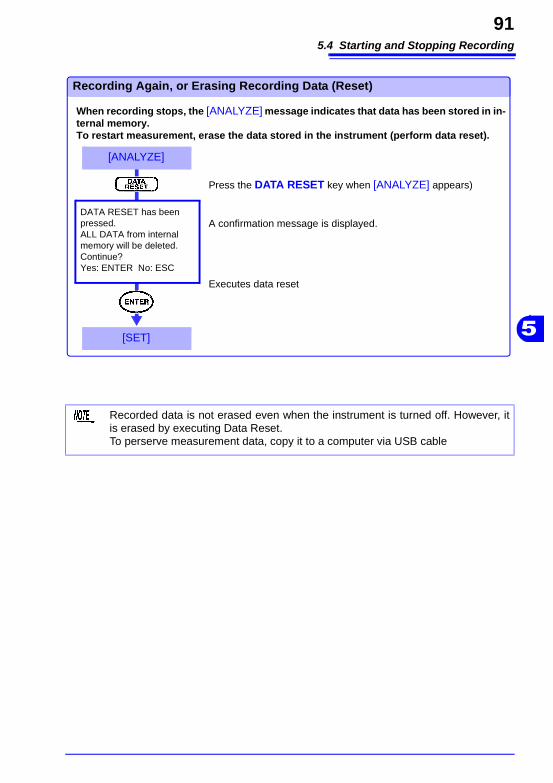
5.4 Starting and Stopping Recording
91
5
Press the DATA RESET key when [ANALYZE] appears)
A confirmation message is displayed.
Executes data reset
Recording Again, or Erasing Recording Data (Reset)
When recording stops, the [ANALYZE] message indicates that data has been stored in in-ternal memory.To restart measurement, erase the data stored in the instrument (perform data reset).
[ANALYZE]
[SET]
DATA RESET has been pressed.ALL DATA from internal memory will be deleted.Continue?Yes: ENTER No: ESC
Recorded data is not erased even when the instrument is turned off. However, it is erased by executing Data Reset.To perserve measurement data, copy it to a computer via USB cable
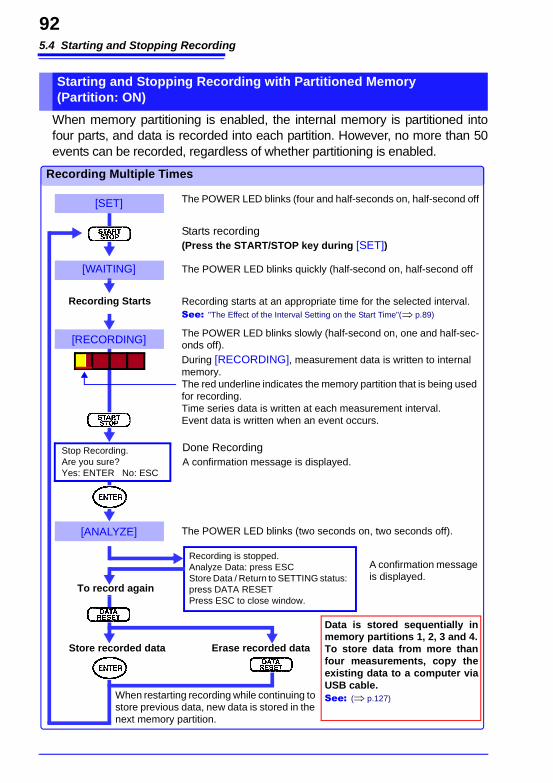
5.4 Starting and Stopping Recording
92
When memory partitioning is enabled, the internal memory is partitioned into four parts, and data is recorded into each partition. However, no more than 50 events can be recorded, regardless of whether partitioning is enabled.
Starting and Stopping Recording with Partitioned Memory (Partition: ON)
Done RecordingA confirmation message is displayed.
[SET]
[WAITING]
[RECORDING]
[ANALYZE]
Recording Multiple Times
Recording Starts
Starts recording(Press the START/STOP key during [SET])
The POWER LED blinks quickly (half-second on, half-second off
Recording starts at an appropriate time for the selected interval.See: "The Effect of the Interval Setting on the Start Time"(⇒ p.89)
The POWER LED blinks slowly (half-second on, one and half-sec-onds off).During [RECORDING], measurement data is written to internal memory.The red underline indicates the memory partition that is being used for recording.Time series data is written at each measurement interval.Event data is written when an event occurs.
The POWER LED blinks (two seconds on, two seconds off).
Store recorded data Erase recorded data
Data is stored sequentially in memory partitions 1, 2, 3 and 4.To store data from more than four measurements, copy the existing data to a computer via USB cable.See: (⇒ p.127)When restarting recording while continuing to
store previous data, new data is stored in the next memory partition.
The POWER LED blinks (four and half-seconds on, half-second off
Recording is stopped.Analyze Data: press ESCStore Data / Return to SETTING status: press DATA RESETPress ESC to close window.
To record again
A confirmation message is displayed.
Stop Recording.Are you sure?Yes: ENTER No: ESC
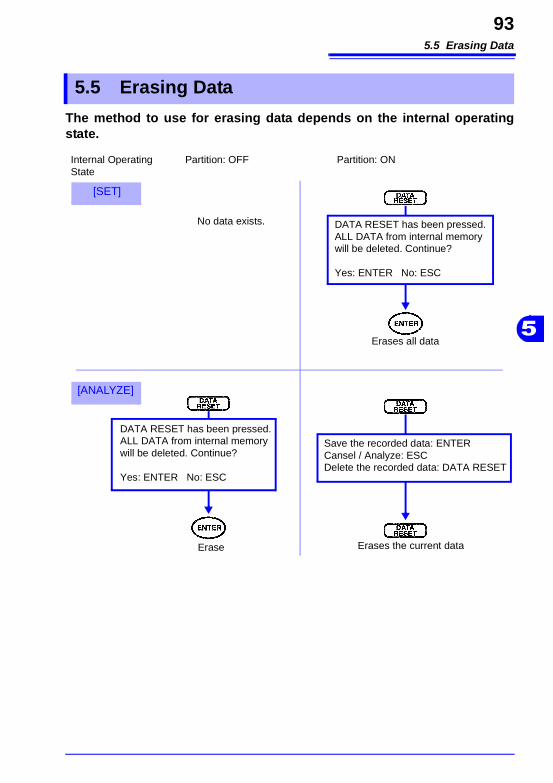
5.5 Erasing Data
93
5
The method to use for erasing data depends on the internal operating state.
5.5 Erasing Data
Internal Operating State
[SET]
[ANALYZE]
Partition: OFF Partition: ON
No data exists.
Erases all data
Erase
Save the recorded data: ENTERCansel / Analyze: ESCDelete the recorded data: DATA RESET
Erases the current data
DATA RESET has been pressed.ALL DATA from internal memory will be deleted. Continue?
Yes: ENTER No: ESC
DATA RESET has been pressed.ALL DATA from internal memory will be deleted. Continue?
Yes: ENTER No: ESC
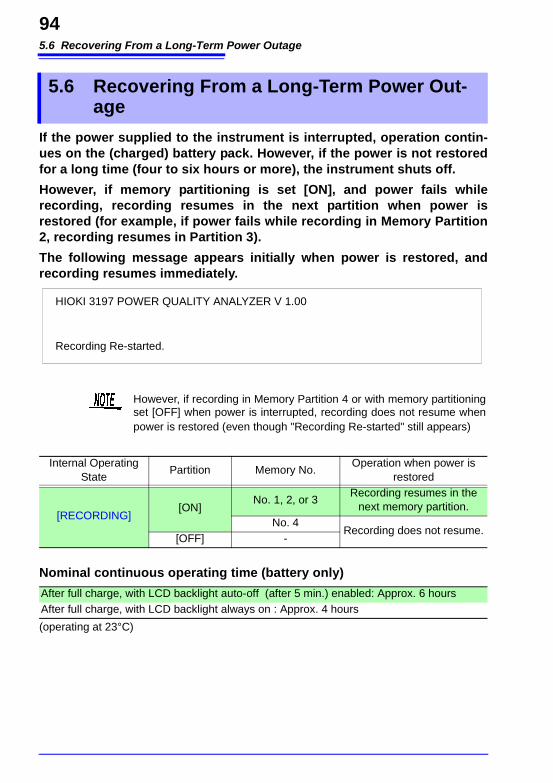
5.6 Recovering From a Long-Term Power Outage
94
If the power supplied to the instrument is interrupted, operation contin-ues on the (charged) battery pack. However, if the power is not restored for a long time (four to six hours or more), the instrument shuts off.
However, if memory partitioning is set [ON], and power fails while recording, recording resumes in the next partition when power is restored (for example, if power fails while recording in Memory Partition 2, recording resumes in Partition 3).
The following message appears initially when power is restored, and recording resumes immediately.
(operating at 23°C)
5.6 Recovering From a Long-Term Power Out-age
HIOKI 3197 POWER QUALITY ANALYZER V 1.00
Recording Re-started.
However, if recording in Memory Partition 4 or with memory partitioning set [OFF] when power is interrupted, recording does not resume when power is restored (even though "Recording Re-started" still appears)
Internal Operating State
Partition Memory No.Operation when power is
restored
[RECORDING][ON]
No. 1, 2, or 3Recording resumes in the
next memory partition.No. 4
Recording does not resume.[OFF] -
Nominal continuous operating time (battery only)
After full charge, with LCD backlight auto-off (after 5 min.) enabled: Approx. 6 hoursAfter full charge, with LCD backlight always on : Approx. 4 hours
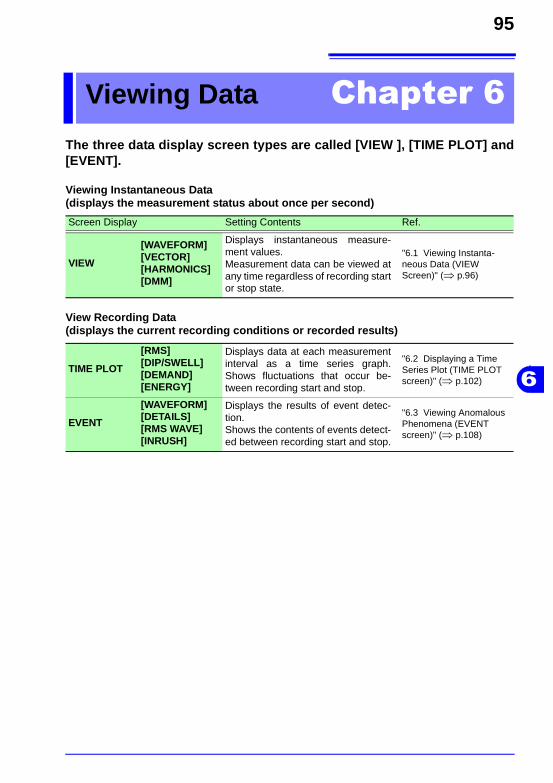
95
6
The three data display screen types are called [VIEW ], [TIME PLOT] and [EVENT].
Viewing Data Chapter 6
Viewing Instantaneous Data (displays the measurement status about once per second)
Screen Display Setting Contents Ref.
VIEW
[WAVEFORM][VECTOR][HARMONICS][DMM]
Displays instantaneous measure-ment values.Measurement data can be viewed at any time regardless of recording start or stop state.
"6.1 Viewing Instanta-neous Data (VIEW Screen)" (⇒ p.96)
View Recording Data (displays the current recording conditions or recorded results)
TIME PLOT
[RMS][DIP/SWELL][DEMAND][ENERGY]
Displays data at each measurement interval as a time series graph. Shows fluctuations that occur be-tween recording start and stop.
"6.2 Displaying a Time Series Plot (TIME PLOT screen)" (⇒ p.102)
EVENT
[WAVEFORM][DETAILS][RMS WAVE][INRUSH]
Displays the results of event detec-tion.Shows the contents of events detect-ed between recording start and stop.
"6.3 Viewing Anomalous Phenomena (EVENT screen)" (⇒ p.108)
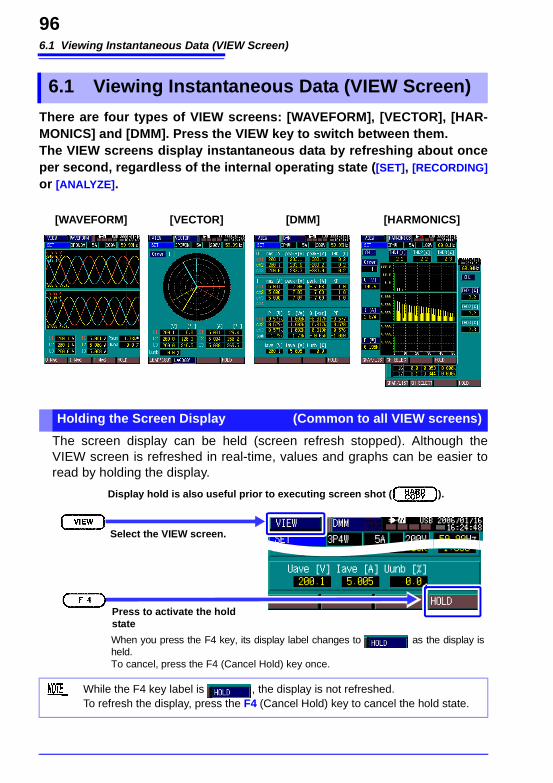
6.1 Viewing Instantaneous Data (VIEW Screen)
96
There are four types of VIEW screens: [WAVEFORM], [VECTOR], [HAR-MONICS] and [DMM]. Press the VIEW key to switch between them.The VIEW screens display instantaneous data by refreshing about once per second, regardless of the internal operating state ([SET], [RECORDING]
or [ANALYZE].
The screen display can be held (screen refresh stopped). Although the VIEW screen is refreshed in real-time, values and graphs can be easier to read by holding the display.
6.1 Viewing Instantaneous Data (VIEW Screen)
[WAVEFORM] [VECTOR] [DMM] [HARMONICS]
Holding the Screen Display (Common to all VIEW screens)
Select the VIEW screen.
Press to activate the hold state
When you press the F4 key, its display label changes to as the display is held.To cancel, press the F4 (Cancel Hold) key once.
Display hold is also useful prior to executing screen shot ( ).
While the F4 key label is , the display is not refreshed.To refresh the display, press the F4 (Cancel Hold) key to cancel the hold state.
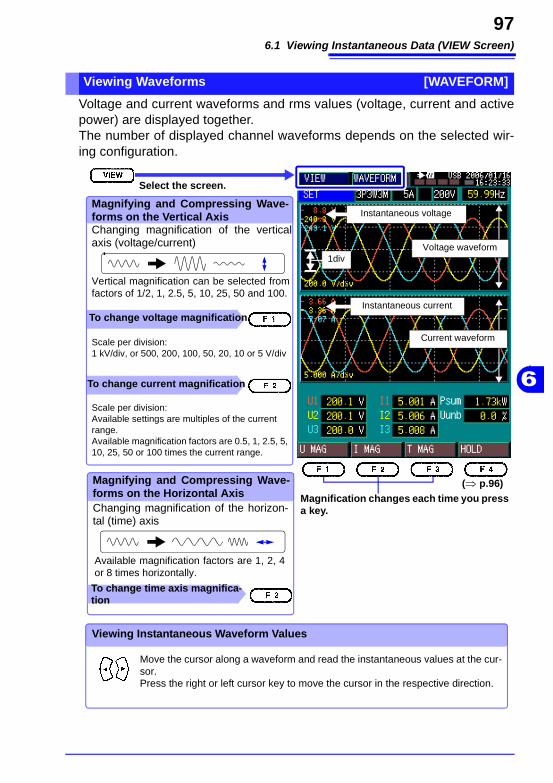
6.1 Viewing Instantaneous Data (VIEW Screen)
97
6
Voltage and current waveforms and rms values (voltage, current and active power) are displayed together. The number of displayed channel waveforms depends on the selected wir-ing configuration.
Viewing Waveforms [WAVEFORM]
Select the screen.
Scale per division:1 kV/div, or 500, 200, 100, 50, 20, 10 or 5 V/div
Changing magnification of the vertical axis (voltage/current)
Vertical magnification can be selected from factors of 1/2, 1, 2.5, 5, 10, 25, 50 and 100.
Magnification changes each time you press a key.
(⇒ p.96)
Instantaneous voltage
1div
Magnifying and Compressing Wave-forms on the Vertical Axis
Voltage waveform
Current waveform
Viewing Instantaneous Waveform Values
Move the cursor along a waveform and read the instantaneous values at the cur-sor.Press the right or left cursor key to move the cursor in the respective direction.
Magnifying and Compressing Wave-forms on the Horizontal Axis
To change time axis magnifica-tion
Available magnification factors are 1, 2, 4 or 8 times horizontally.
Changing magnification of the horizon-tal (time) axis
To change current magnification
To change voltage magnification
Scale per division:Available settings are multiples of the current range.Available magnification factors are 0.5, 1, 2.5, 5, 10, 25, 50 or 100 times the current range.
Instantaneous current
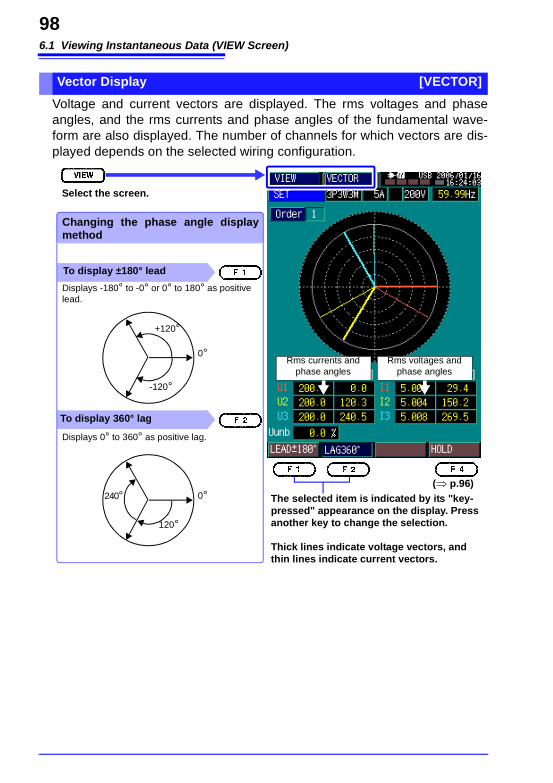
6.1 Viewing Instantaneous Data (VIEW Screen)
98
Voltage and current vectors are displayed. The rms voltages and phase angles, and the rms currents and phase angles of the fundamental wave-form are also displayed. The number of channels for which vectors are dis-played depends on the selected wiring configuration.
Vector Display [VECTOR]
Select the screen.
To display ±180° lead
Displays -180° to -0° or 0° to 180° as positive lead.
To display 360° lag
Displays 0° to 360° as positive lag.
The selected item is indicated by its "key-pressed" appearance on the display. Press another key to change the selection.
Thick lines indicate voltage vectors, and thin lines indicate current vectors.
(⇒ p.96)
Changing the phase angle display method
0°
+120°
-120°
0°
120°
240°
Rms voltages and phase angles
Rms currents and phase angles
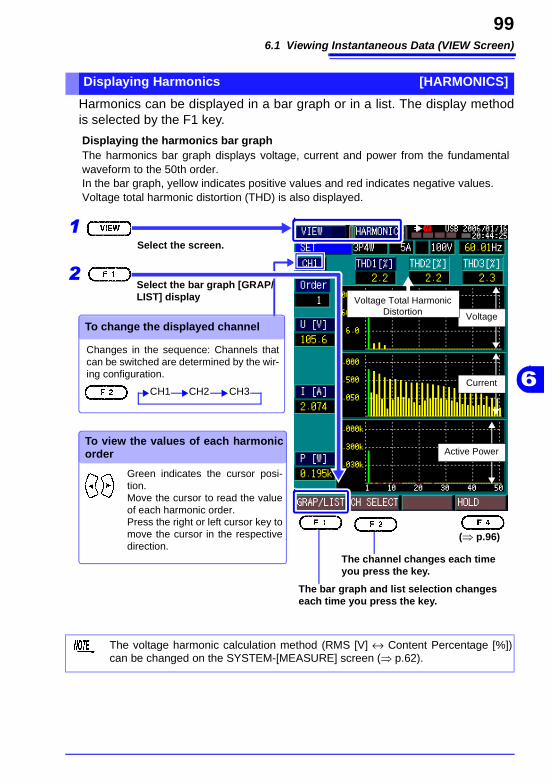
6.1 Viewing Instantaneous Data (VIEW Screen)
99
6
Harmonics can be displayed in a bar graph or in a list. The display method is selected by the F1 key.
Displaying Harmonics [HARMONICS]
Select the screen.
The bar graph and list selection changes each time you press the key.
(⇒ p.96)
Voltage
To view the values of each harmonic order
Green indicates the cursor posi-tion.Move the cursor to read the value of each harmonic order.Press the right or left cursor key to move the cursor in the respective direction.
Current
Active Power
Displaying the harmonics bar graphThe harmonics bar graph displays voltage, current and power from the fundamental waveform to the 50th order. In the bar graph, yellow indicates positive values and red indicates negative values. Voltage total harmonic distortion (THD) is also displayed.
Voltage Total Harmonic Distortion
Select the bar graph [GRAP/LIST] display
1
2
Changes in the sequence: Channels that can be switched are determined by the wir-ing configuration.
To change the displayed channel
The channel changes each time you press the key.
CH1 CH2 CH3
The voltage harmonic calculation method (RMS [V] ↔ Content Percentage [%]) can be changed on the SYSTEM-[MEASURE] screen (⇒ p.62).
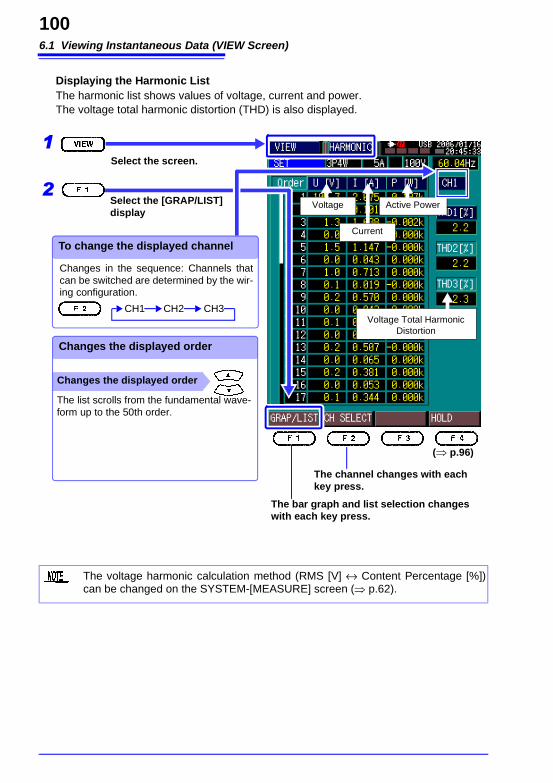
6.1 Viewing Instantaneous Data (VIEW Screen)
100
Changes the displayed order
Select the screen.
(⇒ p.96)
Voltage
Changes the displayed order
Active Power
Displaying the Harmonic ListThe harmonic list shows values of voltage, current and power. The voltage total harmonic distortion (THD) is also displayed.
Voltage Total Harmonic Distortion
Select the [GRAP/LIST] display
1
2
Current
The list scrolls from the fundamental wave-form up to the 50th order.
The bar graph and list selection changes with each key press.
The channel changes with each key press.
To change the displayed channel
Changes in the sequence: Channels that can be switched are determined by the wir-ing configuration.
CH1 CH2 CH3
The voltage harmonic calculation method (RMS [V] ↔ Content Percentage [%]) can be changed on the SYSTEM-[MEASURE] screen (⇒ p.62).
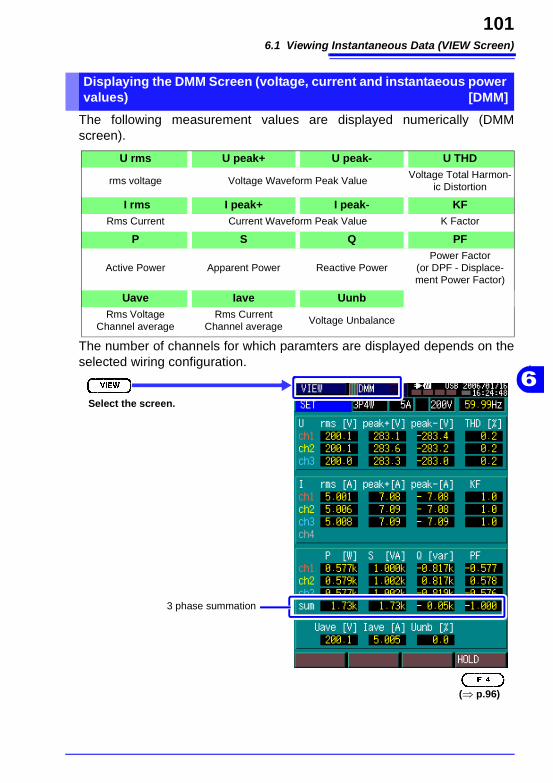
6.1 Viewing Instantaneous Data (VIEW Screen)
101
6
The following measurement values are displayed numerically (DMM screen).
The number of channels for which paramters are displayed depends on the selected wiring configuration.
Displaying the DMM Screen (voltage, current and instantaeous power values) [DMM]
U rms U peak+ U peak- U THD
rms voltage Voltage Waveform Peak ValueVoltage Total Harmon-
ic Distortion
I rms I peak+ I peak- KFRms Current Current Waveform Peak Value K Factor
P S Q PF
Active Power Apparent Power Reactive PowerPower Factor
(or DPF - Displace-ment Power Factor)
Uave Iave UunbRms Voltage
Channel averageRms Current
Channel averageVoltage Unbalance
Select the screen.
(⇒ p.96)
3 phase summation
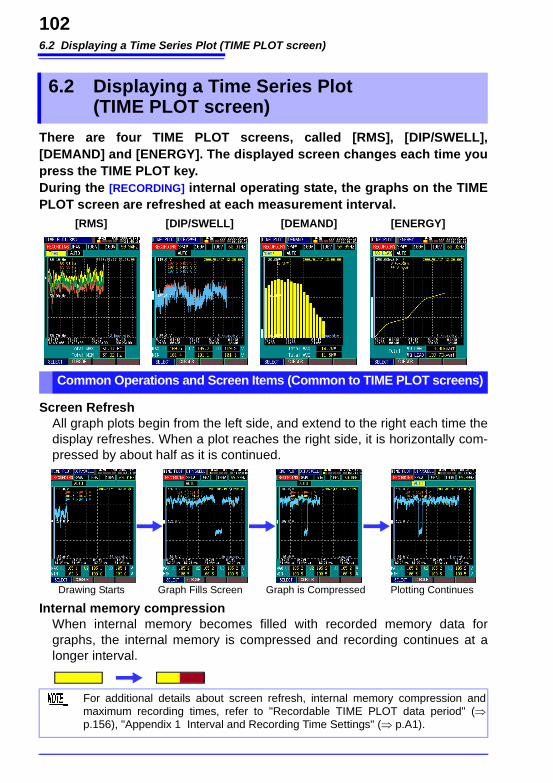
6.2 Displaying a Time Series Plot (TIME PLOT screen)
102
There are four TIME PLOT screens, called [RMS], [DIP/SWELL], [DEMAND] and [ENERGY]. The displayed screen changes each time you press the TIME PLOT key.During the [RECORDING] internal operating state, the graphs on the TIME PLOT screen are refreshed at each measurement interval.
Screen RefreshAll graph plots begin from the left side, and extend to the right each time the display refreshes. When a plot reaches the right side, it is horizontally com-pressed by about half as it is continued.
Internal memory compressionWhen internal memory becomes filled with recorded memory data for graphs, the internal memory is compressed and recording continues at a longer interval.
6.2 Displaying a Time Series Plot (TIME PLOT screen)
[RMS] [DIP/SWELL] [DEMAND] [ENERGY]
Common Operations and Screen Items (Common to TIME PLOT screens)
Drawing Starts Graph Fills Screen Graph is Compressed Plotting Continues
For additional details about screen refresh, internal memory compression and maximum recording times, refer to "Recordable TIME PLOT data period" (⇒p.156), "Appendix 1 Interval and Recording Time Settings" (⇒ p.A1).
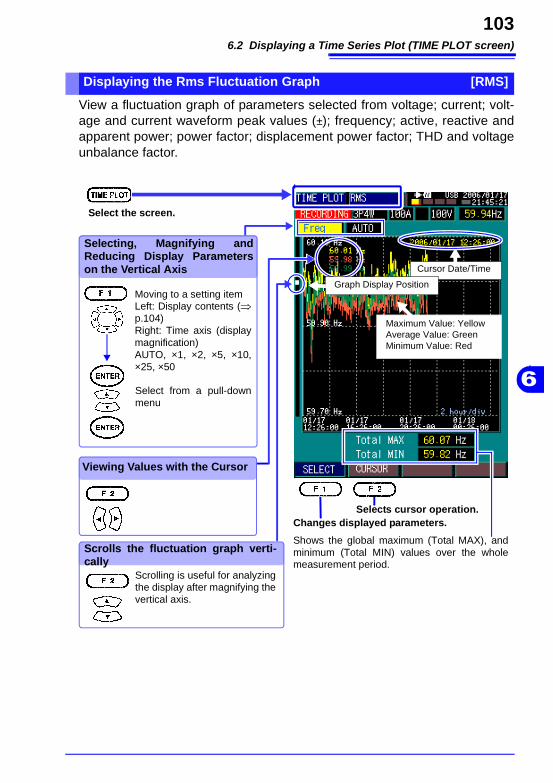
6.2 Displaying a Time Series Plot (TIME PLOT screen)
103
6
View a fluctuation graph of parameters selected from voltage; current; volt-age and current waveform peak values (±); frequency; active, reactive and apparent power; power factor; displacement power factor; THD and voltage unbalance factor.
Displaying the Rms Fluctuation Graph [RMS]
Select the screen.
Selects cursor operation.Changes displayed parameters.
Selecting, Magnifying and Reducing Display Parameters on the Vertical Axis
Graph Display PositionMoving to a setting itemLeft: Display contents (⇒p.104)Right: Time axis (display magnification)AUTO, ×1, ×2, ×5, ×10, ×25, ×50
Select from a pull-down menu
Shows the global maximum (Total MAX), and minimum (Total MIN) values over the whole measurement period.
Maximum Value: YellowAverage Value: GreenMinimum Value: Red
Viewing Values with the Cursor
Scrolls the fluctuation graph verti-cally
Cursor Date/Time
Scrolling is useful for analyzing the display after magnifying the vertical axis.
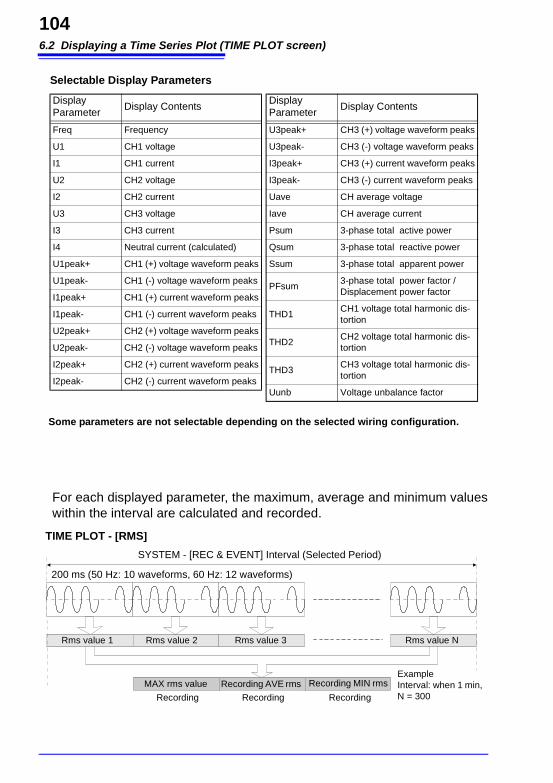
6.2 Displaying a Time Series Plot (TIME PLOT screen)
104
For each displayed parameter, the maximum, average and minimum values within the interval are calculated and recorded.
Selectable Display Parameters
Display Parameter
Display Contents
Freq Frequency
U1 CH1 voltage
I1 CH1 current
U2 CH2 voltage
I2 CH2 current
U3 CH3 voltage
I3 CH3 current
I4 Neutral current (calculated)
U1peak+ CH1 (+) voltage waveform peaks
U1peak- CH1 (-) voltage waveform peaks
I1peak+ CH1 (+) current waveform peaks
I1peak- CH1 (-) current waveform peaks
U2peak+ CH2 (+) voltage waveform peaks
U2peak- CH2 (-) voltage waveform peaks
I2peak+ CH2 (+) current waveform peaks
I2peak- CH2 (-) current waveform peaks
Display Parameter
Display Contents
U3peak+ CH3 (+) voltage waveform peaks
U3peak- CH3 (-) voltage waveform peaks
I3peak+ CH3 (+) current waveform peaks
I3peak- CH3 (-) current waveform peaks
Uave CH average voltage
Iave CH average current
Psum 3-phase total active power
Qsum 3-phase total reactive power
Ssum 3-phase total apparent power
PFsum3-phase total power factor / Displacement power factor
THD1CH1 voltage total harmonic dis-tortion
THD2CH2 voltage total harmonic dis-tortion
THD3CH3 voltage total harmonic dis-tortion
Uunb Voltage unbalance factor
Some parameters are not selectable depending on the selected wiring configuration.
SYSTEM - [REC & EVENT] Interval (Selected Period)
200 ms (50 Hz: 10 waveforms, 60 Hz: 12 waveforms)
Rms value 1 Rms value 2 Rms value 3 Rms value N
ExampleInterval: when 1 min, N = 300
MAX rms value Recording AVE rms Recording MIN rms
Recording Recording Recording
TIME PLOT - [RMS]
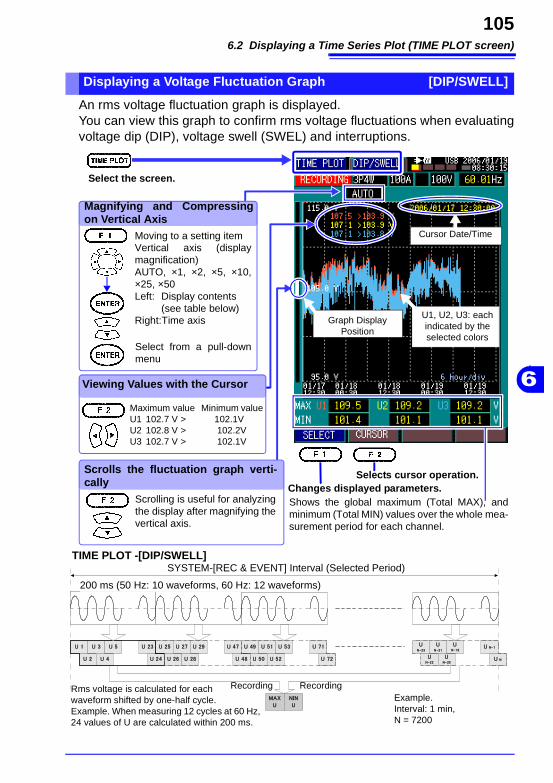
6.2 Displaying a Time Series Plot (TIME PLOT screen)
105
6
An rms voltage fluctuation graph is displayed. You can view this graph to confirm rms voltage fluctuations when evaluating voltage dip (DIP), voltage swell (SWEL) and interruptions.
Displaying a Voltage Fluctuation Graph [DIP/SWELL]
Select the screen.
Selects cursor operation.Changes displayed parameters.
Graph DisplayPosition
Shows the global maximum (Total MAX), and minimum (Total MIN) values over the whole mea-surement period for each channel.
U1, U2, U3: each indicated by the selected colors
Viewing Values with the Cursor
Scrolls the fluctuation graph verti-cally
Cursor Date/Time
Magnifying and Compressing on Vertical Axis
Moving to a setting itemVertical axis (display magnification)AUTO, ×1, ×2, ×5, ×10, ×25, ×50Left: Display contents
(see table below)Right:Time axis
Select from a pull-down menu
Maximum value Minimum valueU1 102.7 V > 102.1VU2 102.8 V > 102.2VU3 102.7 V > 102.1V
Scrolling is useful for analyzing the display after magnifying the vertical axis.
U 1
U 2
U 3
U 4
U 5 U 23
U 24
U 25
U 26
U 27
U 28
U 29 U 47
U 48
U 49
U 50
U 51
U 52
U 53 U 71
U 72
U N-1
U N
UN-23
UN-22
UN-21
UN-20
UN-19
MAXU
NINU
200 ms (50 Hz: 10 waveforms, 60 Hz: 12 waveforms)
Rms voltage is calculated for each waveform shifted by one-half cycle.Example. When measuring 12 cycles at 60 Hz, 24 values of U are calculated within 200 ms.
RecordingRecordingExample. Interval: 1 min, N = 7200
TIME PLOT -[DIP/SWELL]SYSTEM-[REC & EVENT] Interval (Selected Period)
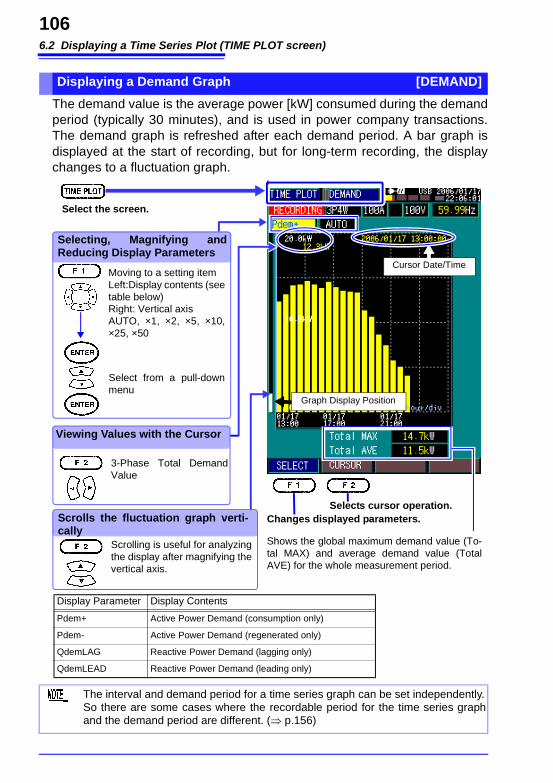
6.2 Displaying a Time Series Plot (TIME PLOT screen)
106
The demand value is the average power [kW] consumed during the demand period (typically 30 minutes), and is used in power company transactions. The demand graph is refreshed after each demand period. A bar graph is displayed at the start of recording, but for long-term recording, the display changes to a fluctuation graph.
Displaying a Demand Graph [DEMAND]
Select the screen.
Selects cursor operation.Changes displayed parameters.
Selecting, Magnifying and Reducing Display Parameters
Moving to a setting itemLeft:Display contents (see table below)Right: Vertical axisAUTO, ×1, ×2, ×5, ×10, ×25, ×50
Select from a pull-down menu
Display Parameter Display Contents
Pdem+ Active Power Demand (consumption only)
Pdem- Active Power Demand (regenerated only)
QdemLAG Reactive Power Demand (lagging only)
QdemLEAD Reactive Power Demand (leading only)
Shows the global maximum demand value (To-tal MAX) and average demand value (Total AVE) for the whole measurement period.
Viewing Values with the Cursor
Scrolls the fluctuation graph verti-cally
Cursor Date/Time
3-Phase Total Demand Value
Graph Display Position
Scrolling is useful for analyzing the display after magnifying the vertical axis.
The interval and demand period for a time series graph can be set independently.So there are some cases where the recordable period for the time series graph and the demand period are different. (⇒ p.156)
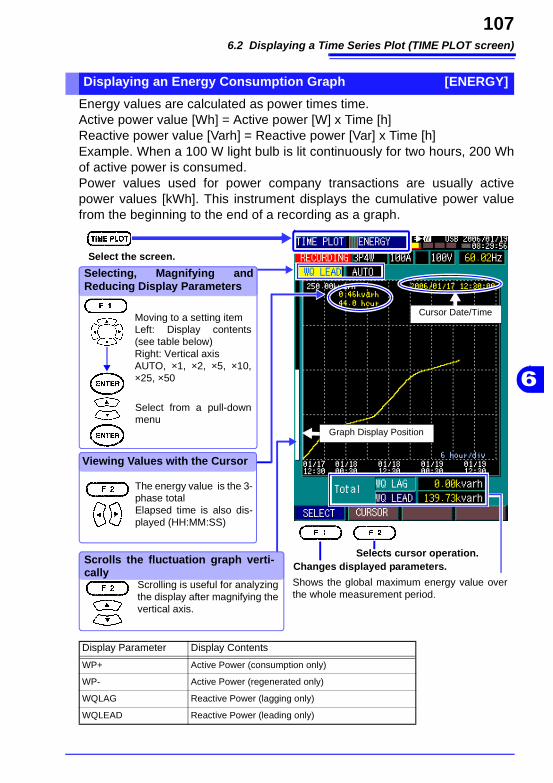
6.2 Displaying a Time Series Plot (TIME PLOT screen)
107
6
Energy values are calculated as power times time.Active power value [Wh] = Active power [W] x Time [h]Reactive power value [Varh] = Reactive power [Var] x Time [h]Example. When a 100 W light bulb is lit continuously for two hours, 200 Wh of active power is consumed.Power values used for power company transactions are usually active power values [kWh]. This instrument displays the cumulative power value from the beginning to the end of a recording as a graph.
Displaying an Energy Consumption Graph [ENERGY]
Select the screen.
Selects cursor operation.Changes displayed parameters.
Selecting, Magnifying and Reducing Display Parameters
Graph Display Position
Moving to a setting itemLeft: Display contents (see table below)Right: Vertical axisAUTO, ×1, ×2, ×5, ×10, ×25, ×50
Select from a pull-down menu
Display Parameter Display Contents
WP+ Active Power (consumption only)
WP- Active Power (regenerated only)
WQLAG Reactive Power (lagging only)
WQLEAD Reactive Power (leading only)
Shows the global maximum energy value over the whole measurement period.
Viewing Values with the Cursor
Scrolls the fluctuation graph verti-cally
Cursor Date/Time
The energy value is the 3-phase totalElapsed time is also dis-played (HH:MM:SS)
Scrolling is useful for analyzing the display after magnifying the vertical axis.
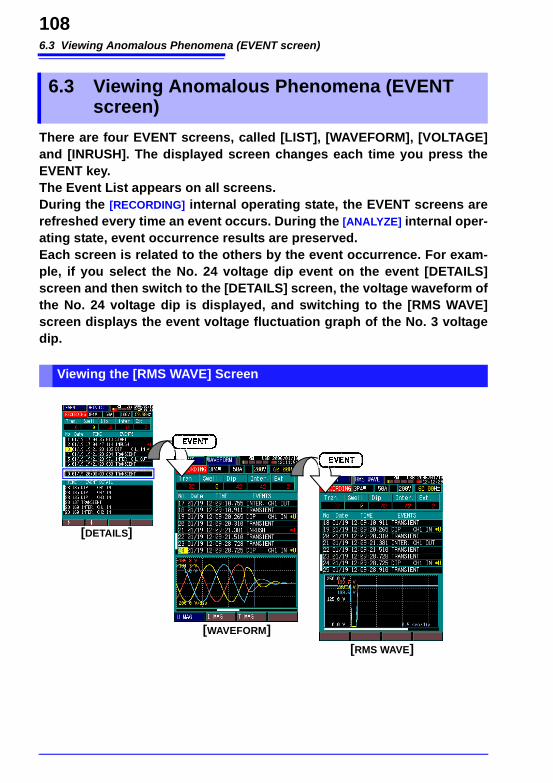
6.3 Viewing Anomalous Phenomena (EVENT screen)
108
There are four EVENT screens, called [LIST], [WAVEFORM], [VOLTAGE] and [INRUSH]. The displayed screen changes each time you press the EVENT key.The Event List appears on all screens.During the [RECORDING] internal operating state, the EVENT screens are refreshed every time an event occurs. During the [ANALYZE] internal oper-ating state, event occurrence results are preserved. Each screen is related to the others by the event occurrence. For exam-ple, if you select the No. 24 voltage dip event on the event [DETAILS] screen and then switch to the [DETAILS] screen, the voltage waveform of the No. 24 voltage dip is displayed, and switching to the [RMS WAVE] screen displays the event voltage fluctuation graph of the No. 3 voltage dip.
6.3 Viewing Anomalous Phenomena (EVENT screen)
Viewing the [RMS WAVE] Screen
[DETAILS]
[WAVEFORM][RMS WAVE]
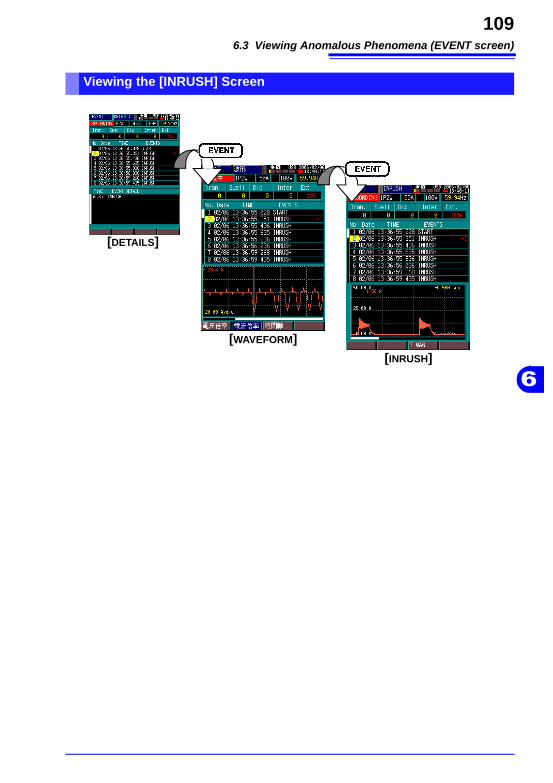
6.3 Viewing Anomalous Phenomena (EVENT screen)
109
6
Viewing the [INRUSH] Screen
[DETAILS]
[WAVEFORM][INRUSH]
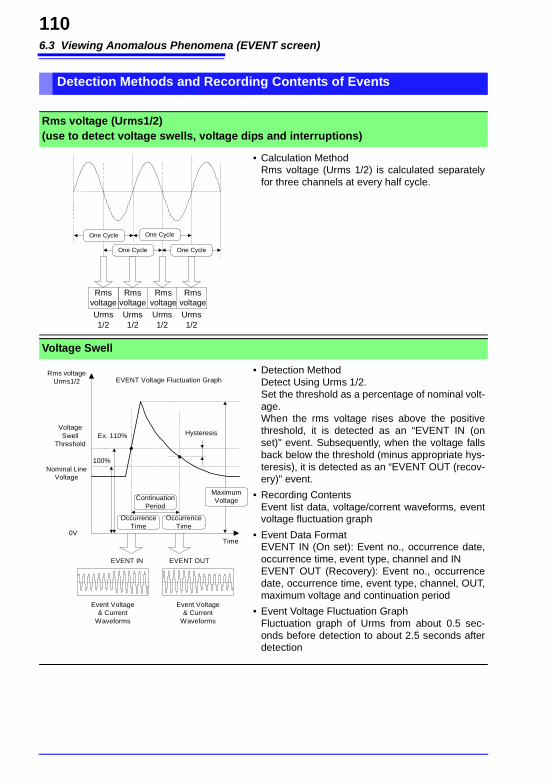
6.3 Viewing Anomalous Phenomena (EVENT screen)
110
Detection Methods and Recording Contents of Events
Rms voltage (Urms1/2) (use to detect voltage swells, voltage dips and interruptions)
• Calculation Method Rms voltage (Urms 1/2) is calculated separately for three channels at every half cycle.
One Cycle
Rmsvoltage
Rmsvoltage
Rmsvoltage
Rmsvoltage
Urms1/2
Urms1/2
Urms1/2
Urms1/2
One Cycle
One Cycle One Cycle
Voltage Swell
• Detection Method Detect Using Urms 1/2. Set the threshold as a percentage of nominal volt-age. When the rms voltage rises above the positive threshold, it is detected as an “EVENT IN (on set)" event. Subsequently, when the voltage falls back below the threshold (minus appropriate hys-teresis), it is detected as an “EVENT OUT (recov-ery)" event.
• Recording Contents Event list data, voltage/corrent waveforms, event voltage fluctuation graph
• Event Data Format EVENT IN (On set): Event no., occurrence date, occurrence time, event type, channel and IN EVENT OUT (Recovery): Event no., occurrence date, occurrence time, event type, channel, OUT, maximum voltage and continuation period
• Event Voltage Fluctuation Graph Fluctuation graph of Urms from about 0.5 sec-onds before detection to about 2.5 seconds after detection
Nominal LineVoltage
VoltageSwell
Threshold
ContinuationPeriod
MaximumVoltage
Time
Rms voltageUrms1/2
0V
Hysteresis
100%
Ex. 110%
EVENT IN EVENT OUT
OccurrenceTime
OccurrenceTime
Event Voltage& Current
Waveforms
Event Voltage& Current
Waveforms
EVENT Voltage Fluctuation Graph
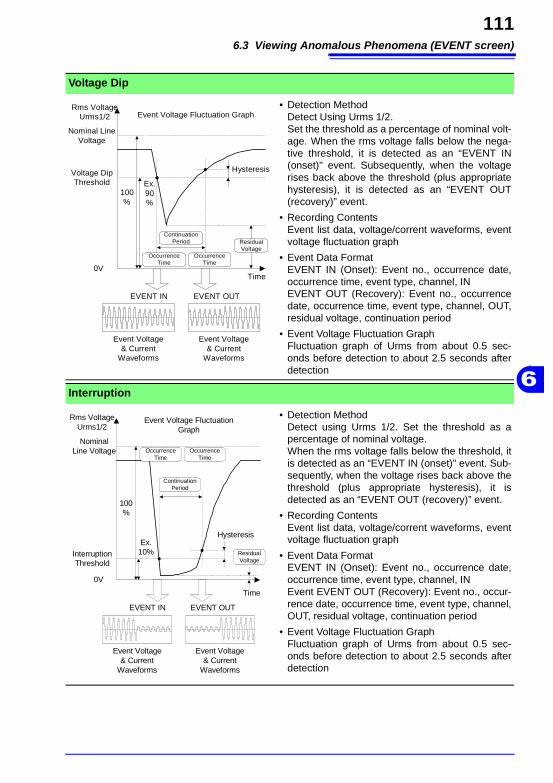
6.3 Viewing Anomalous Phenomena (EVENT screen)
111
6
Voltage Dip
• Detection Method Detect Using Urms 1/2. Set the threshold as a percentage of nominal volt-age. When the rms voltage falls below the nega-tive threshold, it is detected as an “EVENT IN (onset)" event. Subsequently, when the voltage rises back above the threshold (plus appropriate hysteresis), it is detected as an “EVENT OUT (recovery)” event.
• Recording Contents Event list data, voltage/corrent waveforms, event voltage fluctuation graph
• Event Data Format EVENT IN (Onset): Event no., occurrence date, occurrence time, event type, channel, IN EVENT OUT (Recovery): Event no., occurrence date, occurrence time, event type, channel, OUT, residual voltage, continuation period
• Event Voltage Fluctuation Graph Fluctuation graph of Urms from about 0.5 sec-onds before detection to about 2.5 seconds after detection
Nominal LineVoltage
Voltage DipThreshold
ContinuationPeriod Residual
Voltage
Time
Rms VoltageUrms1/2
0V
Hysteresis
100%
Ex.90%
EVENT IN EVENT OUT
OccurrenceTime
OccurrenceTime
Event Voltage& Current
Waveforms
Event Voltage& Current
Waveforms
Event Voltage Fluctuation Graph
Interruption
• Detection Method Detect using Urms 1/2. Set the threshold as a percentage of nominal voltage. When the rms voltage falls below the threshold, it is detected as an “EVENT IN (onset)" event. Sub-sequently, when the voltage rises back above the threshold (plus appropriate hysteresis), it is detected as an “EVENT OUT (recovery)” event.
• Recording Contents Event list data, voltage/corrent waveforms, event voltage fluctuation graph
• Event Data Format EVENT IN (Onset): Event no., occurrence date, occurrence time, event type, channel, IN Event EVENT OUT (Recovery): Event no., occur-rence date, occurrence time, event type, channel, OUT, residual voltage, continuation period
• Event Voltage Fluctuation Graph Fluctuation graph of Urms from about 0.5 sec-onds before detection to about 2.5 seconds after detection
NominalLine Voltage
InterruptionThreshold
ContinuationPeriod
ResidualVoltage
Time
Rms VoltageUrms1/2
0V
Hysteresis
100%
Ex.10%
EVENT IN EVENT OUT
OccurrenceTime
OccurrenceTime
Event Voltage& Current
Waveforms
Event Voltage& Current
Waveforms
Event Voltage FluctuationGraph
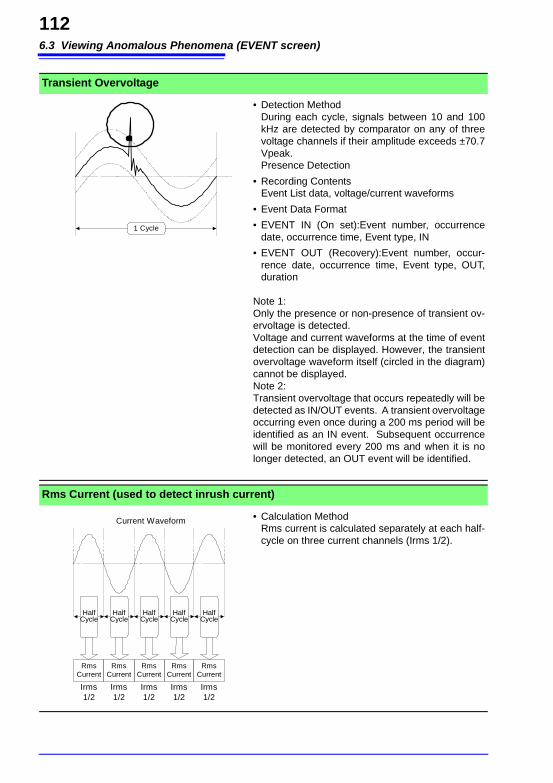
6.3 Viewing Anomalous Phenomena (EVENT screen)
112
Transient Overvoltage
• Detection Method During each cycle, signals between 10 and 100 kHz are detected by comparator on any of three voltage channels if their amplitude exceeds ±70.7 Vpeak. Presence Detection
• Recording Contents Event List data, voltage/current waveforms
• Event Data Format
• EVENT IN (On set):Event number, occurrence date, occurrence time, Event type, IN
• EVENT OUT (Recovery):Event number, occur-rence date, occurrence time, Event type, OUT, duration
Note 1: Only the presence or non-presence of transient ov-ervoltage is detected.Voltage and current waveforms at the time of event detection can be displayed. However, the transient overvoltage waveform itself (circled in the diagram) cannot be displayed.Note 2: Transient overvoltage that occurs repeatedly will be detected as IN/OUT events. A transient overvoltage occurring even once during a 200 ms period will be identified as an IN event. Subsequent occurrence will be monitored every 200 ms and when it is no longer detected, an OUT event will be identified.
1 Cycle
Rms Current (used to detect inrush current)
• Calculation Method Rms current is calculated separately at each half-cycle on three current channels (Irms 1/2).
HalfCycle
RmsCurrent
RmsCurrent
HalfCycle
HalfCycle
HalfCycle
HalfCycle
RmsCurrent
RmsCurrent
RmsCurrent
Irms1/2
Irms1/2
Irms1/2
Irms1/2
Irms1/2
Current Waveform
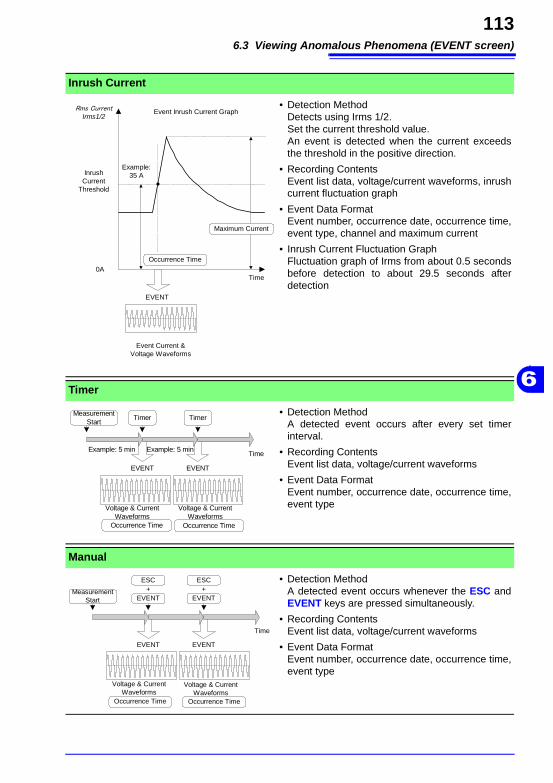
6.3 Viewing Anomalous Phenomena (EVENT screen)
113
6
Inrush Current
• Detection Method Detects using Irms 1/2. Set the current threshold value. An event is detected when the current exceeds the threshold in the positive direction.
• Recording Contents Event list data, voltage/current waveforms, inrush current fluctuation graph
• Event Data Format Event number, occurrence date, occurrence time, event type, channel and maximum current
• Inrush Current Fluctuation Graph Fluctuation graph of Irms from about 0.5 seconds before detection to about 29.5 seconds after detection
InrushCurrent
Threshold
Maximum Current
Time
Rms CurrentIrms1/2
0A
Example:35 A
EVENT
Occurrence Time
Event Current &Voltage Waveforms
Event Inrush Current Graph
Timer
• Detection Method A detected event occurs after every set timer interval.
• Recording Contents Event list data, voltage/current waveforms
• Event Data Format Event number, occurrence date, occurrence time, event type
Time
EVENT
Occurrence Time
MeasurementStart
Voltage & CurrentWaveforms
EVENT
Voltage & CurrentWaveforms
Timer Timer
Example: 5 min Example: 5 min
Occurrence Time
Manual
• Detection Method A detected event occurs whenever the ESC and EVENT keys are pressed simultaneously.
• Recording Contents Event list data, voltage/current waveforms
• Event Data Format Event number, occurrence date, occurrence time, event type
Time
EVENT
Occurrence Time
MeasurementStart
Voltage & CurrentWaveforms
EVENT
Voltage & CurrentWaveforms
ESC
EVENT+
ESC
EVENT+
Occurrence Time
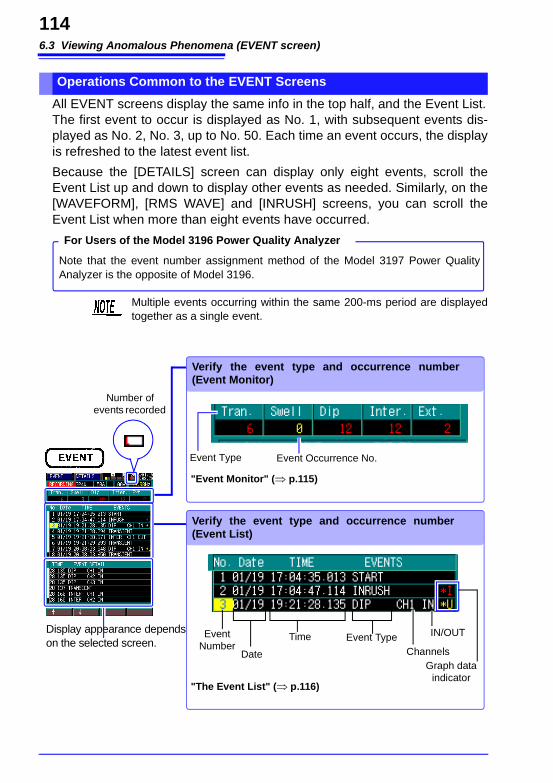
6.3 Viewing Anomalous Phenomena (EVENT screen)
114
All EVENT screens display the same info in the top half, and the Event List. The first event to occur is displayed as No. 1, with subsequent events dis-played as No. 2, No. 3, up to No. 50. Each time an event occurs, the display is refreshed to the latest event list.
Because the [DETAILS] screen can display only eight events, scroll the Event List up and down to display other events as needed. Similarly, on the [WAVEFORM], [RMS WAVE] and [INRUSH] screens, you can scroll the Event List when more than eight events have occurred.
Operations Common to the EVENT Screens
Note that the event number assignment method of the Model 3197 Power Quality Analyzer is the opposite of Model 3196.
For Users of the Model 3196 Power Quality Analyzer
Multiple events occurring within the same 200-ms period are displayed together as a single event.
Event Number
Event Type
Date Channels
IN/OUTTimeDisplay appearance depends on the selected screen.
Verify the event type and occurrence number (Event Monitor)
Event Type Event Occurrence No.
Verify the event type and occurrence number (Event List)
"The Event List" (⇒ p.116)
"Event Monitor" (⇒ p.115)
Number of events recorded
Graph data indicator
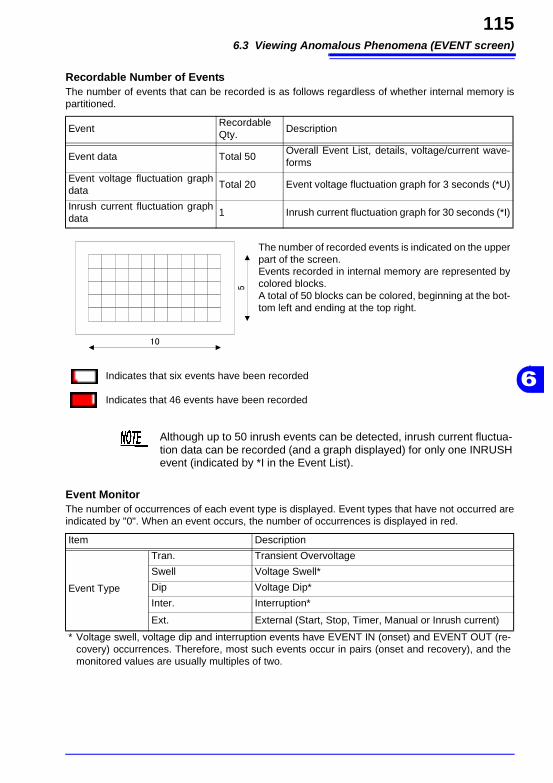
6.3 Viewing Anomalous Phenomena (EVENT screen)
115
6
Recordable Number of EventsThe number of events that can be recorded is as follows regardless of whether internal memory is partitioned.
EventRecordable Qty.
Description
Event data Total 50Overall Event List, details, voltage/current wave-forms
Event voltage fluctuation graph data
Total 20 Event voltage fluctuation graph for 3 seconds (*U)
Inrush current fluctuation graph data
1 Inrush current fluctuation graph for 30 seconds (*I)
The number of recorded events is indicated on the upper part of the screen.Events recorded in internal memory are represented by colored blocks.A total of 50 blocks can be colored, beginning at the bot-tom left and ending at the top right.
Indicates that six events have been recorded
Indicates that 46 events have been recorded
10
5
Although up to 50 inrush events can be detected, inrush current fluctua-tion data can be recorded (and a graph displayed) for only one INRUSH event (indicated by *I in the Event List).
Event MonitorThe number of occurrences of each event type is displayed. Event types that have not occurred are indicated by "0". When an event occurs, the number of occurrences is displayed in red.
Item Description
Event Type
Tran. Transient Overvoltage
Swell Voltage Swell*
Dip Voltage Dip*
Inter. Interruption*
Ext. External (Start, Stop, Timer, Manual or Inrush current)
* Voltage swell, voltage dip and interruption events have EVENT IN (onset) and EVENT OUT (re-covery) occurrences. Therefore, most such events occur in pairs (onset and recovery), and the monitored values are usually multiples of two.
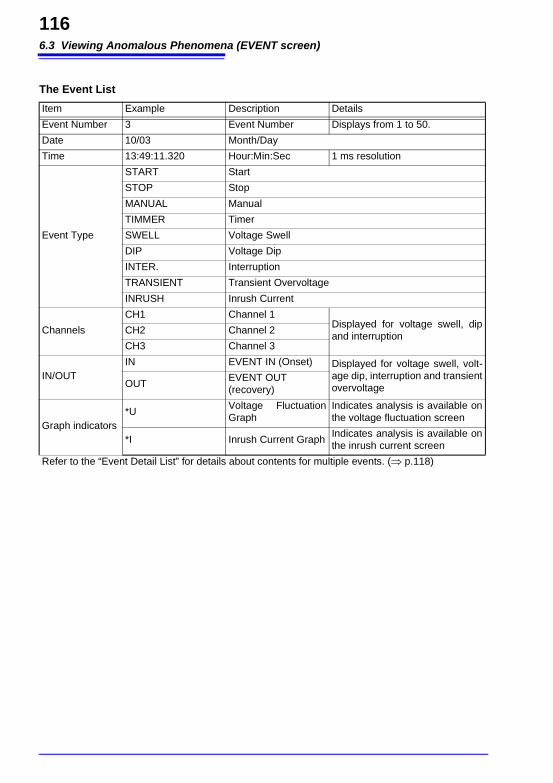
6.3 Viewing Anomalous Phenomena (EVENT screen)
116
The Event List
Item Example Description Details
Event Number 3 Event Number Displays from 1 to 50.
Date 10/03 Month/Day
Time 13:49:11.320 Hour:Min:Sec 1 ms resolution
Event Type
START Start
STOP Stop
MANUAL Manual
TIMMER Timer
SWELL Voltage Swell
DIP Voltage Dip
INTER. Interruption
TRANSIENT Transient Overvoltage
INRUSH Inrush Current
Channels
CH1 Channel 1Displayed for voltage swell, dip and interruption
CH2 Channel 2
CH3 Channel 3
IN/OUTIN EVENT IN (Onset) Displayed for voltage swell, volt-
age dip, interruption and transient overvoltageOUT
EVENT OUT (recovery)
Graph indicators*U
Voltage Fluctuation Graph
Indicates analysis is available on the voltage fluctuation screen
*I Inrush Current GraphIndicates analysis is available on the inrush current screen
Refer to the “Event Detail List” for details about contents for multiple events. (⇒ p.118)
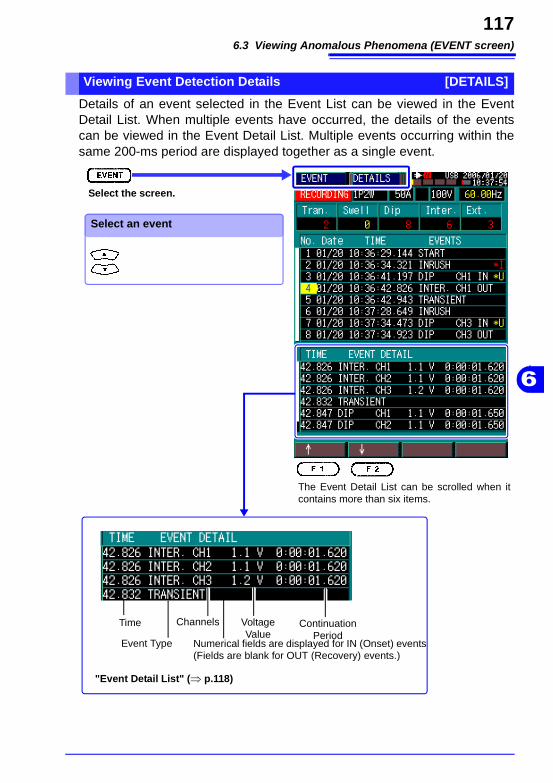
6.3 Viewing Anomalous Phenomena (EVENT screen)
117
6
Details of an event selected in the Event List can be viewed in the Event Detail List. When multiple events have occurred, the details of the events can be viewed in the Event Detail List. Multiple events occurring within the same 200-ms period are displayed together as a single event.
Viewing Event Detection Details [DETAILS]
Select the screen.
Event Type
Channels
Numerical fields are displayed for IN (Onset) events(Fields are blank for OUT (Recovery) events.)
Time Voltage Value
Continuation Period
The Event Detail List can be scrolled when it contains more than six items.
"Event Detail List" (⇒ p.118)
Select an event
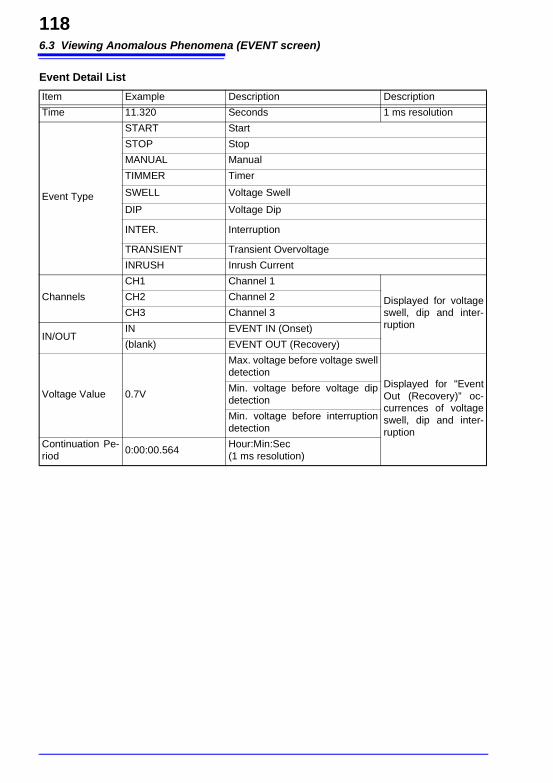
6.3 Viewing Anomalous Phenomena (EVENT screen)
118
Event Detail List
Item Example Description Description
Time 11.320 Seconds 1 ms resolution
Event Type
START Start
STOP Stop
MANUAL Manual
TIMMER Timer
SWELL Voltage Swell
DIP Voltage Dip
INTER. Interruption
TRANSIENT Transient Overvoltage
INRUSH Inrush Current
Channels
CH1 Channel 1
Displayed for voltage swell, dip and inter-ruption
CH2 Channel 2
CH3 Channel 3
IN/OUTIN EVENT IN (Onset)
(blank) EVENT OUT (Recovery)
Voltage Value 0.7V
Max. voltage before voltage swell detection
Displayed for "Event Out (Recovery)” oc-currences of voltage swell, dip and inter-ruption
Min. voltage before voltage dip detection
Min. voltage before interruption detection
Continuation Pe-riod
0:00:00.564Hour:Min:Sec (1 ms resolution)
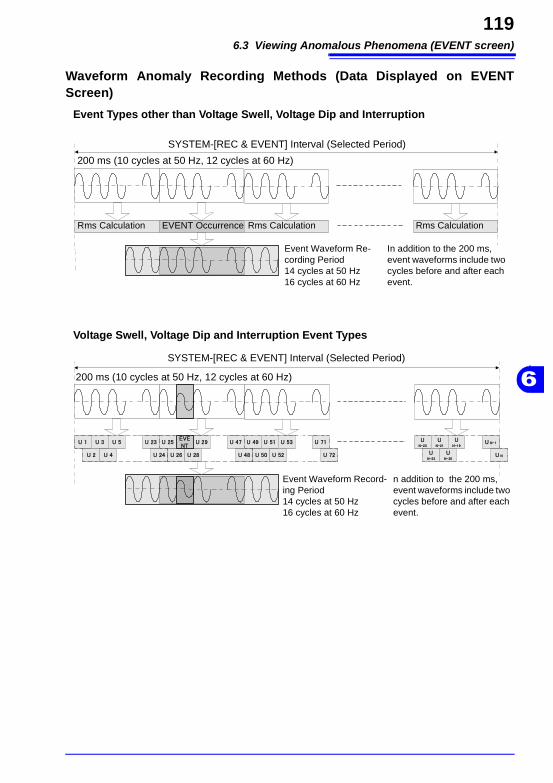
6.3 Viewing Anomalous Phenomena (EVENT screen)
119
6
Waveform Anomaly Recording Methods (Data Displayed on EVENT Screen)
Rms Calculation Rms Calculation Rms CalculationEVENT Occurrence
Event Waveform Re-cording Period14 cycles at 50 Hz16 cycles at 60 Hz
In addition to the 200 ms, event waveforms include two cycles before and after each event.
200 ms (10 cycles at 50 Hz, 12 cycles at 60 Hz)
Event Types other than Voltage Swell, Voltage Dip and Interruption
SYSTEM-[REC & EVENT] Interval (Selected Period)
U 1
U 2
U 3
U 4
U 5 U 23
U 24
U 25
U 26 U 28
U 29 U 47
U 48
U 49
U 50
U 51
U 52
U 53 U 71
U 72
U N-1
U N
UN-23
UN-22
UN-21
UN-20
UN-19
EVENT
200 ms (10 cycles at 50 Hz, 12 cycles at 60 Hz)
Event Waveform Record-ing Period14 cycles at 50 Hz16 cycles at 60 Hz
n addition to the 200 ms, event waveforms include two cycles before and after each event.
Voltage Swell, Voltage Dip and Interruption Event Types
SYSTEM-[REC & EVENT] Interval (Selected Period)
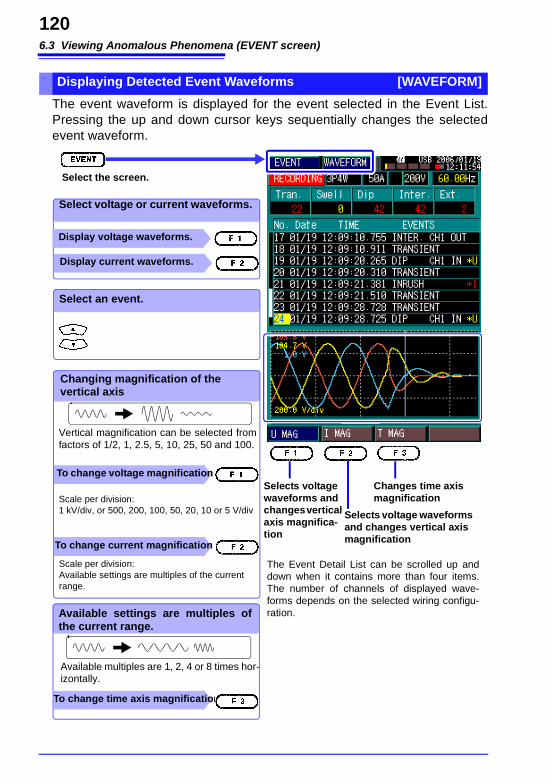
6.3 Viewing Anomalous Phenomena (EVENT screen)
120
The event waveform is displayed for the event selected in the Event List. Pressing the up and down cursor keys sequentially changes the selected event waveform.
「」 Displaying Detected Event Waveforms [WAVEFORM]
Select the screen.
The Event Detail List can be scrolled up and down when it contains more than four items. The number of channels of displayed wave-forms depends on the selected wiring configu-ration.
Scale per division:1 kV/div, or 500, 200, 100, 50, 20, 10 or 5 V/div
Vertical magnification can be selected from factors of 1/2, 1, 2.5, 5, 10, 25, 50 and 100.
To change time axis magnification
Available multiples are 1, 2, 4 or 8 times hor-izontally.
Changing magnification of the vertical axis
To change current magnification
Scale per division:Available settings are multiples of the current range.
Selects voltage waveforms and changes vertical axis magnifica-tion
Select an event.
Select voltage or current waveforms.
Display voltage waveforms.
Display current waveforms.
Available settings are multiples of the current range.
Selects voltage waveforms and changes vertical axis magnification
Changes time axis magnification
To change voltage magnification
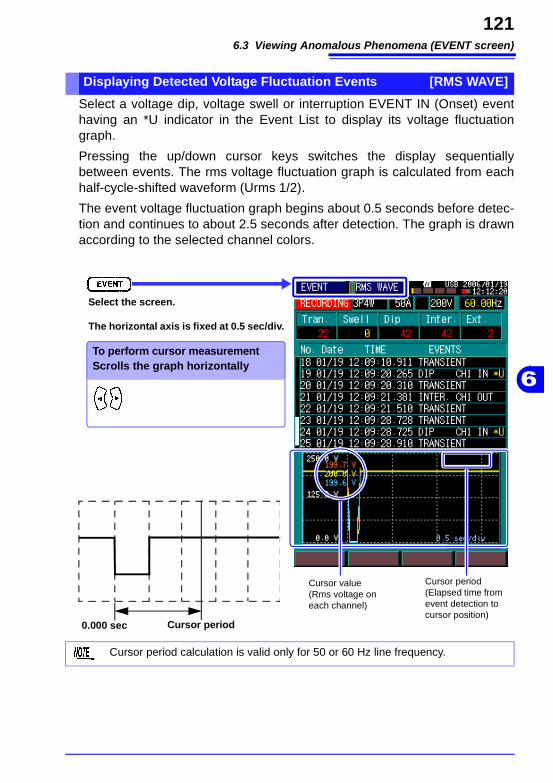
6.3 Viewing Anomalous Phenomena (EVENT screen)
121
6
Select a voltage dip, voltage swell or interruption EVENT IN (Onset) event having an *U indicator in the Event List to display its voltage fluctuation graph.
Pressing the up/down cursor keys switches the display sequentially between events. The rms voltage fluctuation graph is calculated from each half-cycle-shifted waveform (Urms 1/2).
The event voltage fluctuation graph begins about 0.5 seconds before detec-tion and continues to about 2.5 seconds after detection. The graph is drawn according to the selected channel colors.
Displaying Detected Voltage Fluctuation Events [RMS WAVE]
Select the screen.
The horizontal axis is fixed at 0.5 sec/div.
To perform cursor measurementScrolls the graph horizontally
Cursor value(Rms voltage on each channel)
Cursor period(Elapsed time from event detection to cursor position)
0.000 sec Cursor period
Cursor period calculation is valid only for 50 or 60 Hz line frequency.
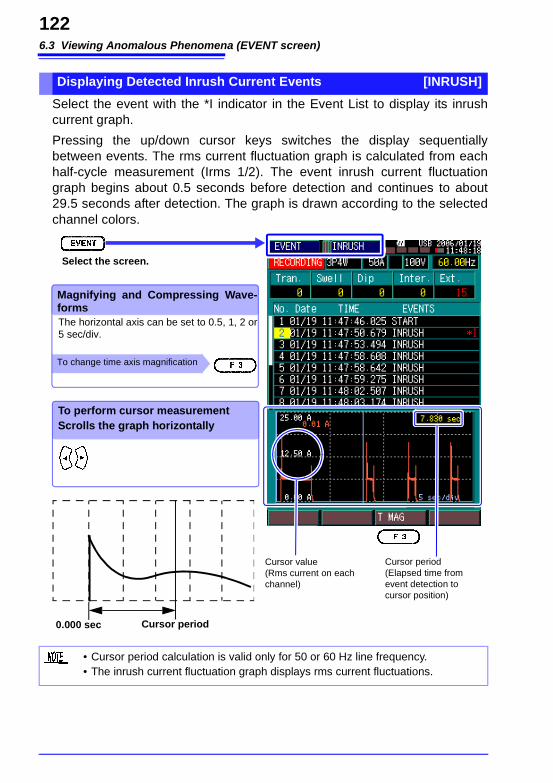
6.3 Viewing Anomalous Phenomena (EVENT screen)
122
Select the event with the *I indicator in the Event List to display its inrush current graph.
Pressing the up/down cursor keys switches the display sequentially between events. The rms current fluctuation graph is calculated from each half-cycle measurement (Irms 1/2). The event inrush current fluctuation graph begins about 0.5 seconds before detection and continues to about 29.5 seconds after detection. The graph is drawn according to the selected channel colors.
Displaying Detected Inrush Current Events [INRUSH]
Select the screen.
To change time axis magnification
Magnifying and Compressing Wave-formsThe horizontal axis can be set to 0.5, 1, 2 or 5 sec/div.
To perform cursor measurementScrolls the graph horizontally
Cursor value(Rms current on each channel)
Cursor period(Elapsed time from event detection to cursor position)
0.000 sec Cursor period
• Cursor period calculation is valid only for 50 or 60 Hz line frequency.• The inrush current fluctuation graph displays rms current fluctuations.
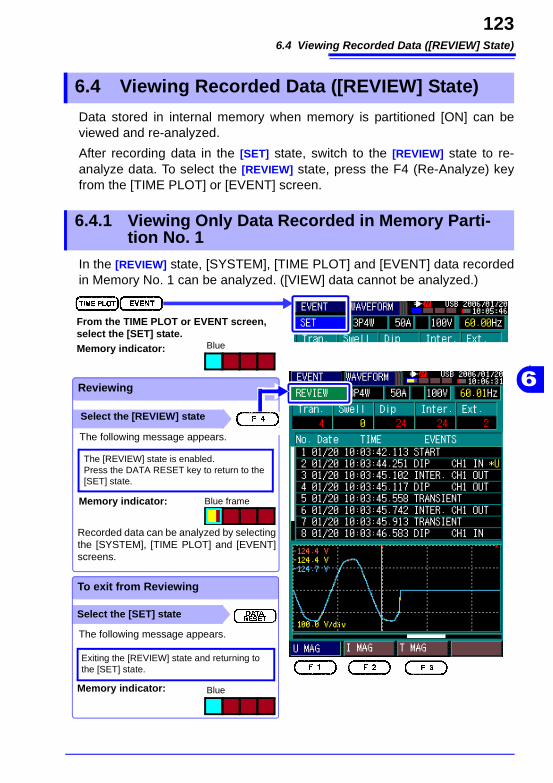
6.4 Viewing Recorded Data ([REVIEW] State)
123
6
Data stored in internal memory when memory is partitioned [ON] can be viewed and re-analyzed.
After recording data in the [SET] state, switch to the [REVIEW] state to re-analyze data. To select the [REVIEW] state, press the F4 (Re-Analyze) key from the [TIME PLOT] or [EVENT] screen.
In the [REVIEW] state, [SYSTEM], [TIME PLOT] and [EVENT] data recorded in Memory No. 1 can be analyzed. ([VIEW] data cannot be analyzed.)
6.4 Viewing Recorded Data ([REVIEW] State)
6.4.1 Viewing Only Data Recorded in Memory Parti-tion No. 1
From the TIME PLOT or EVENT screen, select the [SET] state.Memory indicator:
Select the [REVIEW] state
The following message appears.
Reviewing
The [REVIEW] state is enabled.Press the DATA RESET key to return to the [SET] state.
Blue frameMemory indicator:
Blue
Blue
Recorded data can be analyzed by selecting the [SYSTEM], [TIME PLOT] and [EVENT] screens.
Select the [SET] state
Exiting the [REVIEW] state and returning to the [SET] state.
The following message appears.
Memory indicator:
To exit from Reviewing
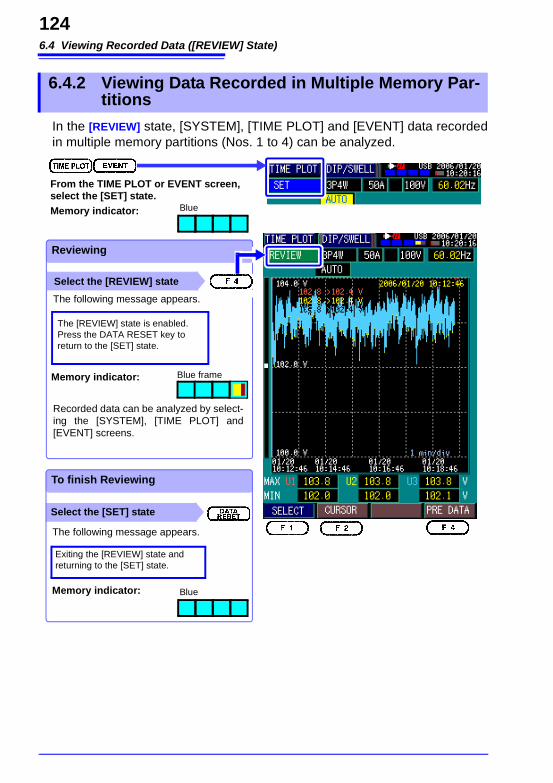
6.4 Viewing Recorded Data ([REVIEW] State)
124
In the [REVIEW] state, [SYSTEM], [TIME PLOT] and [EVENT] data recorded in multiple memory partitions (Nos. 1 to 4) can be analyzed.
6.4.2 Viewing Data Recorded in Multiple Memory Par-titions
From the TIME PLOT or EVENT screen, select the [SET] state.Memory indicator:
Select the [REVIEW] state
The following message appears.
Select the [SET] state
Reviewing
The [REVIEW] state is enabled.Press the DATA RESET key to return to the [SET] state.
Exiting the [REVIEW] state and returning to the [SET] state.
The following message appears.
Blue frameMemory indicator:
Memory indicator: Blue
Blue
To finish Reviewing
Recorded data can be analyzed by select-ing the [SYSTEM], [TIME PLOT] and [EVENT] screens.
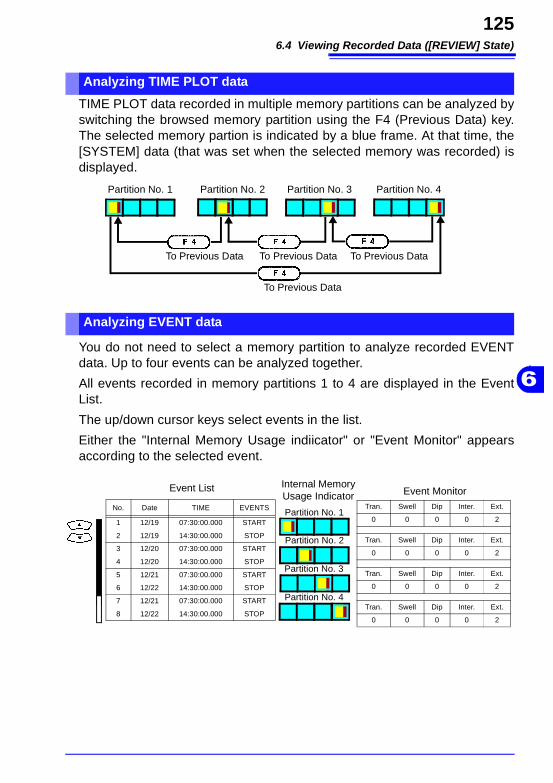
6.4 Viewing Recorded Data ([REVIEW] State)
125
6
TIME PLOT data recorded in multiple memory partitions can be analyzed by switching the browsed memory partition using the F4 (Previous Data) key. The selected memory partion is indicated by a blue frame. At that time, the [SYSTEM] data (that was set when the selected memory was recorded) is displayed.
You do not need to select a memory partition to analyze recorded EVENT data. Up to four events can be analyzed together.
All events recorded in memory partitions 1 to 4 are displayed in the Event List.
The up/down cursor keys select events in the list.
Either the "Internal Memory Usage indiicator" or "Event Monitor" appears according to the selected event.
Analyzing TIME PLOT data
Analyzing EVENT data
Partition No. 1 Partition No. 2 Partition No. 3 Partition No. 4
To Previous Data To Previous DataTo Previous Data
To Previous Data
No. Date TIME EVENTS
1 12/19 07:30:00.000 START
2 12/19 14:30:00.000 STOP
3 12/20 07:30:00.000 START
4 12/20 14:30:00.000 STOP
5 12/21 07:30:00.000 START
6 12/22 14:30:00.000 STOP
7 12/21 07:30:00.000 START
8 12/22 14:30:00.000 STOP
Tran. Swell Dip Inter. Ext.
0 0 0 0 2
Tran. Swell Dip Inter. Ext.
0 0 0 0 2
Tran. Swell Dip Inter. Ext.
0 0 0 0 2
Tran. Swell Dip Inter. Ext.
0 0 0 0 2
Partition No. 1
Partition No. 2
Partition No. 3
Partition No. 4
Event List Event MonitorInternal Memory Usage Indicator

6.4 Viewing Recorded Data ([REVIEW] State)
126
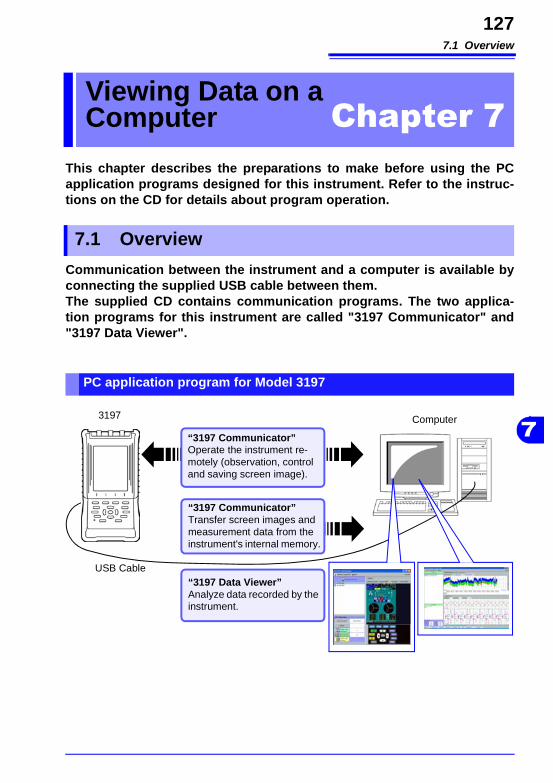
7.1 Overview
127
7
This chapter describes the preparations to make before using the PC application programs designed for this instrument. Refer to the instruc-tions on the CD for details about program operation.
Communication between the instrument and a computer is available by connecting the supplied USB cable between them.The supplied CD contains communication programs. The two applica-tion programs for this instrument are called "3197 Communicator" and "3197 Data Viewer".
Viewing Data on a Computer Chapter 7
7.1 Overview
PC application program for Model 3197
3197 Computer
“3197 Communicator”Operate the instrument re-motely (observation, control and saving screen image).
“3197 Communicator”Transfer screen images and measurement data from the instrument's internal memory.
“3197 Data Viewer”Analyze data recorded by the instrument.
USB Cable
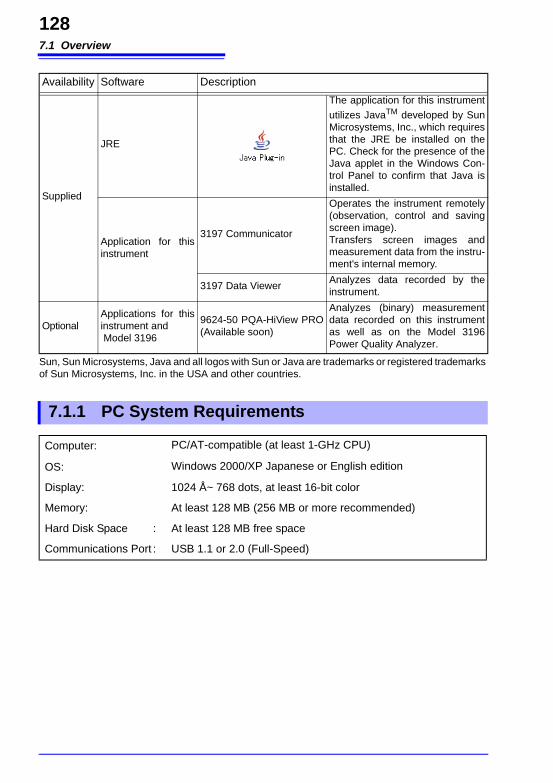
7.1 Overview
128
Sun, Sun Microsystems, Java and all logos with Sun or Java are trademarks or registered trademarks of Sun Microsystems, Inc. in the USA and other countries.
Availability Software Description
Supplied
JRE
The application for this instrument
utilizes JavaTM developed by Sun Microsystems, Inc., which requires that the JRE be installed on the PC. Check for the presence of the Java applet in the Windows Con-trol Panel to confirm that Java is installed.
Application for this instrument
3197 Communicator
Operates the instrument remotely (observation, control and saving screen image).Transfers screen images and measurement data from the instru-ment's internal memory.
3197 Data ViewerAnalyzes data recorded by the instrument.
OptionalApplications for this instrument and Model 3196
9624-50 PQA-HiView PRO(Available soon)
Analyzes (binary) measurement data recorded on this instrument as well as on the Model 3196 Power Quality Analyzer.
7.1.1 PC System Requirements
Computer: PC/AT-compatible (at least 1-GHz CPU)
OS: Windows 2000/XP Japanese or English edition
Display: 1024 Å~ 768 dots, at least 16-bit color
Memory: At least 128 MB (256 MB or more recommended)
Hard Disk Space : At least 128 MB free space
Communications Port : USB 1.1 or 2.0 (Full-Speed)
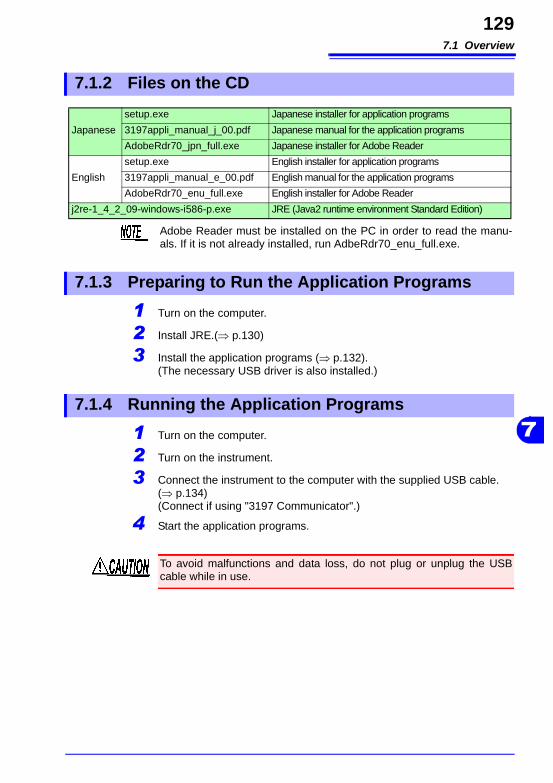
7.1 Overview
129
7
1 Turn on the computer.
2 Install JRE.(⇒ p.130)
3 Install the application programs (⇒ p.132). (The necessary USB driver is also installed.)
1 Turn on the computer.
2 Turn on the instrument.
3 Connect the instrument to the computer with the supplied USB cable. (⇒ p.134) (Connect if using "3197 Communicator".)
4 Start the application programs.
7.1.2 Files on the CD
Japanese
setup.exe Japanese installer for application programs
3197appli_manual_j_00.pdf Japanese manual for the application programs
AdobeRdr70_jpn_full.exe Japanese installer for Adobe Reader
English
setup.exe English installer for application programs
3197appli_manual_e_00.pdf English manual for the application programs
AdobeRdr70_enu_full.exe English installer for Adobe Reader
j2re-1_4_2_09-windows-i586-p.exe JRE (Java2 runtime environment Standard Edition)
Adobe Reader must be installed on the PC in order to read the manu-als. If it is not already installed, run AdbeRdr70_enu_full.exe.
7.1.3 Preparing to Run the Application Programs
7.1.4 Running the Application Programs
To avoid malfunctions and data loss, do not plug or unplug the USB cable while in use.
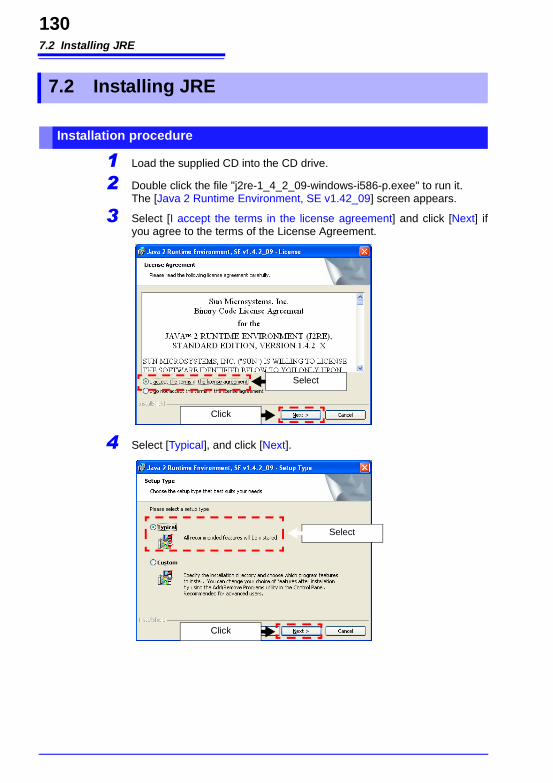
7.2 Installing JRE
130
1 Load the supplied CD into the CD drive.
2 Double click the file "j2re-1_4_2_09-windows-i586-p.exee" to run it.The [Java 2 Runtime Environment, SE v1.42_09] screen appears.
3 Select [I accept the terms in the license agreement] and click [Next] if you agree to the terms of the License Agreement.
4 Select [Typical], and click [Next].
7.2 Installing JRE
Installation procedure
Click
Select
Select
Click
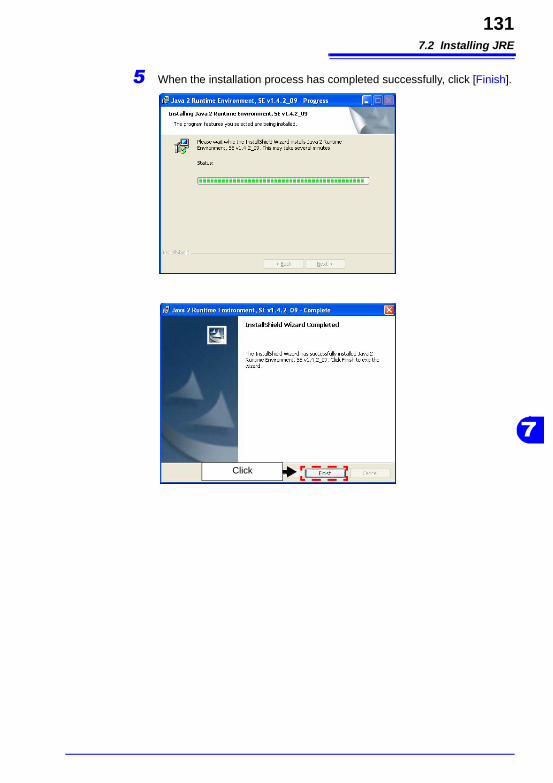
7.2 Installing JRE
131
7
5 When the installation process has completed successfully, click [Finish].
Click
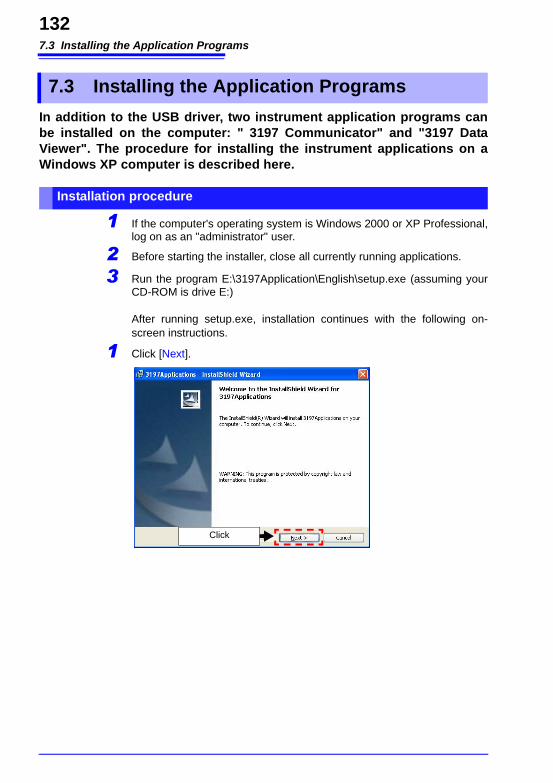
7.3 Installing the Application Programs
132
In addition to the USB driver, two instrument application programs can be installed on the computer: " 3197 Communicator" and "3197 Data Viewer". The procedure for installing the instrument applications on a Windows XP computer is described here.
1 If the computer's operating system is Windows 2000 or XP Professional, log on as an "administrator" user.
2 Before starting the installer, close all currently running applications.
3 Run the program E:\3197Application\English\setup.exe (assuming your CD-ROM is drive E:)
After running setup.exe, installation continues with the following on-screen instructions.
1 Click [Next].
7.3 Installing the Application Programs
Installation procedure
Click
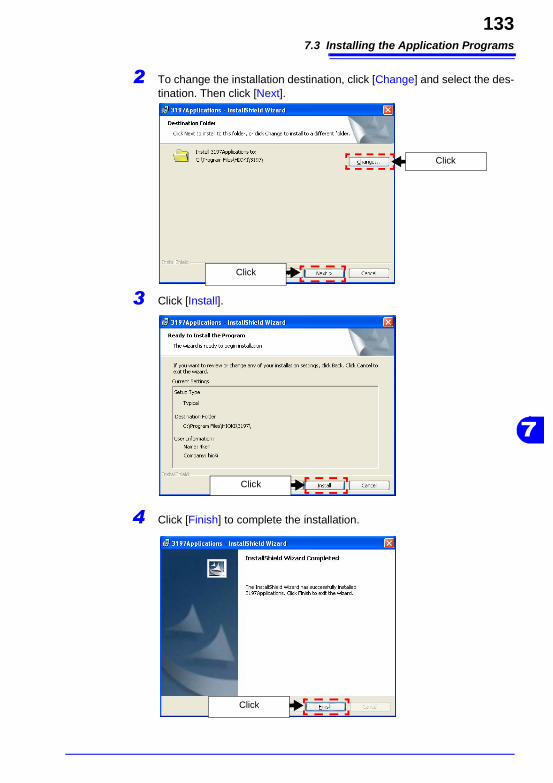
7.3 Installing the Application Programs
133
7
2 To change the installation destination, click [Change] and select the des-tination. Then click [Next].
3 Click [Install].
4 Click [Finish] to complete the installation.
Click
Click
Click
Click
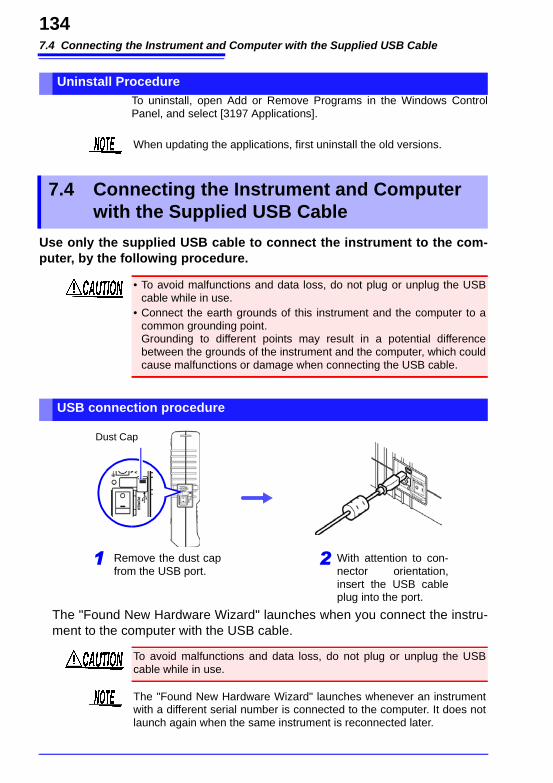
7.4 Connecting the Instrument and Computer with the Supplied USB Cable
134
To uninstall, open Add or Remove Programs in the Windows Control Panel, and select [3197 Applications].
Use only the supplied USB cable to connect the instrument to the com-puter, by the following procedure.
The "Found New Hardware Wizard" launches when you connect the instru-ment to the computer with the USB cable.
Uninstall Procedure
When updating the applications, first uninstall the old versions.
7.4 Connecting the Instrument and Computer with the Supplied USB Cable
• To avoid malfunctions and data loss, do not plug or unplug the USB cable while in use.
• Connect the earth grounds of this instrument and the computer to a common grounding point. Grounding to different points may result in a potential difference between the grounds of the instrument and the computer, which could cause malfunctions or damage when connecting the USB cable.
USB connection procedure
2 With attention to con-nector orientation, insert the USB cable plug into the port.
Remove the dust cap from the USB port.
1
Dust Cap
To avoid malfunctions and data loss, do not plug or unplug the USB cable while in use.
The "Found New Hardware Wizard" launches whenever an instrument with a different serial number is connected to the computer. It does not launch again when the same instrument is reconnected later.
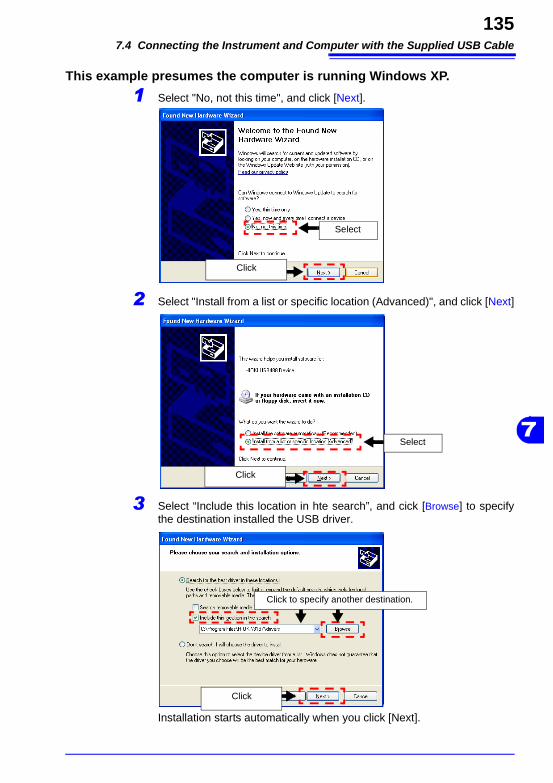
7.4 Connecting the Instrument and Computer with the Supplied USB Cable
135
7
This example presumes the computer is running Windows XP.
1 Select "No, not this time", and click [Next].
2 Select "Install from a list or specific location (Advanced)", and click [Next]
3 Select “Include this location in hte search”, and cick [Browse] to specify the destination installed the USB driver.
Installation starts automatically when you click [Next].
Select
Click
Select
Click
Click
Click to specify another destination.
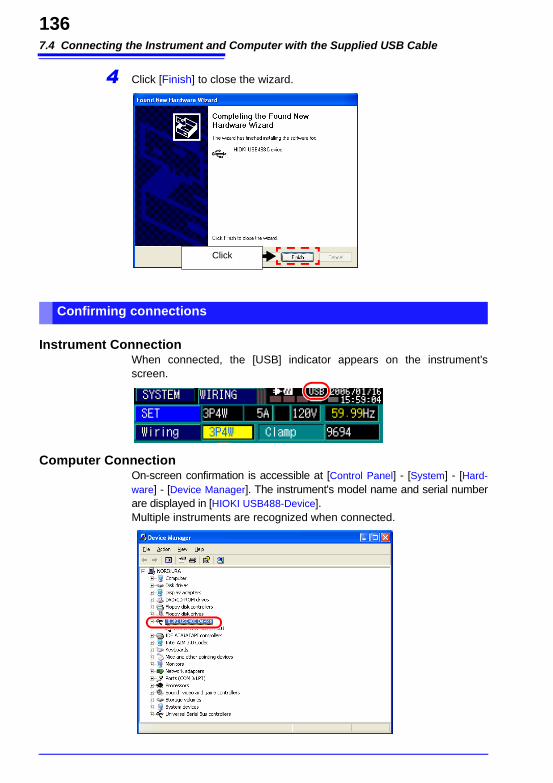
7.4 Connecting the Instrument and Computer with the Supplied USB Cable
136
4 Click [Finish] to close the wizard.
Instrument ConnectionWhen connected, the [USB] indicator appears on the instrument's screen.
Computer ConnectionOn-screen confirmation is accessible at [Control Panel] - [System] - [Hard-ware] - [Device Manager]. The instrument's model name and serial number are displayed in [HIOKI USB488-Device].Multiple instruments are recognized when connected.
Click
Confirming connections
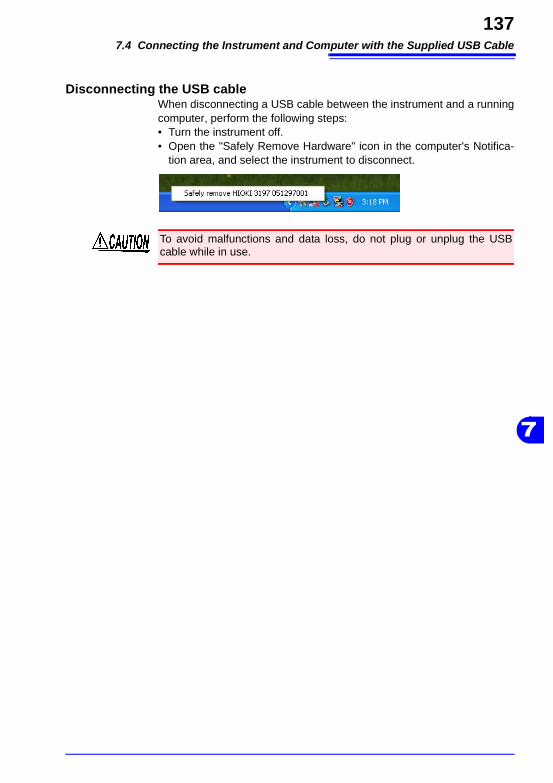
7.4 Connecting the Instrument and Computer with the Supplied USB Cable
137
7
Disconnecting the USB cableWhen disconnecting a USB cable between the instrument and a running computer, perform the following steps:• Turn the instrument off.• Open the "Safely Remove Hardware" icon in the computer's Notifica-
tion area, and select the instrument to disconnect.
To avoid malfunctions and data loss, do not plug or unplug the USB cable while in use.
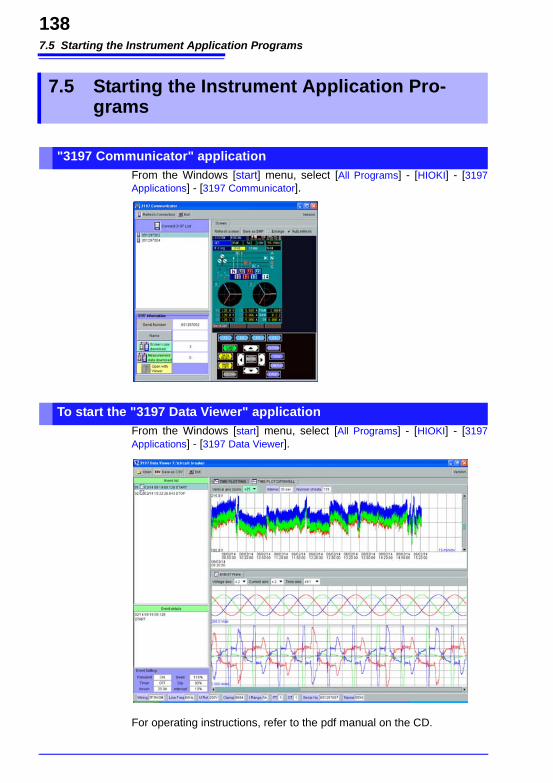
7.5 Starting the Instrument Application Programs
138
From the Windows [start] menu, select [All Programs] - [HIOKI] - [3197 Applications] - [3197 Communicator].
From the Windows [start] menu, select [All Programs] - [HIOKI] - [3197 Applications] - [3197 Data Viewer].
For operating instructions, refer to the pdf manual on the CD.
7.5 Starting the Instrument Application Pro-grams
"3197 Communicator" application
To start the "3197 Data Viewer" application
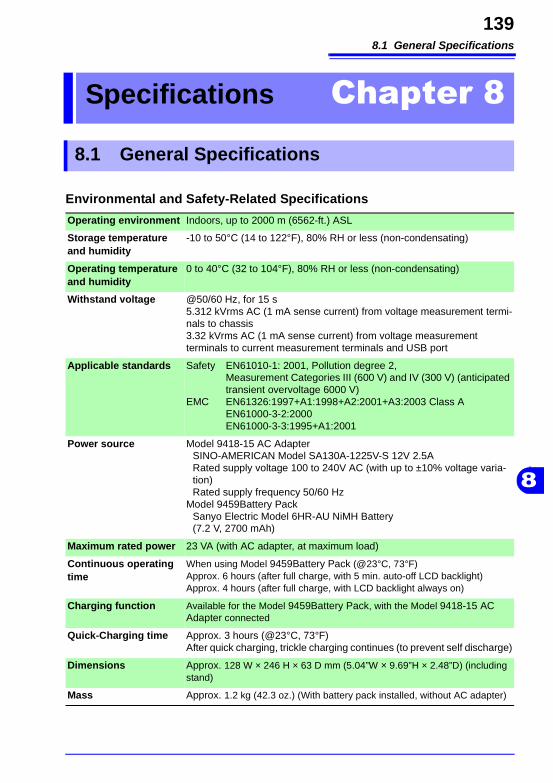
8.1 General Specifications
139
8
Specifications Chapter 8
8.1 General Specifications
Environmental and Safety-Related Specifications
Operating environment Indoors, up to 2000 m (6562-ft.) ASL
Storage temperature and humidity
-10 to 50°C (14 to 122°F), 80% RH or less (non-condensating)
Operating temperature and humidity
0 to 40°C (32 to 104°F), 80% RH or less (non-condensating)
Withstand voltage @50/60 Hz, for 15 s5.312 kVrms AC (1 mA sense current) from voltage measurement termi-nals to chassis3.32 kVrms AC (1 mA sense current) from voltage measurement terminals to current measurement terminals and USB port
Applicable standards Safety EN61010-1: 2001, Pollution degree 2, Measurement Categories III (600 V) and IV (300 V) (anticipated transient overvoltage 6000 V)
EMC EN61326:1997+A1:1998+A2:2001+A3:2003 Class A EN61000-3-2:2000 EN61000-3-3:1995+A1:2001
Power source Model 9418-15 AC Adapter SINO-AMERICAN Model SA130A-1225V-S 12V 2.5A Rated supply voltage 100 to 240V AC (with up to ±10% voltage varia-tion) Rated supply frequency 50/60 Hz
Model 9459Battery Pack Sanyo Electric Model 6HR-AU NiMH Battery (7.2 V, 2700 mAh)
Maximum rated power 23 VA (with AC adapter, at maximum load)
Continuous operating time
When using Model 9459Battery Pack (@23°C, 73°F) Approx. 6 hours (after full charge, with 5 min. auto-off LCD backlight) Approx. 4 hours (after full charge, with LCD backlight always on)
Charging function Available for the Model 9459Battery Pack, with the Model 9418-15 AC Adapter connected
Quick-Charging time Approx. 3 hours (@23°C, 73°F)After quick charging, trickle charging continues (to prevent self discharge)
Dimensions Approx. 128 W × 246 H × 63 D mm (5.04”W × 9.69”H × 2.48”D) (including stand)
Mass Approx. 1.2 kg (42.3 oz.) (With battery pack installed, without AC adapter)
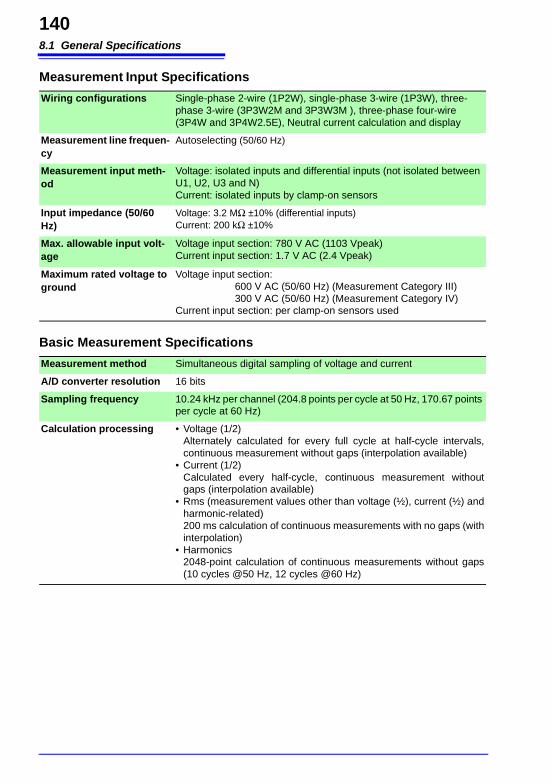
8.1 General Specifications
140
Measurement Input Specifications
Wiring configurations Single-phase 2-wire (1P2W), single-phase 3-wire (1P3W), three-phase 3-wire (3P3W2M and 3P3W3M ), three-phase four-wire (3P4W and 3P4W2.5E), Neutral current calculation and display
Measurement line frequen-cy
Autoselecting (50/60 Hz)
Measurement input meth-od
Voltage: isolated inputs and differential inputs (not isolated between U1, U2, U3 and N)Current: isolated inputs by clamp-on sensors
Input impedance (50/60 Hz)
Voltage: 3.2 MΩ ±10% (differential inputs)Current: 200 kΩ ±10%
Max. allowable input volt-age
Voltage input section: 780 V AC (1103 Vpeak)Current input section: 1.7 V AC (2.4 Vpeak)
Maximum rated voltage to ground
Voltage input section: 600 V AC (50/60 Hz) (Measurement Category III) 300 V AC (50/60 Hz) (Measurement Category IV)
Current input section: per clamp-on sensors used
Basic Measurement Specifications
Measurement method Simultaneous digital sampling of voltage and current
A/D converter resolution 16 bits
Sampling frequency 10.24 kHz per channel (204.8 points per cycle at 50 Hz, 170.67 points per cycle at 60 Hz)
Calculation processing • Voltage (1/2) Alternately calculated for every full cycle at half-cycle intervals, continuous measurement without gaps (interpolation available)
• Current (1/2) Calculated every half-cycle, continuous measurement without gaps (interpolation available)
• Rms (measurement values other than voltage (½), current (½) and harmonic-related) 200 ms calculation of continuous measurements with no gaps (with interpolation)
• Harmonics 2048-point calculation of continuous measurements without gaps (10 cycles @50 Hz, 12 cycles @60 Hz)
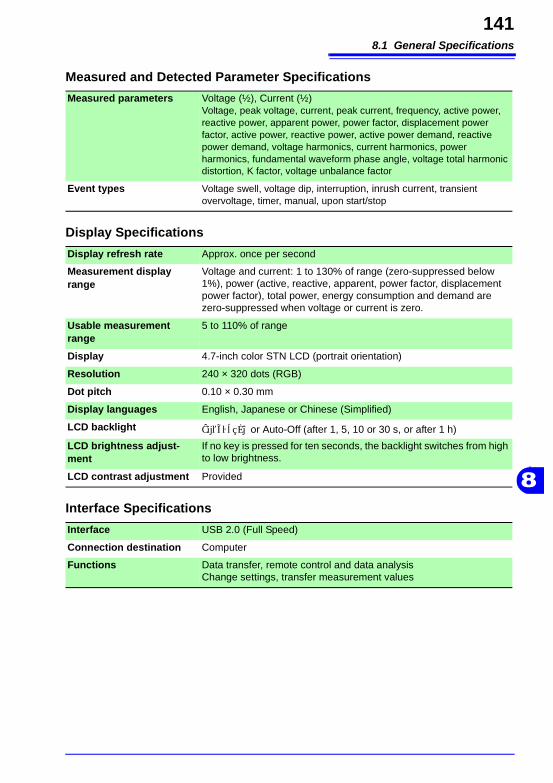
8.1 General Specifications
141
8
Measured and Detected Parameter Specifications
Measured parameters Voltage (½), Current (½)Voltage, peak voltage, current, peak current, frequency, active power, reactive power, apparent power, power factor, displacement power factor, active power, reactive power, active power demand, reactive power demand, voltage harmonics, current harmonics, power harmonics, fundamental waveform phase angle, voltage total harmonic distortion, K factor, voltage unbalance factor
Event types Voltage swell, voltage dip, interruption, inrush current, transient overvoltage, timer, manual, upon start/stop
Display Specifications
Display refresh rate Approx. once per second
Measurement display range
Voltage and current: 1 to 130% of range (zero-suppressed below 1%), power (active, reactive, apparent, power factor, displacement power factor), total power, energy consumption and demand are zero-suppressed when voltage or current is zero.
Usable measurement range
5 to 110% of range
Display 4.7-inch color STN LCD (portrait orientation)
Resolution 240 × 320 dots (RGB)
Dot pitch 0.10 × 0.30 mm
Display languages English, Japanese or Chinese (Simplified)
LCD backlight Always On or Auto-Off (after 1, 5, 10 or 30 s, or after 1 h)
LCD brightness adjust-ment
If no key is pressed for ten seconds, the backlight switches from high to low brightness.
LCD contrast adjustment Provided
Interface Specifications
Interface USB 2.0 (Full Speed)
Connection destination Computer
Functions Data transfer, remote control and data analysisChange settings, transfer measurement values
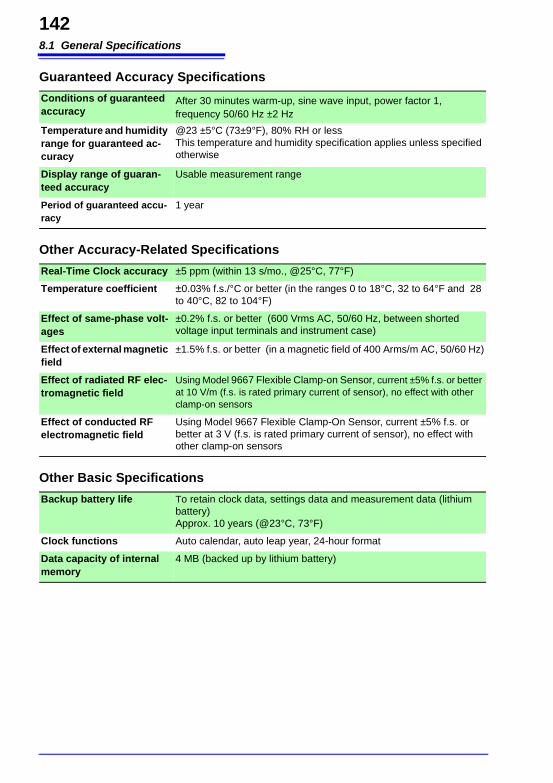
8.1 General Specifications
142
Guaranteed Accuracy Specifications
Conditions of guaranteed accuracy
After 30 minutes warm-up, sine wave input, power factor 1, frequency 50/60 Hz ±2 Hz
Temperature and humidity range for guaranteed ac-curacy
@23 ±5°C (73±9°F), 80% RH or lessThis temperature and humidity specification applies unless specified otherwise
Display range of guaran-teed accuracy
Usable measurement range
Period of guaranteed accu-racy
1 year
Other Accuracy-Related Specifications
Real-Time Clock accuracy ±5 ppm (within 13 s/mo., @25°C, 77°F)
Temperature coefficient ±0.03% f.s./°C or better (in the ranges 0 to 18°C, 32 to 64°F and 28 to 40°C, 82 to 104°F)
Effect of same-phase volt-ages
±0.2% f.s. or better (600 Vrms AC, 50/60 Hz, between shorted voltage input terminals and instrument case)
Effect of external magnetic field
±1.5% f.s. or better (in a magnetic field of 400 Arms/m AC, 50/60 Hz)
Effect of radiated RF elec-tromagnetic field
Using Model 9667 Flexible Clamp-on Sensor, current ±5% f.s. or better at 10 V/m (f.s. is rated primary current of sensor), no effect with other clamp-on sensors
Effect of conducted RF electromagnetic field
Using Model 9667 Flexible Clamp-On Sensor, current ±5% f.s. or better at 3 V (f.s. is rated primary current of sensor), no effect with other clamp-on sensors
Other Basic Specifications
Backup battery life To retain clock data, settings data and measurement data (lithium battery)Approx. 10 years (@23°C, 73°F)
Clock functions Auto calendar, auto leap year, 24-hour format
Data capacity of internal memory
4 MB (backed up by lithium battery)
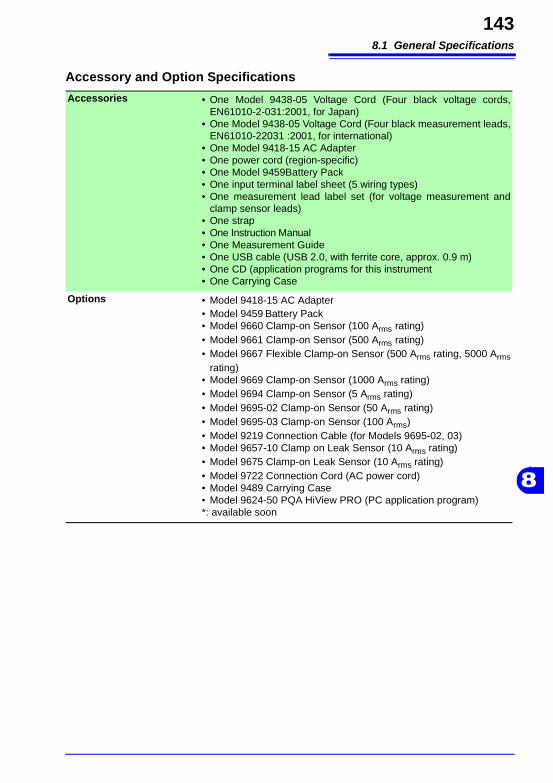
8.1 General Specifications
143
8
Accessory and Option Specifications
Accessories • One Model 9438-05 Voltage Cord (Four black voltage cords, EN61010-2-031:2001, for Japan)
• One Model 9438-05 Voltage Cord (Four black measurement leads, EN61010-22031 :2001, for international)
• One Model 9418-15 AC Adapter• One power cord (region-specific)• One Model 9459Battery Pack• One input terminal label sheet (5 wiring types)• One measurement lead label set (for voltage measurement and
clamp sensor leads)• One strap• One Instruction Manual• One Measurement Guide• One USB cable (USB 2.0, with ferrite core, approx. 0.9 m)• One CD (application programs for this instrument• One Carrying Case
Options • Model 9418-15 AC Adapter• Model 9459 Battery Pack• Model 9660 Clamp-on Sensor (100 Arms rating)• Model 9661 Clamp-on Sensor (500 Arms rating)• Model 9667 Flexible Clamp-on Sensor (500 Arms rating, 5000 Arms
rating)• Model 9669 Clamp-on Sensor (1000 Arms rating)• Model 9694 Clamp-on Sensor (5 Arms rating)• Model 9695-02 Clamp-on Sensor (50 Arms rating)• Model 9695-03 Clamp-on Sensor (100 Arms)• Model 9219 Connection Cable (for Models 9695-02, 03)• Model 9657-10 Clamp on Leak Sensor (10 Arms rating)• Model 9675 Clamp-on Leak Sensor (10 Arms rating)• Model 9722 Connection Cord (AC power cord)• Model 9489 Carrying Case• Model 9624-50 PQA HiView PRO (PC application program)*: available soon
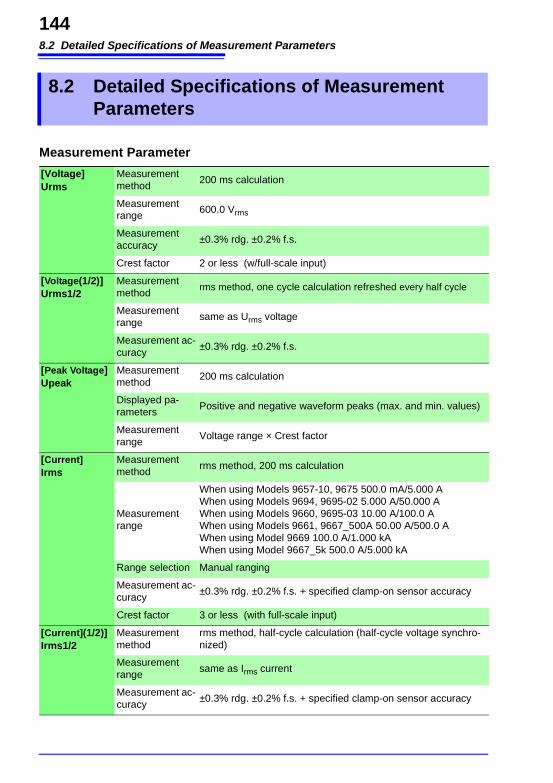
8.2 Detailed Specifications of Measurement Parameters
144
8.2 Detailed Specifications of Measurement Parameters
Measurement Parameter
[Voltage]Urms
Measurement method
200 ms calculation
Measurement range
600.0 Vrms
Measurement accuracy
±0.3% rdg. ±0.2% f.s.
Crest factor 2 or less (w/full-scale input)
[Voltage(1/2)]Urms1/2
Measurement method
rms method, one cycle calculation refreshed every half cycle
Measurement range
same as Urms voltage
Measurement ac-curacy
±0.3% rdg. ±0.2% f.s.
[Peak Voltage]Upeak
Measurement method
200 ms calculation
Displayed pa-rameters
Positive and negative waveform peaks (max. and min. values)
Measurement range
Voltage range × Crest factor
[Current]Irms
Measurement method
rms method, 200 ms calculation
Measurement range
When using Models 9657-10, 9675 500.0 mA/5.000 AWhen using Models 9694, 9695-02 5.000 A/50.000 AWhen using Models 9660, 9695-03 10.00 A/100.0 AWhen using Models 9661, 9667_500A 50.00 A/500.0 AWhen using Model 9669 100.0 A/1.000 kAWhen using Model 9667_5k 500.0 A/5.000 kA
Range selection Manual ranging
Measurement ac-curacy
±0.3% rdg. ±0.2% f.s. + specified clamp-on sensor accuracy
Crest factor 3 or less (with full-scale input)
[Current](1/2)]Irms1/2
Measurement method
rms method, half-cycle calculation (half-cycle voltage synchro-nized)
Measurement range
same as Irms current
Measurement ac-curacy
±0.3% rdg. ±0.2% f.s. + specified clamp-on sensor accuracy
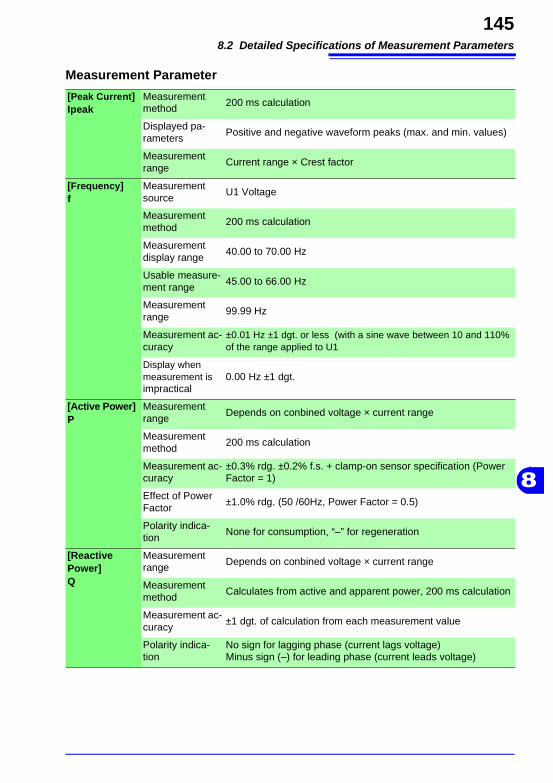
8.2 Detailed Specifications of Measurement Parameters
145
8
[Peak Current]Ipeak
Measurement method
200 ms calculation
Displayed pa-rameters
Positive and negative waveform peaks (max. and min. values)
Measurement range
Current range × Crest factor
[Frequency]f
Measurement source
U1 Voltage
Measurement method
200 ms calculation
Measurement display range
40.00 to 70.00 Hz
Usable measure-ment range
45.00 to 66.00 Hz
Measurement range
99.99 Hz
Measurement ac-curacy
±0.01 Hz ±1 dgt. or less (with a sine wave between 10 and 110% of the range applied to U1
Display when measurement is impractical
0.00 Hz ±1 dgt.
[Active Power]P
Measurement range
Depends on conbined voltage × current range
Measurement method
200 ms calculation
Measurement ac-curacy
±0.3% rdg. ±0.2% f.s. + clamp-on sensor specification (Power Factor = 1)
Effect of Power Factor
±1.0% rdg. (50 /60Hz, Power Factor = 0.5)
Polarity indica-tion
None for consumption, “–” for regeneration
[Reactive Power] Q
Measurement range
Depends on conbined voltage × current range
Measurement method
Calculates from active and apparent power, 200 ms calculation
Measurement ac-curacy
±1 dgt. of calculation from each measurement value
Polarity indica-tion
No sign for lagging phase (current lags voltage)Minus sign (–) for leading phase (current leads voltage)
Measurement Parameter
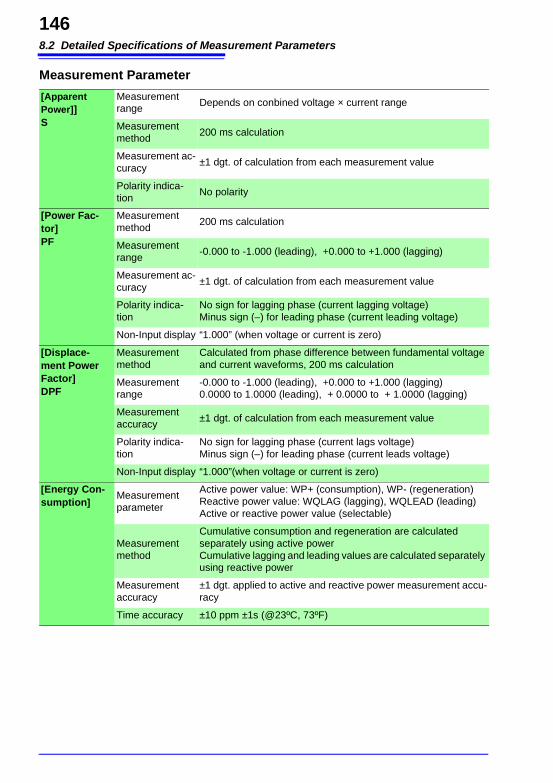
8.2 Detailed Specifications of Measurement Parameters
146
[Apparent Power]]S
Measurement range
Depends on conbined voltage × current range
Measurement method
200 ms calculation
Measurement ac-curacy
±1 dgt. of calculation from each measurement value
Polarity indica-tion
No polarity
[Power Fac-tor]PF
Measurement method
200 ms calculation
Measurement range
-0.000 to -1.000 (leading), +0.000 to +1.000 (lagging)
Measurement ac-curacy
±1 dgt. of calculation from each measurement value
Polarity indica-tion
No sign for lagging phase (current lagging voltage)Minus sign (–) for leading phase (current leading voltage)
Non-Input display “1.000” (when voltage or current is zero)
[Displace-ment Power Factor] DPF
Measurement method
Calculated from phase difference between fundamental voltage and current waveforms, 200 ms calculation
Measurement range
-0.000 to -1.000 (leading), +0.000 to +1.000 (lagging)0.0000 to 1.0000 (leading), + 0.0000 to + 1.0000 (lagging)
Measurement accuracy
±1 dgt. of calculation from each measurement value
Polarity indica-tion
No sign for lagging phase (current lags voltage)Minus sign (–) for leading phase (current leads voltage)
Non-Input display “1.000”(when voltage or current is zero)
[Energy Con-sumption]
Measurement parameter
Active power value: WP+ (consumption), WP- (regeneration)Reactive power value: WQLAG (lagging), WQLEAD (leading)Active or reactive power value (selectable)
Measurement method
Cumulative consumption and regeneration are calculated separately using active powerCumulative lagging and leading values are calculated separately using reactive power
Measurement accuracy
±1 dgt. applied to active and reactive power measurement accu-racy
Time accuracy ±10 ppm ±1s (@23ºC, 73ºF)
Measurement Parameter
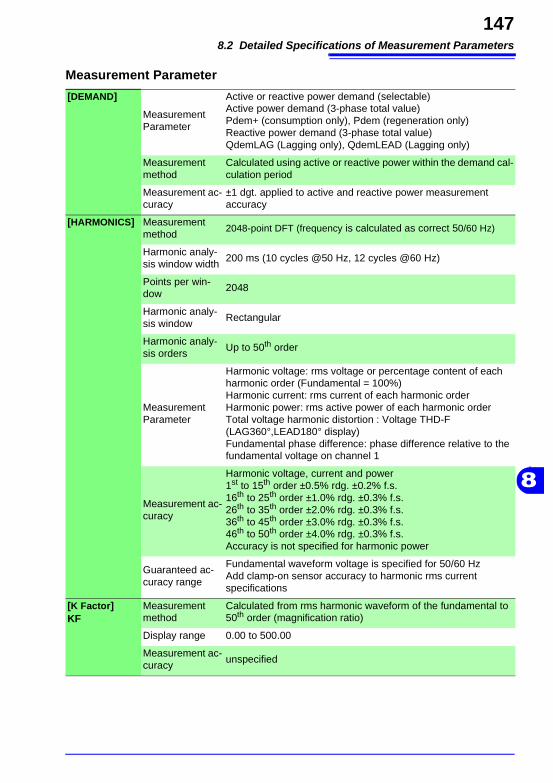
8.2 Detailed Specifications of Measurement Parameters
147
8
[DEMAND]
Measurement Parameter
Active or reactive power demand (selectable)Active power demand (3-phase total value)Pdem+ (consumption only), Pdem (regeneration only)Reactive power demand (3-phase total value)QdemLAG (Lagging only), QdemLEAD (Lagging only)
Measurement method
Calculated using active or reactive power within the demand cal-culation period
Measurement ac-curacy
±1 dgt. applied to active and reactive power measurement accuracy
[HARMONICS] Measurement method
2048-point DFT (frequency is calculated as correct 50/60 Hz)
Harmonic analy-sis window width
200 ms (10 cycles @50 Hz, 12 cycles @60 Hz)
Points per win-dow
2048
Harmonic analy-sis window
Rectangular
Harmonic analy-sis orders
Up to 50th order
Measurement Parameter
Harmonic voltage: rms voltage or percentage content of each harmonic order (Fundamental = 100%)Harmonic current: rms current of each harmonic orderHarmonic power: rms active power of each harmonic orderTotal voltage harmonic distortion : Voltage THD-F(LAG360°,LEAD180° display)Fundamental phase difference: phase difference relative to the fundamental voltage on channel 1
Measurement ac-curacy
Harmonic voltage, current and power1st to 15th order ±0.5% rdg. ±0.2% f.s.16th to 25th order ±1.0% rdg. ±0.3% f.s.26th to 35th order ±2.0% rdg. ±0.3% f.s.36th to 45th order ±3.0% rdg. ±0.3% f.s.46th to 50th order ±4.0% rdg. ±0.3% f.s.Accuracy is not specified for harmonic power
Guaranteed ac-curacy range
Fundamental waveform voltage is specified for 50/60 Hz Add clamp-on sensor accuracy to harmonic rms current specifications
[K Factor]KF
Measurement method
Calculated from rms harmonic waveform of the fundamental to 50th order (magnification ratio)
Display range 0.00 to 500.00
Measurement ac-curacy
unspecified
Measurement Parameter
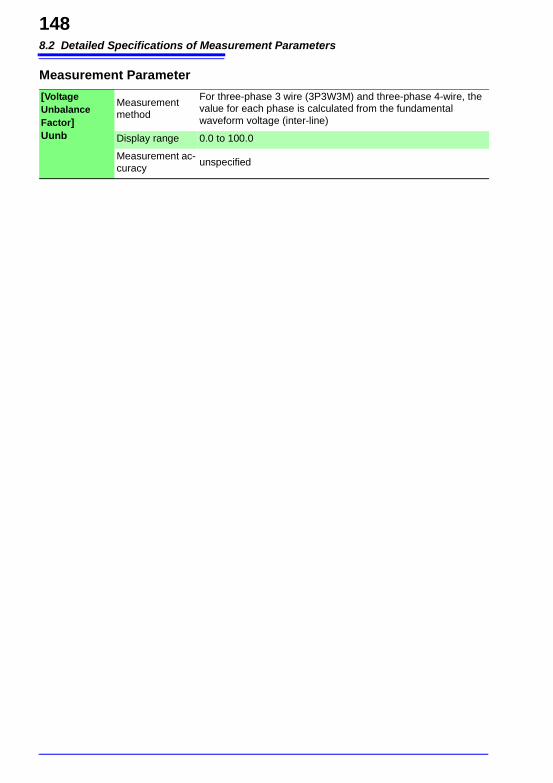
8.2 Detailed Specifications of Measurement Parameters
148
[Voltage Unbalance Factor]Uunb
Measurement method
For three-phase 3 wire (3P3W3M) and three-phase 4-wire, the value for each phase is calculated from the fundamental waveform voltage (inter-line)
Display range 0.0 to 100.0
Measurement ac-curacy
unspecified
Measurement Parameter
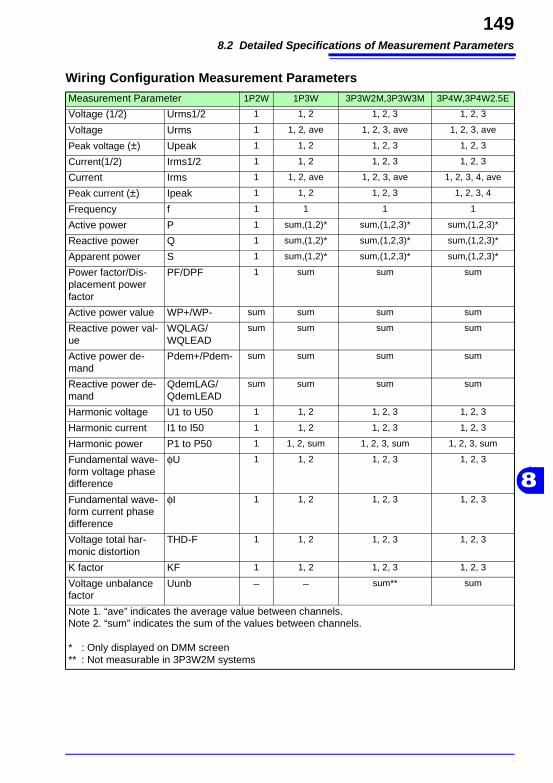
8.2 Detailed Specifications of Measurement Parameters
149
8
Wiring Configuration Measurement Parameters
Measurement Parameter 1P2W 1P3W 3P3W2M,3P3W3M 3P4W,3P4W2.5E
Voltage (1/2) Urms1/2 1 1, 2 1, 2, 3 1, 2, 3
Voltage Urms 1 1, 2, ave 1, 2, 3, ave 1, 2, 3, ave
Peak voltage (±) Upeak 1 1, 2 1, 2, 3 1, 2, 3
Current(1/2) Irms1/2 1 1, 2 1, 2, 3 1, 2, 3
Current Irms 1 1, 2, ave 1, 2, 3, ave 1, 2, 3, 4, ave
Peak current (±) Ipeak 1 1, 2 1, 2, 3 1, 2, 3, 4
Frequency f 1 1 1 1
Active power P 1 sum,(1,2)* sum,(1,2,3)* sum,(1,2,3)*
Reactive power Q 1 sum,(1,2)* sum,(1,2,3)* sum,(1,2,3)*
Apparent power S 1 sum,(1,2)* sum,(1,2,3)* sum,(1,2,3)*
Power factor/Dis-placement power factor
PF/DPF 1 sum sum sum
Active power value WP+/WP- sum sum sum sum
Reactive power val-ue
WQLAG/WQLEAD
sum sum sum sum
Active power de-mand
Pdem+/Pdem- sum sum sum sum
Reactive power de-mand
QdemLAG/QdemLEAD
sum sum sum sum
Harmonic voltage U1 to U50 1 1, 2 1, 2, 3 1, 2, 3
Harmonic current I1 to I50 1 1, 2 1, 2, 3 1, 2, 3
Harmonic power P1 to P50 1 1, 2, sum 1, 2, 3, sum 1, 2, 3, sum
Fundamental wave-form voltage phase difference
φU 1 1, 2 1, 2, 3 1, 2, 3
Fundamental wave-form current phase difference
φI 1 1, 2 1, 2, 3 1, 2, 3
Voltage total har-monic distortion
THD-F 1 1, 2 1, 2, 3 1, 2, 3
K factor KF 1 1, 2 1, 2, 3 1, 2, 3
Voltage unbalance factor
Uunb − − sum** sum
Note 1. “ave” indicates the average value between channels.Note 2. “sum” indicates the sum of the values between channels.
* : Only displayed on DMM screen** : Not measurable in 3P3W2M systems
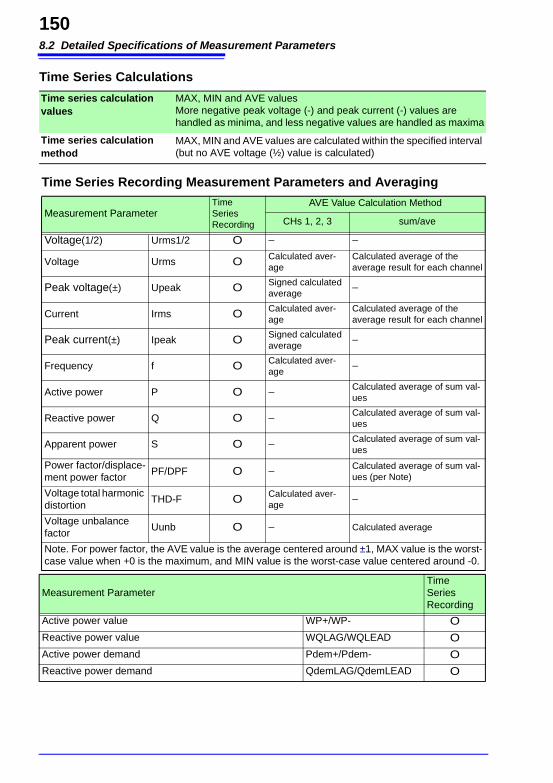
8.2 Detailed Specifications of Measurement Parameters
150
Time Series Calculations
Time series calculation values
MAX, MIN and AVE valuesMore negative peak voltage (-) and peak current (-) values are handled as minima, and less negative values are handled as maxima
Time series calculation method
MAX, MIN and AVE values are calculated within the specified interval (but no AVE voltage (½) value is calculated)
Time Series Recording Measurement Parameters and Averaging
Measurement ParameterTime Series Recording
AVE Value Calculation Method
CHs 1, 2, 3 sum/ave
Voltage(1/2) Urms1/2 O − −
Voltage Urms O Calculated aver-age
Calculated average of the average result for each channel
Peak voltage(±) Upeak O Signed calculated average
−
Current Irms O Calculated aver-age
Calculated average of the average result for each channel
Peak current(±) Ipeak O Signed calculated average
−
Frequency f O Calculated aver-age
−
Active power P O − Calculated average of sum val-ues
Reactive power Q O − Calculated average of sum val-ues
Apparent power S O − Calculated average of sum val-ues
Power factor/displace-ment power factor
PF/DPF O − Calculated average of sum val-ues (per Note)
Voltage total harmonic distortion
THD-F O Calculated aver-age
−
Voltage unbalance factor
Uunb O − Calculated average
Note. For power factor, the AVE value is the average centered around ±1, MAX value is the worst-case value when +0 is the maximum, and MIN value is the worst-case value centered around -0.
Measurement ParameterTime Series Recording
Active power value WP+/WP- OReactive power value WQLAG/WQLEAD OActive power demand Pdem+/Pdem- OReactive power demand QdemLAG/QdemLEAD O
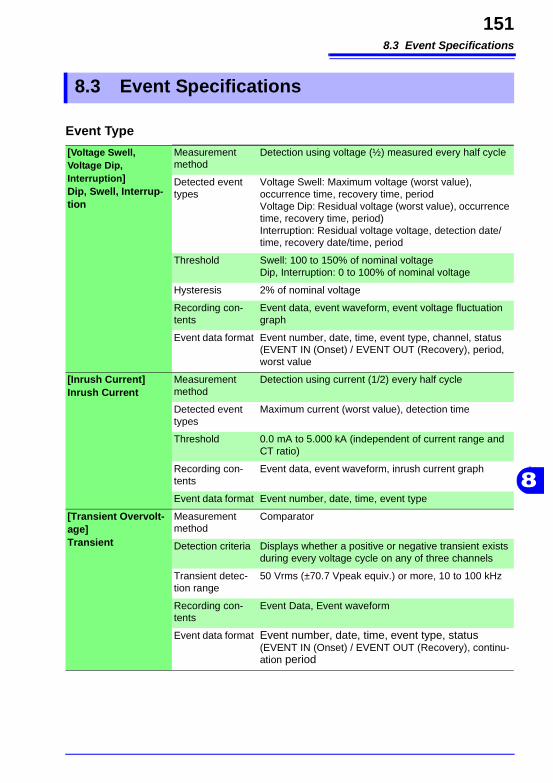
8.3 Event Specifications
151
8
8.3 Event Specifications
Event Type
[Voltage Swell, Voltage Dip, Interruption]Dip, Swell, Interrup-tion
Measurement method
Detection using voltage (½) measured every half cycle
Detected event types
Voltage Swell: Maximum voltage (worst value), occurrence time, recovery time, periodVoltage Dip: Residual voltage (worst value), occurrence time, recovery time, period)Interruption: Residual voltage voltage, detection date/time, recovery date/time, period
Threshold Swell: 100 to 150% of nominal voltageDip, Interruption: 0 to 100% of nominal voltage
Hysteresis 2% of nominal voltage
Recording con-tents
Event data, event waveform, event voltage fluctuation graph
Event data format Event number, date, time, event type, channel, status (EVENT IN (Onset) / EVENT OUT (Recovery), period, worst value
[Inrush Current]Inrush Current
Measurement method
Detection using current (1/2) every half cycle
Detected event types
Maximum current (worst value), detection time
Threshold 0.0 mA to 5.000 kA (independent of current range and CT ratio)
Recording con-tents
Event data, event waveform, inrush current graph
Event data format Event number, date, time, event type
[Transient Overvolt-age] Transient
Measurement method
Comparator
Detection criteria Displays whether a positive or negative transient exists during every voltage cycle on any of three channels
Transient detec-tion range
50 Vrms (±70.7 Vpeak equiv.) or more, 10 to 100 kHz
Recording con-tents
Event Data, Event waveform
Event data format Event number, date, time, event type, status (EVENT IN (Onset) / EVENT OUT (Recovery), continu-ation period
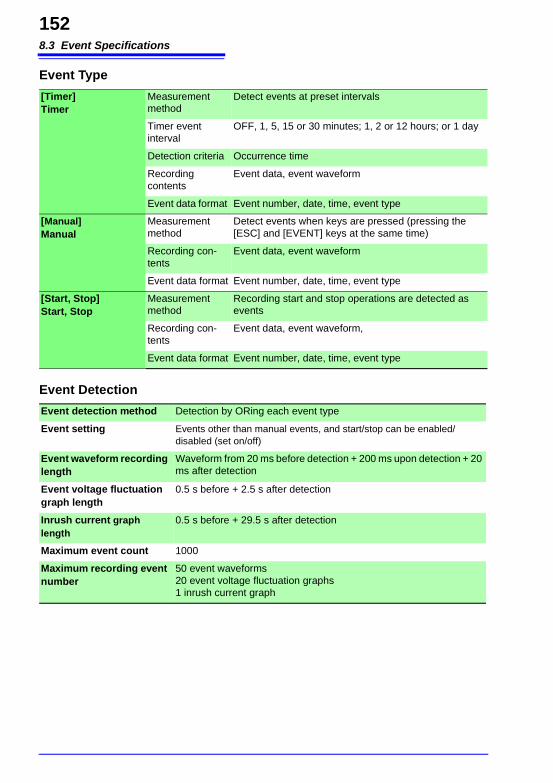
8.3 Event Specifications
152
[Timer] Timer
Measurement method
Detect events at preset intervals
Timer event interval
OFF, 1, 5, 15 or 30 minutes; 1, 2 or 12 hours; or 1 day
Detection criteria Occurrence time
Recording contents
Event data, event waveform
Event data format Event number, date, time, event type
[Manual]Manual
Measurement method
Detect events when keys are pressed (pressing the [ESC] and [EVENT] keys at the same time)
Recording con-tents
Event data, event waveform
Event data format Event number, date, time, event type
[Start, Stop]Start, Stop
Measurement method
Recording start and stop operations are detected as events
Recording con-tents
Event data, event waveform,
Event data format Event number, date, time, event type
Event Type
Event Detection
Event detection method Detection by ORing each event type
Event setting Events other than manual events, and start/stop can be enabled/disabled (set on/off)
Event waveform recording length
Waveform from 20 ms before detection + 200 ms upon detection + 20 ms after detection
Event voltage fluctuation graph length
0.5 s before + 2.5 s after detection
Inrush current graph length
0.5 s before + 29.5 s after detection
Maximum event count 1000
Maximum recording event number
50 event waveforms20 event voltage fluctuation graphs1 inrush current graph
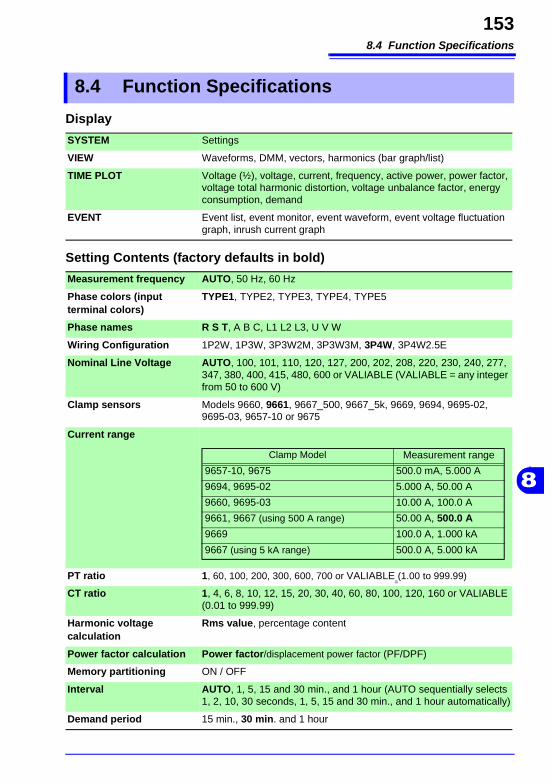
8.4 Function Specifications
153
8
8.4 Function Specifications
Display
SYSTEM Settings
VIEW Waveforms, DMM, vectors, harmonics (bar graph/list)
TIME PLOT Voltage (½), voltage, current, frequency, active power, power factor, voltage total harmonic distortion, voltage unbalance factor, energy consumption, demand
EVENT Event list, event monitor, event waveform, event voltage fluctuation graph, inrush current graph
Setting Contents (factory defaults in bold)
Measurement frequency AUTO, 50 Hz, 60 Hz
Phase colors (input terminal colors)
TYPE1, TYPE2, TYPE3, TYPE4, TYPE5
Phase names R S T, A B C, L1 L2 L3, U V W
Wiring Configuration 1P2W, 1P3W, 3P3W2M, 3P3W3M, 3P4W, 3P4W2.5E
Nominal Line Voltage AUTO, 100, 101, 110, 120, 127, 200, 202, 208, 220, 230, 240, 277, 347, 380, 400, 415, 480, 600 or VALIABLE (VALIABLE = any integer from 50 to 600 V)
Clamp sensors Models 9660, 9661, 9667_500, 9667_5k, 9669, 9694, 9695-02, 9695-03, 9657-10 or 9675
Current range
PT ratio 1, 60, 100, 200, 300, 600, 700 or VALIABLE (1.00 to 999.99)
CT ratio 1, 4, 6, 8, 10, 12, 15, 20, 30, 40, 60, 80, 100, 120, 160 or VALIABLE (0.01 to 999.99)
Harmonic voltage calculation
Rms value, percentage content
Power factor calculation Power factor/displacement power factor (PF/DPF)
Memory partitioning ON / OFF
Interval AUTO, 1, 5, 15 and 30 min., and 1 hour (AUTO sequentially selects 1, 2, 10, 30 seconds, 1, 5, 15 and 30 min., and 1 hour automatically)
Demand period 15 min., 30 min. and 1 hour
Clamp Model Measurement range
9657-10, 9675 500.0 mA, 5.000 A
9694, 9695-02 5.000 A, 50.00 A
9660, 9695-03 10.00 A, 100.0 A
9661, 9667 (using 500 A range) 50.00 A, 500.0 A
9669 100.0 A, 1.000 kA
9667 (using 5 kA range) 500.0 A, 5.000 kA
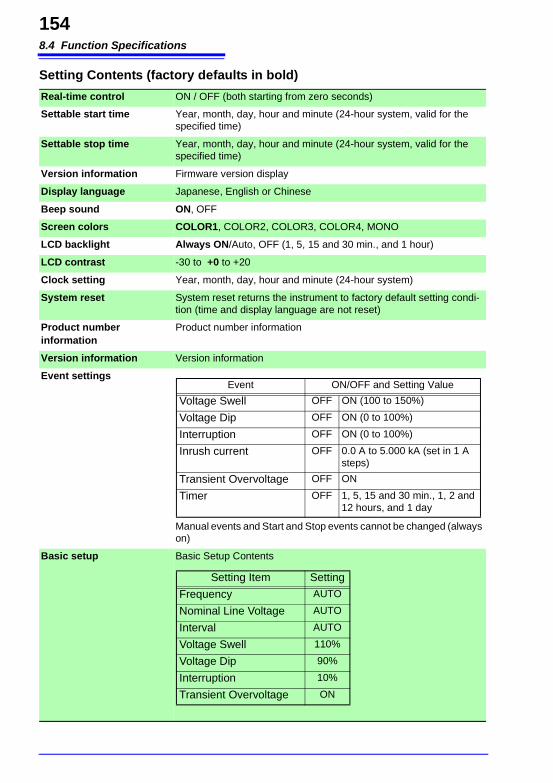
8.4 Function Specifications
154
Real-time control ON / OFF (both starting from zero seconds)
Settable start time Year, month, day, hour and minute (24-hour system, valid for the specified time)
Settable stop time Year, month, day, hour and minute (24-hour system, valid for the specified time)
Version information Firmware version display
Display language Japanese, English or Chinese
Beep sound ON, OFF
Screen colors COLOR1, COLOR2, COLOR3, COLOR4, MONO
LCD backlight Always ON/Auto, OFF (1, 5, 15 and 30 min., and 1 hour)
LCD contrast -30 to +0 to +20
Clock setting Year, month, day, hour and minute (24-hour system)
System reset System reset returns the instrument to factory default setting condi-tion (time and display language are not reset)
Product number information
Product number information
Version information Version information
Event settings
Manual events and Start and Stop events cannot be changed (always on)
Basic setup Basic Setup Contents
Setting Contents (factory defaults in bold)
Event ON/OFF and Setting Value
Voltage Swell OFF ON (100 to 150%)
Voltage Dip OFF ON (0 to 100%)
Interruption OFF ON (0 to 100%)
Inrush current OFF 0.0 A to 5.000 kA (set in 1 A steps)
Transient Overvoltage OFF ON
Timer OFF 1, 5, 15 and 30 min., 1, 2 and 12 hours, and 1 day
Setting Item Setting
Frequency AUTO
Nominal Line Voltage AUTO
Interval AUTO
Voltage Swell 110%
Voltage Dip 90%
Interruption 10%
Transient Overvoltage ON
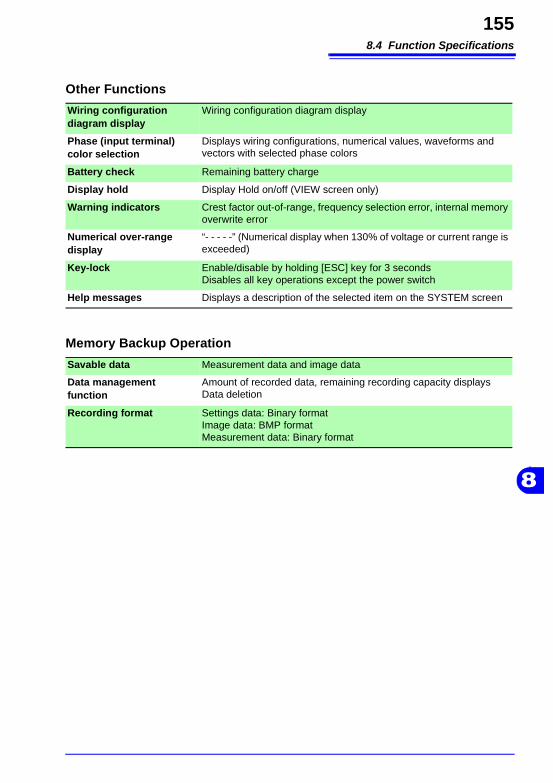
8.4 Function Specifications
155
8
Other Functions
Wiring configuration diagram display
Wiring configuration diagram display
Phase (input terminal) color selection
Displays wiring configurations, numerical values, waveforms and vectors with selected phase colors
Battery check Remaining battery charge
Display hold Display Hold on/off (VIEW screen only)
Warning indicators Crest factor out-of-range, frequency selection error, internal memory overwrite error
Numerical over-range display
“- - - - -” (Numerical display when 130% of voltage or current range is exceeded)
Key-lock Enable/disable by holding [ESC] key for 3 secondsDisables all key operations except the power switch
Help messages Displays a description of the selected item on the SYSTEM screen
Memory Backup Operation
Savable data Measurement data and image data
Data management function
Amount of recorded data, remaining recording capacity displays Data deletion
Recording format Settings data: Binary format Image data: BMP formatMeasurement data: Binary format
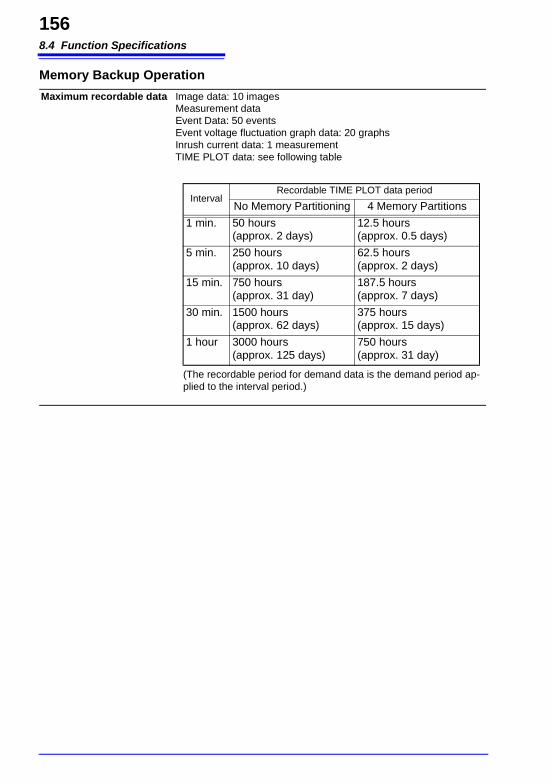
8.4 Function Specifications
156
Maximum recordable data Image data: 10 imagesMeasurement dataEvent Data: 50 eventsEvent voltage fluctuation graph data: 20 graphsInrush current data: 1 measurementTIME PLOT data: see following table
Memory Backup Operation
IntervalRecordable TIME PLOT data period
No Memory Partitioning 4 Memory Partitions
1 min. 50 hours (approx. 2 days)
12.5 hours (approx. 0.5 days)
5 min. 250 hours (approx. 10 days)
62.5 hours (approx. 2 days)
15 min. 750 hours (approx. 31 day)
187.5 hours (approx. 7 days)
30 min. 1500 hours (approx. 62 days)
375 hours (approx. 15 days)
1 hour 3000 hours (approx. 125 days)
750 hours (approx. 31 day)
(The recordable period for demand data is the demand period ap-plied to the interval period.)
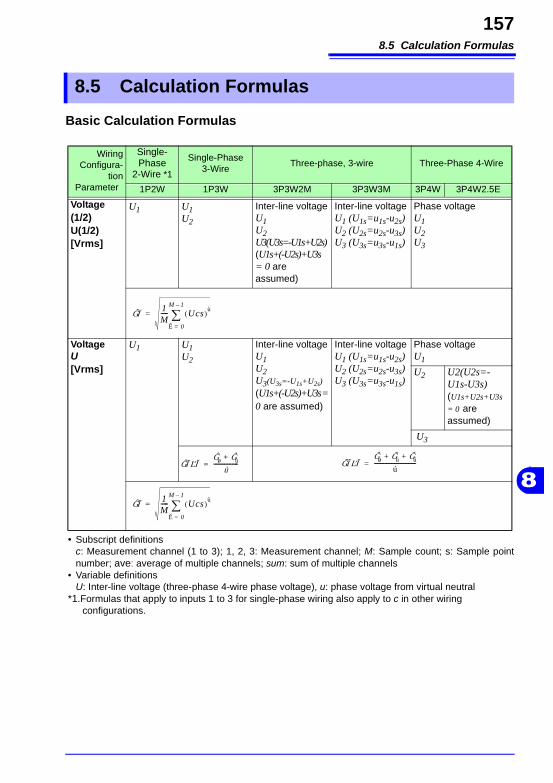
8.5 Calculation Formulas
157
8
Basic Calculation Formulas
8.5 Calculation Formulas
Wiring Configura-
tionParameter
Single-Phase
2-Wire *1
Single-Phase3-Wire
Three-phase, 3-wire Three-Phase 4-Wire
1P2W 1P3W 3P3W2M 3P3W3M 3P4W 3P4W2.5E
Voltage (1/2)U(1/2)[Vrms]
U1 U1U2
Inter-line voltageU1U2U3(U3s=-U1s+U2s)(U1s+(-U2s)+U3s = 0 are assumed)
Inter-line voltageU1 (U1s=u1s-u2s)U2 (U2s=u2s-u3s)U3 (U3s=u3s-u1s)
Phase voltageU1U2U3
VoltageU[Vrms]
U1 U1U2
Inter-line voltageU1U2U3(U3s=-U1s+U2s)
(U1s+(-U2s)+U3s = 0 are assumed)
Inter-line voltageU1 (U1s=u1s-u2s)U2 (U2s=u2s-u3s)U3 (U3s=u3s-u1s)
Phase voltageU1
U2 U2(U2s=-U1s-U3s)(U1s+U2s+U3s
= 0 are assumed)
U3
• Subscript definitions c: Measurement channel (1 to 3); 1, 2, 3: Measurement channel; M: Sample count; s: Sample point number; ave: average of multiple channels; sum: sum of multiple channels
• Variable definitions U: Inter-line voltage (three-phase 4-wire phase voltage), u: phase voltage from virtual neutral
*1.Formulas that apply to inputs 1 to 3 for single-phase wiring also apply to c in other wiring configurations.
Uc 1M----- Ucs( )2
S 0=
M 1–
∑=
UaveU1 U2+
2----------------= Uave
U1 U2 U3+ +
3---------------------------=
Uc 1M----- Ucs( )2
S 0=
M 1–
∑=

8.5 Calculation Formulas
158
Wiring Con-figuration
Parameter
Single-Phase
2-Wire *1
Single-Phase 3-Wire
Three-phase, 3-wire Three-Phase 4-Wire
1P2W 1P3W 3P3W2M 3P3W3M 3P4W 3P4W2.5E
Current (1/2)I(1/2)[Arms]
I1 I1I2
I1I2I3(I3s=-I1s-I2s)
(I1s+I2s+I3s = 0
are assumed)
I1I2I3
CurrentI[Arms]
I1 I1I2
I1I2I3(I3s=-I1s-I2s)
(Assuming I1s+I2s+I3s = 0)
I1I2I3
I1I2I3I4(I4s=I1s+I2s+I3s)
• Subscript definitions c: Measurement Channel (1 to 3 ), 1, 2, 3: Measurement Channel, M: Sample count, s: Sample point number, ave: average of multiple channels; sum: sum of multiple channels
• Variable definitions I: line current, u: phase voltage from virtual neutral
*1.Formulas that apply to inputs 1 to 3 for single-phase wiring also apply to c in other wiring configurations.
Ic 1M----- Ics( )2
S 0=
M 1–
∑=
Iave I1 I2+2
---------------= Iave I1 I2 I3+ +3
--------------------------=
Ic 1M----- Ics( )2
S 0=
M 1–
∑=
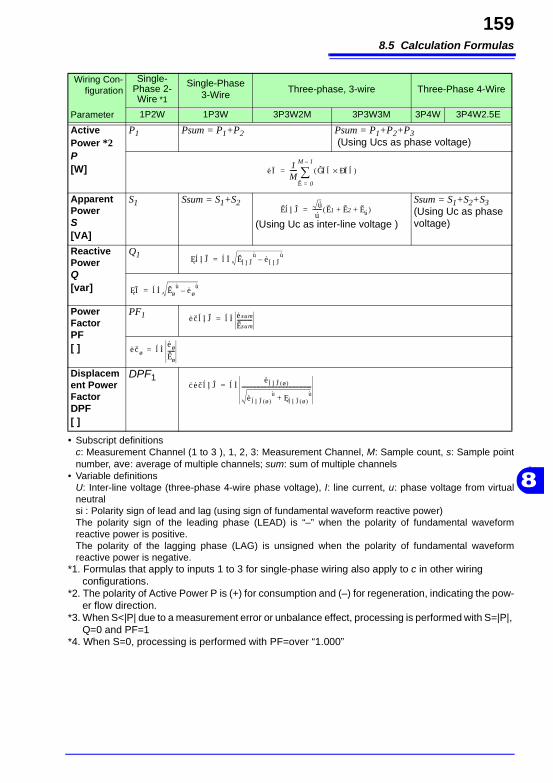
8.5 Calculation Formulas
159
8
Wiring Con-figuration
Parameter
Single-Phase 2-Wire *1
Single-Phase 3-Wire
Three-phase, 3-wire Three-Phase 4-Wire
1P2W 1P3W 3P3W2M 3P3W3M 3P4W 3P4W2.5E
Active Power *2P[W]
P1 Psum = P1+P2 Psum = P1+P2+P3 (Using Ucs as phase voltage)
Apparent PowerS[VA]
S1 Ssum = S1+S2
(Using Uc as inter-line voltage )
Ssum = S1+S2+S3(Using Uc as phase voltage)
Reactive PowerQ[var]
Q1
Power FactorPF[ ]
PF1
Displacement Power FactorDPF[ ]
DPF1
• Subscript definitions c: Measurement Channel (1 to 3 ), 1, 2, 3: Measurement Channel, M: Sample count, s: Sample point number, ave: average of multiple channels; sum: sum of multiple channels
• Variable definitions U: Inter-line voltage (three-phase 4-wire phase voltage), I: line current, u: phase voltage from virtual neutral si : Polarity sign of lead and lag (using sign of fundamental waveform reactive power) The polarity sign of the leading phase (LEAD) is “–” when the polarity of fundamental waveform reactive power is positive. The polarity of the lagging phase (LAG) is unsigned when the polarity of fundamental waveform reactive power is negative.
*1. Formulas that apply to inputs 1 to 3 for single-phase wiring also apply to c in other wiring configurations.
*2. The polarity of Active Power P is (+) for consumption and (–) for regeneration, indicating the pow-er flow direction.
*3. When S<|P| due to a measurement error or unbalance effect, processing is performed with S=|P|, Q=0 and PF=1
*4. When S=0, processing is performed with PF=over “1.000”
Pc 1M----- Ucs Ics×( )S 0=
M 1–
∑=
Ssum 33
------ S1 S2 S3+ +( )=
Qsum si Ssum2 Psum
2–=
Qc si S12 P1
2–=
PFsum si Psum
Ssum-----------=
PF1 siP1S1-----=
DPFsum siPsum 1( )
Psum 1( )2 Qsum 1( )
2+
--------------------------------------------------=
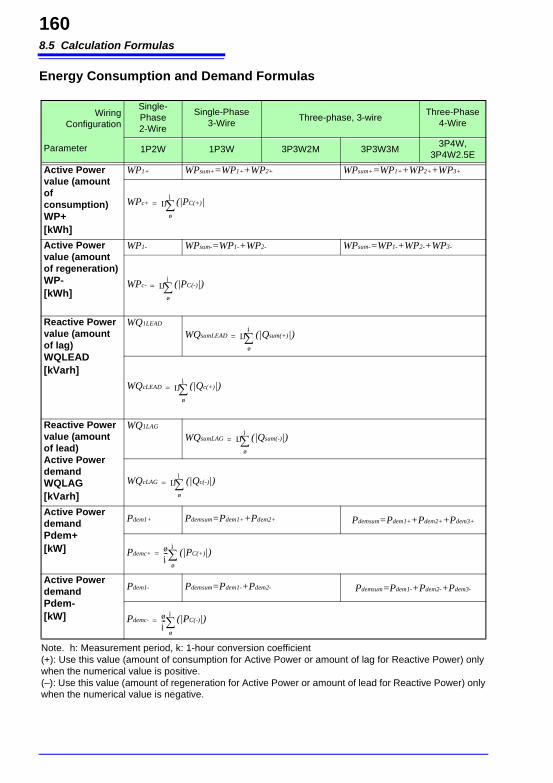
8.5 Calculation Formulas
160
Energy Consumption and Demand Formulas
Wiring Configuration
Parameter
Single-Phase2-Wire
Single-Phase3-Wire
Three-phase, 3-wireThree-Phase
4-Wire
1P2W 1P3W 3P3W2M 3P3W3M3P4W,
3P4W2.5E
Active Power value (amount of consumption)WP+[kWh]
WP1+ WPsum+=WP1++WP2+ WPsum+=WP1++WP2++WP3+
WPc+ (|PC(+)|
Active Power value (amount of regeneration)WP-[kWh]
WP1- WPsum-=WP1-+WP2- WPsum-=WP1-+WP2-+WP3-
WPc- (|PC(-)|)
Reactive Power value (amount of lag)WQLEAD[kVarh]
WQ1LEAD
WQsumLEAD (|Qsum(+)|)
WQcLEAD (|Qc(+)|)
Reactive Power value (amount of lead)Active Power demandWQLAG[kVarh]
WQ1LAG
WQsumLAG (|Qsum(-)|)
WQcLAG (|Qc(-)|)
Active Power demandPdem+[kW]
Pdem1+ Pdemsum=Pdem1++Pdem2+ Pdemsum=Pdem1++Pdem2++Pdem3+
Pdemc+ (|PC(+)|)
Active Power demandPdem-[kW]
Pdem1- Pdemsum=Pdem1-+Pdem2- Pdemsum=Pdem1-+Pdem2-+Pdem3-
Pdemc- (|PC(-)|)
Note. h: Measurement period, k: 1-hour conversion coefficient (+): Use this value (amount of consumption for Active Power or amount of lag for Reactive Power) only when the numerical value is positive. (–): Use this value (amount of regeneration for Active Power or amount of lead for Reactive Power) only when the numerical value is negative.
k1
h
∑=
k1
h
∑=
k1
h
∑=
k1
h
∑=
k1
h
∑=
k1
h
∑=
1h---
1
h
∑=
1h---
1
h
∑=
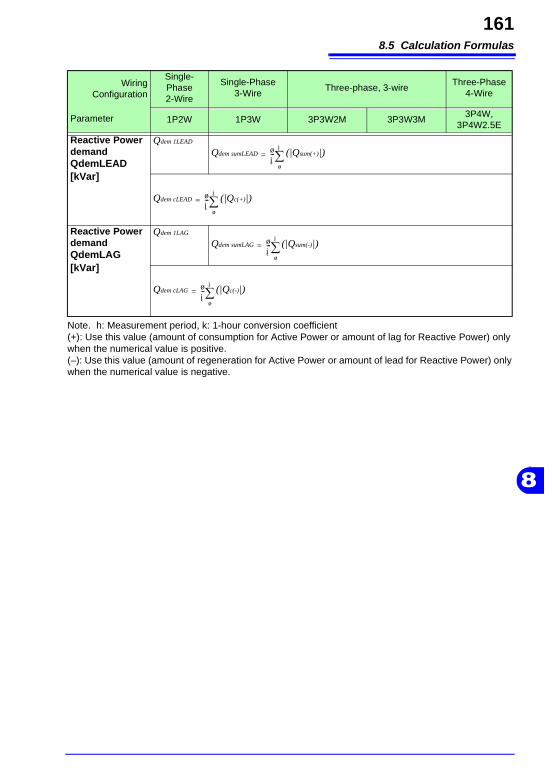
8.5 Calculation Formulas
161
8
Reactive Power demandQdemLEAD[kVar]
Qdem 1LEAD
Qdem sumLEAD (|Qsum(+)|)
Qdem cLEAD (|Qc(+)|)
Reactive Power demandQdemLAG[kVar]
Qdem 1LAG
Qdem sumLAG (|Qsum(-)|)
Qdem cLAG (|Qc(-)|)
Wiring Configuration
Parameter
Single-Phase2-Wire
Single-Phase3-Wire
Three-phase, 3-wireThree-Phase
4-Wire
1P2W 1P3W 3P3W2M 3P3W3M3P4W,
3P4W2.5E
Note. h: Measurement period, k: 1-hour conversion coefficient (+): Use this value (amount of consumption for Active Power or amount of lag for Reactive Power) only when the numerical value is positive. (–): Use this value (amount of regeneration for Active Power or amount of lead for Reactive Power) only when the numerical value is negative.
1h---
1
h
∑=
1h---
1
h
∑=
1h---
1
h
∑=
1h---
1
h
∑=
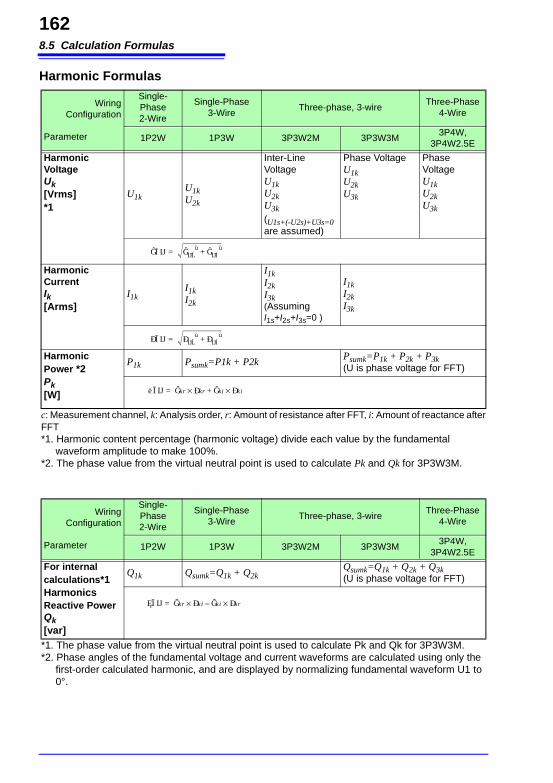
8.5 Calculation Formulas
162
Harmonic Formulas
Wiring Configuration
Parameter
Single-Phase2-Wire
Single-Phase3-Wire
Three-phase, 3-wireThree-Phase
4-Wire
1P2W 1P3W 3P3W2M 3P3W3M3P4W,
3P4W2.5E
Harmonic VoltageUk[Vrms]*1
U1kU1kU2k
Inter-Line VoltageU1kU2kU3k(U1s+(-U2s)+U3s=0 are assumed)
Phase VoltageU1kU2kU3k
Phase VoltageU1kU2kU3k
Harmonic CurrentIk[Arms]
I1kI1kI2k
I1kI2kI3k(Assuming I1s+I2s+I3s=0 )
I1kI2kI3k
Harmonic Power *2Pk[W]
P1k Psumk=P1k + P2kPsumk=P1k + P2k + P3k(U is phase voltage for FFT)
c: Measurement channel, k: Analysis order, r: Amount of resistance after FFT, i: Amount of reactance after FFT*1. Harmonic content percentage (harmonic voltage) divide each value by the fundamental
waveform amplitude to make 100%.*2. The phase value from the virtual neutral point is used to calculate Pk and Qk for 3P3W3M.
Uck Ukr2 Uki
2+=
Ick Ikr2 Iki
2+=
Pck Ukr Ikr× Uki Iki×+=
Wiring Configuration
Parameter
Single-Phase2-Wire
Single-Phase3-Wire
Three-phase, 3-wireThree-Phase
4-Wire
1P2W 1P3W 3P3W2M 3P3W3M3P4W,
3P4W2.5E
For internal calculations*1 HarmonicsReactive PowerQk[var]
Q1k Qsumk=Q1k + Q2kQsumk=Q1k + Q2k + Q3k(U is phase voltage for FFT)
*1. The phase value from the virtual neutral point is used to calculate Pk and Qk for 3P3W3M.*2. Phase angles of the fundamental voltage and current waveforms are calculated using only the
first-order calculated harmonic, and are displayed by normalizing fundamental waveform U1 to 0°.
Qck Ukr Iki× Uki Ikr×–=
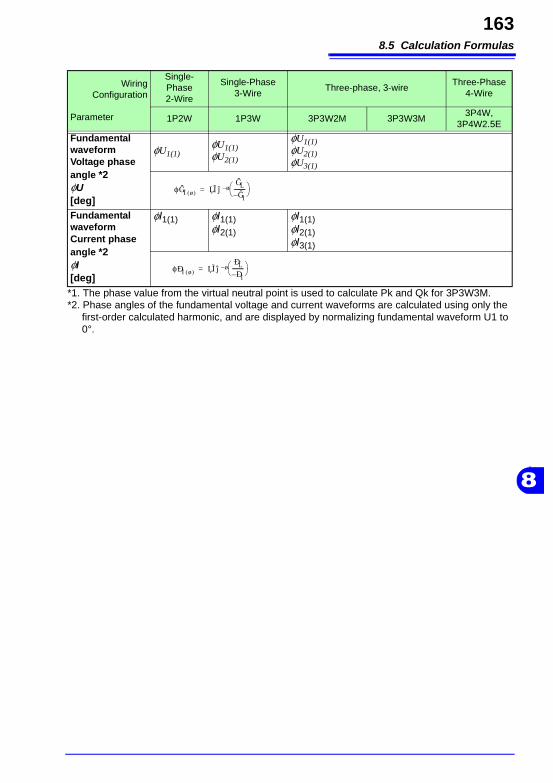
8.5 Calculation Formulas
163
8
Fundamental waveformVoltage phase angle *2φU[deg]
φU1(1)φU1(1)φU2(1)
φU1(1)φU2(1)φU3(1)
Fundamental waveformCurrent phase angle *2φI[deg]
φI1(1) φI1(1)φI2(1)
φI1(1)φI2(1)φI3(1)
Wiring Configuration
Parameter
Single-Phase2-Wire
Single-Phase3-Wire
Three-phase, 3-wireThree-Phase
4-Wire
1P2W 1P3W 3P3W2M 3P3W3M3P4W,
3P4W2.5E
*1. The phase value from the virtual neutral point is used to calculate Pk and Qk for 3P3W3M.*2. Phase angles of the fundamental voltage and current waveforms are calculated using only the
first-order calculated harmonic, and are displayed by normalizing fundamental waveform U1 to 0°.
φUc 1( )UrUi–
--------⎝ ⎠⎛ ⎞1–tan=
φIc 1( )IrIi–
--------⎝ ⎠⎛ ⎞1–tan=
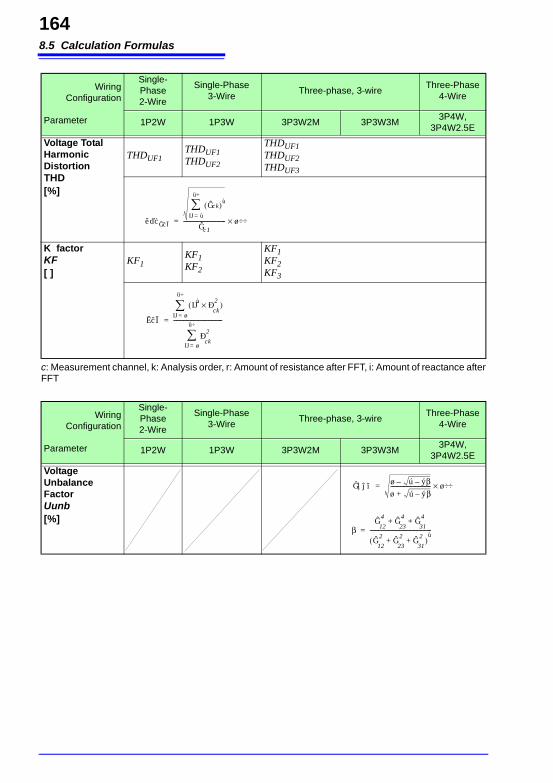
8.5 Calculation Formulas
164
Wiring Configuration
Parameter
Single-Phase2-Wire
Single-Phase3-Wire
Three-phase, 3-wireThree-Phase
4-Wire
1P2W 1P3W 3P3W2M 3P3W3M3P4W,
3P4W2.5E
Voltage Total Harmonic DistortionTHD[%]
THDUF1THDUF1THDUF2
THDUF1THDUF2THDUF3
K factorKF[ ]
KF1KF1KF2
KF1KF2KF3
c: Measurement channel, k: Analysis order, r: Amount of resistance after FFT, i: Amount of reactance after FFT
THDUFc
Uck( )2
k 2=
50
∑
Uc1------------------------------ 100×=
KFc
k2 I× 2
ck( )
k 1=
50
∑
I 2
ckk 1=
50
∑-----------------------------------=
Wiring Configuration
Parameter
Single-Phase2-Wire
Single-Phase3-Wire
Three-phase, 3-wireThree-Phase
4-Wire
1P2W 1P3W 3P3W2M 3P3W3M3P4W,
3P4W2.5E
Voltage Unbalance FactorUunb[%]
Uunb 1 3 6β––
1 3 6β–+----------------------------- 100×=
βU 4
12U 4
23U 4
31+ +
U 2
12U 2
23U 2
31+ +( )
2--------------------------------------------=
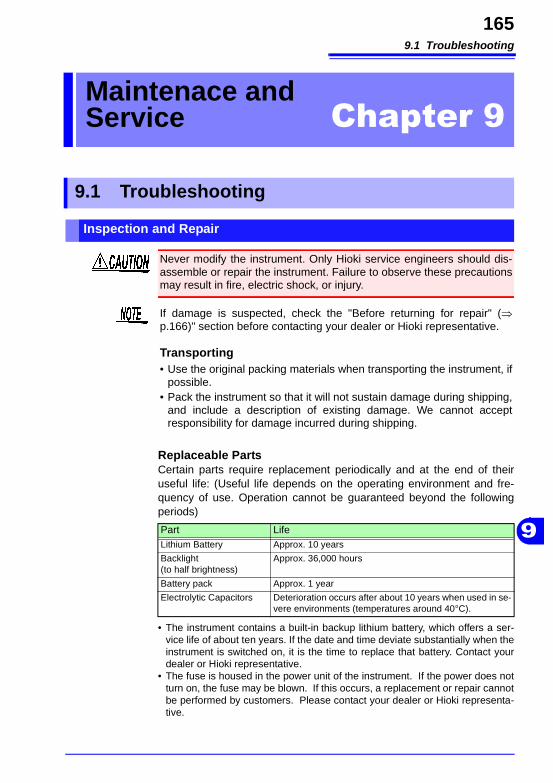
9.1 Troubleshooting
165
9
Replaceable PartsCertain parts require replacement periodically and at the end of their useful life: (Useful life depends on the operating environment and fre-quency of use. Operation cannot be guaranteed beyond the following periods)
• The instrument contains a built-in backup lithium battery, which offers a ser-vice life of about ten years. If the date and time deviate substantially when the instrument is switched on, it is the time to replace that battery. Contact your dealer or Hioki representative.
• The fuse is housed in the power unit of the instrument. If the power does not turn on, the fuse may be blown. If this occurs, a replacement or repair cannot be performed by customers. Please contact your dealer or Hioki representa-tive.
Maintenace and Service Chapter 9
9.1 Troubleshooting
Inspection and Repair
Never modify the instrument. Only Hioki service engineers should dis-assemble or repair the instrument. Failure to observe these precautions may result in fire, electric shock, or injury.
If damage is suspected, check the "Before returning for repair" (⇒p.166)" section before contacting your dealer or Hioki representative.
Transporting• Use the original packing materials when transporting the instrument, if
possible.• Pack the instrument so that it will not sustain damage during shipping,
and include a description of existing damage. We cannot accept responsibility for damage incurred during shipping.
Part LifeLithium Battery Approx. 10 years
Backlight (to half brightness)
Approx. 36,000 hours
Battery pack Approx. 1 year
Electrolytic Capacitors Deterioration occurs after about 10 years when used in se-vere environments (temperatures around 40°C).
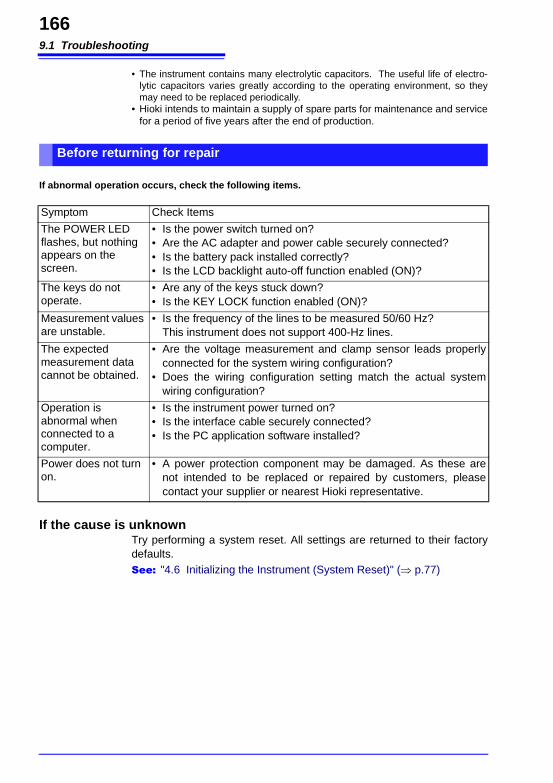
9.1 Troubleshooting
166
• The instrument contains many electrolytic capacitors. The useful life of electro-lytic capacitors varies greatly according to the operating environment, so they may need to be replaced periodically.
• Hioki intends to maintain a supply of spare parts for maintenance and service for a period of five years after the end of production.
If abnormal operation occurs, check the following items.
If the cause is unknownTry performing a system reset. All settings are returned to their factory defaults.See: "4.6 Initializing the Instrument (System Reset)" (⇒ p.77)
Before returning for repair
Symptom Check Items
The POWER LED flashes, but nothing appears on the screen.
• Is the power switch turned on?• Are the AC adapter and power cable securely connected?• Is the battery pack installed correctly?• Is the LCD backlight auto-off function enabled (ON)?
The keys do not operate.
• Are any of the keys stuck down?• Is the KEY LOCK function enabled (ON)?
Measurement values are unstable.
• Is the frequency of the lines to be measured 50/60 Hz? This instrument does not support 400-Hz lines.
The expected measurement data cannot be obtained.
• Are the voltage measurement and clamp sensor leads properly connected for the system wiring configuration?
• Does the wiring configuration setting match the actual system wiring configuration?
Operation is abnormal when connected to a computer.
• Is the instrument power turned on?• Is the interface cable securely connected?• Is the PC application software installed?
Power does not turn on.
• A power protection component may be damaged. As these are not intended to be replaced or repaired by customers, please contact your supplier or nearest Hioki representative.
9.2 Cleaning
167
9
9.2 Cleaning
Cleaning the Instrument• To clean the instrument and input modules, wipe it gently with a soft
cloth moistened with water or mild detergent. Never use solvents such as benzene, alcohol, acetone, ether, ketones, thinners or gasoline, as they can deform and discolor the case.
• Wipe the LCD gently with a soft, dry cloth.
Cleaning Clamp Sensors • Measurements are degraded by dirt on the mating surfaces of the
clamp-on sensor, so keep the surfaces clean by gently wiping with a soft cloth.
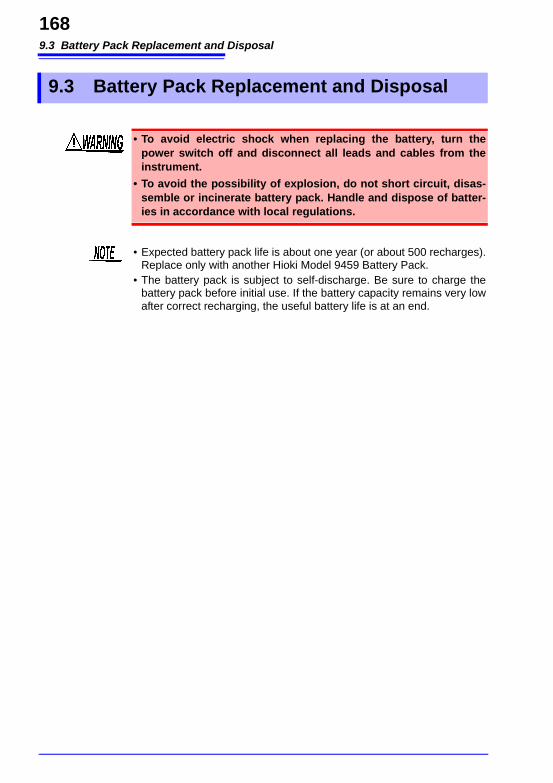
9.3 Battery Pack Replacement and Disposal
168
9.3 Battery Pack Replacement and Disposal
• To avoid electric shock when replacing the battery, turn the power switch off and disconnect all leads and cables from the instrument.
• To avoid the possibility of explosion, do not short circuit, disas-semble or incinerate battery pack. Handle and dispose of batter-ies in accordance with local regulations.
• Expected battery pack life is about one year (or about 500 recharges). Replace only with another Hioki Model 9459 Battery Pack.
• The battery pack is subject to self-discharge. Be sure to charge the battery pack before initial use. If the battery capacity remains very low after correct recharging, the useful battery life is at an end.
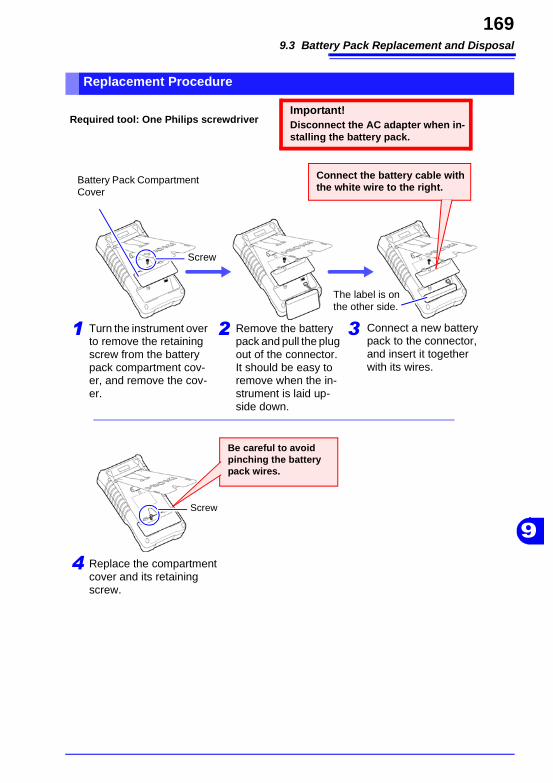
9.3 Battery Pack Replacement and Disposal
169
9
Replacement Procedure
1
Be careful to avoid pinching the battery pack wires.
Turn the instrument over to remove the retaining screw from the battery pack compartment cov-er, and remove the cov-er.
2 Remove the battery pack and pull the plug out of the connector.It should be easy to remove when the in-strument is laid up-side down.
Connect a new battery pack to the connector, and insert it together with its wires.
3
Required tool: One Philips screwdriverImportant! Disconnect the AC adapter when in-stalling the battery pack.
Battery Pack Compartment Cover
Connect the battery cable with the white wire to the right.
The label is on the other side.
4 Replace the compartment cover and its retaining screw.
Screw
Screw
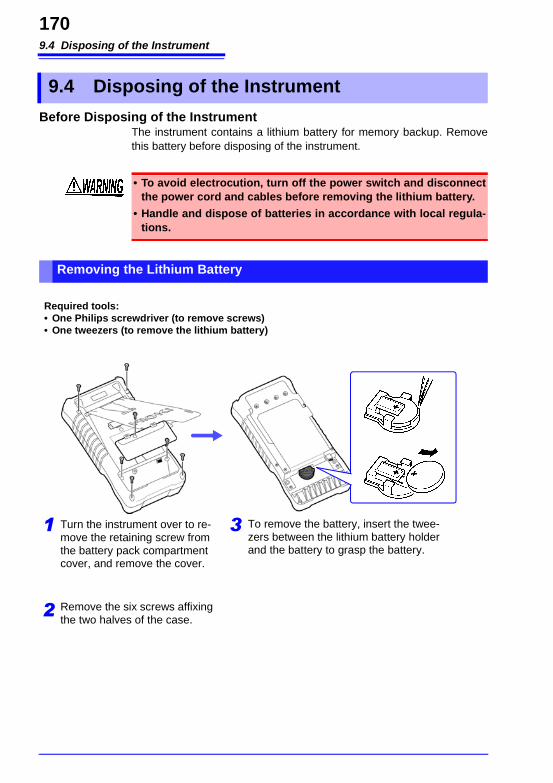
9.4 Disposing of the Instrument
170
Before Disposing of the InstrumentThe instrument contains a lithium battery for memory backup. Remove this battery before disposing of the instrument.
9.4 Disposing of the Instrument
• To avoid electrocution, turn off the power switch and disconnect the power cord and cables before removing the lithium battery.
• Handle and dispose of batteries in accordance with local regula-tions.
Removing the Lithium Battery
Required tools: • One Philips screwdriver (to remove screws)• One tweezers (to remove the lithium battery)
1 Turn the instrument over to re-move the retaining screw from the battery pack compartment cover, and remove the cover.
2 Remove the six screws affixing the two halves of the case.
To remove the battery, insert the twee-zers between the lithium battery holder and the battery to grasp the battery.
3
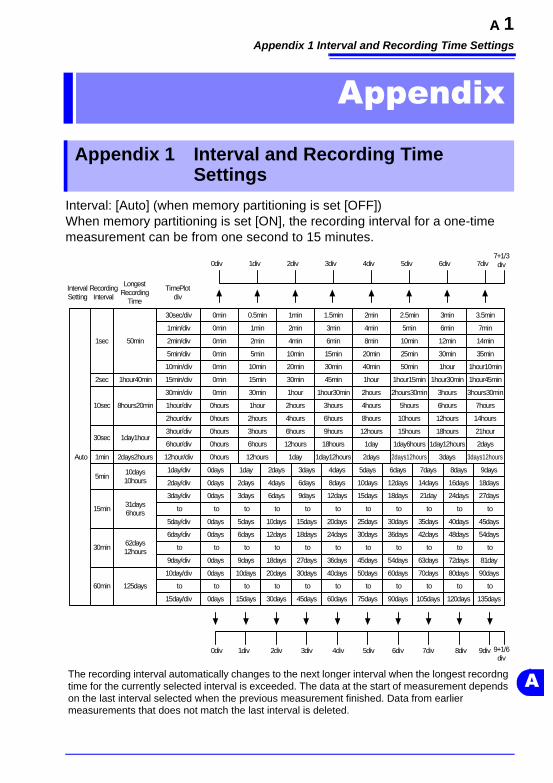
Appendix 1 Interval and Recording Time Settings
A 1
A
Interval: [Auto] (when memory partitioning is set [OFF]) When memory partitioning is set [ON], the recording interval for a one-time measurement can be from one second to 15 minutes.
Appendix
Appendix 1 Interval and Recording Time Settings
2days12hours
1day6hours
1day12hours
IntervalSetting
RecordingInterval
Auto
0hours 1hour 4hours3hours
4hours 8hours
5hours2hours
2hours
6hours
6hours 10hours 12hours
12hours3hours 6hours 15hours 18hours
0hours
0hours 9hours
12hours 1day6hours 18hours 1day12hours
2days12hours 1day 3days
0hours
0hours
7hours
14hours
21hour
2days
3days12hours
0min 0.5min 1min 1.5min 2min 2.5min 3min
5min 10min 15min 20min 25min 30min0min
0min 10min 20min 30min 40min 50min 1hour
0min 15min 30min 45min 1hour 1hour15min 1hour30min
0min 30min 1hour 1hour30min 2hours 2hours30min 3hours
35min
1hour45min
3hours30min
1hour10min
50min
LongestRecording
Time
1hour40min
1day1hour
2days2hours
10days10hours
31days6hours
62days12hours
125days
1min 2min 3min 4min 5min 6min0min
0min 2min 4min 6min 8min 10min 12min
7min
14min
0div 1div 2div 3div 4div 5div 6div7+1/3div7div
30sec/div
1min/div
2min/div
5min/div
10min/div
15min/div
30min/div
1hour/div
2hour/div
3hour/div
6hour/div
12hour/div
1day/div
2day/div
3day/div
to
15day/div
5day/div
6day/div
to
9day/div
10day/div
to
4days1day 2days 5days 6days0days 3days
8days2days 4days 10days 12days0days 6days
12days3days 6days 15days 18days0days 9days
to to to to to to to
7days
14days
21day
to
60days15days 30days 75days 90days0days 45days 105days
20days5days 10days 25days 30days0days 15days 35days
24days6days 12days 30days 36days0days 18days
to to to to to to to
42days
to
36days9days 18days 45days 54days0days 27days 63days
40days10days 20days 50days 60days0days 30days 70days
to to to to to to to to
8days
16days
24days
to
9days
18days
27days
to
120days 135days
40days 45days
48days
to
54days
to
72days 81day
80days 90days
to to
0div 1div 2div 3div 4div 5div 6div 9+1/6div
7div 8div 9div
TimePlotdiv
3.5min
30sec
10sec
1sec
2sec
1min
5min
15min
30min
60min
8hours20min
The recording interval automatically changes to the next longer interval when the longest recordng time for the currently selected interval is exceeded. The data at the start of measurement depends on the last interval selected when the previous measurement finished. Data from earlier measurements that does not match the last interval is deleted.
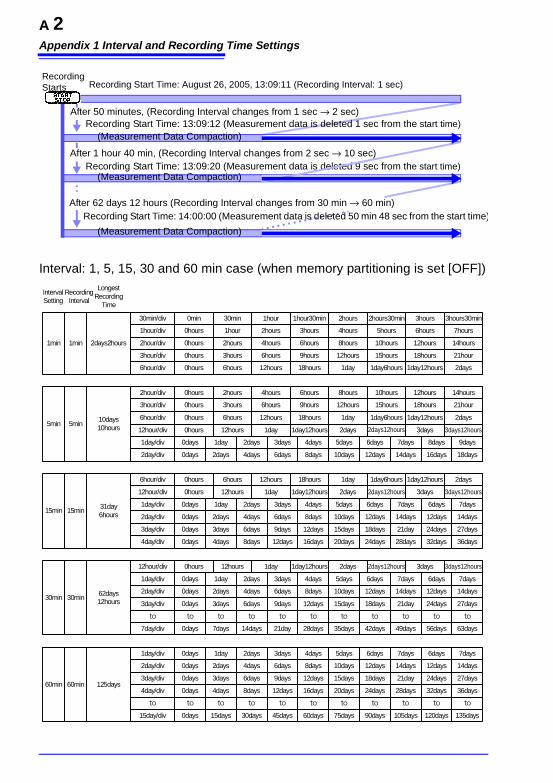
Appendix 1 Interval and Recording Time Settings
A 2
Interval: 1, 5, 15, 30 and 60 min case (when memory partitioning is set [OFF])
Recording Start Time: August 26, 2005, 13:09:11 (Recording Interval: 1 sec)Recording Starts
Recording Start Time: 13:09:12 (Measurement data is deleted 1 sec from the start time)
Recording Start Time: 13:09:20 (Measurement data is deleted 9 sec from the start time)
Recording Start Time: 14:00:00 (Measurement data is deleted 50 min 48 sec from the start time)
After 50 minutes, (Recording Interval changes from 1 sec → 2 sec)
After 1 hour 40 min, (Recording Interval changes from 2 sec → 10 sec)
After 62 days 12 hours (Recording Interval changes from 30 min → 60 min)
(Measurement Data Compaction)
(Measurement Data Compaction)
(Measurement Data Compaction)
30min 30min
1day/div
2day/div
3day/div
12hour/div 2days12hours 1day 2days12hours 3days0hours 1day12hours 3days12hours
to
62days12hours
4days1day 2days 5days 6days0days 3days
8days2days 4days 10days 12days0days 6days
12days3days 6days 15days 18days0days 9days
7days
14days
21day
6days
12days
24days
7days
14days
27days
28days7days 14days 35days 42days0days 21day 49days 56days 63days7day/div
toto to to toto to to to to
15min 15min
12hour/div
1day/div
2day/div
3day/div
4day/div
2days12hours 1day 2days12hours 3days0hours 1day12hours 3days12hours
6hour/div 12hours 1day6hours 18hours 1day6hours 1day12hours0hours 2days
31day6hours
4days1day 2days 5days 6days0days 3days
8days2days 4days 10days 12days0days 6days
12days3days 6days 15days 18days0days 9days
16days4days 8days 20days 24days0days 12days
7days
14days
21day
28days
6days
12days
24days
32days
7days
14days
27days
36days
5min
2hour/div
3hour/div
6hour/div
12hour/div
1day/div
2day/div
5min
4hours 8hours2hours 6hours 10hours 12hours
12hours3hours 6hours 15hours 18hours
0hours
0hours 9hours
12hours 1day6hours 18hours 1day6hours 1day12hours
2days12hours 1day 2days12hours 3days
0hours
0hours 1day12hours
14hours
21hour
2days
3days12hours
10days10hours
4days1day 2days 5days 6days0days 3days
8days2days 4days 10days 12days0days 6days
7days
14days
8days
16days
9days
18days
RecordingInterval
1min
IntervalSetting
1hour/div
2hour/div
3hour/div
6hour/div
1min
0hours 1hour 4hours3hours
4hours 8hours
5hours2hours
2hours
6hours
6hours 10hours 12hours
12hours3hours 6hours 15hours 18hours
0hours
0hours 9hours
12hours 1day6hours 18hours 1day6hours 1day12hours0hours
7hours
14hours
21hour
2days
30min/div 0min 30min 1hour 1hour30min 2hours 2hours30min 3hours 3hours30min
2days2hours
LongestRecording
Time
60min 60min
1day/div
2day/div
3day/div
4day/div
15day/div
125days
4days1day 2days 5days 6days0days 3days
8days2days 4days 10days 12days0days 6days
12days3days 6days 15days 18days0days 9days
7days
14days
21day
6days
12days
24days
7days
14days
27days
toto to to toto to to to toto
60days15days 30days 75days 90days0days 45days 105days 120days 135days
16days4days 8days 20days 24days0days 12days 28days 32days 36days
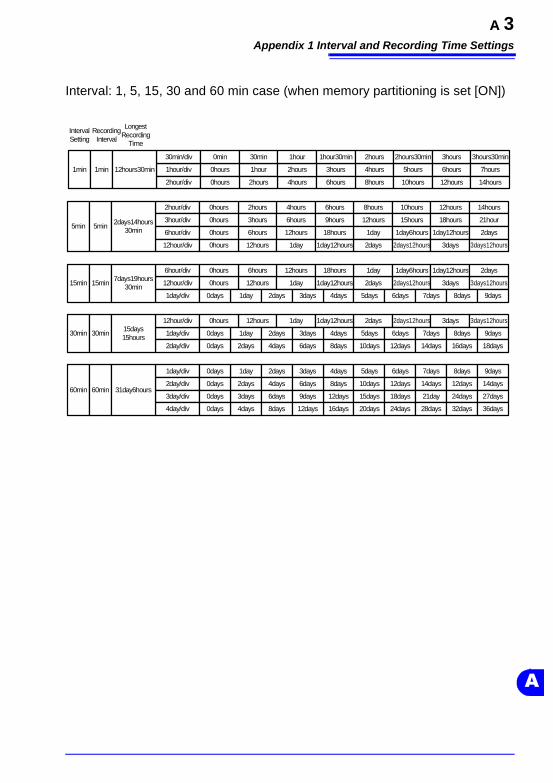
Appendix 1 Interval and Recording Time Settings
A 3
A
Interval: 1, 5, 15, 30 and 60 min case (when memory partitioning is set [ON])
15min 15min
30min 30min
12hour/div
1day/div
2days12hours 1day 2days12hours 3days0hours 1day12hours 3days12hours
1day/div
2day/div
60min 60min
1day/div
2day/div
3day/div
4day/div
6hour/div 12hours 1day6hours 18hours 1day6hours 1day12hours0hours 2days
12hour/div 2days12hours 1day 2days12hours 3days0hours 1day12hours 3days12hours
7days19hours30min
15days15hours
31day6hours
4days1day 2days 5days 6days0days 3days 7days 8days 9days
4days1day 2days 5days 6days0days 3days
8days2days 4days 10days 12days0days 6days
7days
14days
4days1day 2days 5days 6days0days 3days
8days2days 4days 10days 12days0days 6days
12days3days 6days 15days 18days0days 9days
7days
14days
21day
8days
12days
24days
9days
14days
27days
16days4days 8days 20days 24days0days 12days 28days 32days 36days
RecordingInterval
IntervalSetting
5min
2hour/div
3hour/div
6hour/div
12hour/div
5min
4hours 8hours2hours 6hours 10hours 12hours
12hours3hours 6hours 15hours 18hours
0hours
0hours 9hours
12hours 1day6hours 18hours 1day6hours 1day12hours
2days12hours 1day 2days12hours 3days
0hours
0hours 1day12hours
14hours
21hour
2days
3days12hours
2days14hours30min
LongestRecording
Time
8days
16days
9days
18days
1min 1hour/div
2hour/div
1min 0hours 1hour 4hours3hours
4hours 8hours
5hours2hours
2hours
6hours
6hours 10hours 12hours0hours
7hours
14hours
30min/div 0min 30min 1hour 1hour30min 2hours 2hours30min 3hours 3hours30min
12hours30min
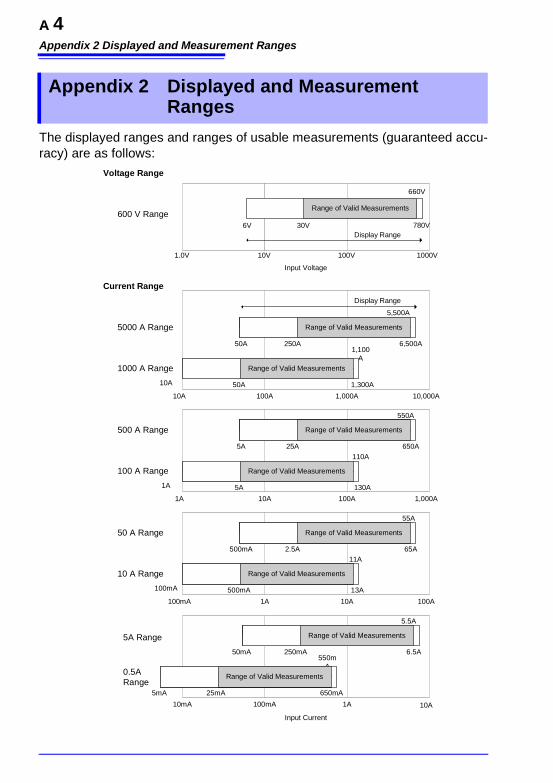
Appendix 2 Displayed and Measurement Ranges
A 4
The displayed ranges and ranges of usable measurements (guaranteed accu-racy) are as follows:
Appendix 2 Displayed and Measurement Ranges
660V
780V6V
1.0V 10V 100V 1000V
600 V Range
Input Voltage
Voltage Range
Current Range
Display Range
5000 A Range
1000 A Range
500 A Range
100 A Range
30V
Input Current
5A Range
10mA 100mA 1A 10A
0.5ARange
650mA5mA
550mA
50 A Range
100mA 1A 10A 100A
Range of Valid Measurements
25mA
6.5A50mA
5.5A
250mA
10 A Range
Range of Valid Measurements
65A500mA
55A
Range of Valid Measurements
2.5A
Range of Valid Measurements
13A100mA
11A
Range of Valid Measurements
500mA
Range of Valid MeasurementsRange of Valid Measurements
Range of Valid MeasurementsRange of Valid Measurements
1A 10A 100A 1,000A
Range of Valid Measurements
650A5A
550A
Range of Valid Measurements
25A
Range of Valid Measurements
130A1A
110A
Range of Valid Measurements
5A
10A 100A 1,000A 10,000A
Range of Valid Measurements
6,500A50A
5,500A
Range of Valid Measurements
250A
Range of Valid Measurements
1,300A10A
1,100A
Range of Valid Measurements
50A
Display Range
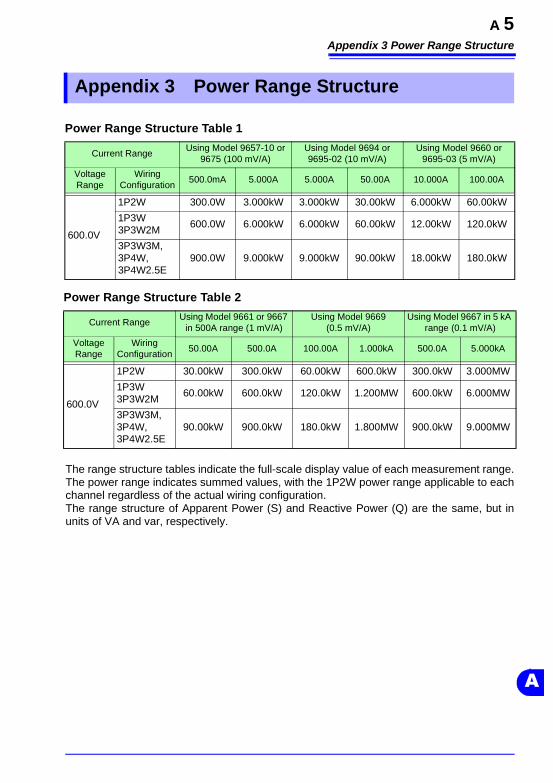
Appendix 3 Power Range Structure
A 5
A
The range structure tables indicate the full-scale display value of each measurement range.The power range indicates summed values, with the 1P2W power range applicable to each channel regardless of the actual wiring configuration. The range structure of Apparent Power (S) and Reactive Power (Q) are the same, but in units of VA and var, respectively.
Appendix 3 Power Range Structure
Power Range Structure Table 1
Current RangeUsing Model 9657-10 or
9675 (100 mV/A)Using Model 9694 or 9695-02 (10 mV/A)
Using Model 9660 or 9695-03 (5 mV/A)
Voltage Range
WiringConfiguration
500.0mA 5.000A 5.000A 50.00A 10.000A 100.00A
600.0V
1P2W 300.0W 3.000kW 3.000kW 30.00kW 6.000kW 60.00kW
1P3W3P3W2M
600.0W 6.000kW 6.000kW 60.00kW 12.00kW 120.0kW
3P3W3M,3P4W,3P4W2.5E
900.0W 9.000kW 9.000kW 90.00kW 18.00kW 180.0kW
Power Range Structure Table 2
Current RangeUsing Model 9661 or 9667
in 500A range (1 mV/A)Using Model 9669
(0.5 mV/A)Using Model 9667 in 5 kA
range (0.1 mV/A)
Voltage Range
WiringConfiguration
50.00A 500.0A 100.00A 1.000kA 500.0A 5.000kA
600.0V
1P2W 30.00kW 300.0kW 60.00kW 600.0kW 300.0kW 3.000MW
1P3W3P3W2M
60.00kW 600.0kW 120.0kW 1.200MW 600.0kW 6.000MW
3P3W3M,3P4W,3P4W2.5E
90.00kW 900.0kW 180.0kW 1.800MW 900.0kW 9.000MW
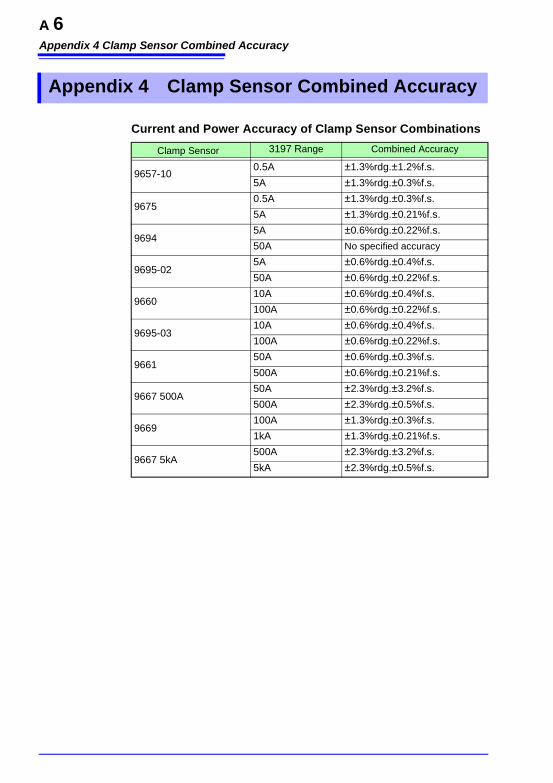
Appendix 4 Clamp Sensor Combined Accuracy
A 6
Appendix 4 Clamp Sensor Combined Accuracy
Current and Power Accuracy of Clamp Sensor Combinations
Clamp Sensor 3197 Range Combined Accuracy
9657-100.5A ±1.3%rdg.±1.2%f.s.
5A ±1.3%rdg.±0.3%f.s.
96750.5A ±1.3%rdg.±0.3%f.s.
5A ±1.3%rdg.±0.21%f.s.
96945A ±0.6%rdg.±0.22%f.s.
50A No specified accuracy
9695-025A ±0.6%rdg.±0.4%f.s.
50A ±0.6%rdg.±0.22%f.s.
966010A ±0.6%rdg.±0.4%f.s.
100A ±0.6%rdg.±0.22%f.s.
9695-0310A ±0.6%rdg.±0.4%f.s.
100A ±0.6%rdg.±0.22%f.s.
966150A ±0.6%rdg.±0.3%f.s.
500A ±0.6%rdg.±0.21%f.s.
9667 500A50A ±2.3%rdg.±3.2%f.s.
500A ±2.3%rdg.±0.5%f.s.
9669100A ±1.3%rdg.±0.3%f.s.
1kA ±1.3%rdg.±0.21%f.s.
9667 5kA500A ±2.3%rdg.±3.2%f.s.
5kA ±2.3%rdg.±0.5%f.s.
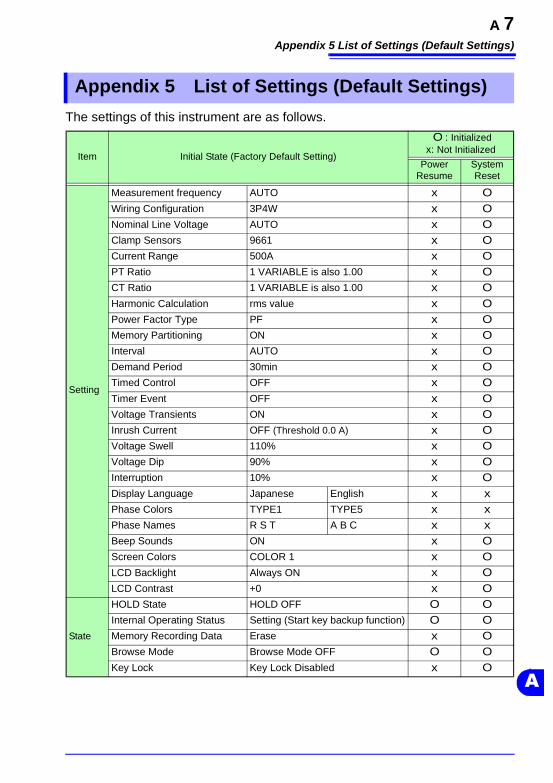
Appendix 5 List of Settings (Default Settings)
A 7
A
The settings of this instrument are as follows.
Appendix 5 List of Settings (Default Settings)
Item Initial State (Factory Default Setting)
O : Initializedx: Not Initialized
Power Resume
System Reset
Setting
Measurement frequency AUTO x OWiring Configuration 3P4W x ONominal Line Voltage AUTO x OClamp Sensors 9661 x OCurrent Range 500A x OPT Ratio 1 VARIABLE is also 1.00 x OCT Ratio 1 VARIABLE is also 1.00 x OHarmonic Calculation rms value x OPower Factor Type PF x OMemory Partitioning ON x OInterval AUTO x ODemand Period 30min x OTimed Control OFF x OTimer Event OFF x OVoltage Transients ON x OInrush Current OFF (Threshold 0.0 A) x OVoltage Swell 110% x OVoltage Dip 90% x OInterruption 10% x ODisplay Language Japanese English x xPhase Colors TYPE1 TYPE5 x xPhase Names R S T A B C x xBeep Sounds ON x OScreen Colors COLOR 1 x OLCD Backlight Always ON x OLCD Contrast +0 x O
State
HOLD State HOLD OFF O OInternal Operating Status Setting (Start key backup function) O OMemory Recording Data Erase x OBrowse Mode Browse Mode OFF O OKey Lock Key Lock Disabled x O
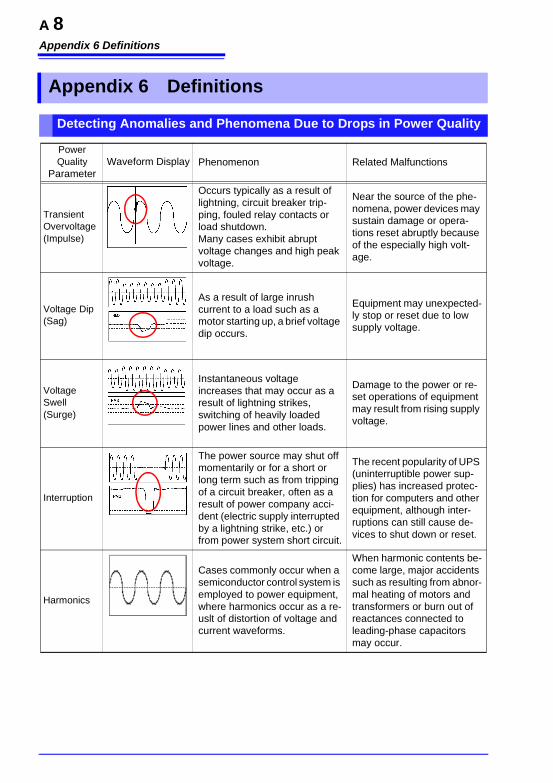
Appendix 6 Definitions
A 8
Appendix 6 Definitions
Detecting Anomalies and Phenomena Due to Drops in Power Quality
Power Quality
ParameterWaveform Display Phenomenon Related Malfunctions
Transient Overvoltage (Impulse)
Occurs typically as a result of lightning, circuit breaker trip-ping, fouled relay contacts or load shutdown. Many cases exhibit abrupt voltage changes and high peak voltage.
Near the source of the phe-nomena, power devices may sustain damage or opera-tions reset abruptly because of the especially high volt-age.
Voltage Dip (Sag)
As a result of large inrush current to a load such as a motor starting up, a brief voltage dip occurs.
Equipment may unexpected-ly stop or reset due to low supply voltage.
Voltage Swell (Surge)
Instantaneous voltage increases that may occur as a result of lightning strikes, switching of heavily loaded power lines and other loads.
Damage to the power or re-set operations of equipment may result from rising supply voltage.
Interruption
The power source may shut off momentarily or for a short or long term such as from tripping of a circuit breaker, often as a result of power company acci-dent (electric supply interrupted by a lightning strike, etc.) or from power system short circuit.
The recent popularity of UPS (uninterruptible power sup-plies) has increased protec-tion for computers and other equipment, although inter-ruptions can still cause de-vices to shut down or reset.
Harmonics
Cases commonly occur when a semiconductor control system is employed to power equipment, where harmonics occur as a re-uslt of distortion of voltage and current waveforms.
When harmonic contents be-come large, major accidents such as resulting from abnor-mal heating of motors and transformers or burn out of reactances connected to leading-phase capacitors may occur.
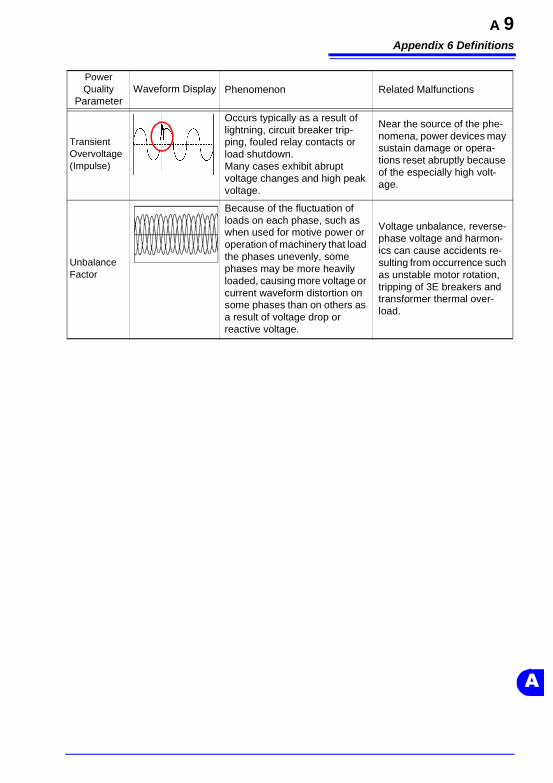
Appendix 6 Definitions
A 9
A
Unbalance Factor
Because of the fluctuation of loads on each phase, such as when used for motive power or operation of machinery that load the phases unevenly, some phases may be more heavily loaded, causing more voltage or current waveform distortion on some phases than on others as a result of voltage drop or reactive voltage.
Voltage unbalance, reverse-phase voltage and harmon-ics can cause accidents re-sulting from occurrence such as unstable motor rotation, tripping of 3E breakers and transformer thermal over-load.
Power Quality
ParameterWaveform Display Phenomenon Related Malfunctions
Transient Overvoltage (Impulse)
Occurs typically as a result of lightning, circuit breaker trip-ping, fouled relay contacts or load shutdown. Many cases exhibit abrupt voltage changes and high peak voltage.
Near the source of the phe-nomena, power devices may sustain damage or opera-tions reset abruptly because of the especially high volt-age.
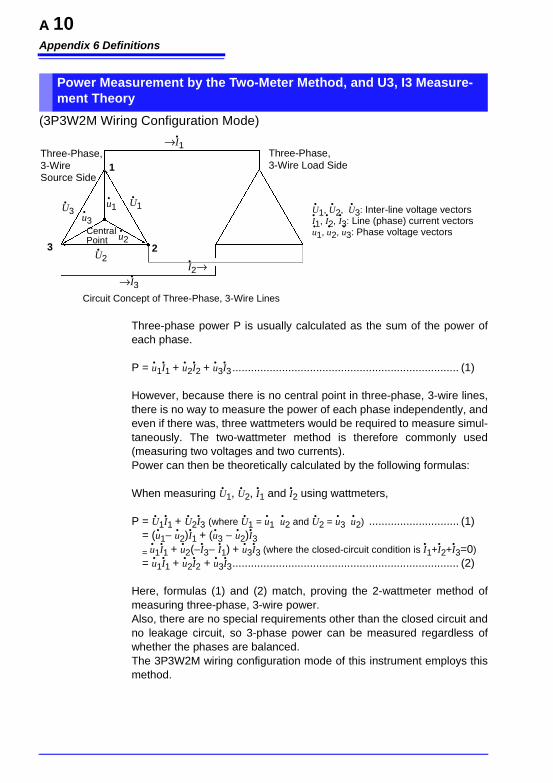
Appendix 6 Definitions
A 10
(3P3W2M Wiring Configuration Mode)
Three-phase power P is usually calculated as the sum of the power of each phase.
P = u1I1 + u2I2 + u3I3......................................................................... (1)
However, because there is no central point in three-phase, 3-wire lines, there is no way to measure the power of each phase independently, and even if there was, three wattmeters would be required to measure simul-taneously. The two-wattmeter method is therefore commonly used (measuring two voltages and two currents). Power can then be theoretically calculated by the following formulas:
When measuring U1, U2, I1 and I2 using wattmeters,
P = U1I1 + U2I3 (where U1 = u1 u2 and U2 = u3 u2) ............................. (1) = (u1− u2)I1 + (u3 − u2)I3 = u1I1 + u2(−I3− I1) + u3I3 (where the closed-circuit condition is I1+I2+I3=0) = u1I1 + u2I2 + u3I3......................................................................... (2)
Here, formulas (1) and (2) match, proving the 2-wattmeter method of measuring three-phase, 3-wire power.Also, there are no special requirements other than the closed circuit and no leakage circuit, so 3-phase power can be measured regardless of whether the phases are balanced. The 3P3W2M wiring configuration mode of this instrument employs this method.
Power Measurement by the Two-Meter Method, and U3, I3 Measure-ment Theory
Central Point
Three-Phase, 3-Wire Source Side
Three-Phase, 3-Wire Load Side1
23
→I3
I2→
→I1
U1U3
U2
u1
u2
u3
Circuit Concept of Three-Phase, 3-Wire Lines
U1, U2, U3: Inter-line voltage vectorsI1, I2, I3: Line (phase) current vectorsu1, u2, u3: Phase voltage vectors
Appendix 6 Definitions
A 11
A
Also, under these conditions, the sums of the voltage and current vec-tors is always zero, so,|U3| = |U1 − U2||I2| = |−I1− I3|are calculated internally to obtain measurements of the voltage and cur-rent of the third phase.
For U3 and I2, measurement is performed regardless of distortion. These values affect the values of 3-phase apparent power and power factor (when set so as to not use a reactive power measurement method).
With the 3P3W2M wiring configuration mode of this instrument, the T phase current of the three-phase lines is applied to I2 in each circuit, so the T phase current of the three-phase lines is displayed as current I2, and the S phase calculated value of the three-phase lines is displayed as I3.
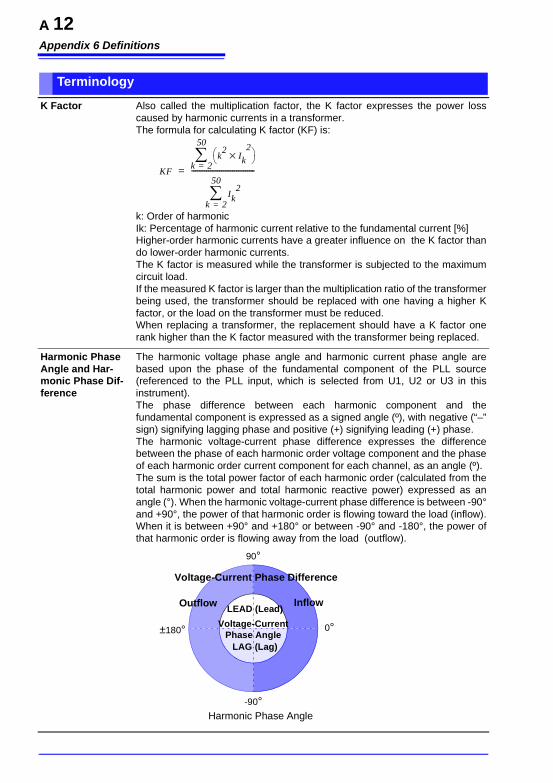
Appendix 6 Definitions
A 12
Terminology
K Factor Also called the multiplication factor, the K factor expresses the power loss caused by harmonic currents in a transformer.The formula for calculating K factor (KF) is:
k: Order of harmonic Ik: Percentage of harmonic current relative to the fundamental current [%] Higher-order harmonic currents have a greater influence on the K factor than do lower-order harmonic currents. The K factor is measured while the transformer is subjected to the maximum circuit load.If the measured K factor is larger than the multiplication ratio of the transformer being used, the transformer should be replaced with one having a higher K factor, or the load on the transformer must be reduced.When replacing a transformer, the replacement should have a K factor one rank higher than the K factor measured with the transformer being replaced.
Harmonic Phase Angle and Har-monic Phase Dif-ference
The harmonic voltage phase angle and harmonic current phase angle are based upon the phase of the fundamental component of the PLL source (referenced to the PLL input, which is selected from U1, U2 or U3 in this instrument). The phase difference between each harmonic component and the fundamental component is expressed as a signed angle (º), with negative (“–” sign) signifying lagging phase and positive (+) signifying leading (+) phase.The harmonic voltage-current phase difference expresses the difference between the phase of each harmonic order voltage component and the phase of each harmonic order current component for each channel, as an angle (º).The sum is the total power factor of each harmonic order (calculated from the total harmonic power and total harmonic reactive power) expressed as an angle (°). When the harmonic voltage-current phase difference is between -90° and +90°, the power of that harmonic order is flowing toward the load (inflow). When it is between +90° and +180° or between -90° and -180°, the power of that harmonic order is flowing away from the load (outflow).
KF
k2
Ik×2
⎝ ⎠⎛ ⎞
k 2=
50
∑
Ik2
k 2=
50
∑----------------------------------=
0°
90°
-90°
±180°
Harmonic Phase Angle
Voltage-Current Phase Difference
Outflow InflowLEAD (Lead)
LAG (Lag)
Voltage-CurrentPhase Angle
Appendix 6 Definitions
A 13
A
Unbalance Factor
• Balanced (Symmetrical) Three-Phase Voltage (Current) This term denotes three-phase alternating voltage or current when each phase has the same voltage (or current) and a phase difference of 120 degrees between phases.
• Unbalanced (Asymmetrical) Three-Phase Voltage (Current) Denotes three-phase alternating voltage or current when the voltages (or currents) of the phases are not the same, or when the phase difference between the phases is not 120 degrees.
Although the following descriptions refer to voltage, they apply to current as well.Degree of Unbalance in Three-Phase Alternating VoltageUsually called the voltage unbalance factor, this is the ratio of negative-phase volt-age to positive-phase voltage
Zero-Phase, Positive-Phase and Negative-Phase VoltageThe concept of zero-, positive- and negative-phase components in a three-phase alternating circuit applies the method of symmetrical coordinates (in which a circuit is thought of as divided into symmetrical components of zero phase, positive phase, and negative phase).• Zero-phase component: Voltage [V0] that is equal in each phase (the “0”
subscript denotes a zero-phase-sequence component).• Positive-phase component: Symmetrical three-phase voltage [V1] in which
the value for each phase is equal, and each of the phases is delayed (lags) by 120 degrees in the phase sequence a→b→c (the “1” subscript denotes a positive-phase-sequence component).
• Negative-phase component: Symmetrical three-phase voltage [V2] in which the value for each phase is equal, and each of the phases is delayed (lags) by 120 degrees in the phase sequence a→c→b (the “2” subscript denotes a negative-phase-sequence component).
If Va, Vb, and Vc are the three-phase alternating voltages, the zero-, positive- and negative-phase voltages are formulated as follows:
Here, “a” denotes the “vector operator”, which is a vector with magnitude 1 and phase angle of 120 degrees. Any given phase angle is advanced by 120 de-grees when multiplied by a, and by 240 degrees when multiplied by a2. When the three-phase alternating voltage is balanced, the zero- and negative-phase voltages are 0, so only the positive-phase voltage (which in this case is equal to the rms value of the three-phase alternating voltage) is displayed re-mains.
Voltage Unbalance Factor = Positive-Phase Voltage
Negative-Phase Voltagex 100 [%]
Zero-phase voltage V0 = Va+Vb+Vc
3
Positive-phase voltage V1 = Va+aVb+a2Vc
3
Negative-phase voltage V2 = Va+a2Vb+aVc
3
Appendix 6 Definitions
A 14
Displacement Power Factor (DPF)
The power factor (PF) is the ratio of active power to apparent power. An inductive load delays the current behind the voltage, and a capacitive load advances the cur-rent ahead of the voltage.
PF (Power Factor)
0 < PF < 1 Indicates reactive power is supplied but not consumed.PF = 1 All supplied power is consumed, and no reactive power is present.PF = -1 In-phase power, voltage and current are generated.-1 < PF < 0 Leading or lagging phase power and current are generated.In general, power factor is calculated using all rms values, so harmonic contents are included.
In addition to this power factor (PF), the displacement power factor (DPF) is the ratio of active power to apparent power. However, the displacement power factor (DPF) is defined as the cosine of the phase difference between the current and voltage of the fundamental waveform, and so does not include the harmonic volt-age or current components.
DPF (Displacement Power Factor)
0 < DPF < 1 The current phase leads or lags the voltage phase, and the load cir-cuit consumes power.
DPF = 1 Current and voltage are in phase, and the load circuit consumes power.
DPF = -1 The current and voltage have opposite phases, and the load circuit generates power.
-1 < DPF < 0 The current phase leads or lags the voltage phase, and the load cir-cuit generates power.
The displacement power factor is the same as the power factor employed in ordi-nary residential watt-hour meters, and is also the same as that calculated using the true reactive-power-measurement method employed by the Model 3197. If the displacement power factor is low (current lags voltage), a phase-advancing capacitor can be added to the power source side for correction. In general, displacement power factor is used when measuring the power source side, and power factor is used when measuring the equipment load side. In a typ-ical neighborhood, the power factor shows a larger value than the displacement power factor.
Demand Denotes the average power [kW] consumed during the demand period (typically 30 minutes), and is used for power company transactions.
Index
Index 1
dex
InNumerics
1P2W .................................................................831P3W .................................................................833197 Communicator ......................................1273197DataViewer .............................................1273P3W2M ............................................................843P3W3M ............................................................843P4W .................................................................853P4W2.5E .........................................................85
A
AC adapter ........................................................41
B
Backlight ............................................................74Basic setup ..................................................54, 56Battery pack ......................................................40Beep ...................................................................74
C
Charge ...............................................................40CHARGE LED ..................................................24Clamp sensor ................................. 38, 45, 60, A6Clock ............................................................32, 76Color ...................................................................73Computer .........................................................127Connection check .............................................86Contrast .............................................................75Crest factor is out of range .............................33CT ratio ..............................................................61Current flow direction arrow ............................82Current input terminals ....................................45Current range ....................................................60
D
Damage ...........................................................165Default .............................................................. A7Demand period .................................................65Display language ........................................47, 73Disposal
Battery pack ................................................168
E
Event list ................................................. 114, 116Event monitor ......................................... 114, 115EVENT Screen .............................................. 108
DETAILS ..................................................... 117INRUSH ...................................................... 122RMS WAVE ................................................ 121WAVEFORM .............................................. 120
F
Frequency ........................................................ 58
G
Ground ................................................................ 9Grounded outlet ............................................... 42
H
Harmonic calculation ...................................... 62Harmonics ........................................................ A8Help comment .................................................. 27
I
Input terminal ................................................... 37Input terminal labels ........................................ 37Inrush current ........................................... 69, 113Inspection ......................................................... 79Install ....................................................... 130, 132Instrument Installation ...................................... 7Internal memory ............................................... 32Interruption ......................................... 71, 111, A8Interval ........................................................ 64, A1
J
JRE .......................................................... 128, 130
K
KEY LOCK ................................................. 32, 51Keys do not operate ...................................... 166
M
Manual ...................................................... 68, 113
Index
Index
Index 2
Manufacturer's serial number ........................ 26
N
Nominal Line Voltage ...................................... 59
P
Partition ........................................... 34, 63, 89, 92OFF ............................................................... 89ON ................................................................. 92
Period of guaranteed accuracy ................... 142PF type .............................................................. 62Placement ........................................................... 7Power cord ....................................................... 19POWER LED ............................................. 23, 46Power range .....................................................A5Power supply indicators ................................. 32Power switch .............................................. 23, 24PT ratio ............................................................. 61
R
Range ................................................................A4Ranges of guaranteed accuracy ...................A4Ranges of usable measurements .................A4Repair .............................................................. 165REVIEW .......................................................... 123
S
Save screen image ......................................... 52SC ...................................................................... 33Self-Test ........................................................... 47Serial number ................................................... 76Single-Phase 2-Wire ....................................... 83Single-Phase 3-Wire ....................................... 83Stand ................................................................. 26Start ................................................................... 68Startup screen ........................................... 47, 80Stop ................................................................... 68Strap .................................................................. 38Strap hole ......................................................... 24System reset .................................................... 77SYSTEM screen .............................................. 57
MEASURE .................................................... 57REC&EVENT ......................................... 63, 67SYSTEM ....................................................... 72
T
Three-Phase 3-Wire ........................................ 84Three-Phase 4-Wire ........................................ 85TIME PLOT Screen
DEMAND .................................................... 106DIP/SWELL ................................................ 105
ENERGY ..................................................... 107RMS ............................................................. 103
Time start .......................................................... 66Timer ......................................................... 69, 113Transient ........................................................... 70Transient overvoltage .............................112, A8Two-wattmeter method .................................A10Typical settings ................................................ 54
U
Unbalance factor .............................................A9USB cable ....................................................... 127USB driver ...................................................... 134USB port ........................................................... 24
V
Version .............................................................. 72VIEW Screen .................................................... 96
Display hold .................................................. 96DMM ............................................................ 101HARMONICS ............................................... 99VECTOR ....................................................... 98
Voltage cords ................................................... 42Voltage dip ..........................................71, 111, A8Voltage input terminals ................................... 24Voltage inputs terminal ................................... 43Voltage swell ......................................71, 110, A8
W
WAVEFORM .................................................... 97Wiring ................................................................ 58
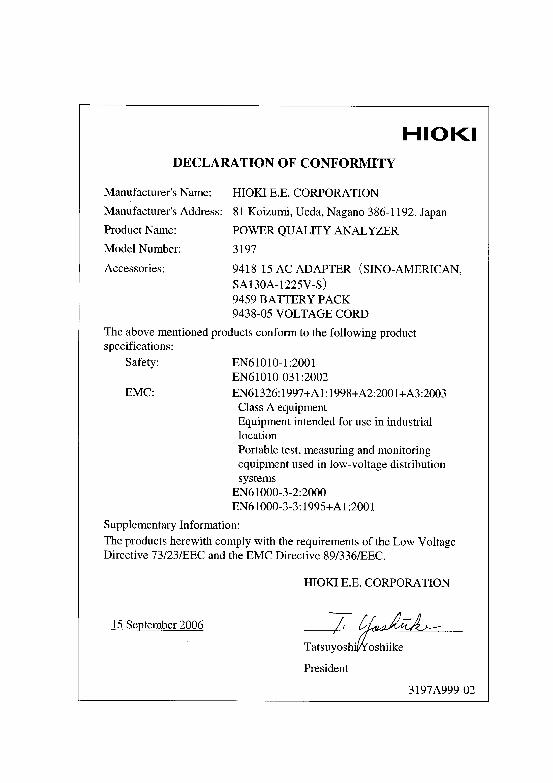

HIOKI 3197 POWER QUALITY ANALYZERInstruction Manual
Publication date: September 2006 Revised edition 1
Edited and published by HIOKI E.E. CORPORATION Technical Support Section
All inquiries to International Sales and Marketing Department 81 Koizumi, Ueda, Nagano, 386-1192, Japan TEL: +81-268-28-0562 / FAX: +81-268-28-0568 E-mail: [email protected] URL http://www.hioki.co.jp/
Printed in Japan 3197A981-01
• All reasonable care has been taken in the production of this manual, but if you find any points which are unclear or in error, please contact your supplier or the International Sales and Marketing Department at HIOKI headquarters.
• In the interests of product development, the contents of this manual are subject to revision without prior notice.
• Unauthorized reproduction or copying of this manual is prohib-ited.

HEAD OFFICE81 Koizumi, Ueda, Nagano 386-1192, JapanTEL +81-268-28-0562 / FAX +81-268-28-0568E-mail: [email protected] / URL http://www.hioki.co.jp/
HIOKI USA CORPORATION
6 Corporate Drive, Cranbury, NJ 08512, USATEL +1-609-409-9109 / FAX +1-609-409-91083197A981-01 06-09H
Printed on recycled paper
![2800mm 3 - city.shunan.lg.jp · -307 3.693 2500 2000 -3197 3.097 2 coo 2500 2_coo -3M97 -3.697 2 2000 -3197 3.697 2000 -3197 3.691 iTüJb] L 1.0mm\hr 1 2-10 022 soo BOO](https://img.pdfslide.us/doc/110x75/5f96ef5d3ba2c50c0a26a7f8/2800mm-3-city-307-3693-2500-2000-3197-3097-2-coo-2500-2coo-3m97-3697.jpg)