Embed Size (px)
Citation preview


SARVEKSHANA96th Issue
Vol. XXIX No. 3 & 4(December 2009)
Journal of
National Sample Survey Office
National Sample Survey Office
Ministry of Statistics & Programme ImplementationGovernment of India
New Delhi

Journal of National Sample Survey Office
Editorial Advisory BoardDr. U Sankar , ChairmanProf. T.J. RaoProf. A. K. AdhikariDr. Manoj Panda, Centre for Economic and Social Studies, Nizamiah Observatory Campus,Begumpet, Hyderabad 500016.
Shri G. C. Manna DDG CSO Economic Statistics Division (ESD), Jeewan Prakash Building, Kasturba GandhiMarg, New Delhi-110001.
Shri P. S. Bose, DDG Survey Design & Research Division NSSO, KolkataShri K. N. Unni, DDG, NSSO Data Processing Division, Ahmedabad.
Shri Satya Narain Singh, Deputy Director General, Coordination & Publication Division, NSSO,Sardar Patel Bhavan, Sansad Marg, New Delhi-110001 (Managing Editor)
Editorial Secretariat — Coordination and Publication Division, National Sample Survey Office, Sardar Patel Bhavan,New Delhi-110001.
Shri Ram Kripal, Deputy Director GeneralShri A. K. Chopra, Deputy DirectorShri Khedan Prasad, Assistant DirectorShri Vinod Sagar, Senior Statistical OfficerShri Mitre Lal, Senior Statistical Officer
Frequency and Subscription‘Sarvekshana’ is published twice a year. The subscription rate is Rs. 200 per copy . For subscription mail to: Controllerof Publications, Department of Publication, Civil Lines, Delhi-110054. Ph. 23819689, 23817823
Manuscript Submission‘Sarvekshana’ is aimed at encouraging research and analysis of NSS data to bring about a deeper understanding ofsocio-economic development of the country. For details about manuscript submission refer to back of cover page.
Opinions expressed in ‘Sarvekshana’ are those of the authors and not necessarily reflect the views or policies ofthe NSSO or the Government of India. NSSO is not responsible for the accuracy of the data and informationincluded in the technical papers nor does it accept any consequence for their use. Material in ‘Sarvekshana’ maybe freely quoted with appropriate acknowledgement and a copy of the publication sent to the Managing Editor.
Suggestions for improvement of the Journal may be addressed to:The Managing Editor, Sarvekshana,Coordination and Publication DivisionNational Sample Survey OfficeSardar Patel Bhawan, Sansad Marg, New Delhi. 110001
SarvekshanaVol. XXIX No 3&4Issue No. 96

CONTENTS
PART – I: TECHNICAL PAPERS
1. Half-year Survey on Morbidity and Health Care: Estimates and Implications 1-7
Ankush Agrawal
2. Milk Consumption Pattern in India 8-20
Jignesh Shah and TN Datta
3. Experiences of the Survey on Unorganized Manufacturing Sector, NSS 62nd Round, 2005-06 21-28
Dr. Rajiv Mehta, G. C. Manna, and T. K. Sanyal
4. A Note on Some Experiences during 63rd Round of Socio-Economic Survey on Service Sector 29-50Enterprises (Excluding Trade) CSO and NSSO
PART – II : SUMMARY AND MAJOR FINDINGS OF SURVEYS
5. An Integrated Summary of NSS Survey on Service Sector in India - 63rd Round 51-58(July 2006—June 2007)
Gayatri Bhattacharyya
PART – III : HIGHLIGHTS OF RECENT REPORTS RELEASED BY NSSO
6. Some Characteristics of Urban Slums — NSS 65th round, 2008-09 59-60
7. Housing Condition in India — NSS 65th round, 2008-09 61-64
8. Domestic Tourism in India — NSS 65th round, 2008-09 65-67
PART – IV : HINDI SECTION
9. Hindi Section ÉÊc. 1-8
PPage

Part-I
TECHNICAL PAPERS

SARVEKSHANA 1
Half-year Survey on Morbidity and Health Care: Estimates and Implications
Ankush AgrawalAbstract
This study examines how far the estimates from surveys based on varying periods are comparable and what wouldbe nature of bias, if any, in estimates from short duration surveys particularly when the items of enquiry are subject toseasonality. The above issues are illustrated using information from two recent rounds of the survey on ‘Morbidity andHealth Care’ conducted by the National Sample Survey Office (NSSO) of India. The study makes a case that theperiod for the surveys on such important aspects as morbidity and health care should be full-year.
JEL Codes: C81, C83, I10
Key words: morbidity, NSSO, survey data
Acknowledgements: This study is a part of author’s PhD thesis submitted to the Indira Gandhi Institute ofDevelopment Research (IGIDR), Mumbai. I am grateful to Dr. M H Suryanarayana for his continuous suggestions onmy work, to Dr. S. Chandrasekhar and Dr. Dipankar Coondoo for discussions, to anonymous referees and the EditorialAdvisory Board of the journal, and to IGIDR and Institute of Economic Growth for institutional support.

2 SARVEKSHANA
1. Introduction
The National Sample Survey Office (NSSO) of Indiaregularly conducts nationwide sample surveys on varioussocio-economic themes such as consumer expenditure,education, employment and unemployment, and morbidityand health care. The information from these surveys is usefulin academic research, macroeconomic planning and indeveloping policy guidelines.
Generally the NSS survey period is one full agriculturalyear for all the topics covered although the period has variedin terms of duration, say, from six months to 12 months andas between agricultural and calendar years. The surveyperiod and the time of year when the survey is initiated areimportant features of a survey. Studies quite often overlooksuch difference and compare estimates from the surveyswith differing periods and time of initiation. For instance,the Task Force set up by the Government in 1976 to assessthe minimum needs for estimation of poverty line decidedto choose the NSSO 28th round survey, conducted duringOctober 1973 to June 1974, as the reference year(Government of India 1979). Studies by Suryanarayana(2009a and 2009b) point out that for a monsoon dependentagricultural economy consumption estimates from the 28th
round may not be a correct choice as the survey was notspread over the full agricultural year. Since the consumptionof those at the bottom end of the distribution is more sensitiveto seasonal variations, the nine-month survey may not bean appropriate one for the above purpose.
Recently, a joint study by Ministry of Health and FamilyWelfare and the WHO country office compared theestimates of morbidity, untreated morbidity and the natureof treatment sought from the NSSO surveys on ‘Morbidityand Health Care’ for 52nd and 60th rounds (Government ofIndia 2007). The other recent studies that have made suchcomparisons include Dilip (2008), Mukherjee andKarmakar (2008), and Selvaraj and Karan (2009). Thesurvey duration of 52nd round was one full agricultural yearfrom July 1995 to June 1996 and that for the 60th roundwas half of the calendar year from January to June of 2004.
Because of differing survey periods however, thecomparisons made in the above studies may not beappropriate. Even use of ‘trend growth rate’ based on 52nd
and 60th rounds for arriving at the expenditure estimatesfor 2004-05 and the estimates of private health expenditurefor 2004 in the National Health Accounts (Government ofIndia 2009) may be subject to errors since the expenditureestimates for the two rounds may not be comparable.
Another factor which may cause non-comparability is‘reference period’ used for collecting data on specific itemsin the survey. For instance, Ghosh and Bhattacharya (1995)based on their analysis of different NSSO rounds onconsumption expenditure illustrate that the elasticities forclothing and several other items decline drastically whenthe reference period of ‘last month’ is replaced by ‘lastyear’. In case of surveys on ‘Morbidity and Health Care’,the NSSO collected information on the self-reportedmorbidity and untreated morbidity with the reference periodsof 30, 15, and 15 days during the 42nd, 52nd, and 60th
rounds respectively. Therefore, owing to the possibility ofbias from seasonal and short-run factors as the study byGhosh and Bhattacharya points out, the estimates from thethree surveys with different reference periods may not becompared. However, two studies, namely, Government ofIndia (1998, p. 22) and Selvaraj and Karan (2009, p. 57),have compared the estimates for untreated morbidity.
The purpose of this paper is to examine and illustratesome issues involving comparison of estimates from surveyswith different ‘survey periods’. This is illustrated withreference to health outcomes and health care using unit leveldata from NSSO. The NSSO survey estimates on healthoutcomes are available for five rounds since 1973-74,though unit record data are available only for three rounds,viz., 42nd round (July 1986 — June 1987), 52nd round,and 60th round. The survey period is a complete agriculturalyear for the first two rounds and only half of the calendaryear for the last one.
Any study examining inter-temporal comparability ofestimates from NSSO surveys with different coverage
Half-year Survey on Morbidity and Health Care: Estimates and Implications

SARVEKSHANA 3
periods is useful given scarcity of household level databasesin India. Furthermore since the NSSO sample isrepresentative at the sub-state level of agro-climatic zones,they are immensely useful for academic research and policy.As far as the household level information on health outcomesand health care is concerned, the NSSO surveys are amongthe few sources of data available for the Indian population.1Since NSSO is conducting these surveys for quite sometime, the surveys can be used to examine temporal as wellas socioeconomic profiles of health outcomes like morbidity.While an inter-temporal profile helps understandingeffectiveness of various government interventions aimed atimproving health outcomes, socioeconomic profile is usefulin assessing the health needs of various sections of thesociety and identifying the subgroups of Population thatare most vulnerable.
2. Half-year survey on morbidity and health care:pros and cons
Since considerable amount of resources are required,large-scale surveys entail huge cost in terms of money. Thereis a cost in terms of time too, in the form of delay in obtaininginformation and subsequent analysis to educe the informationneeded. Therefore, if a half-year survey can provide sameinformation and inferences as precisely as a full-year survey;it would always be preferred.
On the other side, if seasonality is associated with thesubjects of survey inquiry; estimates of populationcharacteristics from the half-year surveys may be subjectto errors.2 The same may also lead to misleading inferences.It is well known that time profile of diseases exhibit seasonalpatterns, and incidence of certain diseases is higher inparticular seasons than that during the others. Consequently,a survey based on six-month period would ignore the
diseases that tend to exist during the remaining six months.For instance, Malaria is most common in India duringJuly-November (Misra 2007, p. 235). Therefore, anysurvey omitting these months, such as the half-year surveyof January-June 2004, would underestimate morbidity dueto Malaria. Hence, getting a disease-specific morbidityprofile of the country’s population would simply beimpracticable with the half-year surveys.
If the interest lies in estimating occurrence of overallmorbidity, irrespective of the type of disease, the estimateobtained from even a half-year survey may be same as theone from a full-year survey. However, this would happenonly if the distribution of morbidity is such that the morbidityprofile during the six-month period included in the survey issimilar to the one in remaining six months.3 If the abovecondition does not hold, which is not very unlikely, using ahalf-year survey would provide incorrect estimate of theoverall morbidity in the country.
As only ill households avail hospitalization facility andincur expenditure on health care, estimates on these aspectsof health care too will be incorrect.4 For instance, the out-of-pocket expenditure incurred by the households oninpatient as well as outpatient care varies considerablyacross the diseases (Agrawal 2009). Hence, dependingupon the nature of disease that they have suffered duringthe remaining six months, the six-month survey wouldintroduce a non-random bias in estimates of the expenditureacross households. Thus, there is a possibility of derivingmisleading conclusions about households’ health seekingbehavior.
Another weakness of the half-year surveys vis-à-visfull-year surveys is reduced size of the sample.5 Since thereis a trade-off between sampling error and sample size, as
1 Besides NSSO, India Health Development Survey (IHDS), National Family Health Surveys (NFHSs) and World Health Survey (WHS) are otherlarge scale surveys, conducted at the level of households in the country, that provide information on health status of the population and health care.The IHDS, conducted during November 2004-October 2005, was organized jointly by the researchers from the University of Maryland and theNational Council of Applied Economics Research (NCAER), New Delhi. The NFHSs, administered by International Institute of PopulationSciences (IIPS), are intended towards collection of information pertaining to maternal and child care. The WHS is monitored by the World HealthOrganization and was conducted in association with IIPS and Ministry of Health and Family Welfare, Government of India. It is a partial surveycovering six major states in the country which comprise about 47 per cent of country’s population (See, Gumber and Berman 1997, for informationon other databases for India on morbidity and health care).
2 Murthy (1967, p. 491) observes, “For items of information subject to seasonal fluctuation, it is desirable to have one complete year as the surveyand reference periods...”
3 Note that this condition includes the situation in which each season of the year contributes equally in overall morbidity.4 As the reference period associated with hospitalization is one year, incidence of hospitalization may be comparable across the half and full year
surveys. The only difference is moving average would be taken over six months than the twelve. Discrepancy due to the difference in the two surveyperiods can be substantial if the recall lapse is dependent on season.
5 The sample size respectively for rural and urban areas was 71284 and 49658 in 1995-96, and 47302 and 26566 households in 2004.

4 SARVEKSHANA
indicated by an inverse relationship although not necessarilylinear between the two (Murthy 1967, pp. 11-12), thesampling error of the estimates obtained from such half-year surveys would be higher.6 Another undesirableconsequence of reduction in sample size is that it can makethe unbiased estimation of parameters at disaggregated level,say, for example agro-climatic zones, difficult. In otherwords, even though the sample is representative to produceunbiased estimate of population parameters at the nationallevel, it may not be so at the level of agro-climatic zones.7This issue is important since the NSSO surveys are perhapsthe only household level nationwide sample surveys thatpermit generation of reliable estimates at the sub-state levelof the agro-climatic zones.
3. Data and methodology
We test for presence of seasonality in self-reportedmorbidity from the 52nd and 60th rounds of surveys.Self-reported morbidity is defined as any deviation fromthe state of physical or mental well-being during thereference period excluding the cases of normal pregnancyand child birth.8 It may not necessarily result inhospitalization, confinement to bed or restriction of activity.The survey collects information on morbidity using tworeference periods: 15 days and one day preceding to thedate of survey. Since morbidity estimates from such surveysmeasure only the proportion of ailing persons (PAP) duringthe reference period and not the frequency of illness, theyare not the same as prevalence rate defined by the WorldHealth Organization (Government of India 1998). Hence,we prefer to use the terms PAP while referring to theestimates based on 15 days reference period and PPM(i.e. point prevalence of morbidity) while referring to theestimates based on one day reference period. For the sakeof robustness, we test for seasonality in both PAP and PPM.
Each round (survey period) is divided into sub-roundsof three months. The months of July-September, October-December, January-March, and April-June are the four sub-rounds for 1995-96; and January-March and April-Juneare the two sub-rounds for 2004. These sub-rounds can
be used to identify the seasons. Equal number of ‘first stageunits’ (FSUs) are allotted to each sub-round so that theentire sample is approximately equally distributed acrossthe sub-rounds (Government of India 1998 and 2006,pp.2-3). Once the number of FSUs to be allotted to eachsub-round is arrived at, a random selection of FSUs fromeach strata/ sub-stratum is made. Then, households / hamletgroup in each stratum are selected randomly.
Table 1 shows the PAP in major Indian states for1995-96 by sub-rounds. At the national level, both in ruraland urban areas, PAP is highest in the months ofJuly-September.9 It is necessary to test whether thedifference in morbidity is statistically significant across thesub-rounds. We use a logistic regression with seasonaldummies to test for the above purpose. The unit ofobservation for the analysis is individual and we also controlfor composition (age and sex) of the population.
4. Testing for seasonality
Let yi denotes the health status of ith individualassuming value ‘1’ if he/she is reported to be ill and ‘0’otherwise and j (j {1,2,3,4}) denotes the sub-round inwhich the individual was surveyed. Here, yi can be definedwith respect to both PAP and PPM. Also let Dij and Sibe dummy variables corresponding to the sub-round inwhich the individual ‘i’ was surveyed and his/ her gendersuch that
6 Sampling error is defined as the error originating from the use of sample observations to draw inferences about the population characteristics.7 For instance, Murthy demonstrates that in a certain case of simple random sampling without replacement, if estimates with five percent precision
are required for each tehsil with in a district total sample size needed is 434 villages as compared to a sample of only 214 villages for the district asa whole. While the sampling fraction in the latter case is 28 per cent, the same becomes 57 in the former (Murthy 1967, pp. 99-100).
8 Note that there is considerable skepticism about the reliability and usefulness of self-reported morbidity data in India (see for instance, Subramanianet al. 2009). However, this issue is not dealt with since it lies beyond the scope of this note.
9 Note however that the seasonal pattern of morbidity is not the same across the states.10 The age-groups are defined on the basis of classification being adopted by the Sample Registration System (SRS).
We also define a set of dummy variables Ageik( k {1,2,3,4,…,13} ) to indicate the age of the individuals.The individuals are classified into one of 13 age-groups:there are 12 age-groups each comprising five year intervalfor the ages 0-59 years and one for those above 60 yearsof age.10 The dummies corresponding to age and sexcontrol for population composition.
SARVEKSHANA 5
It is possible to express the outcome variable of theinterest, health status yi, as a function of observedcharacteristics (Xi) of individual i such that
If G is assumed to follow cumulative logistic distributionfunction (denoted by Ë in this study), the above equationgives us logit model. One can then define likelihood functionwhich can be maximized to obtain parameter estimates.
We estimate the following logit regression:
Here à and È are parameter vectors and â a scalarcorresponding to the dummy variables. Our base categoriesare first sub-round, female and the first age-group(0-4 years) respectively. Thus we estimate the aboveequation using three seasonal dummies, one gender dummyand 12 age-group dummies.
Table 2 shows odds ratios corresponding to theparameter of interest, Ã. In 1995-96, the odds of self-reported morbidity for an individual of given age-group andsex are significantly higher in the months of July toSeptember. This is true in both the sectors irrespective ofwhether we use PAP or PPM as a measure of illness. Thus,the morbidity varies with the sub-rounds/ season even aftercontrolling for the population composition. For 2004 too,we find that the morbidity is significantly higher in the monthsof April-June than that in January-March. In both the years,seasonality seems to be more pronounced in the urbansector.
5. Conclusion
This study examines comparability of estimates from ahalf-year survey to that from a survey with one full-year asthe survey-period. This is illustrated using information fromtwo recent rounds of the survey on ‘Morbidity and HealthCare’, namely, 60th and 52nd rounds. We used a logitregression to test for seasonality in the morbidity estimates.Results confirm presence of seasonality in morbidity. Theresults holds true in both rural and urban areas and with thetwo measures of morbidity, PAP and PPM, differing on thebasis of the reference period.
The above finding means that a six-month survey maynot produce correct estimates of morbidity in the country.
The estimates of expenditure incurred on seeking healthcare by the households too may be incorrect. Further, theestimates from the two rounds, 60th and 52nd, may not becomparable because of seasonality. At best, one can onlycompare the estimates from the corresponding sub-rounds.This casts doubt on findings of the studies, discussed in theintroduction section, that have compared the estimates fromtwo rounds without addressing this issue. The above findingalso means that since the morbidity in 1995-96 was thehighest in the months of July-September, the estimates fromhalf-year survey of 2004 might be an underestimate of thetrue morbidity in the country.
An important implication of this study is that health andmedical interventions should be targeted with reference toseasons. Given the extent of dependence of research andpolicy in India on the NSSO surveys, it is vital that thehousehold survey on such important aspects as morbidityand health care are carried out with one complete year asthe survey period.
References
Agrawal, Ankush. 2009. “Morbidity Profiles and Out-of-Pocket Expenses: Some Issues.” Paper presented atthe seminar Institutional Aspects of Pro-Poor Policy:Revising the Indian Poverty Line. Institute of Social andEconomic Change, Bangalore, December 15.
Dilip, T R. 2008. “Role of Private Hospitals in Kerala:An Exploration.” Working Paper 400. Centre forDevelopment Studies: Trivandrum. Available online athttp://www.cds.edu/
Ghose, Suchismita and Nikhilesh Bhattacharya. 1995.“Effect of Reference Period on Engel Elasticities of Clothingand Other Items: Further Results.” Sankhya: The IndianJournal of Statistics, Series B, 57:3, pp. 433-49.
Government of India. 1979. “Report of the Task Forceon Projections of Minimum Needs and EffectiveConsumption Demand.” Perspective Planning Division,Planning Commission: New Delhi.
Government of India. 1998. “Morbidity and Treatmentof Ailments: NSS Fifty-second Round July 1995 – June1996.” Report No. 441 (52/25.0/1), National SampleSurvey Organisation, Department of Statistics, Governmentof India.

6 SARVEKSHANA
Government of India. 2006. “Morbidity, Health Care,and Condition of the Aged: NSS 60th round.” ReportNo. 507 (60/25.0/1), National Sample SurveyOrganization, Ministry of Statistics and ProgrammeImplementation, Government of India.
Government of India. 2007. “Select Health Parameters:A Comparative Analysis across the National Sample SurveyOrganization (NSSO) 42, 52 and 60 Rounds.” Ministry ofHealth and Family Welfare, Government of India.
Government of India. 2009. “National Health AccountsIndia: 2004-05.” National Health Accounts Cell, Ministryof Health and Family Welfare, Government of India: NewDelhi. Available online at http://mohfw.nic.in/national_health_accounts_india.htm
Gumber, Anil and Peter Berman. 1997. “Measurementand Pattern of Morbidity and Utilization of Health CareServices.” Journal of Health and Population in DevelopingCountries, 1:1, pp. 16-43.
Misra, R P. 2007. Geography of health: a treatise ongeography of life and death in India. New Delhi: ConceptPublishing Company.
Mukherjee, Anit N and Krishanu Karmakar. 2008.“Untreated Morbidity and Demand for Healthcare in India:An Analysis of National Sample Survey Data.” Economicand Political Weekly, vol. 43, No 46, pp. 71-77.
Murthy, M.N. 1967. Sampling theory and Methods.Calcutta: Statistical Publishing Society.
Selvaraj, Sakthivel and Anup K Karan. 2009.“Deepening Health Insecurity in India: Evidence fromNational Sample Surveys since 1980s.” Economic andPolitical Weekly, vol. 44, No. 40, pp. 55-60.
Subramanian, S.V., Malavika A. Subramanyam,Sakthivel Selvaraj, and Ichiro Kawachi. 2009. “Are self-reports of health and morbidities in developing countriesmisleading? Evidence from India.” Social Science &Medicine, 68, pp.260-65.
Suryanarayana, M H. 2009a. “Pursuing inclusion inIndia: a story of specification errors.” Indian Growth andDevelopment Review, 2:2, pp. 155-72.
Suryanarayana, M.H. 2009b. “Nutritional Norms forPoverty: Issues and Implications.” Concept paper preparedfor the Expert Group to Review the Methodology forEstimation of Poverty. Planning Commission, Governmentof India.

SARVEKSHANA 7
Table 1: Morbidity (PAP per 1000 persons) by Seasons: 1995-96
State Rural Urban
Jul-Sept Oct-Dec Jan-Mar Apr-June All Jul-Sept Oct-Dec Jan-Mar Apr-June All
Andhra Pradesh 61.9 45.9 65.9 67.4 60.5 64.9 55.6 54.7 56.7 58.1
Assam 78.2 76.6 75.4 87.0 79.1 84.5 83.4 72.8 94.3 83.9
Bihar 33.4 31.3 30.9 41.0 34.2 34.9 33.3 50.5 41.1 39.7
Gujarat 44.7 44.6 49.1 42.4 45.3 42.4 32.4 36.0 30.9 35.5
Haryana 64.7 41.1 50.1 81.0 60.7 86.5 61.1 38.1 59.5 62.3
Karnataka 51.3 35.3 38.6 42.7 42.3 42.6 40.1 33.9 33.3 37.5
Kerala 131.3 107.1 112.9 111.0 115.8 114.5 56.7 87.4 88.6 86.8
Madhya Pradesh 42.9 30.3 52.9 36.7 40.4 40.0 33.6 36.1 39.3 37.0
Maharashtra 51.1 50.8 49.5 47.3 49.8 55.2 43.8 44.8 40.7 46.4
Orissa 66.7 67.3 60.7 49.9 61.8 70.4 59.2 63.0 53.5 61.6
Punjab 76.7 70.3 83.8 69.6 74.9 75.1 73.5 98.2 87.5 84.2
Rajasthan 24.2 37.8 22.1 21.2 26.6 31.6 34.1 34.8 23.6 30.9
Tamil Nadu 64.6 50.9 46.5 45.0 51.7 85.4 56.2 47.0 42.9 57.6
Uttar Pradesh 67.3 54.3 55.3 66.1 60.6 68.3 65.4 62.7 89.1 71.2
West Bengal 73.1 58.6 63.4 66.4 65.4 84.9 58.1 55.2 58.1 63.9
India 58.3 49.5 53.3 55.4 54.1 61.8 49.4 49.6 51.5 53.2
Source: Estimates based on NSSO 52nd round unit level data.
Table 2: Seasonality in Morbidity (1995-96 and 2004): Odds Ratio
Months/ 1995-96 2004Season Rural Urban Rural Urban
(1) (2) (1) (2) (1) (2) (1) (2)
Jul-Sept B B B B
Oct-Dec 0.84* 0.84* 0.79* 0.81*
Jan-Mar 0.93* 0.91* 0.80* 0.83* B B B B
Apr-June 0.96 0.94 0.83* 0.89* 0.91* 0.89* 0.79* 0.84*
Notes: (i) Estimates in columns (1) correspond to PAP (15 days reference period) and those in (2) to PPM (one dayreference period), (ii) Coefficients marked * are significant at the five percent level, (iii) B indicates base category;and (iv) each regression includes controls for age-sex composition of the respective population, which are notreported here.

8 SARVEKSHANA
MILK CONSUMPTION PATTERN IN INDIA
Jignesh Shah and T.N. Datta
Abstract
Changes in the society are visible all around. The analysis of a single commodity like milk in the consumption basketis no exception. Though there are evidences to show how cereal consumption has been declining over time, milkconsumption continues to be on the rise along with increase in number of milk consuming people – both these factorsdrive growth in milk demand in household segment. Nearly 14 million people turn up as new milk consumers every year,which is the prime driver of aggregate demand for milk. The paper argues that while household demand for milkcontinues to be buoyant, it is conjectured that milk demand in non-household segment in liquid or product form would beeven brighter like in cereal based foods.

SARVEKSHANA 9
1. Background
The Consumer Expenditure Surveys (CES) of NationalSample Survey Office (NSSO) are the most important andregular source of information of consumer surveys ofdifferent food and non-food items in India. Since 1950until 28th Round (1973-74), the NSSO collected data onconsumer expenditure every year. However, after 26th
Round (1971-72) of the survey, the Governing council ofNSSO decided to collect information on consumerexpenditure and employment- unemployment together froma large sample survey once in five years — known as“quinquennial rounds”. These surveys are conducted overa fairly large sample size drawn from rural and urban areasand covering most of the States and Union Territories (UTs).There is yet another novelty in the compilations of the report.It contains information on absolute data in terms ofconsumption volume or quantity on per capita monthly basisand their corresponding value of expenditure. Therefore,the observations from these reports provide a canvas toexamine the phenomenon from longitudinal as well as crosssectional perspectives.
The data collected in consumer expenditure surveysreferred to more than 300 items comprising cereals,vegetables, fruits, pulses, milk & milk products, edible oil,meat, egg and fish, salt, sugar, spices, beverages, pan,tobacco and intoxicants in a very detailed manner. Dataon clothing, fuel and light, footwear, medical expenses,education, entertainment, goods & personal care, sundryarticles, durable goods, conveyance and othermiscellaneous goods and services is also collected. Thisinformation is scattered over many rounds of survey reportsand not analyzed in a way facilitating understanding of thechanges in milk consumption in rural and urban areas.
There are ample reasons that provided motivation togo for such an in-depth analysis. First, with general inflationcontinued high at over 8 percent and food inflation being ataround 17 percent – a phenomenon, which has never beenobserved in the food sector. Therefore, it is pertinent thatthe components of the food basket be analyzed critically tounderstand its implications on consumption behaviour witha specific focus on milk. Second, the milk demand in Indiaby 2020 – estimated by various authors – is in the range of160-290 million tonnes with a growth rate of 4-8 percentper annum. With a moderate growth in GDP of 7 percent,the milk demand is estimated at about 230 million tonnes
by 2020 (Shah, 2010), implying a growth of about 6percent per annum in milk demand. The growth in milkdemand is higher than the growth in milk production, whichis about 4 percent per annum. Thus, the demand-pull isstrong - leading to certain changes in consumption behaviorof milk. This apart, it is important to note that the comparisonof per capita consumption from CES data of NSSOprovides a generalized trend which could be refined further,provided the consumption estimates are adjusted fordifferent milk consuming population like age, sex, foodhabits, religion, etc. While it is recognized that theconsumption data needs to be examined from the aboveattributes of milk consuming populations, the presentstructure of published reports of NSSO based on CESrounds preclude us from providing such analysis. Presentanalysis provides comprehensive understanding of the inter-temporal changes in milk consumption drawing inferencesfrom different rounds of consumer surveys on a singlecanvas.
It may be pointed out that milk expenditure accountsfor about 18-19 percent of total food expenditure inconsumption basket, second most important commodityfor consumption in household food and also assumes highsocial and cultural significance given the non-vegetarian foodconsumption in India. Moreover, there are hardly anycommodity specific historical analyses for evaluation andunderstanding of the trend — most of which revolve roundcereal, non-cereal, animal fat, protein specific generalizedanalyses. For instance, seminal works of Sen (2001)highlights how commodity specific changes are apparentfrom the successive rounds of consumer expenditure surveysand while there are plethora of academic and researchmaterials dealing with poverty measurement andexpenditure disparity in the society. All these singularly aswell as collectively provide sufficient insights into themovements of consumables in the society and thedevelopment institutions and public policy makers drawsufficient wisdoms. The corporate and commercial entitieshowever position and reposition their products into themarkets subject to the observations made through variouspublications of the national consumer expenditure surveyreports. Given this bandwidth of diversity in the utility anduse of precious data put out through NSSO surveys, itmight appear significant that a commodity like milkhandpicked for in-depth analysis. Nonetheless, the papermakes a modest effort to provide greater clarity and

10 SARVEKSHANA
incisiveness into the milk sector and the lessons thereofcould be utilized for other commodity profile on similar lines.
2. Data
For present analysis, data from different rounds of CEShas been taken. Apart from quinquennial rounds, NSS alsopublishes annual rounds of CES with thin sample. However,the annual rounds of CES do not report absoluteconsumption data and therefore only quinquennial roundsviz., 43rd (1987-88), 50th (1993-94), 55th (1999-2000)and 61st (2004-05) rounds were used for analysis.
The scope in NSS inquiry is limited to householdconsumption. By default, out of home or institutionalconsumption is not reported. For milk, following definitionis contained in the report of CES 2004-05; “Milk productsinclude ghee, butter, curd, etc. Milk used for homepreparation of sweetmeats, etc., is also accounted here.This category also includes those baby foods of which theprincipal constituent is milk. Further, milk (liquid) includesice-cream of which the major component is milk. Ice withsyrup but without milk sold under the name of ice-cream isnot included in this category”.
3. Consumer expenditure basket
Consumption basket refers to of a basket ofcommodities that are consumed in the society on regularbasis as necessities. This basket alters with change in foodhabits, level of income and life styles, urbanization,affordability and accessibility. With increase in level ofincome and improvement in life styles, the consumptionbasket tends to be more diversified—the traditional cerealconsumption makes way for non-cereal based food andother items of consumption, mostly non-food items.Economists often relate this phenomenon with the operationof Engel’s law of Demand. This has relevance in the changesin the Indian food consumption basket as has been foundthrough the analysis of last 30 years.
During the 1980s, nationally, some 63 percent of thetotal consumer expenditure in the rural areas used to bedevoted towards food expenditure, and non-food used toshare about 37 percent of the expenditure (Table 1). Overthe years, this non-food component gained prominence,and currently placed at 45 percent – a significant shift in theconsumer expenditure pattern, perfectly in line with Engel’slaw of Demand. It can be contented that with changes in
affordability and higher disposable incomes, consumers tendto spend more on non-food especially on consumerdurables, clothing, footwear, etc items. In the urban areasalso, what was 45 percent as non-food expenditure in the1980s, stands at 57 percent in the 2000s – a significantshift away from food expenditure.
As against the distribution of total expenditure, it isinteresting to check the trends in distribution of total foodexpenditure. It may be seen that among the food items, theshare of milk & milk products; egg, fish & meat; vegetables;fruits and beverages has increased over years. The shareof milk expenditure to total food expenditure is the highestout of these commodities.
It may also be noted that food expenditure pattern,shown above, does not take into account the out of homeconsumption, which is in cooked and semi processed form.Thus along with the rise in the consumption of processedfood and food/ meals taken outside home, which is notwithin the scope of NSS data, remained unreported. Thisis not small quantity, as eating out and take away mealshave been rising rapidly – the business of restaurant andhotel shows more than 6 percent growth on per capita basis(Chand, 2010). Thus, the falling proportion of expenditureon food items may not solely be attributed to rise in non-food expenditure. The increasing incidence of out-of-homeconsumption has to be factored in. However, it isconjectured that the share of out-of-home consumption hasbeen increasing over a period of time, but there is no directevidence to support this contention.
While consumer expenditure on food drops over time,relative expenditure on milk continues to hold water, bothin urban as well in rural areas, though marginal reduction inrelative expenditure on milk in urban areas cannot be lostsight of. Significant point however is that in rural areas thescope of home away expenditure on milk is limited whichperhaps could explain the marginal difference in relativeexpenditure trends between rural and urban areas. A similartrend is discernible for eggs, fish and meat expenditure.Delgado et al (1999), Delgado (2005), FAO (2009), haveobserved that livestock continues to gain prominence inthe consumption basket of the people in the Asian economiescompared to developed economies. The presentobservations of relative expenditure trends in milk onlyvalidates some of the preceding observations made byvarious researchers.

SARVEKSHANA 11
Table 1: % Distribution of total consumer and total food expenditure*: All India
RURAL URBAN
Item 43rd 50th 55th 61st Item 43rd 50th 55th 61st
Cereals 26.1 24.2 22.2 18.0 Cereals 14.8 14 12.3 10.1(41.0) (38.3) (37.3) (32.7) (26.5) (25.7) (25.7) (23.7)
Gram 0.2 0.2 0.1 0.1 Gram 0.2 0.2 0.1 0.1(0.4) (0.3) (0.2) (0.2) (0.3) (0.3) (0.2) (0.2)
Cereal Substitutes 0.1 0.1 0.1 0.1 Cereal Substitutes 0.1 0.1 0.0 0.0(0.2) (0.2) (0.1) (0.1) (0.1) (0.1) (0.1) (0.1)
Pulses & pulse products 4.0 3.8 3.8 3.1 Pulses & pulse products 3.4 3/0 2.8 2.1(6.2) (6.0) (6.4) (5.6) (6.0) (5.6) (5.9) (5.0)
Milk & milk products 8.6 9.5 8.8 8.5 Milk & milk products 9.5 9.8 8.7 7.9(13.5) (15.0) (14.7) (15.4) (17.1) (17.9) (18.1) (18.6)
Edible oil 5.6 4.4 3.7 4.6 Edible oil 5.3 4.4 3.1 3.5(8.8) (7.0) (6.3) (8.4) (9.5) (8.0) (6.5) (8.1)
Egg, fish and meat 3.2 3.3 3.3 3.3 Egg, fish and meat 3.5 3.4 3.1 2.7(5.1) (5.3) (5.6) (6.0) (6.3) (6.2) (6.5) (6.4)
Vegetables 5.2 6.0 6.2 6.1 Vegetables 5.3 5.5 5.1 4.5(8.2) (9.6) (10.4) (11.1) (9.4) (10) (10.7) (10.5)
Fruits (fresh & dry) 1.6 1.7 1.7 1.9 Fruits (fresh & dry) 2.5 2.7 2.4 2.3(2.5) (2.8) (2.9) (3.4) (4.5) (4.9) (5.0) (5.4)
Sugar 2.9 3.0 2.4 2.4 Sugar 2.3 2.4 1.6 1.5(4.5) (4.8) (4) (4.3) (4.2) (4.4) (3.4) (3.5)
Salt 0.2 0.2 0.2 0.2 Salt 0.1 0.1 0.2 0.1(0.3) (0.3) (0.4) (0.4) (0.2) (0.3) (0.3) (0.3)
Spices 2.7 2.5 2.7 2.3 Spices 2.2 1.9 2.1 1.5(4.2) (3.9) (4.6) (4.2) (3.9) (3.5) (4.3) (3.6)
Beverages etc 3.9 4.2 4.2 4.5 Beverages etc 6.7 7.2 6.3 6.2(6.1) (6.6) (7.1) (8.2) (12.0) (13.2) (13.2) (14.6)
Total Food 63.8 63.2 59.4 55 Total Food 55.9 54.7 48.1 42.5(100) (100) (100) (100) (100) (100) (100) (100)
Total Non-food 36.2 36.8 40.6 45.0 Total Non-food 44.1 45.3 51.9 57.5
Total Expenditure 100 100 100 100 Total Expenditure 100 100 100 100
* Figures in parenthesis indicates percentage to total food expenditure

12 SARVEKSHANA
In view of changing trend as witnessed in consumerexpenditure basket, it would be interesting to take a stockof state-wise situation. The following section deals with thestate-wise milk consumption trend in major states of thecountry. Here, it may be noted that the states for whichconsistent data is available across all four rounds of CESwere considered for analyses.
4. Per capita consumption of liquid milk in householdsegment (Base: total population)
At the aggregate level, per capita monthly milk (liquid)consumption has increased from a level of 3.48 liters in1987-88 to 4.18 liters in 2004-05. During this period, thesame has increased from 4.33 liters to 5.11 liters in urbanareas and 3.23 liters to 3.87 liters in rural areas. The urbanconsumption of milk in absolute volume has been risingover the years for over a decade beginning 1987-88. Therural consumption, on the other hand, though increasedduring 1987-88 and 1993-94, showed a decline in
1999-00 over 1993-94 and 2004-05 over 1999-2000.The pooled data (rural + urban) of milk consumption hasalmost stagnated at the country level. In the states of AndhraPradesh, Assam, Bihar, Karnataka, Kerala, MadhyaPradesh, Maharashtra, Orissa, Tamil Nadu and WestBengal, the average per capita consumption of milk is lessthan the country average in both rural and urban areas acrossall the rounds.
At the aggregate level, during 1999-2000 to 2004-05,growth in per capita consumption of milk declined inGujarat, Haryana, Jammu & Kashmir, Karnataka, Kerala,Maharashtra and Rajasthan in the household segment.However, this finding could logically triggers attentiontowards looking up of information in non-household segmentfor a satisfactory explanation. But lack of data in this regardprohibits any direct interpretation. The interpretation of NSSdata could suggest that perhaps out of home consumptionof milk is on the rise.
Table 2: Monthly per capita consumption of liquid milk (ltrs) (base: total population)
State RURAL URBAN RURAL+URBAN
43rd 50th 55th 61st 43rd 50th 55th 61st 43rd 50th 55th 61st
Andhra Pradesh 2.32 2.62 2.87 3.05 3.36 3.92 4.40 4.38 2.56 2.96 3.31 3.39
Assam 1.33 1.21 1.11 1.31 2.02 1.66 2.14 2.00 1.39 1.26 1.21 1.37
Bihar 1.57 2.39 2.41 2.98 2.53 3.49 3.40 3.81 1.67 2.50 2.52 3.06
Gujarat 4.55 5.07 5.42 4.98 5.48 6.21 6.58 6.70 4.81 5.44 5.79 5.57
Haryana 11.49 13.82 13.88 13.13 8.16 9.10 9.03 9.59 10.73 12.60 12.55 12.18
Himachal Pradesh 7.10 7.52 7.87 8.72 7.91 8.95 10.08 8.17 7.15 7.64 8.07 8.67
J&K 4.89 7.26 9.53 8.02 6.34 9.11 8.02 8.31 5.14 7.61 9.22 8.09
Karnataka 2.76 2.88 3.45 3.30 3.86 4.42 5.07 4.87 3.07 3.32 4.63 3.78
Kerala 2.16 2.61 2.97 2.82 3.07 3.27 3.49 3.66 2.31 2.77 3.11 3.02
Madhya Pradesh 2.33 2.76 2.71 3.41 4.17 4.08 4.33 4.33 2.74 3.10 3.10 3.63
Maharashtra 2.24 2.50 2.66 2.73 4.27 4.72 4.79 4.39 2.90 3.33 3.48 3.40
Orissa 0.69 0.77 0.64 0.78 2.40 2.20 1.97 2.25 0.90 0.95 0.86 0.98
Punjab 12.91 14.33 11.67 11.55 8.92 9.70 9.73 10.57 11.86 12.99 11.06 11.23
Rajasthan 6.92 10.41 9.62 9.50 6.11 7.53 7.72 7.38 6.75 9.75 9.20 9.03
Tamil Nadu 1.56 2.12 2.39 2.48 3.30 3.80 4.77 4.82 2.17 2.71 3.22 3.38
Uttar Pradesh 4.32 5.44 4.52 4.64 4.81 5.63 5.27 5.10 4.41 5.48 4.67 4.73
West Bengal 1.30 1.54 1.31 1.45 2.69 2.73 2.63 2.59 1.65 1.82 1.59 1.73
All India 3.23 3.94 3.79 3.87 4.33 4.89 5.10 5.11 3.48 4.18 4.12 4.18

SARVEKSHANA 13
Table 3: % Change in monthly per capita consumption of milk over previous round (base: total population)
State RURAL URBAN RURAL+URBAN
50th over 55th over 61st over 50th over 55th over 61st over 50th over 55th over 61st over 43rd 40th 55th 43th 40th 55th 43th 40th 55th
Andhra Pradesh 12.9 9.5 6.3 16.7 12.2 -0.6 15.5 12.0 2.3
Assam -9.0 -8.3 18.0 -17.8 28.9 -6.6 -9.4 -3.3 13.1
Bihar 52.2 0.8 23.6 37.9 -2.6 12.2 50.0 0.7 21.2
Gujarat 11.4 6.9 -8.2 13.3 6.0 1.9 13.1 6.4 -3.8
Haryana 20.3 0.4 -5.4 11.5 -0.8 6.1 17.4 -0.4 -2.9
Himachal Pradesh 5.9 4.7 10.8 13.1 12.6 -19.0 6.8 5.6 7.5
J&K 48.5 31.3 -15.9 43.7 -12.0 3.7 48.0 21.2 -12.3
Karnataka 4.3 19.8 -4.4 14.5 14.7 -4.0 8.1 39.5 -18.4
Kerala 20.8 13.8 -5.0 6.5 6.7 4.8 19.7 12.1 -2.9
Madhya Pradesh 18.5 -1.8 25.9 -2.2 6.1 -0.1 13.1 0.2 16.8
Maharashtra 11.6 6.4 2.5 10.5 1.5 -8.3 14.6 4.6 -2.4
Orissa 11.6 -16.9 21.7 -8.3 -10.5 14.0 6.2 -9.9 14.2
Punjab 11.0 -18.6 -1.1 8.7 0.3 8.7 9.5 -14.8 1.5
Rajasthan 50.4 -7.6 -1.3 23.2 2.5 -4.4 44.4 -5.6 -1.9
Tamil Nadu 35.9 12.7 3.8 15.2 25.5 1.1 24.7 18.7 5.0
Uttar Pradesh 25.9 -16.9 2.6 17.0 -6.4 -3.2 24.2 -14.7 1.3
West Bengal 18.5 -14.9 10.9 1.5 -3.7 -1.5 10.1 -12.4 8.7
All India 22.0 -3.8 2.0 12.9 4.3 0.1 20.0 -1.3 1.5
5. Incidence of milk consumption
It is pertinent to note that NSSO data throw sufficientlight on to the incidence of milk consumption among thehouseholds. If incidence of consumption rises, it wouldbe construed as enhancement of consumption baseacross wider population. The NSSO data suggest thatincidence of milk consumption has been rising over theyears uniformly across urban and rural areas. Thoughthe proportion of milk consuming households is higherin urban areas, the absolute growth in milk consuminghouseholds was higher in rural areas. In 2004-05, about71 percent households reported milk consumption inrural areas – an increase of almost 10 percentage pointsfrom 1987-88. In urban areas, the proportion was 85percent, increased by 6 percentage points during
1987-88 to 2004-05. At the aggregated level, theincidence of milk consumption rose by 9-percentagepoint during 1987-88 to 2004-05.
The states of Gujarat, Haryana, Jammu & Kashmir,Karnataka, Punjab and Rajasthan have above 90 percentmilk consumers. As far as growth in milk consuminghouseholds is concerned, these states have almost attainedan optimum level and scope for incremental rise might beconstrained. On the other hand, from 1987-88 onwards,absolute increase in milk consumers was substantial in Bihar,Madhya Pradesh, Orissa and West Bengal, both in ruraland urban areas. One of the reasons of such a high growthwould be that these states have started with a lower baseand they still have scopes to expand their milk consumerbase further.

14 SARVEKSHANA
Table 4: Households reporting milk consumption (per 1000 households)
State RURAL URBAN RURAL+URBAN
43rd 50th 55th 61st 43rd 50th 55th 61st 43rd 50th 55th 61st
Andhra Pradesh 629 712 772 775 790 824 844 842 667 740 792 792Assam 553 524 462 499 494 471 493 504 547 518 466 500Bihar 399 522 524 701 537 623 681 813 413 533 542 712Gujarat 953 938 929 917 960 960 941 942 955 946 933 926Haryana 967 965 985 991 924 946 931 956 955 959 968 981Himachal Pradesh 894 881 906 926 790 880 753 866 885 881 887 918J&K 949 955 959 988 946 934 975 985 948 951 962 987Karnataka 823 862 874 906 826 886 896 889 825 869 881 900Kerala 632 674 717 720 706 750 748 765 645 693 725 731Madhya Pradesh 613 606 607 756 853 840 845 934 668 667 667 799Maharashtra 823 830 802 820 887 889 891 911 845 853 837 858Orissa 259 249 214 256 438 442 402 502 284 275 246 292Punjab 972 986 989 993 964 958 953 943 970 977 976 975Rajasthan 841 948 961 982 959 959 971 973 866 951 963 980Tamil Nadu 430 523 601 633 707 680 797 817 526 580 671 705Uttar Pradesh 643 715 732 784 867 878 902 924 687 747 769 814West Bengal 397 437 423 479 555 539 586 638 441 465 464 523
All India 619 663 678 713 789 800 829 850 660 699 719 751
Table 5: % Change in incidence of milk consuming households over previous round
State RURAL URBAN RURAL+URBAN
50th over 55th over 61st over 50th over 55th over 61st over 50th over 55th over 61st over 43rd 40th 55th 43ND 40th 55th 43nd 40th 55th
Andhra Pradesh 13 8 0 4 2 0 11 7 0Assam -5 -12 8 -5 5 2 -5 -10 7Bihar 31 0 34 16 9 19 29 2 31Gujarat -2 -1 -1 0 -2 0 -1 -1 -1Haryana 0 2 1 2 -2 3 0 1 1Himachal Pradesh -1 3 2 11 -14 15 0 1 4J&K 1 0 3 -1 4 1 0 1 3Karnataka 5 1 4 7 1 -1 5 1 2Kerala 7 6 0 6 0 2 7 5 1Madhya Pradesh -1 0 25 -2 1 11 0 0 20Maharashtra 1 -3 2 0 0 2 1 -2 2Orissa -4 -14 20 1 -9 25 -3 -11 18Punjab 1 0 0 -1 -1 -1 1 0 0Rajasthan 13 1 2 0 1 0 10 1 2Tamil Nadu 22 15 5 -4 17 3 10 16 5Uttar Pradesh 11 2 7 1 3 2 9 3 6West Bengal 10 -3 13 -3 9 9 5 0 13
All India 7 2 5 1 4 3 6 3 4

SARVEKSHANA 15
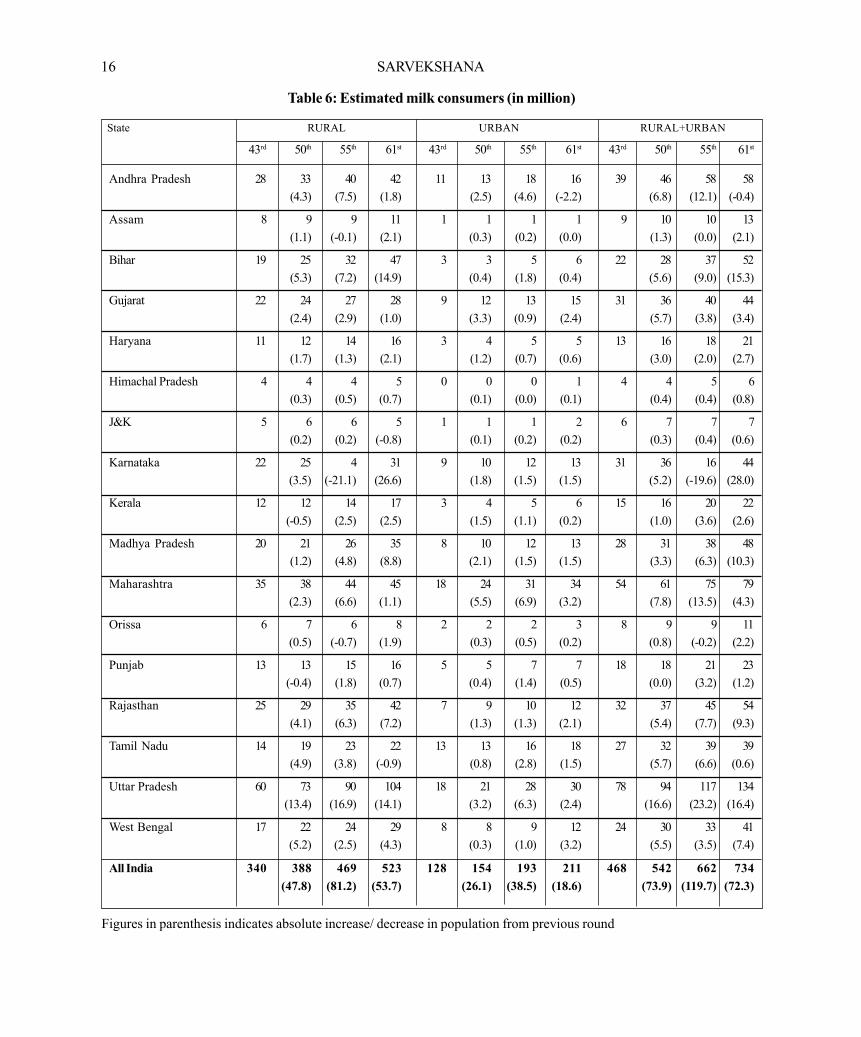
6. Milk consuming population
Since the incidence of milk consuming households ison rise, it is important to understand its implications onthe demand for the commodity given the fact that Indiahas a huge mass of population to feed. The increasingnumber of total milk consumers in absolute term and itsimplications are vital in understanding the changingscenario of milk demand. At all India level, the total milkconsumers has increased from 468 million to 734 million,witnessing an increase of 57 percent during 1987-88 to2004-05. There were 266 million new consumers addedinto the fold. The additional consumers is logically a neteffect of – additional population due to either populationgrowth plus an inclusion of a segment that startedconsuming milk and possibly elimination of a group ofpeople who have stopped consuming milk. Of these newmilk consumers, about 70 percent have been added inrural areas.
If we check incremental consumers during twoquinquennial rounds, about 12 million consumers increasedannually during 1987-88 to 1993-94, 20 million annuallyincreased during 1993-94 to 1999-2000 and between lasttwo quinquennial rounds, the increase in milk consumerswas 14 million per year.
If we look at the increase in milk consumer numbers atthe country level both in rural and urban areas individually,it can be seen that the incremental number in rural areas isalmost double than that of in urban areas. While in ruralareas, the majority of the new milk consumers belonged tothe states of Bihar, Karnataka, Madhya Pradesh, Rajasthan,Uttar Pradesh and West Bengal, most of the incrementalnumbers in urban areas were from Gujarat, Karnataka,Madhya Pradesh, Rajasthan, Tamil Nadu, Uttar Pradeshand West Bengal. The National Commission on PopulationProjection (2001-2026), GoI has projected higher growthin urban population in these states, corroborating the rapidlyincreasing urban milk consumers in these states.
16 SARVEKSHANA
Table 6: Estimated milk consumers (in million)
State RURAL URBAN RURAL+URBAN
43rd 50th 55th 61st 43rd 50th 55th 61st 43rd 50th 55th 61st
Andhra Pradesh 28 33 40 42 11 13 18 16 39 46 58 58(4.3) (7.5) (1.8) (2.5) (4.6) (-2.2) (6.8) (12.1) (-0.4)
Assam 8 9 9 11 1 1 1 1 9 10 10 13(1.1) (-0.1) (2.1) (0.3) (0.2) (0.0) (1.3) (0.0) (2.1)
Bihar 19 25 32 47 3 3 5 6 22 28 37 52(5.3) (7.2) (14.9) (0.4) (1.8) (0.4) (5.6) (9.0) (15.3)
Gujarat 22 24 27 28 9 12 13 15 31 36 40 44(2.4) (2.9) (1.0) (3.3) (0.9) (2.4) (5.7) (3.8) (3.4)
Haryana 11 12 14 16 3 4 5 5 13 16 18 21(1.7) (1.3) (2.1) (1.2) (0.7) (0.6) (3.0) (2.0) (2.7)
Himachal Pradesh 4 4 4 5 0 0 0 1 4 4 5 6(0.3) (0.5) (0.7) (0.1) (0.0) (0.1) (0.4) (0.4) (0.8)
J&K 5 6 6 5 1 1 1 2 6 7 7 7(0.2) (0.2) (-0.8) (0.1) (0.2) (0.2) (0.3) (0.4) (0.6)
Karnataka 22 25 4 31 9 10 12 13 31 36 16 44 (3.5) (-21.1) (26.6) (1.8) (1.5) (1.5) (5.2) (-19.6) (28.0)
Kerala 12 12 14 17 3 4 5 6 15 16 20 22(-0.5) (2.5) (2.5) (1.5) (1.1) (0.2) (1.0) (3.6) (2.6)
Madhya Pradesh 20 21 26 35 8 10 12 13 28 31 38 48(1.2) (4.8) (8.8) (2.1) (1.5) (1.5) (3.3) (6.3) (10.3)
Maharashtra 35 38 44 45 18 24 31 34 54 61 75 79 (2.3) (6.6) (1.1) (5.5) (6.9) (3.2) (7.8) (13.5) (4.3)
Orissa 6 7 6 8 2 2 2 3 8 9 9 11 (0.5) (-0.7) (1.9) (0.3) (0.5) (0.2) (0.8) (-0.2) (2.2)
Punjab 13 13 15 16 5 5 7 7 18 18 21 23(-0.4) (1.8) (0.7) (0.4) (1.4) (0.5) (0.0) (3.2) (1.2)
Rajasthan 25 29 35 42 7 9 10 12 32 37 45 54(4.1) (6.3) (7.2) (1.3) (1.3) (2.1) (5.4) (7.7) (9.3)
Tamil Nadu 14 19 23 22 13 13 16 18 27 32 39 39(4.9) (3.8) (-0.9) (0.8) (2.8) (1.5) (5.7) (6.6) (0.6)
Uttar Pradesh 60 73 90 104 18 21 28 30 78 94 117 134(13.4) (16.9) (14.1) (3.2) (6.3) (2.4) (16.6) (23.2) (16.4)
West Bengal 17 22 24 29 8 8 9 12 24 30 33 41 (5.2) (2.5) (4.3) (0.3) (1.0) (3.2) (5.5) (3.5) (7.4)
All India 340 388 469 523 128 154 193 211 468 542 662 734 (47.8) (81.2) (53.7) (26.1) (38.5) (18.6) (73.9) (119.7) (72.3)
Figures in parenthesis indicates absolute increase/ decrease in population from previous round
SARVEKSHANA 17
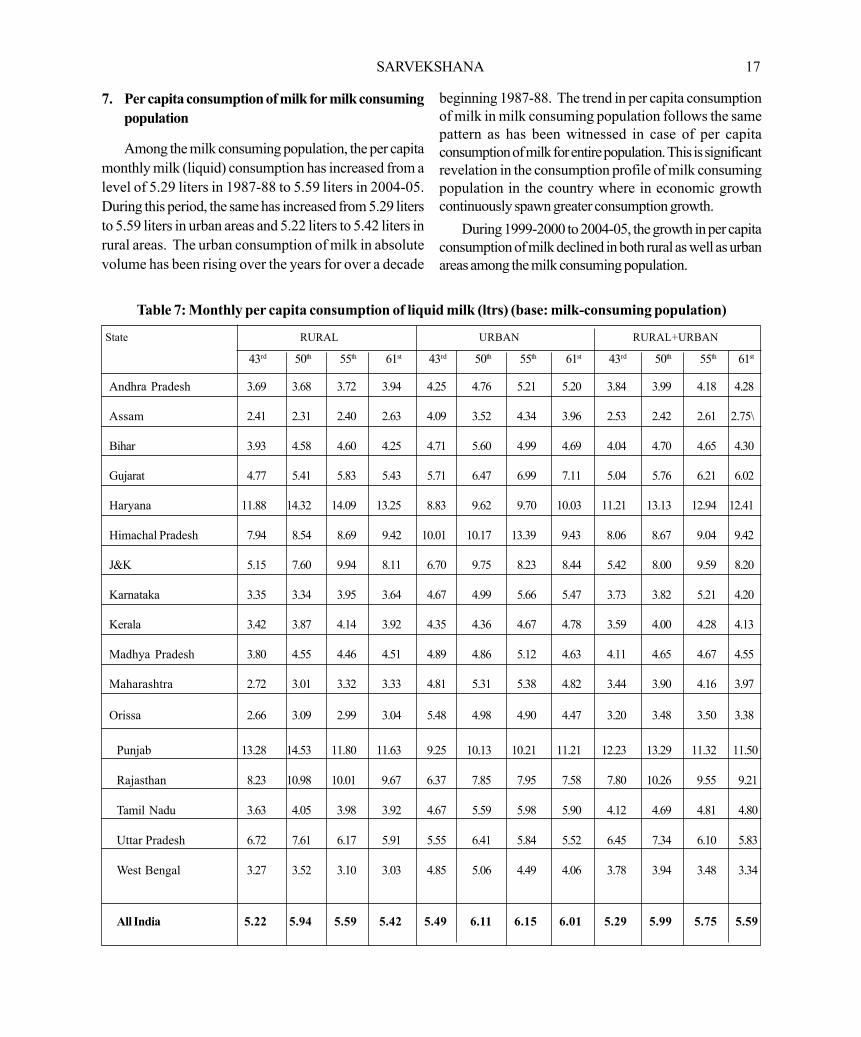
7. Per capita consumption of milk for milk consumingpopulation
Among the milk consuming population, the per capitamonthly milk (liquid) consumption has increased from alevel of 5.29 liters in 1987-88 to 5.59 liters in 2004-05.During this period, the same has increased from 5.29 litersto 5.59 liters in urban areas and 5.22 liters to 5.42 liters inrural areas. The urban consumption of milk in absolutevolume has been rising over the years for over a decade
beginning 1987-88. The trend in per capita consumptionof milk in milk consuming population follows the samepattern as has been witnessed in case of per capitaconsumption of milk for entire population. This is significantrevelation in the consumption profile of milk consumingpopulation in the country where in economic growthcontinuously spawn greater consumption growth.
During 1999-2000 to 2004-05, the growth in per capitaconsumption of milk declined in both rural as well as urbanareas among the milk consuming population.
Table 7: Monthly per capita consumption of liquid milk (ltrs) (base: milk-consuming population)
State RURAL URBAN RURAL+URBAN
43rd 50th 55th 61st 43rd 50th 55th 61st 43rd 50th 55th 61st
Andhra Pradesh 3.69 3.68 3.72 3.94 4.25 4.76 5.21 5.20 3.84 3.99 4.18 4.28
Assam 2.41 2.31 2.40 2.63 4.09 3.52 4.34 3.96 2.53 2.42 2.61 2.75\
Bihar 3.93 4.58 4.60 4.25 4.71 5.60 4.99 4.69 4.04 4.70 4.65 4.30
Gujarat 4.77 5.41 5.83 5.43 5.71 6.47 6.99 7.11 5.04 5.76 6.21 6.02
Haryana 11.88 14.32 14.09 13.25 8.83 9.62 9.70 10.03 11.21 13.13 12.94 12.41
Himachal Pradesh 7.94 8.54 8.69 9.42 10.01 10.17 13.39 9.43 8.06 8.67 9.04 9.42
J&K 5.15 7.60 9.94 8.11 6.70 9.75 8.23 8.44 5.42 8.00 9.59 8.20
Karnataka 3.35 3.34 3.95 3.64 4.67 4.99 5.66 5.47 3.73 3.82 5.21 4.20
Kerala 3.42 3.87 4.14 3.92 4.35 4.36 4.67 4.78 3.59 4.00 4.28 4.13
Madhya Pradesh 3.80 4.55 4.46 4.51 4.89 4.86 5.12 4.63 4.11 4.65 4.67 4.55
Maharashtra 2.72 3.01 3.32 3.33 4.81 5.31 5.38 4.82 3.44 3.90 4.16 3.97
Orissa 2.66 3.09 2.99 3.04 5.48 4.98 4.90 4.47 3.20 3.48 3.50 3.38
Punjab 13.28 14.53 11.80 11.63 9.25 10.13 10.21 11.21 12.23 13.29 11.32 11.50
Rajasthan 8.23 10.98 10.01 9.67 6.37 7.85 7.95 7.58 7.80 10.26 9.55 9.21
Tamil Nadu 3.63 4.05 3.98 3.92 4.67 5.59 5.98 5.90 4.12 4.69 4.81 4.80
Uttar Pradesh 6.72 7.61 6.17 5.91 5.55 6.41 5.84 5.52 6.45 7.34 6.10 5.83
West Bengal 3.27 3.52 3.10 3.03 4.85 5.06 4.49 4.06 3.78 3.94 3.48 3.34
All India 5.22 5.94 5.59 5.42 5.49 6.11 6.15 6.01 5.29 5.99 5.75 5.59
18 SARVEKSHANA
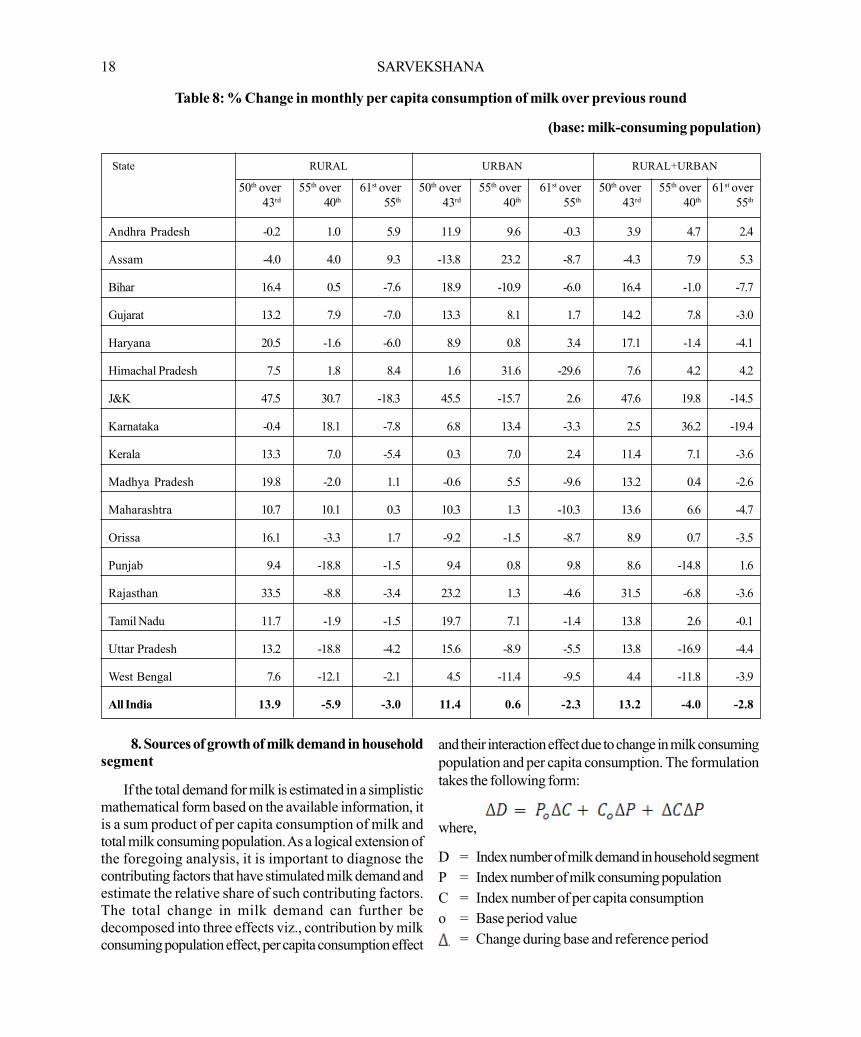
8. Sources of growth of milk demand in householdsegment
If the total demand for milk is estimated in a simplisticmathematical form based on the available information, itis a sum product of per capita consumption of milk andtotal milk consuming population. As a logical extension ofthe foregoing analysis, it is important to diagnose thecontributing factors that have stimulated milk demand andestimate the relative share of such contributing factors.The total change in milk demand can further bedecomposed into three effects viz., contribution by milkconsuming population effect, per capita consumption effect
and their interaction effect due to change in milk consumingpopulation and per capita consumption. The formulationtakes the following form:
where,
D = Index number of milk demand in household segmentP = Index number of milk consuming populationC = Index number of per capita consumptiono = Base period value
= Change during base and reference period
Table 8: % Change in monthly per capita consumption of milk over previous round
(base: milk-consuming population)
State RURAL URBAN RURAL+URBAN
50th over 55th over 61st over 50th over 55th over 61st over 50th over 55th over 61st over 43rd 40th 55th 43rd 40th 55th 43rd 40th 55th
Andhra Pradesh -0.2 1.0 5.9 11.9 9.6 -0.3 3.9 4.7 2.4
Assam -4.0 4.0 9.3 -13.8 23.2 -8.7 -4.3 7.9 5.3
Bihar 16.4 0.5 -7.6 18.9 -10.9 -6.0 16.4 -1.0 -7.7
Gujarat 13.2 7.9 -7.0 13.3 8.1 1.7 14.2 7.8 -3.0
Haryana 20.5 -1.6 -6.0 8.9 0.8 3.4 17.1 -1.4 -4.1
Himachal Pradesh 7.5 1.8 8.4 1.6 31.6 -29.6 7.6 4.2 4.2
J&K 47.5 30.7 -18.3 45.5 -15.7 2.6 47.6 19.8 -14.5
Karnataka -0.4 18.1 -7.8 6.8 13.4 -3.3 2.5 36.2 -19.4
Kerala 13.3 7.0 -5.4 0.3 7.0 2.4 11.4 7.1 -3.6
Madhya Pradesh 19.8 -2.0 1.1 -0.6 5.5 -9.6 13.2 0.4 -2.6
Maharashtra 10.7 10.1 0.3 10.3 1.3 -10.3 13.6 6.6 -4.7
Orissa 16.1 -3.3 1.7 -9.2 -1.5 -8.7 8.9 0.7 -3.5
Punjab 9.4 -18.8 -1.5 9.4 0.8 9.8 8.6 -14.8 1.6
Rajasthan 33.5 -8.8 -3.4 23.2 1.3 -4.6 31.5 -6.8 -3.6
Tamil Nadu 11.7 -1.9 -1.5 19.7 7.1 -1.4 13.8 2.6 -0.1
Uttar Pradesh 13.2 -18.8 -4.2 15.6 -8.9 -5.5 13.8 -16.9 -4.4
West Bengal 7.6 -12.1 -2.1 4.5 -11.4 -9.5 4.4 -11.8 -3.9
All India 13.9 -5.9 -3.0 11.4 0.6 -2.3 13.2 -4.0 -2.8
SARVEKSHANA 19
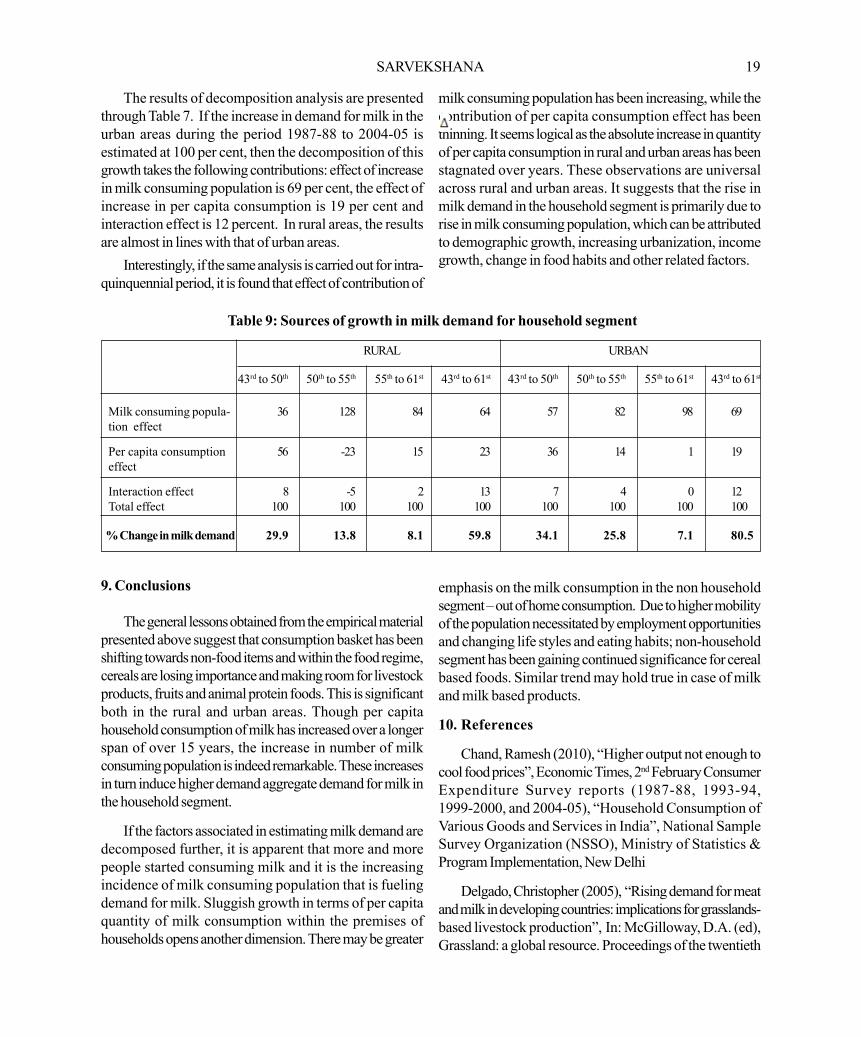
The results of decomposition analysis are presentedthrough Table 7. If the increase in demand for milk in theurban areas during the period 1987-88 to 2004-05 isestimated at 100 per cent, then the decomposition of thisgrowth takes the following contributions: effect of increasein milk consuming population is 69 per cent, the effect ofincrease in per capita consumption is 19 per cent andinteraction effect is 12 percent. In rural areas, the resultsare almost in lines with that of urban areas.
Interestingly, if the same analysis is carried out for intra-quinquennial period, it is found that effect of contribution of
milk consuming population has been increasing, while thecontribution of per capita consumption effect has beenthinning. It seems logical as the absolute increase in quantityof per capita consumption in rural and urban areas has beenstagnated over years. These observations are universalacross rural and urban areas. It suggests that the rise inmilk demand in the household segment is primarily due torise in milk consuming population, which can be attributedto demographic growth, increasing urbanization, incomegrowth, change in food habits and other related factors.
9. Conclusions
The general lessons obtained from the empirical materialpresented above suggest that consumption basket has beenshifting towards non-food items and within the food regime,cereals are losing importance and making room for livestockproducts, fruits and animal protein foods. This is significantboth in the rural and urban areas. Though per capitahousehold consumption of milk has increased over a longerspan of over 15 years, the increase in number of milkconsuming population is indeed remarkable. These increasesin turn induce higher demand aggregate demand for milk inthe household segment.
If the factors associated in estimating milk demand aredecomposed further, it is apparent that more and morepeople started consuming milk and it is the increasingincidence of milk consuming population that is fuelingdemand for milk. Sluggish growth in terms of per capitaquantity of milk consumption within the premises ofhouseholds opens another dimension. There may be greater
emphasis on the milk consumption in the non householdsegment – out of home consumption. Due to higher mobilityof the population necessitated by employment opportunitiesand changing life styles and eating habits; non-householdsegment has been gaining continued significance for cerealbased foods. Similar trend may hold true in case of milkand milk based products.
10. References
Chand, Ramesh (2010), “Higher output not enough tocool food prices”, Economic Times, 2nd February ConsumerExpenditure Survey reports (1987-88, 1993-94,1999-2000, and 2004-05), “Household Consumption ofVarious Goods and Services in India”, National SampleSurvey Organization (NSSO), Ministry of Statistics &Program Implementation, New Delhi
Delgado, Christopher (2005), “Rising demand for meatand milk in developing countries: implications for grasslands-based livestock production”, In: McGilloway, D.A. (ed),Grassland: a global resource. Proceedings of the twentieth
Table 9: Sources of growth in milk demand for household segment
RURAL URBAN
43rd to 50th 50th to 55th 55th to 61st 43rd to 61st 43rd to 50th 50th to 55th 55th to 61st 43rd to 61st
Milk consuming popula- 36 128 84 64 57 82 98 69tion effect
Per capita consumption 56 -23 15 23 36 14 1 19effect
Interaction effect 8 -5 2 13 7 4 0 12Total effect 100 100 100 100 100 100 100 100
% Change in milk demand 29.9 13.8 8.1 59.8 34.1 25.8 7.1 80.5

20 SARVEKSHANA
International Grassland Congress, Dublin, Ireland, 26–30June 2005, Wageningen Academic Publishers, theNetherlands. pp. 29–39
Delgado, Christopher; Rosegrant, Mark; Steinfeld,Henning; Ehui, Simeon; Courbois, Claude (1999):“Livestock to 2020 – The Next Food Revolution”, Food,Agriculture and the Environment Discussion Paper 28,IFPRI/FAO/ILRI
FAO (Food and Agricultural Organisation) (2009): “TheState of Food and Agriculture – Livestock in the Balance”,
Food and Agriculture Organization of the United Nations,Rome
Shah, Jignesh (2010): “Dairy Industrialization”, LambertAcademic Publishing, LAP Lambert Academic Publishing,Germany, 24 p
Sen, Abhijit (2001): “Consumer expenditure,distribution and poverty: Implications of 55th round”,Available at www.macroscan.org/anl/jan01/Abhijit_Sen.pdf
SARVEKSHANA 21
1. Introduction
1.1 Manufacturing sector is one of the important sectorsof Indian economy. As per the NSS 61st round quinquennialsurvey on employment-unemployment ( 2004-05), the shareof this sector in the total employment according to principaland subsidiary statuses taken together was about 8% forrural India and 25% for urban India. Further, themanufacturing sector had a share of about 16% in the GDPat factor cost during 2006-07.
1.2 Keeping in view the importance of this sector, thesubject of unorganized manufacture sector has alwaysremained an important theme of enquiry in the NSS. Infact, small scale manufacture was taken as one of thesubjects in the very1st round of NSS (1950-51) itself andthereafter, the topic was covered during NSS rounds3-10, 14, 23 and 29 following the household approach.Subsequently, after the conduct of first Economic Census(EC) in 1977, the subject of unorganized manufacture sectorhas been covered in NSS rounds 33, 40, 45, 51, 56 and62 following the site approach of enterprises for the purposeof listing and data collection.
2. Coverage and Survey Methodology of NSS62nd Round
2.1 All manufacturing enterprises other than (a) thoseunder the coverage of Annual Survey of Industries (ASI)and (b) government and public sector undertakingscomprised the domain of units of 62nd round of NSS. Interms of National Industrial Classification (NIC) 2004, thesurvey covered the NIC 2-digit codes 15-37. In addition,enterprises engaged in cotton ginning, cleaning and baling(NIC 2004 code 01405) were also covered under thesurvey. It is to be noted that only those enterprises, whichoperated for at least 30 days (15 days in case of seasonalenterprises) during the last 365 days preceding the date ofsurvey, were eligible for survey.
2.2 The survey in the central sample (i.e. fieldworkcarried out mostly with the help of NSSO field staff) coveredthe whole of the Indian Union except (i) Leh, Kargil, Punchand Rajouri districts of Jammu & Kashmir, (ii) interiorvillages of Nagaland situated beyond five kilometres of busroute and (iii) villages of Andaman and Nicobar Islandswhich remain inaccessible throughout the year.
2.3 One salient feature of the sample design was theuse of list frame of enterprises for urban areas, in additionto the usual area frame. This was done for the first time inorder to capture sufficient number of relatively ‘bigger’enterprises with a view to improving the overall estimate ofgross value added per worker, total number of workers,total input, total output, etc. For this purpose, a list of 8,000big non-ASI manufacturing enterprises 1 was prepared asper the data of the census of manufacturing enterprisesconducted by Development Commissioner of Small ScaleIndustries (DCSSI) in 2003. All these units in the list framewere considered for survey without resorting to anysampling. However, only 2,260 units from the list framecould be surveyed and the remaining were ultimately treatedas casualties due to various reasons – the major reasonbeing that they were not eligible for survey since they wereeither government or public sector units or were under thecoverage of ASI.
2.4 In the area frame, as usual, a stratified multi-stagedesign – with villages (panchayat wards in case of Kerala)/urban blocks as the first stage units (FSUs) and unorganizedmanufacturing enterprises as the ultimate stage units (USUs)– was adopted.
In case of large FSUs requiring hamlet-group (hg) /sub-block (sb) formation, one intermediate stage in thesampling involved the selection of two hg’s / sb’s from eachFSU out of a minimum of three hg’s/sb’s formed in theFSU. As regards the first stage stratification, two basicstrata were formed within each district of a State/UT: rural
Experiences of the Survey on Unorganized Manufacturing Sector,NSS 62nd Round, 2005-06
Dr. Rajiv Mehta, G. C. Manna, and T. K. Sanyal,
1 Big manufacturing units were identified based on the data of the census of manufacturing enterprises (2003) conducted by DevelopmentCommissioner of Small Scale Industries. While doing so, from the list of registered SSI units, those not registered under sections 2m(i) and 2m(ii)of Factories Act, 1948 and belonging to manufacturing sector were first identified. Thereafter, the units whose gross value of output in 2001 weremore than 6 times the average output (Rs.1,432,314) of all urban SSI units were separated out. Finally, from this truncated list, those (numbering8,000) with 6 or more workers were identified.

22 SARVEKSHANA
stratum comprising all rural areas of the district and urbanstratum consisting of all urban areas of the district. However,each city with a population of one million or more as perCensus 2001 was invariably treated as a separate stratumby itself. For details of stratification, selection of sampleFSUs and hg/sb selection, reference may be made toAppendix-B (Sample design and Estimation Procedure)of NSS Report Numbers 524-526 based on 62nd round.
2.5 All the eligible enterprises within the sample FSU(or its selected parts/segments as the case might be) werestratified into 2 broad second-stage strata by enterprisetype i.e. Own Account Manufacturing Enterprise (OAME)and Non-Directory/Directory ManufacturingEstablishments (NDME/DME)2. Each of these two broadsecond-stage strata was further divided into 3 broadmanufacturing groups (BMG) i.e. BMG 1, BMG 2 andBMG 3. BMG 1 comprised eligible enterprises belongingto NIC codes 15-20 (NIC codes are described in theAnnex). BMG 2 consisted of eligible enterprises belongingto NIC Codes 23, 27, 30-35 and 01405 while all othereligible enterprises belonging to the rest of the NIC codesunder coverage formed BMG 3. Thus within a sample FSU,six ultimate second-stage strata were formed by jointlyconsidering the broad second-stage strata and BMG. Atotal of 12 manufacturing enterprises – two from eachultimate second-stage stratum – were selected for detailedenquiry. Data from enterprises were collected from booksof accounts if those were available. Otherwise, data werecollected through oral enquiry.
3. Sample size
3.1 Out of 8,000 enterprises selected from the listframe, as stated already, data could be collected from only2,260 enterprises. In the area frame, 80,637 enterprises(42,050 from rural India and 38,587 from urban India)spread over 4,798 villages and 5,125 urban blocks acrossthe country were surveyed. Thus, considering the list frameand area frame both, a sample of 82,897 enterprises wascovered in the 62nd round.
4. Key Findings of the Survey
4.1 The results of the survey on unorganizedmanufacturing sector undertaken in the 62nd round werebrought out in the following three reports:
NSS Report No. 524- Operational Characteristicsof Unorganised Manufacturing Enterprises in India,2005-06
NSS Report No. 525- Unorganised ManufacturingSector in India: Employment, Assets and Borrowings,2005-06
NSS Report No. 526- Unorganised ManufacturingSector in India: Input, Output and Value Added
4.2 The following key statistics on characteristics ofenterprises were generated from the survey and werepresented in the reports at all-India (2-digit level ofNIC’04) and State level.
a. Estimated number of enterprises
b. Type of ownership (i.e. Proprietary, Partnership, Ltd.Company etc.) of the enterprises and nature ofoperation (i.e. Perennial, Seasonal & Casual)
c. Maintenance of accounts, status of registration,whether working on contract
d. Estimated number of workers, type of worker(working owner, hired worker & other worker),nature of employment (full-time & part-time)
e. Input, Output & Value added
f. Fixed Assets, Gross Fixed Capital Formation
g. Outstanding loan and sources of loan
h. Interest paid
4.3 As per the survey, an estimated 17.07 millionunorganised manufacturing enterprises in India wereoperative in India during 2005-06 of which nearly 71%were located in rural areas of the country. These enterprisesemployed about 36.44 million workers. Annual gross valueadded (GVA) by the unorganized manufacturing enterpriseswas worth Rs. 875.9 billions.
4.4 Percentage shares of rural and urban areas in thetotal annual GVA were nearly 43% and 57% respectively.The respective shares of OAMEs, NDMEs & DMEs inaggregate GVA were 32%, 24% & 44%. In this context, it
2OAMEs are enterprises which run without hiring any labour on a fairly regular basis. NDMEs and DMEs run by hiring at least one hired workeron a fairly regular basis – the distinction between the two categories being that the former (NDME) has a total of 5 or less number of workers(including the hired ones) while the latter engages at least 6 workers.

SARVEKSHANA 23
may be mentioned that in terms of number of enterprises,OAMEs, NDMEs & DMEs had percentage shares ofabout 86%, 10% and 4% respectively. This implies therelative importance of DMEs and NDMEs in terms ofhigher GVA per enterprise as compared to that by OAMEs.At all-India level, annual GVA per enterprise and GVA perworker were estimated at about Rs.51,307 and Rs.24,034respectively.
4.5 Raw materials constituted about 85% of totaloperating expenses while manufactured products and by-products constituted nearly 80% of gross receipts ofunorganized manufacturing enterprises. Table 1 highlightssome of the key findings of the survey separately forOAMEs, NDMEs and DMEs. It is to be noted that perenterprise values of assets, annual receipts, expenditure andGVA for DMEs are much higher than those of NDMEs.Similarly, per enterprise estimates of NDMEs are also muchhigher than those of OAMEs.
4.6 Table 2 presents estimated number of enterprises,number of workers and aggregate annual GVA for all-Indiaby 2-digit of industry (NIC 2004). From the table, it maybe seen that manufacture of food products and beverages(NIC 15), manufacture of tobacco products (NIC 16),manufacture of textiles (NIC 17), manufacture of wearingapparel, dressing and dyeing of fur (NIC 18), manufactureof wood and wood products etc (NIC 20), manufactureof fabricated metal products (NIC 28), and manufactureof furniture not elsewhere classified (NIC 36) are the majorindustries in terms of their shares in total number ofenterprises/workers and annual GVA.
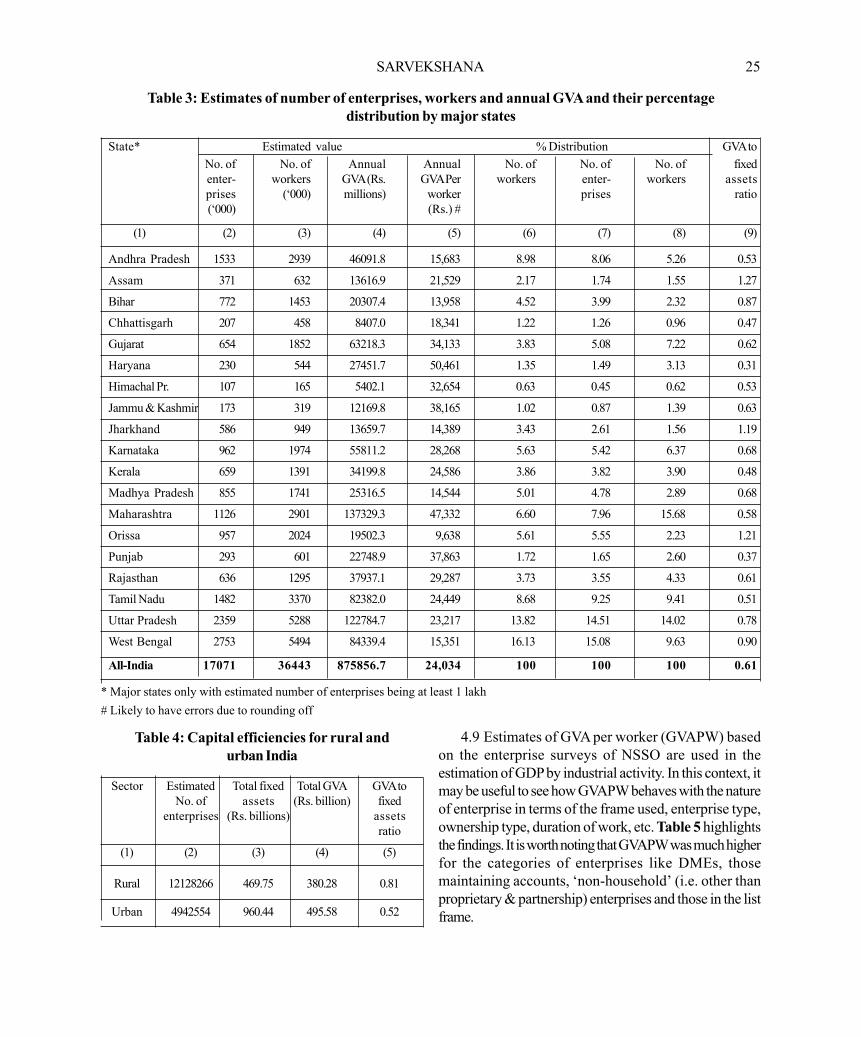
4.7 In Table 3, the state-wise estimates of the abovethree variables are presented for those major states only
with estimated number of unorganized manufacturingenterprises being at least one lakh11 . It may be seen thatstates of Andhra Pradesh, Gujarat, Karnataka,Maharashtra, Tamil Nadu, Uttar Pradesh and West Bengalhave major shares in the aggregate estimates of the threevariables.
4.8 The results of 62nd round provide estimates ofmarket value of assets holdings in different classificationsof enterprises that are useful to derive further indicators. Atall India level, market value of owned fixed assets perenterprise was Rs. 58,166 and that of hired fixed assetswas Rs 25,614. About 69.8% of the total market value offixed assets, both owned as well as hired, is in land andbuildings and this share has progressively increased from
11 Lakh = 105
Table 1: Key findings of the survey on unorganized manufacture sector, 2005-06
India Rural & Urban Combined
Survey characteristic OAME NDME DME ALL
(1) (2) (3) (4) (5)
1. Number of enterprises surveyed 55,045 18,060 9,792 82,897
2. Estimated number of enterprises (millions) 14.61 1.77 0.69 17.07
3. Number of workers (millions) 23.69 5.78 6.98 36.44
4. Key characteristics per enterprise:
4.1 Number of workers 1.6 3.3 10.1 2.1
4.2 Value of assets: owned plus hired (Rs.) 32,734 248,601 744,246 83,780
4.3 Loans outstanding (Rs.) 1,023 34,440 201,102 12,548
4.4 Annual receipts (Rs.) 37,670 363,894 4,157,971 237,470
4.5 Annual expenses (Rs.) 18,467 244,592 3,599,458 186,163
4.6 Annual GVA (Rs.) 19,203 119,302 558,513 51,307
5. Annual GVA per worker:
5.1 GVA per worker (Rs.) 11,846 36,543 55,052 24,034

24 SARVEKSHANA
51st round and 56th round. Correspondingly, the share ofplant and machinery in the fixed asset valued at 21.4% hasprogressively declined. As a measure of capital efficiency,the ratios of GVA to market value of fixed assets by NICcode and by state are presented in Tables 2 and 3. Atall-India level, the ratio is 0.61 implying 61 paise contributionin GVA per one rupee value of fixed assets (owned plus
hired) at market price. As expected, there are certainvariations in the ratios at the said levels of disaggregation.Rural-urban divergences for all-India are shown inTable 4. The difference in capital efficiency, however, issubjected to differentiated role of factors of production aswell as to the differentiated interplay of factor market in thedomain.
Table 2: Estimates of number of enterprises, workers and annual GVA and their percentagedistribution by NIC 2-digit
NIC Estimated value % Distribution GVA to
*Code No. of No. of Annual Annual No. of No. of Annual fixedEnter- workers GVA GVA per Enter- workers GVA assetsprises (‘000) (Rs. worker prises ratio(‘000) Million) (Rs.) #
(1) (2) (3) (4) (5) (6) (7) (8) (9)
01405 9 20 930.7 47,318 0.05 0.05 0.11 0.5015 2601 6346 154058.8 24,277 15.25 17.41 17.59 0.5916 2818 4199 28626.0 6,818 16.51 11.52 3.27 0.8617 2568 6343 122342.4 19,289 15.04 17.40 13.97 0.6018 3214 4930 93312.5 18,928 18.83 13.53 10.65 0.5019 144 474 13579.7 28,674 0.84 1.30 1.55 0.6720 2138 4059 54625.4 13,458 12.53 11.14 6.24 0.7721 168 354 7098.5 20,040 0.98 0.97 0.81 0.4322 118 411 20559.3 50,049 0.69 1.13 2.35 0.3323 6 22 825.0 37,279 0.03 0.06 0.09 0.4724 418 864 16322.3 18,892 2.45 2.37 1.86 0.5825 72 277 14129.3 50,949 0.42 0.76 1.61 0.4126 642 2336 66102.6 28,296 3.76 6.41 7.55 0.9827 35 1129 11682.3 103,511 0.21 0.31 1.33 0.6128 620 1658 90047.0 54,303 3.63 4.55 10.28 0.7229 174 580 39713.6 68,434 1.02 1.59 4.53 0.6030 1 10 771.5 76,178 0.01 0.03 0.09 0.9831 111 269 13321.6 49,501 0.65 0.74 1.52 0.4932 6 24 2190.3 92,939 0.03 0.06 0.25 0.5633 10 33 2130.3 64,945 0.06 0.09 0.24 0.4634 15 92 5473.4 59,462 0.09 0.25 0.62 0.8035 25 111 5149.2 46,580 0.15 0.30 0.59 0.3236 1152 2905 112291.0 38,650 6.75 7.97 12.82 0.6537 4 14 574.2 40,104 0.02 0.04 0.07 0.42
All 17071 36443 875856.7 24,034 100 100 100 0.61
* See Annex for the descriptions
# Likely to have errors due to rounding off
SARVEKSHANA 25
Table 3: Estimates of number of enterprises, workers and annual GVA and their percentagedistribution by major states
State* Estimated value % Distribution GVA toNo. of No. of Annual Annual No. of No. of No. of fixedenter- workers GVA (Rs. GVA Per workers enter- workers assetsprises (‘000) millions) worker prises ratio(‘000) (Rs.) #
(1) (2) (3) (4) (5) (6) (7) (8) (9)
Andhra Pradesh 1533 2939 46091.8 15,683 8.98 8.06 5.26 0.53
Assam 371 632 13616.9 21,529 2.17 1.74 1.55 1.27
Bihar 772 1453 20307.4 13,958 4.52 3.99 2.32 0.87
Chhattisgarh 207 458 8407.0 18,341 1.22 1.26 0.96 0.47
Gujarat 654 1852 63218.3 34,133 3.83 5.08 7.22 0.62
Haryana 230 544 27451.7 50,461 1.35 1.49 3.13 0.31
Himachal Pr. 107 165 5402.1 32,654 0.63 0.45 0.62 0.53
Jammu & Kashmir 173 319 12169.8 38,165 1.02 0.87 1.39 0.63
Jharkhand 586 949 13659.7 14,389 3.43 2.61 1.56 1.19
Karnataka 962 1974 55811.2 28,268 5.63 5.42 6.37 0.68
Kerala 659 1391 34199.8 24,586 3.86 3.82 3.90 0.48
Madhya Pradesh 855 1741 25316.5 14,544 5.01 4.78 2.89 0.68
Maharashtra 1126 2901 137329.3 47,332 6.60 7.96 15.68 0.58
Orissa 957 2024 19502.3 9,638 5.61 5.55 2.23 1.21
Punjab 293 601 22748.9 37,863 1.72 1.65 2.60 0.37
Rajasthan 636 1295 37937.1 29,287 3.73 3.55 4.33 0.61
Tamil Nadu 1482 3370 82382.0 24,449 8.68 9.25 9.41 0.51
Uttar Pradesh 2359 5288 122784.7 23,217 13.82 14.51 14.02 0.78
West Bengal 2753 5494 84339.4 15,351 16.13 15.08 9.63 0.90
All-India 17071 36443 875856.7 24,034 100 100 100 0.61
* Major states only with estimated number of enterprises being at least 1 lakh# Likely to have errors due to rounding off
Table 4: Capital efficiencies for rural andurban India
Sector Estimated Total fixed Total GVA GVA toNo. of assets (Rs. billion) fixed
enterprises (Rs. billions) assetsratio
(1) (2) (3) (4) (5)
Rural 12128266 469.75 380.28 0.81
Urban 4942554 960.44 495.58 0.52
4.9 Estimates of GVA per worker (GVAPW) basedon the enterprise surveys of NSSO are used in theestimation of GDP by industrial activity. In this context, itmay be useful to see how GVAPW behaves with the natureof enterprise in terms of the frame used, enterprise type,ownership type, duration of work, etc. Table 5 highlightsthe findings. It is worth noting that GVAPW was much higherfor the categories of enterprises like DMEs, thosemaintaining accounts, ‘non-household’ (i.e. other thanproprietary & partnership) enterprises and those in the listframe.

26 SARVEKSHANA
Table 5: Annual GVA per worker (Rs.) during2005-06 as per nature of enterprise
Enterprise type Maintenance Number of workingof a/c hours per day
OAME NDME DME No Yes Less than 4 4-7 8 or more
11,846 36,543 55,052 17,888 138,794 5,688 11,171 33,169
proprietary Others Area List& partnership Frame Frame
23,485 129,267 32,815 184,773
5. Comparison with alternative data sources
5.1 Two other important data sources on manufacturingenterprises are the Annual Survey of Industries (ASI) andEconomic Census (EC). While ASI is an annual exercise,the EC is conducted periodically – latest one beingconducted during 2005. It would be of interest to comparethe data from these alternate sources. But before doing so,we need to look at the coverage of these three sources.The term ‘unorganized manufacturing enterprises’ under thecoverage of NSS 62nd round referred to all manufacturingenterprises not covered under the Annual Survey ofIndustries (ASI). All government and public sectorenterprises were excluded from the coverage of NSS62nd round but such enterprises forms part of the coverageof ASI. On the other hand, EC covers all types ofenterprises irrespective of their ownership. In terms ofNational Industrial Classification (NIC) 2004 codes, NSS62nd round covered the NIC 2-digit codes 15-37. Inaddition, enterprises engaged in cotton ginning, cleaningand baling (NIC 2004 code 01405) were also covered inNSS 62nd round to have parity with the coverage of ASI.Under the ambit of ‘manufacturing sector’, EC 2005covered all manufacturing enterprises falling under NIC2004 codes 15-37. Thus, in an ideal situation, total numberof manufacturing enterprises considering both NSS 62nd
round and ASI 2004-05 (fieldwork being conducted in2005-06) after excluding those under NIC code 01405should match with the number as per EC 2005. But fromTable 6, it may be seen that total number of manufacturingenterprises as per NSS 62nd round and ASI 2004-05 takentogether is much higher than those based on EC 2005. Thesimilar kind of divergence is also there in respect of numberof workers, although the exact magnitude of divergence is
somewhat lower because the under-reporting of units inEC is more with regard to the smaller units having relativelyless number of workers.
Table 6: Number of manufacturing enterprises andworkers as per alternative sources
Characteristic NSS 62nd ASI NSS + ASI EC 2005 % Round 2004-05* Diver-
(2005-06)* gence#
(1) (2) (3) (4) (5) (6)
No. of enterprises 17061689 128122 17189811 8322205 -51.6
* Excludes NIC 01405 # 100 x (col.5 – col.4)/col.4
5.2 Table 7 below presents gross value added (GVA)as per NSS 62nd round (2005-06) and ASI 2004-05 andGDP at current prices (base year 1999-2000) accordingto National Accounts Statistics (NAS). It is seen thatestimates as per NSS and ASI are much lower than thoseof NAS. It is also to be noted that the percentage divergencein the estimate between the NSS and NAS has increasedfrom 40.5% during 2000-01 (the year when previoussurvey as per NSS 56th round was conducted) to 45%during 2005-06. We need to take steps to identify thereasons behind such divergences for taking necessarycorrective measures. Main reasons of the said divergencecould be grouped into two categories: one, probable under-reporting of receipts / GVA in the NSS and ASI and two,methodological issues in the compilation of NAS usingvarious data sources.
Table 7: GVA & GDP at current prices formanufacturing sector as per alternative
sources
NSS 62nd NAS ASI NAS NSS + ASI NASRound 2005-06 2004-05 2004-05 (Col. 1+3) (Col. 2+4)
(2005-06) (Unregistered (RegisteredMfg. sector) Mfg. sector)
(1) (2) (3) (4) (5) (6)
Aggregate value (Rs. Billions)
875.86 1593.34 2101.94 3126.22 2977.80 4719.56
% Divergence (NSS and ASI as compared to NAS)
-45.0 - -32.8 - -36.9 -(-40.5)
Note: Figure within brackets gives the percentage divergence for the year2000-01.
Type of ownership
Type of frame (Urban)

SARVEKSHANA 27
6. Issues of concern and suggestions for future
6.1 Size of the enterprise: As per the NSS62nd round, out of an estimated 17 million ‘unorganized’manufacturing enterprises, nearly 2.34 lakh enterprises hadat least 10 workers and about 34,000 of these units hadengaged at least 20 workers. Ideally, such enterprisesshould be registered under the Factories Act, 1948 and bebrought under the coverage of ASI. The standard NSSsample design is not appropriate to capture such biggerunits in adequate number in the sample. Till steps are takento include such units in the sampling frame of ASI, it isworth exploring the possibilities of introducing deeperstratification in the NSS sample design – both at the firststage and second stage of sampling – so as to ensureadequate representation of such units in the sample.
6.2 Use of list frame: It has been shown in Table 4that GVA per worker of a list frame (LF) enterprise wasmuch higher (Rs. 184,773) than that (Rs.32,815) of anenterprise belonging the area frame (AF). This reflectsheterogeneity in the domain of enterprises. Further, in termsof numbers, the surveyed enterprises in list frame were only0.05% of the estimated number of total enterprises in theurban sector. However, the aggregate GVA of list frameenterprises was about 0.9% of total GVA of unorganizedmanufacturing. Thus the list frame enterprises, though rarein the population, are distinctly significant in their contribution.Accordingly, it may be worth using both LF and AF in asurvey of similar topic in future. However, to reap full benefits
of using the LF, the coverage of LF may be expanded byincluding more such units in the frame. To what extent theEC can be utilized for this venture must be explored.However, while developing such an LF, adequate careneeds to be taken to ensure that the units included in theLF are really eligible for survey (i.e. not already coveredunder ASI frame or not government or public sector units,which are out of the coverage of unorganized manufacturingsector).
6.3 Cooperation of respondents: The final resultsbased on any survey depend on the level of cooperation ofrespondents and the quality of response. The present surveyrevealed that nearly 4% of the respondents were busy orreluctant. Another 15% were cooperative but not capable.It needs to be seen how best these problems can beaddressed.
6.4 Length of the schedule: There is no denying ofthe fact that size of the schedule should not be too large forimproving the quality of response. Larger the length of theschedule, higher is the chance of primary data being affectedby respondent’s fatigue. In 16% of the cases / total numberof sample enterprises, the canvassing time of the scheduleof NSS 62nd round took 2 to 3 hours. In nearly 4% of thecases, the canvassing time exceed even 3 hours. It wouldbe useful to cut down the length of the schedule so thatprimary data can be collected within a time period of1 hour or so, at the most one hour and a half.

28 SARVEKSHANA
Annexure
Description of manufacturing activities under the survey coverage of NSS 62nd round
NIC DescriptionCode
01405 Cotton ginning, cleaning and baling
15 Manufacture of Food Products and Beverages
16 Manufacture of Tobacco Products
17 Manufacture of Textiles
18 Manufacture of Wearing Apparel; Dressing and Dyeing of Fur
19 Tanning and Dressing of Leather; Manufacture of Luggage, Handbags, Saddlery, Harness and Footwear
20 Manufacture of Wood and of Products of Wood and Cork, Except Furniture; Manufacture of Articles ofStraw and Plating Materials
21 Manufacture of Paper and Paper Products
22 Publishing, Printing and Reproduction of Recorded Media
23 Manufacture of Coke, Refined Petroleum Products and Nuclear Fuel
24 Manufacture of Chemicals and Chemical Products
25 Manufacture of Rubber and Plastics Products
26 Manufacture of Other Non-Metallic Mineral Products
27 Manufacture of Basic Metals
28 Manufacture of Fabricated Metal Products, Except Machinery and Equipment
29 Manufacture of Machinery and Equipment Not Elsewhere Classified.
30 Manufacture of Office, Accounting and Computing Machinery
31 Manufacture of Electrical Machinery and Apparatus Not Elsewhere Classified.
32 Manufacture of Radio, Television and Communication Equipment and Apparatus
33 Manufacture of Medical, Precision and Optical Instruments, Watches and Clocks
34 Manufacture of Motor Vehicles, Trailers and Semi-Trailers
35 Manufacture of Other Transport Equipment
36 Manufacture of Furniture; Manufacturing Not Elsewhere Classified.
37 Recycling
SARVEKSHANA 29
In this note, an attempt has been made to summarizethe experiences of various divisions of NSSO and EconomicStatistics Division of CSO based on the organizationalpapers from NSSO and CSO.
1. Salient Features of the Survey:
1.1 Introduction The 63rd Round survey (July 2006-June 2007) of National Sample Survey (NSS) was primarilydevoted to the survey on enterprises in service sector(excluding trade) in the country. The other subject of enquirycovered in this round was usual annual survey of householdconsumer expenditure. Last survey of service sectorenterprises was conducted in the 57th round of NSS duringJuly 2001 to June 2002. The 63rd round was basically arepetition of the 57th round in terms of concepts anddefinitions. However, financial sector which was notincluded in 57th round was included in the coverage of 63rdRound.
1.2 Objectives and Coverage: Service sector is themost important sector of the economy in terms of incomegeneration and second only to agriculture in employmentgeneration. However, major data gaps existed in all thesegments of this sector because of its impressive growthand reach. The survey on service sector enterprises waslaunched mainly with the objective to bridge the data gapsexisting in this diverse sector and that could help the policymakers and planners. Beside, this survey has to enable thepolicy makers to understand and address the problems ofproduction, income generation and manpower absorptionin this growing sector.
1.2.1 The objective of the household consumerexpenditure survey was to provide an unbroken annualseries of consumption pattern of rural and urban households.It was also to help in estimating number and percentage ofpersons below the Poverty Line in different States and UTsfrom the size distribution of monthly per capita expenditure.
1.2.2 The NSS 63rd round survey covered all servicesector (excluding trade) enterprises. However, servicesector enterprises covered under the Annual Survey ofIndustries (ASI), Government and Public Sector
Undertakings were excluded. As such enterprises thatcame under NIC 2004 Divisions 55(Hotel andRestaurants), 61(Water Transport), 63(Supporting andauxiliary transport Activities), 64(Post &Telecommunication), 66, 67, 70-74, 80, 85, 90, 92-93,NIC 2004 Groups 602 & 659 and NIC 2004 Class 9191& 9199 that are not run by Governments/PSUs/LocalBodies were covered in 63rd round. Information for thesurvey was collected during July, 2006 to June 2007.
1.3 Sample Design: In this round, a dual frameapproach viz. a list frame and an area frame was adopted.This was the second survey in which a dual frame approachwas used in a NSS round. The first time was in NSS 62nd
round. Accordingly a list of about 1000 service sectorenterprises containing names of financial enterprises suppliedby RBI and names of other service sector enterprisessupplied by M/o Company Affairs was used. All the eligibleunits in the list frame considering all its branches as one unitwere considered for survey without resorting to anysampling. For the coverage of all other service sectorenterprises in the universe, an area frame approach wasfollowed for sampling the units. Besides these, in the areaframe a separate segment 9 was formed comprising all thenon-agricultural enterprises having 50 or more workers inthe entire FSU and having operated for at least one dayduring last 365 days. All the eligible units of Segment 9under coverage were surveyed without any sampling aswas in the case of list frame. As a whole, 13997 FSUs(5608 villages and 8289 urban blocks) in area frame wereallocated for central sample at all India level. In 63rd round,the following three types of schedules were canvassed:
Schedule 0.0 - Listing of Households and Non- AgriculturalEnterprises
Schedule 2.345- Service Sector Enterprises (excluding trade) and
Schedule 1.0 - Household consumer expenditure
The information was collected from 24 enterprises fromeight second stage strata (SSS) for schedule 2.345. Forschedule 1.0, information was collected in 6 householdsfrom three second stage strata in rural FSUs and 4households from two second stage strata in urban FSUs.
A NOTE ON SOME EXPERIENCES DURING NSS 63rd ROUND OF SOCIO-ECONOMIC SURVEYON SERVICE SECTOR ENTERPRISES (EXCLUDING TRADE)
CSO and NSSO

30 SARVEKSHANA
2: Field related issues:
2.1 Conceptual/ Definitional and General Issues
2.1.1 The survey covered all types of enterprises, bigand small, and the information on operating expenses,receipts, employment particulars, fixed assets, loanoutstanding etc. was collected either through the book ofaccounts as provided by the units or orally through theinterview. The field experience of the 63rd round showsthat most of the units in service sector either do not maintainproper accounts or even if maintained, were very reluctantto present to the field staff. The records were obtained in anumber of cases with great difficulty and after lot ofpersuasion. In the face of reluctance from owners, it ispossible sometimes that the field official might not haveinsisted in using the records to avoid delays in survey work.As there was no legal obligation on the part ofestablishment, the field staff faced resistance in getting theinformation. Thus in a large number of cases the informationwas collected on interview basis and in such cases, theenterprises had the tendencies not to reveal the exact figures.
2.1.2 In a few cases, where the owners/operators ofthe enterprises lived outside or far from the FSU, theiremployees were unable to give any information and thereforethe field officials had to spend longer time in searching forthe right respondent. In a number of cases proprietors werereluctant to spare adequate time with the investigators fordetailed enquiry.
2.1.3 Another major problem faced by the field officialswas regarding use of two kinds of reference periodsdepending primarily on whether the enterprises under surveycould provide information from their books of accounts orfrom oral enquiry. For enterprises providing oral informationthere were three kinds of reference periods, viz. a) referencemonth, b) reference year, and c) the last date of referenceperiod. Again for the perennial and casual enterprises,reference month would refer to the last 30 days (precedingthe date of survey) irrespective of the number of days ofoperation. For seasonal enterprises there were twinconcepts of reference month, if the enterprise workedcontinuously for 30 days or more in the current season, thereference month referred to ‘the last 30 days (precedingthe date of survey)’ and for enterprises which worked forless than 30 days in the current season, reference monthreferred to an average month in the last working season.
Also, if an enterprise was unable to provide information forthe last 30 days but was able to provide for the latestcompleted calendar month, the calendar month was treatedas reference month. Likewise, reference year was alsochangeable in nature and the field officials had to facedifficulties with respect to the factors deciding the properreference year / reference month/reference period underspecific conditions. It was hard to keep in mind the widerange of concepts of reference period for different blocksand different items contained in schedule 2.345.
2.2 Specific Problems Associated with the Canvassingof the Schedules
2.2.1 Listing of Enterprises/Households and theirSelection (Schedule 0.0).
2.2.1.1 In this round, a list of 998 enterprises as a listframe was provided for survey. Such enterprises were bignon -ASI service sector units. However, during field survey,it was found that:
(i) The lists provided by Reserve Bank of India andMinistry of Company Affairs were not up to date.
(ii) Many of the units changed their places of operationsas well as offices and some units were closed or hadchanged several hands.
(iii) Majority of the units were already covered underAnnual Survey of Industries. It was also found in afew cases that the units were involved in some otheractivity rather than service.
(iv) There were lot of causalities as out of 998 list frameenterprises; only 438 enterprises could ultimately besurveyed.
(v) In rural sample with very high population/area,formation of Segment 9 in Area Frame samples forlisting big enterprises having 50 or more workerswas found to be very time consuming (and createdunnecessary fatigue among fieldworkers ).
(vi) There were some census 2001 towns andoutgrowths (OGs) for which UFS updating workswere not completed and such towns/OGs wereselected as an FSU. In all such towns/OGs, listingof big enterprises for formation of Segment 9 washuge task for fieldworkers.

SARVEKSHANA 31
2.2.1.2 It was observed that in some cases a particularFSU was repeated 5 times in a sub-round and 11 times inthe entire round. Even, repetition also occurred betweenState and Central samples. The real problem faced duringcanvassing of schedules in repeated FSUs was that eventhe cooperative informants turned hostile on subsequentvisits.
2.2.1.3 The provision in the listing schedule forrecording all NAEs in column 15 (serial number) of block-5a (list of households and non-agricultural enterprises)helped in preparation of the list of the service sector unitswith minimum omission. However, the transfer of entriesfrom column - 19 and 17 from block-5a to block-5bsometimes resulted in copying errors. There were chancesof omission of such enterprises, which were not in existenceon the date of survey but operated during the last 365 dayspreceding the date of survey. There was also the possibilityof omission of invisible enterprises like tuition taking,brokerage, etc at listing stage. There were enterprises, whichcarried out more than one activity simultaneously. Each ofsuch activity was to be treated as separate enterprise ifinformation for these activities was separately available. Ifaccounts were not separable then the enterprise is classifiedas having mixed activity. In some cases the enterprises thatcarry out more than one activity simultaneously may nothave been recorded correctly. Thus there were chances ofomission of such enterprises. Difficulties were experiencedto collect information for column 21 & 22 in block-5b ontotal number of workers including both household workersand hired workers (including apprentices, paid or unpaid)usually working on a working day during reference yearfor perennial and casual enterprises and during the lastworking season of the reference year for seasonalenterprises. The general tendency of the informants was tohide information on number of workers hired. The underreporting of the hired workers was mainly due to theapplication of Labour Act (which?). There were instancesthe informant changed versions regarding hired worker fromlisting stage to detailed enquiry stage ( number may bechanging due to seasonality ?)
2.2.1.4 As per procedural instructions, industries thatfetched maximum earning/employment in case of mixedactivities were to be recorded at the listing stage. Thisresulted in many enterprises doing mixed activities (tradewith service or manufacturing with service) becoming
ineligible for survey coverage at listing stage as the sharesof service activities of the enterprises were less than otheractivities.
2.2.1.5 It was found, in many cases that the informantdenied the existence of a particular enterprise run from thehouse despite display of signboard for a particular enterprise.
2.2.1.6 Self Help Groups were generally not physicallyvisible in sample FSU, so SHGs might have been missed atlisting stage in some cases.
2.2.1.7 Preparation of frame for selection (8-secondstage strata (SSS) in each segment 1&2) and selection ofenterprises had been carried out in a very lengthy way usinga fairly complex procedure, which had sometimes led tomistakes.
2.2.2 Survey on Service Sector Enterprises (Schedule2.345)
2.2.2.1 Whenever a branch unit was selected in AreaFrame whose head office was situated in another city, itwas, in general, difficult to get the information from thebranch unit. In many cases, the branch units showedresistance to provide the information. In some cases, thehead office of enterprise was also not maintaining branch-wise details to furnish information. As per instruction, dataon receipts, expenses, wages, rent, interest, etc. were tobe apportioned using the number of workers in the selectedbranch and number of workers considering all the branches.This process was time consuming and generally informationwas obtained by persuasions and approximation.
2.2.2.2 For enterprises where data was to be collectedfor the last 30 days, sometimes a situation was encounteredwhen the enterprise did not work during the last 30 daysbeing lean period for the unit. In such cases, data in most ofthe blocks was left blank. Likewise in case of enterpriseswhich operated only for two months during the referenceyear and where data was to be collected for last operatingmonth, the enterprises found it very difficult to recall theinformation after a long period. The situation was moredifficult in case of seasonal and casual type of enterprises.
2.2.2.3 Chartered Accountants and Advocates had adoubt whether the schedule was meant for them as all thepossible services found place in sub-heading of the scheduleexcept legal activities and accounting.

32 SARVEKSHANA
2.2.2.4 Some of the block and item specific problemsand experiences of the field are as follows:
i) Block 2.1: problem was felt while recording ‘numberof hours the enterprise normally worked in a day initem 206-207, ‘location of enterprise’ in item 220for rentiers as they may not spend even five to tenminutes for the main activity as the tenant depositthe rent at bank.
ii) Block 2.1: In case the ownership type of sampleenterprise was proprietary or partnership, someinformation of this block e.g. items 209-216 wererelated to the working owner. Wherever the ownerwas not available, no other person could providethe desired information properly as almost all theinformation was of personal nature.
iii) Bl.2.1: In a few cases informants/owners did notknow under which Act their establishments wereregistered (item 229-235). Beside, in item 233,information about service tax registration was alsodifficult to obtain as informant showed reluctanceassuming their enterprise was going to be leviedservice tax.
iv) Bl. 2.2: There were difficulties in collectinginformation on age of transport vehicles in column 4to 7 and their load capacity in column 7 as thisinformation was not available with the informant inmost of the cases.
v) Bl.2.3: It was very difficult to collect information foritems 252 to 257 in case of large cooperative societywherein a large number of members had taken loansfrom the SHG.
vi) Bl.3: Enterprises engaged with transport activitieswere unable to provide information on expensesincurred on tyres, tubes and batteries (item 306)particularly in those enterprises where books ofaccounts were not maintained.
vii) Bl.3: It was very difficult to collect information onitem 316 and 317 in case of commercial propertieswhich were rented out and the owner did not stay inthe place of survey.
viii) Bl. 4& 4.1: Bifurcation of receipts for those unitshaving both Hotel and Restaurant facilities, was
difficult as separate accounts for both the activitieswere not maintained.
ix) Bl.5: This block remained almost blank in case ofthose enterprises that had not maintained their booksof accounts as various entries in this block were tobe recorded from the balance sheet of the enterprise.There were difficulties in collecting information forthis block particularly for items 511 to 533 as mostof the enterprises did not have their books ofaccounts maintained and certain terminologies usedin this block i.e. transfer to reserves (item513), gainon exchange(item538), excess provision writtenback(item 542) were less explained in theInstructions to Field Staff Volume-I.
x) Bl.7.1: There were many cases of list frameenterprises having a large number of branches andgetting details of each of them was extremely difficultand time consuming.
xi) Bl.9 & 10: For those enterprises that providedinformation orally and whose working proprietorswere not available, it was almost impossible to obtaininformation on market value of fixed/current assetsas well as financial liabilities of the enterprise asinformants were hesitant/ reluctant to give information.Further, where informant was proprietor himself, heintended to under report the asset figures and overreport the liability figures. Hence, information in theseblocks (could be obtained through approximationonly?) were not exact.
2.2.3 Consumer Expenditure Survey (Schedule 1.0)
This schedule besides being lengthy and time consumingposed specific problems as under:
i) In case of consumption of vegetables and fruits(items 190-247 in block 5), generally, the informantfailed to recall consumption of different items of fruitsand vegetables quantity wise but was able to give anoverall expenditure on fruits and vegetables. In facteven the period of 30 days was too long for theseitems.
ii) Item 352: Imputation of value of gobar gas wasalmost impossible to the informant as well asInvestigator.

SARVEKSHANA 33
iii) It was difficult for the informants to recall exactnumber and amount of expenditure on clothing,bedding and footwear. They could only tell theoverall expenditure. For example, reporting ofnumber of under garments used in last 365 days fora large family was difficult and embarrassing.Likewise in some cases there was problem of recalllapses for minor repairs on durable goods. Even thebifurcated information on medical (institutional)goods and services were rarely available. Alsoinformation on sanitary napkins was difficult to becollected. This might have been clubbed with theother toilet items.
3: Data Processing issues
3.1 Introduction: The data of each subject of enquiryhas its own distinctive features. Whereas the data ofhousehold expenditure is based on recall of consumptiondetails by the respondent of the sample household, the dataof enterprise survey is captured mostly from the officerecords of the sample enterprise. Collected data, of course,is always subject to various types of non-sampling error,due to lack of understanding of concepts and definitions onthe part of the data collector, lack of adequate clarity in theinstructions to the field staff, unavailability of data at therequired level of details, respondent resistance, and so on.But in case of the enterprise survey, collected data suffersfrom an altogether different type of deficiency from that ofhousehold surveys. This is mainly due to problem intransformation of the financial figures available in theenterprise office records to the format of NSS schedule. Inthe small enterprises problems may be ascribed to non-disclosure of commercial information by the owner. Whileprocessing a huge mass of data as handled by DataProcessing Division (DPD) of NSSO, various kinds ofabnormalities in the collected data have been observed.Documentation of these along with the technical treatmentthey were subjected to will decide help planning anddesigning various stages of survey operations, dataprocessing and analysis.
It is needless to emphasize that greater care at the stageof developing a suitable survey methodology and also atthe stage of primary data collection will ultimately result infaster data processing, and in turn, quicker disseminationof survey results. An attempt has been made in this note tolist the experiences gained while processing NSS
63rd Round data and also to suggest measures that mightprevent recurrence of the major problems encountered,especially in surveys on unorganized sector enterprises, asthe NSS goes into its 67th round.
3.2 Schedule 2.345: Service Sector Enterprises(excluding Trade)
3.2.1 Coverage: The 63rd round (July 2006 - June2007) of NSS covered service sector enterprises (excludingTrade). All service sector enterprises, which are not coveredunder the Annual Survey of Industries (ASI), were underthe coverage of the survey. Government and public sectorundertakings, and a few other special types of enterpriseswere excluded. Service sector enterprises coming underthe NIC category 55, 602, 61, 63, 64, 659, 66, 67, 70,71, 72, 73, 74, 80, 85, 90 ,9191, 9199, 92 and 93 werecovered. That means data were collected from the followinggroup of enterprises:
Sl. Category of enterprisesNo.
1 hotels and restaurants (NIC-04 group 551 and552)
2 transport (NIC-04 group 602, 611, 612, class 6301and 6303 to 6309)
3 storage (NIC-04 class 6302)
4 communications (NIC-04 group 641 and 642)
5 real estate, renting and business activities (NIC-04 division 70 - 74 excluding 70103)
6 education (NIC-04 group 801, 802, 803 and 809)
7 health and social work (NIC-04 group 851, 852and 853)
In 63rd round, DPD processed 51.92 lakh records ofsch.2.345, in respect of 191,179 sample enterprises. Ithas always been the experience in the past that enterprisesurvey data are more difficult to control i.e. to bring it to asatisfactory level of accuracy through validation. In 63rd
round, data validation work was completed byMarch, 2008, but the subsequent stages of tabulation, editand post-tabulation checks had taken comparatively moretime. However, data and reports relating to Sch.1.0 of63rd round were finalised much earlier.

34 SARVEKSHANA
3.3 Experience in Sampling
3.3.1 Non-UFS towns and OG: In 63rd round, it wasnoticed for the first time that many newly declared smalltowns and outgrowths (OGs) which were declared as urbanin census 2001, are being omitted in the NSSO frame, asUFS work was not yet done there. It was expected thatnewly emerging industries will mostly be found in theseoutgrowth urban areas, and hence for an enterprise surveyit is very important to cover these areas. By careful manualscrutiny, a separate list of such towns/OGs was preparedand that was used as a frame for such towns and OGs inurban sector. All these non-UFS towns and OGs of Census2001 were put in a separate urban sub-stratum and thewhole town/ OG was considered as FSU for sampleselection.
3.4 Data of List Frame Enterprises
3.4.1 List frame Enterprises: A list of about 1000 largeenterprises spread across the country, where data werecollected without any sub-round restriction. Out of 998list-frame enterprises surveyed, as many as 574(=58%)were surveyed during last 3 months of the survey anddespatched thereafter. As a result, receipts of the schedulesof these big enterprises were concentrated towards the endof the data processing cycle. Perhaps, the field staff had towait for the accounting year to complete, to get the requiredinformation from the enterprise.
3.4.2 Information relating to branches: The list frameenterprises did not have information on the State to whichthey/ their branches belonged. The enterprise and brancheswere excluded from the area frame to avoid duplicateestimation. Some special problems were faced while dataprocessing of this category of enterprises:
(a) Out of 998 list frame enterprises, information relatingto branches were available only for 148 cases.
(b) Significant no. of cases with no. of employees aslow as 1-2 and large no branches. In fact, out of998 enterprises, 564(=57%) did not report anyworker at all. 66(=7%) reported = 5 workers. Onthe other hand, there were 55 enterprises reportingmore than 1000 workers (4 of them with more than28000 workers!).
(c) Non-reporting of workers was mainly due to thefact that the respondents in the Corporate Head
Office were not able to provide the number ofemployees in branches.
(d) Similarly, information on wages was altogethermissing in respect of about 558= (56%) cases.
(e) As major branches of some big enterprises weredistributed in several states, state and sector codewas not recorded/ data-entered in case of 148(=15%) enterprises, out of which 25 reported tohave branches. This caused problem in tabulatingthe data and references were made to the samplelist at the time of tabulation.
(f) Obviously, rural/urban classification of suchenterprises made in the sample list may not becompatible with its actual operational data.
3.5. Detail Schedule data (Sch. 2.345)
The main data processing issues are as follows:
3.5.1 Block-void cases: Data were to be filled inspecified sub-blocks in the schedules for different enterprisecategories. For examples, for hotels and restaurantsexpenditure figures were to be given at sub-block(item.301-304), and the receipt details at sub-block(item.401-404). Accordingly, validation rules were alsoframed. But in a large number of schedules figures werenot furnished in the respective blocks. Rather, they wereclubbed into blocks titled ‘other expenses’ (Blk-3.1) or‘other receipts’ (Blk.-4.1). In most of these cases, littlecorrections could be made. But each of these cases requireddetailed checking. Block-void cases that remained in thedata even after validation and field references are presentedbelow.
Sl. Category of No. of No. of % No. No. of % No.No. enterprises sample Block- of cases Block- of cases
enter- void voidprises (Expenses (Receipt
Block) Block)
1 hotels and restaurants 30746 564 1.8 341 1.1(NIC-04 group 551and 552)
2 transport (NIC-04 42526 2049 4.8 639 1.5group 602, 611, 612,class 6301 and 6303to 6309)
3 storage (NIC-04 82 16 19.5 5 6.1class 6302)

SARVEKSHANA 35
Sl. Category of No. of No. of % No. No. of % No.No. enterprises sample Block- of cases Block- of cases
enter- void voidprises (Expen- (Receipt
ses Block) Block)
4 communications 22898 239 1 171 0.7(NIC-04 group641 and 642)
5 real estate, renting 20731 3096 14.9 1310 6.3and business activities(NIC-04 division70 - 74 excluding70103)
6 education (NIC-04 12285 802 6.5 202 1.6group 801, 802,803 and 809)
7 health and social 11937 652 5.5 228 1.9work (NIC-04group 851, 852and 853)
As an example, there were many cases of ‘Cybercafes’which wrongly reported expenditure/ receipts in items 314and 411 leaving blank their allotted sub-blocks i.e. items316-317 and items 412-413.
3.5.2 Mixed activities: Another aspect of reporting atwrong sub-block was in respect of enterprises having mixedactivities. Because of incorrect reporting, it was difficult toascertain which activity was major and which one is minor.
In about 3% of the cases reporting mixed activity(8515 in number), NIC code of the second activity wasnot specified or invalid.
For small units with multiple activities and not keepingseparate accounts it was difficult to assign correct NICcodes by looking at the supportive evidences available inthe schedule.
3.6 Experiences at the Tabulation stage
3.6.1 Unacceptable GVA per worker: At the tabulationstage, the doubtful cases of large negative GVAs andunacceptable levels of GVA per workers in some of theState x Tabulation Category were again referred to the DPCentres for in-depth scrutiny. In many cases it was found,that data were collected for 1 year but it was reported asfor one month ( as for oral enquiry, it is to be one monthreference). Hence, medium-sized positive/negative GVAgot unnecessarily multiplied by 12 resulting into largepositive/negative GVA. One Computer-edit rule of making‘blank’ number of workers into ‘1’ added further
complications to the problem. Some of these cases hadupset the estimates even at State × Tabulation Categorylevel. A fairly large number of such suspected cases werere-checked in detailed, before GVA tables could befinalised. This consumed additional time that was notexpected.
3.6.2 Enterprises having Branches: In this round inaddition to the area frame units, it was proposed to canvass1000 list frame units. As per the lay out of the scheduledesign, for the list frame units, in Block 1, items 6 to 16 (i.e.ID particulars where state and sector code is recorded) werenot required to be filled in. So there was a problem ofobtaining state and sector code for the list frame units. Hencethere was necessity to ascertain state and sector code foreach of the list frame unit before tabulation. In this connection,an imputation procedure as follows was adopted:
In all the list frame units canvassed, whenever usablebranch-wise details (bl 7.1) were available, the values areto be apportioned depending on the number of workers atthe state and sector level. Wherever such information wasnot available, the state and sector code of the place whereit was surveyed is to be taken. It was found that out of1000 units, only in 148 units branch-wise details wereavailable. For the remaining 852 units state and sector codehad to be obtained by looking into the sample list. Anyaggregate for any sector x state has to be derived in aproportionate manner — the proportion will be the ratio ofnumber of workers of a branch to the total number ofworkers recorded in block 7.1.
While examining the validated data it was observedthat the following problems could arise.
(i) Enterprises having branches abroad (state code 40)were found in 6 cases. The proportional contributionof these branches will have to be excluded duringstate x sector aggregation.
(ii) Enterprises were found having branches but stateand sector code as blank. 25 such cases were found.
(iii) Enterprises were found having large number ofbranches (as large as 177) with number of workersas low as 1 or 2. So distributing the workers intodifferent state and sector code with male/female/working owner/ hired/ full time / part time etc. wasnot possible.
36 SARVEKSHANA
Also total number of vehicles recorded in block 2.2 couldnot be segregated for each of the branches.
In view of the above difficulties, it was decided thatbranch-wise segregation of list frame data was not feasibleand each unit was taken as single unit for estimation purpose.State and sector code of each unit was taken where it wascanvassed as per sample list of the list frame. Howeversome special tables were generated from these branch-wisedetails as per the procedure and tabulation plan providedseparately. Had the provision for collecting information onstate and sector for the list frame units could be made atthe stage of designing the schedule, such complications andadjustments could be avoided at the tabulation stage,requiring lot of additional time for table and data finalization.
3.6.3 Imputation of workers and emoluments: At thetime of tabulation, it was detected that in a large no. ofcases, no. of workers were ‘0’ or blank whereasemoluments were >0 and vice versa. It was verified fromfilled-in schedules also. Earlier, it was suggested by SDRDin the auto correction programme that whenever totalnumbers of workers in an enterprise were found to be ‘0’or blank, it should be replaced by ‘1’. Depending on typeof ownership and enterprise type, item 702 / item 711 wasmade ‘1’ and hence total no. of workers resulting in ‘1’.But subsequently, when tables were generated, it was foundthat GVA per worker and Annual emolument per workerwere so abnormal that tables were not presentable.Thereafter, several alternative procedures for imputationof “workers from emoluments” and “emoluments fromworkers” were tried out, and each time fresh software hadto be developed. As a result, full procedure of generatingtables — starting from editing, imputation, generation ofmultiplier, posting of multiplier, generation of work files,generation of tables etc. — could be finished only aftercompletion of a few long-drawn iterative cycles.
3.6.4. In about 60 % cases list frame units were foundto be casualty as proper care was not taken to excludeASI units from the coverage of the list frame units. Butthere were some List Frame Units which were undoubtedlyunder the coverage of the survey and data could not becollected for them due to some reasons. Some suitablemultiplying factors were used in some cases to obtain thepopulation figure for the List Frame Units. Otherwise, herewere no multiplier (i.e., multiplier = 1.00) for all the ListFrame Units.
3.7 New Challenges Faced in the 63rd Round
3.7.1 New areas of data collection
The “public works” columns introduced in thedemographic block, though not absolutely new to NSS asthey had appeared earlier in Schedule 10 of the 62nd round,should be mentioned here as they seem to be still affectedby the conceptual problems characteristic of new data items.Failure to make entries in the “no. of days worked” columnas well as the “wages” columns when such entries werenecessary, was frequent. The wages data were furthermessed up by a conceptual error: in many cases it wasobvious that the investigator had entered the daily wagerate instead of the total amount received as wages in 365days (note that the wage rate was required in Block 9 ofSch.0.0). Although a broad column heading “total wagesreceived (Rs.)” had been provided in the block across thewages columns, it appears on hindsight that “total wagesreceived (Rs.) in 365 days” would have been a betteralternative.
Example 1: In this round instructions were given torecord value less than Rs. 0.50 as zero. But the check“quantity=0 if and only if value=0” remained unaltered. Forsome cases where value thus became recorded as 0 thoughquantity consumed was > 0 (e.g. against matchbox), muchtime was wasted in validating the data. The anomaliesremained and, as one might expect, a number of queries werereceived on this matter from users of unit level data.
3.8 Recurring Problems of the Consumer ExpenditureSchedule
3.8.1. Problems removable through redesign of schedules
The most obvious example of this kind of problem isthe durable goods block (see Annexure-I ). It is taken upat the end, when the informant has already become restlessand the investigator has to be quick with his questions andwriting down. At this point there comes a block that hasthe most complicated structure among all the blocks of theconsumer expenditure. It has columns for purchase andrepair, first-hand and second-hand, number and value, andfinally, a code for ‘whether hire-purchased’. Moreover thepositioning of these columns does not follow a simplepattern. For example, the treatment of ‘first-hand andsecond-hand’ is not symmetric. The block thus lacks thesymmetry and simplicity of most of the preceding blocks.Matters are further complicated by a completely avoidableattempt to shade or blacken out the cells for which

SARVEKSHANA 37
information is not deemed to be necessary. The logic behindthe choice of cells to be shaded is not always clear. Thefall-out is that entry in a row is sometimes planned to startfrom col. 3, sometimes from col. 4, sometimes from col. 5and sometimes from col. 6. It is not at all surprising, underthe circumstances, that the entries for numbers purchasedor codes for ‘whether hire-purchased’ get entered in thevalue columns, creating cars worth Re.1 or Rs. 2 to thebewilderment of unit level data users.
3.8.2 Problems removable through morecomprehensive instructions
The range of items of human consumption is soenormously wide that one cannot have an item in theschedule for every kind of food that is consumed in India.Thus, many items in the schedule have each got to cover arange of foods or non-food articles. This being so, it is thejob of the instructions manual to specify, at least for all thecommonly consumed food and non-food articles, the exactitem in the schedule against which consumption of that articleis to be recorded. Otherwise, a great deal of consumptionwill be missed, giving the estimates a downward bias. Underthe circumstances, it is inexplicable that a food as widelyconsumed in India as ‘papad’, which, in fact, has a strongclaim to be accorded the status of a separate item, has yetto find a place either in the schedule or in the instructions.On the other hand ‘ganja’, in spite of being rarely reportedand attracting data of doubtful quality, continues to enjoyseparate- item status when it is high time it is clubbed with“other intoxicants”. FOD officials have, during this roundas in earlier rounds, expressed their ignorance as to where‘papad’ is to be reported.
It needs also to be emphasized that the item break-upof the group “beverages, refreshments and processed food”needs to be examined afresh in the light of the growingimportance of this group with economic development andthe aggressive marketing strategies of multinationalcorporations. For one thing, it preferable to have a separatesub-group for ready-to-eat snacks consumed away fromhome such as samosas, chowmein, paw bhaji, etc., asopposed to packets of semi-processed food such as“chow”, papad, Maggi noodles, etc. There are two reasonsfor this. One is that separating the two types of processedfood helps and increases recall. The other is that prices ofthe ‘ready-to-eat’ variety are typically higher, and the caloriecontent per rupee commensurately lower.
3.9 Problems avoidable through better field work
A great variety of data problems fall into this category.One example is the NIC and NCO codes of the householdcharacteristics block (Block 3). These are often inconsistentwith the household industry and occupation descriptions.They are also often inconsistent with household type,reported in the same block. These are persistent problems,suggesting that some training needs to be speciallyconducted, or some training time specially set aside, forthese items alone.
Other examples of recurrent data deficiencies that canbe overcome through better field efforts include data onquantity. Cases of missing quantity, or quantity inconsistentwith value, can be easily detected and corrected throughfield scrutiny and unnecessary editing at later stages avoided.
3.10 Problems due to non-cooperativeness ofinformants
It is well-known that of all schedules, the consumerexpenditure schedule remains the one which arouses thegreatest amount of suspicion and hostility among informants,especially of the affluent variety. This is mainly because itappears to unnecessarily intrude upon the privacy of thehousehold. It is quite possible that cases of missing quantityor value, for instance, arise from the informant’s refusal toanswer not one but two questions, one on quantity andanother on value, on even the most unimportant food articlessuch as chillies and capsicum. An attempt should be madein every round to reduce schedule bulk by weeding out theitems with least contribution to the average MPCE in thepreceding round.
Ultimately, the solution to such problems depends onthe collective will of the NSS and its stakeholders to collectrealistic data.
3.11 Schedule 0.0: List of Households and Non-agricultural Enterprises
The following are the main observations on thisschedule.
(a) High casualty in SSS: In this round of enterprisesurvey, 8 SSS’s were to be formed in each area-frame FSU, and 24 enterprises were to be surveyedfrom each FSU. But in reality, only 190,181enterprises were surveyed in 12,898 such FSUs,

38 SARVEKSHANA
giving a per-FSU count of enterprises of 15. Thusmany of the SSS’s had only a few enterprises, whichmight have affected the multiplier and reliability.Average number of enterprises surveyed in each SSSis given below:
Avg. no. of enterprises surveyed
SSS no. Without HG* With HGformation formation
1 2.00 1.532 1.59 1.453 1.19 1.274 2.75 2.435 3.89 3.276 4.25 2.597 2.44 2.198 11.70 8.41
*Hamlet Group (HG)
It may be seen that SSS-8 had been grossly over-sampled, at the cost of inadequate netting of other classifiedtypes of enterprises. In SSS-8, i.e. group of unclassifiedOAEs, as many as 1,23,667 enterprises were listed, whichis 65% of the total number of area-frame enterprises.
(b) Misclassification of enterprises into SSS at listingstage: Extent of differences in classification intoSSS at listing stage and after canvassing the detailedschedule was found to be negligible. The table belowgives the figures:
SSS As per NIC At listingnumber code in the stage
DetailedSchedule
1 1892 1943
2 665 657
3 254 221
4 8922 9848
5 30295 29638
SSS As per NIC At listingnumber code in the stage
DetailedSchedule
6 11662 14114
7 10624 10293
8 148041 123667
(c) Segment 9 enterprises: There were 202 FSUs underSegment 9, having 378 eligible enterprises in them.Hence average number of sampled enterprises wasonly about 2 per FSU.
(d) NIC codes recorded under col. 17 (NIC) did notmatch with the description of col.16 (description ofactivities).
(e) Discrepancies were found in case of compensationrule in the event of shortfall of enterprises. Theprescribed priority order was not followed there.
(f) In Col.1, Block 2, the figures were reported againsthouse no. with alphabet, hyphen, slash, etc. As thedata entry package did not allow entry of alphacharacters, the data transcription has been made byignoring hyphens, slashes and other non numericalcharacters. Had the field personnel been sensitizedin time to the implications of recording suchcharacters, much time spent on an unnecessary datacleaning job would have been saved.
3.12 Misclassification of enterprises among thedifferent second stage strata
The misclassification of enterprises among the differentsecond stage strata, has been examined by the Bangalurucentre (See Annexure-IV).
3.12.1 To study the extent of the misclassification ofthe enterprise among the Second Stage Strata, the datawith respect to NIC code, and enterprise code, werecompared with Second Stage Strata classification.Accordingly, we have arrived the frequency ofmisclassification as indicated below.

SARVEKSHANA 39
SR STATE/ No. of No. of R-1 R-2 R-3 R-4 R-5 R-6 R-7 R-8 R-9 R-10SECTOR SSUs in SSUs in
Processed Error
I KTK(R) 855 5 1 0 0 2 1 0 0 1 2 1
KTK(U) 1595 22 2 0 0 11 2 1 5 1 4 5
TN(R) 2208 15 3 0 0 4 1 1 2 4 4 6
TN(U) 2935 42 2 4 0 8 8 2 9 9 15 19
II KTK(R) 994 5 0 0 0 0 0 0 4 1 0 1
KTK(U) 1569 16 0 0 0 9 0 0 2 5 0 7
TN(R) 2221 7 0 0 0 2 0 0 0 5 0 5
TN(U) 2705 23 0 1 1 4 2 0 8 7 2 10
III KTK(R) 771 4 0 0 0 3 0 0 0 1 0 1
KTK(U) 1263 12 0 0 0 5 3 2 0 2 3 4
TN(R) 1969 5 0 0 0 5 0 0 0 0 0 0
TN(U) 2176 14 1 0 0 4 0 1 3 5 1 9
IV KTK(R) 973 6 0 0 0 3 2 0 0 1 2 1
KTK(U) 1322 23 3 0 0 12 3 0 0 5 6 5
TN(R) 1979 2 0 0 0 0 0 0 0 2 0 2
TN(U) 1987 18 1 0 0 4 7 2 0 4 9 6
Total 27522 219 13 5 1 76 29 9 33 53 48 82
(Rules are enclosed as Annexure-V)
3.12.2 In few cases we have identified that theenterprise code reported in the listing schedule differs fromthe detailed schedule 2.345. For example, in listing scheduleenterprise was reported as “OAE”, while in the detailedschedule the same was reported as “Establishment”.
3.12.3 The coding structure is not uniform in the listingas well as detailed schedule 2.345. The coding was ‘1’ forestablishments and ‘2’ for own account enterprises in listingschedule, where as in schedule 2.345, the coding was ‘2’for establishments and ‘1’ for own account enterprises. Thisdifferent coding structure may be one of the reasons for themisclassification. This may lead to confusion for the fieldinvestigator in giving proper coding.
3.12.4 For example, all establishments having NIC code6301,6303,6304,6309 etc. should have been classified
under SSS4. But as per instructions NIC 6302 should goto SSS2 and 6305, 6306 should go to SSS5. Such a robustclassification may lead to confusion in classifying theestablishments/OAEs by the investigators.
3.12.5 On examining the distribution of errors acrossthe second stage strata 219 no. of SSUs in error wereobserved out of 1632 FSU’s canvassed. The patterns oferror were not randomly distributed, but more concentratedin SSS4, SSS5, SSS7 and SSS8. This would probablyhave overall impact on the estimation.
3.12.6 An attempt was made to classify the 219misclassified SSS out of 27522 SSS canvassed. Theseschedules are classified into appropriate SSS with the helpof NIC and establishment codes. The details are givenbelow.

40 SARVEKSHANA
SSS 1 2 3 4 5 6 7 8 Total
Total Schedules Canvassed 420 99 39 1411 4345 3671 1437 16100 27522
Wrong Classification 13 5 1 76 29 9 33 53 219
Correct Classification 8 1 0 12 137 15 5 41 219
Net 415 95 38 1347 4453 3677 1409 16088 27522
Percentage Change -1.2 -4.0 -2.6 -4.5 2.5 0.2 -1.9 -0.1
3.12.7 It may be observed from the above table, theestimates relating to SSS2, SSS3, SSS4, and SSS7 areoverestimated, where as that of SSS5 is underestimated. Itmay be inferred from the above, such a robust classificationwill have impact on the estimation.
4. Certain conceptual issues and operationalexperience
4.1 Introduction: Schedule of enquiry designed forenterprise survey of NSS 63rd round was one of the mostcomplex schedules designed for any enterprise survey inthe history of NSS. In the course of field-work and dataprocessing and tabulation, considerable difficulties wereexperienced. After the trial tables were generated,considerable efforts were put in to remove the anomalies inthe tables owing to omissions or commissions in the scheduledesigning stage and data collection stage. The followingsections give a critical assessment of enterprise survey ofNSS 63rd round based on the experience of tabulating theresults.
4.2 Issues related to sample size:
4.2.1 The issue of sample size needs properconsideration for giving disaggregated estimates like ‘all-India x Tabulation category’, ‘State x Tabulation category’etc. As for example, ‘storage and warehousing’ units notcovered under ASI were surveyed in NSS 63rd round. Butestimates generated for ‘estimated number of enterprises’,estimated number of workers, GVA per worker etc. issubject to high relative standard (RSE) error. The followingtable may be seen.
Table 1: Relative Standard Errors (RSE) by sector
Storage and Ware- Relative Standard housing (I1) Error (RSE)
Rural Urban
Est. no. of enterprises 44.7 20.2
Est. no. of workers 48.0 38.6
GVA per enterprise 20.0 44.79
GVA per worker 28.3 23.5
4.2.2 GVA estimates of State x Tabulation Category(I1) have come blank in many states in the tabulated resultsthough such estimates were generated in 57th round survey.This is possibly because the number of FSUs surveyed in63rd round (13271 FSUs) was much lower than the samefor 57th round (15869 FSUs). Consequently, in the selectedvillages and UFS blocks in several states during listing stage,no sample enterprise was found under ‘storage andwarehousing (I1)’. To illustrate, State-wise sample-sizeunder tabulation category I1 in 57th round and 63rd roundis presented in Annexure-II. Only 82 sample enterpriseswere surveyed in 63rd round as against 726 enterprises in57th round.
5. Divergences in the Estimates of Number ofEstablishments and Workers Engaged in theServices Sector in India as per NSS 63rd Roundand Economic Census 2005
5.1 Introduction: Apart from the NSS follow-upsurveys, information on number of establishments andworkers is also available from the Economic Censuses (EC)conducted from time to time. The last EC was conductedduring 2005. Although survey period of NSS 63rd round

SARVEKSHANA 41
(2006-07) differs from that of EC 2005, it may be usefulto study the closeness of the related estimates based on thetwo sources. Scope of this paper is confined to this studywith a view to identifying the sub-domains/activities withinthe services sector where the divergence is more prominentso that remedial corrective measures can be taken in future.
NSS 63rd round did not cover establishments belongingto government and public sector. Accordingly, figures basedon EC 2005 presented in this report do not include suchestablishments to make the comparison with the NSSmeaningful. Further, in all the statistical tables, only thoseactivities of services sector have been considered for whichseparate estimates are available in the released NSS reports.
5.2 Findings on the divergences in the alternativeestimates
A. All establishments taken together
Table 2 shows the divergence in the number ofestablishments and number of workers in terms of ratio ofNSS estimate to that of EC. It may be seen that, in general,across all activities except hotels and storage &warehousing, NSS estimate is much higher than that of EC.The divergence is quite alarming in case of communications,non-banking financial intermediation, and insurance &pension funding. The time difference in the conduct offieldwork of the two sources cannot probably explain thesaid divergence.
Table 2: Divergence with regard to number of establishments and workers
Number of Ratio of Number of Ratio ofestablishments NSS to workers NSS to
NSS 63rd EC 2005 EC NSS 63rd EC 2005 ECRound Round
(1) (2) (3) (4) (5) (6) (7)
Hotels 69318 215500 0.32 440658 769721 0.57
Restaurants 1990393 1249438 1.59 4693097 2878265 1.63
Storage and Warehousing 2719 95221 0.03 17910 263707 0.07
Communications 1893347 623994 3.03 2665392 1101650 2.42
Non Banking financial 1285330 98429 13.06 5332671 325632 16.38 Intermediation*
Insurance and pension 228718 66372 3.45 437814 164796 2.66 funding
Real Estate, renting and 1400966 996398 1.41 3098087 2572698 1.20 Business activities
Education 1041208 544418 1.91 3873975 2827658 1.37
Health and Social work 1094815 596334 1.84 2181238 1655093 1.32
Other Community, social and 3128230 2372069 1.32 5088172 4342998 1.17 personal services
All 12135044 6858173 1.77 27829014 16902218 1.65
* Excluding insurance and pension funding.
B. Divergence by type of establishment
If we look at the extent of divergence in the figures ofboth number of establishments and number of workers bytype of establishments in terms of whether they hiredworkers or not, the former being categorized as OwnAccount Establishments (OAEs), interestingly it reveals that
(see Tables 3 and 4) estimates of number of OAEs as perNSS are much higher than those of EC across the activitycategories except hotels and storage & warehousing. Reverseis the case with ‘Other type of establishments’ which operatedwith the help of hired workers. For such units, EC figuresare generally found to be on the higher side.
Activity

42 SARVEKSHANA
Table 3: Divergence in the total number of establishments by type of establishment
OAE Ratio of Others Ratio ofNSS 63rd EC 2005 NSS to NSS 63rd EC 2005 NSS to
Round EC Round EC
(1) (2) (3) (4) (5) (6) (7)
Hotels 8110 89156 0.09 61208 126344 0.48
Restaurants 1540298 742904 2.07 450095 506534 0.89
Storage and warehousing 678 42124 0.02 2041 53097 0.04
Communications 1753260 428939 4.09 140087 195055 0.72
Non Banking financial 1209330 44866 26.95 75999 53563 1.42 Intermediation*
Insurance and pension funding 198964 45252 4.40 29754 21120 1.41
Real Estate, renting and 1039673 538987 1.93 361293 457411 0.79 Business activities
Education 712596 199057 3.58 328612 345361 0.95
Health and Social work 813315 311335 2.61 281500 284999 0.99
Other Community, social and 2855429 1519973 1.88 272802 852096 0.32 personal services
All 10131653 3962593 2.56 2003391 2895580 0.69
Table 4: Divergence in the total number of workers by type of establishment
Ratio of Ratio ofNSS 63rd EC 2005 NSS to NSS 63rd EC 2005 NSS to
Round EC Round EC
(1) (2) (3) (4) (5) (6) (7)
Hotels 14724 138361 0.11 425934 631360 0.67
Restaurants 2654365 1021580 2.60 2038731 1856685 1.10
Storage and warehousing 787 49369 0.02 17123 214338 0.08
Communications 2227525 481166 4.63 437867 620484 0.71
Non Banking financial 4879945 84558 57.71 452726 241074 1.88 Intermediation*
Insurance and pension funding 211839 49306 4.30 225975 115490 1.96
Real Estate, renting and 1292441 645557 2.00 1805646 1927141 0.94 Business activities
Education 774060 278145 2.78 3099915 2549513 1.22
Health and Social work 896497 384930 2.33 1284741 1270163 1.01
Other Community, social and 4063251 1998940 2.03 1024921 2344058 0.44 personal services
All 17015434 5131912 3.32 10813579 11770306 0.92
* Excluding insurance and pension funding.
OAE Others
Activity
Activity

SARVEKSHANA 43
C. Divergence by rural and urban
The divergence in the alternative estimates by rural andurban is shown in Table 5. Problem is relatively more in
Table 5: Divergence (ratio of NSS estimate to EC) by rural and urban
Activity Number of establishments Number of workersRural Urban Rural Urban
(1) (2) (3) (4) (5)
Hotels 0.13 0.49 0.20 0.76
Restaurants 1.56 1.64 1.58 1.67
Storage and warehousing 0.03 0.03 0.05 0.07
Communications 3.82 2.52 3.62 1.87
Non Banking financial Intermediation* 26.04 2.72 35.25 3.28
Insurance and pension funding 4.73 2.77 3.63 2.41
Real Estate, renting and Business activities 1.43 1.39 1.18 1.21
Education 1.89 1.93 1.28 1.44
Health and Social work 2.43 1.34 1.58 1.19
Other Community, social and personal services 1.46 1.10 1.37 0.94
All 2.03 1.50 2.10 1.33
* Excluding insurance and pension funding
case of rural. The divergence is alarmingly high in case ofestablishments in the non-banking financial intermediationlocated in the rural areas.
6. Suggestions
6.1 In each of the sample FSUs, eligible enterpriseswere divided into 8 Second Stage Stratum (SSS). Forselection of sample enterprises, a separate block 5b wasprovided with 24 columns in which first two columns werecopied from the previous block 5a. In some cases, therewas possibility of errors while transferring entries from block5a to block 5b. The space provided in different columnsfor second stage stratification was too less hence there waspossibility of error in formation of SSS. Most of thefieldworkers were of the view that SSS may be minimizedto ensure correct sample selection if possible.
6.2 On the whole the experiment of list frame and itsmixing with the area frame complicated the field work. Asfar as possible, it should be avoided in future surveys.
6.3 The list frame enterprises did not respond favorably.Similar problem was faced in case of big enterprises (having50 or more workers). Many of the units were eitherreluctant or/and provided data in a haphazard manner. Manyenterprises, despite maintaining books of accounts neither
provided books of accounts nor revealed exact figureswhere information was collected orally.
6.4 While defining concept of household it has beenstated that foreign nationals and their domestic servantswill not be listed. However, if a foreign national becomesan Indian citizen for all practical purposes, he/she is to belisted as per definition provided in para 1.9.2(iv) at pageA-17. The term ‘becomes Indian citizen for all purposes’is not clear and should be elaborated. Similarly, now a days,period of under trial prisoners in jail extends up to yearstogether and as per definition provided in para 1.9.2(ii) atpage A-17, these persons are to be listed in their parenthouseholds. Keeping in view of long term stay at jail ofunder trial prisoners, it would be better to exclude undertrial prisoners who are in jail for more than six months.
6.5 The schedule 2.345 was most difficult to becanvassed. It took a lot of time in motivating the informantsfor response and required a lot of probing for getting reliabledata. Either the units (both list/area frame and other servicesector units) in businesslike manner did not have time to

44 SARVEKSHANA
spare or were busy in narrating their problems of facilitiesand finances and apathy of Govt. machinery. Besides,various terminologies used in the schedule were purelytechnical in nature for which elaborate instructions must beprovided to the field staff. A better understanding of balancesheet is required while canvassing in those enterprises thatare providing information from their books of account forwhich training to field staff by the experts of balance sheetcould be helpful.
6.6 There should be some space in the schedule tocarry out calculations in the schedule 2.345 so that it couldbe rechecked at any time for accuracy of data.
6.7 There should be some legal binding on enterprisesto provide information pertaining to their operationalcharacteristics which could be helpful in getting properresponse from reluctant informant particularly big enterprises.
6.8 In schedule 1.0, it was difficult for the informantsto recall exact number and amount of expenditure onclothing, bedding and footwear etc. and for minor repairson durable goods which had the reference period of last365 days. They could only tell the overall expenditure. It issuggested that 7 days reference period may be kept forfood items like edible oil, eggs, fish and meat, vegetable,fruits, spices, beverages etc.”
6.9 The informants were hesitant in giving informationon jewelry items and sanitary napkins. The item on sanitarynapkins may be clubbed with the other toilet items.
6.10 The feedback indicates a considerableimprovement in the awareness among people about NSSO.There is a need for enhancement of funds for theadvertisement of NSSO activities particularly throughelectronic media.
6.11 Over last five decades or so, field conditions havevastly changed, however, the service conditions of the fieldofficials have not changed much. They need motivation interms of recognition or incentive awards. Besides, propertraining on behavioral science and psychology, they shouldbe equipped with NSS survey results, pamphlets etc. toenable them to deal with urban informants.
6.12 Enterprises having books of accounts wereallowed to provide information orally if they chose to. Thiscreated an additional category of enterprises as far asprovision of information was concerned, which was given
a separate code. Again, the code entered was vital forinterpretation of the data collected. Just like 62nd Round,this aspect added an additional dimension of complicationsinto the data, which required more resources in dataprocessing.
6.13 In many cases copy of the balance sheet wasattached. DPD scrutinizing staff had no prior knowledgeof reading a balance sheet for checking the reported figuresin the schedule. Some exposure/brief training onaccountancy before the commencement of the dataprocessing activities would have been very useful. In fact,such training may be held for the Field Staff and DPD stafftogether, whenever enterprise surveys are taken up.
6.14 Had the issue of treatment of the enterprises havingbranches been planned and settled earlier, spendingadditional time at tabulation stage could have been avoided.
6.15 The absence of the sub-round restriction causesbulk of the schedules from these categories to be receivedat the very end of the survey period. This leaves little timeto detect and, through correspondence with the field, toprevent the occurrence of any more data affected byconceptual errors. In 63rd round, these were List FrameUnits, which are relatively big units, having more dataprocessing complications. It is quite important to introducea work schedule for these types of schedules.
6.16 Blocks-3.1 & 4.1: In number of cases blocks 3and 4 were found blank and the entire expenses and receiptwere found reported against blocks 3.1 and 4.1 only.
6.17 Blocks-3-5 & 6: In many cases it has been noticedthat for financial enterprises, data are found reported inblocks 3-5 instead of block-6 and the vice versa in fewcases.
6.18 Blocks-2.2 to 12: Instances were noticed withenterprises operated for few months and found not operatingfor the last 30 days at the time of survey. Howeverconsidering the period of last 365 days prior to survey,such enterprises were surveyed with the reference periodas last 30 days during which it was not operated. In suchcases blocks other than 0, 1 and 2.1 are found blank.
6.19 In many cases it was found that where the totalexpenses transferred to Balance Sheet as ‘PreliminaryExpenses’ or ‘Deferred Revenue Expenditure’, suchinformation was not properly transferred to the block

SARVEKSHANA 45
specified the matter was taken up with SDRD andinstructions were given to processing staff for correctingthe entry
6.20 Two items Deferred Revenue expenditure (pageC-99) and Preliminary expenditure (page C-100) (item1016) were shown in the Vol. I to be recorded in theliability side but as per schedule VI of the Companies Act itis to be recorded in the asset side. This too created confusionboth at the field and in the processing unit.
6.21 One of the problems for negative GVA was forthose companies which had not started functioning butregistered as enterprises therefore it was canvassed. Suchcompanies even enclosed balance sheet showing negativetransactions.
6.22 Checking of all the draft tables together for boththe reports of 63rd Rd. enterprise survey, would have helpeddetection and timely rectification of some of the critical dataproblems and inter-table inconsistencies, which causeddelay in report finalization.
6.23 The field for item no. 14 of Sch. 0.0 (i.e. framepopulation) is auto-generated. But the field staff puts somefigure either from their own understanding or from the samplelist. And the PDES check point for this item states that‘check the entries from the sample list & correct it’. Atleast the PDES check point for item 14 should be droppedwhen it is auto generated from sample list file. And it wouldbe better if the item is dropped from the schedule itself.
6.24 For column 1, block 2 of Sch. 0.0 (i.e. houseno.), the field people often puts some number with alphabet,slash, hyphen etc. As the field is a numeric only, keepingthe provision for writing running srl. No. in 1st column ofBlock 2 of the schedule may be thought of and the samemay also be entered.
6.25 For PDES & CSP of each schedule, the ‘actionto be taken if check fails’ should be clearly mentioned toenable the scrutinizers to take uniform 7 correct measure inrespect of the abnormalities/mistakes found in the schedules.
6.26 The particulars of the substituted samples shouldbe supplied to D. P. Centres as the necessity of the same isfelt at DCS during Id-checking.
6.27 Blocks 5, 6, 7: Generally the error codes appeardue to reporting of wrong total figures or missing ofconstituent items. To detect mistakes easily, the derivedtotals as per data entered may also be printed in the errorlist.
6.28 An attempt should be made to reduce schedulebulk by weeding out the items with least contribution to theaverage MPCE. In schedule 1.0 we have set of 400 odditems of information so is for the enterprise schedule(Sch.2.345). Annexure-III gives a list of least reported items ofschedule 1.0 .
6.29 The difficulties encountered during NSS 63rdround highlight the fact that a survey of very big enterprisesand small, medium and micro-enterprises should never bedone together. This leads to difficulties in adopting efficientsampling design. The survey also revealed that in theabsence of statutory legislation, attempts to cover bigenterprises through oral enquiry are not desirable. Theexperience of 63rd round led to the decision of coveringunincorporated manufacturing, trade and service sectorenterprises in NSS 67th round enterprise survey.
6.30 There are wide divergences in the figures thrownup by two sources. OAEs seem to have been grossly under-reported in the EC. There are wide divergences in the figuresof number of establishments/workers as per the two sourcesin case of hotels, storage & warehousing, communications,non-banking financial intermediation, insurance and pensionfunding, education, and health and social work. The reasonsfor divergences could be many like (a) lack of clarity of theconcepts and definition of the term ‘establishment’particularly in case of enumerators of EC, (b) under-listingof establishments in EC, and (c) sampling errors associatedwith the NSS estimates. Ascertaining of the exact reasonswould require in-depth study at disaggregated level likevillage/block level at least for some villages/blocks selectedfor the NSS 63rd round. With the constraint of time andresources, this study could not be undertaken. However,from the limited analysis and findings presented in this paper,it is evident that divergences in the alternative estimates arequite alarming in case of certain activities. Both the sourcesare required to take remedial measures so that observeddivergences are minimized in future.

46 SARVEKSHANA
Annexure-I
Extract from Schedule 1.0, Block 11, 63rd round
[11] expenditure for purchase and construction (including repair and maintenance) of durable goods fordomestic use during the last 365 days ended on …..........
item first-hand purchase second-handpurchase
description code no. in no. whether value cost of no. value totaluse on pur- hire pur- (Rs.) raw pur- (Rs.) expen-
the date chased chased materials chased ditureof survey (yes-1, and (Rs.)
no.-2) services [(6)+(7)+for cons- (9)]truction
and repair(Rs.)
(1) (2) (3) (4) (5) (6) (7) (8) (9) (10)
motor car, jeep 612
tyres & tubes 613
other transport equipment 614
glass eyes, hearing aids & orthopaedic equipment 620
other medical equipment 621
therapeutic appliances: sub-total (620-621) 629
123456789012345678901234567891234567890123456789012345678912345678901234567890123456789123456789012345678901234567891234567890123456789012345678912345678901234567890123456789123456789012345678901234567891234567890123456789012345678912345678901234567890123456789123456789012345678901234567891234567890123456789012345678912345678901234567890123456789123456789012345678901234567891234567890123456789012345678912345678901234567890123456789123456789012345678901234567891234567890123456789012345678912345678901234567890123456789123456789012345678901234567891234567890123456789012345678912345678901234567890123456789123456789012345678901234567891234567890123456789012345678912345678901234567890123456789123456789012345678901234567891234567890123456789012345678912345678901234567890123456789123456789012345678901234567891234567890123456789012345678912345678901234567890123456789123456789012345678901234567891234567890123456789012345678912345678901234567890123456789123456789012345678901234567891234567890123456789012345678912345678901234567890123456789123456789012345678901234567891234567890123456789012345678912345678901234567890123456789123456789012345678901234567891234567890123456789012345678912345678901234567890123456789123456789012345678901234567891234567890123456789012345678912345678901234567890123456789
12345678901234561234567890123456123456789012345612345678901234561234567890123456123456789012345612345678901234561234567890123456123456789012345612345678901234561234567890123456
123456789012345123456789012345123456789012345123456789012345123456789012345123456789012345123456789012345123456789012345123456789012345123456789012345123456789012345123456789012345123456789012345123456789012345123456789012345123456789012345123456789012345123456789012345123456789012345123456789012345123456789012345123456789012345123456789012345123456789012345123456789012345123456789012345123456789012345123456789012345123456789012345123456789012345123456789012345123456789012345123456789012345123456789012345123456789012345123456789012345123456789012345123456789012345123456789012345

SARVEKSHANA 47
Annexure-II
Sample enterprises surveyed under ‘Storage and Warehousing ‘(I1) in 57th round and 63rd round
State/UT No. of enterprises surveyed No. of enterprises surveyedIn 57th round in category In 63rd round in category
‘Storage and Warehousing ‘Storage and Warehousing ‘(I1) ‘(I1)
Total FSUs surveyed=15869 Total FSUs surveyed=13271(57th round) (63rd round)
Andhra Pradesh 77 2Arunachal Pradesh 1 0Assam 43 9Bihar 55 5Chhattisgarh 14 1Delhi 18 14Goa 0 0Gujarat 9 2Haryana 15 0Himachal Pradesh 6 0Jammu & Kashmir 20 3Jharkhand 25 0Karnataka 30 0Kerala 10 2Madhya Pradesh 18 8Maharashtra 68 9Manipur 14 4Meghalaya 38 3Mizoram 4 0Nagaland 9 0Orissa 1 0Punjab 15 1Rajasthan 4 0Sikkim 0 0Tamil Nadu 17 3Tripura 32 2Uttarakhand 1 0Uttar Pradesh 34 7West Bengal 141 7A & N Islands 0 0Chandigarh 0 0D & N Haveli 3 0Daman & Diu 0 0Lakshadweep 0 0Puducherry 4 0
All-India 726 82
Source: NSS Report No. 483 and NSS Report No. 528

48 SARVEKSHANA
Annexure-III
Least reported items of Sch. 1.0
Round Number
Item Description 62nd 63rd
item no. sample no. item no. sample no.of hhs of hhs
barley & its products 120 70 120 145
walnut 254 199
cheroot (no.) 325 141 325 288
ganja 330 41 330 68
gobar gas 352 142 352 193
medical insurance premium 414 89 414 137
medicine (unani) 423 160
club fees 433 123 433 194
goods for recreation & hobbies 434 156 434 371
attendant 481 71 481 126
legal expenses 487 148 487 194
air fare 500 15 500 44
hotel lodging charges 521 60 521 92
foam, rubber cushion 554 52 554 153
painting, drawings, engravings etc. 556 64 556 126
camera & photographic equipment 563 22 563 90
musical instruments 566 27 566 70
other goods for recreation 567 144 567 384
jewels, pearls 572 76 572 207
washing machine 594 148
water purifier 598 185
other transport equipment 614 114 614 289
other medical equipment 621 19 621 50
other machines for household work 631 18 631 98
personal computer 632 141
telephone instrument(landline) 634 127
any other personal goods 635 156 635 322

SARVEKSHANA 49
Annexure-IV
Schedule 2.345: SERVICE SECTOR ENTERPRISES (EXCLUDING TRADE)
The following rules are checked for misclassification of enterprises by Enterprise type / NIC 2004.
Sl. reference to scheduleNo. block item col. Rule
(1) (2) (3) (4) (5)
1. 1 15 - For SSS-1,2 202, 228 - (i) If Blk-1/It-15 = 1 then Blk-2 /It-228 = 2 and Blk-2/It-202 (NIC) should be
any one of ‘659, 66, 67’(ii) If Blk-1/It-15 = 1 then Blk-2 /It-228 = 2
2. 1 15 - For SSS-2,2 202, 228 - (i) If Blk-1/It-15 = 2 then Blk-2 /It-228 = 2 and Blk-2/It-202 (NIC) should be
any one of ‘72, 73, 6302’(ii) If Blk-1/It-15 = 2 then Blk-2 /It-228 = 2
3. 1 15 - For SSS-3,2 202, 228 - (i) If Blk-1/It-15 = 3 then Blk-2 /It-228 = 2 and Blk-2/It-202 (NIC) should be
any one of ’61, 90, 9191, 9199’(ii) If Blk-1/It-15 = 3 then Blk-2 /It-228 = 2
4. 1 15 - For SSS-4,2 202, 228 - (i) If Blk-1/It-15 = 4 then Blk-2 /It-228 = 2 and Blk-2/It-202 (NIC) should be
any one of ‘551, 6301, 6303, 6304, 6309, 641, 701, 742, 743, 851, 921’(ii) If Blk-1/It-15 = 4 then Blk-2 /It-228 = 2
5. 1 15 - For SSS-5,2 202, 228 - (i) If Blk-1/It-15 = 5 then Blk-2 /It-228 = 2 and Blk-2/It-202 (NIC) should be
any one of ‘codes under coverage other than above’(ii) If Blk-1/It-15 = 5 then Blk-2 /It-228 = 2
6. 1 15 - For SSS-6,2 202, 228 - (i) If Blk-1/It-15 = 6 then Blk-2 /It-228 = 1 and Blk-2/It-202 (NIC) should be
any one of ‘659, 66, 67’(ii) If Blk-1/It-15 = 6 then Blk-2 /It-228 = 1
7. 1 15 - For SSS-7,2 202, 228 - (i) If Blk-1/It-15 = 7 then Blk-2 /It-228 = 1 and Blk-2/It-202 (NIC) should be
any one of ’70, 72, 73, 74’(ii) If Blk-1/It-15 = 7 then Blk-2 /It-228 = 1
8. 1 15 - For SSS-8,2 202, 228 - (i) If Blk-1/It-15 = 8 then Blk-2 /It-228 = 1 and Blk-2/It-202 (NIC) should be
any one of ‘codes under coverage other than above’(ii) If Blk-1/It-15 = 8 then Blk-2 /It-228 = 1
9. 1 15 - If Blk-1/It-15 = (1/2/3/4/5) then Blk-2 /It-228 = 22 228 -
10. 1 15 - If Blk-1/It-15 = (6/7/8) then Blk-2 /It-228 = 12 228 -
Note:Block-1 / Item 15 SSS (1-5) - Establishment SSS (6-8) - OAEBlock-2 / Item 228 Enterprise type - Code ‘1’: OAE Code ‘2’ : Establishment

50 SARVEKSHANA
State State/UT Sample no. of householdscode
01 Jammu & Kashmir 74
02 Himachal Pradesh 216
03 Punjab 39
04 Chandigarh 1
05 Uttaranchal 80
06 Haryana 83
08 Rajasthan 508
09 Uttar Pradesh 530
10 Bihar 238
11 Sikkim 37
12 Arunachal Pradesh 55
13 Nagaland 60
14 Manipur 43
15 Mizoram 72
16 Tripura 24517 Meghalaya 5518 Assam 27119 West Bengal 91420 Jharkhand 9021 Orissa 43722 Chhattisgarh 18623 Madhya Pradesh 27724 Gujarat 15727 Maharashtra 27728 Andhra Pradesh 61229 Karnataka 13731 Lakshadweep 832 Kerala 9533 Tamil Nadu 28534 Pondicherry 435 A & N islands 13
State State/UT Sample no. of householdscode
State /UTwise status of participation inPublic works
Annexure-V

Part-II
SUMMARY AND MAJOR FINDINGS OF SURVEYS

An Integrated Summary of NSS Survey on Service Sector in India — 63rd Round(July 2006-June 2007)
Gayatri Bhattacharyya
1. Introduction
1.1 Service sector is the most important segment ofeconomy in terms of its contribution to the overall GDP. Itis a diverse domain of economic activities and operationalcharacteristics of units. The entire range of units in the servicesector consist of very big corporate entities accounting forbulk of output as well as large number of very small andtiny enterprises with substantial share in employment. It issecond only to agriculture in employment generation.However, major data gaps exist in all the segments of thissector because of its vast and heterogeneous spread in thegeographical domain and its growth dynamics. The surveyof service sector enterprises in NSS 63rd round duringJuly 2006 - June 2007 is an attempt to fill these data gaps.The enterprise survey thus is an exclusive source ofcomprehensive and national and sub national data profileon estimated number of enterprises, their ownership andoperational characteristics, estimates on number of workers,type of worker, nature of employment, input, output & valueadded, fixed assets, capital formation, assets and liabilities.The previous survey of NSSO on service sector enterpriseswas conducted during July 2001-June 2002 in NSS 57th
round.
1.2 The term ‘service sector enterprises’ under thecoverage of 63rd round basically referred to all service sectorenterprises, other than (a) government and public sectorundertakings and (b) those covered under Annual Surveyof Industries. The survey thus covers all service sectorenterprises (excluding trade) engaged in the activities ofhotels and restaurants (Section H of NIC 2004); transport,storage and communication (I); financial intermediation (J);real estate, renting and business activities (K); education(M); health and social work (N) and other community,social and personal service activities (O). One distinctfeature of this survey is inclusion of financial intermediation(J) not covered in previous surveys on unorganised servicesector enterprises of NSSO. However, the survey does
not cover the industries/ activities of transport via railways,air or pipeline (groups 601, 603 and division 62 of NIC2004), operating of real estate of self owned residentialbuildings (sub-class 70103 of NIC2004), monetaryintermediation (group 651 of NIC 2004), activities of tradeunions (sub-class 91200), religious organizations (sub-class91910) and political organizations (sub-class 91920). Notethat a part of sub-class 91910 relating to activities ofindividuals who provided services directly to worshipperslike priests etc. is covered.
2. Methodology
2.1 Geographical Coverage: The survey covered thewhole of the Indian Union except (i) Leh (Ladakh), Kargil,Punch and Rajauri districts of Jammu & Kashmir, (ii) interiorvillages situated beyond 5 km of a bus route in Nagaland,(iii) villages of Andaman and Nicobar Islands, which remaininaccessible throughout the year.
2.2 Outline of Sample Design: Keeping in view aheterogeneous domain of service sector comprising verylarge as well as very small enterprises, the sample design of63rd round was specially evolved with dual frame namely,list frame and area frame, for selection of sample enterprises.While a list of financial sector enterprises and a list of otherservice sector enterprises comprising relatively large unitsconstituted the list frame, other enterprises (other than listframe enterprises) located in all the villages and urban blockswithin the geographical coverage constituted the areaframe. In the area frame, a stratified multi-stage samplingdesign was adopted. First-Stage Units (FSUs) were villages(Panchayat wards in Kerala) in rural areas and UrbanFrame Survey (UFS) blocks in urban areas. Relatively largerFSUs were sub-divided into smaller parts called hamlet-groups in the rural areas and sub-blocks in the urban areas.In case of large FSUs requiring hamlet-group (hg) / sub-block (sb) formation, one intermediate stage in the samplinginvolved the selection of three hg’s / sb’s from each FSU
SARVEKSHANA 51
out of a minimum of four hg’s/sb’s formed in the FSU. Onehg/sb with maximum number of service sector enterpriseswas selected with probability ‘1’ and called segment 1 andtwo more hg’s/sb’s, selected at random from the list ofremaining hg’s/sb’s of the FSU, constituted segment 2.Within the segments as noted above, eight Second StageStrata (SSS) classified by type of industries x enterprisetypes were formed. The ultimate stage units (USUs) i.e.the service sector enterprises were selected from the eligibleenterprises of the respective SSS of each segment bySRSWOR. However, within the whole FSU relativelybigger service sector enterprises having 50 or more workersthat were eligible for survey (i.e. having operated for atleast 30/15 days during the reference year respectively fornon-seasonal/seasonal enterprises) were separately listed(segment 9) and the schedule was canvassed in all theselisted enterprises of segment 9. Ultimately, a sample of438 enterprises from list frame ( total 998 enterprises)and 190,282 enterprises spread over 13,271 samplevillages/urban blocks from area frame were actuallysurveyed.
2.3 Design-based estimates of aggregates for anyselected survey characteristic were obtained separately forlist frame and area frame. Finally these two sets of estimateswere added to get the pooled aggregate estimate for thecombined frame. In this summary report, discussion will bemainly focused on the pooled estimate based on two typesof frames used in the survey.
2.4 Items of information collected: Schedule 2.345was designed for collection of data from the service sectorenterprises. The schedule was organized into 19 blocks.The items of information collected through different blocksof the schedule are: Particulars of operation and backgroundinformation of the enterprise, Principal operating expenses,Other operating expenses, Principal receipts, Otherreceipts, Other receipts/expenditures (non-entrepreneurial)for non-financial enterprises, Gross value added,Employment particulars, Compensation to workers, Fixedassets owned and rent payable on hired assets, andFinancial liabilities.
3. Contents of the Integrated Summary:
3.1 Based on NSS 63rd round enterprise survey, tworeports have been published: (1) Service Sector in India(2006-07)—Operational Characteristics of Enterprises(NSS Report No. 528) and (2) Service Sector in India(2006-07)—Economic Characteristics of Enterprises (NSSReport No. 529). The present integrated summary of theresults gives the major findings based on the two reports.
4. Main Findings:
4A: All-India Results
4.1 Key Indicators: There are many indicators ofenterprise sector by which the impact on the economy canbe studied. Some of these key indicators are size (likenumber of enterprises and number of workers), employmentper enterprise, gross value added, etc. Statement 1 givesan overview of the Service Sector Enterprises in India during2006-07 in terms of key indicators. It reveals that about16.5 million service sector enterprises were working in Indiaduring 2006-07. It also reveals that about 33.5 millionpersons were working in service sector enterprises during2006-07. The aggregate Gross Value Added (GVA) forthe country is estimated at 2,44,792 Crores of Rupees.The estimated market value of owned fixed assets perenterprise for the country is estimated at Rs. 1,78,102.The heterogeneity of the domain of service sector is evidentfrom the simple revelation that per enterprise value of ownedfixed assets for Establishments (Rs. 960.2 thousand) isabout 22 times the same (Rs. 43.7 thousand) for OwnAccount Enterprises (OAEs)1 . It is seen that, on anaverage, the financial liability (the total liability incurredby the enterprise as on the last date of reference yearwhich includes capital deployed by the partners of anenterprise, share capital, reserve and surplus amountnoted in the balance sheet, long-term loans and alsoall short-term commitments for payments like unpaidwages etc.) of an enterprise amounts to Rs. 4,41,133. Thefinancial liability per enterprise for OAEs is Rs. 21,430 asagainst Rs. 28,84,961 for Establishments for the country.
1 As per the definition adopted in the survey, an own account enterprise is a unit that operated without hiring any worker during major part of the
preceding one year while the establishment referred to a unit that hired at least one worker during the said reference period.
52 SARVEKSHANA

Statement 1: Service Sector Enterprises in India, 2006-07 at a glance
Key indicators Total OAE Establishment
Estimated number of enterprises (in’000) 16,512 14,092 2,420Estimated number of workers (in’000) 33,516 21,258 12,258Average number of workers per enterprise 2.03 1.51 5.07Aggregate GVA (in Rs. Crore) 2,44,792 45,660 1,99,131Estimated value (in Rs.) of fixed assets owned per enterprise 1,78,102 43,774 9,60,260
Estimated value (in Rs.) of Financial liability per enterprise 4,41,133 21,430 28,84,961
4.2 Number of Enterprises and their features: Numberof enterprises is a major characteristic to describe thegrowth of economy and the scale of economicentrepreneurship. As shown in Statement 2, during2006-07, about 16.5 million enterprises are engaged in theservice sector activities excluding trade. Interestingly, 60%of the service sector enterprises are in rural India as against40% in urban sector. OAEs constitute 85% of allenterprises. Chart 1 provides the pictorial view of thedistribution of enterprises by type of enterprise – OAE andEstablishment and sector – rural India and urban India.
Statement 2: Estimated number of enterprises byenterprise type and sector in India, 2006-07
sector Number of enterprises (in ‘000)
OAE Establishments all
Rural 9,004 896 9,900urban 5,088 1,524 6,612All 14,092 2,420 16,512
Chart 1: Percentage distribution of enterprises byenterprise type and sector
4.3 Statement 3 provides a few important features ofthe service sector enterprises. Proprietary enterprises (i.e.enterprises owned by a single household) has the highestshare (90%) in total number of enterprises in the country.The preponderance of informality of service sector
entrepreneurship in the economic space was reflected fromthe fact that about 59% of all enterprises are found to benot registered under any Act or with any registration authorityand this proportion is more in case of OAEs (63%) thanestablishments (34%). About 26% of the enterprisesoperate their business without any fixed location. Thecorresponding percentage is less in the case ofestablishments (10%) as compared to OAEs (29%). A vastmajority (99%) of all enterprises is perennial i.e. operatingmore or less throughout the year. About 91% of theenterprises has worked for 9 months or more during thelast 365 days.
Statement 3: Some features of enterprises byenterprise type in India, 2006-07
Features Total OAE Establishment
Percentage of proprietary enterprises 90.2 91.0 86.0
Percentage of enterprises not registered 59.1 63.4 34.5with any agency
Percentage of enterprises without fixed 26.4 29.1 9.9premises
Percentage of enterprises operating 98.6 98.6 98.3peremises
Percentage of enterprises operating for 90.9 90.9 90.59 or more months
Percentage of enterprises working on 2.5 2.3 3.8contract
4.4 Problems faced in operation of enterprises andstatus of receiving assistance: Statement 4 reveals thatabout 22% of enterprises reported to be suffering fromscarcity of capital. This percentage is little higher in case ofrural India (23%) than urban India (20%).
SARVEKSHANA 53

Statement 4: Percentage of enterprises reporting shortage of capital
Percentage of enterprises reporting shortage of capital
Rural Urban All
OAE Establishment All OAE Establishment All OAE Establishment All
22.7 23.4 22.8 20.9 16.3 19.9 22.1 18.9 21.6
4.5 The non-receipt of any government assistance isalso reported by majority of the enterprises. As seen inStatement 5, about 86% of the enterprises do not receiveany assistance in the form of loan or subsidy or training etcfrom the government. Interestingly, the incidence of non
receipt of any assistance is reported higher, thoughmarginally by urban enterprises. About 12% get it as loansonly. The incidence of receiving assistance in any form ishigher for establishments (22%) than OAEs (13%).
Statement 5: Percentage of enterprises receiving assistance and not receiving any assistance categorizedby enterprise type and sector
percentage of enterprises Rural Urban All
OAE Establishment All OAE Establishment All OAE Establishment All
receiving assistance as loan 13.5 23.6 14.4 7.6 15.4 9.4 11.4 18.5 12.4
receiving other assistance 1.8 5.4 2.1 1.4 2.9 1.7 1.6 3.8 1.9
not receiving any assistance 84.7 71.0 83.5 91.0 81.7 88.9 87.0 77.7 85.7
4.6 Employment in Service Sector: In India, servicesector has an important role in generating employment.Number of workers in service sector in India during2006-07 was estimated to be about 3.35 Crores, with ruraland urban share being 54% and 46% respectively.
Statement 6: No. of workers by enterprise type andsector during 2006-07
Enterprise type Estimated number ofworkers (in ‘000)
Rural Urban All
OAE 14,548 6,709 21,258
Establishments 3,582 8,673 12,255
All 18,130 15,383 33,513
4.7 Proportion of Female Workers: In order to studythe gender differential in employment in service sectorenterprises, the particulars of employment are collected also
by gender of the workers. Statement 6a gives theproportions of female workers in different enterprise typesseparately for rural, urban and both sectors combined. It isseen that the female workers constituted roughly 29% ofall workers in service sector enterprises and the percentageof female workers is higher in rural areas (35%) than thesame in urban areas (22%).
Statement 6a: Percentage of female workers byenterprise type and sector during 2006-07
Enterprise type Percentage of femaleworker
Rural Urban All
OAE 39.0 20.2 33.0Establishments 19.4 24.0 22.6All 35.1 22.4 29.2
4.8 Workers (full-time and part-time): Theinformation on number of workers engaged in the enterprise
54 SARVEKSHANA

on a full-time or part-time basis was collected in the surveyfor generating estimates of full-time and part-time workers.A worker is considered to be working for full-time if he orshe has worked for more than half of the period of normalworking hours of the enterprise on a fairly regular basis.Statement 6b reveals that about 76% of workers in ruralenterprises and 90% of those in urban enterprises areengaged on full-time basis. Information on hired worker(person employed directly or through any agency onpayment of regular wage / salary in cash or kind includingApprentices, paid or unpaid, paid household workers,servants and resident workers of the enterprise) was alsocollected and Statement 6c reveals some facts about salaryof hired workers for establishments in India.
Statement 6b: Percentage of workers by duration ofwork and sector during 2006-07
Duration of work Percentage of worker
Rural Urban All
Full-time 76 90 83Part time 24 10 17All 100 100 100
Statement 6c: Annual salary (in Rs. ) per hiredworker based on area frame during 2006-07
Enterprise type Annual salary per hired worker (in Rs.)
Rural Urban All
Establishments 24,816 57,977 48,482
Statement 6c reveals that annual salary for hiredworker in urban areas (Rs. 57,977) is more than double incase of rural India (Rs. 24,816).
4.9 Fixed Assets Owned: Statement 7 presents theestimated value of total fixed assets owned per enterprisefor different enterprise types. At all-India level, the estimatedmarket value of owned fixed assets per enterprise isestimated as Rs. 1,78,102. The market value of ownedfixed assets per enterprise in urban areas is about 5.5 timesthe corresponding value in rural areas. Per enterprise valueof owned fixed assets for Establishments is about 22 timesthe same for OAEs.
Statement 7: Estimated value (Rs.) of owned fixedassets per enterprise by enterprise type
Enterprise type Estimated value of owned fixedassets per enterprise (in Rs.)
Rural Urban All
OAE 32,801 63,194 43,774Establishments 3,67,366 13,09,118 9,60,260All 63,096 3,50,325 1,78,102
4.10 Financial Liability: Financial liabilities includedcapital deployed by the partners of an enterprise, sharecapital, reserve and surplus amount noted in the balancesheet, long-term loans and also all short-term commitmentsfor payments like unpaid wages, etc. The average amountof financial liability per enterprise is presented in Statement 8.It is seen that at all-India level, the financial liability of anenterprise as on the last date of the reference year amountedto Rs. 4,41,133. The financial liability per enterprise forOAEs is Rs. 21,430 against Rs. 28,84,961 forEstablishments. Thus, financial liability per Establishmentis considerably higher than the same for OAEs.
Statement 8: Estimated value (Rs.) of financialliability per enterprise by enterprise type
Enterprise type financial liability perenterprise (Rs.)
Rural Urban All
OAE 8,210 44,827 21,430
Establishments 3,84,220 43,56,395 28,84,961
All 42,258 10,38,455 4,41,133
4.11 Gross Value Added: Gross Value Added (GVA)is the value added to the economy by the process ofproduction of an enterprise. Statement 9 gives an overviewof GVA in the Indian economy. Aggregate annual grossvalue added by service sector enterprises is estimated asRs.2,44,792 crore out of which rural India and urban Indiahad shares of 15% and 85% respectively. Majorcontribution to GVA has come in rural areas from OAEs(61%) and in urban areas from Establishments (89%).Considering both rural and urban India, establishments havethe major contribution (81%) in total GVA by the servicesector (see Chart 2 also).
SARVEKSHANA 55

Statement 9: Aggregate gross value added(Rs. in crores) by enterprise type and
sector during 2006-07
Enterprise type aggregate gross value added(Rs. in crores)
Rural Urban All
OAE 22,759 22,901 45,660Establishments 14,660 1,84,472 1,99,131All 37,419 2,07,373 2,44,792
Chart 2: Percentage distribution of gross valueadded by enterprise type for each
sector and total
4.11.1 GVA per worker based on area frame:Statement 10 below gives the estimated annual gross valueadded per worker (GVAPW) by type of enterpriseseparately for rural, urban and combined sector. As expected,GVAPW are substantially high for Establishments for allsectors. At all-India level, annual GVAPW in service sectoris estimated at Rs. 73038. For rural India, annual GVAPWfor OAEs and Establishments are estimated as Rs15644and Rs. 40931 respectively. The corresponding estimatesfor urban areas are Rs. 34132 and Rs. 212615 respectively.
Statement 11: Some features of service sector enterprises at activity levelsActivities Percentage distribution of enterprises Estimated Estimated Estimated
Total OAE Establishment number of number of annualenterprises workers gross value
(in ‘000) (in ‘000) added perenterprise
(in Rs. ‘000)
Hotels (H1) 0.42 0.06 2.53 69 44 1 1,548 244Hotels and restaurants (H) 12.47 10.99 21.13 2,060 5,134 137 55Storage and warehousing (I1) 0.02 0.00 0.08 3 18 572 87Transport, storage and communication (I) 37.99 40.55 23.09 6,273 8,370 70 52Insurance and pension funding and auxiliary 1.39 1.41 1.23 229 438 1327 693activities (J2)Financial intermediation (J) 9.17 9.99 4.37 1,514 5,770 327 86Real estate, renting and business activities (K) 8.48 7.38 14.93 1,401 3,098 483 218Education (M) 6.31 5.06 13.58 1,041 3,874 226 61Health and social work (N) 6.63 5.77 11.63 1,095 2,181 165 83Other community, social and personal service 18.94 20.26 11.27 3,128 5,088 45 27activities (O)Total 100 100 100 16,512 33,516 148 73
Statement 10: GVA per worker (in Rs.)
Enterprise type Estimated GVA per worker (in Rs.)
Rural Urban All
OAE 15,644 34,132 21,479Establishments 40,931 2,12,615 1,62,452All 20,640 1,34,782 73,038
4.12 Features of Service Sector Enterprises atActivity Levels: As seen in the Statement 11 below,transport, storage & communication (I) has the highestpercentage of enterprises (38%) followed by othercommunity, social and personal service activities (O)(19%). As against the total number of workers estimatedas 3.35 crores, the number of workers in various activitiesin the service sector differ. It is seen that the estimatednumber of workers engaged in enterprises belonging to‘transport, storage and communication (I)’ (0.84 crores)is the highest followed by ‘financial intermediation (J)’(0.58 crores), ‘hotels and restaurants (H)’ (0.513 crores),‘other community, social and personal services(O)’(0.509 crores), and ‘education(M)’ (0.39 crores). It isfurther seen that ‘Hotels (H1)’ has the highest annual GVAper enterprise (Rs. 1548 thousand) at all-India level. Thisis followed by ‘Insurance and pension funding andauxiliary activities (J2)’ (Rs. 1327 thousand) and‘Storage and warehousing (I1)’ (Rs. 572 thousand).‘Other community, social and personal service activities(O)’ had the lowest GVA per enterprise (Rs. 45 thousand).
56 SARVEKSHANA
Estimatedanuual
gross valueadded per
worker(in Rs.‘000)

4.13 Comparative results with the past rounds:Statement 12 gives comparison of the results of enterprisesurveys on service sector during 2006-07 (NSS 63rd round)and during 2001-02 (NSS 57th round) and indicates thatthere is nominal change in the number of enterprises andnumber of workers over years. It is interesting also to notethat top four States in terms of number of enterprises (names)are identical both in 2001-02 and 2006-07 and their
percentage shares do not reveal noteworthy differences.
4.14 GVA per enterprise is Rs.1,30,153 in 63rd round[excluding enterprises covered under financialintermediation (J)] against Rs. 51,673 in 57th round. GVAper worker is Rs. 70,358 in 63rd round [excludingenterprises covered under financial intermediation (J)]against Rs. 28,160 in 57th round.
Statement 12: Comparative statements for some key indicators over previous round:Key Indicators 57th round (2001-02) 63rd round (2006-07)*
Estimated number of enterprises (in’000) 14472 14998Estimated number of workers (in’000) 26556 27742Average number of workers per enterprise 1.8 1.8Share of top five states in total number of enterprises U P 17.19 U P 14.71
WB 10.79 WB 12.81A P 9.29 A P 9.35Maharashtra 8.21 Maharashtra 8.95Bihar 8.17 T N 6.57Total 53.65 Total 52.40
GVA per enterprise (in Rs.) 51,673 1,30,153
GVA per worker (in Rs.) 28,160 70,358
* Percentages and estimates calculated by excluding enterprises covered under financial intermediation (J).
4B. State-wise results4.15 Results for certain major economic characteristics
are discussed in respect of 21 major states which areidentified on the basis of estimated number of enterprises(exceeding 1 lakh).
4.16 Enterprises across Major States in 2006-07:Across the states, the characteristics of the enterprises werediffering in terms of its size, total number workers and annualGVA.
Statement 13: Key indicators of service sector enterprises for 21 Major states in India during 2006-07(based on area frame)
State/UT Estimated Estimated Estimated % share Estimated % share Aggregate % sharenumber of number of number of of total number of Annual of GVA
enterprises enterprises enterprises enterprises workers in Gross Valuein ‘000 in ‘000 in ‘000 ‘000 Added (Rs.(OAE) (Estt.) (total) lakhs)
Andhra Pradesh 1,566 156 1,722 10.43 3635 11.06 10,03,501 6.56Assam 493 103 596 3.61 1128 3.43 2,75,469 1.80Bihar 797 75 872 5.28 1309 3.98 2,88,338 1.89Chhattisgarh 151 26 177 1.07 450 1.37 92,942 0.61Delhi 90 57 147 0.89 323 0.98 1,78,565 1.17Gujarat 534 110 644 3.90 1223 3.72 12,16,637 7.95Haryana 271 57 328 1.99 572 1.74 2,47,472 1.62Himachal Pradesh 89 26 115 0.69 217 0.66 84,077 0.55Jammu & Kashmir 109 30 139 0.84 244 0.74 1,35,330 0.88Jharkhand 387 48 435 2.63 647 1.97 2,03,051 1.33Karnataka 707 98 805 4.88 1592 4.84 17,84,135 11.66Kerala 758 202 960 5.81 2174 6.61 11,60,437 7.59Madhya Pradesh 381 87 468 2.84 1017 3.09 3,03,309 1.98Maharashtra 1178 311 1,489 9.02 3160 9.61 28,24,612 18.47Orissa 547 75 622 3.77 1924 5.85 2,24,677 1.47Punjab 382 69 451 2.73 800 2.43 4,20,316 2.75Rajasthan 479 121 600 3.64 1188 3.61 5,62,698 3.68Tamil Nadu 953 240 1,193 7.23 2922 8.89 11,80,685 7.72Uttarakhand 125 24 149 0.90 246 0.75 1,00,298 0.66Uttar Pradesh 1969 277 2,246 13.60 4064 12.36 10,64,251 6.96West Bengal 1927 164 2,091 12.67 3321 10.10 7,98,305 5.22India 14,092 2,420 16,512 100.00 32880 100.00 1,52,95,334 100.00
SARVEKSHANA 57
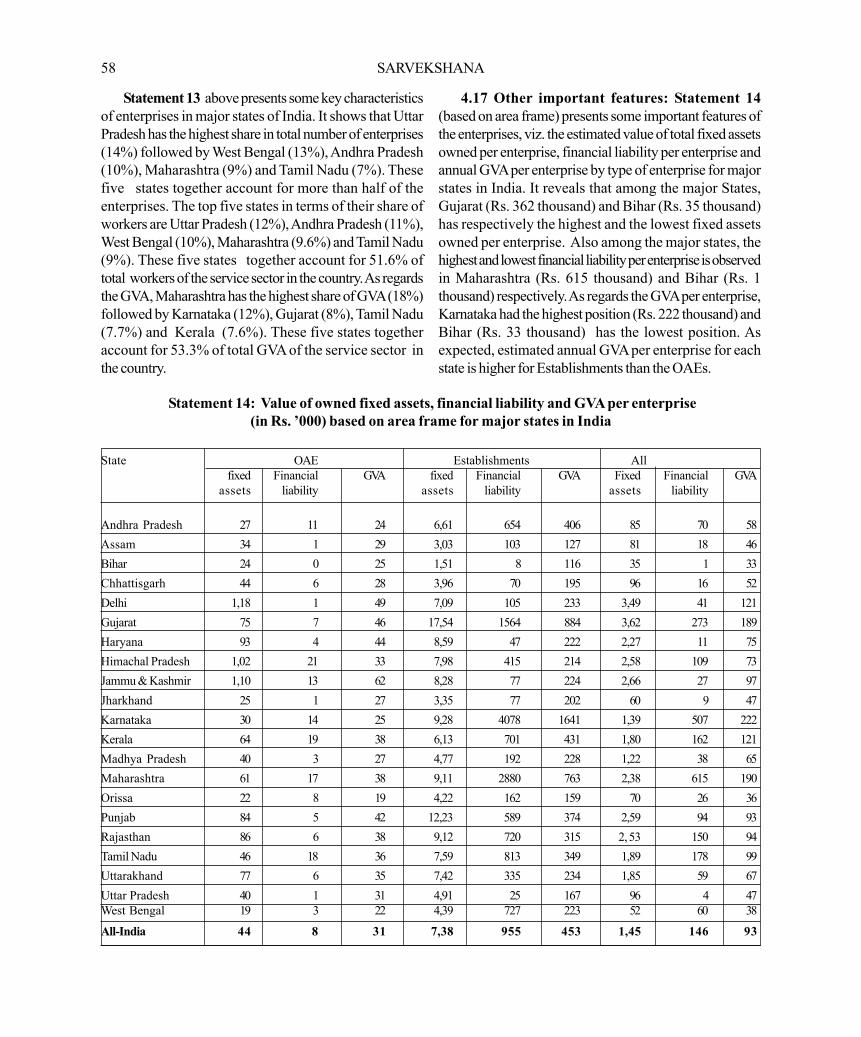
Statement 13 above presents some key characteristicsof enterprises in major states of India. It shows that UttarPradesh has the highest share in total number of enterprises(14%) followed by West Bengal (13%), Andhra Pradesh(10%), Maharashtra (9%) and Tamil Nadu (7%). Thesefive states together account for more than half of theenterprises. The top five states in terms of their share ofworkers are Uttar Pradesh (12%), Andhra Pradesh (11%),West Bengal (10%), Maharashtra (9.6%) and Tamil Nadu(9%). These five states together account for 51.6% oftotal workers of the service sector in the country. As regardsthe GVA, Maharashtra has the highest share of GVA (18%)followed by Karnataka (12%), Gujarat (8%), Tamil Nadu(7.7%) and Kerala (7.6%). These five states togetheraccount for 53.3% of total GVA of the service sector inthe country.
4.17 Other important features: Statement 14(based on area frame) presents some important features ofthe enterprises, viz. the estimated value of total fixed assetsowned per enterprise, financial liability per enterprise andannual GVA per enterprise by type of enterprise for majorstates in India. It reveals that among the major States,Gujarat (Rs. 362 thousand) and Bihar (Rs. 35 thousand)has respectively the highest and the lowest fixed assetsowned per enterprise. Also among the major states, thehighest and lowest financial liability per enterprise is observedin Maharashtra (Rs. 615 thousand) and Bihar (Rs. 1thousand) respectively. As regards the GVA per enterprise,Karnataka had the highest position (Rs. 222 thousand) andBihar (Rs. 33 thousand) has the lowest position. Asexpected, estimated annual GVA per enterprise for eachstate is higher for Establishments than the OAEs.
Statement 14: Value of owned fixed assets, financial liability and GVA per enterprise(in Rs. ’000) based on area frame for major states in India
State OAE Establishments Allfixed Financial GVA fixed Financial GVA Fixed Financial GVA
assets liability assets liability assets liability
Andhra Pradesh 27 11 24 6,61 654 406 85 70 58Assam 34 1 29 3,03 103 127 81 18 46Bihar 24 0 25 1,51 8 116 35 1 33Chhattisgarh 44 6 28 3,96 70 195 96 16 52Delhi 1,18 1 49 7,09 105 233 3,49 41 121Gujarat 75 7 46 17,54 1564 884 3,62 273 189Haryana 93 4 44 8,59 47 222 2,27 11 75Himachal Pradesh 1,02 21 33 7,98 415 214 2,58 109 73Jammu & Kashmir 1,10 13 62 8,28 77 224 2,66 27 97Jharkhand 25 1 27 3,35 77 202 60 9 47Karnataka 30 14 25 9,28 4078 1641 1,39 507 222Kerala 64 19 38 6,13 701 431 1,80 162 121Madhya Pradesh 40 3 27 4,77 192 228 1,22 38 65Maharashtra 61 17 38 9,11 2880 763 2,38 615 190Orissa 22 8 19 4,22 162 159 70 26 36Punjab 84 5 42 12,23 589 374 2,59 94 93Rajasthan 86 6 38 9,12 720 315 2, 53 150 94Tamil Nadu 46 18 36 7,59 813 349 1,89 178 99Uttarakhand 77 6 35 7,42 335 234 1,85 59 67Uttar Pradesh 40 1 31 4,91 25 167 96 4 47West Bengal 19 3 22 4,39 727 223 52 60 38
All-India 44 8 31 7,38 955 453 1,45 146 93
58 SARVEKSHANA

Part-III
HIGHLIGHTS OF RECENT REPORTS RELEASED BY NSSO
Highlights of NSS 65th round report number 534(Some Characteristics of Urban Slums, 2008-09)
For this survey, conducted during July 2008 to June2009, urban areas notified as slums by respectivemunicipalities, corporations, local bodies ordevelopment authorities were treated as “notifiedslums”. A “non-notified slum” was a compact urbanarea with a collection of poorly built tenements,mostly of temporary nature, crowded togetherusually with inadequate sanitary and drinking waterfacilities in unhygienic conditions. All such slums,notified or non-notified, were considered as ‘slum’for the purpose of the survey, if at least 20households lived in such a slum within the selectedurban block. In the 4738 urban blocks surveyedout of the allotted random sample of 4764 urbanblocks during the 65th round, there existed 365notified and 365 non-notified slums.
About 49 thousand slums were estimated to beexistence in urban India in 2008-09, 24% of themwere located along nallahs and drains and 12%along railway lines.
About 57% of slums were built on public land,owned mostly by local bodies, state government,etc.
In 64% of notified slums, a majority of the dwellingswere pucca, the corresponding percentage for thenon-notified ones being 50%.
For 95% slums, the major source of drinking waterwas either tap or tubewell.
Only 1% notified and 7% non-notified slums didnot have electricity connection.
About 78% of notified slums and 57% of the non-notified slums had a pucca road inside the slum.
About 73% notified and 58% non-notified slumshad a motorable approach road.
About 48% of the slums were usually affected bywater logging during monsoon – 32% with insideof slum waterlogged as well as approach road tothe slum, 7% where the slum was waterloggedbut not the approach road, and 9% where onlythe approach road was waterlogged in themonsoon.
The sanitary conditions in the slums in terms of latrinefacility during 2008-09 showed considerableimprovement since 2002. Latrines with septic tanks(or similar facility) were available in 68% notifiedand 47% non-notified slums (up from 66% and35% respectively in 2002). At the other extreme,10% notified and 20% non-notified slums (downfrom 17% and 51% in 2002) did not have anylatrine facility at all.
About 10% notified and 23% non-notified slumsdid not have any drainage facility. Thecorresponding proportions in 2002 had been 15%for notified and 44% for non-notified slums.Underground drainage systems or drainage systemsconstructed of pucca materials existed in about39% notified slums (25% in 2002) and 24% non-notified slums (13% in 2002).
Underground sewerage existed in about 33%notified slums (30% in 2002) and 19% non-notifiedslums (15% in 2002).
Government agencies were collecting garbage from75% notified and 55% non-notified slums. Amongthese slums, garbage was collected at least once in7 days in 93% notified and 92% non-notified slums.About 10% notified and 23% non-notified slumsdid not have any regular mechanism for garbagedisposal.
Note that the changes reported during the last five yearsin the slums are as reported by the knowledgeable person(from whom the information is collected) depending on his/her perceptions.
Highlights of recent reports released by NSSO
SARVEKSHANA 59
Over the last five years, facilities had improved inabout 50% of notified slums in terms of roads (bothwithin-slum road and approach road) and watersupply. The incidence of deterioration of any of theexisting facilities in notified slums during the last fiveyears was quite low (about 6% or below).
In case of most slum facilities – sewerage andmedical facilities being exceptions – the facility wasreported to have improved during the last five yearsin more than 20% of non-notified slums.Deterioration of any of the existing facilities in non-notified slums, like notified slums, was rare (about9% or below).
Facilities such as street light, latrine, drainage,sewerage and medical facilities were each reportedby more than 10% of notified slums to be non-
existent both at the time of survey and five yearsearlier. In case of non-notified slums, facilities likestreet light, latrine, drainage, sewerage and garbagedisposal were each reported by more than 20% ofthe slums to be non-existent, both during the surveyand five years earlier.
Where improvement had been brought aboutduring the last 5 years, it was due to theGovernment’s efforts in about 80-90% of slums,both notified as well as non-notified and for all thefacilities. Improvement in educational facilities atprimary level was attributed to NGOs in 13% ofthe notified slums where such improvement wasreported. NGOs were also found to have played arole in the improvement of latrine and seweragesystem in non-notified slums.
60 SARVEKSHANA

Highlights of NSS 65th round report number 535(Housing Condition in India, 2008-09)
This report is based on the 65th round survey on Housing
Condition (Schedule 1.2) conducted during July 2008 toJune 2009. In this survey, a total of 12,865 first stage units(FSUs) were surveyed: 8,130 villages in rural areas and4,735 urban frame survey (UFS) blocks in urban areas.The survey covered a sample of 1,53,518 households(97,144 in rural areas and 56,374 in urban areas). Someof the key findings are stated below.
1. Some Aspects of Facilities for Living
1.1 Drinking water facility during last 365 days
In rural areas the major source of drinking water(most often used) was ‘tube well/hand pump’ inrespect of 55 per cent of households followed by‘tap’ for 30 per cent of households.
In urban areas, ‘tap’ was the major source ofdrinking water for 74 per cent of the householdsand ‘tube well/hand pump’ served another 18 percent households.
The three sources of drinking water, ‘tap’, ‘tubewell/hand pump’ and ‘well’ together served nearly97 per cent of rural households and 95 per cent ofurban households.
Nearly 86 per cent of the rural households gotsufficient drinking water throughout the year fromthe first major source against nearly 91 per cent ofurban households. Thus, the insufficiency of drinkingwater in any of the month was in respect of 14 percent and 9 per cent of rural and urban households,respectively.
Shortage of drinking water set in the month ofMarch and gradually reached a peak during May;thereafter, the situation of availability of drinkingwater gradually improved and by August thesituation improved substantially.
During the month of May, drinking water for 13per cent of the rural households and 8 per cent ofthe urban households was insufficient.
Drinking water facility within the premises wasavailable to nearly 41 per cent of rural householdsand 75 per cent of urban households.
1.2 Bathroom facility
Bathroom facility was not available for nearly 64per cent of rural households, while in urban areas,the proportion of households with no bathroom wasconsiderably lower, nearly 22 per cent.
In the rural areas, detached bathrooms were morecommon (23 per cent of the households) than wereattached bathrooms (13 per cent of the households).
In urban areas, a higher proportion of households(48 per cent) had attached bathroom than detachedbathroom (nearly 31 per cent).
1.3 Sanitation facility
Nearly 49 per cent households had no latrine facility.Nearly 65 per cent of rural households had no latrinefacility whereas 11 per cent of urban householdsdid not have any latrine.
In rural areas, nearly 14 per cent of the householdsused pit latrine compared to nearly 8 per centhouseholds in urban areas.
In rural areas, septic tank/flush latrine was used by18 per cent households compared to 77 per centhouseholds in urban areas.
1.4 Electricity facility
At the all-India level, nearly 75 per cent of thehouseholds had electricity for domestic use. Whileonly 66 per cent households in rural areas had thisfacility, 96 per cent in urban areas had this.
1.5 Households with three basic facilities: drinkingwater within premises, latrine and electricity
Nearly 18 per cent of rural households had all threefacilities (drinking water within premises, latrine andelectricity) whereas in urban areas, all three facilitieswere enjoyed by 68 per cent households.
1.6 Tenure types
A majority of the households in both rural and urbanareas were residing in owned dwelling: nearly 95per cent in rural areas and 62 per cent in urbanareas.
SARVEKSHANA 61
3 per cent of rural households lived in hired dwellingwhile a greater proportion, viz., 30 per cent of urbanhouseholds lived in hired dwelling.
Nearly 5 per cent of the urban households hadresidence in employer’s quarter against slightly lessthan one per cent of rural households.
2. Characteristics of the house and dwelling unit
2.1 Type of structure
Nearly 55 per cent of the rural households and 92per cent of the urban households lived in puccastructures.
Nearly 28 per cent of the rural households and 6per cent of the urban households lived in semi-puccastructures.
Nearly 2 per cent of the urban households and 17per cent of the rural households lived in katchastructures.
2.2 Availability of separate room to married couplesand per capita floor area
Nearly 75 per cent of households both in rural aswell as in urban areas, had availability of separateroom for the married couples.
Per capita floor area availability was 8.39 sq. mt.in rural areas and 9.45 sq. mt. in urban areas.
Nearly 13 per cent of the urban households and 8per cent of the rural households had per capita floorarea of 20 sq. mt. and above.
2.3 Rent of hired accommodation
Average monthly rent of hired dwellings (excludingemployer’s quarter) per household in urban areas(Rs. 1149) was nearly double of that in rural areas(Rs. 560).
3. Micro environmental elements surrounding thehouse
Nearly 19 per cent of the households in rural areasand 6 per cent in urban areas had open katchadrainage. Nearly 57 per cent of the households inrural areas and 15 per cent in urban areas had nodrainage arrangement.
Garbage disposal arrangement was available to only24 per cent of rural households against 79 per centof the urban households.
Nearly 18 per cent of the rural households had nodirect opening to road against nearly 6 per cent ofthe urban households.
4. Construction for residential purpose during last365 days
Nearly 12 per cent households in rural areas and 4per cent households in urban areas undertookconstructions during the last 365 days.
Among rural households, nearly 11 per centcompleted constructions and 1 per cent undertookconstructions which were in-progress.
In urban areas, nearly 4 per cent householdscompleted constructions and less than 1 per centundertook constructions which were in-progress.
On an average, each reporting household, both inrural and urban areas, undertook only oneconstruction activity.
Average cost per completed construction wasnearly Rs. 27,000 in rural areas and, nearlyRs. 58,000 in urban areas.
Average cost of constructions that were in-progresswas nearly Rs. 82,000 in rural areas against nearlyRs. 1,53,000 in urban areas.
Nearly 72 per cent of the completed constructionsin rural areas and 71 per cent in urban areas wereof the type alteration /improvement/ major repair.
In both rural and urban areas, nearly 14 per centof the constructions related to new building.
In rural areas, for nearly 9 per cent of the completedconstructions some amount was financed frominstitutional agencies, while in urban areas it wasfor nearly 11 per cent of the constructions.
Financing from non-institutional agencies wasalmost of the same order in both rural and urbanareas: in rural areas nearly 27 per cent of theconstructions had some amount financed from non-institutional agencies while it was nearly 26 per centin urban areas.
62 SARVEKSHANA

In both the rural and urban areas, financing of thecost of construction from own sources haddominant share in total cost of completedconstructions: in rural areas nearly 66 per cent ofthe total cost of completed constructions wasfinanced from own sources which was nearly 61per cent in urban areas.
In rural areas, nearly 18 per cent of the total costof completed constructions was financed frominstitutional agencies and nearly 17 per cent fromnon-institutional agencies.
In urban areas, nearly 25 per cent of the total costof completed constructions was financed frominstitutional agencies against 15 per cent from non-institutional agencies.
5. Some aspects of housing condition among socialgroups
In rural areas, ‘tube well/hand pump’ remained themajor source of drinking water across all the socialgroups: nearly 59 per cent of the SC householdsdepended on ‘tube well/hand pump’ as the majorsource of drinking water against 56 per cent of SThouseholds, 52 per cent of OBC households and56 per cent of the residual social group ‘others’.
In rural areas, ‘tap’ as a major source of drinkingwater was the lowest reported among SThouseholds (19 per cent) and it was the highest
among OBC households (33 per cent) closelyfollowed by households in the residual social group‘others’ (31 per cent).
In urban areas, proportion of households whodepended on ‘tap’ was lowest among SThouseholds (69 per cent) and the same was highestamong ‘others’ (78 per cent).
In urban areas, ‘tube well/hand pump’ served thehighest proportion of SC households (23 per cent)and lowest proportion of ‘others’ households(14 per cent).
In rural areas, highest proportion of SC householdshad no latrine facility (76 per cent), closely followedby ST households (75 per cent) and lowestproportion of ‘others’ households had no latrinefacility (43 per cent).
In urban areas, highest proportion of SChouseholds had no latrine facility (23 per cent),closely followed by ST households (21 per cent)and for ‘others’ households the proportion waslowest (4 per cent).
In rural areas, nearly 57 per cent of ST householdshad electricity for domestic use against nearly74 per cent of households in ‘others’ category.
In urban areas, nearly 92 per cent of ST householdshad electricity against nearly 98 per cent ofhouseholds in ‘others’ category.
SARVEKSHANA 63
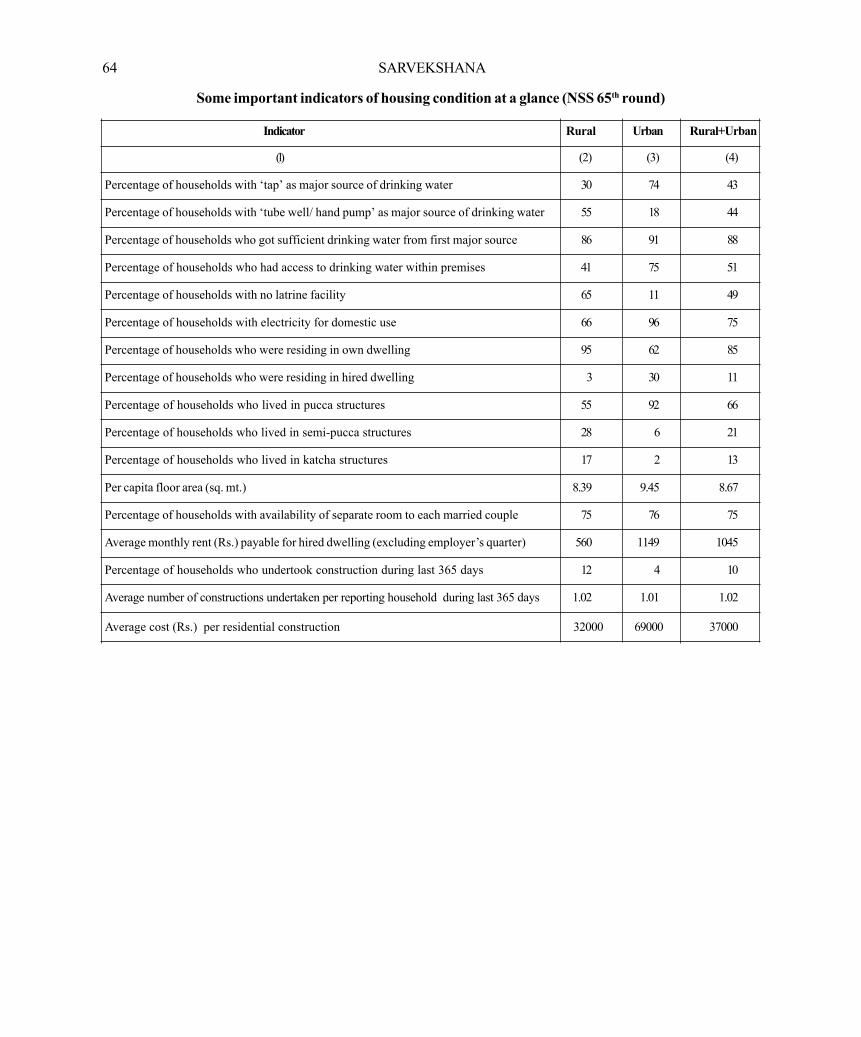
Some important indicators of housing condition at a glance (NSS 65th round)
Indicator Rural Urban Rural+Urban
(1) (2) (3) (4)
Percentage of households with ‘tap’ as major source of drinking water 30 74 43
Percentage of households with ‘tube well/ hand pump’ as major source of drinking water 55 18 44
Percentage of households who got sufficient drinking water from first major source 86 91 88
Percentage of households who had access to drinking water within premises 41 75 51
Percentage of households with no latrine facility 65 11 49
Percentage of households with electricity for domestic use 66 96 75
Percentage of households who were residing in own dwelling 95 62 85
Percentage of households who were residing in hired dwelling 3 30 11
Percentage of households who lived in pucca structures 55 92 66
Percentage of households who lived in semi-pucca structures 28 6 21
Percentage of households who lived in katcha structures 17 2 13
Per capita floor area (sq. mt.) 8.39 9.45 8.67
Percentage of households with availability of separate room to each married couple 75 76 75
Average monthly rent (Rs.) payable for hired dwelling (excluding employer’s quarter) 560 1149 1045
Percentage of households who undertook construction during last 365 days 12 4 10
Average number of constructions undertaken per reporting household during last 365 days 1.02 1.01 1.02
Average cost (Rs.) per residential construction 32000 69000 37000
64 SARVEKSHANA

Highlights of NSS 65th round report number 536(Domestic Tourism in India, 2008-09)
The results on ‘Domestic Tourism in India’ are based ondata collected during July 2008 — June 2009 from 1,53,308surveyed households in 8,109 sample villages and 4,719urban blocks spread over all States and Union Territoriesof India. All estimates relate to a period of 365 days. Theimportant indicators for studying domestic tourism in ademographic domain are derived through the concept of‘trip’, which is devised as a unit of movement of membersof a household as ‘domestic visitors’.
NUMBER OF TRIPS MADE IN A YEAR
In a one-year period, 418 overnight trips weremade per 100 Indian households (on an average,about 4 per household). The number of trips per100 households was 440 for the rural population,perceptibly higher than for the urban population,for which it was 365.
The incidence of same-day trips, at 753 per 100households in a year, was substantially higher thanthat of overnight trips. Rural households undertooksame-day trips at the rate of 844 per 100households, which was noticeably higher than 537trips per 100 households, the rate for urbanhouseholds.
The number of overnight trips made per 100 personsin the population was 210 in rural India and 207,that is, roughly the same level, in urban India.
The number of overnight trips per 100 persons washigher for males – 225 for the rural population and220 for the urban – than for females – 194, rural,and 192, urban.
The number of same-day trips per 100 ofpopulation was 330 in rural India and 263 in urbanIndia. In rural India it was 389 for males and 266for females, and in urban India it was 297 amongmales and 226 among females.
With increase in age, the number of overnight aswell as same-day trips per person rose graduallyand then declined, being highest for the age-group30—34 in rural India and highest for the age-group40—44 in urban India. Among children under 15,
however, the number of trips, both same day aswell as overnight, per child was highest in the lowestage group 0-4 for rural as well as urban India.
There was not much variation among persons ofdifferent occupations or industries in number ofovernight or same-day trips per 100 persons.
CHARACTERISTICS OF TRIPS
Overnight/ Same-day: For the rural population,slightly over one-third of all trips were overnighttrips and nearly two-thirds were same-day trips.For the urban population, the proportion ofovernight trips was a little higher – over 40%.
Trip size: For the rural population, every 100overnight trips had 223 participating members, andevery 100 same-day trips had 183. For the urbanpopulation, every 100 overnight trips had 232participants, and every 100 same-day trips had 200participants.
Leading purpose (overnight trips): Trips whosepurpose was ‘social’ (social visits) accounted for75% of overnight trips of the rural population and71% of overnight trips of the urban population.Trips with ‘religious and pilgrimage’ purposesaccounted for about 9% of overnight trips for therural population and 12% for the urban population.Trips for ‘health and medical’ purposes formed 7%of overnight trips of the rural population and about3½% for the urban population of India. Trips for‘holidaying, leisure and recreation’ accounted for5% of overnight trips of urban people but only 2%for rural people.
Leading purpose (same-day trips): About 55%of same-day trips of the urban population and 38%for the rural population were made for ‘social’ visits.‘Shopping’ was found to be the next leadingpurpose for undertaking same-day trips in ruralIndia, accounting for 23% of such trips, but wasless common in urban India, where its share wasonly about 7%. ‘Health and medical’ purposes, too,were much more common in rural India, accountingfor 17% of same-day trips, and less common inurban India, where their share was about 8%.
Duration: The average number of nights spent onovernight trips was about 3 for the rural population
SARVEKSHANA 65
•
•
•
•
•
•
•
•
•
•
•
•
and about 4 for the urban. However, the averageduration of overnight trips undertaken by the urbanpopulation varied from 3.5 nights in the months ofFebruary and August to 5.6 in the month of July. Inrural areas month-to-month variation was relativelylow, the average duration varying from 2.7 nightsin February to 3.4 nights in June.
Destination location: Travel within one’s owndistrict accounted for about 66% of overnightvisitor-trips of the rural population but only about30% for the urban population. For the urbanpopulation, 49% of overnight visitor-trips were toa place outside one’s district but within one’s state;for the rural population, 28% of overnight visitor-trips were of this kind. 21% of urban and 6% ofrural overnight visitor-trips involved travel beyondone’s state.
Number of places visited: For every 100 tripsmade to a destination outside one’s state, about150 places were visited. For every 100 trips madeto a destination outside one’s district but withinone’s state, about 119 places were visited. Forevery 100 trips made to a destination within one’sdistrict, about 104 places were visited.
VISITOR CHARACTERISTICS AND VISITOR-SPECIFIC CHARACTERISTICS OF TRIPS
Gender profile: Among every 1000 overnightvisitors, 537 were males and 463 were females forthe urban sector while 525 were males and475 females for the rural sector. Among same-dayvisitors the male-female break-up did not differmuch across sectors and was about 55:45.
Visitor purpose: The break-up of overnight orsame-day visitor-trips by the purpose that led thevisitor to make the trip did not differ appreciablyfrom the break-up of overnight/ same-day trips byleading purpose.
Mode of travel: Buses were the dominant modeof travel for overnight and same-day trips alike,accounting for two-thirds (67%) of overnightvisitor-trips of the rural population, 57% ofovernight visitor-trips by the urban population, and57-61% of same-day visitor-trips of the rural and
urban populations. About 21% of same-day visitor-trips, for both rural and urban sectors, were byown transport.
Trains were used as the major mode of travel for27% of overnight visitor-trips by urban Indians;for rural Indians their share in overnight visitor-tripswas 7%. Trains were also used in 9% of same-dayvisitor-trips by urban Indians but their share wasonly 2% for rural Indians.
Type of stay: In case of 85% of rural and 80% ofurban overnight visitor-trips, the visitors stayed withfriends and relatives for the major part of their stay.
OCCURRENCE OF DOMESTIC TOURISMACTIVITY IN A ONE-YEAR PERIOD
About 77% of the population of both rural andurban sectors took part in at least one overnighttrip during a one-year period. For same-day tripsthe proportion of population making at least onetrip was about 76% in rural India and 70% in urbanIndia.
Households in which at least one member had madean overnight trip during the past one year formed92% of all households (about 93% in the ruralsector and 90% in the urban sector).
As many as 96% of rural households, but only 86%of urban households, had at least one member whohad taken part in a same-day trip during the pastone year, the overall percentage for India being93%.
The percentage of households with at least onemember making an overnight trip during the pastone year did not vary appreciably with householdoccupation, household social group or householdreligion. Nor was there any clear pattern of variationwith household economic level.
EXPENDITURE ON TRIPS
At all-India level, average expenditure per overnighttrip was Rs.821 for the rural population andRs.1,636 for the urban population.
66 SARVEKSHANA
•
•
•
•
•
•
•
•
•
•
•
•

Overnight trips with ‘social’ leading purpose had aper-trip expenditure of Rs.466 (43% lower thanthe average trip considering all purposes) for therural population and Rs.989 for the urbanpopulation (40% lower than average). Overnighttrips for ‘health and medical’ purposes were fourtimes as expensive as the average trip for both ruraland urban populations. The urban population’sovernight trips for ‘holidaying, leisure andrecreation’ were on the average more than threetimes as expensive, and its ‘business’ trips twice asexpensive as the average trip considering allpurposes. In both sectors, religious trips had a per-trip expenditure close to, but slightly higher than,the all-purposes average.
Average expenditure per overnight visitor-trip wasRs.369 in rural India and Rs.715 in urban India.
Average expenditure per overnight visitor-trip madefor ‘social’ reasons was only Rs.202 in rural Indiaand Rs.418 in urban India. In urban India ‘religiousand pilgrimage’ trips had an average expenditureper visitor-trip of Rs.699, lower than the all-purposes average.
In both rural and urban India, ‘social’ purpose tripsaccounted for about 43% of all overnight tripexpenditure. Trips for ‘health and medical’ purposeshad a share of 30% in overnight trip expenditurefor the rural population and 15% for the urban.‘Religious and pilgrimage’ trips had a share of about11% in the rural sector and about 14% in the urban.
The share of transport in overnight trip expenditurewas 20% in rural India but as much as 33% inurban India. The share of shopping was 30% in
rural India and 25% in urban India. The share ofrecreation, religious, cultural, sporting and health-related expenditure was as high as 32% in ruralIndia but only 15% in urban India.
The share of food and drink in overnight tripexpenditure was about 9-10% for both rural andurban India. The share of accommodation was 3%in rural India and about 6% (excluding paymentsmade as part of a ‘package’) in urban India.
For same-day trips, shopping was the largestcomponent of expenditure, accounting for 60% ofexpenditure in case of the rural population and 44%in case of the urban.
For ‘social’ overnight trips, shopping expenditureformed 51% of the total in rural India and about38% in urban India. For the urban population,transport commanded the largest share ofexpenditure (around 43%) for both ‘social’ and‘religious and pilgrimage’ trips. The share ofrecreation, religious, cultural, sporting and health-related expenditure for the rural population wasover 78% in ‘health and medical’ trips but under10% in ‘religious’ trips and lower still in trips for‘social’ visits.
Of the total expenditure by households on domestictourism, expenditure on overnight trips accountedfor 61% – 36% being incurred by rural and 25%by urban households. Same-day trips had a shareof 39% in total expenditure, 30% incurred by ruraland 9% by urban households. Thus, of the totaldomestic tourism expenditure, the share of the ruralhouseholds was about two-thirds (66%).
SARVEKSHANA 67
•
•
•
•
•
•
•
•
•

JÉhb-IV ÉÊcxnÉÒ
ºÉ´ÉæFÉhÉ
®É−]ÅÉÒªÉ |ÉÉÊiÉn¶ÉÇ ºÉ´ÉæFÉhÉ BÉEɪÉÉÇãÉªÉ BÉEÉÒ {ÉÉÊjÉBÉEÉ
£ÉÉMÉ-XXIX ºÉÆ.3 +ÉÉè® 4 +ÉÆBÉE ºÉÆJªÉÉ 96
®É−]ÅÉÒªÉ |ÉÉÊiÉn¶ÉÇ ºÉ´ÉæFÉhÉ BÉEɪÉÉÇãÉªÉ ºÉÉÆÉÎJªÉBÉEÉÒ A´ÉÆ BÉEɪÉÇμÉEàÉ BÉEɪÉÉÇx´ÉªÉxÉ àÉÆjÉÉãɪÉ
£ÉÉ®iÉ ºÉ®BÉEÉ® xÉ<Ç ÉÊnããÉÉÒ

ºÉ´ÉæFÉhÉ £ÉÉMÉ-XXIX ºÉÆ.3 +ÉÉè® 4
ÉÊ´É−ÉªÉ ºÉÚSÉÉÒ
Þ£ÉÉ®iÉ àÉå ºÉä´ÉÉ FÉäjÉ Þ BÉEä ºÉƤÉÆvÉ àÉå ®É−]ÅÉÒªÉ |ÉÉÊiÉn¶ÉÇ ºÉ´ÉæFÉhÉ BÉEɪÉÉÇãÉªÉ BÉEä 63´Éå nÉè® (VÉÖãÉÉ<Ç, 2006--VÉÚxÉ, 2007) BÉEÉ ºÉàÉÉÎx´ÉiÉ ºÉÉ® *
ÉÊcxnÉÒ 1--12

ºÉà{ÉÉnBÉEÉÒªÉ ºÉãÉÉcBÉEÉ® ¤ÉÉäbÇ 1. bÉì. ªÉÚ. ºÉÆBÉE® 2. |ÉÉä. ]ÉÒ.VÉä. ®É´É 3. |ÉÉä. A.BÉEä. +ÉÉÊvÉBÉEÉ®ÉÒ 4. bÉì. àÉxÉÉäVÉ {ÉÉÆbÉ 5. gÉÉÒ VÉÉÒ.ºÉÉÒ. àÉxxÉÉ 6. gÉÉÒ {ÉÉÒ.AºÉ. ¤ÉÉäºÉ 7. gÉÉÒ BÉEä. AxÉ. =xxÉÉÒ 8. gÉÉÒ ºÉiªÉ xÉɮɪÉhÉ É˺Éc
ºÉà{ÉÉnBÉEÉÒªÉ ºÉÉÊSÉ´ÉÉãɪÉ
ºÉàÉx´ÉªÉ A´ÉÆ |ÉBÉEɶÉxÉ |É£ÉÉMÉ, ®É−]ÅÉÒªÉ |ÉÉÊiÉn¶ÉÇ ºÉ´ÉæFÉhÉ BÉEɪÉÉÇãɪÉ,
ºÉ®nÉ® {É]äãÉ £É´ÉxÉ, ºÉƺÉn àÉÉMÉÇ,
xÉ<Ç ÉÊnããÉÉÒ-110001
gÉÉÒ ®ÉàÉ BÉßE{ÉÉãÉ, ={É àÉcÉÉÊxÉnä¶ÉBÉE gÉÉÒ +ɶÉÉäBÉE BÉÖEàÉÉ® SÉÉä{ɽÉ, ={É ÉÊxÉnä¶ÉBÉE
gÉÉÒ ÉÊ´ÉxÉÉän ºÉÉMÉ®, ´ÉÉÊ®−~ ºÉÉÆÉÎJªÉBÉEÉÒ +ÉÉÊvÉBÉEÉ®ÉÒ gÉÉÒ ®ÉàÉ ºÉÆVÉÉÒ´ÉxÉ, ´ÉÉÊ®−~ ºÉÉÆÉÎJªÉBÉEÉÒ +ÉÉÊvÉBÉEÉ®ÉÒ
gÉÉÒ ÉÊàÉjÉä ãÉÉãÉ, ´ÉÉÊ®−~ ºÉÉÆÉÎJªÉBÉEÉÒ +ÉÉÊvÉBÉEÉ®ÉÒ
àÉÚãªÉ& +ÉxiÉnæ¶ÉÉÒªÉ 200/-âó{ÉA

ºÉ´ÉæFÉhÉ ÉÊc.1
£ÉÉ®iÉ àÉå ºÉä´ÉÉ FÉäjÉ BÉEä ºÉƤÉÆvÉ àÉå ®É.|É.ºÉ´Éæ. BÉEä 63´Éå nÉè® (VÉÖãÉÉ<Ç, 2006-VÉÚxÉ, 2007)
BÉEÉ ºÉàÉÉÎx´ÉiÉ ºÉÉ®
®ÉàÉBÉßE{ÉÉãÉ A´ÉÆ ÉÊ´ÉxÉÉän ºÉÉMÉ®
1. |ɺiÉÉ´ÉxÉÉ 1.1 ºÉä´ÉÉ FÉäjÉ, VÉÉÒbÉÒ{ÉÉÒ àÉå +É{ÉxÉä ªÉÉäMÉnÉxÉ BÉEä {ÉÉÊ®|ÉäFªÉ àÉå +ÉlÉÇBªÉ´ÉºlÉÉ BÉEÉ ºÉ¤ÉºÉä àÉci´É{ÉÚhÉÇ {ÉcãÉÚ cè * ªÉc <BÉEÉ<ǪÉÉå BÉEÉÒ {ÉÉÊ®SÉÉãÉxÉ ÉÊ´ÉÉʶÉ−]iÉÉ+ÉÉäÆ iÉlÉÉ +ÉÉÉÌlÉBÉE MÉÉÊiÉÉÊ´ÉÉÊvɪÉÉå BÉEÉ ¤ÉcÖÉÊ´ÉvÉ FÉäjÉ cè * ºÉä´ÉÉ FÉäjÉ àÉå ¶ÉÉÉÊàÉãÉ <BÉEÉ<ǪÉÉå BÉEÉÒ ºÉÆ{ÉÚhÉÇ gÉßÆJÉãÉÉ àÉå ÉʴɶÉÉãÉ ÉÊxÉMÉÉÊàÉiÉ =tÉàÉ iÉlÉÉ UÉä]ä-UÉä]ä =tÉàÉ nÉäxÉÉå cÉÒ ¶ÉÉÉÊàÉãÉ cé * ÉʴɶÉÉãÉ =tÉàÉÉå BÉEÉ VÉcÉÆ =i{ÉÉnxÉ àÉå ªÉÉäMÉnÉxÉ ¤ÉcÖiÉ VªÉÉnÉ cè ´ÉcÉÓ UÉä]ÉÒ <BÉEÉ<ǪÉÉå BÉEÉ ®ÉäVÉMÉÉ® àÉå ªÉÉäMÉnÉxÉ VªÉÉnÉ cè * ªÉc ®ÉäVÉMÉÉ® ºÉßVÉxÉ àÉå BÉßEÉÊ−É BÉEä ¤ÉÉn ÉÊuiÉÉÒªÉ ºlÉÉxÉ {É® cè * iÉlÉÉÉÊ{É, £ÉÉèMÉÉäÉÊãÉBÉE FÉäjÉ àÉå <ºÉBÉEÉÒ ÉÊ´ÉÉÊ´ÉvÉ ´ÉßciÉ BªÉÉÉÎ{iÉ iÉlÉÉ ´ÉßÉÊr MÉÉÊiÉBÉEÉÒ BÉEä BÉEÉ®hÉ <ºÉ FÉäjÉ BÉEä ºÉ£ÉÉÒ £ÉÉMÉÉå àÉå £ÉÉ®ÉÒ bÉ]É +ÉÆiÉ®ÉãÉ cè * VÉÖãÉÉ<Ç 2006-VÉÚxÉ 2007 BÉEä nÉè®ÉxÉ ®É.|É.ºÉ´Éæ. BÉEä 63´Éå nÉè® àÉå ºÉä´ÉÉ FÉäjÉ =tÉàÉÉå BÉEÉ ºÉ´ÉæFÉhÉ <xÉ bÉ]É +ÉÆiÉ®ÉãÉÉå BÉEÉä £É®xÉä BÉEÉ |ɪÉÉºÉ cè * +ÉiÉ& =tÉàÉ ºÉ´ÉæFÉhÉ, =tÉàÉÉå BÉEÉÒ +ÉxÉÖàÉÉÉÊxÉiÉ ºÉÆJªÉÉ, =xÉBÉEä º´ÉÉÉÊàÉi´É +ÉÉè® {ÉÉÊ®SÉÉãÉxÉ ÉÊ´ÉÉʶÉ−]iÉÉ+ÉÉäÆ, BÉEÉàÉMÉÉ®Éå BÉEÉÒ ºÉÆJªÉÉ ºÉƤÉÆvÉÉÒ +ÉxÉÖàÉÉxÉÉå, BÉEÉàÉMÉÉ®Éå BÉEä |ÉBÉEÉ®, ®ÉäVÉMÉÉ® BÉEÉÒ |ÉBÉßEÉÊiÉ, <xÉ{ÉÖ], =i{ÉÉnxÉ A´ÉÆ àÉÚãªÉ´ÉvÉÇxÉ, ºlÉɪÉÉÒ {ÉÉÊ®ºÉÆ{ÉÉÊkɪÉÉå, {ÉÚÆVÉÉÒ ÉÊxÉàÉÉÇhÉ, {ÉÉÊ®ºÉÆ{ÉÉÊkÉ A´ÉÆ näxÉnÉÉÊ®ªÉÉå ºÉƤÉÆvÉÉÒ ®É−]ÅÉÒªÉ iÉlÉÉ ={É ®É−]ÅÉÒªÉ bÉ]É BÉEÉÒ BªÉÉ{ÉBÉE °ô{É®äJÉÉ BÉEÉ ABÉEàÉÉjÉ »ÉÉäiÉ cè * ºÉä´ÉÉ FÉäjÉ =tÉàÉÉå ºÉƤÉÆvÉÉÒ ®É.|É.ºÉ´Éæ. BÉEÉ ÉÊ{ÉUãÉÉ ºÉ´ÉæFÉhÉ VÉÖãÉÉ<Ç 2001-VÉÚxÉ 2002 BÉEä nÉè®ÉxÉ ®É.|É.ºÉ´Éæ. BÉEä 57´Éå nÉè® àÉå +ÉɪÉÉäÉÊVÉiÉ ÉÊBÉEªÉÉ MɪÉÉ lÉÉ * 1.2 63´Éå nÉè® BÉEä +ÉÆiÉMÉÇiÉ |ɪÉÖBÉDiÉ ÞºÉä´ÉÉ FÉäjÉ =tÉàÉ Þ ¶É¤n (A) ºÉ®BÉEÉ®ÉÒ iÉlÉÉ ºÉÉ´ÉÇVÉÉÊxÉBÉE FÉäjÉ ={ÉμÉEàÉ iÉlÉÉ (¤ÉÉÒ) ´ÉÉÉÌ−ÉBÉE =tÉÉäMÉ ºÉ´ÉæFÉhÉ BÉEä +ÉÆiÉMÉÇiÉ ºÉÉÎààÉÉÊãÉiÉ FÉäjÉ BÉEä +ÉãÉÉ´ÉÉ àÉÖJªÉiÉ& ºÉ£ÉÉÒ ºÉä´ÉÉ FÉäjÉ =tÉàÉÉå BÉEä ºÉÆn£ÉÇ àÉå cè * +ÉiÉ& ºÉ´ÉæFÉhÉ àÉå cÉä]ãÉ iÉlÉÉ ®äº]Éä®å] (AxÉ+ÉÉ<ǺÉÉÒ 2004 BÉEÉ ºÉäBÉD¶ÉxÉ ASÉ); {ÉÉÊ®´ÉcxÉ, ºÉÆOÉchÉ iÉlÉÉ ºÉÆSÉÉ® (+ÉÉ<Ç) ÉÊ´ÉkÉÉÒªÉ àÉvªÉºlÉiÉÉ (VÉä) VÉàÉÉÒxÉ VÉɪÉnÉn, ÉÊBÉE®ÉA {É® näxÉÉ +ÉÉè® BªÉɴɺÉÉÉʪÉBÉE MÉÉÊiÉÉÊ´ÉÉÊvɪÉÉÆ (BÉEä) ÉʶÉFÉÉ (AàÉ) º´ÉɺlªÉ A´ÉÆ ºÉÉàÉÉÉÊVÉBÉE BÉEɪÉÇ (AxÉ) +ÉÉè® +ÉxªÉ ºÉÉàÉÖnÉÉʪÉBÉE, ºÉÉàÉÉÉÊVÉBÉE iÉlÉÉ ÉÊxÉVÉÉÒ ºÉä´ÉÉ BÉEɪÉÇ-BÉEãÉÉ{ÉÉå àÉå ºÉƤÉr ºÉ£ÉÉÒ ºÉä´ÉÉ FÉäjÉ =tÉàÉ (+ÉÉä) (BªÉÉ{ÉÉ® BÉEÉä UÉä½BÉE®) ºÉÉÎààÉÉÊãÉiÉ cé * <ºÉ ºÉ´ÉæFÉhÉ BÉEÉÒ ABÉE àÉÖJªÉ ÉʴɶÉä−ÉiÉÉ ÉÊ´ÉkÉÉÒªÉ àÉvªÉºlÉiÉÉ (VÉä) BÉEÉä ¶ÉÉÉÊàÉãÉ BÉE®xÉÉ cè VÉÉä ÉÊBÉE ®É.|É.ºÉ´Éæ. BÉEÉ. BÉEä +ɺÉÆMÉÉÊ~iÉ ºÉä´ÉÉ FÉäjÉ =tÉàÉÉå ºÉä ºÉƤÉÆÉÊvÉiÉ ÉÊ{ÉUãÉä ºÉ´ÉæFÉhÉ àÉå ¶ÉÉÉÊàÉãÉ xÉcÉÓ lÉÉÒ * iÉlÉÉÉÊ{É, <ºÉ ºÉ´ÉæFÉhÉ àÉå =tÉÉäMÉ/®äãÉ´Éä, ÉÊ´ÉàÉÉxÉ ªÉÉ {ÉÉ<{ÉãÉÉ<xÉ (AxÉ+ÉÉ<ǺÉÉÒ 2004 BÉEÉ ºÉàÉÚc 601, 603 +ÉÉè® |É£ÉÉMÉ 62) BÉEä VÉÉÊ®A {ÉÉÊ®´ÉcxÉ BÉEÉÒ MÉÉÊiÉÉÊ´ÉÉÊvɪÉÉÆ, ÉÊxÉVÉÉÒ +ÉÉ´ÉɺÉÉÒªÉ £É´ÉxÉÉå (AxÉ+ÉÉ<ǺÉÉÒ 2004 BÉEÉ ={É ´ÉMÉÇ 70103) BÉEÉÒ VÉàÉÉÒxÉ VÉɪÉnÉn BÉEÉ ºÉÆSÉÉãÉxÉ, àÉÉèÉÊpBÉE àÉvªÉºlÉiÉÉ (AxÉ+ÉÉ<ǺÉÉÒ 2004 BÉEÉ ºÉàÉÚc 651), ]Åäb ªÉÚÉÊxɪÉxÉ (={É-´ÉMÉÇ 91200) BÉEä BÉEɪÉÇ-BÉEãÉÉ{É, vÉÉÉÌàÉBÉE ºÉÆMÉ~xÉ (={É-´ÉMÉÇ 91910) A´ÉÆ ®ÉVÉxÉÉÒÉÊiÉBÉE ºÉÆMÉ~xÉ (={É-´ÉMÉÇ 91920) ¶ÉÉÉÊàÉãÉ xÉcÉÓ cé * =ããÉäJÉxÉÉÒªÉ cè ÉÊBÉE ={É ´ÉMÉÇ 91910 BÉEÉ ABÉE £ÉÉMÉ AäºÉä BªÉÉÎBÉDiɪÉÉå ºÉä ºÉƤÉÆÉÊvÉiÉ cè VÉÉä {ÉÖVÉÉ®ÉÒ <iªÉÉÉÊn VÉèºÉä ={ÉɺÉBÉEÉå BÉEÉä +É{ÉxÉÉÒ ºÉä´ÉÉAÆ ={ÉãɤvÉ BÉE®ÉiÉä cé *

ºÉ´ÉæFÉhÉ ÉÊc.2
2. {ÉrÉÊiÉ 2.1 £ÉÉèMÉÉäÉÊãÉBÉE FÉäjÉ& <ºÉ ºÉ´ÉæFÉhÉ àÉå (i) VÉààÉÚ A´ÉÆ BÉE¶àÉÉÒ® BÉEä ãÉäc (ãÉqÉJÉ), BÉEÉ®ÉÊMÉãÉ, {ÉÚÆSU A´ÉÆ ®ÉVÉÉè®ÉÒ ÉÊVÉãÉä (ii) xÉÉMÉÉãÉéb àÉå ¤ÉºÉ °ô] ºÉä {ÉÉÆSÉ ÉÊBÉEãÉÉäàÉÉÒ]® BÉEÉÒ nÚ®ÉÒ ºÉä {É®ä ÉκlÉiÉ +ÉÉÆiÉÉÊ®BÉE MÉÉÆ´É (iii) +ÉÆbàÉÉxÉ +ÉÉè® ÉÊxÉBÉEÉä¤ÉÉ® uÉÒ{É ºÉàÉÚc BÉEä MÉÉÆ´É, VÉÉä {ÉÚ®ä ´É−ÉÇ +ÉMÉàªÉ ®ciÉä cé, BÉEÉä UÉä½BÉE® {ÉÚ®É £ÉÉ®iÉ ºÉÆPÉ ¶ÉÉÉÊàÉãÉ cè * 2.2 |ÉÉÊiÉn¶ÉÇ ÉÊbVÉÉ<xÉ BÉEÉÒ °ô{É®äJÉÉ& ÉʴɶÉÉãÉ A´ÉÆ ¤ÉcÖiÉ UÉä]ä =tÉàÉÉå ´ÉÉãÉä ºÉä´ÉÉ FÉäjÉ BÉEä ÉÊ´É−ÉàÉ bÉäàÉäxÉ BÉEÉä vªÉÉxÉ àÉå ®JÉiÉä cÖA |ÉÉÊiÉn¶ÉÇ =tÉàÉÉå BÉEä SɪÉxÉ cäiÉÖ 63´Éå nÉè® BÉEÉ |ÉÉÊiÉn¶ÉÇ +ÉÉÊ£ÉBÉEã{É ÉʴɶÉä−ÉiÉÉè® ºÉä nÉäc®ä |ÉEäàÉ xÉÉàÉiÉ& ÉÊãɺ] |ÉEäàÉ +ÉÉè® AÉÊ®ªÉÉ |ÉEäàÉ ºÉä iÉèªÉÉ® ÉÊBÉEªÉÉ MɪÉÉ lÉÉ * ªÉtÉÉÊ{É ÉÊ´ÉkÉÉÒªÉ FÉäjÉ =tÉàÉÉå ´É ºÉä´ÉÉFÉäjÉ BÉEä +ÉxªÉ ¤É½ä =tÉàÉÉå BÉEÉä ÉÊãɺ] |ÉEäàÉ àÉå ¶ÉÉÉÊàÉãÉ ÉÊBÉEªÉÉ MɪÉÉ lÉÉ, iÉlÉÉÉÊ{É MÉÉÆ´ÉÉå iÉlÉÉ ¶Éc®ÉÒ |ÉJÉÆbÉå BÉEä £ÉÉèMÉÉäÉÊãÉBÉE FÉäjÉ àÉå +É´ÉÉκlÉiÉ +ÉxªÉ ºÉ£ÉÉÒ =tÉàÉÉå (ÉÊãɺ] |ÉEäàÉ àÉå ¶ÉÉÉÊàÉãÉ =tÉàÉÉå BÉEÉä UÉä½BÉE®) BÉEÉä AÉÊ®ªÉÉ |ÉEäàÉ àÉå ¶ÉÉÉÊàÉãÉ ÉÊBÉEªÉÉ MɪÉÉ lÉÉ * AÉÊ®ªÉÉ |ÉEäàÉ àÉå, ºiÉ®ÉÒBÉßEiÉ ¤ÉcÖ-ºiÉ®ÉÒªÉ |ÉÉÊiÉn¶ÉÇ ÉÊbVÉÉ<xÉ BÉEÉä +É{ÉxÉɪÉÉ MɪÉÉ lÉÉ * OÉÉàÉÉÒhÉ FÉäjÉÉå àÉå {ÉcãÉä ºiÉ® BÉEÉÒ <BÉEÉ<ǪÉÉÆ (A{ÉEAºÉªÉÚ) MÉÉÆ´É (BÉEä®ãÉ àÉå {ÉÆSÉɪÉiÉ ´ÉÉbÇ) lÉä +ÉÉè® ¶Éc®ÉÒ FÉäjÉÉå àÉå, ¶Éc®ÉÒ |ÉEäàÉ ºÉ´Éæ (ªÉÚA{ÉEAºÉ) |ÉJÉÆb {ÉcãÉä ºiÉ® BÉEÉÒ <BÉEÉ<ǪÉÉÆ lÉÉÒ * +É{ÉäFÉÉBÉßEiÉ {ÉcãÉä ºiÉ® BÉEÉÒ ¤É½ÉÒ <BÉEÉ<ǪÉÉå BÉEÉä UÉä]ä-UÉä]ä £ÉÉMÉÉå àÉå ¤ÉÉÆ]É MɪÉÉ, ÉÊVÉxcå OÉÉàÉÉÒhÉ FÉäjÉÉå àÉå ¤ÉºiÉÉÒ-ºÉàÉÚc xÉÉàÉ ÉÊnªÉÉ MɪÉÉ +ÉÉè® ¶Éc®ÉÒ FÉäjÉÉå àÉå ={É-|ÉJÉÆb xÉÉàÉ ÉÊnªÉÉ MɪÉÉ * {ÉcãÉä ºiÉ® BÉEÉÒ ¤É½ÉÒ <BÉEÉ<ǪÉÉå BÉEä àÉÉàÉãÉä àÉå, VÉcÉÆ ¤ÉºiÉÉÒ-ºÉàÉÚc (ASÉVÉÉÒ)/={É-|ÉJÉÆb (AºÉ¤ÉÉÒ) ¤ÉxÉÉxÉÉ VÉ°ô®ÉÒ lÉÉ, ´ÉcÉÆ |ÉÉÊiÉn¶ÉÇ SɪÉxÉ àÉå ABÉE àÉvªÉ´ÉiÉÉÔ ºiÉ® ¶ÉÉÉÊàÉãÉ ÉÊBÉEªÉÉ MɪÉÉ, ÉÊVɺÉàÉå |ÉiªÉäBÉE A{ÉEAºÉªÉÚ ºÉä iÉÉÒxÉ ¤ÉºiÉÉÒ-ºÉàÉÚc/={É-|ÉJÉÆb BÉEÉ SɪÉxÉ ÉÊBÉEªÉÉ VÉÉxÉÉ lÉÉ * ªÉä ¤ÉºiÉÉÒ-ºÉàÉÚc/={É-|ÉJÉÆb A{ÉEAºÉªÉÚ àÉå ¤ÉxÉÉA MÉA BÉEàÉ ºÉä BÉEàÉ SÉÉ® ASÉVÉÉÒ/AºÉ¤ÉÉÒ àÉå ºÉä SÉÖxÉä VÉÉxÉä lÉä * ºÉä´ÉÉ FÉäjÉ BÉEä =tÉàÉÉå BÉEÉÒ +ÉÉÊPÉBÉEiÉàÉ ºÉÆJªÉÉ ´ÉÉãÉÉ ABÉE ASÉVÉÉÒ/AºÉ¤ÉÉÒ ºÉÆ£ÉÉBªÉiÉÉ Þ1 Þ ABÉE BÉEä ºÉÉlÉ SÉÖxÉÉ MɪÉÉ +ÉÉè® <ºÉä ºÉäMÉàÉå] -1 BÉEcÉ MɪÉÉ +ÉÉè® A{ÉEAºÉªÉÚ BÉEä ¶Éä−É ASÉVÉÉÒ/AºÉ¤ÉÉÒ BÉEÉÒ ºÉÚSÉÉÒ àÉå ºÉä ªÉÉoÉÎSUBÉE +ÉÉvÉÉ® {É® nÉä ASÉVÉÉÒ/AºÉ¤ÉÉÒ +ÉÉè® SÉÖxÉä MÉA iÉlÉÉ <xɺÉä ºÉäMÉàÉå]-2 ¤ÉxÉɪÉÉ MɪÉÉ * VÉèºÉÉ ÉÊBÉE >ó{É® =ããÉäJÉ ÉÊBÉEªÉÉ MɪÉÉ cè, ºÉäMÉàÉå] BÉEä +ÉÆiÉMÉÇiÉ, =tÉÉäMÉÉå BÉEä |ÉBÉEÉ® A´ÉÆ =tÉàÉÉå BÉEä |ÉBÉEÉ® BÉEä +ÉÉvÉÉ® {É® ´ÉMÉÉÔBÉßEiÉ nںɮä SÉ®hÉ BÉEä +ÉÉ~ ÉÊuiÉÉÒªÉ ºiÉ® ºÉƺiÉ® (AºÉAºÉAºÉ) iÉèªÉÉ® ÉÊBÉEA MÉA * +ÉÆÉÊiÉàÉ ºiÉ® BÉEÉÒ <BÉEÉ<ǪÉÉå (ªÉÚAºÉªÉÚ) +ÉlÉÉÇiÉ ºÉä´ÉÉ FÉäjÉ BÉEä =tÉàÉÉå BÉEÉä AºÉ+ÉÉ®AºÉb¤ãªÉÚ+ÉÉä+ÉÉ® BÉEä VÉÉÊ®A |ÉiªÉäBÉE ºÉäMÉàÉå] BÉEä ºÉƤÉÆÉÊvÉiÉ AºÉAºÉAºÉ BÉEä {ÉÉjÉ =tÉàÉÉå àÉå ºÉä SÉÖxÉÉ MɪÉÉ lÉÉ * ãÉäÉÊBÉExÉ, ºÉÆ{ÉÚhÉÇ A{ÉEAºÉªÉÚ àÉå ºÉä ºÉä´ÉÉ FÉäjÉ BÉEä +É{ÉäFÉÉBÉßEiÉ ¤É½ä =tÉàÉ (MÉè®- àÉÉèºÉàÉÉÒ/àÉÉèºÉàÉÉÒ =tÉàÉÉå BÉEä àÉÉàÉãÉä àÉå, ºÉÆn£ÉÇ ´É−ÉÇ BÉEä nÉè®ÉxÉ 30/15 ÉÊnxÉ BÉEÉàÉ BÉE®xÉä ´ÉÉãÉä =tÉàÉ), ÉÊVÉxÉàÉå 50 ªÉÉ <ºÉºÉä +ÉÉÊvÉBÉE BÉEàÉÇSÉÉ®ÉÒ BÉEÉàÉ BÉE®iÉä cé +ÉÉè® VÉÉä ºÉ´ÉæFÉhÉ BÉEä ªÉÉäMªÉ lÉä, BÉEÉä +ÉãÉMÉ ºÉä ºÉÚSÉÉÒ¤Ér (ºÉäMÉàÉå]-9) ÉÊBÉEªÉÉ MɪÉÉ +ÉÉè® ºÉäMÉàÉå]-9 BÉEä <xÉ ºÉ£ÉÉÒ ºÉÚSÉÉÒ¤Ér =tÉàÉÉå àÉå +ÉxÉÖºÉÚÉÊSɪÉÉÆ £É®ÉÒ MÉ<ÇÆ * +ÉÆiÉiÉ& ÉÊãɺ] |ÉEäàÉ (BÉÖEãÉ 998 =tÉàÉ) ºÉä xÉàÉÚxÉä BÉEä iÉÉè® {É® 438 =tÉàÉÉå BÉEÉ +ÉÉè® AÉÊ®ªÉÉ |ÉEäàÉ ºÉä 13,271 |ÉÉÊiÉn¶ÉÇ MÉÉÆ´ÉÉå/¶Éc®ÉÒ |ÉJÉÆbÉå àÉå +É´ÉÉκlÉiÉ 190,282 =tÉàÉÉå BÉEÉ ´ÉɺiÉÉÊ´ÉBÉE ºÉ´ÉæFÉhÉ ÉÊBÉEªÉÉ MɪÉÉ * 2.3 ÉÊBÉEºÉÉÒ £ÉÉÒ SÉÖÉËxÉnÉ ºÉ´ÉæFÉhÉ ÉʴɶÉä−ÉiÉÉ BÉEä ºÉƤÉÆvÉ àÉå ºÉàÉÉcÉ®Éå BÉEä ÉÊbVÉÉ<xÉ +ÉÉvÉÉÉÊ®iÉ +ÉxÉÖàÉÉxÉ, ÉÊãɺ] |ÉEäàÉ +ÉÉè® AÉÊ®ªÉÉ |ÉEäàÉ BÉEä ÉÊãÉA +ÉãÉMÉ-+ÉãÉMÉ cÉÉʺÉãÉ ÉÊBÉEA MÉA * +ÉÆiÉ àÉå, ºÉƪÉÖBÉDiÉ |ÉEäàÉ BÉEä ÉÊãÉA ABÉEÉÊjÉiÉ ºÉBÉEãÉ +ÉxÉÖàÉÉxÉ |ÉÉ{iÉ BÉE®xÉä BÉEä =qä¶ªÉ ºÉä +ÉxÉÖàÉÉxÉÉå BÉEä <xÉ nÉäxÉÉå ºÉä]Éå BÉEÉ ªÉÉäMÉ ÉÊxÉBÉEÉãÉÉ MɪÉÉ * <ºÉ ºÉÉ®-ºÉÆÉÊFÉ{iÉ ÉÊ®{ÉÉä]Ç àÉå, ºÉ´ÉæFÉhÉ àÉå ={ɪÉÉäMÉ ÉÊBÉEA MÉA nÉä |ÉBÉEÉ® BÉEä |ÉEäàÉÉå {É® +ÉÉvÉÉÉÊ®iÉ ABÉEjÉ +ÉxÉÖàÉÉxÉ BÉEä ¤ÉÉ®ä àÉå ÉʴɶÉä−É °ô{É ºÉä SÉSÉÉÇ BÉEÉÒ VÉÉAMÉÉÒ *

ºÉ´ÉæFÉhÉ ÉÊc.3
2.4 àÉnå, ÉÊVÉxÉBÉEä ¤ÉÉ®ä àÉå ºÉÚSÉxÉÉ VÉÖ]É<Ç MÉ<Ç& ºÉä´ÉÉ FÉäjÉ BÉEä =tÉàÉÉå ºÉä +ÉÉÆBÉE½ä VÉÖ]ÉxÉä BÉEä ÉÊãÉA +ÉxÉÖºÉÚSÉÉÒ 2.345 iÉèªÉÉ® BÉEÉÒ MÉ<Ç lÉÉÒ * +ÉxÉÖºÉÚSÉÉÒ BÉEÉä 19 |ÉJÉÆbÉå àÉå ºÉÆMÉÉÊ~iÉ ÉÊBÉEªÉÉ MɪÉÉ * +ÉxÉÖºÉÚSÉÉÒ BÉEä ÉÊ´ÉÉÊ£ÉxxÉ JÉÆbÉå BÉEä àÉÉvªÉàÉ ºÉä ÉÊVÉxÉ àÉnÉå BÉEä ¤ÉÉ®ä àÉå ºÉÚSÉxÉÉ VÉÖ]É<Ç MÉ<Ç, ´Éä cé & ºÉÆSÉÉãÉxÉ BÉEÉ ÉÊ´É´É®hÉ iÉlÉÉ =tÉàÉ BÉEÉÒ {Éß−~£ÉÚÉÊàÉ BÉEä ¤ÉÉ®ä àÉå ºÉÚSÉxÉÉ, ºÉÆSÉÉãÉxÉ BÉEÉ àÉÚãÉ BªÉªÉ, ºÉÆSÉÉãÉxÉ ºÉƤÉÆvÉÉÒ +ÉxªÉ BªÉªÉ, àÉÚãÉ |ÉÉÉÎ{iɪÉÉÆ, +ÉxªÉ |ÉÉÉÎ{iɪÉÉÆ, MÉè®-ÉÊ´ÉkÉÉÒªÉ =tÉàÉÉå BÉEä ºÉƤÉÆvÉ àÉå +ÉxªÉ |ÉÉÉÎ{iɪÉÉÆ/BªÉªÉ, ºÉBÉEãÉ àÉÚãªÉ´ÉvÉÇxÉ, ®ÉäVÉMÉÉ® ºÉƤÉÆvÉÉÒ ÉÊ´É´É®hÉ, BÉEÉàÉMÉÉ®Éå BÉEÉä {ÉÉÉÊ®gÉÉÊàÉBÉE, º´ÉÉÉÊàÉi´É ´ÉÉãÉÉÒ +ÉSÉãÉ ºÉÆ{ÉÉÊkɪÉÉÆ +ÉÉè® ÉÊBÉE®ÉA {É® ãÉÉÒ MÉ<Ç ºÉÆ{ÉÉÊkɪÉÉå BÉEÉ ÉÊBÉE®ÉªÉÉ iÉlÉÉ ÉÊ´ÉkÉÉÒªÉ näªÉiÉÉAÆ *
3. ºÉàÉÉÎx´ÉiÉ ºÉÉ® BÉEÉÒ ÉÊ´É−ɪÉ-´ÉºiÉÖ
3.1 =tÉàÉ ºÉ´ÉæFÉhÉ {É® +ÉÉvÉÉÉÊ®iÉ AxÉAºÉAºÉ BÉEä 63´Éå nÉè® ºÉä ºÉƤÉÆÉÊvÉiÉ nÉä ÉÊ®{ÉÉä]ç |ÉBÉEÉÉʶÉiÉ cÉä SÉÖBÉEÉÒ cé& (1) £ÉÉ®iÉ àÉå ºÉä´ÉÉ FÉäjÉ (2006-07) -=tÉàÉÉå BÉEÉÒ |ÉSÉÉãÉxÉÉiàÉBÉE ÉʴɶÉä−ÉiÉÉAÆ (AxÉAºÉAºÉ ÉÊ®{ÉÉä]Ç ºÉÆ.528) iÉlÉÉ (2) £ÉÉ®iÉ àÉå ºÉä´ÉÉ FÉäjÉ (2006-07)- =tÉàÉÉå BÉEÉÒ +ÉÉÉÌlÉBÉE ÉʴɶÉä−ÉiÉÉAÆ (AxÉAºÉAºÉ ÉÊ®{ÉÉä]Ç ºÉÆ.529) * {ÉÉÊ®hÉÉàÉÉå BÉEÉ àÉÉèVÉÚnÉ ABÉEÉÒBÉßEiÉ ºÉÉ® ={É®ÉäBÉDiÉ nÉä ÉÊ®{ÉÉä]Éç BÉEä |ÉàÉÖJÉ ÉÊxÉ−BÉE−ÉÇ {É® +ÉÉvÉÉÉÊ®iÉ cè *
4. àÉÖJªÉ ÉÊxÉ−BÉE−ÉÇ &
4 BÉE& +ÉÉÊJÉãÉ-£ÉÉ®iÉÉÒªÉ {ÉÉÊ®hÉÉàÉ
4.1 |ÉàÉÖJÉ ºÉÆBÉEäiÉBÉE& =tÉàÉ FÉäjÉ BÉEä BÉE<Ç ºÉÆBÉEäiÉBÉE cé ÉÊVɺÉBÉEä VÉÉÊ®A +ÉlÉÇBªÉ´ÉºlÉÉ {É® |É£ÉÉ´É BÉEÉ +ÉvªÉªÉxÉ ÉÊBÉEªÉÉ VÉÉ ºÉBÉEiÉÉ cè * <ºÉàÉå ºÉä BÉÖEU |ÉàÉÖJÉ ºÉÆBÉEäiÉBÉE cé- +ÉÉBÉEÉ® (VÉèºÉä =tÉàÉÉå BÉEÉÒ ºÉÆJªÉÉ +ÉÉè® BÉEÉàÉMÉÉ®Éå BÉEÉÒ ºÉÆJªÉÉ), |ÉÉÊiÉ =tÉàÉ ®ÉäVÉMÉÉ®, ºÉBÉEãÉ àÉÚãªÉ´ÉvÉÇxÉ +ÉÉÉÊn * ÉÊ´É´É®hÉÉÒ 1 |ÉàÉÖJÉ ºÉÆBÉEäiÉBÉEÉå BÉEä ºÉÆn£ÉÇ àÉå 2006-07 BÉEä nÉè®ÉxÉ £ÉÉ®iÉ àÉå ºÉä´ÉÉ FÉäjÉ =tÉàÉÉå BÉEÉÒ ABÉE ZÉãÉBÉE |ɺiÉÖiÉ BÉE®iÉÉÒ cè * <ºÉºÉä |ÉBÉE] cÉäiÉÉ cè ÉÊBÉE 2006-07 BÉEä nÉè®ÉxÉ £ÉÉ®iÉ àÉå ãÉMÉ£ÉMÉ 16.5 ÉÊàÉÉÊãɪÉxÉ ºÉä´ÉÉ FÉäjÉ =tÉàÉ BÉEɪÉÇ BÉE® ®cä lÉä * <ºÉºÉä ªÉc £ÉÉÒ |ÉBÉE] cÉäiÉÉ cè ÉÊBÉE 2006-07 BÉEä nÉè®ÉxÉ ºÉä´ÉÉ FÉäjÉ =tÉàÉÉå àÉå ãÉMÉ£ÉMÉ 33.5 ÉÊàÉãɪÉxÉ ãÉÉäMÉ BÉEɪÉÇ BÉE® ®cä lÉä * nä¶É BÉEÉ BÉÖEãÉ ºÉBÉEãÉ àÉÚãªÉ´ÉvÉÇxÉ 2,44,792 BÉE®Éä½ âó. +ÉxÉÖàÉÉÉÊxÉiÉ ÉÊBÉEªÉÉ MɪÉÉ cè * nä¶É BÉEÉÒ |ÉÉÊiÉ =tÉàÉ º´ÉÉÉÊàÉi´É ´ÉÉãÉÉÒ ºlÉÉ<Ç {ÉÉÊ®ºÉÆ{ÉÉÊkɪÉÉå BÉEÉÒ ¤ÉÉVÉÉ® BÉEÉÒàÉiÉ 1,78,102 âó. +ÉxÉÖàÉÉÉÊxÉiÉ BÉEÉÒ MÉ<Ç cè * ºÉä´ÉÉ FÉäjÉ BÉEä bÉäàÉäxÉ BÉEÉÒ ÉÊ´É−ÉàÉiÉÉ <ºÉ ºÉÉvÉÉ®hÉ iÉlªÉ ºÉä cÉÒ º{É−] cè ÉÊBÉE |ÉÉÊiÉ−~ÉxÉÉå BÉEÉÒ º´ÉÉÉÊàÉi´É ´ÉÉãÉÉÒ ºlÉɪÉÉÒ {ÉÉÊ®ºÉÆ{ÉÉÊkɪÉÉå BÉEÉ |ÉÉÊiÉ =tÉàÉ àÉÚãªÉ (âó.960.2 cVÉÉ®) º´É-ãÉäJÉÉ =tÉàÉÉå 1 (+ÉÉäA<Ç) BÉEä <ºÉÉÒ àÉÚãªÉ (âó. 43.7 cVÉÉ®) BÉEÉ ãÉMÉ£ÉMÉ 22 MÉÖhÉÉ cè ) ªÉc näJÉÉ MɪÉÉ cè ÉÊBÉE ABÉE =tÉàÉ BÉEÉ +ÉÉèºÉiÉxÉ, ÉÊ´ÉkÉÉÒªÉ nÉÉʪÉi´É (ºÉÆn£ÉÇ ´É−ÉÇ BÉEÉÒ +ÉÆÉÊiÉàÉ ÉÊiÉÉÊlÉ BÉEÉÒ ÉκlÉÉÊiÉ BÉEä +ÉxÉÖºÉÉ® =tÉàÉ uÉ®É ´ÉcxÉ ÉÊBÉEªÉÉ MɪÉÉ BÉÖEãÉ nÉÉʪÉi´É ÉÊVɺÉàÉå ABÉE =tÉàÉ BÉEä ºÉÉZÉänÉ®Éå uÉ®É ãÉMÉÉ<Ç MÉ<Ç {ÉÚÆVÉÉÒ, ¶ÉäªÉ® {ÉÚÆVÉÉÒ, ¤ÉèãÉåºÉ ¶ÉÉÒ] àÉå xÉÉä] BÉEÉÒ MÉ<Ç ÉÊ®VÉ´ÉÇ iÉlÉÉ +ÉÉÊvɶÉä−É ®ÉÉʶÉ, nÉÒPÉÇ +É´ÉÉÊvÉ BÉEä jÉ@hÉ iÉlÉÉ +É|ÉnkÉ àÉVÉnÚ®ÉÒ +ÉÉÉÊn VÉèºÉä £ÉÖMÉiÉÉxÉÉå BÉEä ÉÊãÉA ºÉ£ÉÉÒ +Éã{É-+É´ÉÉÊvÉ BÉEÉÒ |ÉÉÊiɤÉriÉÉAÆ £ÉÉÒ ¶ÉÉÉÊàÉãÉ cé) 4,41,133 âó. cè * nä¶É àÉå +ÉÉäA<Ç BÉEÉ |ÉÉÊiÉ =tÉàÉ ÉÊ´ÉkÉÉÒªÉ nÉÉʪÉi´É, |ÉÉÊiÉ−~ÉxÉÉå BÉEä 28,84,961 âó. BÉEÉÒ iÉÖãÉxÉÉ àÉå, 21,430 âó. cè * 1 ºÉ´ÉæFÉhÉ àÉå +É{ÉxÉÉ<Ç MÉ<Ç {ÉÉÊ®£ÉÉ−ÉÉ BÉEä +ÉxÉÖºÉÉ®, º´É-ãÉäJÉÉ =tÉàÉ ´Éc <BÉEÉ<Ç cè VÉÉä ÉÊ{ÉUãÉä ABÉE ´É−ÉÇ BÉEä +ÉÉÊvÉBÉEÉÆ¶É £ÉÉMÉ BÉEä nÉè®ÉxÉ
BÉEÉä<Ç £Éɽä BÉEä BÉEÉàÉMÉÉ® BÉEÉä ÉÊãÉA ÉʤÉxÉÉ SÉãÉÉ<Ç MÉ<Ç cÉä VɤÉÉÊBÉE |ÉÉÊiÉ−~ÉxÉ ºÉä iÉÉi{ɪÉÇ AäºÉÉÒ <BÉEÉ<Ç ºÉä cè ÉÊVɺÉàÉå =BÉDiÉ ºÉÆn£ÉÇ +É´ÉÉÊvÉ BÉEä nÉè®ÉxÉ BÉEàÉ ºÉä BÉEàÉ ABÉE £Éɽä BÉEÉ BÉEÉàÉMÉÉ® ãÉMÉɪÉÉ MɪÉÉ cÉä *

ºÉ´ÉæFÉhÉ ÉÊc.4
ÉÊ´É´É®hÉÉÒ 1 & £ÉÉ®iÉ àÉå ºÉä´ÉÉ FÉäjÉ =tÉàÉ, 2006-07 BÉEÉÒ ABÉE ZÉãÉBÉE
|ÉàÉÖJÉ ºÉÆBÉEäiÉBÉE BÉÖEãÉ +ÉÉäA<Ç |ÉÉÊiÉ−~ÉxÉ =tÉàÉÉå BÉEÉÒ +ÉxÉÖàÉÉÉÊxÉiÉ ºÉÆJªÉÉ ('000) 16,512 14,092 2,420 BÉEÉàÉMÉÉ®Éå BÉEÉÒ +ÉxÉÖàÉÉÉÊxÉiÉ ºÉÆJªÉÉ ('000) 33,516 21,258 12,258 |ÉÉÊiÉ =tÉàÉ BÉEÉàÉMÉÉ®Éå BÉEÉÒ +ÉÉèºÉiÉ ºÉÆJªÉÉ 2.03 1.51 5.07 BÉÖEãÉ ºÉBÉEãÉ àÉÚãªÉ´ÉvÉÇxÉ (âó. BÉE®Éä½ àÉå) 2,44,792 45,660 1,99,131 |ÉÉÊiÉ =tÉàÉ º´ÉÉÉÊàÉi´É ´ÉÉãÉÉÒ ºlÉÉ<Ç {ÉÉÊ®ºÉÆ{ÉÉÊkɪÉÉå BÉEÉ +ÉxÉÖàÉÉÉÊxÉiÉ àÉÚãªÉ (âó. àÉå)
1,78,102 43,774 9,60,260
|ÉÉÊiÉ =tÉàÉ ÉÊ´ÉkÉÉÒªÉ nÉÉʪÉi´É BÉEÉ +ÉxÉÖàÉÉÉÊxÉiÉ àÉÚãªÉ (âó. àÉå) 4,41,133 21,430 28,84,961
4.2 =tÉàÉÉå BÉEÉÒ ºÉÆJªÉÉ iÉlÉÉ =xÉBÉEÉÒ ÉʴɶÉä−ÉiÉÉAÆ & +ÉlÉÇBªÉ´ÉºlÉÉ BÉEä ÉÊ´ÉBÉEÉºÉ iÉlÉÉ +ÉÉÉÌlÉBÉE =tÉàɶÉÉÒãÉiÉÉ BÉEä àÉÉxÉ BÉEÉÒ BªÉÉJªÉÉ cäiÉÖ =tÉàÉÉå BÉEÉÒ ºÉÆJªÉÉ ABÉE àÉÖJªÉ ÉʴɶÉä−ÉiÉÉ cè * VÉèºÉÉ ÉÊ´É´É®hÉÉÒ 2 àÉå n¶ÉÉǪÉÉ MɪÉÉ cè, 2006-07 BÉEä nÉè®ÉxÉ BªÉÉ{ÉÉ® BÉEÉä UÉä½BÉE® ãÉMÉ£ÉMÉ 16.5 ÉÊàÉÉÊãɪÉxÉ =tÉàÉ ºÉä´ÉÉ FÉäjÉ MÉÉÊiÉÉÊ´ÉÉÊvɪÉÉå àÉå ãÉMÉä cé * vªÉÉxÉ näxÉä ªÉÉäMªÉ cè ÉÊBÉE 60 |ÉÉÊiɶÉiÉ ºÉä´ÉÉ FÉäjÉ =tÉàÉ OÉÉàÉÉÒhÉ £ÉÉ®iÉ àÉå cé VɤÉÉÊBÉE 40 |ÉÉÊiɶÉiÉ ¶Éc®ÉÒ FÉäjÉ àÉå cé * +ÉÉäA<Ç ºÉ£ÉÉÒ =tÉàÉÉå BÉEÉ 85 |ÉÉÊiɶÉiÉ cè *
ÉÊ´É´É®hÉÉÒ 2 & £ÉÉ®iÉ àÉå =tÉàÉ BÉEä |ÉBÉEÉ® iÉlÉÉ FÉäjÉ BÉEä +ÉxÉÖºÉÉ® =tÉàÉÉå BÉEÉÒ +ÉxÉÖàÉÉÉÊxÉiÉ ºÉÆJªÉÉ, 2006-07
=tÉàÉÉå BÉEÉÒ ºÉÆJªÉÉ ('000 àÉå) FÉäjÉ +ÉÉäA<Ç |ÉÉÊiÉ−~ÉxÉ ºÉ£ÉÉÒ
OÉÉàÉÉÒhÉ 9,004 896 9,900¶Éc®ÉÒ 5,088 1,524 6,612 ºÉàɺiÉ 14,092 2,420 16,512
4.3 ÉÊ´É´É®hÉÉÒ 3 ºÉä´ÉÉ FÉäjÉ =tÉàÉÉå BÉEÉÒ BÉÖEU àÉci´É{ÉÚhÉÇ ÉʴɶÉä−ÉiÉÉAÆ ¤ÉiÉÉiÉÉÒ cè * º´ÉÉÉÊàÉi´É ´ÉÉãÉä =tÉàÉ (+ÉlÉÉÇiÉ ABÉEãÉ {ÉÉÊ®´ÉÉ® BÉEä º´ÉÉÉÊàÉi´É ´ÉÉãÉä =tÉàÉ) nä¶É àÉå =tÉàÉÉå BÉEÉÒ BÉÖEãÉ ºÉÆJªÉÉ àÉå ºÉ´ÉÉÇÉÊvÉBÉE ÉÊcººÉÉ (90±) ®JÉiÉä cé * +ÉÉÉÌlÉBÉE VÉMÉiÉ àÉå ºÉä´ÉÉ FÉäjÉ =tÉàɶÉÉÒãÉiÉÉ BÉEÉÒ +ÉxÉÉè{ÉSÉÉÉÊ®BÉEiÉÉ BÉEÉÒ |ÉvÉÉxÉiÉÉ <ºÉ iÉlªÉ ºÉä |ÉnÉ̶ÉiÉ cÖ<Ç ÉÊBÉE BÉÖEãÉ =tÉàÉÉå BÉEÉ ãÉMÉ£ÉMÉ 59 |ÉÉÊiÉÉʶÉiÉ ÉÊcººÉÉ ÉÊBÉEºÉÉÒ +ÉÉÊvÉÉÊxɪÉàÉ +ÉlÉ´ÉÉ ÉÊBÉEºÉÉÒ {ÉÆVÉÉÒBÉE®hÉ |ÉÉÉÊvÉBÉE®hÉ BÉEä iÉciÉ {ÉÆVÉÉÒBÉßEiÉ xÉcÉÓ {ÉɪÉÉ MɪÉÉ cè +ÉÉè® ªÉc +ÉxÉÖ{ÉÉiÉ |ÉÉÊiÉ−~ÉxÉÉå (34±) BÉEÉÒ iÉÖãÉxÉÉ àÉå +ÉÉäA<Ç (63±) BÉEä àÉÉàÉãÉä àÉå +ÉÉÊvÉBÉE cè * ãÉMÉ£ÉMÉ 26 |ÉÉÊiɶÉiÉ =tÉàÉ ÉÊBÉEºÉÉÒ ÉÊxɪÉiÉ +É´ÉÉκlÉÉÊiÉ BÉEä ÉʤÉxÉÉ +É{ÉxÉÉ ®ÉäVÉMÉÉ® SÉãÉÉiÉä cé * ºÉàÉxÉÖ°ô{É |ÉÉÊiɶÉiÉiÉÉ +ÉÉäA<Ç (29±) BÉEÉÒ iÉÖãÉxÉÉ àÉå |ÉÉÊiÉ−~ÉxÉÉå (10±) BÉEä àÉÉàÉãÉä àÉå BÉEàÉ cè * ºÉ£ÉÉÒ =tÉàÉÉå àÉå +ÉÉÊvÉBÉEÉƶÉiÉ& (99±) ¤ÉÉ®càÉɺÉÉÒ cé +ÉlÉÉÇiÉ {ÉÚ®ä ´É−ÉÇ BÉEàÉÉä¤Éä¶É BÉEɪÉÇ BÉE®iÉä ®ciÉä cé * 91 |ÉÉÊiɶÉiÉ =tÉàÉÉå xÉä ÉÊ{ÉUãÉä 365 ÉÊnxÉÉå BÉEä nÉè®ÉxÉ 9 àÉÉc +ÉlÉ´ÉÉ +ÉÉÊvÉBÉE BÉEɪÉÇ ÉÊBÉEªÉÉ cè *

ºÉ´ÉæFÉhÉ ÉÊc.5
ÉÊ´É´É®hÉÉÒ 3 & £ÉÉ®iÉ àÉå =tÉàÉ BÉEä |ÉBÉEÉ® BÉEä +ÉxÉÖºÉÉ® =tÉàÉÉå BÉEÉÒ BÉÖEU ÉʴɶÉä−ÉiÉÉAÆ, 2006-07
ÉʴɶÉä−ÉiÉÉAÆ BÉÖEãÉ +ÉÉäA<Ç |ÉÉÊiÉ−~ÉxÉ º´ÉÉÉÊàÉi´É ´ÉÉãÉä =tÉàÉÉå BÉEÉÒ |ÉÉÊiɶÉiÉiÉÉ 90.2 91.0 86.0 ÉÊBÉEºÉÉÒ AVÉåºÉÉÒ ºÉä {ÉÆVÉÉÒBÉßEiÉ xÉ cÖA =tÉàÉÉå BÉEÉÒ |ÉÉÊiɶÉiÉiÉÉ 59.1 63.4 34.5 ÉʤÉxÉÉ ÉÊxɪÉiÉ {ÉÉÊ®ºÉ®Éå ´ÉÉãÉä =tÉàÉÉå BÉEÉÒ |ÉÉÊiɶÉiÉÉ 26.4 29.1 9.9 ¤ÉÉ®càÉÉºÉ SÉãÉxÉä ´ÉÉãÉä =tÉàÉÉå BÉEÉÒ |ÉÉÊiɶÉiÉiÉÉ 98.6 98.6 98.3 9 àÉcÉÒxÉä +ÉlÉ´ÉÉ +ÉÉÊvÉBÉE àÉcÉÒxÉä SÉãÉxÉä ´ÉÉãÉä =tÉàÉÉå BÉEÉÒ |ÉÉÊiɶÉiÉÉ 90.9 90.9 90.5 ~äBÉEä {É® BÉEɪÉÇ ´ÉÉãÉä =tÉàÉÉå BÉEÉÒ |ÉÉÊiɶÉiÉÉ 2.5 2.3 3.8
4.4 =tÉàÉÉå BÉEä {ÉÉÊ®SÉÉãÉxÉ BÉEÉÒ ºÉàɺªÉÉAÆ iÉlÉÉ ºÉcɪÉiÉÉ |ÉÉ{iÉ BÉE®xÉä BÉEÉÒ ÉκlÉÉÊiÉ & ÉÊ´É´É®hÉÉÒ 4 ºÉä º{É−] cè ÉÊBÉE ãÉMÉ£ÉMÉ 22± =tÉàÉ {ÉÚÆVÉÉÒ BÉEÉÒ BÉEàÉÉÒ BÉEÉ ºÉÉàÉxÉÉ BÉE®iÉä ¤ÉiÉÉA MÉA cé * ªÉc |ÉÉÊiɶÉiÉiÉÉ ¶Éc®ÉÒ £ÉÉ®iÉ (20±) BÉEÉÒ iÉÖãÉxÉÉ àÉå OÉÉàÉÉÒhÉ £ÉÉ®iÉ (23±) BÉEä àÉÉàÉãÉä àÉå lÉÉä½ÉÒ +ÉÉÊvÉBÉE cè *
ÉÊ´É´É®hÉÉÒ 4 & {ÉÚÆVÉÉÒ BÉEÉÒ BÉEàÉÉÒ ¤ÉiÉÉxÉä ´ÉÉãÉä =tÉàÉÉå BÉEÉÒ |ÉÉÊiɶÉiÉiÉÉ
{ÉÚÆVÉÉÒ BÉEÉÒ BÉEàÉÉÒ ¤ÉiÉÉxÉä ´ÉÉãÉä =tÉàÉÉå BÉEÉÒ |ÉÉÊiɶÉiÉiÉÉ OÉÉàÉÉÒhÉ ¶Éc®ÉÒ ºÉàɺiÉ
+ÉÉäA<Ç |ÉÉÊiÉ−~ÉxÉ ºÉàɺiÉ +ÉÉäA<Ç |ÉÉÊiÉ−~ÉxÉ ºÉàɺiÉ +ÉÉäA<Ç |ÉÉÊiÉ−~ÉxÉ ºÉàɺiÉ
22.7 23.4 22.8 20.9 16.3 19.9 22.1 18.9 21.6 4.5 +ÉÉÊvÉBÉEÉÆ¶É =tÉàÉÉå uÉ®É ºÉÚÉÊSÉiÉ ÉÊBÉEªÉÉ MɪÉÉ ÉÊBÉE =xÉBÉEÉä BÉEÉä<Ç ºÉ®BÉEÉ®ÉÒ ºÉcɪÉiÉÉ xÉcÉÓ ÉÊàÉãÉÉÒ * VÉèºÉÉ ÉÊ´É´É®hÉÉÒ 5 àÉå näJÉÉ MɪÉÉ cè, ãÉMÉ£ÉMÉ 86± =tÉàÉ ºÉ®BÉEÉ® ºÉä jÉ@hÉ +ÉlÉ´ÉÉ +ÉÉÉÌlÉBÉE ºÉcɪÉiÉÉ +ÉlÉ´ÉÉ |ÉÉʶÉFÉhÉ +ÉÉÉÊn BÉEä °ô{É àÉå BÉEÉä<Ç ºÉcɪÉiÉÉ |ÉÉ{iÉ xÉcÉÓ BÉE®iÉä cé * vªÉÉxÉ näxÉä ªÉÉäMªÉ cè ÉÊBÉE ÉÊBÉEºÉÉÒ ºÉcɪÉiÉÉ BÉEä |ÉÉ{iÉ xÉ cÉäxÉä BÉEÉÒ PÉ]xÉÉAÆ ¶Éc®ÉÒ =tÉàÉÉå uÉ®É BÉÖEU +ÉÉÊvÉBÉE ºÉÚÉÊSÉiÉ BÉEÉÒ MÉ<Ç cé * ãÉMÉ£ÉMÉ 12± <ºÉä jÉ@hÉÉå BÉEä °ô{É àÉå cÉÒ |ÉÉ{iÉ BÉE®iÉä cé * ÉÊBÉEºÉÉÒ °ô{É àÉå ºÉcɪÉiÉÉ |ÉÉ{iÉ BÉE®xÉä BÉEÉÒ PÉ]xÉÉAÆ +ÉÉäA<Ç (13±) BÉEÉÒ iÉÖãÉxÉÉ àÉå |ÉÉÊiÉ−~ÉxÉÉå (22±) BÉEä ÉÊãÉA +ÉÉÊvÉBÉE cé * ÉÊ´É´É®hÉÉÒ 5 & =tÉàÉ BÉEä |ÉBÉEÉ® iÉlÉÉ FÉäjÉ BÉEä +ÉxÉÖºÉÉ® gÉähÉÉÒBÉE®hÉ ÉÊBÉEA MÉA ºÉcɪÉiÉÉ |ÉÉ{iÉ BÉE® ®cä =tÉàÉ iÉlÉÉ BÉEÉä<Ç ºÉcɪÉiÉÉ |ÉÉ{iÉ xÉ BÉE® ®cä =tÉàÉÉå BÉEÉÒ |ÉÉÊiɶÉiÉiÉÉ
OÉÉàÉÉÒhÉ ¶Éc®ÉÒ ºÉàɺiÉ
+ÉÉäA<Ç |ÉÉÊiÉ−~ÉxÉ ºÉàɺiÉ +ÉÉäA<Ç |ÉÉÊiÉ−~ÉxÉ ºÉàɺiÉ +ÉÉäA<Ç |ÉÉÊiÉ−~ÉxÉ ºÉàɺiÉ
jÉ@hÉ BÉEä °ô{É àÉå ºÉcɪÉiÉÉ |ÉÉ{iÉ BÉE® ®cä 13.5 23.6 14.4 7.6 15.4 9.4 11.4 18.5 12.4
+ÉxªÉ ºÉcɪÉiÉÉ |ÉÉ{iÉ BÉE® ®cä 1.8 5.4 2.1 1.4 2.9 1.7 1.6 3.8 1.9
BÉEÉä<Ç ºÉcɪÉiÉÉ |ÉÉ{iÉ xÉcÉÓ BÉE® ®cä 84.7 71.0 83.5 91.0 81.7 88.9 87.0 77.7 85.7
4.6 ºÉä´ÉÉ FÉäjÉ àÉå ®ÉäVÉMÉÉ® & £ÉÉ®iÉ àÉå, ºÉä´ÉÉ FÉäjÉ BÉEÉÒ ®ÉäVÉMÉÉ® ºÉßVÉxÉ àÉå àÉci´É{ÉÚhÉÇ £ÉÚÉÊàÉBÉEÉ cè * ´É−ÉÇ 2006-07 BÉEä nÉè®ÉxÉ ºÉä´ÉÉ FÉäjÉ àÉå BÉEÉàÉMÉÉ®Éå BÉEÉÒ ºÉÆJªÉÉ ãÉMÉ£ÉMÉ 3.35 BÉE®Éä½ cÉäxÉä BÉEÉ +ÉxÉÖàÉÉxÉ ãÉMÉɪÉÉ MɪÉÉ lÉÉ, ÉÊVɺÉàÉå OÉÉàÉÉÒhÉ iÉlÉÉ ¶Éc®ÉÒ ÉÊcººÉÉ μÉEàɶÉ& 54± iÉlÉÉ 46± lÉÉ *
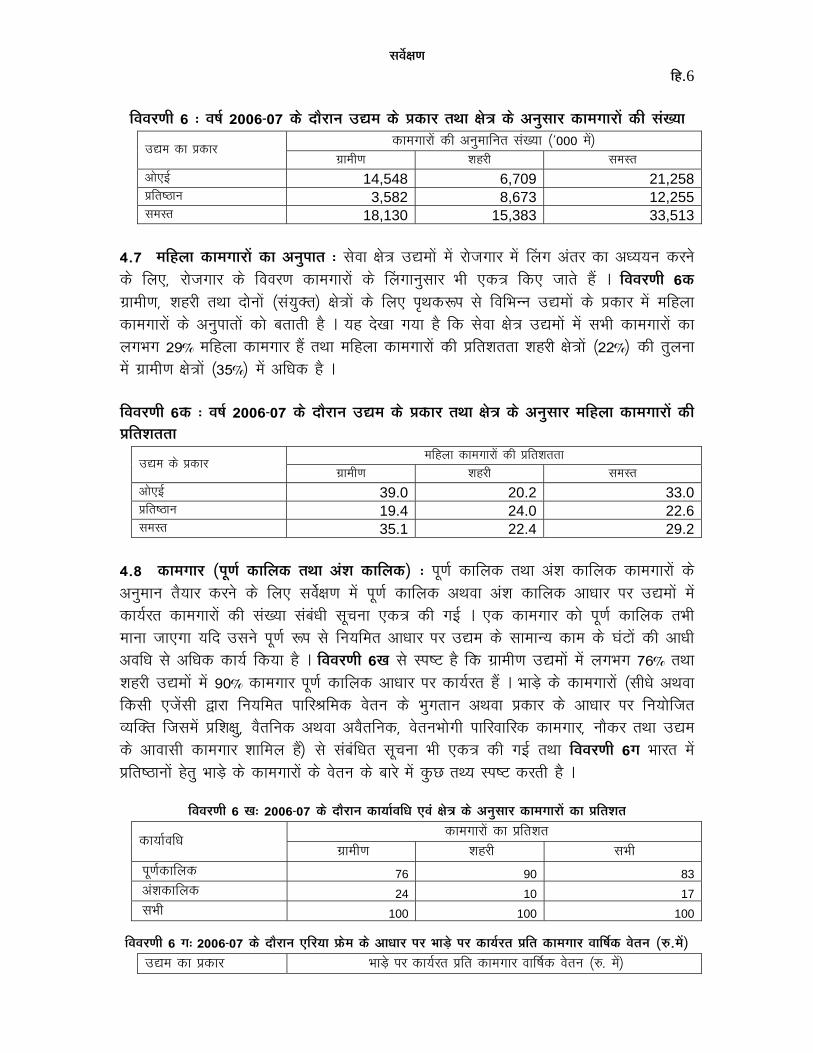
ºÉ´ÉæFÉhÉ ÉÊc.6
ÉÊ´É´É®hÉÉÒ 6 & ´É−ÉÇ 2006-07 BÉEä nÉè®ÉxÉ =tÉàÉ BÉEä |ÉBÉEÉ® iÉlÉÉ FÉäjÉ BÉEä +ÉxÉÖºÉÉ® BÉEÉàÉMÉÉ®Éå BÉEÉÒ ºÉÆJªÉÉ
BÉEÉàÉMÉÉ®Éå BÉEÉÒ +ÉxÉÖàÉÉÉÊxÉiÉ ºÉÆJªÉÉ ('000 àÉå) =tÉàÉ BÉEÉ |ÉBÉEÉ®
OÉÉàÉÉÒhÉ ¶Éc®ÉÒ ºÉàɺiÉ +ÉÉäA<Ç 14,548 6,709 21,258|ÉÉÊiÉ−~ÉxÉ 3,582 8,673 12,255ºÉàɺiÉ 18,130 15,383 33,513
4.7 àÉÉÊcãÉÉ BÉEÉàÉMÉÉ®Éå BÉEÉ +ÉxÉÖ{ÉÉiÉ & ºÉä´ÉÉ FÉäjÉ =tÉàÉÉå àÉå ®ÉäVÉMÉÉ® àÉå ÉËãÉMÉ +ÉÆiÉ® BÉEÉ +ÉvªÉªÉxÉ BÉE®xÉä BÉEä ÉÊãÉA, ®ÉäVÉMÉÉ® BÉEä ÉÊ´É´É®hÉ BÉEÉàÉMÉÉ®Éå BÉEä ÉËãÉMÉÉxÉÖºÉÉ® £ÉÉÒ ABÉEjÉ ÉÊBÉEA VÉÉiÉä cé * ÉÊ´É´É®hÉÉÒ 6BÉE OÉÉàÉÉÒhÉ, ¶Éc®ÉÒ iÉlÉÉ nÉäxÉÉå (ºÉƪÉÖBÉDiÉ) FÉäjÉÉå BÉEä ÉÊãÉA {ÉßlÉBÉE°ô{É ºÉä ÉÊ´ÉÉÊ£ÉxxÉ =tÉàÉÉå BÉEä |ÉBÉEÉ® àÉå àÉÉÊcãÉÉ BÉEÉàÉMÉÉ®Éå BÉEä +ÉxÉÖ{ÉÉiÉÉå BÉEÉä ¤ÉiÉÉiÉÉÒ cè * ªÉc näJÉÉ MɪÉÉ cè ÉÊBÉE ºÉä´ÉÉ FÉäjÉ =tÉàÉÉå àÉå ºÉ£ÉÉÒ BÉEÉàÉMÉÉ®Éå BÉEÉ ãÉMÉ£ÉMÉ 29± àÉÉÊcãÉÉ BÉEÉàÉMÉÉ® cé iÉlÉÉ àÉÉÊcãÉÉ BÉEÉàÉMÉÉ®Éå BÉEÉÒ |ÉÉÊiɶÉiÉiÉÉ ¶Éc®ÉÒ FÉäjÉÉå (22±) BÉEÉÒ iÉÖãÉxÉÉ àÉå OÉÉàÉÉÒhÉ FÉäjÉÉå (35±) àÉå +ÉÉÊvÉBÉE cè * ÉÊ´É´É®hÉÉÒ 6BÉE & ´É−ÉÇ 2006-07 BÉEä nÉè®ÉxÉ =tÉàÉ BÉEä |ÉBÉEÉ® iÉlÉÉ FÉäjÉ BÉEä +ÉxÉÖºÉÉ® àÉÉÊcãÉÉ BÉEÉàÉMÉÉ®Éå BÉEÉÒ |ÉÉÊiɶÉiÉiÉÉ
àÉÉÊcãÉÉ BÉEÉàÉMÉÉ®Éå BÉEÉÒ |ÉÉÊiɶÉiÉiÉÉ =tÉàÉ BÉEä |ÉBÉEÉ®
OÉÉàÉÉÒhÉ ¶Éc®ÉÒ ºÉàɺiÉ +ÉÉäA<Ç 39.0 20.2 33.0|ÉÉÊiÉ−~ÉxÉ 19.4 24.0 22.6ºÉàɺiÉ 35.1 22.4 29.2
4.8 BÉEÉàÉMÉÉ® ({ÉÚhÉÇ BÉEÉÉÊãÉBÉE iÉlÉÉ +ÉÆ¶É BÉEÉÉÊãÉBÉE) & {ÉÚhÉÇ BÉEÉÉÊãÉBÉE iÉlÉÉ +ÉÆ¶É BÉEÉÉÊãÉBÉE BÉEÉàÉMÉÉ®Éå BÉEä +ÉxÉÖàÉÉxÉ iÉèªÉÉ® BÉE®xÉä BÉEä ÉÊãÉA ºÉ´ÉæFÉhÉ àÉå {ÉÚhÉÇ BÉEÉÉÊãÉBÉE +ÉlÉ´ÉÉ +ÉÆ¶É BÉEÉÉÊãÉBÉE +ÉÉvÉÉ® {É® =tÉàÉÉå àÉå BÉEɪÉÇ®iÉ BÉEÉàÉMÉÉ®Éå BÉEÉÒ ºÉÆJªÉÉ ºÉƤÉÆvÉÉÒ ºÉÚSÉxÉÉ ABÉEjÉ BÉEÉÒ MÉ<Ç * ABÉE BÉEÉàÉMÉÉ® BÉEÉä {ÉÚhÉÇ BÉEÉÉÊãÉBÉE iÉ£ÉÉÒ àÉÉxÉÉ VÉÉAMÉÉ ªÉÉÊn =ºÉxÉä {ÉÚhÉÇ °ô{É ºÉä ÉÊxɪÉÉÊàÉiÉ +ÉÉvÉÉ® {É® =tÉàÉ BÉEä ºÉÉàÉÉxªÉ BÉEÉàÉ BÉEä PÉÆ]Éå BÉEÉÒ +ÉÉvÉÉÒ +É´ÉÉÊvÉ ºÉä +ÉÉÊvÉBÉE BÉEɪÉÇ ÉÊBÉEªÉÉ cè * ÉÊ´É´É®hÉÉÒ 6JÉ ºÉä º{É−] cè ÉÊBÉE OÉÉàÉÉÒhÉ =tÉàÉÉå àÉå ãÉMÉ£ÉMÉ 76± iÉlÉÉ ¶Éc®ÉÒ =tÉàÉÉå àÉå 90± BÉEÉàÉMÉÉ® {ÉÚhÉÇ BÉEÉÉÊãÉBÉE +ÉÉvÉÉ® {É® BÉEɪÉÇ®iÉ cé * £Éɽä BÉEä BÉEÉàÉMÉÉ®Éå (ºÉÉÒvÉä +ÉlÉ´ÉÉ ÉÊBÉEºÉÉÒ AVÉåºÉÉÒ uÉ®É ÉÊxɪÉÉÊàÉiÉ {ÉÉÉÊ®gÉÉÊàÉBÉE ´ÉäiÉxÉ BÉEä £ÉÖMÉiÉÉxÉ +ÉlÉ´ÉÉ |ÉBÉEÉ® BÉEä +ÉÉvÉÉ® {É® ÉÊxɪÉÉäÉÊVÉiÉ BªÉÉÎBÉDiÉ ÉÊVɺÉàÉå |ÉÉʶÉFÉÖ, ´ÉèiÉÉÊxÉBÉE +ÉlÉ´ÉÉ +É´ÉèiÉÉÊxÉBÉE, ´ÉäiÉxÉ£ÉÉäMÉÉÒ {ÉÉÉÊ®´ÉÉÉÊ®BÉE BÉEÉàÉMÉÉ®, xÉÉèBÉE® iÉlÉÉ =tÉàÉ BÉEä +ÉÉ´ÉɺÉÉÒ BÉEÉàÉMÉÉ® ¶ÉÉÉÊàÉãÉ cé) ºÉä ºÉƤÉÆÉÊvÉiÉ ºÉÚSÉxÉÉ £ÉÉÒ ABÉEjÉ BÉEÉÒ MÉ<Ç iÉlÉÉ ÉÊ´É´É®hÉÉÒ 6MÉ £ÉÉ®iÉ àÉå |ÉÉÊiÉ−~ÉxÉÉå cäiÉÖ £Éɽä BÉEä BÉEÉàÉMÉÉ®Éå BÉEä ´ÉäiÉxÉ BÉEä ¤ÉÉ®ä àÉå BÉÖEU iÉlªÉ º{É−] BÉE®iÉÉÒ cè *
ÉÊ´É´É®hÉÉÒ 6 JÉ& 2006-07 BÉEä nÉè®ÉxÉ BÉEɪÉÉÇ´ÉÉÊvÉ A´ÉÆ FÉäjÉ BÉEä +ÉxÉÖºÉÉ® BÉEÉàÉMÉÉ®Éå BÉEÉ |ÉÉÊiɶÉiÉ
BÉEÉàÉMÉÉ®Éå BÉEÉ |ÉÉÊiɶÉiÉ BÉEɪÉÉÇ´ÉÉÊvÉ
OÉÉàÉÉÒhÉ ¶Éc®ÉÒ ºÉ£ÉÉÒ {ÉÚhÉÇBÉEÉÉÊãÉBÉE 76 90 83 +ÉƶÉBÉEÉÉÊãÉBÉE 24 10 17 ºÉ£ÉÉÒ 100 100 100
ÉÊ´É´É®hÉÉÒ 6 MÉ& 2006-07 BÉEä nÉè®ÉxÉ AÉÊ®ªÉÉ |ÉEäàÉ BÉEä +ÉÉvÉÉ® {É® £Éɽä {É® BÉEɪÉÇ®iÉ |ÉÉÊiÉ BÉEÉàÉMÉÉ® ´ÉÉÉÌ−ÉBÉE ´ÉäiÉxÉ (âó.àÉå)
=tÉàÉ BÉEÉ |ÉBÉEÉ® £Éɽä {É® BÉEɪÉÇ®iÉ |ÉÉÊiÉ BÉEÉàÉMÉÉ® ´ÉÉÉÌ−ÉBÉE ´ÉäiÉxÉ (âó. àÉå)

ºÉ´ÉæFÉhÉ ÉÊc.7
OÉÉàÉÉÒhÉ ¶Éc®ÉÒ ºÉ£ÉÉÒ |ÉÉÊiÉ−~ÉxÉ 24,816 57,977 48,482
ÉÊ´É´É®hÉÉÒ 6MÉ ºÉä |ÉBÉE] cÉäiÉÉ cè ÉÊBÉE ¶Éc®ÉÒ FÉäjÉÉå àÉå £Éɽä {É® BÉEɪÉÇ®iÉ BÉEÉàÉMÉÉ®Éå BÉEÉ ´ÉÉÉÌ−ÉBÉE ´ÉäiÉxÉ (57,977 âó.) OÉÉàÉÉÒhÉ £ÉÉ®iÉ (24,816 âó.) BÉEÉÒ iÉÖãÉxÉÉ àÉå nÖMÉÖxÉä ºÉä +ÉÉÊvÉBÉE cè * 4.9 º´ÉÉÉÊàÉi´É ´ÉÉãÉÉÒ ºlÉɪÉÉÒ {ÉÉÊ®ºÉà{ÉÉÊkɪÉÉÄ- ÉÊ´É´É®hÉÉÒ 7 ÉÊ´ÉÉÊ£ÉxxÉ |ÉBÉEÉ® BÉEä =tÉàÉÉå BÉEä ÉÊãÉA |ÉÉÊiÉ =tÉàÉ º´ÉÉÉÊàÉi´É ´ÉÉãÉÉÒ BÉÖEãÉ ºlÉɪÉÉÒ {ÉÉÊ®ºÉà{ÉÉÊkɪÉÉå BÉEÉ +ÉxÉÖàÉÉÉÊxÉiÉ àÉÚãªÉ |ɺiÉÖiÉ BÉE®iÉÉÒ cè * +ÉÉÊJÉãÉ £ÉÉ®iÉÉÒªÉ ºiÉ® {É®, |ÉÉÊiÉ =tÉàÉ º´ÉÉÉÊàÉi´É ´ÉÉãÉÉÒ ºlÉɪÉÉÒ {ÉÉÊ®ºÉà{ÉÉÊkɪÉÉå BÉEÉ +ÉxÉÖàÉÉÉÊxÉiÉ ¤ÉÉWÉÉ® àÉÚãªÉ 1,78,102 âó. cè * ¶Éc®ÉÒ FÉäjÉÉå àÉå |ÉÉÊiÉ =tÉàÉ º´ÉÉÉÊàÉi´É ´ÉÉãÉÉÒ ºlÉɪÉÉÒ {ÉÉÊ®ºÉà{ÉÉÊkɪÉÉå BÉEÉ ¤ÉÉWÉÉ® àÉÚãªÉ OÉÉàÉÉÒhÉ FÉäjÉÉå àÉå <ºÉÉÒ |ÉBÉEÉ® BÉEä àÉÚãªÉ BÉEÉ ãÉMÉ£ÉMÉ 5.5 MÉÖhÉÉ cè * |ÉÉÊiÉ−~ÉxÉÉå BÉEä ÉÊãÉA º´ÉÉÉÊàÉi´É ´ÉÉãÉÉÒ ºlÉɪÉÉÒ {ÉÉÊ®ºÉà{ÉÉÊkɪÉÉå BÉEÉ |ÉÉÊiÉ =tÉàÉ àÉÚãªÉ º´ÉãÉäJÉÉ =tÉàÉÉå (+ÉÉäA<Ç) BÉEä =ºÉÉÒ |ÉBÉEÉ® BÉEä àÉÚãªÉ BÉEÉ ãÉMÉ£ÉMÉ 22 MÉÖhÉÉ cè *
ÉÊ´É´É®hÉÉÒ 7: ÉÊ£ÉxxÉ |ÉBÉEÉ® BÉEä =tÉàÉÉå BÉEä +ÉxÉÖºÉÉ® º´ÉÉÉÊàÉi´É ´ÉÉãÉÉÒ ºlÉɪÉÉÒ {ÉÉÊ®ºÉà{ÉÉÊkɪÉÉå BÉEÉ +ÉxÉÖàÉÉÉÊxÉiÉ àÉÚãªÉ (âó.) |ÉÉÊiÉ =tÉàÉ º´ÉÉÉÊàÉi´É ´ÉÉãÉÉÒ ºlÉɪÉÉÒ {ÉÉÊ®ºÉà{ÉÉÊkɪÉÉå BÉEÉ +ÉxÉÖàÉÉÉÊxÉiÉ àÉÚãªÉ (âó.àÉå)
=tÉàÉ BÉEÉ |ÉBÉEÉ® OÉÉàÉÉÒhÉ ¶Éc®ÉÒ ºÉ£ÉÉÒ
+ÉÉäA<Ç 32,801 63,194 43,774 |ÉÉÊiÉ−~ÉxÉ 3,67,366 13,09,118 9,60,260 ºÉ£ÉÉÒ 63,096 3,50,325 1,78,102
4.10 ÉÊ´ÉkÉÉÒªÉ nÉÉʪÉi´É& ÉÊ´ÉkÉÉÒªÉ nÉÉʪÉi´ÉÉå àÉå ÉÊBÉEºÉÉÒ =tÉàÉ BÉEä £ÉÉMÉÉÒnÉ®Éå uÉ®É ãÉMÉÉ<Ç MÉ<Ç {ÉÚÆVÉÉÒ, ¶ÉäªÉ® {ÉÚÆVÉÉÒ, ¤ÉäãÉåºÉ ¶ÉÉÒ] àÉå xÉÉä] BÉEÉÒ MÉ<Ç ÉÊ®WÉ´ÉÇ +ÉÉè® +ÉÉÊvɶÉä−É ®ÉÉʶÉ, nÉÒPÉÉÇ´ÉÉÊvÉ jÉ@hÉ iÉlÉÉ +É|ÉnkÉ àÉWÉnÚ®ÉÒ +ÉÉÉÊn £ÉÖMÉiÉÉxÉÉå BÉEä ÉÊãÉA ºÉ£ÉÉÒ ãÉPÉÖ +É´ÉÉÊvÉ BÉEÉÒ |ÉÉÊiɤÉriÉÉAÆ £ÉÉÒ ¶ÉÉÉÊàÉãÉ lÉÉÒ * |ÉÉÊiÉ =tÉàÉ ÉÊ´ÉkÉÉÒªÉ nÉÉʪÉi´É BÉEÉÒ +ÉÉèºÉiÉ ®ÉÉ榃 ÉÊ´É´É®hÉÉÒ-8 àÉå nÉÒ MÉ<Ç cè * ªÉc näJÉÉ MɪÉÉ ÉÊBÉE +ÉÉÊJÉãÉ £ÉÉ®iÉÉÒªÉ ºiÉ® {É®, ÉÊBÉEºÉÉÒ =tÉàÉ BÉEÉ ÉÊ´ÉkÉÉÒªÉ nÉÉʪÉi´É ºÉÆn£ÉÇ ´É−ÉÇ BÉEÉÒ +ÉÆÉÊiÉàÉ ÉÊiÉÉÊlÉ BÉEä +ÉxÉÖºÉÉ® 4,41,133 °ô{ÉA lÉÉ * |ÉÉÊiÉ−~ÉxÉÉå BÉEä ÉÊãÉA 28,84,961 âó. BÉEÉÒ iÉÖãÉxÉÉ àÉå º´ÉãÉäJÉÉ =tÉàÉÉå (+ÉÉäA<Ç) BÉEÉ |ÉÉÊiÉ =tÉàÉ ÉÊ´ÉkÉÉÒªÉ nÉÉʪÉi´É 21,430 âó. cè * +ÉiÉ& |ÉÉÊiÉ |ÉÉÊiÉ−~ÉxÉ ÉÊ´ÉkÉÉÒªÉ nÉÉʪÉi´É +ÉÉäA<Ç BÉEä ÉÊ´ÉkÉÉÒªÉ nÉÉʪÉi´É ºÉä BÉEÉ{ÉEÉÒ +ÉÉÊvÉBÉE cè *
ÉÊ´É´É®hÉÉÒ 8: ÉÊ£ÉxxÉ |ÉBÉEÉ® BÉEä =tÉàÉÉå BÉEä +ÉxÉÖºÉÉ® ÉÊ´ÉkÉÉÒªÉ nÉÉʪÉi´É BÉEÉ +ÉxÉÖàÉÉÉÊxÉiÉ àÉÚãªÉ (âó.) |ÉÉÊiÉ =tÉàÉ ÉÊ´ÉkÉÉÒªÉ nÉÉʪÉi´É (âó.àÉå)
=tÉàÉ BÉEÉ |ÉBÉEÉ® OÉÉàÉÉÒhÉ ¶Éc®ÉÒ ºÉ£ÉÉÒ
+ÉÉäA<Ç 8,210 44,827 21,430 |ÉÉÊiÉ−~ÉxÉ 3,84,220 43,56,395 28,84,961 ºÉ£ÉÉÒ 42,258 10,38,455 4,41,133
4.11 ºÉBÉEãÉ àÉÚãªÉ ºÉÆ´ÉrÇxÉ& ºÉBÉEãÉ àÉÚãªÉ ºÉÆ´ÉrÇxÉ (VÉÉÒ´ÉÉÒA) ´Éc àÉÚãªÉ cè VÉÉä ÉÊBÉEºÉÉÒ =tÉàÉ BÉEä =i{ÉÉnxÉ BÉEÉÒ |ÉÉÊμÉEªÉÉ uÉ®É +ÉlÉÇBªÉ´ÉºlÉÉ àÉå VÉÉä½É VÉÉiÉÉ cè * ÉÊ´É´É®hÉÉÒ 9 £ÉÉ®iÉÉÒªÉ +ÉlÉÇBªÉ´ÉºlÉÉ àÉå VÉÉÒ´ÉÉÒA BÉEÉÒ ABÉE ZÉãÉBÉE |ɺiÉÖiÉ BÉE®iÉÉÒ cè * ºÉä´ÉÉ FÉäjÉ àÉå =tÉàÉÉå uÉ®É VÉÉä½É MɪÉÉ BÉÖEãÉ ´ÉÉÉÌ−ÉBÉE ºÉBÉEãÉ àÉÚãªÉ ºÉÆ´ÉrÇxÉ 2,44,792 BÉE®Éä½ âó. +ÉxÉÖàÉÉÉÊxÉiÉ cè ÉÊVɺÉàÉå OÉÉàÉÉÒhÉ £ÉÉ®iÉ +ÉÉè® ¶Éc®ÉÒ £ÉÉ®iÉ BÉEÉ ÉÊcººÉÉ μÉEàɶÉ& 15± +ÉÉè® 85± lÉÉ * VÉÉÒ´ÉÉÒA àÉå |ÉàÉÖJÉ +ÉƶÉnÉxÉ OÉÉàÉÉÒhÉ FÉäjÉÉå àÉå +ÉÉäA<Ç ºÉä (61±) iÉlÉÉ ¶Éc®ÉÒ FÉäjÉÉå àÉå

ºÉ´ÉæFÉhÉ ÉÊc.8
|ÉÉÊiÉ−~ÉxÉÉå ºÉä (89±) |ÉÉ{iÉ cÖ+ÉÉ cè * OÉÉàÉÉÒhÉ +ÉÉè® ¶Éc®ÉÒ FÉäjÉ nÉäxÉÉå àÉå cÉÒ (ºÉƪÉÖBÉDiÉ °ô{É ºÉä) ºÉä´ÉÉ FÉäjÉ àÉå BÉÖEãÉ VÉÉÒ´ÉÉÒA àÉå |ÉÉÊiÉ−~ÉxÉÉå uÉ®É àÉÖJªÉ +ÉƶÉnÉxÉ (81±) ÉÊBÉEªÉÉ MɪÉÉ *
ÉÊ´É´É®hÉÉÒ 9& 2006-07 BÉEä nÉè®ÉxÉ =tÉàÉ BÉEä |ÉBÉEÉ® +ÉÉè® FÉäjÉ BÉEä +ÉxÉÖºÉÉ® BÉÖEãÉ ºÉBÉEãÉ àÉÚãªÉ ºÉÆ´ÉrÇxÉ (BÉE®Éä½ âó.àÉå)
BÉÖEãÉ ºÉBÉEãÉ àÉÚãªÉ ºÉÆ´ÉrÇxÉ (BÉE®Éä½ âó.àÉå) =tÉàÉ BÉEÉ |ÉBÉEÉ®
OÉÉàÉÉÒhÉ ¶Éc®ÉÒ ºÉ£ÉÉÒ +ÉÉäA<Ç 22,759 22,901 45,660 |ÉÉÊiÉ−~ÉxÉ 14,660 1,84,472 1,99,131 ºÉ£ÉÉÒ 37,419 2,07,373 2,44,792
4.11.1 AÉÊ®ªÉÉ |ÉEäàÉ BÉEä +ÉÉvÉÉ® {É® |ÉÉÊiÉ BÉEÉàÉMÉÉ® VÉÉÒ´ÉÉÒA&- xÉÉÒSÉä nÉÒ MɪÉÉÒ ÉÊ´É´É®hÉÉÒ 10 ÉÊ£ÉxxÉ-ÉÊ£ÉxxÉ =tÉàÉÉå uÉ®É OÉÉàÉÉÒhÉ, ¶Éc®ÉÒ +ÉÉè® ºÉƪÉÖBÉDiÉ FÉäjÉÉå BÉEä ÉÊãÉA +ÉãÉMÉ-+ÉãÉMÉ +ÉxÉÖàÉÉÉÊxÉiÉ |ÉÉÊiÉ BÉEÉàÉMÉÉ® ´ÉÉÉÌ−ÉBÉE ºÉBÉEãÉ àÉÚãªÉ ºÉÆ´ÉrÇxÉ (VÉÉÒ´ÉÉÒA{ÉÉÒb¤ãªÉÚ) n¶ÉÉÇiÉÉÒ cè * +ÉɶÉÉ BÉEä +ÉxÉÖ°ô{É, ºÉ£ÉÉÒ FÉäjÉÉå àÉå |ÉÉÊiÉ−~ÉxÉÉå BÉEä ÉÊãÉA VÉÉÒ´ÉÉÒA{ÉÉÒb¤ãªÉÚ BÉEÉ{ÉEÉÒ +ÉÉÊvÉBÉE lÉÉ * +ÉÉÊJÉãÉ £ÉÉ®iÉÉÒªÉ ºiÉ® {É®, ºÉä´ÉÉ FÉäjÉ àÉå ´ÉÉÉÌ−ÉBÉE VÉÉÒ´ÉÉÒA{ÉÉÒb¤ãªÉÚ 73038 âó. +ÉxÉÖàÉÉÉÊxÉiÉ cè * OÉÉàÉÉÒhÉ £ÉÉ®iÉ BÉEä ÉÊãÉA, +ÉÉäA<Ç iÉlÉÉ |ÉÉÊiÉ−~ÉxÉÉå BÉEä ÉÊãÉA ´ÉÉÉÌ−ÉBÉE VÉÉÒ´ÉÉÒA{ÉÉÒb¤ãªÉÚ μÉEàɶÉ& 15644 âó. +ÉÉè® 40931 âó. +ÉxÉÖàÉÉÉÊxÉiÉ cé * ¶Éc®ÉÒ FÉäjÉÉå BÉEä ÉÊãÉA <ºÉÉÒ |ÉBÉEÉ® BÉEä +ÉxÉÖàÉÉxÉ μÉEàɶÉ& 34132 âó. +ÉÉè® 212615 âó. cé *
ÉÊ´É´É®hÉÉÒ 10: |ÉÉÊiÉ BÉEÉàÉMÉÉ® VÉÉÒ´ÉÉÒA (âó. àÉå) =tÉàÉ BÉEÉ |ÉBÉEÉ® |ÉÉÊiÉ BÉEÉàÉMÉÉ® +ÉxÉÖàÉÉÉÊxÉiÉ VÉÉÒ´ÉÉÒA (âó.àÉå) OÉÉàÉÉÒhÉ ¶Éc®ÉÒ ºÉ£ÉÉÒ +ÉÉäA<Ç 15,644 34,132 21,479
|ÉÉÊiÉ−~ÉxÉ 40,931 2,12,615 1,62,452
ºÉ£ÉÉÒ 20,640 1,34,782 73,038
4.12 BÉEɪÉÇBÉEãÉÉ{É ºiÉ® {É® ºÉä´ÉÉ FÉäjÉ BÉEä =tÉàÉÉå BÉEÉÒ ÉʴɶÉä−ÉiÉÉAÆ & VÉèºÉÉ ÉÊBÉE xÉÉÒSÉä ÉÊ´É´É®hÉÉÒ 11 àÉå n¶ÉÉǪÉÉ MɪÉÉ cè, BÉÖEãÉ =tÉàÉÉå àÉå {ÉÉÊ®´ÉcxÉ, £ÉÆbÉ®hÉ iÉlÉÉ ºÉÆSÉÉ® (+ÉÉ<Ç) =tÉàÉÉå BÉEÉÒ |ÉÉÊiɶÉiÉiÉÉ ºÉ¤ÉºÉä +ÉÉÊvÉBÉE (38±)cè, <ºÉBÉEä ¤ÉÉn +ÉxªÉ ºÉàÉÖnɪÉ, ºÉÉàÉÉÉÊVÉBÉE iÉlÉÉ BªÉÉÎBÉDiÉMÉiÉ ºÉä´ÉÉ BÉEɪÉÇBÉEãÉÉ{ÉÉå (+ÉÉä) BÉEÉ ºlÉÉxÉ (19±) cè * 3.35 BÉE®Éä½ +ÉxÉÖàÉÉÉÊxÉiÉ BÉEÉàÉMÉÉ®Éå BÉEÉÒ BÉÖEãÉ ºÉÆJªÉÉ àÉå ºÉä ºÉä´ÉÉ FÉäjÉ BÉEä ÉÊ´ÉÉÊ£ÉxxÉ BÉEɪÉÇBÉEãÉÉ{ÉÉå ºÉä VÉÖ½ä BÉEÉàÉMÉÉ®Éå BÉEÉÒ ºÉÆJªÉÉ ÉÊ£ÉxxÉ cè * näJÉÉ MɪÉÉ cè ÉÊBÉE Þ{ÉÉÊ®´ÉcxÉ, £ÉÆbÉ®hÉ iÉlÉÉ ºÉÆSÉÉ® (+ÉÉ<Ç)Þ ºÉä ºÉƤÉÆÉÊvÉiÉ =tÉàÉÉå ºÉä VÉÖ½ä BÉEÉàÉMÉÉ®Éå BÉEÉÒ +ÉxÉÖàÉÉÉÊxÉiÉ ºÉÆJªÉÉ ºÉ¤ÉºÉä +ÉÉÊvÉBÉE (0.84 BÉE®Éä½) cè, <ºÉBÉEä ¤ÉÉn ÞÉÊ´ÉkÉÉÒªÉ àÉvªÉºlÉiÉÉ (VÉä)Þ (0.58 BÉE®Éä½), ÞcÉä]ãÉ A´ÉÆ ®äºiÉ®ÉÆ (ASÉ)Þ (0.513 BÉE®Éä½), Þ+ÉxªÉ ºÉàÉÖnɪÉ, ºÉÉàÉÉÉÊVÉBÉE iÉlÉÉ BªÉÉÎBÉDiÉMÉiÉ ºÉä´ÉɪÉå (+ÉÉä)Þ (0.51 BÉE®Éä½), iÉlÉÉ ÞÉʶÉFÉÉ (AàÉ)Þ (0.39 BÉE®Éä½) BÉEÉ ºlÉÉxÉ cè * +ÉÉMÉä ªÉc £ÉÉÒ näJÉÉ MɪÉÉ cè ÉÊBÉE +ÉÉÊJÉãÉ £ÉÉ®iÉÉÒªÉ ºiÉ® {É® |ÉÉÊiÉ =tÉàÉ ºÉ´ÉÉÇÉÊvÉBÉE ´ÉÉÉÌ−ÉBÉE VÉÉÒ´ÉÉÒA ÞcÉä]ãÉ (ASÉ1)Þ (1548 cVÉÉ® âó.) BÉEÉ cè * <ºÉBÉEä ¤ÉÉn Þ¤ÉÉÒàÉÉ A´ÉÆ {Éå¶ÉxÉ {ÉEÆÉËbMÉ iÉlÉÉ ºÉcɪÉBÉE BÉEɪÉÇBÉEãÉÉ{ÉÉå (VÉä2)Þ (1327 cVÉÉ® âó.) iÉlÉÉ Þ£ÉÆbÉ®hÉ A´ÉÆ £ÉÆbÉ®MÉßc (+ÉÉ<Ç1)Þ (572 cVÉÉ® âó.) BÉEÉ ºlÉÉxÉ cè * |ÉÉÊiÉ =tÉàÉ ºÉ¤ÉºÉä BÉEàÉ VÉÉÒ´ÉÉÒA Þ+ÉxªÉ ºÉàÉÖnɪÉ, ºÉÉàÉÉÉÊVÉBÉE iÉlÉÉ BªÉÉÎBÉDiÉMÉiÉ ºÉä´ÉÉ BÉEɪÉÇBÉEãÉÉ{ÉÉå (+ÉÉä)Þ (45 cVÉÉ® âó.) BÉEÉ lÉÉ *

ºÉ´ÉæFÉhÉ ÉÊc.9
ÉÊ´É´É®hÉÉÒ 11: BÉEɪÉÇBÉEãÉÉ{É ºiÉ® {É® ºÉä´ÉÉ FÉäjÉ BÉEä =tÉàÉÉå BÉEÉÒ BÉÖEU ÉʴɶÉä−ÉiÉÉAÆ =tÉàÉÉå BÉEÉ |ÉÉÊiɶÉiÉ´ÉÉ® ´ÉMÉÉÔBÉE®hÉ
BÉEɪÉÇBÉEãÉÉ{É
BÉÖEãÉ +ÉÉäA<Ç |ÉÉÊiÉ−~ÉxÉ =tÉàÉÉå BÉEÉÒ +ÉxÉÖàÉÉÉÊxÉiÉ ºÉÆJªÉÉ (cVÉÉ® âó. àÉå)
BÉEÉàÉMÉÉ®Éå BÉEÉÒ +ÉxÉÖàÉÉÉÊxÉiÉ ºÉÆJªÉÉ (cVÉÉ® âó. àÉå)
|ÉÉÊiÉ =tÉàÉ +ÉxÉÖàÉÉÉÊxÉiÉ ´ÉÉÉÌ−ÉBÉE ºÉBÉEãÉ àÉÚãªÉ ´ÉrÇxÉ (cVÉÉ® âó. àÉå)
|ÉÉÊiÉ BÉEÉàÉMÉÉ® +ÉxÉÖàÉÉÉÊxÉiÉ ´ÉÉÉÌ−ÉBÉE ºÉBÉEãÉ àÉÚãªÉ ´ÉrÇxÉ (cVÉÉ® âó. àÉå)
cÉä]ãÉ (ASÉ 1) 0.42 0.06 2.53 69 44 1 1,548 244 cÉä]ãÉ A´ÉÆ ®äºiÉ®ÉÆ (ASÉ) 12.47 10.99 21.13 2,060 5,134 137 55 £ÉÆbÉ®xÉ A´ÉÆ £ÉÆbÉ®MÉßc (+ÉÉ<Ç 1) 0.02 0.00 0.08 3 18 572 87 {ÉÉÊ®´ÉcxÉ, £ÉÆbÉ®hÉ A´ÉÆ ºÉÆSÉÉ® (+ÉÉ<Ç) 37.99 40.55 23.09 6,273 8,370 70 52 ¤ÉÉÒàÉÉ A´ÉÆ {Éå¶ÉxÉ {ÉEÆÉËbMÉ iÉlÉÉ ºÉcɪÉBÉE BÉEɪÉÇBÉEãÉÉ{É (VÉä2) 1.39 1.41 1.23 229 438
1327 693
ÉÊ´ÉkÉÉÒªÉ àÉvªÉºlÉiÉÉ (VÉä) 9.17 9.99 4.37 1,514 5,770 327 86
ÉÊ®ªÉãÉ Aº]ä], ÉÊBÉE®ÉªÉänÉ®ÉÒ iÉlÉÉ BªÉÉ{ÉÉÉÊ®BÉE BÉEɪÉÇBÉEãÉÉ{É (BÉEä) 8.48 7.38 14.93 1,401 3,098
483
218
ÉʶÉFÉÉ (AàÉ) 6.31 5.06 13.58 1,041 3,874 226 61 º´ÉɺlªÉ A´ÉÆ ºÉÉàÉÉÉÊVÉBÉE BÉEɪÉÇ (AxÉ) 6.63 5.77 11.63 1,095 2,181 165 83 +ÉxªÉ ºÉàÉÖnɪÉ, ºÉÉàÉÉÉÊVÉBÉE iÉlÉÉ BªÉÉÎBÉDiÉMÉiÉ ºÉä´ÉÉ BÉEä BÉEɪÉÇBÉEãÉÉ{É (+ÉÉä) 18.94 20.26 11.27 3,128 5,088
45 27
BÉÖEãÉ 100 100 100 16,512 33,516 148 73
4.13 ÉÊ{ÉUãÉä nÉè®Éå BÉEä ºÉÉlÉ iÉÖãÉxÉÉiàÉBÉE {ÉÉÊ®hÉÉàÉ& ÉÊ´É´É®hÉÉÒ 12 àÉå 2006-07 (AxÉAºÉAºÉ BÉEÉ 63´ÉÉÆ nÉè®) iÉlÉÉ 2001-02 (AxÉAºÉAºÉ BÉEÉ 57´ÉÉÆ nÉè®) BÉEä nÉè®ÉxÉ ºÉä´ÉÉ FÉäjÉ ºÉä ºÉƤÉÆÉÊvÉiÉ =tÉàÉÉå BÉEä ºÉ´ÉæFÉhÉ BÉEä {ÉÉÊ®hÉÉàÉÉå BÉEÉÒ iÉÖãÉxÉÉ nÉÒ MÉ<Ç cè ÉÊVɺɺÉä ªÉc {ÉiÉÉ SÉãÉiÉÉ cè ÉÊBÉE ÉÊ{ÉUãÉä ´É−ÉÉç BÉEä nÉè®ÉxÉ =tÉàÉÉå BÉEÉÒ ºÉÆJªÉÉ iÉlÉÉ BÉEÉàÉMÉÉ®Éå BÉEÉÒ ºÉÆJªÉÉ àÉå àÉÉàÉÚãÉÉÒ ¤ÉnãÉÉ´É cÖ+ÉÉ cè * ªÉc näJÉxÉÉ £ÉÉÒ ÉÊnãÉSɺ{É cè ÉÊBÉE 2001-02 iÉlÉÉ 2006-07 nÉäxÉÉå cÉÒ nÉè®Éå àÉå =tÉàÉÉå BÉEÉÒ ºÉÆJªÉÉ BÉEä àÉÉàÉãÉä àÉå ¶ÉÉÒ−ÉÇ SÉÉ® ®ÉVªÉ ABÉE cÉÒ ®cä cé iÉlÉÉ =xÉBÉEÉÒ |ÉÉÊiɶÉiÉiÉÉ BÉEÉÒ ÉÊcººÉänÉ®ÉÒ àÉå BÉEÉä<Ç =ããÉäJÉxÉÉÒªÉ +ÉÆiÉ® xÉcÉÓ ®cÉ cè * 4.14 57´Éå nÉè® àÉå 51,673 âó. |ÉÉÊiÉ =tÉàÉ VÉÉÒ´ÉÉÒA BÉEä àÉÖBÉEɤÉãÉä 63´Éå nÉè® àÉå |ÉÉÊiÉ =tÉàÉ VÉÉÒ´ÉÉÒA 1,30,153 âó. ®cÉ cè (ÉÊ´ÉkÉÉÒªÉ àÉvªÉºlÉiÉÉ (VÉä) BÉEä iÉciÉ ¶ÉÉÉÊàÉãÉ =tÉàÉÉå BÉEÉä UÉä½BÉE®) * 57´Éå nÉè® àÉå 28,160 âó. BÉEä |ÉÉÊiÉ BÉEÉàÉMÉÉ® VÉÉÒ´ÉÉÒA BÉEä àÉÖBÉEɤÉãÉä 63´Éå nÉè® àÉå |ÉÉÊiÉ BÉEÉàÉMÉÉ® VÉÉÒ´ÉÉÒA 70,358 âó. (ÉÊ´ÉkÉÉÒªÉ àÉvªÉºlÉiÉÉ (VÉä) BÉEä iÉciÉ ¶ÉÉÉÊàÉãÉ =tÉàÉÉå BÉEÉä UÉä½BÉE®) ®cÉ cè *

ºÉ´ÉæFÉhÉ ÉÊc.10
ÉÊ´É´É®hÉÉÒ 12: ÉÊ{ÉUãÉä nÉè®Éå BÉEä nÉè®ÉxÉ BÉÖEU àÉÖJªÉ ºÉÆBÉEäiÉBÉEÉå BÉEä iÉÖãÉxÉÉiàÉBÉE ÉÊ´É´É®hÉ&
àÉÖJªÉ ºÉÆBÉEäiÉBÉE 57 ´ÉÉÆ nÉè® (2001-02) 63 ´ÉÉÆ nÉè® (2006-07)*
=tÉàÉÉå BÉEÉÒ +ÉxÉÖàÉÉÉÊxÉiÉ ºÉÆJªÉÉ (cVÉÉ® àÉå) 14472 14998 BÉEÉàÉMÉÉ®Éå BÉEÉÒ +ÉxÉÖàÉÉÉÊxÉiÉ ºÉÆJªÉÉ (cVÉÉ® àÉå) 26556 27742 |ÉÉÊiÉ =tÉàÉ BÉEÉàÉMÉÉ®Éå BÉEÉÒ +ÉÉèºÉiÉ ºÉÆJªÉÉ 1.8 1.8
=kÉ® |Énä¶É 17.19 =kÉ® |Énä¶É 14.71 {ÉÉζSÉàÉ ¤ÉÆMÉÉãÉ 10.79 {ÉÉζSÉàÉ ¤ÉÆMÉÉãÉ 12.81
+ÉÉÆwÉ |Énä¶É 9.29 +ÉÉÆwÉ |Énä¶É 9.35 àÉcÉ®É−]Å 8.21 àÉcÉ®É−]Å 8.95 ÉʤÉcÉ® 8.17 iÉÉÊàÉãÉxÉÉbÚ 6.57
=tÉàÉÉå BÉEÉÒ BÉÖEãÉ ºÉÆJªÉÉ àÉå ¶ÉÉÒ−ÉÇ {ÉÉÆSÉ ®ÉVªÉÉå BÉEÉÒ ÉÊcººÉänÉ®ÉÒ BÉEÉ |ÉÉÊiɶÉiÉ
BÉÖEãÉ 53.65 BÉÖEãÉ 52.40 |ÉÉÊiÉ =tÉàÉ VÉÉÒ´ÉÉÒA (âó. àÉå) 51,673 1,30,153 |ÉÉÊiÉ BÉEÉàÉMÉÉ® VÉÉÒ´ÉÉÒA (âó. àÉå) 28,160 70,358
*ÉÊ´ÉkÉÉÒªÉ àÉvªÉºlÉiÉÉ (VÉä) BÉEä iÉciÉ ¶ÉÉÉÊàÉãÉ =tÉàÉÉå BÉEÉä UÉä½BÉE® |ÉÉÊiɶÉiÉiÉÉ iÉlÉÉ +ÉxÉÖàÉÉxÉÉå BÉEÉÒ MÉhÉxÉÉ BÉEÉÒ MÉ<Ç cè *
4JÉ& ®ÉVªÉ-´ÉÉ® {ÉÉÊ®hÉÉàÉ
4.15 21 ¤É½ä ®ÉVªÉÉå BÉEÉÒ BÉÖEU àÉÖJªÉ +ÉÉÉÌlÉBÉE ÉʴɶÉä−ÉiÉÉ+ÉÉäÆ BÉEä {ÉÉÊ®hÉÉàÉÉå BÉEÉÒ SÉSÉÉÇ BÉEÉÒ MÉ<Ç cè ÉÊVÉxÉBÉEÉÒ {ÉcSÉÉxÉ =tÉàÉÉå BÉEÉÒ +ÉxÉÖàÉÉÉÊxÉiÉ ºÉÆJªÉÉ (1 ãÉÉJÉ ºÉä +ÉÉÊvÉBÉE) BÉEä +ÉÉvÉÉ® {É® BÉEÉÒ MÉ<Ç cè *
4.16 2006-07 àÉå ¤É½ä ®ÉVªÉÉå àÉå +É´ÉÉκlÉiÉ =tÉàÉ& <xÉ ®ÉVªÉÉå àÉå =tÉàÉÉå BÉEä +ÉÉBÉEÉ®, BÉÖEãÉ BÉEÉàÉMÉÉ®Éå BÉEÉÒ ºÉÆJªÉÉ iÉlÉÉ ´ÉÉÉÌ−ÉBÉE VÉÉÒ´ÉÉÒA BÉEä àÉÉàÉãÉä àÉå =tÉàÉÉå BÉEÉÒ ÉʴɶÉä−ÉiÉÉAÆ ÉÊ£ÉxxÉ-ÉÊ£ÉxxÉ lÉÉÓ *
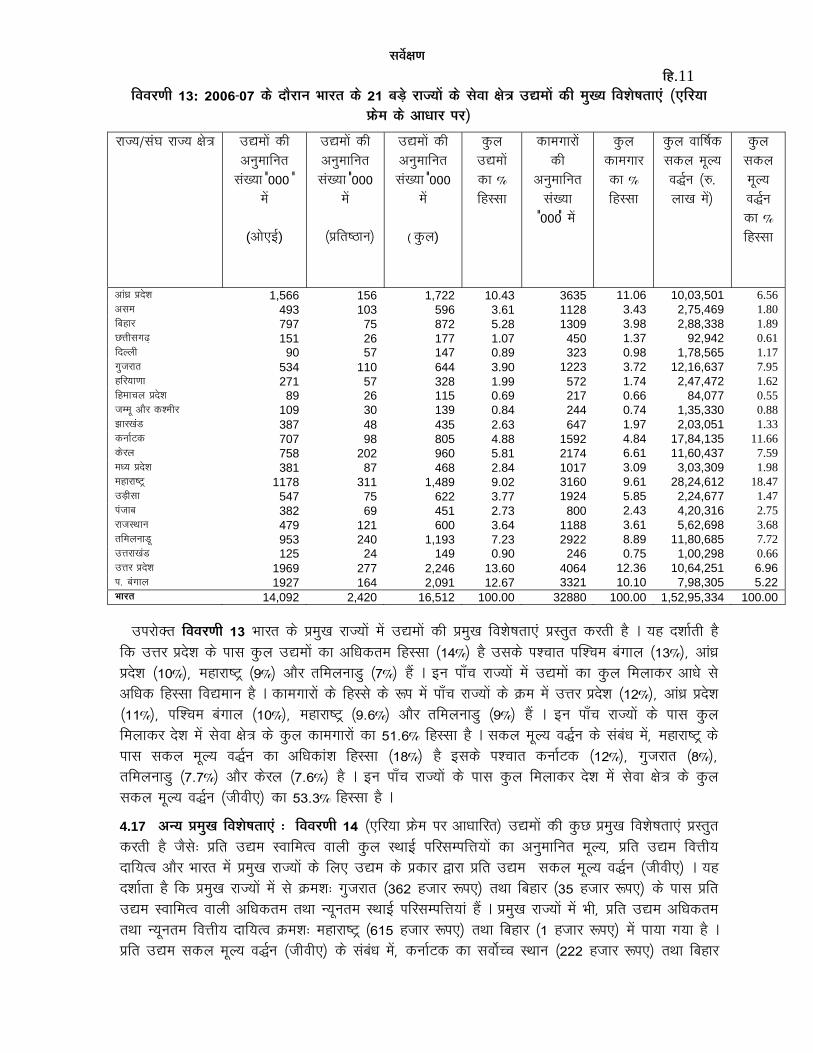
ºÉ´ÉæFÉhÉ ÉÊc.11
ÉÊ´É´É®hÉÉÒ 13: 2006-07 BÉEä nÉè®ÉxÉ £ÉÉ®iÉ BÉEä 21 ¤É½ä ®ÉVªÉÉå BÉEä ºÉä´ÉÉ FÉäjÉ =tÉàÉÉå BÉEÉÒ àÉÖJªÉ ÉʴɶÉä−ÉiÉÉAÆ (AÉÊ®ªÉÉ |ÉEäàÉ BÉEä +ÉÉvÉÉ® {É®)
={É®ÉäBÉDiÉ ÉÊ´É´É®hÉÉÒ 13 £ÉÉ®iÉ BÉEä |ÉàÉÖJÉ ®ÉVªÉÉå àÉå =tÉàÉÉå BÉEÉÒ |ÉàÉÖJÉ ÉʴɶÉä−ÉiÉÉAÆ |ɺiÉÖiÉ BÉE®iÉÉÒ cè * ªÉc n¶ÉÉÇiÉÉÒ cè ÉÊBÉE =kÉ® |Énä¶É BÉEä {ÉÉºÉ BÉÖEãÉ =tÉàÉÉå BÉEÉ +ÉÉÊvÉBÉEiÉàÉ ÉÊcººÉÉ (14±) cè =ºÉBÉEä {ɶSÉÉiÉ {ÉÉζSÉàÉ ¤ÉÆMÉÉãÉ (13±), +ÉÉÆwÉ |Énä¶É (10±), àÉcÉ®É−]Å (9±) +ÉÉè® iÉÉÊàÉãÉxÉÉbÖ (7±) cé * <xÉ {ÉÉÄSÉ ®ÉVªÉÉå àÉå =tÉàÉÉå BÉEÉ BÉÖEãÉ ÉÊàÉãÉÉBÉE® +ÉÉvÉä ºÉä +ÉÉÊvÉBÉE ÉÊcººÉÉ ÉÊ´ÉtÉàÉÉxÉ cè * BÉEÉàÉMÉÉ®Éå BÉEä ÉÊcººÉä BÉEä °ô{É àÉå {ÉÉÄSÉ ®ÉVªÉÉå BÉEä μÉEàÉ àÉå =kÉ® |Énä¶É (12±), +ÉÉÆwÉ |Énä¶É (11±), {ÉÉζSÉàÉ ¤ÉÆMÉÉãÉ (10±), àÉcÉ®É−]Å (9.6±) +ÉÉè® iÉÉÊàÉãÉxÉÉbÖ (9±) cé * <xÉ {ÉÉÄSÉ ®ÉVªÉÉå BÉEä {ÉÉºÉ BÉÖEãÉ ÉÊàÉãÉÉBÉE® nä¶É àÉå ºÉä´ÉÉ FÉäjÉ BÉEä BÉÖEãÉ BÉEÉàÉMÉÉ®Éå BÉEÉ 51.6± ÉÊcººÉÉ cè * ºÉBÉEãÉ àÉÚãªÉ ´ÉrÇxÉ BÉEä ºÉƤÉÆvÉ àÉå, àÉcÉ®É−]Å BÉEä {ÉÉºÉ ºÉBÉEãÉ àÉÚãªÉ ´ÉrÇxÉ BÉEÉ +ÉÉÊvÉBÉEÉÆ¶É ÉÊcººÉÉ (18±) cè <ºÉBÉEä {ɶSÉÉiÉ BÉExÉÉÇ]BÉE (12±), MÉÖVÉ®ÉiÉ (8±), iÉÉÊàÉãÉxÉÉbÖ (7.7±) +ÉÉè® BÉEä®ãÉ (7.6±) cè * <xÉ {ÉÉÄSÉ ®ÉVªÉÉå BÉEä {ÉÉºÉ BÉÖEãÉ ÉÊàÉãÉÉBÉE® nä¶É àÉå ºÉä´ÉÉ FÉäjÉ BÉEä BÉÖEãÉ ºÉBÉEãÉ àÉÚãªÉ ´ÉrÇxÉ (VÉÉÒ´ÉÉÒA) BÉEÉ 53.3± ÉÊcººÉÉ cè *
4.17 +ÉxªÉ |ÉàÉÖJÉ ÉʴɶÉä−ÉiÉÉAÆ & ÉÊ´É´É®hÉÉÒ 14 (AÉÊ®ªÉÉ |ÉEäàÉ {É® +ÉÉvÉÉÉÊ®iÉ) =tÉàÉÉå BÉEÉÒ BÉÖEU |ÉàÉÖJÉ ÉʴɶÉä−ÉiÉÉAÆ |ɺiÉÖiÉ BÉE®iÉÉÒ cè VÉèºÉä& |ÉÉÊiÉ =tÉàÉ º´ÉÉÉÊàÉi´É ´ÉÉãÉÉÒ BÉÖEãÉ ºlÉÉ<Ç {ÉÉÊ®ºÉà{ÉÉÊkɪÉÉå BÉEÉ +ÉxÉÖàÉÉÉÊxÉiÉ àÉÚãªÉ, |ÉÉÊiÉ =tÉàÉ ÉÊ´ÉkÉÉÒªÉ nÉÉʪÉi´É +ÉÉè® £ÉÉ®iÉ àÉå |ÉàÉÖJÉ ®ÉVªÉÉå BÉEä ÉÊãÉA =tÉàÉ BÉEä |ÉBÉEÉ® uÉ®É |ÉÉÊiÉ =tÉàÉ ºÉBÉEãÉ àÉÚãªÉ ´ÉrÇxÉ (VÉÉÒ´ÉÉÒA) * ªÉc n¶ÉÉÇiÉÉ cè ÉÊBÉE |ÉàÉÖJÉ ®ÉVªÉÉå àÉå ºÉä μÉEàɶÉ& MÉÖVÉ®ÉiÉ (362 cVÉÉ® °ô{ÉA) iÉlÉÉ ÉʤÉcÉ® (35 cVÉÉ® °ô{ÉA) BÉEä {ÉÉºÉ |ÉÉÊiÉ =tÉàÉ º´ÉÉÉÊàÉi´É ´ÉÉãÉÉÒ +ÉÉÊvÉBÉEiÉàÉ iÉlÉÉ xªÉÚxÉiÉàÉ ºlÉÉ<Ç {ÉÉÊ®ºÉà{ÉÉÊkɪÉÉÆ cé * |ÉàÉÖJÉ ®ÉVªÉÉå àÉå £ÉÉÒ, |ÉÉÊiÉ =tÉàÉ +ÉÉÊvÉBÉEiÉàÉ iÉlÉÉ xªÉÚxÉiÉàÉ ÉÊ´ÉkÉÉÒªÉ nÉÉʪÉi´É μÉEàɶÉ& àÉcÉ®É−]Å (615 cVÉÉ® °ô{ÉA) iÉlÉÉ ÉʤÉcÉ® (1 cVÉÉ® °ô{ÉA) àÉå {ÉɪÉÉ MɪÉÉ cè * |ÉÉÊiÉ =tÉàÉ ºÉBÉEãÉ àÉÚãªÉ ´ÉrÇxÉ (VÉÉÒ´ÉÉÒA) BÉEä ºÉƤÉÆvÉ àÉå, BÉExÉÉÇ]BÉE BÉEÉ ºÉ´ÉÉæSSÉ ºlÉÉxÉ (222 cVÉÉ® °ô{ÉA) iÉlÉÉ ÉʤÉcÉ®
®ÉVªÉ/ºÉÆPÉ ®ÉVªÉ FÉäjÉ =tÉàÉÉå BÉEÉÒ +ÉxÉÖàÉÉÉÊxÉiÉ
ºÉÆJªÉÉ Þ000 Þ àÉå
(+ÉÉäA<Ç)
=tÉàÉÉå BÉEÉÒ +ÉxÉÖàÉÉÉÊxÉiÉ ºÉÆJªÉÉ Þ000
àÉå
(|ÉÉÊiÉ−~ÉxÉ)
=tÉàÉÉå BÉEÉÒ +ÉxÉÖàÉÉÉÊxÉiÉ ºÉÆJªÉÉ Þ000
àÉå
( BÉÖEãÉ)
BÉÖEãÉ =tÉàÉÉå BÉEÉ ± ÉÊcººÉÉ
BÉEÉàÉMÉÉ®Éå BÉEÉÒ
+ÉxÉÖàÉÉÉÊxÉiÉ ºÉÆJªÉÉ Þ000Þ àÉå
BÉÖEãÉ BÉEÉàÉMÉÉ® BÉEÉ ± ÉÊcººÉÉ
BÉÖEãÉ ´ÉÉÉÌ−ÉBÉE ºÉBÉEãÉ àÉÚãªÉ ´ÉrÇxÉ (âó. ãÉÉJÉ àÉå)
BÉÖEãÉ ºÉBÉEãÉ àÉÚãªÉ ´ÉrÇxÉ BÉEÉ ± ÉÊcººÉÉ
+ÉÉÆwÉ |Énä¶É 1,566 156 1,722 10.43 3635 11.06 10,03,501 6.56 +ɺÉàÉ 493 103 596 3.61 1128 3.43 2,75,469 1.80 ÉʤÉcÉ® 797 75 872 5.28 1309 3.98 2,88,338 1.89 UkÉÉÒºÉMÉfà 151 26 177 1.07 450 1.37 92,942 0.61 ÉÊnããÉÉÒ 90 57 147 0.89 323 0.98 1,78,565 1.17 MÉÖVÉ®ÉiÉ 534 110 644 3.90 1223 3.72 12,16,637 7.95 cÉÊ®ªÉÉhÉÉ 271 57 328 1.99 572 1.74 2,47,472 1.62 ÉÊcàÉÉSÉãÉ |Énä¶É 89 26 115 0.69 217 0.66 84,077 0.55 VÉààÉÚ +ÉÉè® BÉE¶àÉÉÒ® 109 30 139 0.84 244 0.74 1,35,330 0.88 ZÉÉ®JÉÆb 387 48 435 2.63 647 1.97 2,03,051 1.33 BÉExÉÉÇ]BÉE 707 98 805 4.88 1592 4.84 17,84,135 11.66 BÉEä®ãÉ 758 202 960 5.81 2174 6.61 11,60,437 7.59 àÉvªÉ |Énä¶É 381 87 468 2.84 1017 3.09 3,03,309 1.98 àÉcÉ®É−]Å 1178 311 1,489 9.02 3160 9.61 28,24,612 18.47 =½ÉÒºÉÉ 547 75 622 3.77 1924 5.85 2,24,677 1.47 {ÉÆVÉÉ¤É 382 69 451 2.73 800 2.43 4,20,316 2.75 ®ÉVɺlÉÉxÉ 479 121 600 3.64 1188 3.61 5,62,698 3.68 iÉÉÊàÉãÉxÉÉbÚ 953 240 1,193 7.23 2922 8.89 11,80,685 7.72 =kÉ®ÉJÉÆb 125 24 149 0.90 246 0.75 1,00,298 0.66 =kÉ® |Énä¶É 1969 277 2,246 13.60 4064 12.36 10,64,251 6.96 {É. ¤ÉÆMÉÉãÉ 1927 164 2,091 12.67 3321 10.10 7,98,305 5.22 £ÉÉ®iÉ 14,092 2,420 16,512 100.00 32880 100.00 1,52,95,334 100.00

ºÉ´ÉæFÉhÉ ÉÊc.12
BÉEÉ ÉÊxÉàxÉiÉàÉ ºlÉÉxÉ (33 cVÉÉ® °ô{ÉA) cè * VÉèºÉä ÉÊBÉE =ààÉÉÒn lÉÉÒ, |ÉiªÉäBÉE ®ÉVªÉ BÉEä ÉÊãÉA |ÉÉÊiÉ =tÉàÉ +ÉxÉÖàÉÉÉÊxÉiÉ ºÉBÉEãÉ àÉÚãªÉ ´ÉrÇxÉ (VÉÉÒ´ÉÉÒA) º´É-ãÉäJÉÉ =tÉàÉÉå BÉEÉÒ iÉÖãÉxÉÉ àÉå |ÉÉÊiÉ−~ÉxÉÉå BÉEä ÉÊãÉA =SSÉ cè *
ÉÊ´É´É®hÉÉÒ 14: º´ÉÉÉÊàÉi´É ´ÉÉãÉÉÒ BÉÖEãÉ ºlÉÉ<Ç {ÉÉÊ®ºÉà{ÉÉÊkɪÉÉå BÉEÉ àÉÚãªÉ, ÉÊ´ÉkÉÉÒªÉ nÉÉʪÉi´É +ÉÉè® |ÉÉÊiÉ =tÉàÉ ºÉBÉEãÉ àÉÚãªÉ ´ÉrÇxÉ (âó. cVÉÉ® àÉå) (VÉÉÒ´ÉÉÒA) £ÉÉ®iÉ àÉå |ÉàÉÖJÉ ®ÉVªÉÉå BÉEä ÉÊãÉA AÉÊ®ªÉÉ |ÉEäàÉ {É® +ÉÉvÉÉÉÊ®iÉ *
º´É-ãÉäJÉÉ =tÉàÉ |ÉÉÊiÉ−~ÉxÉ ºÉ£ÉÉÒ ®ÉVªÉ
ºlÉÉ<Ç {ÉÉÊ®ºÉà{ÉÉÊkɪÉÉÄ
ÉÊ´ÉkÉÉÒªÉ nÉÉʪÉi´É
ºÉBÉEãÉ àÉÚãªÉ ´ÉrÇxÉ
(VÉÉÒ´ÉÉÒA)
ºlÉÉ<Ç {ÉÉÊ®ºÉà{ÉÉÊkɪÉÉÄ
ÉÊ´ÉkÉÉÒªÉ nÉÉʪÉi´É
ºÉBÉEãÉ àÉÚãªÉ ´ÉrÇxÉ
(VÉÉÒ´ÉÉÒA)
ºlÉÉ<Ç {ÉÉÊ®ºÉà{ÉÉÊkɪÉÉÄ
ÉÊ´ÉkÉÉÒªÉ nÉÉʪÉi´É
ºÉBÉEãÉ àÉÚãªÉ ´ÉrÇxÉ
(VÉÉÒ´ÉÉÒA) +ÉÉÆwÉ |Énä¶É 27 11 24 661 654 406 85 70 58 +ɺÉàÉ 34 1 29 303 103 127 81 18 46 ÉʤÉcÉ® 24 0 25 151 8 116 35 1 33 UkÉÉÒºÉMÉfà 44 6 28 396 70 195 96 16 52 ÉÊnããÉÉÒ 118 1 49 709 105 233 349 41 121 MÉÖVÉ®ÉiÉ 75 7 46 1754 1564 884 362 273 189 cÉÊ®ªÉÉhÉÉ 93 4 44 859 47 222 227 11 75 ÉÊcàÉÉSÉãÉ |Énä¶É 102 21 33 798 415 214 258 109 73 VÉààÉÚ +ÉÉè® BÉE¶àÉÉÒ® 110 13 62 828 77 224 266 27 97 ZÉÉ®JÉÆb 25 1 27 335 77 202 60 9 47 BÉExÉÉÇ]BÉE 30 14 25 928 4078 1641 139 507 222 BÉEä®ãÉ 64 19 38 613 701 431 180 162 121 àÉvªÉ |Énä¶É 40 3 27 477 192 228 122 38 65 àÉcÉ®É−]Å 61 17 38 911 2880 763 238 615 190 =½ÉÒºÉÉ 22 8 19 422 162 159 70 26 36 {ÉÆVÉÉ¤É 84 5 42 1223 589 374 259 94 93 ®ÉVɺlÉÉxÉ 86 6 38 912 720 315 253 150 94 iÉÉÊàÉãÉxÉÉbÚ 46 18 36 759 813 349 189 178 99 =kÉ®ÉJÉÆb 77 6 35 742 335 234 185 59 67 =kÉ® |Énä¶É 40 1 31 491 25 167 96 4 47 {É. ¤ÉÆMÉÉãÉ 19 3 22 439 727 223 52 60 38 ºÉàɺiÉ £ÉÉ®iÉ 44 8 31 738 955 453 145 146 93

BROAD CONTENTS OF THE LAST THREE ISSUES OF ‘SARVEKSHANA’
(A ) 93rd ISSUE
PART – I : TECHNICAL PAPERS 1. External Validation of NSS Consumer Expenditure Survey
(Siladitya Choudhury and S. Mukherjee) 2. Activity profiles of Children in India
(P C Mohanan)
PART – II : SUMMARY AND MAJOR FINDINGS OF SURVEYS
1. An Integrated Summary of NSS 61st Round (July 2004 – June 2005) on “Household Consumer Expenditure in India”
(Nivedita Gupta) (B) 94th ISSUE
PART – I: TECHNICAL PAPERS 1. Gender Bias in Intra-Household Allocation as Measured through Indian National Sample Survey
(Siddhartha Kundu) 2. Inter-state comparisons of housing conditions – a study based on NSS 58th round
(P C Mohanan and Sourav Chakrabortty)
PART – II : SUMMARY AND MAJOR FINDINGS OF SURVEYS
3. An Integrated Summary of NSS 61st Round (July 2004 – June 2005)
on “Employment and Unemployment situation in India”
(Siladitya Chaudhuri & Sudip Kumar Ray) (C ) 95th ISSUE
PART – I: TECHNICAL PAPERS
1. Some Effects on Estimates of Household Consumption of Using Mixed reference Period – NSS 61st Round Data
(Prabir Chaudhury and Siddhartha Kundu) 2. Gendering Disguised Unemployment: A Study of Informal Service Sector in India
(Atanu Sengupta, Soumyendra Kishore Datta, Susanta Mond) 3. A study of student households
(Gopa Chattapadhyay and Prabir Chaudhury) 4. A short note on the linkage between Poverty and Child Labour in India
(Dipa Mukherjee) 5. A Relationship between MPCEs from Worksheet and from Detailed Inquiry
(Siddhartha Kundu) PART – II : SUMMARY AND MAJOR FINDINGS OF SURVEYS
6. An Integrated Summary of Unorganised Manufacturing Sector in India - NSS-62nd Round (July 2005-June 2006)
(T. K. Sanyal & Nilanjana Roy Joseph)
PART – III : HIGHLIGHTS OF RECENT REPORTS RELEASED BY NSSO 7. Household Consumer Expenditure in India –NSS 64th Round, 2007-08 8. Employment and Unemployment Situation in India–NSS 64th Round, 2007-08 9. Education in India: Participation and Expenditure - NSS 64th Round, 2007-08 10. Migration in India - NSS 64th Round, 2007-08