Embed Size (px)
Citation preview
1
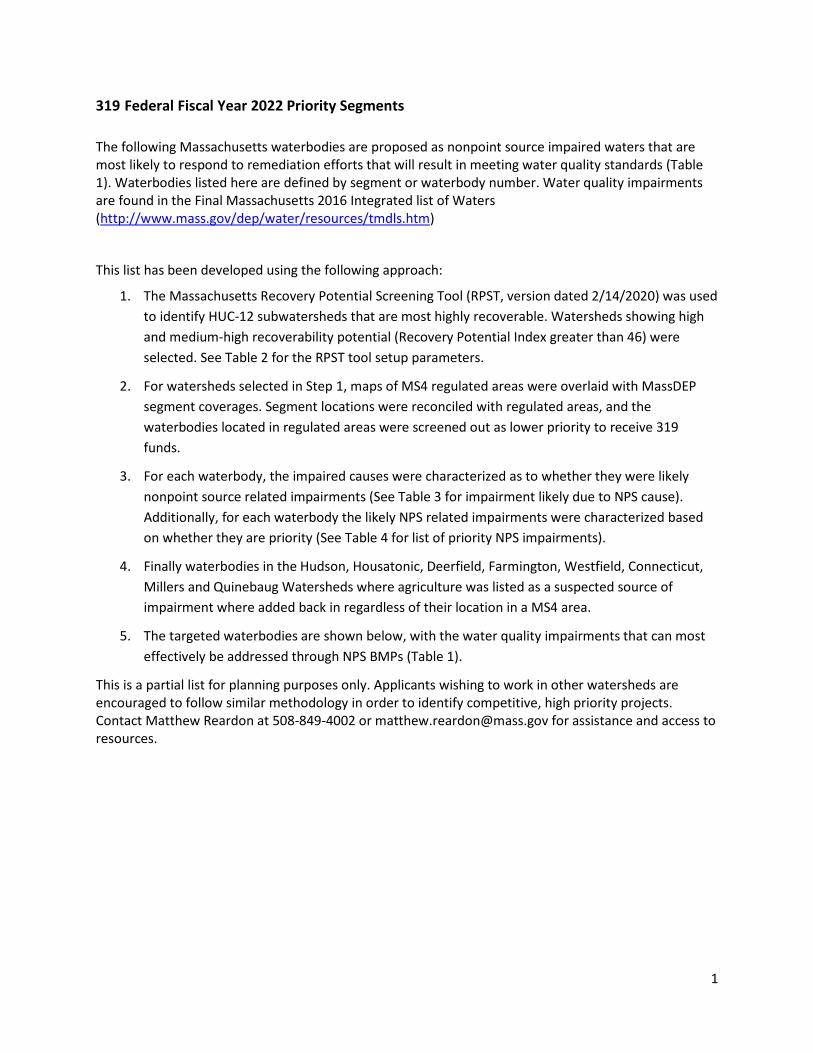
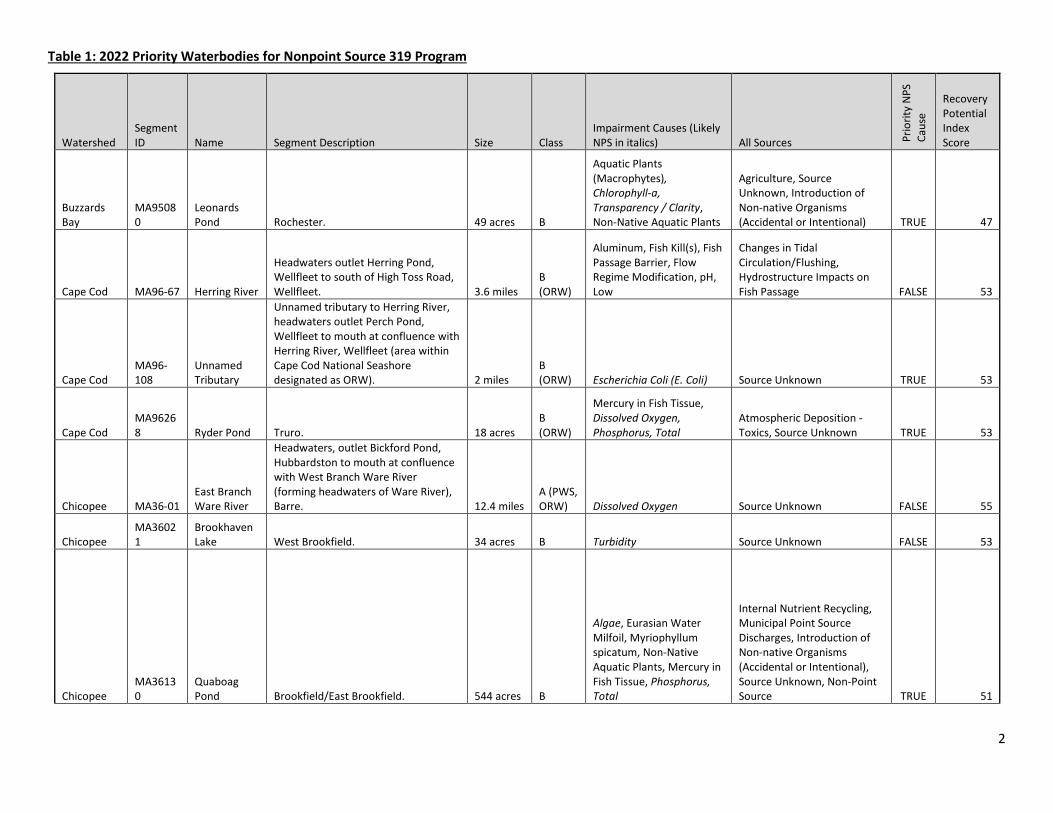
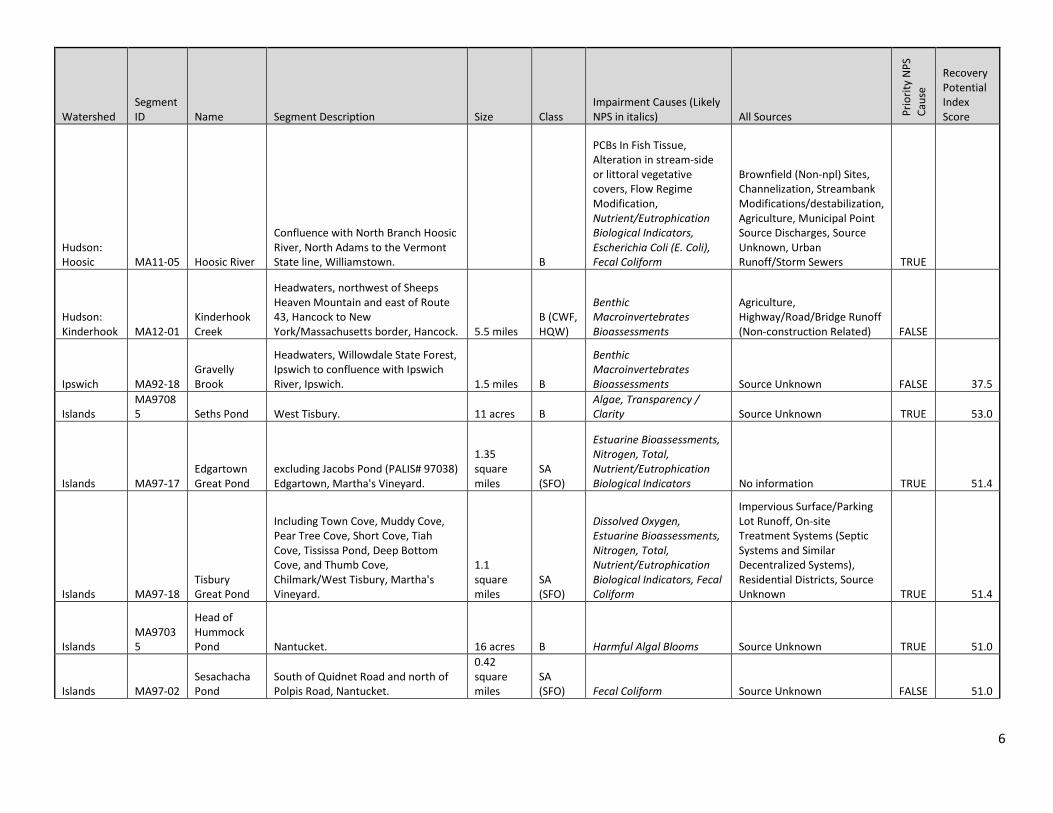
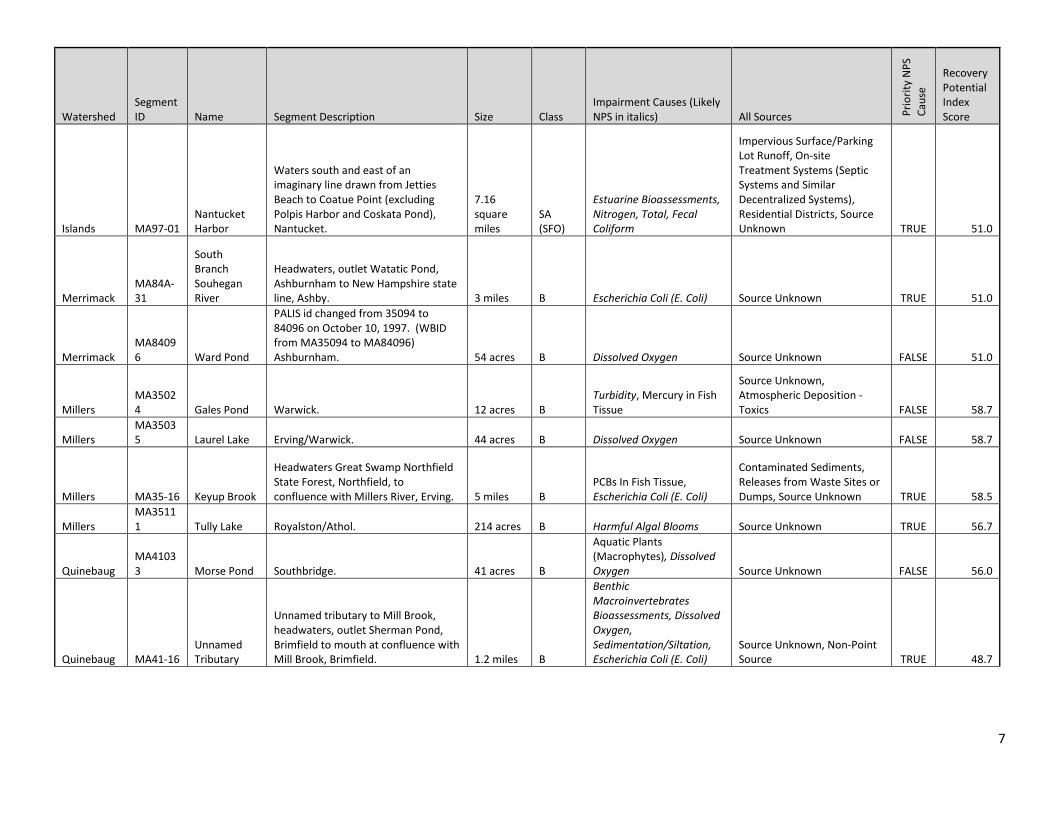
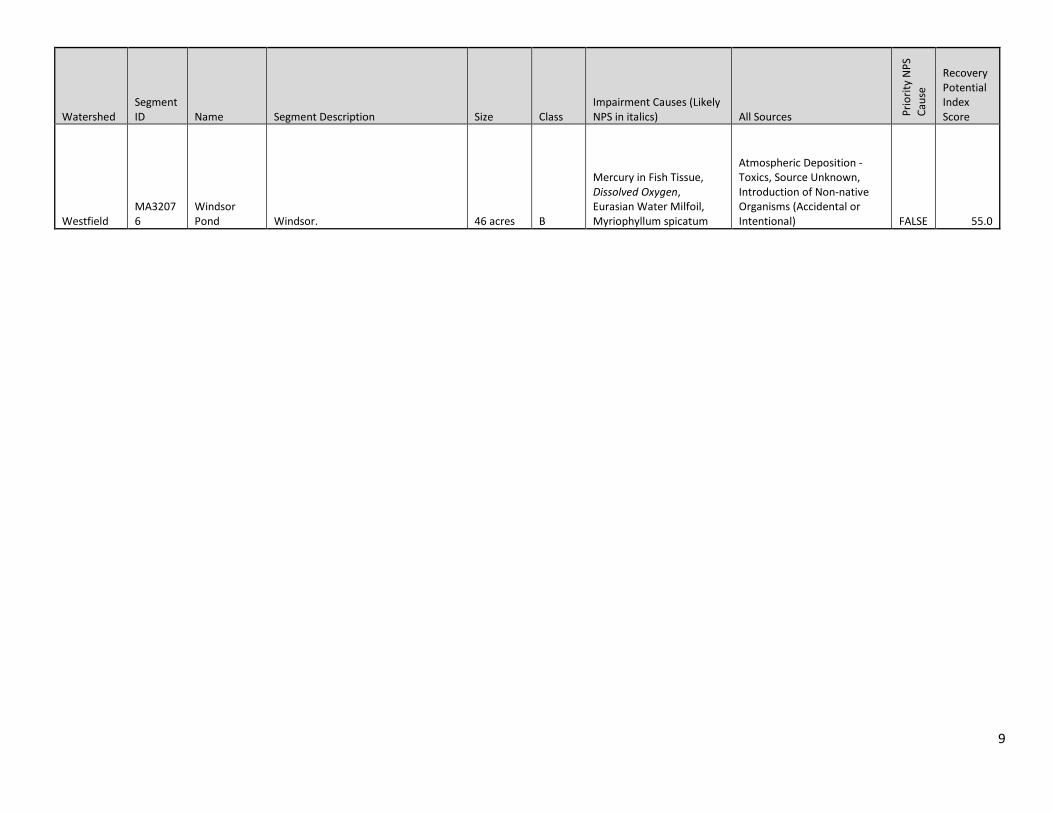
319 Federal Fiscal Year 2022 Priority Segments The following Massachusetts waterbodies are proposed as nonpoint source impaired waters that are most likely to respond to remediation efforts that will result in meeting water quality standards (Table 1). Waterbodies listed here are defined by segment or waterbody number. Water quality impairments are found in the Final Massachusetts 2016 Integrated list of Waters (http://www.mass.gov/dep/water/resources/tmdls.htm)
This list has been developed using the following approach:
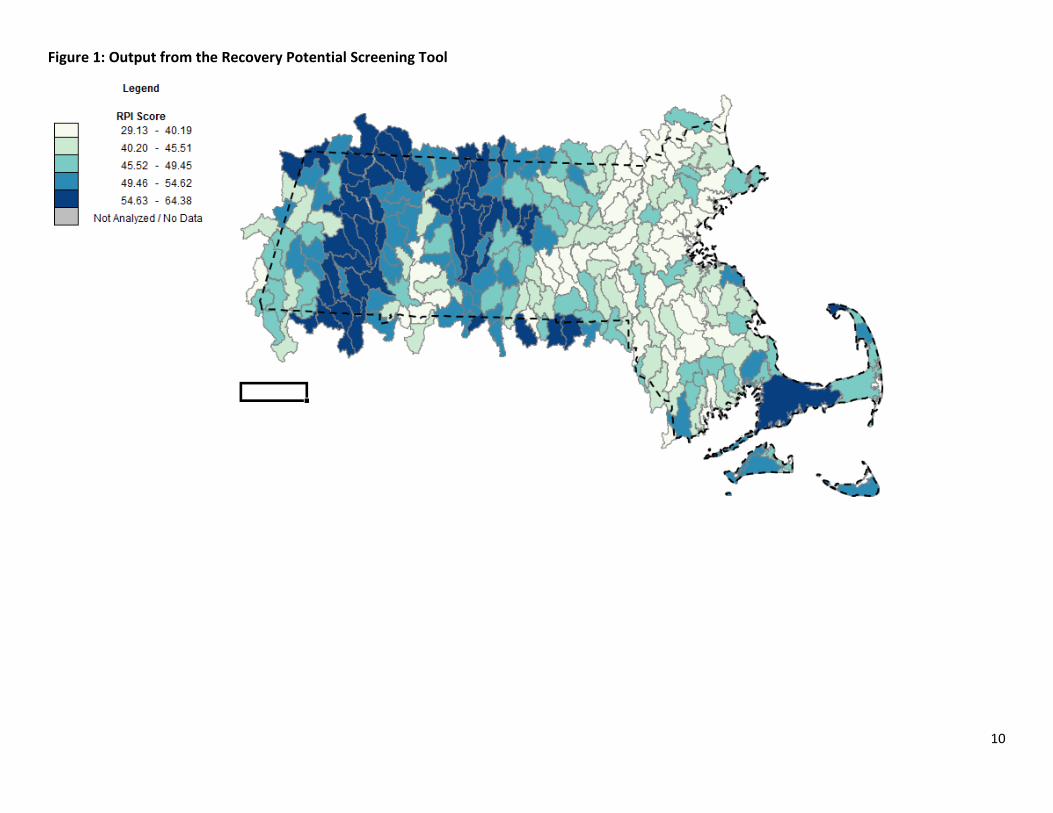
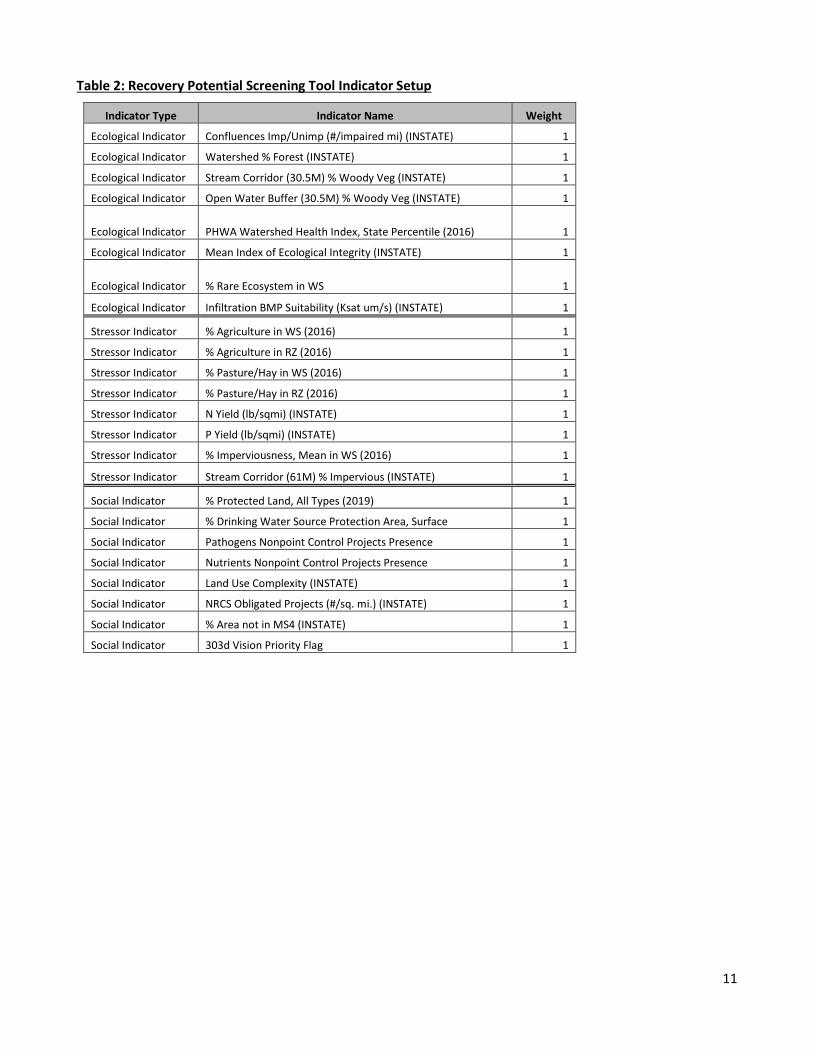
1. The Massachusetts Recovery Potential Screening Tool (RPST, version dated 2/14/2020) was used to identify HUC-12 subwatersheds that are most highly recoverable. Watersheds showing high and medium-high recoverability potential (Recovery Potential Index greater than 46) were selected. See Table 2 for the RPST tool setup parameters.
2. For watersheds selected in Step 1, maps of MS4 regulated areas were overlaid with MassDEP segment coverages. Segment locations were reconciled with regulated areas, and the waterbodies located in regulated areas were screened out as lower priority to receive 319 funds.
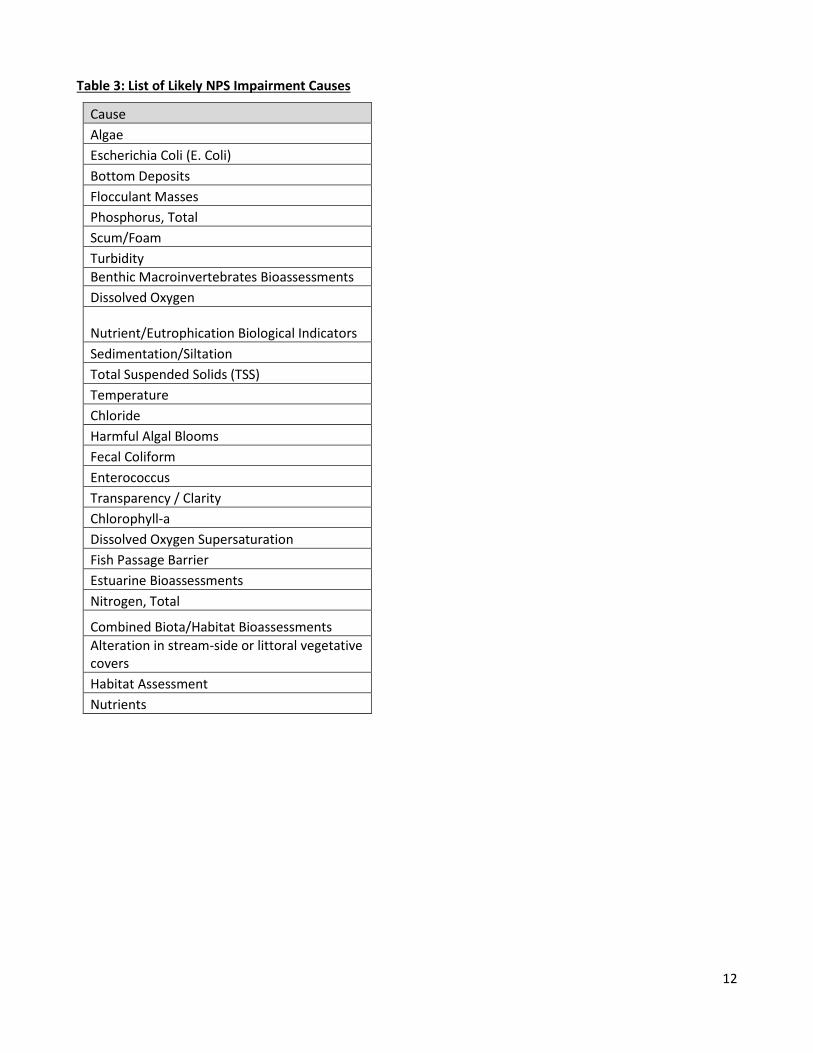
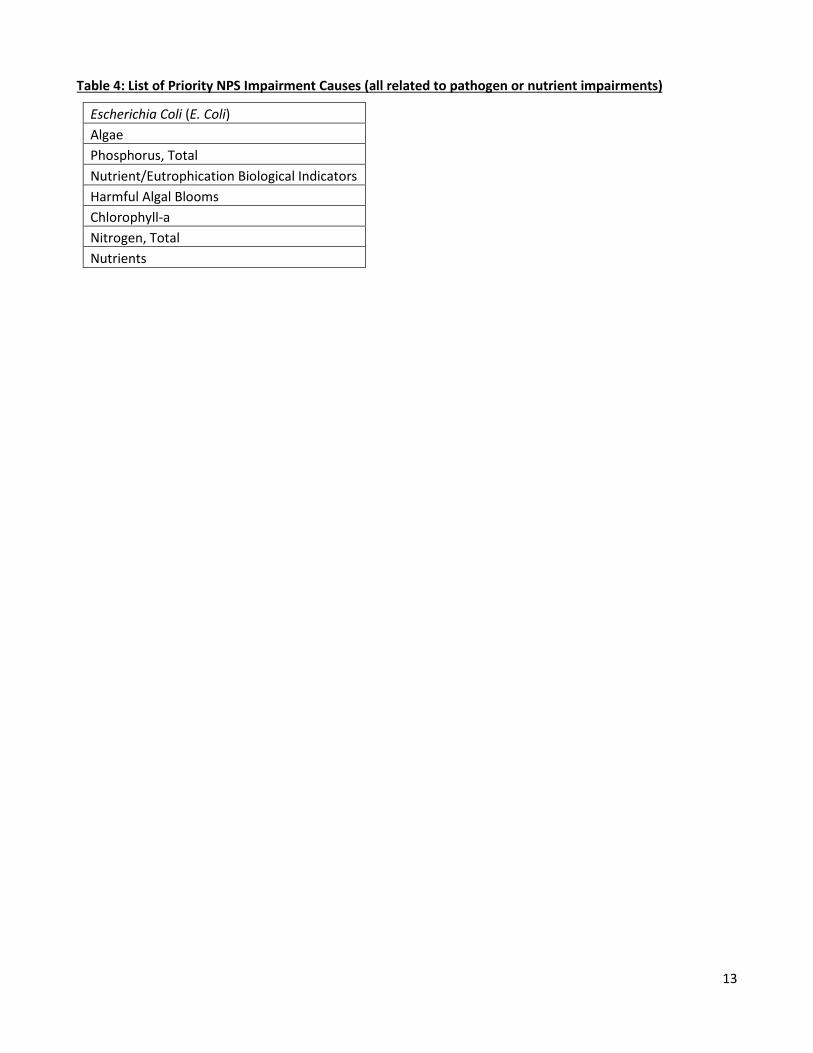
3. For each waterbody, the impaired causes were characterized as to whether they were likely nonpoint source related impairments (See Table 3 for impairment likely due to NPS cause). Additionally, for each waterbody the likely NPS related impairments were characterized based on whether they are priority (See Table 4 for list of priority NPS impairments).
4. Finally waterbodies in the Hudson, Housatonic, Deerfield, Farmington, Westfield, Connecticut, Millers and Quinebaug Watersheds where agriculture was listed as a suspected source of impairment where added back in regardless of their location in a MS4 area.
5. The targeted waterbodies are shown below, with the water quality impairments that can most effectively be addressed through NPS BMPs (Table 1).
This is a partial list for planning purposes only. Applicants wishing to work in other watersheds are encouraged to follow similar methodology in order to identify competitive, high priority projects. Contact Matthew Reardon at 508-849-4002 or [email protected] for assistance and access to resources.
2
Table 1: 2022 Priority Waterbodies for Nonpoint Source 319 Program
Watershed Segment ID Name Segment Description Size Class
Impairment Causes (Likely NPS in italics) All Sources Pr
iorit
y N
PS
Caus
e
Recovery Potential Index Score
Buzzards Bay
MA95080
Leonards Pond Rochester. 49 acres B
Aquatic Plants (Macrophytes), Chlorophyll-a, Transparency / Clarity, Non-Native Aquatic Plants
Agriculture, Source Unknown, Introduction of Non-native Organisms (Accidental or Intentional) TRUE 47
Cape Cod MA96-67 Herring River
Headwaters outlet Herring Pond, Wellfleet to south of High Toss Road, Wellfleet. 3.6 miles
B (ORW)
Aluminum, Fish Kill(s), Fish Passage Barrier, Flow Regime Modification, pH, Low
Changes in Tidal Circulation/Flushing, Hydrostructure Impacts on Fish Passage FALSE 53
Cape Cod MA96-108
Unnamed Tributary
Unnamed tributary to Herring River, headwaters outlet Perch Pond, Wellfleet to mouth at confluence with Herring River, Wellfleet (area within Cape Cod National Seashore designated as ORW). 2 miles
B (ORW) Escherichia Coli (E. Coli) Source Unknown TRUE 53
Cape Cod MA96268 Ryder Pond Truro. 18 acres
B (ORW)
Mercury in Fish Tissue, Dissolved Oxygen, Phosphorus, Total
Atmospheric Deposition - Toxics, Source Unknown TRUE 53
Chicopee MA36-01 East Branch Ware River
Headwaters, outlet Bickford Pond, Hubbardston to mouth at confluence with West Branch Ware River (forming headwaters of Ware River), Barre. 12.4 miles
A (PWS, ORW) Dissolved Oxygen Source Unknown FALSE 55
Chicopee MA36021
Brookhaven Lake West Brookfield. 34 acres B Turbidity Source Unknown FALSE 53
Chicopee MA36130
Quaboag Pond Brookfield/East Brookfield. 544 acres B
Algae, Eurasian Water Milfoil, Myriophyllum spicatum, Non-Native Aquatic Plants, Mercury in Fish Tissue, Phosphorus, Total
Internal Nutrient Recycling, Municipal Point Source Discharges, Introduction of Non-native Organisms (Accidental or Intentional), Source Unknown, Non-Point Source TRUE 51
3
Watershed Segment ID Name Segment Description Size Class
Impairment Causes (Likely NPS in italics) All Sources Pr
iorit
y N
PS
Caus
e
Recovery Potential Index Score
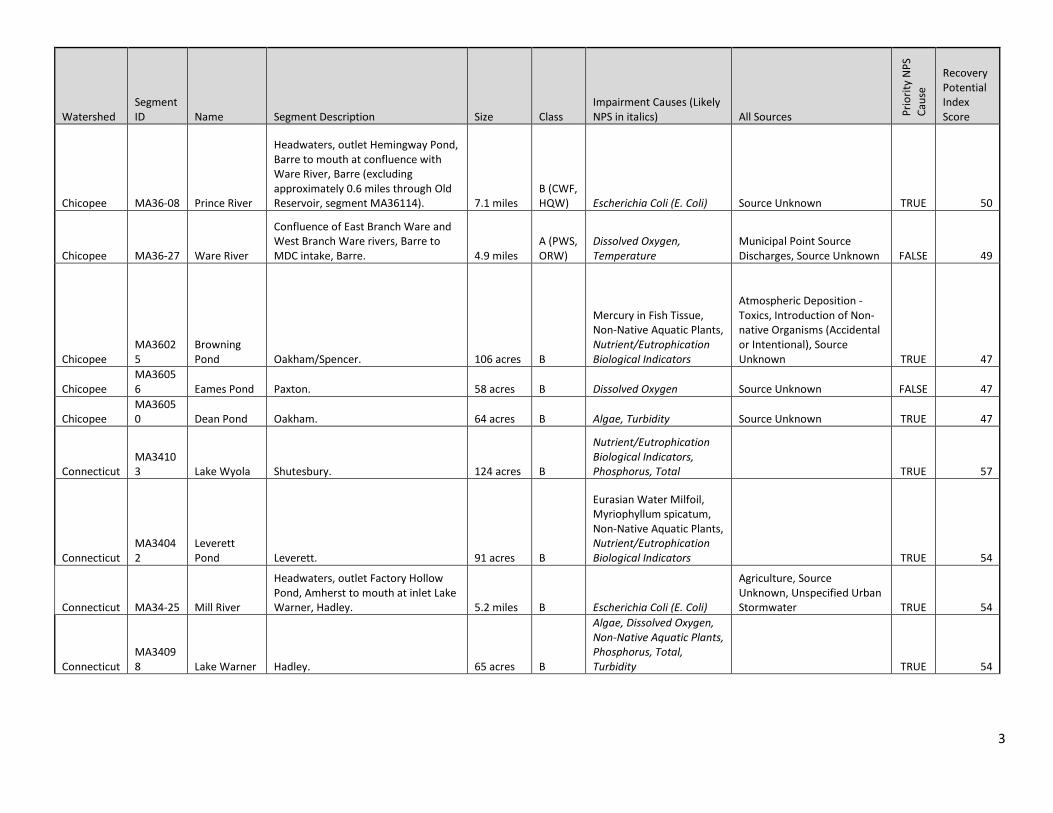
Chicopee MA36-08 Prince River
Headwaters, outlet Hemingway Pond, Barre to mouth at confluence with Ware River, Barre (excluding approximately 0.6 miles through Old Reservoir, segment MA36114). 7.1 miles
B (CWF, HQW) Escherichia Coli (E. Coli) Source Unknown TRUE 50
Chicopee MA36-27 Ware River
Confluence of East Branch Ware and West Branch Ware rivers, Barre to MDC intake, Barre. 4.9 miles
A (PWS, ORW)
Dissolved Oxygen, Temperature
Municipal Point Source Discharges, Source Unknown FALSE 49
Chicopee MA36025
Browning Pond Oakham/Spencer. 106 acres B
Mercury in Fish Tissue, Non-Native Aquatic Plants, Nutrient/Eutrophication Biological Indicators
Atmospheric Deposition - Toxics, Introduction of Non-native Organisms (Accidental or Intentional), Source Unknown TRUE 47
Chicopee MA36056 Eames Pond Paxton. 58 acres B Dissolved Oxygen Source Unknown FALSE 47
Chicopee MA36050 Dean Pond Oakham. 64 acres B Algae, Turbidity Source Unknown TRUE 47
Connecticut MA34103 Lake Wyola Shutesbury. 124 acres B
Nutrient/Eutrophication Biological Indicators, Phosphorus, Total TRUE 57
Connecticut MA34042
Leverett Pond Leverett. 91 acres B
Eurasian Water Milfoil, Myriophyllum spicatum, Non-Native Aquatic Plants, Nutrient/Eutrophication Biological Indicators TRUE 54
Connecticut MA34-25 Mill River
Headwaters, outlet Factory Hollow Pond, Amherst to mouth at inlet Lake Warner, Hadley. 5.2 miles B Escherichia Coli (E. Coli)
Agriculture, Source Unknown, Unspecified Urban Stormwater TRUE 54
Connecticut MA34098 Lake Warner Hadley. 65 acres B
Algae, Dissolved Oxygen, Non-Native Aquatic Plants, Phosphorus, Total, Turbidity TRUE 54
4
Watershed Segment ID Name Segment Description Size Class
Impairment Causes (Likely NPS in italics) All Sources Pr
iorit
y N
PS
Caus
e
Recovery Potential Index Score
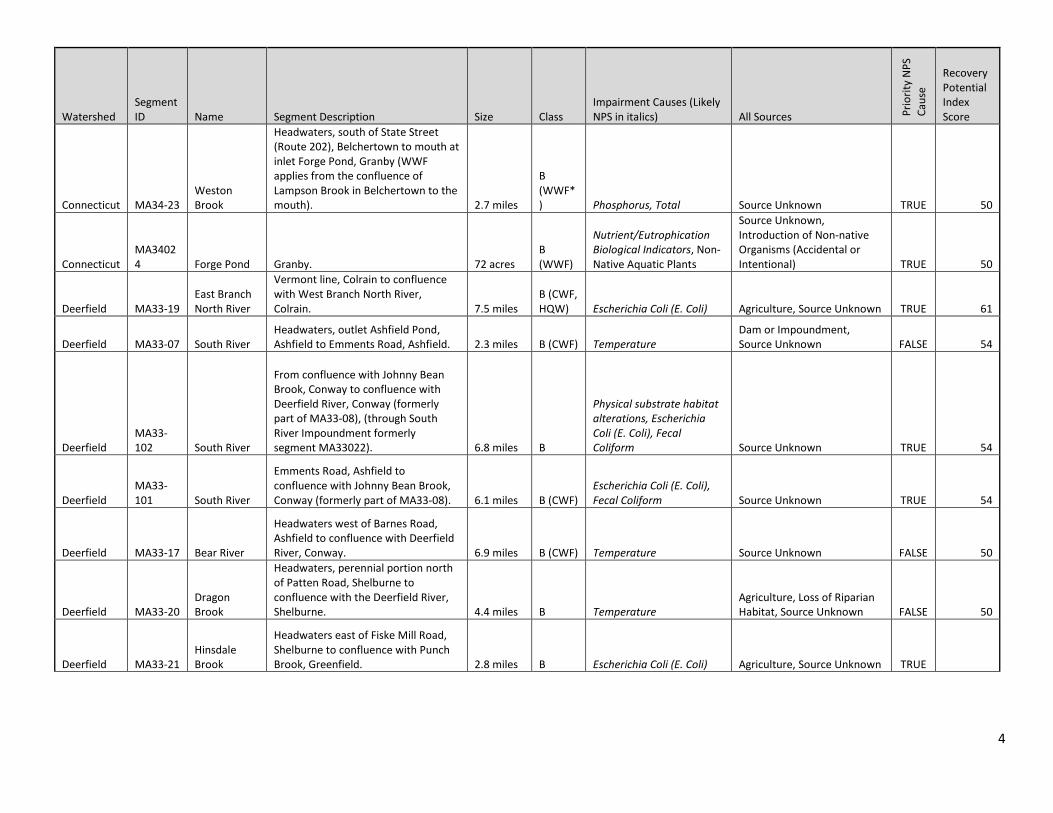
Connecticut MA34-23 Weston Brook
Headwaters, south of State Street (Route 202), Belchertown to mouth at inlet Forge Pond, Granby (WWF applies from the confluence of Lampson Brook in Belchertown to the mouth). 2.7 miles
B (WWF*) Phosphorus, Total Source Unknown TRUE 50
Connecticut MA34024 Forge Pond Granby. 72 acres
B (WWF)
Nutrient/Eutrophication Biological Indicators, Non-Native Aquatic Plants
Source Unknown, Introduction of Non-native Organisms (Accidental or Intentional) TRUE 50
Deerfield MA33-19 East Branch North River
Vermont line, Colrain to confluence with West Branch North River, Colrain. 7.5 miles
B (CWF, HQW) Escherichia Coli (E. Coli) Agriculture, Source Unknown TRUE 61
Deerfield MA33-07 South River Headwaters, outlet Ashfield Pond, Ashfield to Emments Road, Ashfield. 2.3 miles B (CWF) Temperature
Dam or Impoundment, Source Unknown FALSE 54
Deerfield MA33-102 South River
From confluence with Johnny Bean Brook, Conway to confluence with Deerfield River, Conway (formerly part of MA33-08), (through South River Impoundment formerly segment MA33022). 6.8 miles B
Physical substrate habitat alterations, Escherichia Coli (E. Coli), Fecal Coliform Source Unknown TRUE 54
Deerfield MA33-101 South River
Emments Road, Ashfield to confluence with Johnny Bean Brook, Conway (formerly part of MA33-08). 6.1 miles B (CWF)
Escherichia Coli (E. Coli), Fecal Coliform Source Unknown TRUE 54
Deerfield MA33-17 Bear River
Headwaters west of Barnes Road, Ashfield to confluence with Deerfield River, Conway. 6.9 miles B (CWF) Temperature Source Unknown FALSE 50
Deerfield MA33-20 Dragon Brook
Headwaters, perennial portion north of Patten Road, Shelburne to confluence with the Deerfield River, Shelburne. 4.4 miles B Temperature
Agriculture, Loss of Riparian Habitat, Source Unknown FALSE 50
Deerfield MA33-21 Hinsdale Brook
Headwaters east of Fiske Mill Road, Shelburne to confluence with Punch Brook, Greenfield. 2.8 miles B Escherichia Coli (E. Coli) Agriculture, Source Unknown TRUE
5
Watershed Segment ID Name Segment Description Size Class
Impairment Causes (Likely NPS in italics) All Sources Pr
iorit
y N
PS
Caus
e
Recovery Potential Index Score
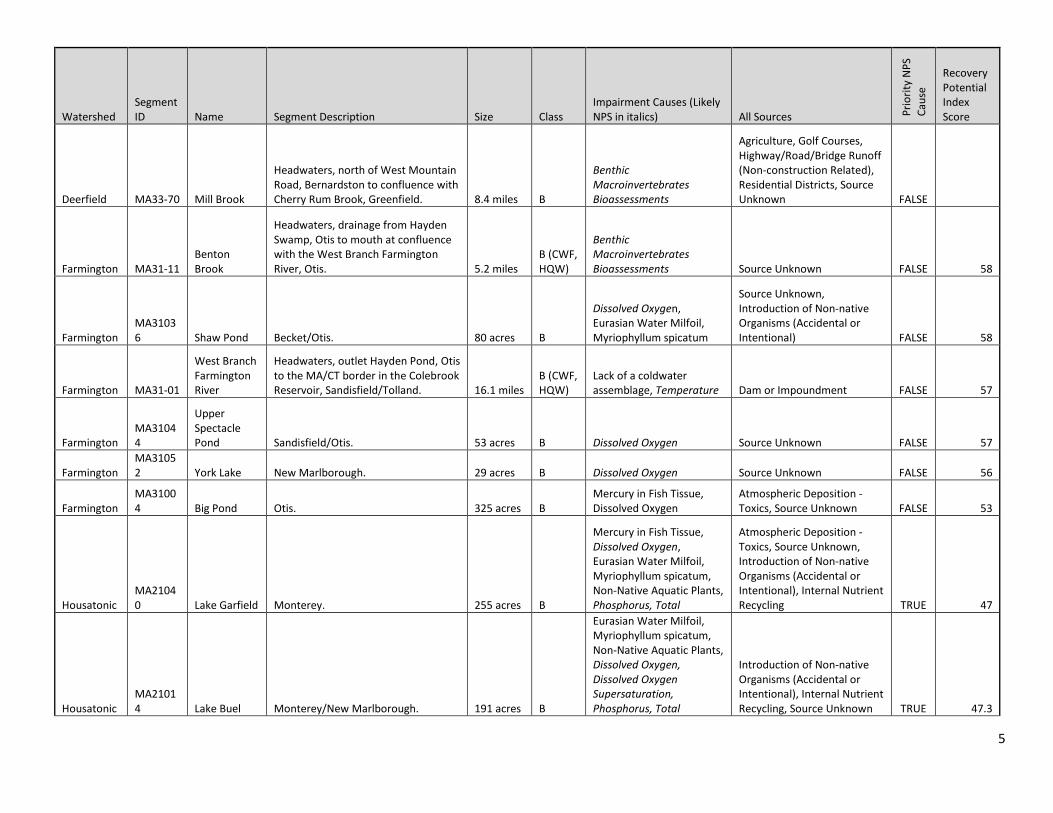
Deerfield MA33-70 Mill Brook
Headwaters, north of West Mountain Road, Bernardston to confluence with Cherry Rum Brook, Greenfield. 8.4 miles B
Benthic Macroinvertebrates Bioassessments
Agriculture, Golf Courses, Highway/Road/Bridge Runoff (Non-construction Related), Residential Districts, Source Unknown FALSE
Farmington MA31-11 Benton Brook
Headwaters, drainage from Hayden Swamp, Otis to mouth at confluence with the West Branch Farmington River, Otis. 5.2 miles
B (CWF, HQW)
Benthic Macroinvertebrates Bioassessments Source Unknown FALSE 58
Farmington MA31036 Shaw Pond Becket/Otis. 80 acres B
Dissolved Oxygen, Eurasian Water Milfoil, Myriophyllum spicatum
Source Unknown, Introduction of Non-native Organisms (Accidental or Intentional) FALSE 58
Farmington MA31-01
West Branch Farmington River
Headwaters, outlet Hayden Pond, Otis to the MA/CT border in the Colebrook Reservoir, Sandisfield/Tolland. 16.1 miles
B (CWF, HQW)
Lack of a coldwater assemblage, Temperature Dam or Impoundment FALSE 57
Farmington MA31044
Upper Spectacle Pond Sandisfield/Otis. 53 acres B Dissolved Oxygen Source Unknown FALSE 57
Farmington MA31052 York Lake New Marlborough. 29 acres B Dissolved Oxygen Source Unknown FALSE 56
Farmington MA31004 Big Pond Otis. 325 acres B
Mercury in Fish Tissue, Dissolved Oxygen
Atmospheric Deposition - Toxics, Source Unknown FALSE 53
Housatonic MA21040 Lake Garfield Monterey. 255 acres B
Mercury in Fish Tissue, Dissolved Oxygen, Eurasian Water Milfoil, Myriophyllum spicatum, Non-Native Aquatic Plants, Phosphorus, Total
Atmospheric Deposition - Toxics, Source Unknown, Introduction of Non-native Organisms (Accidental or Intentional), Internal Nutrient Recycling TRUE 47
Housatonic MA21014 Lake Buel Monterey/New Marlborough. 191 acres B
Eurasian Water Milfoil, Myriophyllum spicatum, Non-Native Aquatic Plants, Dissolved Oxygen, Dissolved Oxygen Supersaturation, Phosphorus, Total
Introduction of Non-native Organisms (Accidental or Intentional), Internal Nutrient Recycling, Source Unknown TRUE 47.3
6
Watershed Segment ID Name Segment Description Size Class
Impairment Causes (Likely NPS in italics) All Sources Pr
iorit
y N
PS
Caus
e
Recovery Potential Index Score
Hudson: Hoosic MA11-05 Hoosic River
Confluence with North Branch Hoosic River, North Adams to the Vermont State line, Williamstown. B
PCBs In Fish Tissue, Alteration in stream-side or littoral vegetative covers, Flow Regime Modification, Nutrient/Eutrophication Biological Indicators, Escherichia Coli (E. Coli), Fecal Coliform
Brownfield (Non-npl) Sites, Channelization, Streambank Modifications/destabilization, Agriculture, Municipal Point Source Discharges, Source Unknown, Urban Runoff/Storm Sewers TRUE
Hudson: Kinderhook MA12-01
Kinderhook Creek
Headwaters, northwest of Sheeps Heaven Mountain and east of Route 43, Hancock to New York/Massachusetts border, Hancock. 5.5 miles
B (CWF, HQW)
Benthic Macroinvertebrates Bioassessments
Agriculture, Highway/Road/Bridge Runoff (Non-construction Related) FALSE
Ipswich MA92-18 Gravelly Brook
Headwaters, Willowdale State Forest, Ipswich to confluence with Ipswich River, Ipswich. 1.5 miles B
Benthic Macroinvertebrates Bioassessments Source Unknown FALSE 37.5
Islands MA97085 Seths Pond West Tisbury. 11 acres B
Algae, Transparency / Clarity Source Unknown TRUE 53.0
Islands MA97-17 Edgartown Great Pond
excluding Jacobs Pond (PALIS# 97038) Edgartown, Martha's Vineyard.
1.35 square miles
SA (SFO)
Estuarine Bioassessments, Nitrogen, Total, Nutrient/Eutrophication Biological Indicators No information TRUE 51.4
Islands MA97-18 Tisbury Great Pond
Including Town Cove, Muddy Cove, Pear Tree Cove, Short Cove, Tiah Cove, Tississa Pond, Deep Bottom Cove, and Thumb Cove, Chilmark/West Tisbury, Martha's Vineyard.
1.1 square miles
SA (SFO)
Dissolved Oxygen, Estuarine Bioassessments, Nitrogen, Total, Nutrient/Eutrophication Biological Indicators, Fecal Coliform
Impervious Surface/Parking Lot Runoff, On-site Treatment Systems (Septic Systems and Similar Decentralized Systems), Residential Districts, Source Unknown TRUE 51.4
Islands MA97035
Head of Hummock Pond Nantucket. 16 acres B Harmful Algal Blooms Source Unknown TRUE 51.0
Islands MA97-02 Sesachacha Pond
South of Quidnet Road and north of Polpis Road, Nantucket.
0.42 square miles
SA (SFO) Fecal Coliform Source Unknown FALSE 51.0
7
Watershed Segment ID Name Segment Description Size Class
Impairment Causes (Likely NPS in italics) All Sources Pr
iorit
y N
PS
Caus
e
Recovery Potential Index Score
Islands MA97-01 Nantucket Harbor
Waters south and east of an imaginary line drawn from Jetties Beach to Coatue Point (excluding Polpis Harbor and Coskata Pond), Nantucket.
7.16 square miles
SA (SFO)
Estuarine Bioassessments, Nitrogen, Total, Fecal Coliform
Impervious Surface/Parking Lot Runoff, On-site Treatment Systems (Septic Systems and Similar Decentralized Systems), Residential Districts, Source Unknown TRUE 51.0
Merrimack MA84A-31
South Branch Souhegan River
Headwaters, outlet Watatic Pond, Ashburnham to New Hampshire state line, Ashby. 3 miles B Escherichia Coli (E. Coli) Source Unknown TRUE 51.0
Merrimack MA84096 Ward Pond
PALIS id changed from 35094 to 84096 on October 10, 1997. (WBID from MA35094 to MA84096) Ashburnham. 54 acres B Dissolved Oxygen Source Unknown FALSE 51.0
Millers MA35024 Gales Pond Warwick. 12 acres B
Turbidity, Mercury in Fish Tissue
Source Unknown, Atmospheric Deposition - Toxics FALSE 58.7
Millers MA35035 Laurel Lake Erving/Warwick. 44 acres B Dissolved Oxygen Source Unknown FALSE 58.7
Millers MA35-16 Keyup Brook
Headwaters Great Swamp Northfield State Forest, Northfield, to confluence with Millers River, Erving. 5 miles B
PCBs In Fish Tissue, Escherichia Coli (E. Coli)
Contaminated Sediments, Releases from Waste Sites or Dumps, Source Unknown TRUE 58.5
Millers MA35111 Tully Lake Royalston/Athol. 214 acres B Harmful Algal Blooms Source Unknown TRUE 56.7
Quinebaug MA41033 Morse Pond Southbridge. 41 acres B
Aquatic Plants (Macrophytes), Dissolved Oxygen Source Unknown FALSE 56.0
Quinebaug MA41-16 Unnamed Tributary
Unnamed tributary to Mill Brook, headwaters, outlet Sherman Pond, Brimfield to mouth at confluence with Mill Brook, Brimfield. 1.2 miles B
Benthic Macroinvertebrates Bioassessments, Dissolved Oxygen, Sedimentation/Siltation, Escherichia Coli (E. Coli)
Source Unknown, Non-Point Source TRUE 48.7

8
Watershed Segment ID Name Segment Description Size Class
Impairment Causes (Likely NPS in italics) All Sources Pr
iorit
y N
PS
Caus
e
Recovery Potential Index Score
Quinebaug MA41-17 West Brook
Headwaters, west of the Dix Hill Road/Route 19 intersection (excluding intermittent portion), Brimfield to mouth at confluence with Mill Brook, Brimfield. 1.8 miles B Escherichia Coli (E. Coli) Source Unknown TRUE 48.7
Quinebaug MA41001 Alum Pond Sturbridge. 198 acres B Dissolved Oxygen Source Unknown FALSE 48.7
Westfield MA32-65
Middle Branch Westfield River
Source in Peru State Wildlife Management Area, north of Pierce Road, Peru to Kinnebrook Road, Dayville (locality in Chester). 13.7 miles
A (PWS, ORW, CWF) Temperature
Loss of Riparian Habitat, Source Unknown FALSE 58.2
Westfield MA32-13 West Falls Branch
Headwaters (perennial portion), at confluence with Bronson Brook, northeast at the intersection of Dingle Road and Route 143, Worthington to mouth at confluence with Westfield River near the village of West Chesterfield, Chesterfield. (formerly identified by the Massachusetts Stream Classification Program as West Branch). 2.9 miles B (CWF) Temperature
Source Unknown, Loss of Riparian Habitat FALSE 57.5
Westfield MA32-16 Little River
Headwaters, confluence of Watts and Wards streams, Ringville (locality in Worthington), to mouth at confluence with Westfield River, Huntington. 5.7 miles B Temperature
Loss of Riparian Habitat, Source Unknown FALSE 57.5
Westfield MA32-04 Westfield River
Headwaters, confluence of Drowned Land Brook and Center Brook, Savoy to confluence with Middle Branch Westfield River, Huntington. 33.1 miles
B (CWF, HQW)
Temperature, Enterococcus
Loss of Riparian Habitat, Source Unknown FALSE 57.5
Westfield MA32-41
Moose Meadow Brook
Outlet Westfield Reservoir to mouth at confluence with Westfield River, Westfield (formerly part of segment MA32-23). 4.8 miles B
Escherichia Coli (E. Coli), Fecal Coliform
Agriculture, Grazing in Riparian or Shoreline Zones TRUE 55.1
9
Watershed Segment ID Name Segment Description Size Class
Impairment Causes (Likely NPS in italics) All Sources Pr
iorit
y N
PS
Caus
e
Recovery Potential Index Score
Westfield MA32076
Windsor Pond Windsor. 46 acres B
Mercury in Fish Tissue, Dissolved Oxygen, Eurasian Water Milfoil, Myriophyllum spicatum
Atmospheric Deposition - Toxics, Source Unknown, Introduction of Non-native Organisms (Accidental or Intentional) FALSE 55.0
10
Figure 1: Output from the Recovery Potential Screening Tool
11
Table 2: Recovery Potential Screening Tool Indicator Setup
Indicator Type Indicator Name Weight
Ecological Indicator Confluences Imp/Unimp (#/impaired mi) (INSTATE) 1
Ecological Indicator Watershed % Forest (INSTATE) 1
Ecological Indicator Stream Corridor (30.5M) % Woody Veg (INSTATE) 1
Ecological Indicator Open Water Buffer (30.5M) % Woody Veg (INSTATE) 1
Ecological Indicator PHWA Watershed Health Index, State Percentile (2016) 1
Ecological Indicator Mean Index of Ecological Integrity (INSTATE) 1
Ecological Indicator % Rare Ecosystem in WS 1
Ecological Indicator Infiltration BMP Suitability (Ksat um/s) (INSTATE) 1
Stressor Indicator % Agriculture in WS (2016) 1
Stressor Indicator % Agriculture in RZ (2016) 1
Stressor Indicator % Pasture/Hay in WS (2016) 1
Stressor Indicator % Pasture/Hay in RZ (2016) 1
Stressor Indicator N Yield (lb/sqmi) (INSTATE) 1
Stressor Indicator P Yield (lb/sqmi) (INSTATE) 1
Stressor Indicator % Imperviousness, Mean in WS (2016) 1
Stressor Indicator Stream Corridor (61M) % Impervious (INSTATE) 1
Social Indicator % Protected Land, All Types (2019) 1
Social Indicator % Drinking Water Source Protection Area, Surface 1
Social Indicator Pathogens Nonpoint Control Projects Presence 1
Social Indicator Nutrients Nonpoint Control Projects Presence 1
Social Indicator Land Use Complexity (INSTATE) 1
Social Indicator NRCS Obligated Projects (#/sq. mi.) (INSTATE) 1
Social Indicator % Area not in MS4 (INSTATE) 1
Social Indicator 303d Vision Priority Flag 1
12
Table 3: List of Likely NPS Impairment Causes
Cause Algae Escherichia Coli (E. Coli) Bottom Deposits Flocculant Masses Phosphorus, Total Scum/Foam Turbidity Benthic Macroinvertebrates Bioassessments Dissolved Oxygen
Nutrient/Eutrophication Biological Indicators Sedimentation/Siltation Total Suspended Solids (TSS) Temperature Chloride Harmful Algal Blooms Fecal Coliform Enterococcus Transparency / Clarity Chlorophyll-a Dissolved Oxygen Supersaturation Fish Passage Barrier Estuarine Bioassessments Nitrogen, Total
Combined Biota/Habitat Bioassessments Alteration in stream-side or littoral vegetative covers Habitat Assessment Nutrients
13
Table 4: List of Priority NPS Impairment Causes (all related to pathogen or nutrient impairments)
Escherichia Coli (E. Coli) Algae Phosphorus, Total Nutrient/Eutrophication Biological Indicators Harmful Algal Blooms Chlorophyll-a Nitrogen, Total Nutrients

1