Embed Size (px)
Citation preview
PNNL- 16079
3.1.1.2 Feed Processing and Handling DL2 Final Report DC Elliott JK Magnuson CF Wend September 2006 Prepared for the U.S. Department of Energy under Contract DE-AC06-76RL01830
DISCLAIMER
This report was prepared as an account of work sponsored by an agency of the United States Government. Neither the United States Government nor any agency thereof, nor Battelle Memorial Institute, nor any of their employees, makes any warranty, express or implied, or assumes any legal liability or responsibility for the accuracy, completeness, or usefulness of any information, apparatus, product, or process disclosed, or represents that its use would not infringe privately owned rights. Reference herein to any specific commercial product, process, or service by trade name, trademark, manufacturer, or otherwise does not necessarily constitute or imply its endorsement, recommendation, or favoring by the United States Government or any agency thereof, or Battelle Memorial Institute. The views and opinions of authors expressed herein do not necessarily state or reflect those of the United States Government or any agency thereof.
PACIFIC NORTHWEST NATIONAL LABORATORY operated by BATTELLE
for the UNITED STATES DEPARTMENT OF ENERGY
under Contract DE-AC06-76RL01830
Printed in the United States of America
Available to DOE and DOE contractors from the Office of Scientific and Technical Information,
P.O. Box 62, Oak Ridge, TN 37831-0062; ph: (865) 576-8401 fax: (865) 576-5728
email: [email protected]
Available to the public from the National Technical Information Service, U.S. Department of Commerce, 5285 Port Royal Rd., Springfield, VA 22161
ph: (800) 553-6847 fax: (703) 605-6900
email: [email protected] online ordering: http://www.ntis.gov/ordering.htm
This document was printed on recycled paper. (8/00)
PNNL- 16079
3.1.1.2 Feed Processing and Handling DL2 Final Report DC Elliott JK Magnuson CF Wend September 2006 Prepared for the U.S. Department of Energy under Contract DE-AC06-76RL01830
Milestone Completion Report
ID#: 3.1.1.2DL2 Type: D
Completion Date: September 13, 2006 Scheduled Completion: September 15, 2006
Related Program C Milestone(s):
M 2.7.1, M 2.7.2, M 4.12.1, M 5.12.1
Milestone Title: Final Report Authors: Douglas C. Elliott, Jon K. Magnuson, Chris Wend, Antares Group Project Name: Project Leader:
Feed Processing and Handling (PNNL) Douglas C. Elliott
Key Words: Reviewed By: Don J. Stevens
EXECUTIVE SUMMARY
Purpose and Scope: Both current and future Sugars Biorefineries will have a wide variety of residue streams that can be used as feedstocks for Thermochemical processes. These feedstocks include off-spec materials, either corn or corn stover, or process residues such as corn fiber, lignin-rich residue streams or even materials such as distillers’ dried grain and solubles (DDG&S). The value and volumes of these residue streams in current and future Sugars Biorefineries will have significant impact on the potential for integration Thermochemical processes into the Sugar Biorefineries. Specifically, features such as the density, moisture content, physical form and mineral content of each of the potential Thermochemical feedstocks vary widely and will impact the specific unit operations for concentrating, consolidating and conveying the residue into feedstocks. There is the potential for integrating processes for concentrating the residues with pyrolysis technology to produce a liquid that can be pumped. This project will identify the volume and value of these potential Thermochemical feedstocks and define the process operations that will be required to convert these residue streams into Thermochemical feedstocks. This project will work with current producers of corn ethanol, staff at the National Laboratories, subcontractors, and other stakeholders to identify the current and potential residue streams. The composition (moisture content, ultimate and proximate analysis, ash composition) and physical properties (density, viscosity, particle size) of the residues from current sugars biorefineries will be measured. A second element of the task is to define the unit operations needed for concentrating, consolidating and conveying the residues into feedstocks, and then define specific equipment to conduct these unit operations. The alternatives to be evaluated include: 1) drying of wet residues for feeding to a low-pressure, high temperature process, such as gasification or pyrolysis
(work conducted at NREL), and 2) preparation of a pumpable slurry which can be pumped at high-pressure to a hydrothermal conversion process (the work at PNNL presented in this report). One component of the work will be to define the properties of the lignin-rich residue produced from a lignocellulosic sugars process. In particular, questions about the physical properties and processibility of this stream will need to be addressed. These properties will define the equipment that is needed to convert lignin-rich fermentation residues into a material that can be fed into a hydrothermal process such as the PNNL wet gasification.
Key results: This project involved assessing the biorefinery residue feedstock quality and availability, acquiring actual feedstock material and performing feed processing tests to better understand the handling properties of the wet residues relative to high-pressure feeding systems for hydrothermal processes, operating at up to 200 atm pressure (21 MPa). In order to assess feedstock quality and quantity, the in-house data at PNNL was collected and analyzed. In addition, a portion of the work was subcontracted (Antares Group Incorporated) to acquire the most currently available data on feedstock availability and pricing. The subcontracted work resulted in two reports: Quantifying Biomass Resources for Hydrothermal Processing I and II (attached as appendices to this report). Wet biorefinery residue material was acquired from the fungal processing team at PNNL and from commercial dry mill grain alcohol producers by way of sample storage from earlier ethanol stillage processing research at PNNL. The two materials were 1) a sample derived from fungal digestion of corn stover and subsequent recovery of the unconverted material and fungal biomass and 2) stillage from corn ethanol production. Pumping tests were performed in the Process Development Laboratories at PNNL using an array of feed preprocessing units and pump configurations. Biorefinery residue was also generated at PNNL using fungal processing technology under development at the lab. The feedstock was corn stover pellets acquired from the Idaho National Laboratory.
Conclusions: Our studies found a significant quantity of feedstock available for hydrothermal processing. The alternative use of hydrothermal processing for biosludges and corn milling co-products could provide industry with more options, which may be more cost-effective. Technology integration, based on the feedstock resources identified in this study, is feasible in pulp, paper and integrated mills and corn wet and dry-grind mills. On a wet basis, the study identified approximately 9.8 million tons/year of biosludge available in the U.S. through pulp and paper making processes. From wet corn milling 15.2 million and 4.5 million tons per year of potential feedstock were identified as wet gluten feed and wet gluten meal, respectively, for a total supply of approximately 19.8 million tons per year of U.S. production. In dry-grind corn ethanol mills, it is estimated the potential amount of feedstock is about 61.1 million tons per year of wet solids. With continued growth in this industry, this supply should increase dramatically in coming years. Although currently about 60% of dry-grind ethanol wet residues are dried, with increasing prices for natural gas, the cost/benefit ratio of drying the solids for marketing as animal feed is becoming less of an economic driver. It is expected that high energy costs will lead to increased availability of wet feedstock for alternate uses, such as hydrothermal processing to fuels. In total, the resource potential from processing pulp
and paper and corn processing residues is approximately 90.6 million tons in wet weight or about 20 million tons in dry weight annually, equivalent to 320 trillion Btu (0.3 quad) of energy resource. The numbers given above represent the current resource, based on existing technology. If the billion ton per year biomass utilization scenario comes to pass, based on wet processing systems, such as fermentation, the amount of unconverted residue stream will greatly increase the amount of feedstock available for hydrothermal processing. Generally speaking, the lignin and unconvertible feedstock portion is likely to be 40% of the biomass fed to the process. In that case the feedstock available for hydrothermal processing will be an order of magnitude higher than shown above. This material can be pumped to high pressures following sufficient preprocessing. Conversion of the material to useful fuels is also possible using processes such as the catalytic hydrothermal gasification technology under development at PNNL.
Recommendations: Since the available resource of wet biorefinery residues is large already and only expected to expand in the future, further work is recommended in hydrothermal process development to provide economical options of processing of wet biorefinery residues to useful products.
3.1.1.2 Feed Processing and Handling DL2 Final Report
Pacific Northwest National Laboratory
Purpose and Scope: Both current and future Sugars Biorefineries will have a wide variety of residue streams that can be used as feedstocks for Thermochemical processes. These feedstocks include off-spec materials, either corn or corn stover, or process residues such as corn fiber, lignin-rich residue streams or even materials such as distillers’ dried grain and solubles (DDG&S). The value and volumes of these residue streams in current and future Sugars Biorefineries will have significant impact on the potential for integration of Thermochemical processes into the Sugar Biorefineries. Specifically, features, such as the density, moisture content, physical form and mineral content of each of the potential Thermochemical feedstocks, vary widely and will impact the specific unit operations for concentrating, consolidating and conveying the residue into feedstocks. This project identified the volume and value of these potential Thermochemical feedstocks and defined the process operations that will be required to convert these residue streams into Thermochemical feedstocks. This project worked with current producers of corn ethanol, staff at the National Laboratories, subcontractors, and other stakeholders to identify the current and potential residue streams. The composition (moisture content, ultimate and proximate analysis, ash composition) and physical properties (density, viscosity, particle size) of the residues from current sugars biorefineries were measured. A second element of the task was to define the unit operations needed for concentrating, consolidating and conveying the residues into feedstocks, and then define specific equipment to conduct these unit operations. The alternatives evaluated included: 1) drying of wet residues for feeding to a low-pressure, high temperature process, such as gasification or pyrolysis (work conducted at NREL), and 2) preparation of a pumpable slurry, which can be pumped at high-pressure to a hydrothermal conversion process (the work at PNNL presented in this report). One component of the work was to define the properties of the lignin-rich residue produced from a lignocellulosic sugars process. In particular, questions about the physical properties and processibility of this stream needed to be addressed. These properties will define the equipment that is needed to convert lignin-rich fermentation residues into a material that can be fed into a hydrothermal process such as the PNNL wet gasification.
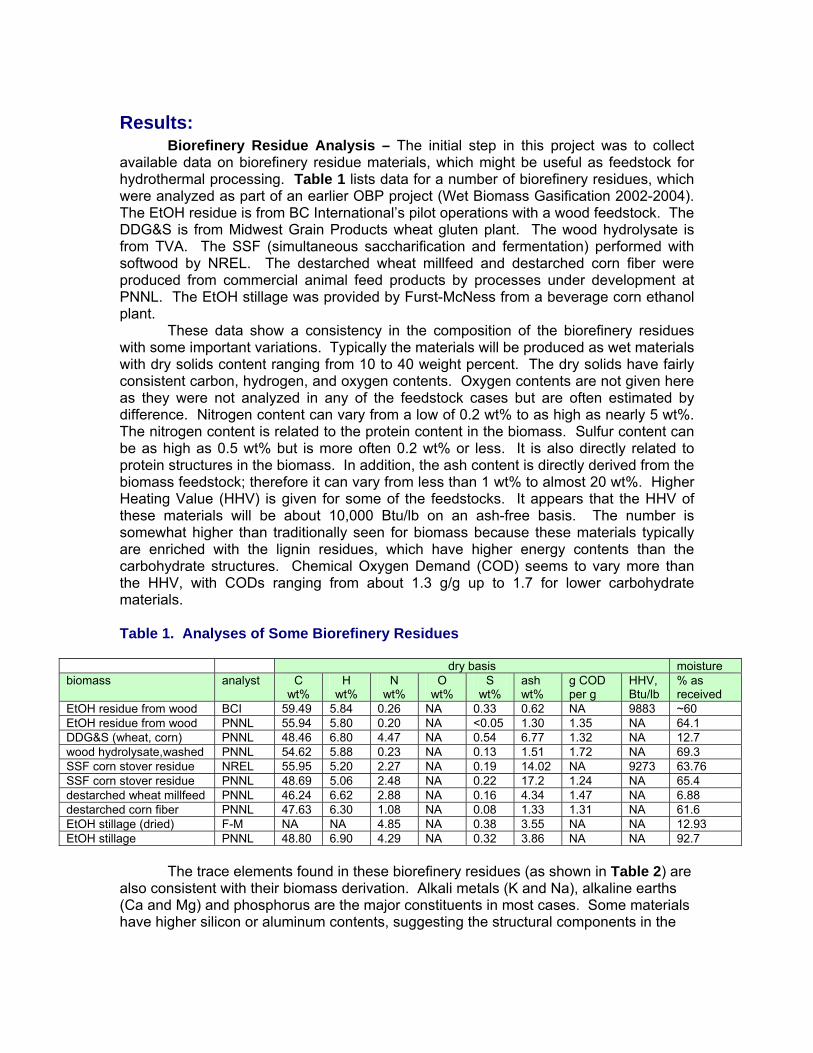
Results: Biorefinery Residue Analysis – The initial step in this project was to collect available data on biorefinery residue materials, which might be useful as feedstock for hydrothermal processing. Table 1 lists data for a number of biorefinery residues, which were analyzed as part of an earlier OBP project (Wet Biomass Gasification 2002-2004). The EtOH residue is from BC International’s pilot operations with a wood feedstock. The DDG&S is from Midwest Grain Products wheat gluten plant. The wood hydrolysate is from TVA. The SSF (simultaneous saccharification and fermentation) performed with softwood by NREL. The destarched wheat millfeed and destarched corn fiber were produced from commercial animal feed products by processes under development at PNNL. The EtOH stillage was provided by Furst-McNess from a beverage corn ethanol plant. These data show a consistency in the composition of the biorefinery residues with some important variations. Typically the materials will be produced as wet materials with dry solids content ranging from 10 to 40 weight percent. The dry solids have fairly consistent carbon, hydrogen, and oxygen contents. Oxygen contents are not given here as they were not analyzed in any of the feedstock cases but are often estimated by difference. Nitrogen content can vary from a low of 0.2 wt% to as high as nearly 5 wt%. The nitrogen content is related to the protein content in the biomass. Sulfur content can be as high as 0.5 wt% but is more often 0.2 wt% or less. It is also directly related to protein structures in the biomass. In addition, the ash content is directly derived from the biomass feedstock; therefore it can vary from less than 1 wt% to almost 20 wt%. Higher Heating Value (HHV) is given for some of the feedstocks. It appears that the HHV of these materials will be about 10,000 Btu/lb on an ash-free basis. The number is somewhat higher than traditionally seen for biomass because these materials typically are enriched with the lignin residues, which have higher energy contents than the carbohydrate structures. Chemical Oxygen Demand (COD) seems to vary more than the HHV, with CODs ranging from about 1.3 g/g up to 1.7 for lower carbohydrate materials. Table 1. Analyses of Some Biorefinery Residues
dry basis moisture biomass analyst C
wt% H
wt% N
wt% O
wt% S
wt% ash wt%
g COD per g
HHV, Btu/lb
% as received
EtOH residue from wood BCI 59.49 5.84 0.26 NA 0.33 0.62 NA 9883 ~60 EtOH residue from wood PNNL 55.94 5.80 0.20 NA <0.05 1.30 1.35 NA 64.1 DDG&S (wheat, corn) PNNL 48.46 6.80 4.47 NA 0.54 6.77 1.32 NA 12.7 wood hydrolysate,washed PNNL 54.62 5.88 0.23 NA 0.13 1.51 1.72 NA 69.3 SSF corn stover residue NREL 55.95 5.20 2.27 NA 0.19 14.02 NA 9273 63.76 SSF corn stover residue PNNL 48.69 5.06 2.48 NA 0.22 17.2 1.24 NA 65.4 destarched wheat millfeed PNNL 46.24 6.62 2.88 NA 0.16 4.34 1.47 NA 6.88 destarched corn fiber PNNL 47.63 6.30 1.08 NA 0.08 1.33 1.31 NA 61.6 EtOH stillage (dried) F-M NA NA 4.85 NA 0.38 3.55 NA NA 12.93 EtOH stillage PNNL 48.80 6.90 4.29 NA 0.32 3.86 NA NA 92.7
The trace elements found in these biorefinery residues (as shown in Table 2) are also consistent with their biomass derivation. Alkali metals (K and Na), alkaline earths (Ca and Mg) and phosphorus are the major constituents in most cases. Some materials have higher silicon or aluminum contents, suggesting the structural components in the
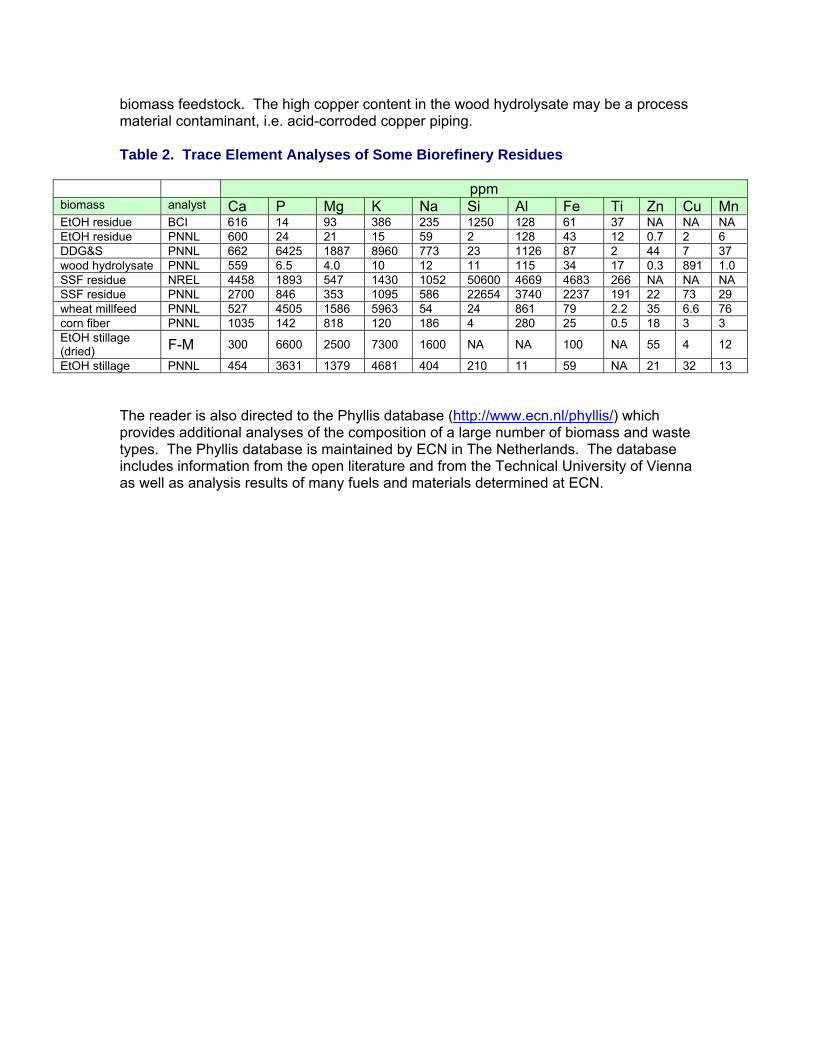
biomass feedstock. The high copper content in the wood hydrolysate may be a process material contaminant, i.e. acid-corroded copper piping. Table 2. Trace Element Analyses of Some Biorefinery Residues
ppm biomass analyst Ca P Mg K Na Si Al Fe Ti Zn Cu MnEtOH residue BCI 616 14 93 386 235 1250 128 61 37 NA NA NA EtOH residue PNNL 600 24 21 15 59 2 128 43 12 0.7 2 6 DDG&S PNNL 662 6425 1887 8960 773 23 1126 87 2 44 7 37 wood hydrolysate PNNL 559 6.5 4.0 10 12 11 115 34 17 0.3 891 1.0 SSF residue NREL 4458 1893 547 1430 1052 50600 4669 4683 266 NA NA NA SSF residue PNNL 2700 846 353 1095 586 22654 3740 2237 191 22 73 29 wheat millfeed PNNL 527 4505 1586 5963 54 24 861 79 2.2 35 6.6 76 corn fiber PNNL 1035 142 818 120 186 4 280 25 0.5 18 3 3 EtOH stillage (dried) F-M 300 6600 2500 7300 1600 NA NA 100 NA 55 4 12
EtOH stillage PNNL 454 3631 1379 4681 404 210 11 59 NA 21 32 13 The reader is also directed to the Phyllis database (http://www.ecn.nl/phyllis/) which provides additional analyses of the composition of a large number of biomass and waste types. The Phyllis database is maintained by ECN in The Netherlands. The database includes information from the open literature and from the Technical University of Vienna as well as analysis results of many fuels and materials determined at ECN.

Pumping of Biorefinery Residues – The portion of this Feed Processing and Handling project assigned to PNNL was focused on the wet residues from biorefineries and their utilization. Drying of these materials before use in a thermochemical conversion process can have a large negative impact on the overall process efficiency. The use of the wet feedstocks without drying can be accomplished through hydrothermal processing. Hydrothermal processing is the use of a water-based environment in order to thermochemically convert the biorefinery residue to value-added fuels and products. Typical hydrothermal processing conditions include temperatures in excess of 100°C and up to 350°C. In order to perform hydrothermal processing a pressurized system is required to minimize the vaporization of the water and the resulting energy requirement. Pressures in excess of 50 atm are common and up to 200 atm are used. Pumping of the wet biorefinery residues at these pressures is a key barrier to utilization. In fact, the pumping of wet biomass slurries is well-known. For example, the pulp and paper industry moves slurries through their facilities, but only at lower pressures. The use of pressurized systems at higher pressures and temperatures leads into processing territory with limited commercial experience, which remains a technological challenge.1 When considering capital costs for such systems, it is obvious that more concentrated feedstock slurries should require smaller processing systems for equivalent throughput and resulting lower capital costs. Similarly, higher temperature will lead to higher reaction rate also resulting in reduced reactor size and cost. However, higher temperature will require higher pressure to maintain a liquid water phase for slurry transport in the hydrothermal system. Therefore, the economic drivers for capital cost reduction in hydrothermal processes, higher slurry concentrations and higher operating pressures both lead to increasing difficulties for pumping. High-pressure feeding systems for biomass slurries have been recognized as a process development issue at least as long as the modern biomass conversion systems have been under development since the Arab oil embargo of 1973. Pumping of slurries of biomass was accomplished at the laboratory scale at several sites, but in all cases the slurry concentration was limited. Early work at the Pittsburgh Energy Research Center (PERC) suggests, “Perhaps the areas (sic) of greatest operational difficulty in the bench-scale plant involves the pumping of the waste slurry.”2 As a result, they could only process at up to 15% dry solids of garbage in water slurry. Yet, “This pumping problem is not anticipated in large-scale operation.” But, “It is doubtful, however, because of the low bulk density of dried organic refuse, that slurries containing greater than 30 weight percent solids can be pumped (even in commercial installations).” Similar results were reported in the larger scale plant operated for the Department of Energy at Albany, Oregon, for the production of oil from wood flour. In that final report3 it is disclosed that wood flour (-60 mesh) could be pumped at up to 10% in either oil or water. Attempts to prehydrolyze the wood at concentrations up to 23% were accomplished (with either flour or chips) but the prehydrolyzed feed needed to be diluted back to 12% in water for high-pressure pumping in order to avoid plugging. Both of these cases used progressing
1 Matsumura, Y.; Minowa, T.; Potic, B.; Kersten, S.R.A.; Prins, W.; van Swaaiij, W.P.M.; van de Beld, B.; Elliott, D.C.; Neuenschwander, G.G.; Kruse, A.; Antal, M.J., Jr. Biomass Gasification in near- and super-critical water: Status and Prospects. Biomass and Bioenergy, 29, 269-292, 2005. 2 Wender, I.; Steffgen, F.W.; Yavorsky, P.M. Clean Liquid and Gaseous Fuels from Organic Solid Wastes, In: Recycling and Disposal of Solid Waste, M.E. Henstock, ed. Pp. 43-99, Pergamon Press, New Elmsford, NY, 1975. 3 Rust International Corporation, Final Report: An Investigation of Liquefaction of Wood at the Biomass Liquefaction Facility, report # PNL-5114, April 1982.
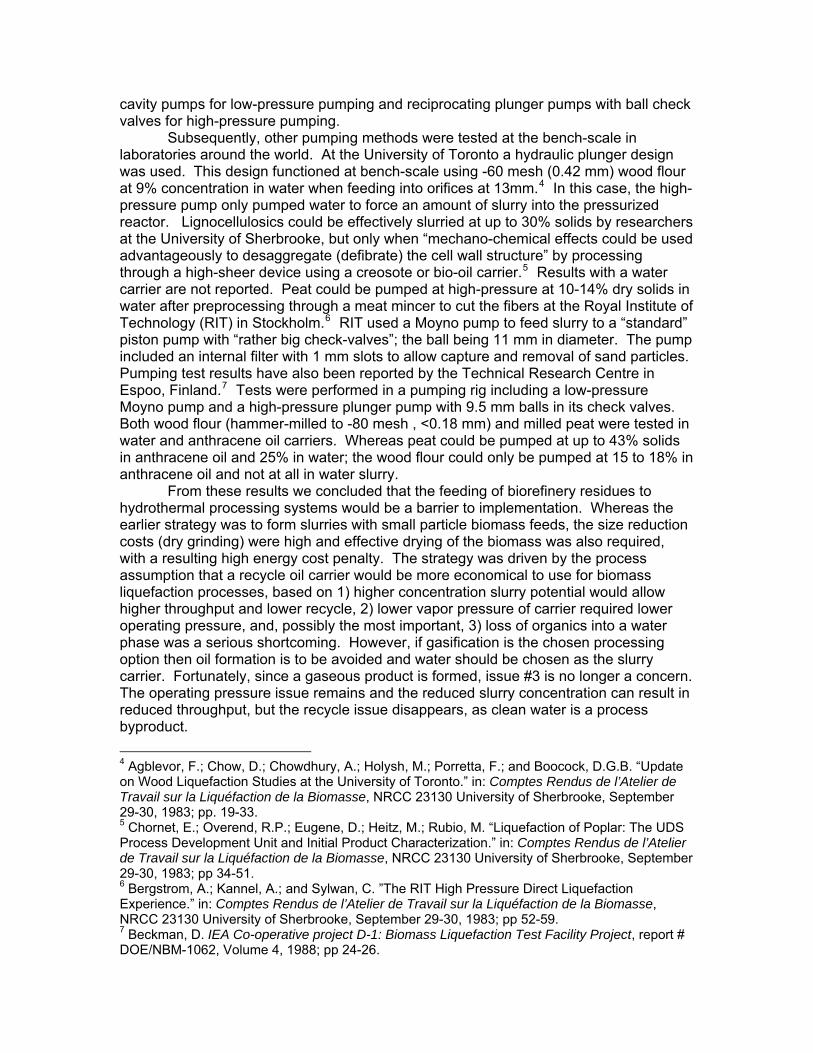
cavity pumps for low-pressure pumping and reciprocating plunger pumps with ball check valves for high-pressure pumping. Subsequently, other pumping methods were tested at the bench-scale in laboratories around the world. At the University of Toronto a hydraulic plunger design was used. This design functioned at bench-scale using -60 mesh (0.42 mm) wood flour at 9% concentration in water when feeding into orifices at 13mm.4 In this case, the high-pressure pump only pumped water to force an amount of slurry into the pressurized reactor. Lignocellulosics could be effectively slurried at up to 30% solids by researchers at the University of Sherbrooke, but only when “mechano-chemical effects could be used advantageously to desaggregate (defibrate) the cell wall structure” by processing through a high-sheer device using a creosote or bio-oil carrier.5 Results with a water carrier are not reported. Peat could be pumped at high-pressure at 10-14% dry solids in water after preprocessing through a meat mincer to cut the fibers at the Royal Institute of Technology (RIT) in Stockholm.6 RIT used a Moyno pump to feed slurry to a “standard” piston pump with “rather big check-valves”; the ball being 11 mm in diameter. The pump included an internal filter with 1 mm slots to allow capture and removal of sand particles. Pumping test results have also been reported by the Technical Research Centre in Espoo, Finland.7 Tests were performed in a pumping rig including a low-pressure Moyno pump and a high-pressure plunger pump with 9.5 mm balls in its check valves. Both wood flour (hammer-milled to -80 mesh , <0.18 mm) and milled peat were tested in water and anthracene oil carriers. Whereas peat could be pumped at up to 43% solids in anthracene oil and 25% in water; the wood flour could only be pumped at 15 to 18% in anthracene oil and not at all in water slurry. From these results we concluded that the feeding of biorefinery residues to hydrothermal processing systems would be a barrier to implementation. Whereas the earlier strategy was to form slurries with small particle biomass feeds, the size reduction costs (dry grinding) were high and effective drying of the biomass was also required, with a resulting high energy cost penalty. The strategy was driven by the process assumption that a recycle oil carrier would be more economical to use for biomass liquefaction processes, based on 1) higher concentration slurry potential would allow higher throughput and lower recycle, 2) lower vapor pressure of carrier required lower operating pressure, and, possibly the most important, 3) loss of organics into a water phase was a serious shortcoming. However, if gasification is the chosen processing option then oil formation is to be avoided and water should be chosen as the slurry carrier. Fortunately, since a gaseous product is formed, issue #3 is no longer a concern. The operating pressure issue remains and the reduced slurry concentration can result in reduced throughput, but the recycle issue disappears, as clean water is a process byproduct. 4 Agblevor, F.; Chow, D.; Chowdhury, A.; Holysh, M.; Porretta, F.; and Boocock, D.G.B. “Update on Wood Liquefaction Studies at the University of Toronto.” in: Comptes Rendus de l’Atelier de Travail sur la Liquéfaction de la Biomasse, NRCC 23130 University of Sherbrooke, September 29-30, 1983; pp. 19-33. 5 Chornet, E.; Overend, R.P.; Eugene, D.; Heitz, M.; Rubio, M. “Liquefaction of Poplar: The UDS Process Development Unit and Initial Product Characterization.” in: Comptes Rendus de l’Atelier de Travail sur la Liquéfaction de la Biomasse, NRCC 23130 University of Sherbrooke, September 29-30, 1983; pp 34-51. 6 Bergstrom, A.; Kannel, A.; and Sylwan, C. ”The RIT High Pressure Direct Liquefaction Experience.” in: Comptes Rendus de l’Atelier de Travail sur la Liquéfaction de la Biomasse, NRCC 23130 University of Sherbrooke, September 29-30, 1983; pp 52-59. 7 Beckman, D. IEA Co-operative project D-1: Biomass Liquefaction Test Facility Project, report # DOE/NBM-1062, Volume 4, 1988; pp 24-26.

By using wet biomass as the feed, size reduction can be accomplished in a lower cost wet grinding process step. Such results have been reported by our lab wherein sorghum stalks were chopped and processed through a wet ball mill and filtered through an 18 mesh screen to produce a slurry pumpable at up to 21 MPa.8 The pump was a reciprocating plunger pump with 9.5 mm ball check valves, which was operated at 0.5 to 2.0 liters/hr. The sorghum slurry was produced at 4 to 6 % dry solids and was a stable slurry, which did not settle out. Similar stable slurries of micro-crystalline cellulose in water could not be formed and would always settle out, even with the addition of corn starch. Pumpable slurries of brewer’s spent grain were also produced by this method wherein the final percentage of dry solids was 7.5 to 9.2 %.9 Subsequently, tests were also performed with potato crumbs from a french fry manufacturing operation. These could be pumped following the wet milling operation at 14% dry solids slurry content.10 More recent tests have been made using this same preprocessing system to produce pumpable feed from the screened solids from dairy manure (at 3.5% dry solids) and Distillers Dried Grain and Solubles (rewetted to 5 to 9.5 % dry solids slurries). In these tests a progressing cavity (Moyno) pump was used as the low-pressure feed to the high-pressure reciprocating plunger pump. Similar DDG&S slurries (at 2.5 to 5.5% dry solids) were pumped in a larger scale system with reciprocating plunger pump (16 mm ball check valve) without the low-pressure Moyno pump at rates from 5 to 12 liters/hr. However, there were some inconsistencies in the pumping (which would probably have been overcome by the use of the Moyno).11 Most recently a high-pressure syringe pump (Isco) has been used to feed biomass slurries. The pump can feed at up to 10 liters/hr at 21 MPa with a dual piston arrangement, which allows automatic refilling for uninterrupted feeding; however, the uninterrupted feed rate is limited to only 8 liters/hr because of the fill rate. This pump has been used to feed wastewater treatment biosludge at 1.5 to 5 % dry solids. The biosludge was initially recovered as a 1.5% slurry or a dewatered sludge with about 14% dry solids, which was remixed with the dilute slurry to form the 5% dry solids material. Corn ethanol stillage (10.8 % dry solids), which has been homogenized with an in-line sheer mixer unit (Arde Barinco) has also been effectively pumped with the syringe pump. Similarly, a wheat mill-feed (dry mill byproduct) was also pumped at a concentration of 7.6 wt% dry solids in water slurry after wet ball milling. Others have also reported pumping of biomass slurries at high-pressure in the laboratory. The University of Hawaii reported that biomass slurries were fed to high-pressure reactor systems; in the two cases the pump used water as a hydraulic medium to push the biomass slurry, such that the pump only pumped water and not slurry. In one unit, water was pumped into a balloon inside a vessel filled with biosludge to force
8 Elliott, D.C.; Sealock, L.J., Jr.; Butner, R.S.; Baker, E.G.; Neuenschwander, G.G. Low-Temperature Conversion of High-Moisture Biomass: Continuous Reactor System Results. report # PNL-7126, Pacific Northwest National Laboratory, Richland, Washington, 1989. 9 Baker, E.G.; Butner, R.S.; Sealock, L.J., Jr.; Elliott, D.C.; Neuenschwander, G.G. Themocatalytic Conversion of Food Processing Wastes: Topical Report FY 1988. report # PNL-6784, Pacific Northwest National Laboratory, Richland, Washington, 1989. 10 Elliott, D.C.; Hart, T.R.; Neuenschwander, G.G.; Deverman, G.S.; Werpy, T.A.; Phelps, M.R.; Baker, E.G.; Sealock, L.J., Jr. Low-Temperature Catalytic Gasification of Wet Industrial Wastes. report # PNL-10513, Pacific Northwest National Laboratory, Richland, Washington, 1995. 11 Elliott, D.C.; Neuenschwander, G.G.; Hart, T.R.; Butner, R.S.; Zacher, A.H.; Engelhard, M.H.; Young, J.S.; McCready, D.E. Chemical Processing in High-Pressure Aqueous Environments. 7. Process Development for Catalytic Gasification of Wet Biomass Feedstocks. Industrial and Engineering Chemistry Research, 43, #9, 1999-2004; 2004.
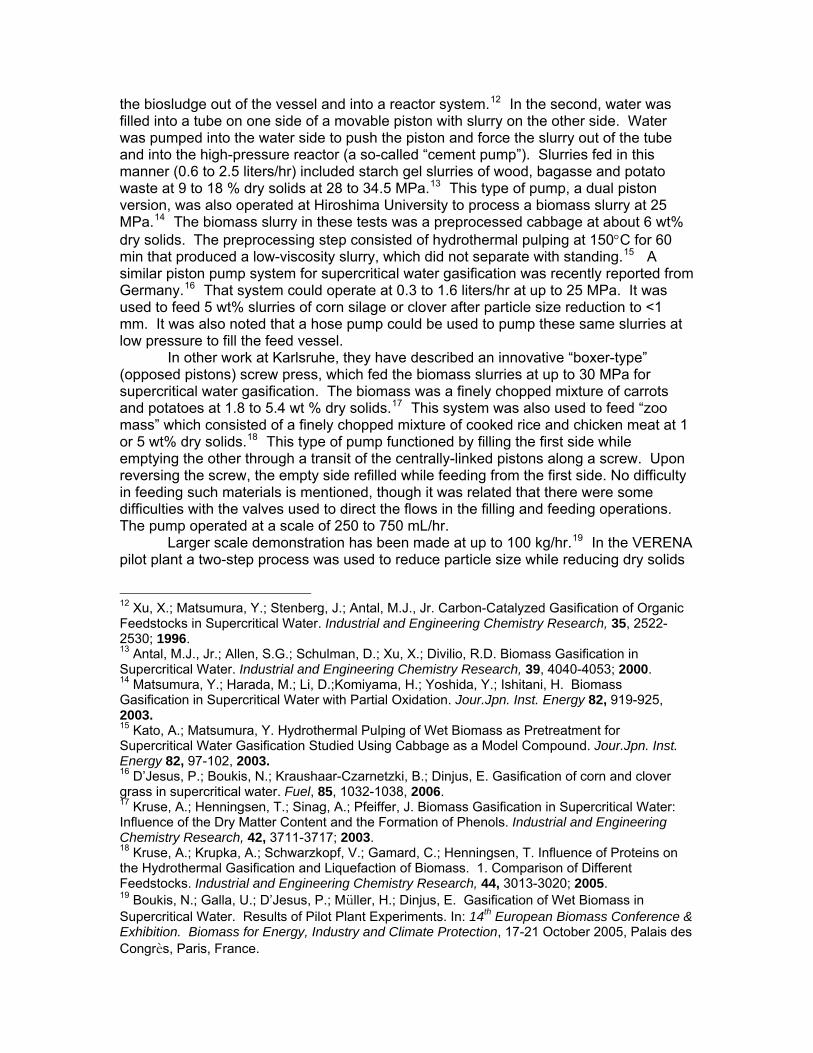
the biosludge out of the vessel and into a reactor system.12 In the second, water was filled into a tube on one side of a movable piston with slurry on the other side. Water was pumped into the water side to push the piston and force the slurry out of the tube and into the high-pressure reactor (a so-called “cement pump”). Slurries fed in this manner (0.6 to 2.5 liters/hr) included starch gel slurries of wood, bagasse and potato waste at 9 to 18 % dry solids at 28 to 34.5 MPa.13 This type of pump, a dual piston version, was also operated at Hiroshima University to process a biomass slurry at 25 MPa.14 The biomass slurry in these tests was a preprocessed cabbage at about 6 wt% dry solids. The preprocessing step consisted of hydrothermal pulping at 150°C for 60 min that produced a low-viscosity slurry, which did not separate with standing.15 A similar piston pump system for supercritical water gasification was recently reported from Germany.16 That system could operate at 0.3 to 1.6 liters/hr at up to 25 MPa. It was used to feed 5 wt% slurries of corn silage or clover after particle size reduction to <1 mm. It was also noted that a hose pump could be used to pump these same slurries at low pressure to fill the feed vessel. In other work at Karlsruhe, they have described an innovative “boxer-type” (opposed pistons) screw press, which fed the biomass slurries at up to 30 MPa for supercritical water gasification. The biomass was a finely chopped mixture of carrots and potatoes at 1.8 to 5.4 wt % dry solids.17 This system was also used to feed “zoo mass” which consisted of a finely chopped mixture of cooked rice and chicken meat at 1 or 5 wt% dry solids.18 This type of pump functioned by filling the first side while emptying the other through a transit of the centrally-linked pistons along a screw. Upon reversing the screw, the empty side refilled while feeding from the first side. No difficulty in feeding such materials is mentioned, though it was related that there were some difficulties with the valves used to direct the flows in the filling and feeding operations. The pump operated at a scale of 250 to 750 mL/hr. Larger scale demonstration has been made at up to 100 kg/hr.19 In the VERENA pilot plant a two-step process was used to reduce particle size while reducing dry solids
12 Xu, X.; Matsumura, Y.; Stenberg, J.; Antal, M.J., Jr. Carbon-Catalyzed Gasification of Organic Feedstocks in Supercritical Water. Industrial and Engineering Chemistry Research, 35, 2522-2530; 1996. 13 Antal, M.J., Jr.; Allen, S.G.; Schulman, D.; Xu, X.; Divilio, R.D. Biomass Gasification in Supercritical Water. Industrial and Engineering Chemistry Research, 39, 4040-4053; 2000. 14 Matsumura, Y.; Harada, M.; Li, D.;Komiyama, H.; Yoshida, Y.; Ishitani, H. Biomass Gasification in Supercritical Water with Partial Oxidation. Jour.Jpn. Inst. Energy 82, 919-925, 2003. 15 Kato, A.; Matsumura, Y. Hydrothermal Pulping of Wet Biomass as Pretreatment for Supercritical Water Gasification Studied Using Cabbage as a Model Compound. Jour.Jpn. Inst. Energy 82, 97-102, 2003. 16 D’Jesus, P.; Boukis, N.; Kraushaar-Czarnetzki, B.; Dinjus, E. Gasification of corn and clover grass in supercritical water. Fuel, 85, 1032-1038, 2006. 17 Kruse, A.; Henningsen, T.; Sinag, A.; Pfeiffer, J. Biomass Gasification in Supercritical Water: Influence of the Dry Matter Content and the Formation of Phenols. Industrial and Engineering Chemistry Research, 42, 3711-3717; 2003. 18 Kruse, A.; Krupka, A.; Schwarzkopf, V.; Gamard, C.; Henningsen, T. Influence of Proteins on the Hydrothermal Gasification and Liquefaction of Biomass. 1. Comparison of Different Feedstocks. Industrial and Engineering Chemistry Research, 44, 3013-3020; 2005. 19 Boukis, N.; Galla, U.; D’Jesus, P.; Müller, H.; Dinjus, E. Gasification of Wet Biomass in Supercritical Water. Results of Pilot Plant Experiments. In: 14th European Biomass Conference & Exhibition. Biomass for Energy, Industry and Climate Protection, 17-21 October 2005, Palais des Congrès, Paris, France.

content of corn silage to a pumpable level. A cutting mill was used first to reduce particle size to a few mm followed by a colloid mill which produced a slurry with 84% of the mass at less than 0.5 mm and an organic carbon content of 3.96 wt %. This system could be operated at up to 35 MPa, but the details of the pump are not given. As related earlier, the high-pressure feeding of biomass slurries should be more readily achieved at larger flow rates wherein the fibrous nature of the biomass would not be expected to bridge and plug the orifices and valves.

Quantifying Biomass Resources for Hydrothermal Processing – A study (see Appendix 1) was undertaken via subcontract by Antares Group Inc. to provide a nationwide feedstock assessment. The assessment provided a clear snapshot of the amount and location of select sources of feedstock. Although potential resource streams include animal manures (especially dairy and swine), corn wet and dry mill co-products, paper mill sludge, food processing sludge, municipal wastewater sludge and chemical processing sludge, in order to focus on OBP priorities this study was limited to sludges generated through the pulp and paper making process (not including black liquor) and co-products of the corn milling industry. The study identified U.S. pulp and paper and corn milling facilities on a state-level basis and evaluated the biomass feedstock generating potential of these facilities. The study found a significant quantity of feedstock available for possible hydrothermal processing. Such use for the sludges and corn milling co-products could provide each industry with more options, which, in some cases, may be more cost effective. Technology integration, based on the identification of feedstock resources found, is feasible in pulp, paper, and integrated mills and corn wet- and dry-grind mills. On a wet weight basis, the study identified approximately 9.8 million tons per year of sludge available in the U.S. through the pulp and paper making process. For wet milling, 15.2 million and 4.5 million tons per year of potential feedstock from wet gluten feed and wet gluten meal, respectively, for a total supply of approximately 19.8 million tons per year. As for dry mills, the amount of potential whole stillage feedstock is about 61.1 million tons per year. With continued long-term growth expected in ethanol production, feedstock from dry-grind ethanol mills should rise further in the future. In all, the estimate is a total annual feedstock resource from these industries of approximately 90.8 million tons in wet weight or about 20 million tons in dry weight. A second phase (see Appendix 2) of the subcontract focused on the corn dry-grind ethanol facility. The study found that the ethanol industry has more than doubled in production since 2000. As of January 2005, 81 ethanol plants were in operation, with production capacity of 3,644 million gallons per year. Nearly 95 percent of the U.S. ethanol comes from corn. Of the corn-ethanol plants in operation, approximately two-thirds are dry mills. Because a dry-grind plant is cheaper to build and generally more efficient to operate with respect to ethanol production, it is logical that future growth will come in the form of dry-grind corn plants. As dry-grind ethanol production increases, a proportionate growth will occur for its co-products, wet distillers grains (WDG) as well as the dried version, distiller’s dried grains and solubles (DDGS). An ethanol plant’s economic viability depends strongly on finding revenue-making markets for its co-products. If additional DDGS/WDG supplies exceed the demand of traditional markets, ethanol plant managers may need to consider other options such as hydrothermal processing to fuels and chemicals. Currently, DDGS is used primarily as a high quality feedstuff for dairy cattle, beef cattle, swine, and poultry. Using a conversion factor of 18 lbs DDGS per bushel of corn processed to ethanol, the maximum potential market in the U.S. was determined as 10.2 million tons (at 10% moisture), assuming that all distiller’s grains are dried. Actually only about 60% of WDG are sold as DDGS while the remaining is sold as WDG. The DDGS competes with corn, soybean meal, and dicalcium phosphate in animal feed markets as a source of protein and phosphorus. It has a long shelf-life and is easily transported around the country. The U.S. domestic market accounts for about 75% of production, while the remaining 25% is sold into international markets. Exports are growing at a moderate rate, although not nearly fast enough to keep up with DDGS supply growth.
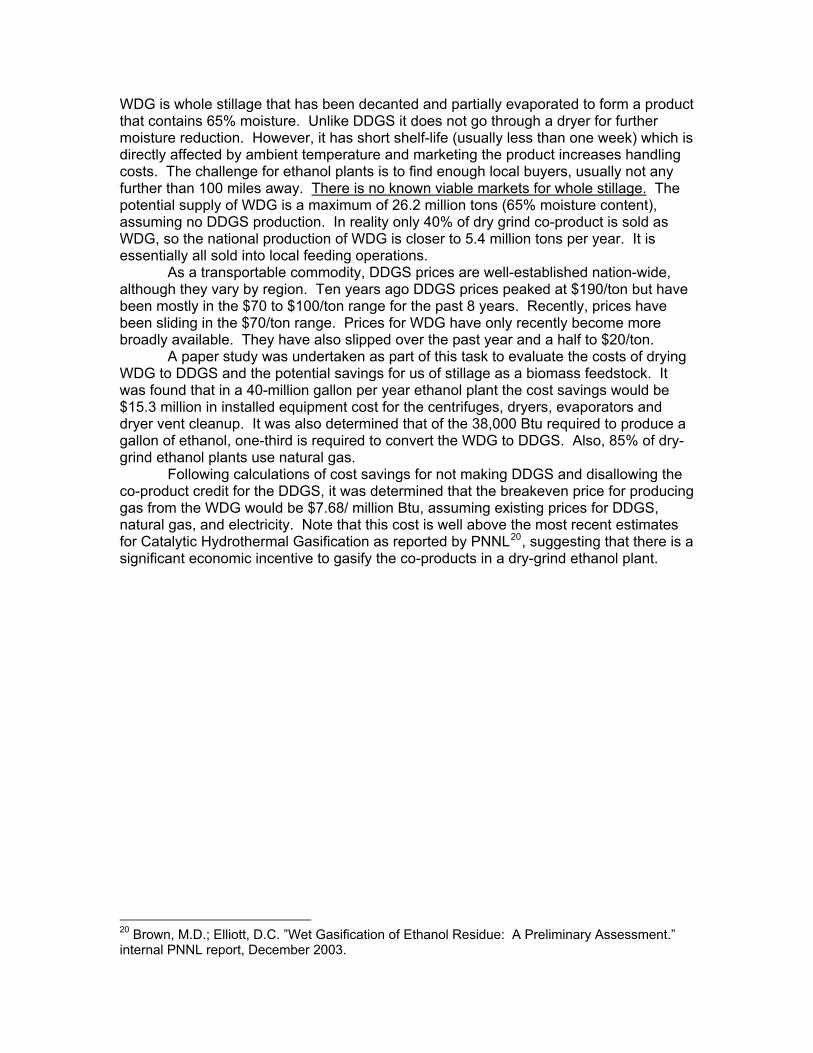
WDG is whole stillage that has been decanted and partially evaporated to form a product that contains 65% moisture. Unlike DDGS it does not go through a dryer for further moisture reduction. However, it has short shelf-life (usually less than one week) which is directly affected by ambient temperature and marketing the product increases handling costs. The challenge for ethanol plants is to find enough local buyers, usually not any further than 100 miles away. There is no known viable markets for whole stillage. The potential supply of WDG is a maximum of 26.2 million tons (65% moisture content), assuming no DDGS production. In reality only 40% of dry grind co-product is sold as WDG, so the national production of WDG is closer to 5.4 million tons per year. It is essentially all sold into local feeding operations. As a transportable commodity, DDGS prices are well-established nation-wide, although they vary by region. Ten years ago DDGS prices peaked at $190/ton but have been mostly in the $70 to $100/ton range for the past 8 years. Recently, prices have been sliding in the $70/ton range. Prices for WDG have only recently become more broadly available. They have also slipped over the past year and a half to $20/ton. A paper study was undertaken as part of this task to evaluate the costs of drying WDG to DDGS and the potential savings for us of stillage as a biomass feedstock. It was found that in a 40-million gallon per year ethanol plant the cost savings would be $15.3 million in installed equipment cost for the centrifuges, dryers, evaporators and dryer vent cleanup. It was also determined that of the 38,000 Btu required to produce a gallon of ethanol, one-third is required to convert the WDG to DDGS. Also, 85% of dry-grind ethanol plants use natural gas. Following calculations of cost savings for not making DDGS and disallowing the co-product credit for the DDGS, it was determined that the breakeven price for producing gas from the WDG would be $7.68/ million Btu, assuming existing prices for DDGS, natural gas, and electricity. Note that this cost is well above the most recent estimates for Catalytic Hydrothermal Gasification as reported by PNNL20, suggesting that there is a significant economic incentive to gasify the co-products in a dry-grind ethanol plant.
20 Brown, M.D.; Elliott, D.C. ”Wet Gasification of Ethanol Residue: A Preliminary Assessment.” internal PNNL report, December 2003.
Production of Lignin-Rich Biorefinery Feedstock by Fungal Processing -- The purpose of this sub-task was to examine the effects of culturing a plant biomass utilizing filamentous fungus on corn stover to digest the polysaccharide components (cellulose and hemicellulose) of corn stover and metabolize the released sugars. The goal was to reduce the sugar content and enrich the lignin fraction, resulting in a high solids slurry that could be fed to a hydrothermal process. Aspergillus niger and Trichoderma reesei were the two fungal species chosen for examination due to their natural ecological roles as soil saprobic fungi, their large complement of glycosyl hydrolases (150-200 genes) as revealed by genome sequences, and their economic importance as producers of organic acids and enzymes from plant derived sugars. Media and Fungal Strain Selection Initially, shake flask cultures were used to examine different media and two species of fungi. All media contained 4% (w/v; as received weight) corn stover with various nutritional supplements. The corn stover, courtesy of Idaho National Laboratory, had been hammer-milled to pass through a ¼″ screen. The “inorganic” supplement consisted of final concentrations in the media of 30 mM NH4Cl, 4 mM KH2PO4, 0.1 mM MgSO4, 0.1 mM CaCl2 and a trace metal solution containing 1-10 μM Fe, Zn, Co, and Cu. The “organic” supplement consisted of 0.15% D-xylose and 0.15% yeast extract to stimulate initial growth of the fungus and maximum protein (enzyme) production. Media were inoculated with 106 spores per ml of either T. reesei (ATCC 56765) or A. niger (ATCC 1015). The cultures were examined for growth and expression of various glycosyl hydrolases. Selected endo- and exo-acting glycosyl hydrolases active on cellullose and hemicellulose were determined with colorimetric assays. The endo-acting cellulase and xylanase activities were assayed with covalently modified azo dye polysaccharides carboxymethylcellulose and wheat arabinoxylan (Megazyme® substrates) respectively. The β-glucosidase, β-xylosidase and α-arabinofuranosidase activities were assayed with the appropriate para-nitrophenyl glycosides. The fungi grew with or without the supplements, and further media optimization could have been performed, but determining the most economical media formulation was not the purpose of this task. More consistent expression of the glycosyl hydrolases necessary for cellulose and hemicellulose hydrolysis were obtained with the nutrient supplements, so they were included in the stirred-tank fermentations. Also, A. niger gave higher levels of the enzyme activities tested, so this fungus was selected for subsequent fermentations. The other treatment option examined in shake flasks was pre-treatment of the corn stover slurry with commercial cellulase and xylanase mixtures before inoculation with the fungal spores. This option was examined to obtain maximum depletion of the cellulose and hemicellulose fraction and potentially provide free sugars or oligosaccharides to accelerate the growth of the fungi. The enzymes used were Dyadic 2XP and NCE-2X, which are marketed as xylanase and cellulase preparation, respectively. The corn stover slurry was incubated with the 0.5 g/L of each enzyme mixture for three days at 50°C, then autoclaved to inactivate the introduced enzymes before inoculation with the fungal spores, so that enzyme assays performed on samples would reflect activities expressed by the fungus and not residual activity. Fungal growth was good on the enzyme pre-treated material and since the purpose of this task was to obtain maximum polysaccharide hydrolysis, this pre-treatment was included in subsequent fermentations.
Stirred Tank Fermentations Laboratory scale stirred-tank fermentors mimic conditions commonly used in commercial biological processes. They are also large enough to provide the volume of material necessary for the downstream processing experiments. Initially, a 10-liter working volume New Brunswick fermentor was used to examine the behavior of the fungus growing on corn stover in a stirred tank fermentor before proceeding to 30-liter fermentors for preparation of greater quantities of lignin enriched corn stover. The corn stover used in the fermentors was pre-processed as a wet slurry in a ball mill to a fine consistency (≤35 mesh screen) and a magnet passed through the resulting slurry to remove the bulk of the metal (stainless steel) shavings resulting from the milling. This corn stover slurry was autoclaved and stored at 4°C. The fermentor was charged with 7 liters of “corn stover media”, which contains ~2% (w/v) dry weight corn stover plus the inorganic and organic supplements, and autoclaved. Commercial cellulase and xylanase enzymes were added at 0.5 g/l each and incubated at 50°C, pH 5 for 4 days, then the fermentor was sterilized again. The media was inoculated with 106 spores per ml of A. niger and incubated for 2 weeks at 30°C and a variable agitation and aeration regimen as follows. Initially, air flow was 0.3 l/min and agitation was 200 rpm. This was based on previous experience with filamentous fungal fermentation where foaming peaks approximately 24-36 h after inoculation coincident with peak oxygen demand and growth. Aeration was manually adjusted as necessary (range: 0.3-0.6 l/min) over the first two days of spore germination and rapid growth to keep dissolved oxygen from dropping to zero. Foaming was controlled by manual addition of a 1% suspension of Clerol FBA265 (Cognis). After growth had peaked, agitation was increased to 600 rpm for the remainder of the run in order to keep the solids suspended. Samples for dry weight determinations were removed before enzymatic pre-treatment, 18 h after pre treatment began, and 1, 4, 7, 13 and 14 days after inoculation with A. niger. The dry weight was determined on a 10 ml sample that was centrifuged at 3,200 × g for 10 minutes, suspended in water, centrifuged again and the solid pellet dried in a 100°C oven to constant weight. This protocol results in washing away most of the soluble oligosaccharides released from the cellulose and hemicellulose, thus reflecting remaining insoluble material. The dry weight of this insoluble solids fraction decreased 35% from 21.1 g/L to 13.7 g/l over the course of the entire treatment. To prepare sufficient quantities of material for downstream processing, two 15-l fermentations were performed in 30-l working volume sterilizable-in-place Sartorius fermentors. The corn stover media was pre-treated with enzymes (1 g/l each of NCE-2X and 2XP) for 3 days at 50°C. The media was sterilized again before inoculation with 106 spores per ml of A. niger and growth was allowed to proceed for 13 days. The two fermentor runs behaved similarly but not identically. Samples were taken at the onset and completion of enzyme pre-treatment, and 1, 2, 12 and 13 days after spore inoculation. The dry weight in the first run decreased from 28.7 to 14.3 g/L and in the second run from 24.9 to 13.6 g/l; 50% and 45%, respectively. In both cases the measured dry weight of biomass reached two minima: the first at the completion of the enzymatic pre-treatment and the second at the end of the fungal fermentation. The measured dry weight exhibited an intermediate peak of ~75% of the initial dry weight, 24 h after inoculation with fungal spores likely reflecting conversion of readily available carbon to fungal (mycelial) biomass. Light micrographs confirm that extensive fungal hyphal growth occurred on the corn stover particles. The release of CO2, measured continuously with an O2/CO2 off-gas analyzer, rose rapidly from inoculation to 20 h, plateaued for about 5 h, then declined rapidly for the next 5 h and gradually through the remaining 11 days of the fermentations. Enzyme activities for the endo-acting cellulase and xylanase attained top concentrations within two days and maintained this level of

activity to the end. Interestingly, the measured concentration of activity for the enzymes that act on oligosaccharides (β-glucosidase, β-xylosidase and α-arabinofuranosidase) generally increased dramatically (3-13 fold) from the early stage samples (1 and 2 days) to the late stage samples (12 and 13 days). This suggests continued fungal activity and enzyme expression to take advantage of the increasing concentration of oligosaccharides released from cellulose and hemicellulose. At the completion of the fermentation, solids were harvested by centrifugation at 18,000 × g for downstream processing.
100 μm
50 μm
Figure 1. Light micrograph of fungal hyphae growing on corn stover four days after inoculation. In conclusion the enzyme pre-treatment was effective in solubilizing the polysaccharide portion of corn stover. Based on the data available, 2-5 days of treatment with fungus would be sufficient to utilize much of the available carbon in the form of oligosaccharides and simple sugars and conversion to fungal biomass or release as carbon dioxide. More extensive testing of dry weights, fungal biomass, enzyme activities, and analysis of the soluble sugars and oligosaccharides daily over the sixteen day course of enzyme pre-treatment and fungal treatment would be necessary to determine the optimal duration of the combined treatment for minimal polysaccharide and maximum lignin content. Such an intensive analysis was beyond the scope of this sub-task in the context of the current project.

Appendix I
Quantifying Biomass Resources for hydrothermal Processing

Battelle Memorial Institute, Pacific Northwest Division Quantifying Biomass Resources for Hydrothermal Processing Prepared for: Battelle Memorial Institute Prepared by: ANTARES Group Incorporated Date: August 17, 2005
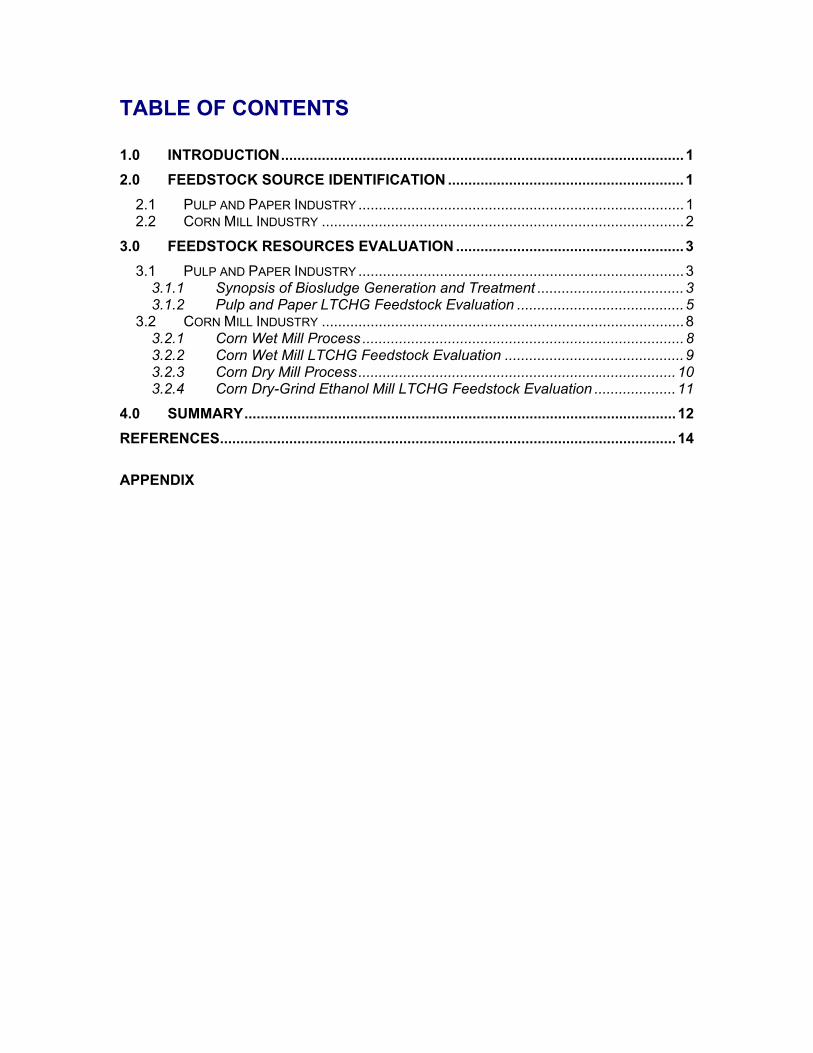
TABLE OF CONTENTS 1.0 INTRODUCTION...................................................................................................1 2.0 FEEDSTOCK SOURCE IDENTIFICATION ..........................................................1
2.1 PULP AND PAPER INDUSTRY ................................................................................1 2.2 CORN MILL INDUSTRY .........................................................................................2
3.0 FEEDSTOCK RESOURCES EVALUATION ........................................................3 3.1 PULP AND PAPER INDUSTRY ................................................................................3
3.1.1 Synopsis of Biosludge Generation and Treatment ....................................3 3.1.2 Pulp and Paper LTCHG Feedstock Evaluation .........................................5
3.2 CORN MILL INDUSTRY .........................................................................................8 3.2.1 Corn Wet Mill Process ...............................................................................8 3.2.2 Corn Wet Mill LTCHG Feedstock Evaluation ............................................9 3.2.3 Corn Dry Mill Process..............................................................................10 3.2.4 Corn Dry-Grind Ethanol Mill LTCHG Feedstock Evaluation ....................11
4.0 SUMMARY..........................................................................................................12 REFERENCES................................................................................................................14 APPENDIX
Antares Group Incorporated Quantifying Biomass Resources for Hydrothermal Processing
Prepared for Battelle Memorial Institute – August 17, 2005 1
1.0 INTRODUCTION Millions of tons of biomass residues are generated each year as biosludges. In their raw form, they are essentially incompatible with traditional gasification technologies since considerable energy is spent on dehydrating the biomass either as part of the process or as part of separate drying steps. Low-Temperature Catalytic Hydrothermal Gasification (LTCHG) offers the potential to access the carbon and hydrogen trapped in these streams using a less energy intensive process that works with the high moisture contents of these resources. Potential resource streams include animal manures (especially dairy and swine), corn wet and dry mill byproducts, paper mill sludge (not including spent black liquor from pulping), food processing sludge, municipal wastewater sludge, and chemical processing sludge. The moisture barrier aside, there is substantial industry interest in thermo-chemical technologies to convert waste streams into added-value products. Many groups are pursuing thermochemical conversion processes as an integral part of Biorefinery operations. In this effort, ANTARES has completed a nationwide feedstock assessment for the Pacific Northwest National Laboratory of Battelle Memorial Institute, providing a clear snapshot of the amount and location of select sources of feedstock. As directed, ANTARES has limited this study to include only sludges generated through the pulp and paper making process (not including spent black liquor from pulping process) and byproducts of the corn milling industry. Specifically, the effort includes completion of the following tasks:
• Identification of U.S. pulp and paper and corn milling (wet and dry) facilities on a state-level; and
• Evaluation of biomass feedstock (biosludge) generating potential of these facilities.
2.0 Feedstock Source Identification To accurately quantify potential feedstock resources down to the state-level, individual pulp and paper mill and corn mill locations and processing capacity data were required. This type of information for these particular industries is not readily available from public sources like the U.S. Census Bureau website or census-based database resources such as the U.S. Department of Agriculture’s National Agriculture Statistics Service (NASS) database, which provides easy access to state-level Concentrated Animal Feeding Operation (CAFO) data. Mill locations and biosludge/co-product quantity information of pulp and paper mills and corn (wet and dry) mills were obtained by ANTARES through the purchase of commercially available industrial information databases.
2.1 Pulp and Paper Industry ANTARES purchased a license from Fisher International, Inc. for use of their U.S. pulp and paper mill industry data. The database includes mill location and
Antares Group Incorporated Quantifying Biomass Resources for Hydrothermal Processing
Prepared for Battelle Memorial Institute – August 17, 2005 2
contact information of each pulp, paper, and integrated mill in the United States. In addition, biosludge waste quantities, in dry tons per day, are provided. The database was formed using Source Identification Codes (SIC) for the pulp and paper industry. SIC codes are given to individual companies (including their manufacturing plants) within a particular type of industry to help analyze that industry as a whole. Industries are codified based on their primary end-product. Industry databases are often built using these codes.
2.2 Corn Mill Industry ANTARES used in-house resources and purchased outside databases to identify sources and characterize the potential feedstock components of the corn milling industry. As we know, corn is processed into products and co-products by either wet- or dry-milling. Each of these process methods produces a potential feedstock source for LTCHG technology. Different sources were used to identify and characterize each type of mill. Detailed wet mill information was obtained through the purchase of a database from Industrial Information Resources, Inc. The database was formed using the SIC code for corn wet mills. This particular database contains up-to-date (June 2005) information for each corn wet mill in the U.S., including: plant name, location, and corn processing capacity (bushels/year). Identification of corn dry mills required a different approach because they are not listed under a single SIC as are wet mills. With that said, the vast majority of dry mills are identified using the SIC for ethanol because ethanol is the primary end-product of dry mills. Known as dry-grind ethanol mills, they are the largest processors of corn, in terms of bushels processed, using the dry milling method. ANTARES already possessed ethanol plant data through 2004 from Industrial Information Resources, Inc. The database includes: plant name, location, corn processing inputs (bushels/year), and ethanol production. However, as said above, other industries in addition to ethanol use the dry mill method. These dry mills use almost the same process, but are different in that they don’t produce a single primary product (like ethanol), but rather several end-products such as cereals, corn breads, muffins, corn dogs, pancakes, beer additives, snack foods, etc. and hominy feed for livestock. Securing detailed resource data for these non-ethanol producing dry mill facilities was not possible under this effort because the data for these mills is scattered among these many different industries. Data collection would have overwhelmed the project budget and as a result, ANTARES focused its resource evaluation on the dry-grind ethanol mill data, which was more readily available. Additionally, as indicated later in Section 2.2.3, dry-grind ethanol plants represent the vast majority of corn demand in this milling category and overall results are not expected to be materially affected by this simplifying assumption.
Antares Group Incorporated Quantifying Biomass Resources for Hydrothermal Processing
Prepared for Battelle Memorial Institute – August 17, 2005 3
3.0 Feedstock Resources Evaluation In this section, ANTARES has provided brief characterizations of the processing routines typically utilized in the corn milling (wet and dry) and pulp and paper industries to facilitate delineation of the evaluation results. These characterizations are also helpful in describing the biosludge estimating methods used. Following the industry characterizations, ANTARES provides a state-by-state resource assessment. Data, provided in Exhibits, includes: location (State) and annual tonnages generated. Discussions of chemical composition and current uses or disposal methods are also included for each type of biosludge.
3.1 Pulp and Paper Industry Paper, paperboard, and other wood-fiber-based products are manufactured using wood pulp and/or waste paper raw materials. Wood pulp is the fibrous material that results when wood is dissolved into individual fibers (lignin, cellulose, and hemi-cellulose) by chemical, semi-chemical, or mechanical methods. Waste paper is composed of previously discarded paper or paperboard products. Both contain cellulose fiber that can be subsequently combined with other inputs to manufacture paper, paperboard, or other wood-fiber-based products. Wood pulp manufacturing and the re-use of waste paper are best understood in the context of the entire pulp and paper industry. Total global annual production of wood pulp is approximately 200 million metric tons, of which the U.S. industry produces about 60 million metric tons1. Most pulp (approximately 75 percent) is produced and consumed at integrated pulp and paper mills. At these integrated mills, the pulp is pumped as a slurry directly to a paper or paperboard plant where it may be mixed with other pulps, recycled fiber, or fillers such as clay before going to the paper machine. Only about 10-15% of U.S. pulp production is dried for transport to distant stand-alone paper mills. Some pulp, known as market pulp, is produced at dedicated pulp mills. ANTARES has identified each facility in the pulp and paper industry in the U.S. for this evaluation. Some of these facilities are dedicated to the production of either pulp or paper, while other facilities are integrated pulp and paper mills. All of these facilities are included because they all generate some quantity of biosludge through a wastewater treatment process.
3.1.1 Synopsis of Biosludge Generation and Treatment Wastewater treatment sludge, or biosludge, is the largest volume residual waste stream generated by the pulp and paper industry. In a 1988 EPA survey of 104 mills, total sludge generation was estimated to be about 2.5 million dry tons per 1 Energy Efficiency and the Pulp and Paper Industry, American Council for an Energy Efficient Economy, 1996.

Antares Group Incorporated Quantifying Biomass Resources for Hydrothermal Processing
Prepared for Battelle Memorial Institute – August 17, 2005 4
year, or an average of approximately 26,000 dry tons per year per plant.2 Pulp-making operations are responsible for the bulk of sludge wastes, although treatment of papermaking effluents also generates significant sludge volumes. For the majority of pulp and integrated mills that operate their own wastewater treatment systems, sludges are generated onsite. A small number of pulp mills, and a much larger proportion of papermaking establishments, discharge effluents to publicly-owned wastewater treatment works. Wastewater from pulp, paper, and integrated mills usually go through two treatment stages: primary and secondary. A definition of both treatment phases is provided below.3 Primary treatment is sedimentation in a clarifier to remove suspended solids from effluents. This mechanical treatment removes about 50% to 90% of suspended solids and delivers an effluent with 20 to 200 mg (solids)/liter. If chemicals are added, the efficiency is increased. Primary treatment can also lead to a reduction of BOD by 30% to 50%. Secondary treatment is a biological treatment where organic pollution and oxygen demand are reduced. Several processes like ponds, aerated lagoons, activated sludge, trickling filters or anaerobic treatment, are available. The effluents need to stay 5 to 10 days to obtain a BOD5 reduction by 70 to 95%. Toxicity is also significantly reduced. Effluents of secondary treatment are normally non toxic to fish at full concentration and can thus be discharged into bodies of water with some precautions. Usually, the mass of secondary solids is less than the mass of primary solids. In pulp and paper mill wastewater treatment facilities, the wastewater first enters a sedimentation basin or clarifier (called the primary sedimentation basin or clarifier) or in some instances a dissolved air flotation device that captures suspended fiber and clay material. The suspended material then forms concentrated slurry containing normally 1% to 5% solids. This slurry or “sludge” is then pumped to a gravity thickener for further concentration and then to a dewatering device (typically a belt filter press, vacuum filter, or screw press) that increases sludge solids content normally in the range of 20% to 50%.4 With today’s increased regulations, most wastewater treatment facilities are required to have an additional treatment process. The goal of this secondary treatment phase is to remove dissolved biodegradable organic materials and effectively reduce the stream’s biological oxygen demand (BOD).
2 EPA Office of Compliance Sector Notebook Project, Profile of the Pulp and Paper Industry, 2nd Edition, November 2002. 3 Food and Agriculture Organization of the United Nations, Environmental Impact Assessment and Environmental Auditing in the Pulp and Paper Industry, 1996. 4 Maxham, John V., Prime Fiber Corporation (Appleton, WI), Conversion of Pulp and Paper Mill Sludge to Papermaking Pulp, United States Patent Description, August 11, 1992.
Antares Group Incorporated Quantifying Biomass Resources for Hydrothermal Processing
Prepared for Battelle Memorial Institute – August 17, 2005 5
The resulting sludge produced from wastewater treatment must be dewatered somewhere downstream depending on its destination, which can be burning, landfill, composting and even animal feeding. Because of the difficulty associated with dewatering solids from secondary treatment alone, these solids are often combined with the solids from primary treatment prior to dewatering. Dewatered sludges are usually between 30 and 50% solids (i.e., 70% to 50% water, by weight). Higher fractions of secondary sludge typically lead to lower percent solids of the combined, dewatered mixture. Primary solids, when dewatered alone, would be near the higher end of this range.
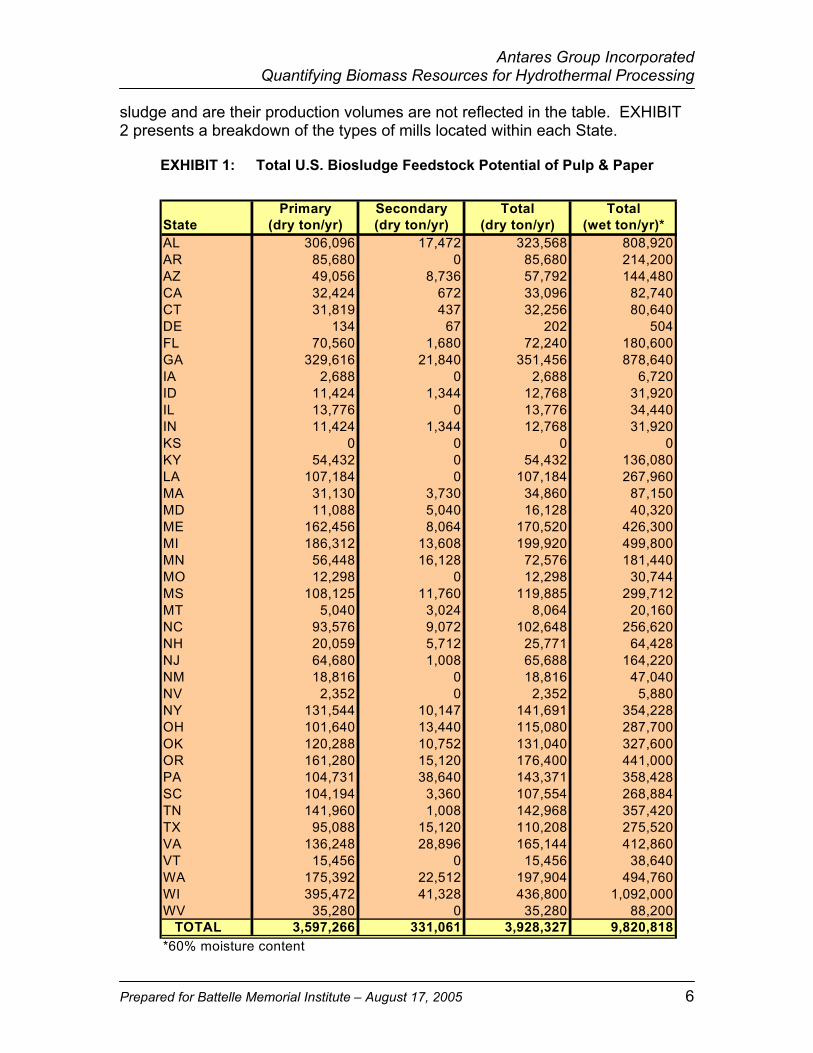
3.1.2 Pulp and Paper LTCHG Feedstock Evaluation Drawing from the Fisher database, ANTARES has been able to identify locations and obtain the biosludge quantity data of each facility in the U.S. These facilities include dedicated paper mills, dedicated pulp mills, and integrated pulp and paper mills. The primary data source for the sludge production is through direct contact with the mills. Some of the information is supplemented with publicly available data in company environmental/sustainability reports. Most of the individual mill records contain biosludge data for both primary and secondary treatment streams. Other records do not provide this break-down, but rather primary and secondary quantities are combined then presented as a single quantity under “primary treatment”. Because of the difficulty associated with dewatering secondary solids alone, these solids are often combined prior to dewatering anyway, thus it is of little consequence. EXHIBIT 1 provides U.S. pulp, paper, and integrated mill biosludge data potentially available in each state for LTCHG use. Data is presented in both dry and wet tons/year. On a dry weight basis, the results show about 3.9 million tons per year. On a wet weight basis, the study finds approximately 9.8 million tons/year of biosludge potentially available. ANTARES calculated wet tons/year by applying a moisture percentage of 60% (the median sludge water percentage after combined dewatering of primary and secondary sludges). Using the data provided by the Fisher database, average total sludge output5 was calculated to be 19,4666 dry tons/mill (48,665 tons/mill, wet weight). This result is slightly lower than the average amount of 26,000 dry tons/mill found in EPA’s study (mentioned in Section 2.1.1). ANTARES believes that the primary reason for this discrepancy is due to the fact that the EPA study only surveyed Kraft pulp mills, whereas this study also includes data from paper mills, which are known to produce less sludge. In addition, it appears that some mills internally recycle their
5 Sludge output is defined as sludge volumes that are eventually moved off-site for disposal/recycling. However, some paper mills recycle their sludge and do not report an output volume. If economically justified for other uses and assuming industry average data, these mills could add an additional 2.9 million wet tons/year of volume to the market potential. 6 Based on mills reporting sludge volumes
Antares Group Incorporated Quantifying Biomass Resources for Hydrothermal Processing
Prepared for Battelle Memorial Institute – August 17, 2005 6
sludge and are their production volumes are not reflected in the table. EXHIBIT 2 presents a breakdown of the types of mills located within each State.
Primary Secondary Total TotalState (dry ton/yr) (dry ton/yr) (dry ton/yr) (wet ton/yr)*AL 306,096 17,472 323,568 808,920AR 85,680 0 85,680 214,200AZ 49,056 8,736 57,792 144,480CA 32,424 672 33,096 82,740CT 31,819 437 32,256 80,640DE 134 67 202 504FL 70,560 1,680 72,240 180,600GA 329,616 21,840 351,456 878,640IA 2,688 0 2,688 6,720ID 11,424 1,344 12,768 31,920IL 13,776 0 13,776 34,440IN 11,424 1,344 12,768 31,920KS 0 0 0 0KY 54,432 0 54,432 136,080LA 107,184 0 107,184 267,960MA 31,130 3,730 34,860 87,150MD 11,088 5,040 16,128 40,320ME 162,456 8,064 170,520 426,300MI 186,312 13,608 199,920 499,800MN 56,448 16,128 72,576 181,440MO 12,298 0 12,298 30,744MS 108,125 11,760 119,885 299,712MT 5,040 3,024 8,064 20,160NC 93,576 9,072 102,648 256,620NH 20,059 5,712 25,771 64,428NJ 64,680 1,008 65,688 164,220NM 18,816 0 18,816 47,040NV 2,352 0 2,352 5,880NY 131,544 10,147 141,691 354,228OH 101,640 13,440 115,080 287,700OK 120,288 10,752 131,040 327,600OR 161,280 15,120 176,400 441,000PA 104,731 38,640 143,371 358,428SC 104,194 3,360 107,554 268,884TN 141,960 1,008 142,968 357,420TX 95,088 15,120 110,208 275,520VA 136,248 28,896 165,144 412,860VT 15,456 0 15,456 38,640WA 175,392 22,512 197,904 494,760WI 395,472 41,328 436,800 1,092,000WV 35,280 0 35,280 88,200
TOTAL 3,597,266 331,061 3,928,327 9,820,818*60% moisture content
EXHIBIT 1: Total U.S. Biosludge Feedstock Potential of Pulp & Paper
Antares Group Incorporated Quantifying Biomass Resources for Hydrothermal Processing
Prepared for Battelle Memorial Institute – August 17, 2005 7
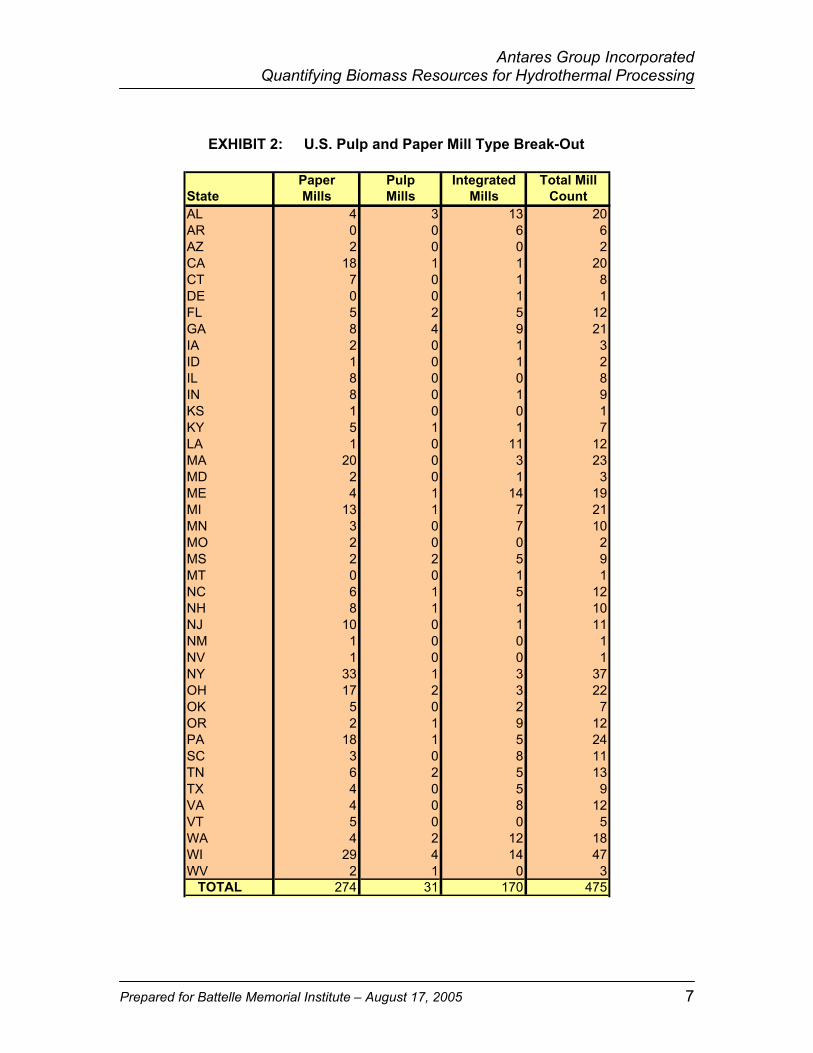
Paper Pulp Integrated Total MillState Mills Mills Mills CountAL 4 3 13 20AR 0 0 6 6AZ 2 0 0 2CA 18 1 1 20CT 7 0 1 8DE 0 0 1 1FL 5 2 5 12GA 8 4 9 21IA 2 0 1 3ID 1 0 1 2IL 8 0 0 8IN 8 0 1 9KS 1 0 0 1KY 5 1 1 7LA 1 0 11 12MA 20 0 3 23MD 2 0 1 3ME 4 1 14 19MI 13 1 7 21MN 3 0 7 10MO 2 0 0 2MS 2 2 5 9MT 0 0 1 1NC 6 1 5 12NH 8 1 1 10NJ 10 0 1 11NM 1 0 0 1NV 1 0 0 1NY 33 1 3 37OH 17 2 3 22OK 5 0 2 7OR 2 1 9 12PA 18 1 5 24SC 3 0 8 11TN 6 2 5 13TX 4 0 5 9VA 4 0 8 12VT 5 0 0 5WA 4 2 12 18WI 29 4 14 47WV 2 1 0 3
TOTAL 274 31 170 475
EXHIBIT 2: U.S. Pulp and Paper Mill Type Break-Out
Antares Group Incorporated Quantifying Biomass Resources for Hydrothermal Processing
Prepared for Battelle Memorial Institute – August 17, 2005 8
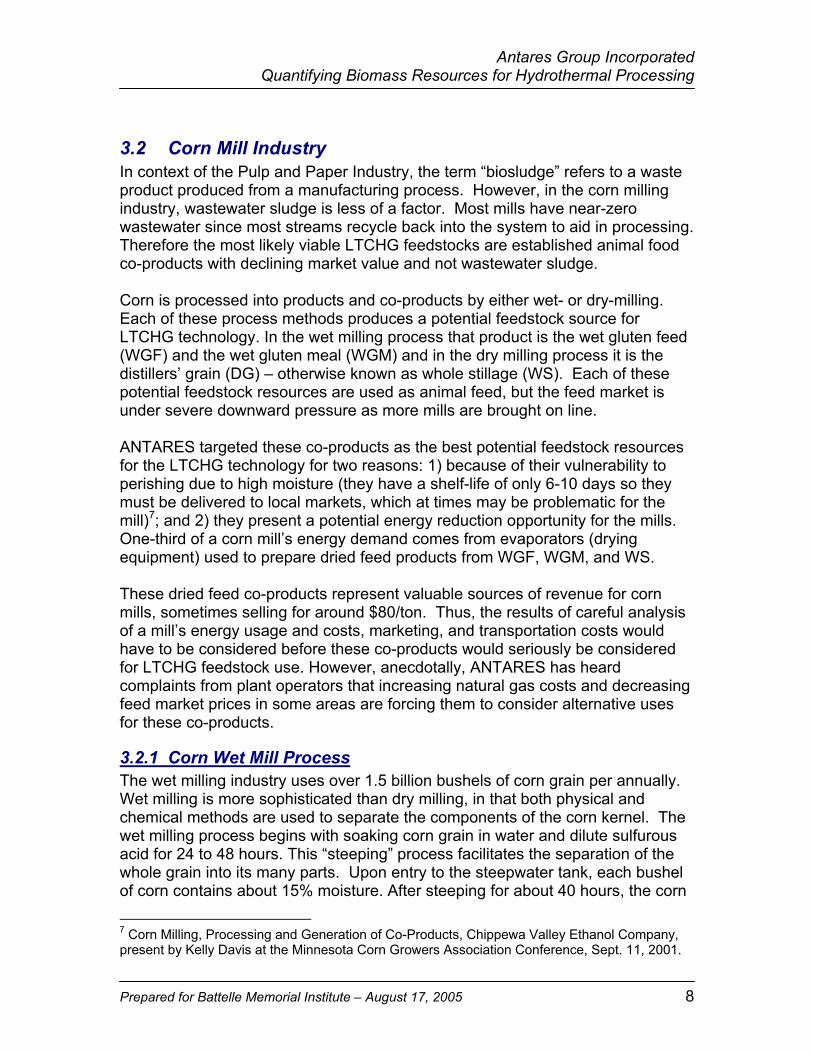
3.2 Corn Mill Industry In context of the Pulp and Paper Industry, the term “biosludge” refers to a waste product produced from a manufacturing process. However, in the corn milling industry, wastewater sludge is less of a factor. Most mills have near-zero wastewater since most streams recycle back into the system to aid in processing. Therefore the most likely viable LTCHG feedstocks are established animal food co-products with declining market value and not wastewater sludge. Corn is processed into products and co-products by either wet- or dry-milling. Each of these process methods produces a potential feedstock source for LTCHG technology. In the wet milling process that product is the wet gluten feed (WGF) and the wet gluten meal (WGM) and in the dry milling process it is the distillers’ grain (DG) – otherwise known as whole stillage (WS). Each of these potential feedstock resources are used as animal feed, but the feed market is under severe downward pressure as more mills are brought on line. ANTARES targeted these co-products as the best potential feedstock resources for the LTCHG technology for two reasons: 1) because of their vulnerability to perishing due to high moisture (they have a shelf-life of only 6-10 days so they must be delivered to local markets, which at times may be problematic for the mill)7; and 2) they present a potential energy reduction opportunity for the mills. One-third of a corn mill’s energy demand comes from evaporators (drying equipment) used to prepare dried feed products from WGF, WGM, and WS. These dried feed co-products represent valuable sources of revenue for corn mills, sometimes selling for around $80/ton. Thus, the results of careful analysis of a mill’s energy usage and costs, marketing, and transportation costs would have to be considered before these co-products would seriously be considered for LTCHG feedstock use. However, anecdotally, ANTARES has heard complaints from plant operators that increasing natural gas costs and decreasing feed market prices in some areas are forcing them to consider alternative uses for these co-products.
3.2.1 Corn Wet Mill Process The wet milling industry uses over 1.5 billion bushels of corn grain per annually. Wet milling is more sophisticated than dry milling, in that both physical and chemical methods are used to separate the components of the corn kernel. The wet milling process begins with soaking corn grain in water and dilute sulfurous acid for 24 to 48 hours. This “steeping” process facilitates the separation of the whole grain into its many parts. Upon entry to the steepwater tank, each bushel of corn contains about 15% moisture. After steeping for about 40 hours, the corn
7 Corn Milling, Processing and Generation of Co-Products, Chippewa Valley Ethanol Company, present by Kelly Davis at the Minnesota Corn Growers Association Conference, Sept. 11, 2001.
Antares Group Incorporated Quantifying Biomass Resources for Hydrothermal Processing
Prepared for Battelle Memorial Institute – August 17, 2005 9
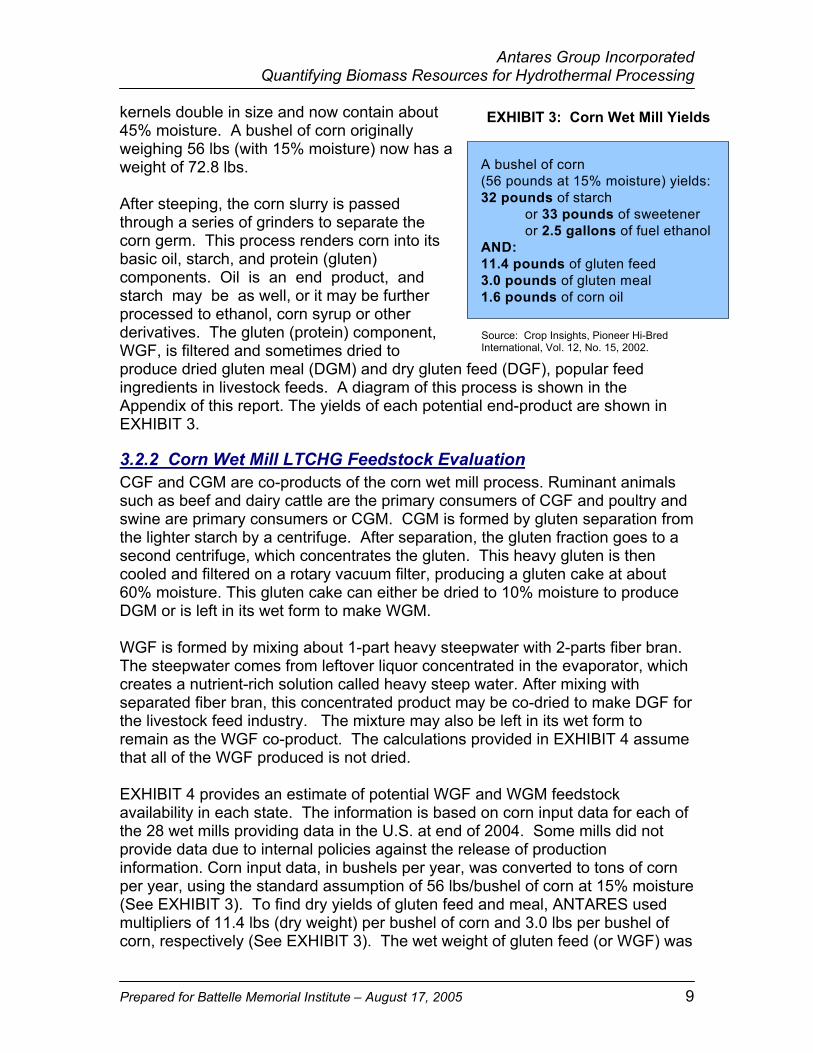
kernels double in size and now contain about 45% moisture. A bushel of corn originally weighing 56 lbs (with 15% moisture) now has a weight of 72.8 lbs. After steeping, the corn slurry is passed through a series of grinders to separate the corn germ. This process renders corn into its basic oil, starch, and protein (gluten) components. Oil is an end product, and starch may be as well, or it may be further processed to ethanol, corn syrup or other derivatives. The gluten (protein) component, WGF, is filtered and sometimes dried to produce dried gluten meal (DGM) and dry gluten feed (DGF), popular feed ingredients in livestock feeds. A diagram of this process is shown in the Appendix of this report. The yields of each potential end-product are shown in EXHIBIT 3.
3.2.2 Corn Wet Mill LTCHG Feedstock Evaluation CGF and CGM are co-products of the corn wet mill process. Ruminant animals such as beef and dairy cattle are the primary consumers of CGF and poultry and swine are primary consumers or CGM. CGM is formed by gluten separation from the lighter starch by a centrifuge. After separation, the gluten fraction goes to a second centrifuge, which concentrates the gluten. This heavy gluten is then cooled and filtered on a rotary vacuum filter, producing a gluten cake at about 60% moisture. This gluten cake can either be dried to 10% moisture to produce DGM or is left in its wet form to make WGM. WGF is formed by mixing about 1-part heavy steepwater with 2-parts fiber bran. The steepwater comes from leftover liquor concentrated in the evaporator, which creates a nutrient-rich solution called heavy steep water. After mixing with separated fiber bran, this concentrated product may be co-dried to make DGF for the livestock feed industry. The mixture may also be left in its wet form to remain as the WGF co-product. The calculations provided in EXHIBIT 4 assume that all of the WGF produced is not dried. EXHIBIT 4 provides an estimate of potential WGF and WGM feedstock availability in each state. The information is based on corn input data for each of the 28 wet mills providing data in the U.S. at end of 2004. Some mills did not provide data due to internal policies against the release of production information. Corn input data, in bushels per year, was converted to tons of corn per year, using the standard assumption of 56 lbs/bushel of corn at 15% moisture (See EXHIBIT 3). To find dry yields of gluten feed and meal, ANTARES used multipliers of 11.4 lbs (dry weight) per bushel of corn and 3.0 lbs per bushel of corn, respectively (See EXHIBIT 3). The wet weight of gluten feed (or WGF) was
A bushel of corn (56 pounds at 15% moisture) yields: 32 pounds of starch
or 33 pounds of sweeteneror 2.5 gallons of fuel ethanol
AND:11.4 pounds of gluten feed3.0 pounds of gluten meal1.6 pounds of corn oil
EXHIBIT 3: Corn Wet Mill Yields
Source: Crop Insights, Pioneer Hi-Bred International, Vol. 12, No. 15, 2002.
Antares Group Incorporated Quantifying Biomass Resources for Hydrothermal Processing
Prepared for Battelle Memorial Institute – August 17, 2005 10
estimated using average moisture contents of 55%, while 60% moisture was assumed for WGM.8 The total potential feedstock quantity is estimated at about 15.2 million and 4.5 million tons per year from WGF and WGM, respectively, for a total supply of approximately 19.8 million tons.
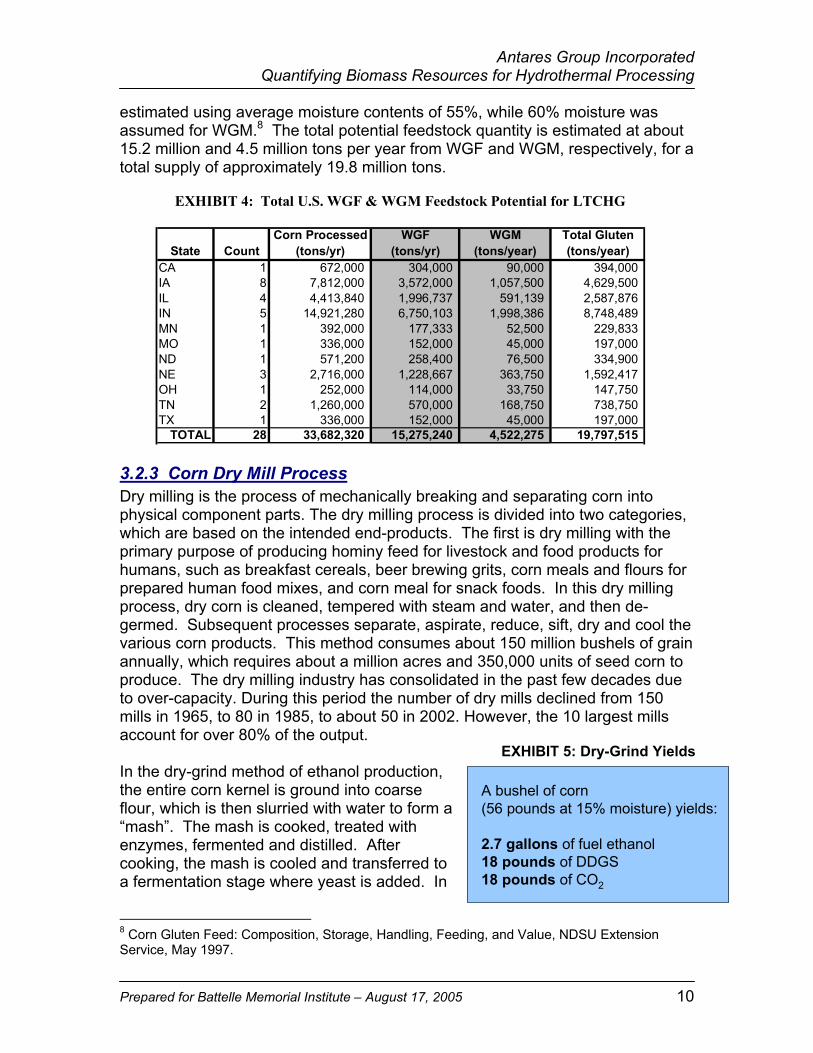
3.2.3 Corn Dry Mill Process Dry milling is the process of mechanically breaking and separating corn into physical component parts. The dry milling process is divided into two categories, which are based on the intended end-products. The first is dry milling with the primary purpose of producing hominy feed for livestock and food products for humans, such as breakfast cereals, beer brewing grits, corn meals and flours for prepared human food mixes, and corn meal for snack foods. In this dry milling process, dry corn is cleaned, tempered with steam and water, and then de-germed. Subsequent processes separate, aspirate, reduce, sift, dry and cool the various corn products. This method consumes about 150 million bushels of grain annually, which requires about a million acres and 350,000 units of seed corn to produce. The dry milling industry has consolidated in the past few decades due to over-capacity. During this period the number of dry mills declined from 150 mills in 1965, to 80 in 1985, to about 50 in 2002. However, the 10 largest mills account for over 80% of the output. In the dry-grind method of ethanol production, the entire corn kernel is ground into coarse flour, which is then slurried with water to form a “mash”. The mash is cooked, treated with enzymes, fermented and distilled. After cooking, the mash is cooled and transferred to a fermentation stage where yeast is added. In
8 Corn Gluten Feed: Composition, Storage, Handling, Feeding, and Value, NDSU Extension Service, May 1997.
Corn Processed WGF WGM Total GlutenState Count (tons/yr) (tons/yr) (tons/year) (tons/year)
CA 1 672,000 304,000 90,000 394,000 IA 8 7,812,000 3,572,000 1,057,500 4,629,500 IL 4 4,413,840 1,996,737 591,139 2,587,876 IN 5 14,921,280 6,750,103 1,998,386 8,748,489 MN 1 392,000 177,333 52,500 229,833 MO 1 336,000 152,000 45,000 197,000 ND 1 571,200 258,400 76,500 334,900 NE 3 2,716,000 1,228,667 363,750 1,592,417 OH 1 252,000 114,000 33,750 147,750 TN 2 1,260,000 570,000 168,750 738,750 TX 1 336,000 152,000 45,000 197,000
TOTAL 28 33,682,320 15,275,240 4,522,275 19,797,515
EXHIBIT 4: Total U.S. WGF & WGM Feedstock Potential for LTCHG
A bushel of corn (56 pounds at 15% moisture) yields:
2.7 gallons of fuel ethanol18 pounds of DDGS18 pounds of CO2
EXHIBIT 5: Dry-Grind Yields

Antares Group Incorporated Quantifying Biomass Resources for Hydrothermal Processing
Prepared for Battelle Memorial Institute – August 17, 2005 11
addition to ethanol, the dry-grind process also generates DG, a high quality livestock feed, and carbon dioxide, which is used as a food and industrial product. Average bushel yields are provided in EXHIBIT 5. A simple diagram of the dry-grind ethanol process is provided in the Appendix.
3.2.4 Corn Dry-Grind Ethanol Mill LTCHG Feedstock Evaluation As previously discussed in Section 1.2, the dry-grind ethanol milling industry will serve as the source of feedstock estimates for LTCHG in this study. Of the dry-grind co-products, DG is the most likely to be used as a feedstock for LTCHG. DG is the remaining solid and liquid fraction after distillation. It is referred to as “whole stillage” (WS). WS includes the fiber, oil and protein components of the grain, as well as the non-fermented starch. WS has a moisture content of about 85%. Although it is possible to feed WS to livestock, poultry, and fish, because of transportation problems, it is almost always processed further to reduce moisture before being sold. In this process, first, the “thin stillage” is separated from the insoluble solid fraction using centrifuges or presses/extruders. The thin stillage is then sent to evaporator units to remove excess water. After evaporation, the thick, viscous syrup is mixed back with the solids to create a feed product known as wet distillers’ grains with solubles (WDGS). WDGS, containing 65% moisture, can be used directly as an animal feed product. However, WDGS has a shelf life of only one to two weeks. Like the wet feed products produced in wet milling, the feedlot must be within about 50-100 miles of the mill to avoid perishing. Handling and storage can be a challenge, especially in hot summer months when shelf life is even more limited. To increase shelf life and lower transportation costs, WDGS is usually dried to 10-12% moisture to produce a product known as dried distillers’ grain with solubles (DDGS). As with gluten feed and meal, drying WS is energy-intensive, consuming about one-third of the energy requirements of the entire dry-grind plant. However, producing a uniform, stable, high-quality feed co-product is essential to the profitability of the plant, resulting in most plants producing DDGS rather than WDGS. An alternative market for WS-based animal feed products could develop through the LTCHG technology. Use as a feedstock for onsite energy generation using LTCHG could eliminate the problem of finding nearby markets for WDGS, reduce transportation costs, reduce the need for energy-intensive drying equipment to
EXHIBIT 6: U.S. WS Feedstock Potential
Corn WholeMill Processed Stillage
State Count (tons/year) (tons/year)IA 17 6,114,556 11,792,358 IL 8 8,229,732 15,871,626 IN 1 915,600 1,765,800 KS 6 1,126,356 2,172,258 KY 2 342,160 659,880 MI 1 420,000 810,000 MN 14 3,239,600 6,247,800 MO 4 1,008,000 1,944,000 ND 2 378,000 729,000 NE 10 4,205,600 8,110,800 NM 1 212,800 410,400 SD 10 3,716,020 7,166,610 WI 6 1,705,200 3,288,600 WY 1 56,000 108,000 TOTAL 83 31,669,624 61,077,132
Antares Group Incorporated Quantifying Biomass Resources for Hydrothermal Processing
Prepared for Battelle Memorial Institute – August 17, 2005 12
make DDGS, and allow for new, syngas product lines or heat/power. Collectively, these advantages may increase mill flexibility and potentially profitability. Using a traditional yield of 18 lbs of DDGS per bushel of corn processed, ANTARES back-calculated to estimate the total WS production of each state. Total WS production in the U.S. is estimated to be about 61.1 million tons per year. The results, shown in EXHIBIT 6, use an assumed WS moisture content of 85%.
4.0 Summary The study finds a significant quantity of feedstock available for possible LTCHG use. Alternative use through LTCHG for biosludges and corn milling co-products may provide each industry with more options, which, in some cases, may be more cost-effective. Technology integration, based on the identification of feedstock resources found herein, is feasible in pulp, paper, and integrated mills and corn wet and dry-grind mills. On a wet weight basis, the study identified approximately 9.8 million tons/year of biosludge available in the U.S. annually through the pulp and paper making process. For wet milling, ANTARES discovered 15.2 million and 4.5 million tons per year of potential feedstock from WGF and WGM, respectively, for a total supply of approximately 19.8 million tons/year. As for dry mills, ANTARES estimates the amount of potential WS feedstock to be about 61.1 million tons per year. With continued long-term growth expected in ethanol production, feedstock from dry-grind ethanol mills should rise further in the future. In all, ANTARES estimates a total annual LTCHG feedstock resource potential of approximately 90.6 million tons in wet weight or about 20 million tons in dry weight. EXHIBIT 7, on the next page, provides a complete summary.
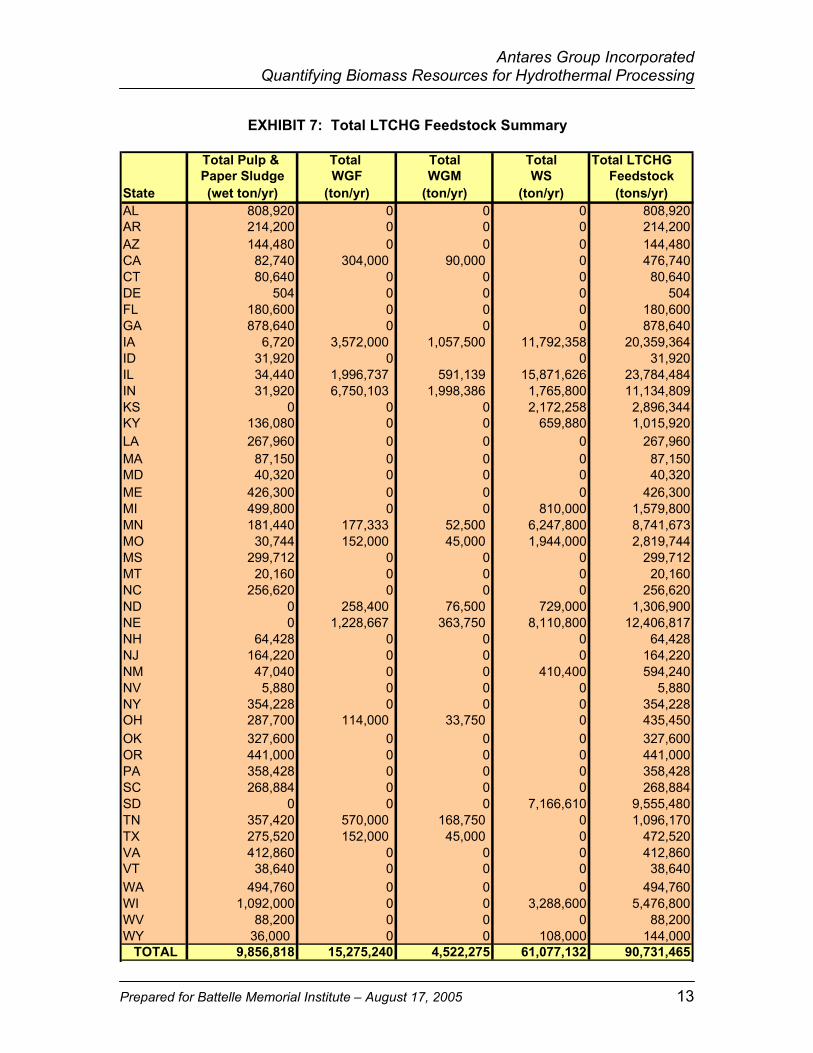
Antares Group Incorporated Quantifying Biomass Resources for Hydrothermal Processing
Prepared for Battelle Memorial Institute – August 17, 2005 13
Total Pulp & Total Total Total Total LTCHGPaper Sludge WGF WGM WS Feedstock
State (wet ton/yr) (ton/yr) (ton/yr) (ton/yr) (tons/yr)AL 808,920 0 0 0 808,920AR 214,200 0 0 0 214,200AZ 144,480 0 0 0 144,480CA 82,740 304,000 90,000 0 476,740CT 80,640 0 0 0 80,640DE 504 0 0 0 504FL 180,600 0 0 0 180,600GA 878,640 0 0 0 878,640IA 6,720 3,572,000 1,057,500 11,792,358 20,359,364ID 31,920 0 0 31,920IL 34,440 1,996,737 591,139 15,871,626 23,784,484IN 31,920 6,750,103 1,998,386 1,765,800 11,134,809KS 0 0 0 2,172,258 2,896,344KY 136,080 0 0 659,880 1,015,920LA 267,960 0 0 0 267,960MA 87,150 0 0 0 87,150MD 40,320 0 0 0 40,320ME 426,300 0 0 0 426,300MI 499,800 0 0 810,000 1,579,800MN 181,440 177,333 52,500 6,247,800 8,741,673MO 30,744 152,000 45,000 1,944,000 2,819,744MS 299,712 0 0 0 299,712MT 20,160 0 0 0 20,160NC 256,620 0 0 0 256,620ND 0 258,400 76,500 729,000 1,306,900NE 0 1,228,667 363,750 8,110,800 12,406,817NH 64,428 0 0 0 64,428NJ 164,220 0 0 0 164,220NM 47,040 0 0 410,400 594,240NV 5,880 0 0 0 5,880NY 354,228 0 0 0 354,228OH 287,700 114,000 33,750 0 435,450OK 327,600 0 0 0 327,600OR 441,000 0 0 0 441,000PA 358,428 0 0 0 358,428SC 268,884 0 0 0 268,884SD 0 0 0 7,166,610 9,555,480TN 357,420 570,000 168,750 0 1,096,170TX 275,520 152,000 45,000 0 472,520VA 412,860 0 0 0 412,860VT 38,640 0 0 0 38,640WA 494,760 0 0 0 494,760WI 1,092,000 0 0 3,288,600 5,476,800WV 88,200 0 0 0 88,200WY 36,000 0 0 108,000 144,000
TOTAL 9,856,818 15,275,240 4,522,275 61,077,132 90,731,465
EXHIBIT 7: Total LTCHG Feedstock Summary

Antares Group Incorporated Quantifying Biomass Resources for Hydrothermal Processing
Prepared for Battelle Memorial Institute – August 17, 2005 14
References
1) American Council for an Energy Efficient Economy, “Energy Efficiency and the Pulp and Paper Industry”, 1996.
2) Chippewa Valley Ethanol Company, “Corn Milling, Processing and
Generation of Co-Products”, present by Kelly Davis at the Minnesota Corn Growers Association Conference, Sept. 11, 2001.
3) Crop Insights, Pioneer Hi-Bred International, Vol. 12, No. 15, 2002.
4) Food and Agriculture Organization of the United Nations,
“Environmental Impact Assessment and Environmental Auditing in the Pulp and Paper Industry”, 1996.
5) Maxham, John V., Prime Fiber Corporation (Appleton, WI),
“Conversion of Pulp and Paper Mill Sludge to Papermaking Pulp”, United States Patent Description, August 11, 1992.
6) North Dakota Extension Service, “Corn Gluten Feed: Composition,
Storage, Handling, Feeding, and Value”, May 1997.
Antares Group Incorporated Quantifying Biomass Resources for Hydrothermal Processing
Prepared for Battelle Memorial Institute – August 17, 2005
APPENDIX
Corn Milling Process Diagrams
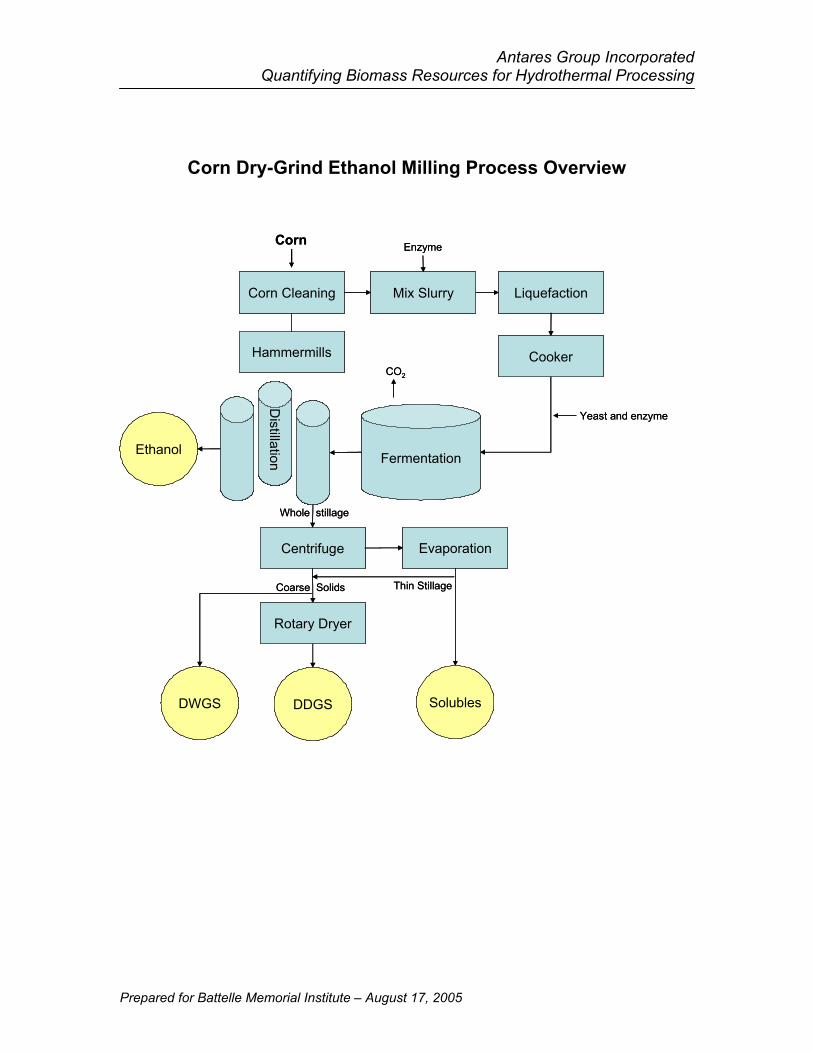
Antares Group Incorporated Quantifying Biomass Resources for Hydrothermal Processing
Prepared for Battelle Memorial Institute – August 17, 2005
Corn Cleaning
Corn
Rotary Dryer
EvaporationCentrifuge
Cooker
LiquefactionMix Slurry
Hammermills
Distillation Fermentation
DWGS DDGS
Ethanol
Solubles
Thin Stillage
Enzyme
Whole stillage
Yeast and enzyme
Coarse Solids
CO2
Corn Cleaning
Corn
Rotary Dryer
EvaporationCentrifuge
Cooker
LiquefactionMix Slurry
Hammermills
Distillation
Distillation Fermentation
DWGS DDGS
Ethanol
Solubles
Thin Stillage
Enzyme
Whole stillage
Yeast and enzyme
Coarse Solids
CO2
Corn Dry-Grind Ethanol Milling Process Overview

Antares Group Incorporated Quantifying Biomass Resources for Hydrothermal Processing
Prepared for Battelle Memorial Institute – August 17, 2005
Corn Cleaning
Corn
Centrifugal Separators
Starch WashingHydro Clones
Washing Screens
Grinding Mills
Germ Separation
Steep Tanks
Hammermills
Corn Oil
Corn GlutenMeal
Starch &Sweeteners
Steepwater
GermGerm Extraction
SteepwaterEvaporation
Corn GlutenFeed
Corn GermMeal
CondensedFermentedExtractives
Corn Cleaning
Corn
Centrifugal Separators
Starch WashingHydro Clones
Washing Screens
Grinding Mills
Germ Separation
Steep Tanks
Hammermills
Corn Oil
Corn GlutenMeal
Starch &Sweeteners
Steepwater
GermGerm Extraction
SteepwaterEvaporation
Corn GlutenFeed
Corn GermMeal
CondensedFermentedExtractives
Corn Wet Milling Process Overview

Appendix II
Quantifying Biomass Resources for Hydrothermal Processing II
Battelle Memorial Institute, Pacific Northwest Division Quantifying Biomass Resources for Hydrothermal Processing II Prepared for: Battelle Memorial Institute Prepared by: ANTARES Group Incorporated Date: November 30, 2005
TABLE OF CONTENTS 1.0 INTRODUCTION...................................................................................................1 2.0 MARKET SEGMENT AND SIZE ANALYSIS .......................................................1
2.1 DISTILLERS DRIED GRAINS AND SOLUBLES ..........................................................2 2.1.1 DDGS Market Size ....................................................................................2 2.1.2 Market Segments ......................................................................................4
2.2 WET DISTILLER’S GRAIN......................................................................................6 2.2.1 WDG Market Size......................................................................................6 2.2.2 Market Segments ......................................................................................8
3.0 MARKET PRICE ANALYSIS................................................................................9 3.1 DISTILLER’S DRIED GRAINS WITH SOLUBLES PRICE ..............................................9 3.2 WET DISTILLER’S GRAIN PRICE .........................................................................10
4.0 CONVERSION COST ANALYSIS ......................................................................12 4.1 CAPITAL COST ..................................................................................................12 4.2 OPERATIONS AND MAINTENANCE COST .............................................................13 4.3 COST OF CONVERSION SUMMARY......................................................................15
5.0 SUMMARY..........................................................................................................16 REFERENCES................................................................................................................17
Prepared for Battelle Memorial Institute – November 30, 2005 1
1.0 INTRODUCTION In a report submitted to Battelle in August 2005, ANTARES identified and quantified resources potentially available for use as feedstock for the Low-Temperature Catalytic Hydrothermal Gasification (LTCHG) technology. Feedstock included biosludges generated by pulp and paper mills and animal feed co-products of the wet and dry-grind corn milling processes. A total feedstock supply of about 50 million wet tons per year was discovered. In this effort, ANTARES has taken a closer look at the dry-grind ethanol co-products and related markets. The ethanol industry has more than doubled in production since 2000. As of January 2005, 81 ethanol plants were in operation, with a production capacity of 3,643.7 mgy.1 Nearly 95 percent of U.S. ethanol comes from corn. Of the corn-ethanol plants in operation, approximately two-thirds are dry-mills, producing ethanol, animal feed, and in some cases carbon dioxide.2 Because a dry-grind plant is cheaper to build and generally more efficient to operate with respect to ethanol production, it seems logical that future growth will come in the form of dry-grind corn plants. Naturally, as dry-grind ethanol production increases, a proportionate growth will occur for its co-products, such as WDG as well as the dried version, distiller’s dried grains and solubles (DDGS). An ethanol plant’s economic viability depends strongly on finding revenue-making markets for its co-products. If the additional DDGS/WDG supplies exceed the demand of traditional markets, ethanol plant managers may need to consider other options. One of these options could include using the WDG as a feedstock for LTCHG technology rather than converting to DDGS. To determine the viability of this option, ANTARES has conducted a nationwide assessment that focuses in on dry-grind ethanol co-product markets, specifically DDGS and WDG. This report includes analysis in the following areas:
• Market prices of DDGS and WDG; • Market segment and sizes of DDGS and WDG; and • Costs of converting WDG to DDGS.
2.0 MARKET SEGMENT AND SIZE ANALYSIS Using in-house resources, ANTARES has reviewed the major market segments and market sizes for DDGS and WDG. Where possible, ANTARES has also determined end-uses, geographic market distribution, and major buyers.
1 Renewable Fuels Association, Ethanol Industry Statistics, October, 2005. 2 Markham, Steve, “Distillers Dried Grains and Their Impact on Corn, Soymeal, and Livestock Markets”, Presented at Agriculture Outlook Forum, February 25, 2005.

Prepared for Battelle Memorial Institute – November 30, 2005 2
2.1 Distillers Dried Grains and Solubles Production of DDGS is rising in step with the rapid increase of ethanol production in the United States. Expanding existing markets or developing new ones will be important as the ethanol industry looks for additional buyers to maintain co-product demand and prevent product price erosion. Currently, DDGS is used primarily as a high quality feedstuff in feeding dairy cattle, beef cattle, swine, and poultry. ANTARES has attempted to examine important aspects of these markets.
2.1.1 DDGS Market Size ANTARES has presented U.S. market size of DDGS using data obtained by the August 2005 effort. ANTARES estimates the U.S. DDGS annual production capacity of corn dry-grind ethanol mills to be as much as about 10.2 million tons (10% moisture). This estimate represents the maximum size of the market if we assume 100% conversion of distillers’ grain to DDGS. The estimate is based upon corn input data from mills in operation as well as mills under construction as of January 2005. ANTARES used a conversion factor of 18 lbs DDGS per bushel of corn processed. EXHIBIT 1 provides a state-level breakdown of the maximum potential DDGS market size.
Quantity (1,000 tons/year)No Data 1 to 100100 to 300300 to 500500 to 1,0001,000 to 1,5001,500 to 2,0002,000 to 3,000
18,000548,100
1,965,393
2,645,271294,300
362,043109,980
135,000
1,041,300
324,000
121,500
1,351,800
68,400
1,194,435
EXHIBIT 1: DDGS Maximum Market Supply Potential by State
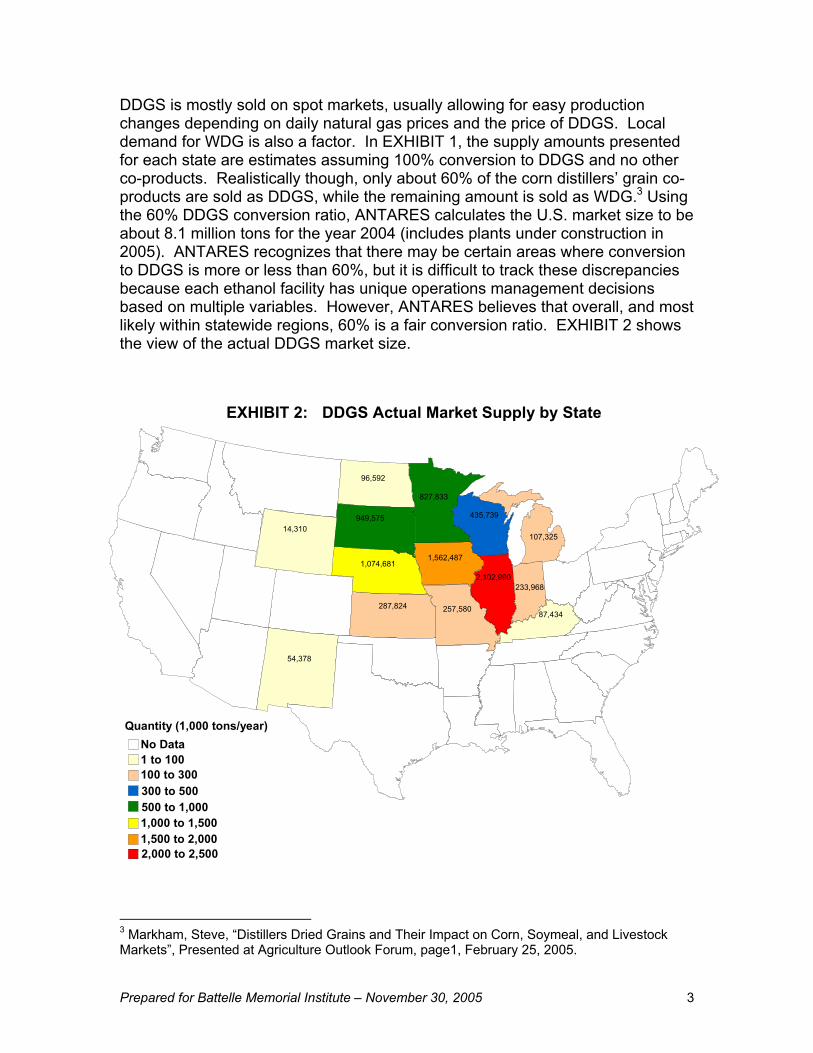
Prepared for Battelle Memorial Institute – November 30, 2005 3
DDGS is mostly sold on spot markets, usually allowing for easy production changes depending on daily natural gas prices and the price of DDGS. Local demand for WDG is also a factor. In EXHIBIT 1, the supply amounts presented for each state are estimates assuming 100% conversion to DDGS and no other co-products. Realistically though, only about 60% of the corn distillers’ grain co-products are sold as DDGS, while the remaining amount is sold as WDG.3 Using the 60% DDGS conversion ratio, ANTARES calculates the U.S. market size to be about 8.1 million tons for the year 2004 (includes plants under construction in 2005). ANTARES recognizes that there may be certain areas where conversion to DDGS is more or less than 60%, but it is difficult to track these discrepancies because each ethanol facility has unique operations management decisions based on multiple variables. However, ANTARES believes that overall, and most likely within statewide regions, 60% is a fair conversion ratio. EXHIBIT 2 shows the view of the actual DDGS market size.
3 Markham, Steve, “Distillers Dried Grains and Their Impact on Corn, Soymeal, and Livestock Markets”, Presented at Agriculture Outlook Forum, page1, February 25, 2005.
EXHIBIT 2: DDGS Actual Market Supply by State
Quantity (1,000 tons/year)No Data 1 to 100100 to 300300 to 500500 to 1,0001,000 to 1,5001,500 to 2,0002,000 to 2,500
14,310
435,739
1,562,487
2,102,990233,968
287,82487,434
107,325
827,833
257,580
96,592
1,074,681
54,378
949,575

Prepared for Battelle Memorial Institute – November 30, 2005 4
2.1.2 Market Segments As stated above, about 60% of dry grind production is marketed as DDGS at 10% moisture. DDGS competes with corn, soybean meal, and dicalcium phosphate in animal feed markets as a source of protein and phosphorus. DDGS has a very long shelf life, and is easily transported from the Corn Belt to across the U.S. and all over the world. The U.S. domestic markets account for about 75% of production, while the remaining 25% is produced to satisfy the demand of international markets. 4 Traditionally, the majority of DDGS sold in domestic U.S. markets has been consumed as a protein supplement by rumens (dairy and beef cattle), which are able to capitalize nutritionally on its high bypass protein.5 DDGS can be fed up to 30% of a rumen’s diet, providing about one-half of the supplemental protein required with the remaining half coming from soybean meal-based protein supplements. The smaller remaining portion of DDGS has been sold as a feed supplement for mongastric animals such as swine and poultry, with a very small portion sold as aquaculture feed. The overall animal feed market is far larger than existing DDGS production capacities, thus theoretically there is room for growth. As dry-grind ethanol production continues to increase, it is essential for plant managers to find growth in non-traditional markets. Much of this growth is expected to come from increased use by monogastric animals. However, the extent of realistic market penetration and growth in market share is questionable. Historically, DDGS has not been used in monogastric diets because of low protein quality, low amino acid digestibility, high fiber content, and nutrient variability among sources. Thus, a negative image of the product must be overcome before widespread use is possible in this segment. Recent research conducted at the University of Minnesota indicated that new ethanol plants are producing co-products with higher nutrient content and digestibility than that listed in the 1998 National Research Council publication on Nutrient Requirements of Swine. The results of this research has shown that DDGS produced by modern ethanol plants is very high quality and is an excellent partial substitute for corn, soybean meal, and dicalcium phosphate in monogastric feeding programs. DDGS is higher in digestible and metabolizable energy, higher in total and digestible amino acids, and higher in available phosphorus compared to DDGS produced at older plants. These positive research results, coupled with higher freight costs in the domestic and export markets, have facilitated the transition of DDGS into the swine and poultry rations. The pie charts in Exhibit 3 show market segment allocation changes in consumption from 2001 to 2004. The consumption by monogastric animals has increased from 4% to 19%.6
4 United States Grains Council, Newsletter, July 23, 2004. 5 University of Minnesota Department of Animal Science, DDGS website, October 12, 2005. 6 G.C. Shurson, Department of Animal Science, University of Minnesota, Presented in South Korea, March 7-11, 2005.
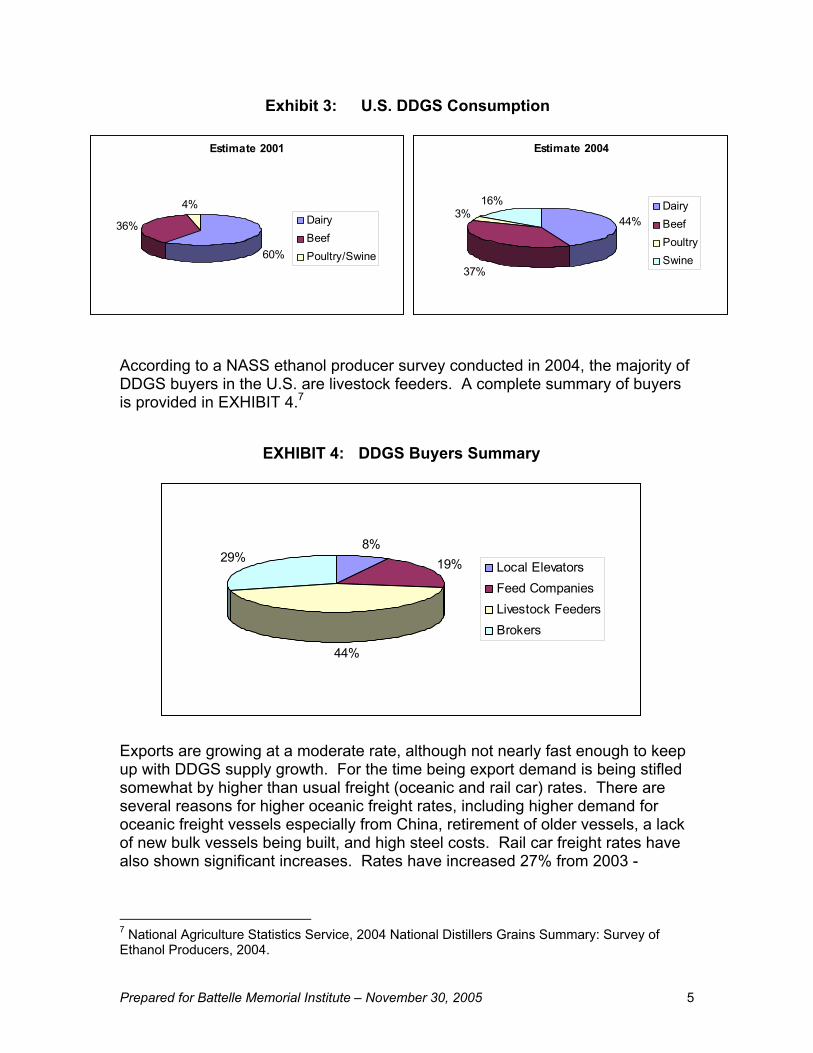
Prepared for Battelle Memorial Institute – November 30, 2005 5
According to a NASS ethanol producer survey conducted in 2004, the majority of DDGS buyers in the U.S. are livestock feeders. A complete summary of buyers is provided in EXHIBIT 4.7 Exports are growing at a moderate rate, although not nearly fast enough to keep up with DDGS supply growth. For the time being export demand is being stifled somewhat by higher than usual freight (oceanic and rail car) rates. There are several reasons for higher oceanic freight rates, including higher demand for oceanic freight vessels especially from China, retirement of older vessels, a lack of new bulk vessels being built, and high steel costs. Rail car freight rates have also shown significant increases. Rates have increased 27% from 2003 -
7 National Agriculture Statistics Service, 2004 National Distillers Grains Summary: Survey of Ethanol Producers, 2004.
8%19%
44%
29%Local ElevatorsFeed CompaniesLivestock FeedersBrokers
EXHIBIT 4: DDGS Buyers Summary
Estimate 2001
60%
36%
4%DairyBeefPoultry/Swine
Estimate 2004
44%
37%
3%16% Dairy
BeefPoultrySwine
Exhibit 3: U.S. DDGS Consumption
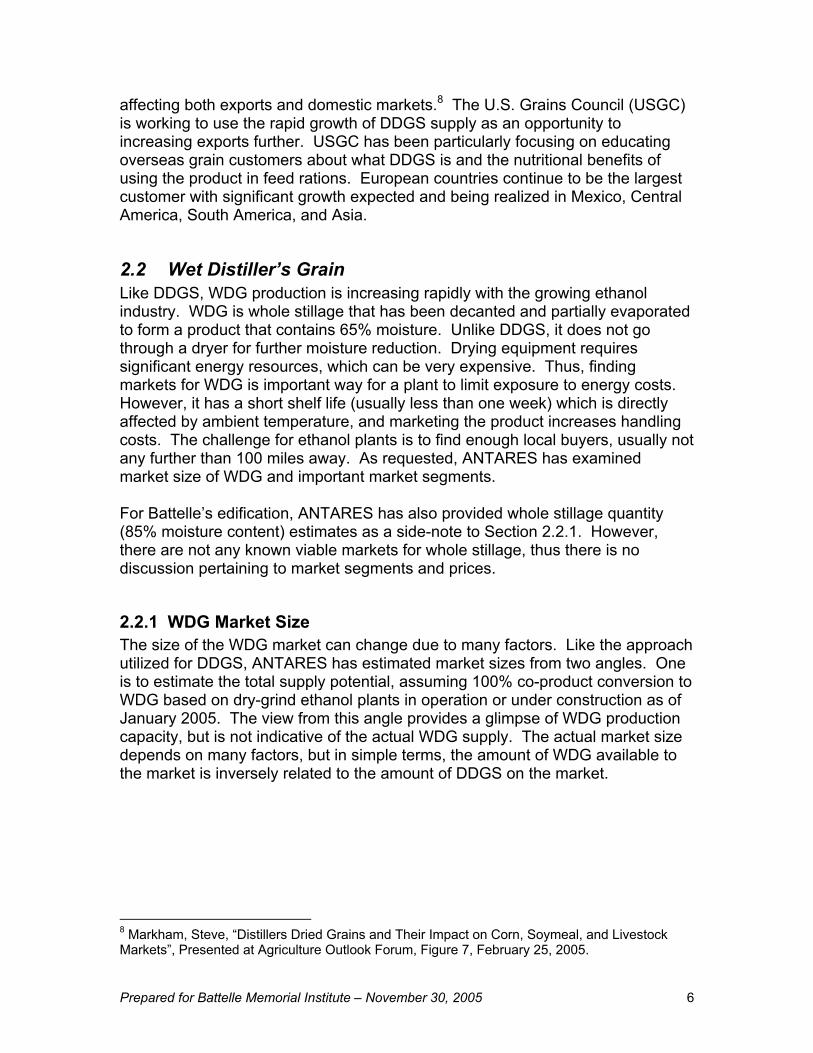
Prepared for Battelle Memorial Institute – November 30, 2005 6
affecting both exports and domestic markets.8 The U.S. Grains Council (USGC) is working to use the rapid growth of DDGS supply as an opportunity to increasing exports further. USGC has been particularly focusing on educating overseas grain customers about what DDGS is and the nutritional benefits of using the product in feed rations. European countries continue to be the largest customer with significant growth expected and being realized in Mexico, Central America, South America, and Asia.
2.2 Wet Distiller’s Grain Like DDGS, WDG production is increasing rapidly with the growing ethanol industry. WDG is whole stillage that has been decanted and partially evaporated to form a product that contains 65% moisture. Unlike DDGS, it does not go through a dryer for further moisture reduction. Drying equipment requires significant energy resources, which can be very expensive. Thus, finding markets for WDG is important way for a plant to limit exposure to energy costs. However, it has a short shelf life (usually less than one week) which is directly affected by ambient temperature, and marketing the product increases handling costs. The challenge for ethanol plants is to find enough local buyers, usually not any further than 100 miles away. As requested, ANTARES has examined market size of WDG and important market segments. For Battelle’s edification, ANTARES has also provided whole stillage quantity (85% moisture content) estimates as a side-note to Section 2.2.1. However, there are not any known viable markets for whole stillage, thus there is no discussion pertaining to market segments and prices.
2.2.1 WDG Market Size The size of the WDG market can change due to many factors. Like the approach utilized for DDGS, ANTARES has estimated market sizes from two angles. One is to estimate the total supply potential, assuming 100% co-product conversion to WDG based on dry-grind ethanol plants in operation or under construction as of January 2005. The view from this angle provides a glimpse of WDG production capacity, but is not indicative of the actual WDG supply. The actual market size depends on many factors, but in simple terms, the amount of WDG available to the market is inversely related to the amount of DDGS on the market.
8 Markham, Steve, “Distillers Dried Grains and Their Impact on Corn, Soymeal, and Livestock Markets”, Presented at Agriculture Outlook Forum, Figure 7, February 25, 2005.
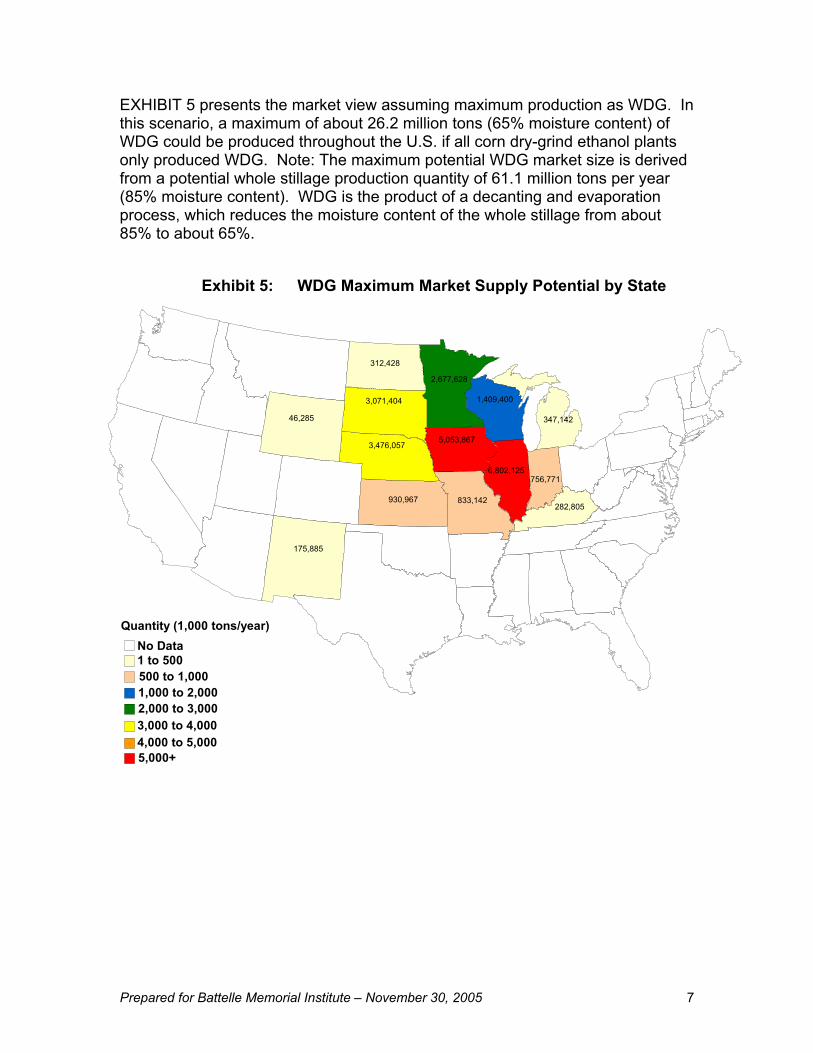
Prepared for Battelle Memorial Institute – November 30, 2005 7
EXHIBIT 5 presents the market view assuming maximum production as WDG. In this scenario, a maximum of about 26.2 million tons (65% moisture content) of WDG could be produced throughout the U.S. if all corn dry-grind ethanol plants only produced WDG. Note: The maximum potential WDG market size is derived from a potential whole stillage production quantity of 61.1 million tons per year (85% moisture content). WDG is the product of a decanting and evaporation process, which reduces the moisture content of the whole stillage from about 85% to about 65%.
Exhibit 5: WDG Maximum Market Supply Potential by State
46,285
1,409,400
5,053,867
6,802,125756,771
930,967282,805
347,142
2,677,628
833,142
312,428
3,476,057
175,885
3,071,404
Quantity (1,000 tons/year)No Data 1 to 500500 to 1,0001,000 to 2,0002,000 to 3,0003,000 to 4,0004,000 to 5,0005,000+

Prepared for Battelle Memorial Institute – November 30, 2005 8
In reality, only about 40% of dry grind co-product is sold as WDG.9 Taking this factor under consideration, we can safely estimate current national production of WDG to be closer to about 5.4 million tons (65% moisture content) per year. This equates to about 12.5 tons per year of whole stillage (85% moisture content). EXHIBIT 6 presents the picture of the national WDG market using this assumption.
EXHIBIT 6: WDG Actual Market Supply by State
2.2.2 Market Segments WDG is a wet animal feed supplement typically having a moisture content of 65%. WDG is difficult to transport and will begin to perish in less than one week due to its high moisture content, therefore buyers usually consist of local animal
9 Markham, Steve, “Distillers Dried Grains and Their Impact on Corn, Soymeal, and Livestock Markets”, Presented at Agriculture Outlook Forum, page 1, February 25, 2005.
9,488
288,927
1,036,042
1,394,435155,138
190,84857,975
71,164
548,913
170,794
64,047
712,591
36,056
629,637
Quantity (1,000 tons/year)No Data 1 to 100100 to 300300 to 500500 to 1,0001,000 to 1,5001,500 to 2,0002,000 to 2,500
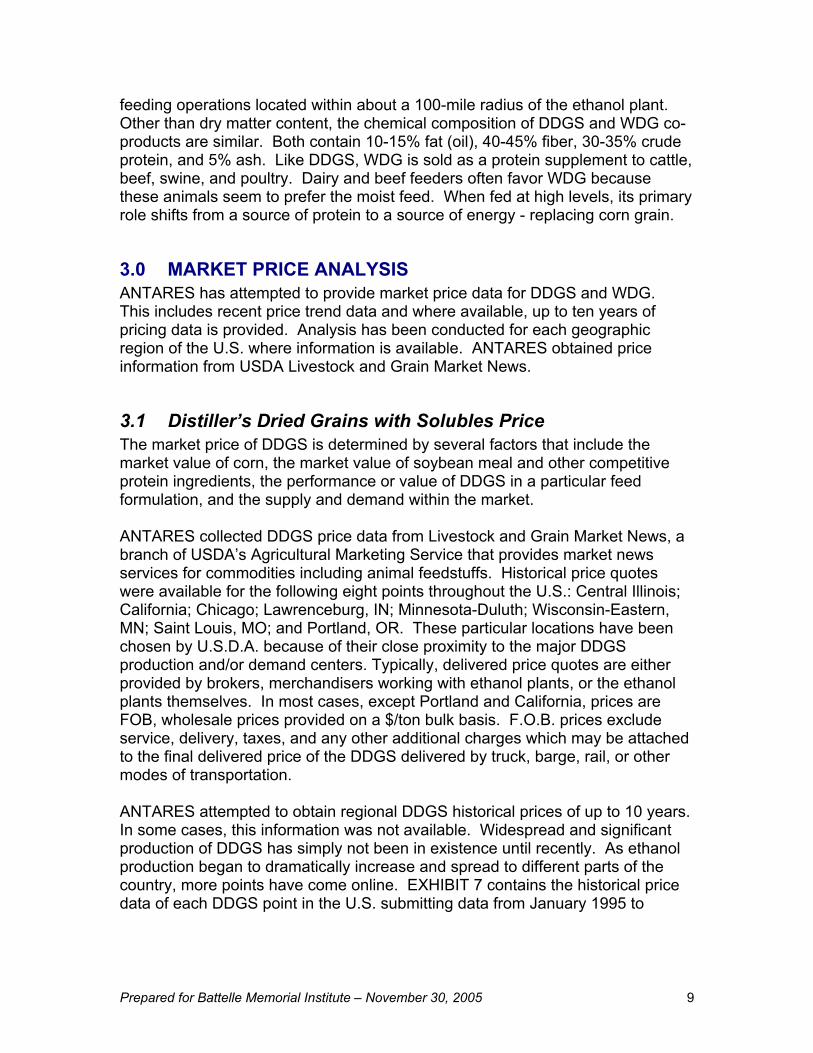
Prepared for Battelle Memorial Institute – November 30, 2005 9
feeding operations located within about a 100-mile radius of the ethanol plant. Other than dry matter content, the chemical composition of DDGS and WDG co-products are similar. Both contain 10-15% fat (oil), 40-45% fiber, 30-35% crude protein, and 5% ash. Like DDGS, WDG is sold as a protein supplement to cattle, beef, swine, and poultry. Dairy and beef feeders often favor WDG because these animals seem to prefer the moist feed. When fed at high levels, its primary role shifts from a source of protein to a source of energy - replacing corn grain.
3.0 MARKET PRICE ANALYSIS ANTARES has attempted to provide market price data for DDGS and WDG. This includes recent price trend data and where available, up to ten years of pricing data is provided. Analysis has been conducted for each geographic region of the U.S. where information is available. ANTARES obtained price information from USDA Livestock and Grain Market News.
3.1 Distiller’s Dried Grains with Solubles Price The market price of DDGS is determined by several factors that include the market value of corn, the market value of soybean meal and other competitive protein ingredients, the performance or value of DDGS in a particular feed formulation, and the supply and demand within the market. ANTARES collected DDGS price data from Livestock and Grain Market News, a branch of USDA’s Agricultural Marketing Service that provides market news services for commodities including animal feedstuffs. Historical price quotes were available for the following eight points throughout the U.S.: Central Illinois; California; Chicago; Lawrenceburg, IN; Minnesota-Duluth; Wisconsin-Eastern, MN; Saint Louis, MO; and Portland, OR. These particular locations have been chosen by U.S.D.A. because of their close proximity to the major DDGS production and/or demand centers. Typically, delivered price quotes are either provided by brokers, merchandisers working with ethanol plants, or the ethanol plants themselves. In most cases, except Portland and California, prices are FOB, wholesale prices provided on a $/ton bulk basis. F.O.B. prices exclude service, delivery, taxes, and any other additional charges which may be attached to the final delivered price of the DDGS delivered by truck, barge, rail, or other modes of transportation. ANTARES attempted to obtain regional DDGS historical prices of up to 10 years. In some cases, this information was not available. Widespread and significant production of DDGS has simply not been in existence until recently. As ethanol production began to dramatically increase and spread to different parts of the country, more points have come online. EXHIBIT 7 contains the historical price data of each DDGS point in the U.S. submitting data from January 1995 to
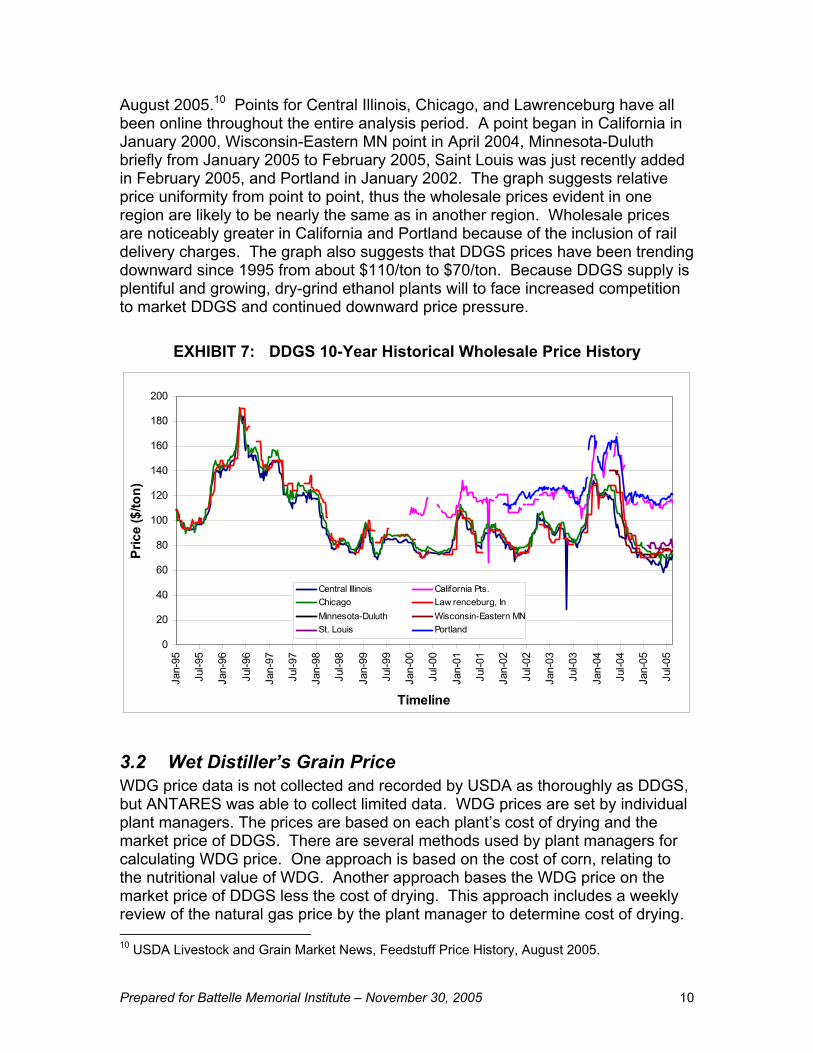
Prepared for Battelle Memorial Institute – November 30, 2005 10
August 2005.10 Points for Central Illinois, Chicago, and Lawrenceburg have all been online throughout the entire analysis period. A point began in California in January 2000, Wisconsin-Eastern MN point in April 2004, Minnesota-Duluth briefly from January 2005 to February 2005, Saint Louis was just recently added in February 2005, and Portland in January 2002. The graph suggests relative price uniformity from point to point, thus the wholesale prices evident in one region are likely to be nearly the same as in another region. Wholesale prices are noticeably greater in California and Portland because of the inclusion of rail delivery charges. The graph also suggests that DDGS prices have been trending downward since 1995 from about $110/ton to $70/ton. Because DDGS supply is plentiful and growing, dry-grind ethanol plants will to face increased competition to market DDGS and continued downward price pressure.
EXHIBIT 7: DDGS 10-Year Historical Wholesale Price History
0
20
40
60
80
100
120
140
160
180
200
Jan-
95
Jul-9
5
Jan-
96
Jul-9
6
Jan-
97
Jul-9
7
Jan-
98
Jul-9
8
Jan-
99
Jul-9
9
Jan-
00
Jul-0
0
Jan-
01
Jul-0
1
Jan-
02
Jul-0
2
Jan-
03
Jul-0
3
Jan-
04
Jul-0
4
Jan-
05
Jul-0
5
Timeline
Pric
e ($
/ton)
Central Illinois California Pts.Chicago Law renceburg, InMinnesota-Duluth Wisconsin-Eastern MNSt. Louis Portland
3.2 Wet Distiller’s Grain Price WDG price data is not collected and recorded by USDA as thoroughly as DDGS, but ANTARES was able to collect limited data. WDG prices are set by individual plant managers. The prices are based on each plant’s cost of drying and the market price of DDGS. There are several methods used by plant managers for calculating WDG price. One approach is based on the cost of corn, relating to the nutritional value of WDG. Another approach bases the WDG price on the market price of DDGS less the cost of drying. This approach includes a weekly review of the natural gas price by the plant manager to determine cost of drying. 10 USDA Livestock and Grain Market News, Feedstuff Price History, August 2005.

Prepared for Battelle Memorial Institute – November 30, 2005 11
That cost is subtracted from the price the product can be sold for as DDGS and that determines the selling price of WDG. Note that WDG is sold on a dry matter basis, thus the price will always be less than the price for DDGS. EXHIBIT 8 shows a calculation example using this approach. 11
EXHIBIT 8: WDG Selling Price Determination Calculation Prices for competing sources of protein, performance in local feeding operations, quality, and consistency may also impact WDG value. The plant must maximize the price of its co-products and should not sell WDG for less than the equivalent price at which it can sell DDGS. The impact of selling WDG is evaluated based on the total DDGS revenue less the savings from the reduction in natural gas use by dryers. As stated Livestock and Grain Market News has limited WDG price data available. Wisconsin-Eastern, MN began submitting wholesale price quotes in April, 2004 and goes through August 2005. This data is shown in EXHIBIT 9. Because WDG prices are set based on the price of DDGS, they move in step with DDGS. The price has gone down from a high of $50/ton in April 2004 to about $20/ton in August 2005.
EXHIBIT 9: WDG Available Wholesale Price History
0
10
20
30
40
50
60
70
80
Apr
-04
May
-04
Jun-
04
Jul-0
4
Aug
-04
Sep
-04
Oct
-04
Nov
-04
Dec
-04
Jan-
05
Feb-
05
Mar
-05
Apr
-05
May
-05
Jun-
05
Jul-0
5
Aug
-05
Timeline
Pric
e ($
/ton) Wisconsin-
Eastern MN
11 Feasibility of Lignite-Powered Ethanol Plants in North Dakota, BBI International, April 15, 2004.
DDGS selling price F.O.B. at the plant $80.00 Cost to dry $20.00 WDG wet price $60.00 WDG selling price ($60.00 X 35% dry matter) $21.00
Prepared for Battelle Memorial Institute – November 30, 2005 12
4.0 CONVERSION COST ANALYSIS As discussed in the August 2005 report, corn mills use a significant portion of their overall energy requirements drying wet co-products into dry animal feed products. Under the right conditions, it might be beneficial to use the WDG as a LTCHG feedstock for onsite electricity generation instead of using energy intensive solid separation and drying equipment to convert to DDGS for use in the animal feed markets. ANTARES has used in-house and industry resources to determine the cost of converting WDG to DDGS. The cost estimates consider expected capital costs and O&M costs expected from an average sized dry-grind ethanol plant using commonly utilized solids separation and drying equipment with typical efficiencies.
4.1 Capital Cost The primary equipment items required to produce DDGS include: moisture separators, evaporators, dryers, and thermal oxidizers with heat recovery steam generators (HRSG). ANTARES used in-house resources and industry contacts, where necessary, to obtain cost estimates for equipment used by a modern-day dry-grind ethanol plant. ANTARES used a 40-million gallon per year ethanol plant as the cost basis, which is indicative of the average plant size built during the last two years and plants currently under construction. Further details are provided below. Moisture separators - remove much of the water from the whole stillage immediately following distillation. The most common types of moisture separators are presses/extruders, decanter centrifuges, and screen centrifuges. The liquid extracted is called thin stillage, which in most cases, is sent on to evaporator units for further separation of solids. ANTARES in-house resources suggest the installed cost of a decanter centrifuge system to be approximately $3.2 million.12 Evaporators – concentrate thin stillage to syrup-like solubles before being mixed back with the insoluble solids to form WDG. The most commonly used evaporator today is the plate evaporator (PE). The PE is a rising-film evaporator with a plate pattern specially designed for evaporation duties. According to in-house resources, PE evaporation equipment could be installed for about $4.4 million.13 Dryers – proper drying of distiller’s grains is a key part of a successful plant. Most of a plant’s profit is in the ability to produce a quality DDGS product that is consistent in moisture, color, and texture. Ethanol plants use several types of
12 Commercialization of Corn to Ethanol in New York State, NYSERDA, p. E-3, May 2000 13 Commercialization of Corn to Ethanol in New York State, NYSERDA, p. E-3, May 2000
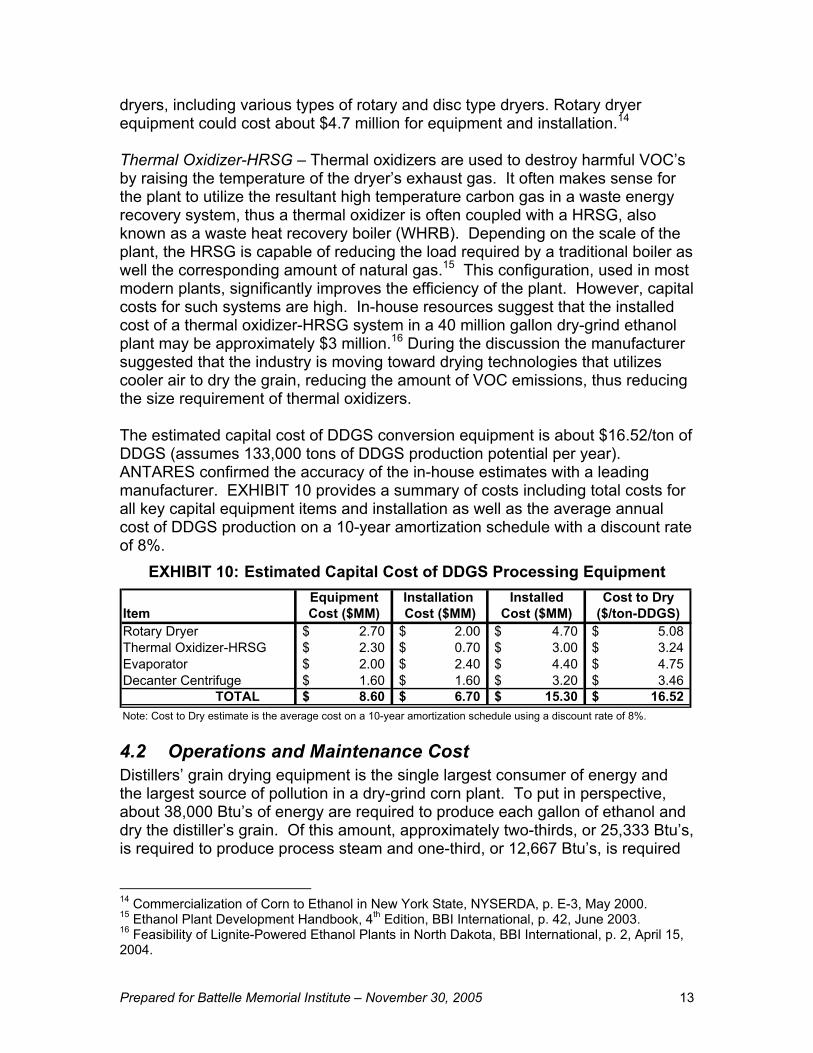
Prepared for Battelle Memorial Institute – November 30, 2005 13
dryers, including various types of rotary and disc type dryers. Rotary dryer equipment could cost about $4.7 million for equipment and installation.14 Thermal Oxidizer-HRSG – Thermal oxidizers are used to destroy harmful VOC’s by raising the temperature of the dryer’s exhaust gas. It often makes sense for the plant to utilize the resultant high temperature carbon gas in a waste energy recovery system, thus a thermal oxidizer is often coupled with a HRSG, also known as a waste heat recovery boiler (WHRB). Depending on the scale of the plant, the HRSG is capable of reducing the load required by a traditional boiler as well the corresponding amount of natural gas.15 This configuration, used in most modern plants, significantly improves the efficiency of the plant. However, capital costs for such systems are high. In-house resources suggest that the installed cost of a thermal oxidizer-HRSG system in a 40 million gallon dry-grind ethanol plant may be approximately $3 million.16 During the discussion the manufacturer suggested that the industry is moving toward drying technologies that utilizes cooler air to dry the grain, reducing the amount of VOC emissions, thus reducing the size requirement of thermal oxidizers. The estimated capital cost of DDGS conversion equipment is about $16.52/ton of DDGS (assumes 133,000 tons of DDGS production potential per year). ANTARES confirmed the accuracy of the in-house estimates with a leading manufacturer. EXHIBIT 10 provides a summary of costs including total costs for all key capital equipment items and installation as well as the average annual cost of DDGS production on a 10-year amortization schedule with a discount rate of 8%.
EXHIBIT 10: Estimated Capital Cost of DDGS Processing Equipment Equipment Installation Installed Cost to Dry
Item Cost ($MM) Cost ($MM) Cost ($MM) ($/ton-DDGS)Rotary Dryer 2.70$ 2.00$ 4.70$ 5.08$ Thermal Oxidizer-HRSG 2.30$ 0.70$ 3.00$ 3.24$ Evaporator 2.00$ 2.40$ 4.40$ 4.75$ Decanter Centrifuge 1.60$ 1.60$ 3.20$ 3.46$
TOTAL 8.60$ 6.70$ 15.30$ 16.52$ Note: Cost to Dry estimate is the average cost on a 10-year amortization schedule using a discount rate of 8%.
4.2 Operations and Maintenance Cost Distillers’ grain drying equipment is the single largest consumer of energy and the largest source of pollution in a dry-grind corn plant. To put in perspective, about 38,000 Btu’s of energy are required to produce each gallon of ethanol and dry the distiller’s grain. Of this amount, approximately two-thirds, or 25,333 Btu’s, is required to produce process steam and one-third, or 12,667 Btu’s, is required
14 Commercialization of Corn to Ethanol in New York State, NYSERDA, p. E-3, May 2000. 15 Ethanol Plant Development Handbook, 4th Edition, BBI International, p. 42, June 2003. 16 Feasibility of Lignite-Powered Ethanol Plants in North Dakota, BBI International, p. 2, April 15, 2004.

Prepared for Battelle Memorial Institute – November 30, 2005 14
to convert the distiller’s grain to DDGS.17 It is important to note that the overall plant efficiencies will be significantly altered by the type of dryer utilized and the subsequent volume of VOC’s driven off the grain into the thermal oxidizer/HRSG recovery system. These factors will have a direct affect on natural gas demand and expenditures and thus, the operating cost of drying DDGS. As mentioned, the industry is moving toward the use of cooler inlet-temperature dryers which drive off less VOC’s and therefore less fuel to the thermal oxidizer-HRSG system. DDGS produced by these cooler (and smaller) systems will retain high nutrient qualities vitally important to marketability to animal feeders. Thus, there is a tradeoff between natural gas demand and DDGS quality. Approximately 85% of dry-grind ethanol plants use natural gas, therefore, as seen in EXHIBIT 11, industrial natural gas rates have been used to calculate the estimated operations cost associated with the dryers. ANTARES used undelivered industrial natural gas spot price estimates of $9.00/MMBtu.18 A relatively smaller portion of overall energy consumption is consumed by the decanter centrifuge motor(s). An average industrial electricity rate of $5.47 cents/kWh has been used to factor in the cost of electricity required by the decanter centrifuge motors. An average size ethanol plant of 40 million gallons should expect to spend close to $4.6 million per year in drying equipment operating costs, translating to about $35/ton of DDGS produced.
EXHIBIT 11: Operations Cost of Drying to DDGS Ethanol Capacity Total Energy1 DDGS Capacity2 Drying Demand3 Cost to Dry4,5 Cost to Dry
(gal/year) (MMBtu/year) (tons/year) (MMBtu/year) ($/year) ($/ton DDGS)10,000,000 380,000 33,333 126,670 1,151,510$ 34.55$ 20,000,000 760,000 66,667 253,340 2,303,020$ 34.55$ 40,000,000 1,520,000 133,333 506,680 4,606,039$ 34.55$ 80,000,000 3,040,000 266,667 1,013,360 9,212,078$ 34.55$
1) Total of 38,000 Btu's required to produce a gallon of Ethanol, BBI International, June 2003.2) Assumes conversion factor of 18 lbs DDGS/Bu of corn3) 12,667 Btu's required for drying DDGS per gallon of ethanol, BBI International, June 2003.4) Assumes industrial NG price of $9.00/MMBtu, Energy Information Administration.5) Assumes industrial average electricity price of 5.47 cents/kWh for decanter centrifuge, Energy Information Administration. The dryers are typically the highest maintenance item in a dry-grind ethanol plant primarily because of the many mechanical conveyors. Maintenance for rotary dryers involves usual lubrication of bearings and the replacement of the metal rim around the drum and the metal wheels on the dryer base. These replacements are usually necessary about once every five years and cost from $10,000 to $20,000.19 Normal maintenance of thermal oxidizers consists of greasing bearings, replacing gasket, fan belts and filters, which are relatively low cost.
17 BBI International, Ethanol Plant Development Handbook, 4th Edition, p. 15, June, 2003. 18 Energy Information Administration, industrial natural gas spot price forecast for 2005-2006. 19 Badger, Phillip; Processing Cost Analysis for Biomass Feedstocks, October 2002.
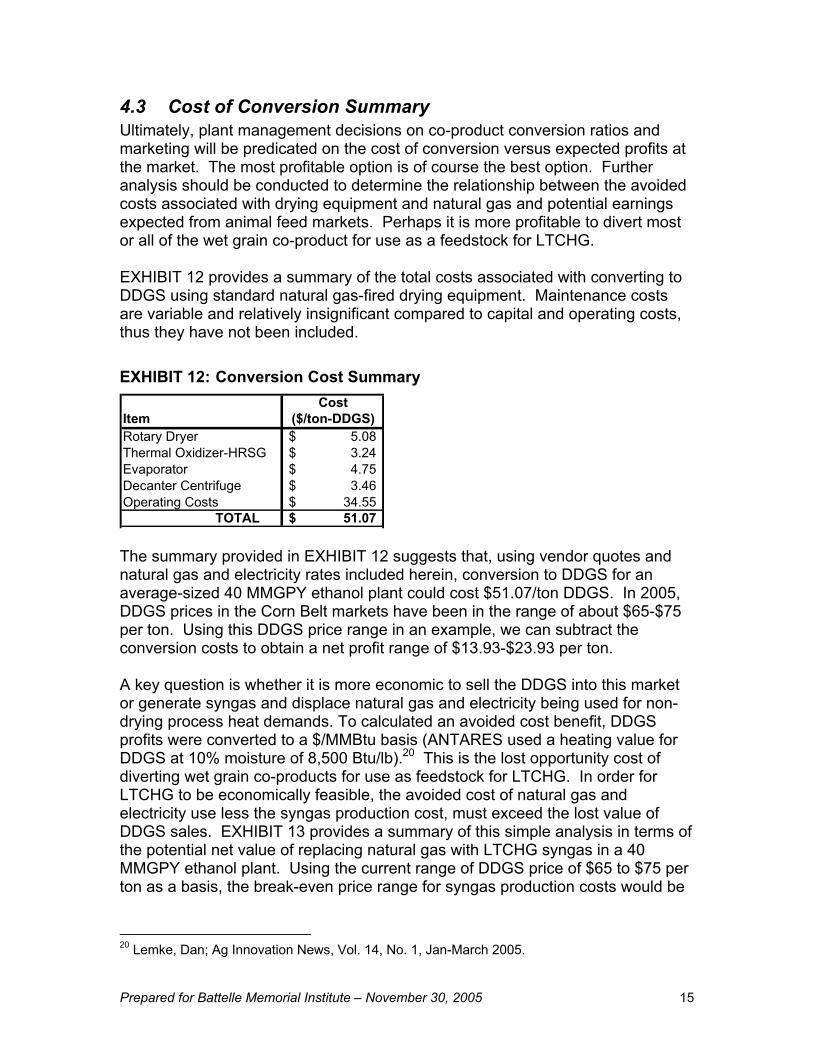
Prepared for Battelle Memorial Institute – November 30, 2005 15
4.3 Cost of Conversion Summary Ultimately, plant management decisions on co-product conversion ratios and marketing will be predicated on the cost of conversion versus expected profits at the market. The most profitable option is of course the best option. Further analysis should be conducted to determine the relationship between the avoided costs associated with drying equipment and natural gas and potential earnings expected from animal feed markets. Perhaps it is more profitable to divert most or all of the wet grain co-product for use as a feedstock for LTCHG. EXHIBIT 12 provides a summary of the total costs associated with converting to DDGS using standard natural gas-fired drying equipment. Maintenance costs are variable and relatively insignificant compared to capital and operating costs, thus they have not been included. EXHIBIT 12: Conversion Cost Summary
CostItem ($/ton-DDGS)Rotary Dryer 5.08$ Thermal Oxidizer-HRSG 3.24$ Evaporator 4.75$ Decanter Centrifuge 3.46$ Operating Costs 34.55$
TOTAL 51.07$ The summary provided in EXHIBIT 12 suggests that, using vendor quotes and natural gas and electricity rates included herein, conversion to DDGS for an average-sized 40 MMGPY ethanol plant could cost $51.07/ton DDGS. In 2005, DDGS prices in the Corn Belt markets have been in the range of about $65-$75 per ton. Using this DDGS price range in an example, we can subtract the conversion costs to obtain a net profit range of $13.93-$23.93 per ton. A key question is whether it is more economic to sell the DDGS into this market or generate syngas and displace natural gas and electricity being used for non-drying process heat demands. To calculated an avoided cost benefit, DDGS profits were converted to a $/MMBtu basis (ANTARES used a heating value for DDGS at 10% moisture of 8,500 Btu/lb).20 This is the lost opportunity cost of diverting wet grain co-products for use as feedstock for LTCHG. In order for LTCHG to be economically feasible, the avoided cost of natural gas and electricity use less the syngas production cost, must exceed the lost value of DDGS sales. EXHIBIT 13 provides a summary of this simple analysis in terms of the potential net value of replacing natural gas with LTCHG syngas in a 40 MMGPY ethanol plant. Using the current range of DDGS price of $65 to $75 per ton as a basis, the break-even price range for syngas production costs would be
20 Lemke, Dan; Ag Innovation News, Vol. 14, No. 1, Jan-March 2005.
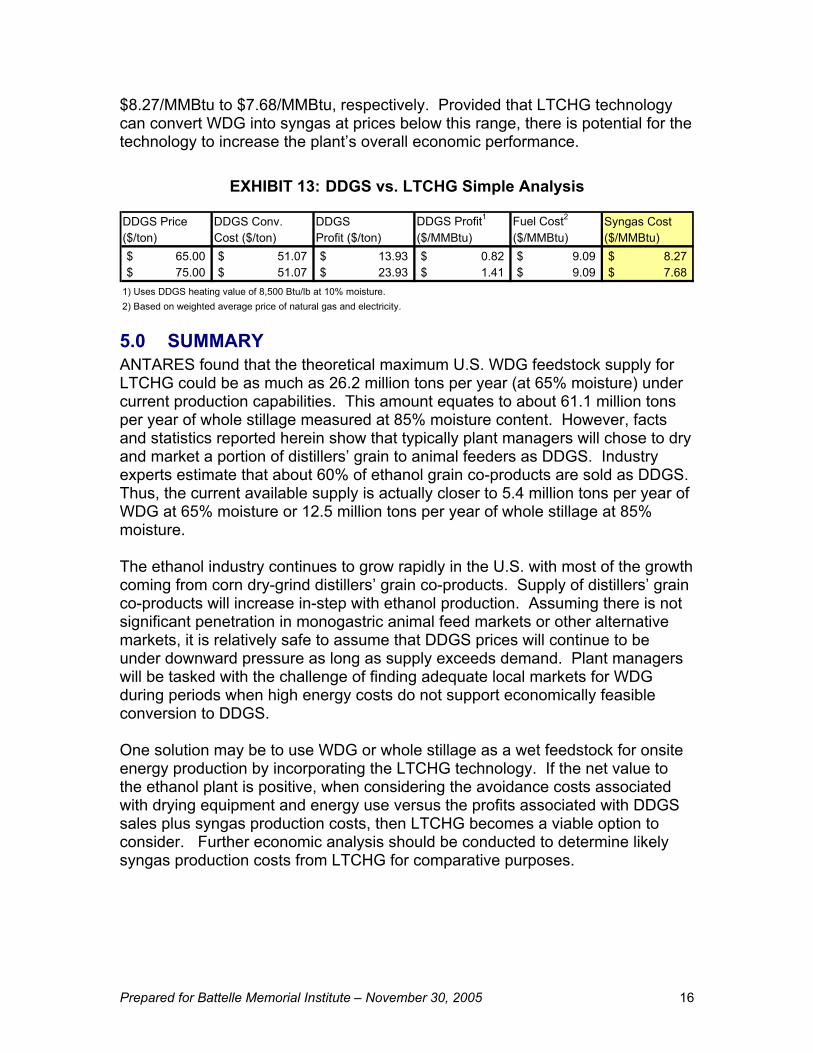
Prepared for Battelle Memorial Institute – November 30, 2005 16
$8.27/MMBtu to $7.68/MMBtu, respectively. Provided that LTCHG technology can convert WDG into syngas at prices below this range, there is potential for the technology to increase the plant’s overall economic performance.
EXHIBIT 13: DDGS vs. LTCHG Simple Analysis
DDGS Price DDGS Conv. DDGS DDGS Profit1 Fuel Cost2 Syngas Cost($/ton) Cost ($/ton) Profit ($/ton) ($/MMBtu) ($/MMBtu) ($/MMBtu)
65.00$ 51.07$ 13.93$ 0.82$ 9.09$ 8.27$ 75.00$ 51.07$ 23.93$ 1.41$ 9.09$ 7.68$
1) Uses DDGS heating value of 8,500 Btu/lb at 10% moisture.2) Based on weighted average price of natural gas and electricity.
5.0 SUMMARY ANTARES found that the theoretical maximum U.S. WDG feedstock supply for LTCHG could be as much as 26.2 million tons per year (at 65% moisture) under current production capabilities. This amount equates to about 61.1 million tons per year of whole stillage measured at 85% moisture content. However, facts and statistics reported herein show that typically plant managers will chose to dry and market a portion of distillers’ grain to animal feeders as DDGS. Industry experts estimate that about 60% of ethanol grain co-products are sold as DDGS. Thus, the current available supply is actually closer to 5.4 million tons per year of WDG at 65% moisture or 12.5 million tons per year of whole stillage at 85% moisture. The ethanol industry continues to grow rapidly in the U.S. with most of the growth coming from corn dry-grind distillers’ grain co-products. Supply of distillers’ grain co-products will increase in-step with ethanol production. Assuming there is not significant penetration in monogastric animal feed markets or other alternative markets, it is relatively safe to assume that DDGS prices will continue to be under downward pressure as long as supply exceeds demand. Plant managers will be tasked with the challenge of finding adequate local markets for WDG during periods when high energy costs do not support economically feasible conversion to DDGS. One solution may be to use WDG or whole stillage as a wet feedstock for onsite energy production by incorporating the LTCHG technology. If the net value to the ethanol plant is positive, when considering the avoidance costs associated with drying equipment and energy use versus the profits associated with DDGS sales plus syngas production costs, then LTCHG becomes a viable option to consider. Further economic analysis should be conducted to determine likely syngas production costs from LTCHG for comparative purposes.
Prepared for Battelle Memorial Institute – November 30, 2005 17
REFERENCES
1) Badger, Phillip, Processing Cost Analysis for Biomass Feedstocks, October 2002.
2) Commercialization of Corn to Ethanol in New York State, NYSERDA,
p. E-3, May 2000.
3) Ethanol Plant Development Handbook, 4th Edition, BBI International, p. 42, June 2003.
4) Feasibility of Lignite-Powered Ethanol Plants in North Dakota, BBI
International, April 15, 2004.
5) Lemke, Dan; Ag Innovation News, Vol. 14, No. 1, Jan-March 2005.
6) Markham, Steve, “Distillers Dried Grains and Their Impact on Corn, Soymeal, and Livestock Markets”, Presented at Agriculture Outlook Forum, February 25, 2005.
7) National Agriculture Statistics Service, 2004 National Distillers Grains
Summary: Survey of Ethanol Producers, 2004.
8) Renewable Fuels Association, Ethanol Industry Statistics, October, 2005.
9) Shurson, G.C., Department of Animal Science, University of
Minnesota, Presented in South Korea, March 7-11, 2005.
10) USDA Livestock and Grain Market News, Feedstuff Price History, August 2005.
11) United States Grains Council, Newsletter, July 23, 2004.
12) University of Minnesota Department of Animal Science, DDGS
website, October 12, 2005.