Embed Size (px)
Citation preview

311 A&U A/o. V/ty'
THE INDUSTRIAL REPRESENTATIVE'S PERCEPTION OF THE IMPACT OF
MANAGERIAL CONTROL SYSTEMS ON PERFORMANCE
DISSERTATION
Presented to the Graduate Council of the
University of North Texas in Partial
Fulfillment of the Requirements
For the Degree of
DOCTOR OF PHILOSOPHY
By
Richard A. Dunipace, B.B.A, M.B.A.
Denton, Texas
August, 1995

Dunipace, Richard A., The Industrial Representative's
Perception of the Impact of Managerial Control Systems on
Performance. Doctor of Philosophy (Marketing), August,
1995, 227 pp., 21 tables, 13 illustrations, bibliography,
206 titles.
The objective of this study was to examine whether the
factors which constitute the manufacturer/industrial-
representative relationship, influence performance as
predicted by control theory. In addition, the study
evaluated the contribution of selected demographic factors
such as size of the firm, and the representative's
experience, on performance.
A self-selected convenience sample of members of the
Manufacturer's Representative Educational Research
Foundation was taken. A self-administered questionnaire was
mailed to each respondent. Follow-ups using postcards and
further mailings were used to increase the response rate. A
usable response rate of 71 percent was achieved.
Overall, the control form used to manage the
manufacturer/representative relationship was a significant
predictor of the success of the relationship. Control based
on close working relationships (i.e., behavior-based
control) produced significantly higher performance than
relationships based on simply focusing on sales (i.e.,

output-based control). Close relationships involve mutual
sharing of resources, depth and quality of communications,
and mutual involvement in the sales process. They are also
characterized by warmer more caring interorganizational
climates.
The implications of the findings of the research for
the manufacturer are as follows. To maximize the
representative's selling performance, the manufacturer
should actively work with the representative, and involve
him as much as possible in the selling process. That is,
the manufacturer should use behavior-based control and
manage the relationship so as to produce a most-important
relationship. Most-important relationships are those that
generate the most commissions for the representative and the
greatest sales for the manufacturer. The manufacturer
should invest in specific assets, encourage trust, be
supportive, communicate often and in detail, and freely
share or provide selling aids and information. The
representative should be treated as a valued member of the
selling team and of the business.

©Copyright by
Richard A. Dunipace
1995

ACKNOWLEDGEMENTS
I have many people to thank for this dissertation. The
first, and by far the greatest, thanks go to Dr. John
Crawford, my dissertation chairman. Without his constant
effort and encouragement this dissertation might never have
been finished. My other committee members Drs. Krishna
Erramilli, J.B Spalding, and Kenneth Koelln provided
suggestions and helpful criticisms throughout the work.
Richard Hayslett of the Power-Motion Technology
Representative Association and Dr. Marilyn Stephens of the
Manufacturers1 Representatives Educational Research
Foundation for their advice and comments, and to the members
of the associations who funded the survey, in part, and who
took the time to fill out and return the questionnaire.
My thanks to Jim Hughes, Nick Langston, and Art Hirsch
for their help in refining the questionnaire, and to Frank
Bistrum, Bill Bess, Hank Bergson, Gregg Marshall, Gary
Kavalar, Paul Dykstra, Carol Wagner, Jack Springer, and
Richard Upton for their suggestions and support in making
the questionnaires available to their representative
associations memberships.
Finally, and most importantly, I wish to thank my wife
Pat for providing the encouragement and support to carry me
throughout this process.
iv

TABLE OF CONTENTS
Page
ACKNOWLEDGMENTS iv
LIST OF TABLES viii
LIST OF ILLUSTRATIONS X
CHAPTER I: OVERVIEW AND INTRODUCTION TO STUDY
Introduction 1
The Manufacturer-Rep Relationship 6 Literature Review 7 Purpose of the Research 9 Justification for the Study 10 Research Design 11
The Data Collection Instrument 11 The Sampling Design 12 Summary of the Design 13
Significance of the Study 13 Organization of the Dissertation 13 Chapter References 15
CHAPTER II: LITERATURE REVIEW
Introduction 19 The Control Issue 19
Control Theory 21 Formal Controls 22 Informal Controls 25 Summary 26
Agency Theory 27 Human Influence Factors 29
Opportunism 31 Bounded Rationality 31 Risk Aversion 32
Organizational Factors 33 Goal Conflict 33 Uncertainty 33 Risk Sharing 34 Market Efficiency and Equilibrium . . . . 35
Informational Factors 35 Information Asymmetry 35 Purchasable Commodity 36
Chapter Summary 38 Chapter References 39
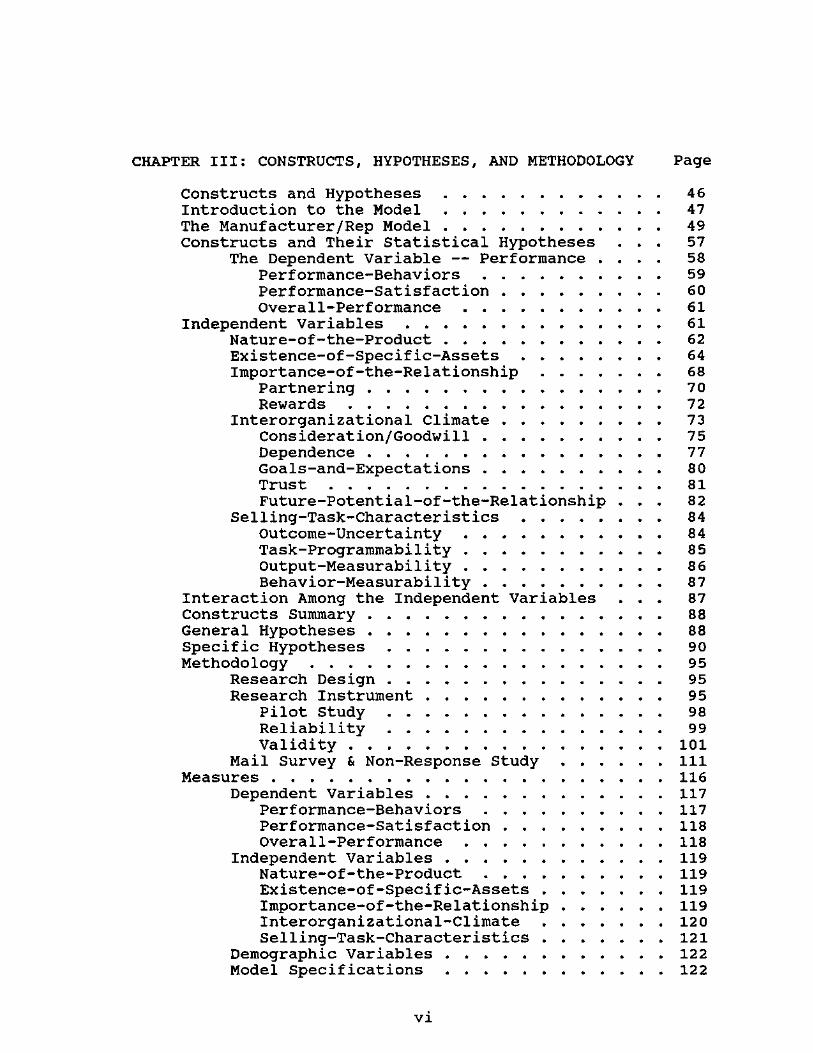
CHAPTER III: CONSTRUCTS, HYPOTHESES, AND METHODOLOGY Page
Constructs and Hypotheses 46 Introduction to the Model 47 The Manufacturer/Rep Model 49 Constructs and Their Statistical Hypotheses . . . 57
The Dependent Variable — Performance . . . . 58 Performance-Behaviors 59 Performance-Satisfaction 60 Overall-Performance 61
Independent Variables 61 Nature-of-the-Product 62 Existence-of-Specific-Assets 64 Importance-of-the-Relationship 68
Partnering 70 Rewards 72
Interorganizational Climate 73 Consideration/Goodwill 75 Dependence 77 Goals-and-Expectations 80 Trust 81 Future-Potential-of-the-Relationship . . . 82
Selling-Task-Characteristics 84 Outcome-Uncertainty 84 Task-Programmability 85 Output-Measurability 86 Behavior-Measurability 87
Interaction Among the Independent Variables . . . 87 Constructs Summary 88 General Hypotheses 88 Specific Hypotheses 90 Methodology 95
Research Design 95 Research Instrument 95
Pilot Study 98 Reliability 99 Validity 101
Mail Survey & Non-Response Study Ill Measures 116
Dependent Variables 117 Performance-Behaviors 117 Performance-Satisfaction 118 Overall-Performance 118
Independent Variables 119 Nature-of-the-Product 119 Existence-of-Specific-Assets 119 Importance-of-the-Relationship 119 Interorganizational-Climate 120 Selling-Task-Characteristics 121
Demographic Variables 122 Model Specifications 122
VI

Page
CHAPTER REFERENCES 129
CHAPTER IV: RESULTS 140 The Response Pattern Analysis 140 Demographic Analysis of Respondents 142 Hypotheses Testing 147
Testing the Assumptions 153 Overall-Control-Form 157 Conclusion 162
Chapter Summary 164 Chapter References 166
CHAPTER V: REVIEW, CONCLUSIONS AND RECOMMENDATIONS 167
Review of the Study 167 Implications of the Findings 171
Nature-of-the-Product 172 Existence-of-Specific-Assets 173 Importance-of-the-Relationship 174 Interorganizational-Climate 176 Selling-Task-Characteristics 178 Control Form 179 Manufacturers' Marketing Managers 181 Implications for the Rep 181
Contributions of the Study 184 Limitations of the Study 186 Areas for Further Research 188
APPENDIX A. RESEARCH INSTRUMENT 190
B. SCALE ITEMS FOR RESEARCH INSTRUMENT 195 Table A. 1 — Nature-of-the-Product 196 Table A.2 — Existence-of-Specific-Assets . . 196 Table A.3 — Importance-of-the-Relationship . 197 Table A.4 — Interorganizational-Climate . . 198 Table A.5 — Selling-Task-Characteristics . . 199 Table A. 6 — Performance 200
C. SURVEY COVER LETTER 201
D. REGRESSION ASSUMPTIONS 203
BIBLIOGRAPHY 210
Vll

LIST OF TABLES
CHAPTER 2:
TABLE 2.1 TABLE 2.2
Page
Forms of Control 22 Agency Theory Overview 37
CHAPTER 3:
TABLE 3.1 — The Control Model 49 TABLE 3.2 — Rep Sales Force Management Constructs,
Variables, and Descriptions 89 TABLE 3.3 — Churchill's Procedure for Developing
Better Measures of Constructs 97 TABLE 3.4 — Reliability Coefficients for the Study . . 102 TABLE 3.5 — Factor Analysis of Study Variables:
Final Scale Variables (Least-Important-Principal) 109
TABLE 3.6 — Factor Analysis of Study Variables: Final Scale Variables (Most-Important-Principal) Ill
TABLE 3.7 — Mail Survey Events 115 TABLE 3.8 — Survey Response Pattern 117
CHAPTER 4:
TABLE 4.1 TABLE 4.2 TABLE 4.3
TABLE 4.4
TABLE 4.5
TABLE 4.6
TABLE 4.7
TABLE 4.8
TABLE 4.9
Summary of Demographic Findings 144 Demographic Profile of Study 146 Regression Results: Most-Important-Principal 151
Regression Results: Least-Important-Principal 154
Comparison of the Control Form of Each Construct Vs. the Type of Principal 158
Overall Control Profile: Most-Important-Principal 162
Overall Control Profile: Least-Important-Principal 163
Hypotheses Results: Most-Important-Principal 164
Hypotheses Results: Least-Important-Principal 165
Vlll

Page
CHAPTER 5:
TABLE 5.1 — Comparison of the Least-Important-Principal Vs. Most-Important-Principal: Existence-of-Specific-Assets 174
TABLE 5.2 — Summary of Analysis Results 185
IX

LIST OF ILLUSTRATIONS
CHAPTER 1:
FIGURE 1.1 FIGURE 1.2
Traditional Sales Force Control Model Agency View of Sales Force Management
Page
. 3
. 6
CHAPTER 2:
FIGURE 2.1 Agency Influence Factors in the Selling Environment 30
CHAPTER 3;
FIGURE 3.1 - Control Method Choice Factors in the Agency Selling Environment 51
- Managing the Rep Sales Force 52 - Expected Control Form Versus Rep
Management Factors 54 - Conceptual Rep Management Model 55 - The Overall-Control-Form Model 57 - Organizational Theory Model of Performance
(Modified to Include Strategy) 64 FIGURE 3.7 — Operational Rep Management Model . . . . 91
FIGURE 3.2 FIGURE 3.3
FIGURE 3.4 FIGURE 3.5 FIGURE 3.6
CHAPTER 4:
FIGURE 4.1 — Histogram of the Standardized Residuals Produced When Evaluating Overall-Performance for the Least-Important-Principal 155
FIGURE 4.2 — Normal Probability Plot of the Observed Versus Expected Cumulative Probability of the Standardized Residuals Produced When Evaluating Overall-Performance for the Least-Important- Principal . . . 156
FIGURE 4.3 — Scatterplot of the Regression Residuals Versus the Regression Predicted Values Produced When Evaluating Overall-Performance for the Least-Important-Principal . . . 156
x

CHAPTER I
OVERVIEW OF STUDY
Introduction
Since the 1970's, there has been a growing trend toward
using a manufacturer's representative (rep) rather than a
direct sales force to perform the personal selling function.
Independent reps are agent middlemen who are contracted to
sell the output for one or more principals, they generally
carry several product lines, manage their territory as they
see fit, and are responsible for their own selling expenses.
They are paid on a commission basis, do not take title to
the goods they sell, and have no authority to modify their
principal's instructions as to price, terms of sale, etc.
Hitchcock (1984) estimated that up to 50,000 U.S.
manufacturers use independent reps. Taylor (1990) raised
this number to 75,000 firms. In support, a recent survey
found that 6.6 percent of the total volume of sales was
accounted for by outside sales agencies in the 1990's
(O'Connell and Keenan 1990). The reasons given for the
increased use of reps include: 1) the increasing rate of a
sales call annualized at just over 11%, or an average of
$239 per call in conjunction with the inability of firms to
raise their prices correspondingly (respondents indicate an
average rise of only 5% over the last three years); and 2)
1

2
it takes between 3-7 calls to close a sale placing the cost
of a sale at between $717 and $1,673 (O'Connell and Keenan
1990). This emphasizes the need for increased efficiency
and effectiveness of the selling function.
Since reps are responsible for their own selling costs
and are paid based on sales, they should be the preferred
selling method. However, not all companies use reps, and in
many cases where reps are used, both the company and the rep
are dissatisfied with the relationship. This
dissatisfaction may be due to the way in which the
relationship is managed. Many principals treat reps as they
would their own salespeople. They see the rep as simply an
extension of the direct sales force and evaluate him on his
ability to follow established procedures and guidelines as
well as achieving sales goals. Conversely, reps may be
managed as if they are independent contractors charged
strictly with achieving sales goals. These two managerial
methods can be classified as behavior control and output
control (See Figure 1.1).
Behavior control presumes that if the proper procedures
are followed by the salesperson, sales will result (cf.,
Ouchi 1977, 1979). Behavior control focuses on the process
used to sell products such as sales calls, sales reports,
and effective communications with customers. The principal
advantage of behavior control is the high degree of hands-
on-management it affords the sales manager.

FIGURE 1.1 TRADITIONAL SALES FORCE CONTROL MODEL
Behavior Control
Focuses on Sales Process
Sales Management •-
w Focuses on Sales Process
Sales Management •-
Output Control
Focuses on Final Sale
w- Focuses on Final Sale
The sales manager directs the behaviors of the sales force
based upon his view of how the selling process should be
conducted. This works favorably for well understood,
standardized products and markets. It can also allow the
selling process to be better integrated into a long-term
business strategy. A longer-term orientation yields many
benefits including: 1) enhanced ability to plan or forecast
for future sales of new or present products, 2) enhanced
customer relations because more time may be spent building
and maintaining such relationships, 3) easier management of
the sales force since they are not paid solely on sales but
upon their selling behaviors (e.g., working with customers,
maintaining records for the principal, etc.) and 4) a better
trained sales force (Anderson and Oliver 1987). The
disadvantages of behavior-based control include: (1) the
complexity and subjectivity of evaluating salespeople due to
biases, ignorance, halo effects, and lack of credibility of

4
the evaluation process; (2) the difficulty of dealing with
longer time horizons; and (3) the amount of data analysis
involved (cf. Anderson and Oliver 1987; Churchill, Ford and
Walker 1985; Eisenhardt 1985, 1989).
Output control, on the other hand, focuses on the final
sale. It is not important how the sales goal is reached,
just that it is. The main advantage of output control is
that it is simple to set up and administer. It also
provides a strong individual motivation because poor
producers receive little or no compensation (Anderson and
Oliver 1987). Another advantage is that the selling process
does not have to be well understood by the manufacturer.
This can be helpful in complex and uncertain selling
situations. One disadvantage is that the lack of close
supervision permits behaviors which can be detrimental to
the long term goals of the organization (cf., John 1984;
Williamson 1970, 1975, 1979). The lack of supervision also
allows the rep to focus on activities which generate
immediate payoff rather than building for the future. This
shortcoming can be overcome by using multiple indicators of
performance. However, these increase the complexity of the
control system, necessitate more record keeping, require
additional information gathering, and usually involve
subjective judgement (Anderson and Oliver 1987). Multiple
indicators shift the system more toward behavior control and
reduce the benefits of output control. Additionally, team

5
selling, complex products, or long selling cycles, may make
output control difficult to administer.
The difficulty of using either behavior or output based
control with reps is that they are not part of the
organization and not subject to its rules and regulations.
Reps can choose whether or not to follow the dictates of the
manufacturer. Their relationship as agents, not employees,
introduces a new aspect into the issue of control and makes
the application of traditional control methods suspect.
The purpose of "control" is to motivate people to
achieve organizational goals (Flamholtz 1979; Flamholtz,
Das, and Tsui 1985). Within the manufacturer/rep
relationship "control" refers to the comprehensive bundle of
understandings and agreements both formal and informal upon
which the relationship is founded.
A written contract is commonly employed to define the
relationship between the manufacturer and rep, and to
provide a basis for control. However, this contract is
generally only for 30-days and may be terminated by either
party (Heide and John 1988). Additionally, a written
contract can not provide the flexibility to fully specify
the manufacturer/rep relationship due to its complexity —
especially as it develops over time. Nor can it be easily
enforced by one member of the relationship. Thus, the
contract does not provide an adequate basis for control of
the relationship. The manufacturer and representative must

6
formulate a relationship not based on a fixed document but
upon the mutual recognition of the need to work together for
their mutual advantage.
The Manufacturer-Rep Relationship
By its nature, selling is accomplished within an agency
relationship which exists between the salespeople and the
firm. An agency relationship exists whenever one party (the
principal) relies on another party (the agent) to undertake
some action on the principal's behalf (Bergen, Dutta, and
Walker 1992). This relationship is present whether a direct
or indirect salesforce is employed (See Figure 1.2).
FIGURE 1.2 AGENCY VIEW OF SALES FORCE MANAGEMENT
Agency Relationship
Direct Sales Force
Manufacturer Agency Relationship
Manufacturer w-
Rep Sales Force Rep Sales Force
The agency relationship influences every aspect of
sales management from the initial decision to use personal
selling to the day-to-day management of the sales force.
However, recognition of the influence of agency is even more
important when reps are used to supplement or substitute for
a company sales force. Clearly they are acting on behalf of
the principal but they are also very much concerned with

7
their own businesses as well. Divided loyalties, as well as
other considerations (dealt with in detail in Chapter 2)
make it difficult for methods of controlling an in-house
sales force to work effectively with reps. Unlike a typical
management-salesforce relationship, manufacturers and reps
bilaterally govern their exchange and shoulder mutual
responsibility for the outcome. Thus, in some
relationships, reps could effectively act as employers and
manufacturers as employees. This could occur if the rep
agency was relatively large and well established compared to
the manufacturer, especially if there were many possible
suppliers of products or ready substitutes. Under these
circumstances, reps might control access to customers and
select which manufacturer will supply the customer's needs.
A similar situation occurs when a relatively small
manufacturer deals with a large well established retailer or
distributor.
Literature Review
Marketing abounds with agency relationships, but few
have been researched. Some work has been done in channel
coordination and control (e.g., Banerji and Simon 1991;
Bergen and John 1991; Brickley and Dark 1987; Mathewson and
Winter 1984, 1985, 1986; Rey and Tirole 1986; Moorthy 1987;
Norton 1988; Lai 1990), and in consumer promotion (e.g.,
Klein and Leffler 1981; Milgrom and Roberts 1982; Nelson
1974; Rao and Bergen 1991; Rao and Monroe 1991). In the
8
area of sales force management, principal/agent research has
mainly focused on sales force compensation (Basu et al.
1985; Dearden and Lilien 1990; Eisenhardt 1985; John, Weiss,
and Weitz 1987; Lai and Srinivasan 1988; Lai and Staelin
1986; Lai, Outland, and Staelin 1990; Oliver and Weitz
1991). No research was found pertaining to efficient
methods of controlling reps, which is the focus of this
study.
Using reps to sell products has become a significant
consideration in recent years due to their relative
effectiveness and efficiency as compared to the direct sales
force. The principal deterrent to employing a rep has been
the problem of control. Controlling reps is complex, and no
single control factor or category of factors is likely to be
wholly effective.
No research to date has considered the issue of
effective control from the rep's perspective. This point is
important because manufacturers do not have unilateral
control of the relationship and its subsequent outcomes.
Reps and their principals bilaterally govern the
relationship and are equally concerned as to its outcome.
To draw valid conclusions about how the relationship should
be managed from the rep's point of view, reps must be
surveyed (cf., Heide and John 1988; and Mahajan et al.
1984) .

9
Another shortcoming of past research is that it tends
to understate the role and importance of influenceable human
factors and job factors within the manufacturer/rep
relationship. Human factors include differences in goals,
self-interests, risk preference, and human characteristics
such as lack of candor or honesty, shirking responsibility,
or failing to fulfill promises. Human factors can also
include the degree of experience, or other resources which
the rep requires to sell effectively. Job factors include
the type of product, uncertainty in the selling environment,
ease of monitoring sales behaviors or outcomes, etc. There
has also been a lack of theoretical support for the
usefulness of many climatic variables which, upon
examination, seem to influence sales management. These
variables include: liking of the rep for the manufacturer,
the influence of longevity on the manufacturer/rep
relationship, goal congruence between the manufacturer and
the rep, or the interrelationship between trust,
participation, communication quality, etc. exhibited within
a relationship.
Purpose of the Research
For the rep to function efficiently, he must perceive
the management control system which his principal is using
to monitor performance as an aid to his selling task.
Determining whether it is or not is the purpose of this
research. An effective control system requires a knowledge
10
of the variables, or factors, at work in the
manufacturer/rep relationship. This study will address two
issues. First, what type of controls are being used, in the
rep's estimation, by his most valued (i.e., important)
principal and by his least valued (i.e., important)
principal? Second, how does the rep see his performance
being influenced by the form of control exercised?
Justification for the Study
The focus of this study is on the rep's perception of
how a given form of control affects the manufacturer/rep
relationship. The independence of both parties, along with
the complexity of the marketing environment, introduces
uncertainty and risk into the relationship and puts a
premium on intangible factors (e.g. commitment, trust,
longevity of relationship) whose value and importance
relates more to the people involved than to the purely
business aspects of buying and selling. Any theoretical
framework used to model the relationship must be capable of
dealing with the many business factors inherent in the
relationship as well as the human elements which form,
guide, and give value to the relationship.
Based on current literature, there is very little
understanding of the specific variables at work in the
manufacturer/rep situation, or of their relative
interrelationships. This severely limits the efficiency and
effectiveness of decision making. Further, management's

11
attempts to control the rep's effort must be based upon
knowledge of the form of control most likely to produce
harmony as well as the desired level of sales if the
manufacturer/rep relationship is to foster and grow.
A final reason for surveying reps is that very little
research has been conducted from the rep's viewpoint. Thus,
while the rep is an essential constituent of the
manufacturer/rep relationship, little is known about his
views or outlooks. This can dramatically limit the ability
of sales managers to optimally structure, and manage, the
manufacturer/rep relationship.
Clearly, a model which reflects the agency relationship
between the manufacturer and the rep is needed as a basis
for ordered research and decision making. Such a model is
presented in this study.
Research Design
The data collection instrument and the sampling design
are described briefly in the following sections. The
details of the model specifications, hypotheses, and the
overall methodology are presented in chapter III.
The Data Collection Instrument
The research instrument consists of 113 questions and
statements which tap 5 constructs, a dependent variable, and
some demographic data. The constructs are: (1) the nature-
of-the-product, (2) existence-of-specific-assets, (3)
12
importance-of-the-relationship, (4) interorganizational-
climate, and (5) selling-task-characteristics. The
dependent variable is rep performance as measured by the sum
of all variables used to assess the selling behaviors used
to meet the needs of the manufacturer and rep, and by the
sum of all variables used to assess the satisfaction derived
by each as perceived by the rep. The data was collected via
a self-administered mail survey instrument (See Appendix 1).
The Sampling Design
The sampled population are members of the twenty-six
representative associations composing the Manufacturers
Representative Educational Research Foundation (MRERF).
Member firms sell a wide variety of industrial products
across the United States (e.g. electronics, agriculture,
power transmission, health, safety, etc.). Affiliation and
support was obtained in the form of monetary support, mail
lists, and identification of common goals in in-house
publications to ensure a higher response rate.
The questionnaire was mailed to members of the various
associations along with a cover letter asking for
cooperation in trade for a copy of the summary findings. A
follow-up mailing was sent ten days after the surveys were
sent out.

13
Summary of the Design
The constructs of interest (the-nature-of-the-product,
existence-of-specific-assets, importance-of-the-
relationship, interorganizational-climate, and selling-task-
characteristics) were assessed along with the dependent
variable (performance), and some demographic data. Details
of the proposed model and specifications can be found in
chapter III. The complete model was validated using
multiple regression. Cronbach's coefficient alpha was used
to evaluate reliability (internal consistency).
Significance of the Study
More than half of all companies in the United States
use independent reps, either wholly or in combination with
their own direct sales force (Novick 1988). The reason is
the high cost of the direct sales force and the improved
productivity of independent reps. However, little research
has been conducted on managing reps (cf., Anderson 1985;
Frazier 1990). Additionally, many firms do not use reps
because of a perceived difficulty in controlling their
activities. Thus, controlling the activities of reps is an
important issue which warrants further study.
Organization of the Dissertation
This chapter provides an introduction and overview of
the study. Chapter 2 discusses management of the rep sales
force, and reviews the literature on agency theory and

14
control theory. Chapter 3 covers the study constructs,
methodology, presents the general and specific hypotheses,
introduces the construct measures, and the theoretical
model. Chapter 4 discusses the results of the response rate
and demographic analysis for the study sample, and evaluates
the study hypotheses. Chapter 5 provides a review of the
study, presents the implications of the findings, enumerates
the contributions of the study, the limitations of the
research, and concludes with a discussion of areas for
further research.

CHAPTER REFERENCES
Anderson, Erin M. (1985), "The Salesperson as Outside Agent or Employee: A Transaction Cost Analysis," Marketing Science. 4 (3), 234-254.
and Richard L. Oliver (1987), "Perspectives on Behavior-Based Versus Outcome-Based Salesforce Control Systems," Journal of Marketing. 51 (October), 76-88.
Banerji, Shumeet, and Carol Simon (1991), "Franchising vs. Ownership: A Contracting Explanation," mimeo, Graduate School of Business, University of Chicago.
Basu, Amiya K., Rajiv Lai, V. Srinivasan, and Richard Staelin (1985), "Salesforce Compensation Plans: An Agency Theoretic Perspective," Marketing Science. 4 (4), 267-91.
Bergen, Mark E. and George John (1991), "Understanding the Participation Rate Decision in Cooperative Advertising Plans," Working Paper #87, Marketing Technical Report and Reprint Series, Graduate School of Business, University of Chicago.
Shantanu Dutta, and Orville C. Walker, Jr. (1992), "Agency Relationships in Marketing: A Review of the Implications and Applications of Agency and Related Theories," Journal of Marketing. 56 (July), 1-24.
Brickley, James A. and Frederick H. Dark (1987), "The Choice of Organizational Form: The Case of Franchising," Journal of Financial Economics. 18 (June), 401-20.
Churchill, Gilbert A. Jr., Neil M. Ford, and Orville C. Walker, Jr. (1985), Sales Force Management: Planning. Implementation, and Control. Richard D. Irwin Inc., Homewood, Illinois.
Dearden, James A. and Gary L. Lilien (1990), "On Optimal Salesforce Compensation in the Presence of Production Learning Effects," International Journal of Research in Marketing. 7, 179-88.
Eisenhardt, Kathleen M. (1985), "Control: Organizational and Economic Approaches," Management Science. 31 (2), 134-49.
(1989), "Agency Theory: An Assessment and Review," Management Review. 14 (1), 57-74.
15

16
Flamholtz, Eric G. (1979), "Organizational Control Systems as a Managerial Tool," California Management Review. 22(2), 50-9.
T.K. Das, and Anne S. Tsui (1985), "Toward an Integrative Framework of Organizational Control," Accounting. Organizations and Society. 10(1), 35-50.
Frazier, Gary L. (1990), "The Design and Management of Channels of Distribution," in The Interface of Marketing and Strategy, ed. George Day, Barton A. Weitz, and Robin Wensley, Greenwich, CT.: JAI Press Inc., 255-304.
Heide, Jan B., and George John (1988),"The Role of Dependence Balancing in Safeguarding Transaction-Specific Assets in Conventional Channels," Journal of Marketing. 52 (January), 20-35.
Hitchcock, Earl (1984), "What Marketers Love About Their Manufacturers' Reps," Sales and Marketing Management. September, 60-5.
John, George (1984), "An Empirical Investigation of Some Antecedents of Opportunism in a Marketing Channel," Journal of Marketing Research. 21 (August), 278-89.
, Allen M. Weiss, and Barton A. Weitz (1987), "An Organizcitional Coordination Model of Salesforce Compensation Plans: Theoretical,Analysis and Empirical Test," Journal of Law. Economics, and Organization. 3 (2), 373-95.
Klein, Benjamin and Keith B. Leffler (1981), "The Role of Market Forces in Assuring Contractual Performance," Journal of Political Economy. 89 (4), 615-41.
Lai, Rajiv (1990), "Improving Channel Coordination Through Franchising," Marketing Science. 9 (4), 299-318.
and V. Srinivasan (1988), "Salesforce Compensation Plans: A Dynamic Perspective," working paper, Graduate School of Business, Stanford University.
and Richard Staelin (1986), "Salesforce Compensation Plans in Environments with Asymmetric Information," Marketing Science. 5 (3), 179-98.
, Donald Outland, and Richard Staelin (1990), "Salesforce Compensation Plans: An Empirical Test of the Agency Theory Framework," working paper, Graduate School of Business, Stanford University.

17
Mahajan, Jayashree, Gilbert A. Churchill, Jr., Neil M. Ford, and Orville C. Walker Jr.(1984), "A Comparison of the Impact of Organizational Climate on the Job Satisfaction of Manufacturers' Agents and Company Salespeople: An Exploratory Study," Journal of Personal Selling & Sales Management, May, 1-10.
Mathewson, George F. and Ralph A. Winter (1984), "An Economic Theory of Vertical Restraints," The Rand Journal of Economics. 15 (Spring), 27-38.
and (1985), "The Economics of Franchise Contracts," Journal of Law and Economics. 28 (October), 503-26.
and (1986), "The Economics of Vertical Restraints in Distribution," New Developments in the Analysis of Market Structures. Joseph E. Stiglitz and G. Frank Mathewson, eds. Cambridge, MA: MIT Press.
Milgrom, Paul and John Roberts (1982), "Predation, Reputation and Entry Deterrence," Journal of Economic Theory. 27 (August), 280-312.
Moorthy, K. Sridhar (1987), "Managing Channel Profits: Comment," Marketing Science. 6 (4), 375-9.
Nelson, Phillip (1974), "Advertising as Information," Journal of Political Economy. 82 (July/August), 729-54.
Norton, Seth W. (1988), "An Empirical Look at Franchising as an Organizational Form," Journal of Business. 61 (2), 197-218.
Novick, Harold J. (1988), Selling Through Independent Reps. New York: American Management Association.
O'Connell, William A. and William Keenan Jr. (1990), "The Shape of Things to Come," Sales and Marketing Management. January, 37-41.
Oliver, Richard L. and Barton A. Weitz (1991), "The Effects of Risk Preference, Uncertainty and Incentive Compensation on Salesperson Motivation," Report Number 91-104. Cambridge, MA: Marketing Science Institute (February).
Ouchi, William G. (1977), "The Relationship Between Organizational Structure and Organizational Control," Administrative Science Quarterly. 22 (March), 95-113.
(1979), "A Conceptual Framework for the Design of

18
Organizational Control Mechanisms," Management Science. 24 (9), 833-48.
Rao, Akshay R. and Mark E. Bergen (1991), "Price Premium Variations as a Consequence of Buyers' Lack of Information," working paper #88, Marketing Technical Report and Reprint Series, Graduate School of Business, University of Chicago.
and Kent B. Monroe (1991), "The Causes and consequences of Price Premiums: Linking Product Quality and Profitability," working paper, Carlson School of Management, University of Minnesota
Rey, Patrick and Jean Tirole (1986), "The Logic of Vertical Restraints," The American Economic Review. 76 (5), 921-39.
Taylor, Ronald K. (1990), "Manufacturers' Representatives; The March to Professionalism," Journal of Personal Selling & Sales Management. 10 (Winter), 53-5.
Williamson, Oliver E. (1970), Corporate Control and Business Behavior: An Inguiry into the Effects of Organizational Form on Enterprise Behavior. Englewood Cliffs, NJ: Prentice-Hall Inc.
(1975), Markets and Hierarchies: Analysis and Antitrust Implications. New York, NY: The Free Press.
(1979), "Transaction-Cost Economics: The Governance of Contractual Relations," Journal of Law and Economics. 22 (October), 233-62.

CHAPTER II
LITERATURE REVIEW
Introduction
Manufacturers' representatives ("reps") are people or
firms that contract with several manufacturers to sell
products on a straight commission basis within a defined
market territory (Novick 1982; Powers 1991). They generally
sell noncorapeting, complementary product lines, and have
limited authority as to the terms of sale (Sibley and Teas
1979). Reps neither take ownership nor physical possession
of the goods they sell. They focus on the selling function.
In recent years the use of reps, in lieu of a direct
salesforce, has grown considerably due to their selling
efficiency. However, managing reps is quite different from
managing a direct sales force. This difference must be
fully understood and accounted for to realize their full
potential. Washburn (1983, p.82-83) explains:
...manufacturer's representatives can provide powerful marketing advantages to many firms. Too often, however, principals do not realize those advantages because of errors of omission committed somewhere in the process of recruiting, selecting, training and working with reps.
The Control Issue
The desire and the ability to manage the sales force
are important determinants of whether to use a direct or
independent rep sales force. Selling through a rep is more
19
20
complex than selling through a direct sales force, and many
manufacturers fail wholly, or in part, in their use of reps
(Novick 1988). The key to success is understanding the
needs of the rep and developing an effective system of
control which is mutually acceptable to both the
manufacturer and rep.
Several factors determine the form of control exercised
within manufacturer/rep relationships. These are: the
nature-of-the product (cf., Govindarajan and Fisher 1990;
Porter 1980, 1985; Snell 1992); the existence-of-specific-
assets (cf., Anderson 1985; Anderson and Coughlan 1987;
Heide and John 1988, 1992; Klein, Frazier, and Roth 1990);
the importance-of-the-relationship (cf., Anderson and Weitz
1992; Burke 1984; Noordewier, John, and Nevin 1990); the
interorganizational-climate (cf., Anderson, Lodish, Weitz
1987; Tyagi 1985); and the selling-task-characteristics
(cf., Ouchi 1977, 1979; Thompson 1967). Further, each of
these factors is influenced by the agency relationship
between the firm and its rep.
When determining how to control the sales force..."The
central problem of agency is the same as that of the
organizational control literature. That is, how can
organizations achieve co-operation among people with
conflicting preferences?" (Eisenhardt 1982, p.13). There
are many definitions of organizational control. Tannenbaum
(1968, p.5) defines control as "any process in which a

21
person or group of persons or organizations of persons,
determines, that is, intentionally affects, the behavior of
another person, group, or organization." Williamson (1975)
views control in terms of the choice of institutional form
(i.e., the market or the company) to be utilized to conduct
transactions based on their relative cost. Thompson (1967)
stresses performance measurement and evaluation of the
informational characteristics of a given task.
In a rep management context, Thompson (1967) would
assess control by measuring the behavior of the reps (i.e.,
behavior-based control) or the outputs from their behaviors
(i.e., output-based control).
Control Theory
Control is any process or procedure that helps align
the actions (i.e., behaviors) of the individual with the
interests, or goals, of their employing firm (Anderson and
Oliver 1987; Hofstede 1978; Jaeger and Baliga 1985; Merchant
1985, 1988; Phillips 1982; Tannenbaum 1968). Control is
intended to affect individual action so that people will be
motivated to achieve organizational goals (Flamholtz 1979).
Two broad classes of controls have been identified: formal,
and informal (Jaworski 1988). Formal controls are written
documents, such as plans and budgets, that provide a
prescribed frcimework for behavior. Informal controls are
unwritten rules or prescriptions for behavior (e.g., group
norms), including both social and self controls. Table 2.1

22
illustrates the differences.
TABLE 2.1 FORMS OF CONTROL
Control Classification
Type of Control
Description of Control Classification
Formal Behavior -Based Control
Process based control...The firm influences work outcomes by focusing on the behaviors and/or activities in a work process rather than on the end results. The firm assumes responsibility for outcomes.
Formal
Output -Based Control
Work outcomes are used to direct, influence, and shape individual behavior. The individual is responsible for the "cause-effect", work input/output, transformation (i.e., outcome).
Informal Social Control
Worker-based mechanisms that influence individual or group behavior via the norms, values and behavior of the social unit.
Informal
Self Control
The individual takes responsibility for work produced by establishing personal objectives, monitoring own performance, and adjusting behaviors as needed.
Based on Jaworski (1988), Jaworski and Maclnnis (1989).
Formal Controls
Formal controls allow rational management of a firm and
as such are the primary focus of this study. There are two
types of formal control: behavior or output (See Table 2.1).
Ouchi (1977 p.97) explains:
In controlling the work of people and of technologies, there are only two phenomena which can be observed, monitored, and counted: behavior and the outputs which result from behavior. Thus, control systems can be regarded as being based essentially on the monitoring and evaluation of one or the other, and these will be referred to as being 'behavior' or 'output' control.

23
Behavior-based control presumes managerial knowledge of
the link between the action of subordinates and the results
that are achieved (i.e., that tasks can be programmed).
Task-programmability is a task's potential to be clearly
defined by the behaviors or processes needed to perform it
(Govindarajan and Fisher 1990).
Output-based control depends on managers having fixed,
structured standards of desirable performance (Snell 1992;
Thompson 1967). It is appropriate where the goals of an
organization are well understood, agreed upon, and readily
measured (Ouchi 1979). Examples of such control are sales
or production quotas.
Even when standards of performance are available,
output-based control may be inappropriate or awkward. For
example, in situations where it is difficult to determine
when a sale is complete, or once complete, whom to credit
for the sale. This may occur where the sales process is
protracted, involves a poorly defined or highly complex
customer need, or in situations involving team selling. In
a protracted sale (e.g., one or more years), the salesperson
must provide a long stream of behaviors to arrive at the
final sale (e.g., prospecting, providing information,
negotiation, etc.). During this interval, the manufacturer
may have difficulty in maintaining control of the rep's
actions. This may lead to behaviors which are detrimental
to the long term interests of the manufacturer. Protracted

24
sales may also run beyond normal accounting periods and thus
require special handling. They may also be more of a
personnel problem. The rep may be terminated or the
manufacturer's sales manager may leave. Problems can also
occur if the manufacturer's sales procedures or guidelines
change (e.g., a lowering of commission rates, different
terms, etc.). Also, partial payments may be used to finance
the sale in which case some negotiation with the rep may be
required as to how the rep is to be paid (e.g., at the
completion of milestones, at the end of the job, when the
company is paid, etc). If the rep is to be paid based on
completing milestones, the number of payments, and their
timing must be negotiated and administered. This assumes
that the rep would even be willing [or able] to wait for the
completion of the job to receive payment. The use of
partial payments also requires that the job be accurately
monitored in order to determine when milestones are reached
and payment is appropriate.
For poorly defined, or complex, customer requirements,
the rep may not be willing to spend the time to work with
the customer if there is a question of whether he will be
paid for his time. In team selling, it may be difficult to
determine how to allot the commission for the sale. One
member of the team may have done far more to make the sale
possible than another.
25
Informal Controls
When formal controls can not be used due to a lack of
cause/effect knowledge, or when standards of desirability of
outcome are ambiguous, organizations turn to informal
controls. Informal controls are used to channel or direct
behavior using both bureaucratic and non-bureaucratic
methods, and are composed of social and self controls.
Social control is a norm-based, group or team centered
means of informal control. Jaworski (1988 p.27) elaborates:
Social control can be defined...as the prevailing social perspectives and patterns of interpersonal interactions within subgroups in the firm. The direction for control comes from the internalization of values and mutual commitment toward some common goal...the marketing work unit establishes certain standards (norms), monitors conformity, and takes action when social deviations occur.
Social control is a mechanism which guides the
behaviors of individuals or groups apart from formal rules,
regulations, or procedures. This control may be used to
directly police behavior or to predispose behavior through
socialization and selection. Social policing results when
an individual is pressured by those they work with to comply
to a group's values or norms. Predisposition results from:
1) selection of personnel with the correct background or
outlook, and 2) training. An employee's background and
training predispose him/her to act in a desired manner and
therefore regulate the antecedent conditions of performance
— the knowledge, skills, abilities, values, and motives of
employees (Snell 1992).

26
With self control, the individual takes responsibility
for the work produced by establishing personal objectives,
monitoring his/her own performance, and adjusting behaviors
as needed (Jaworski 1988). This form of control is most
often exercised in firms where individuals work alone with
little or no supervision.
Summary
Managing the rep requires a careful consideration of
the needs of the organization, and a balancing of these
needs with the freedom desired by the rep to run his own
sales force as he pleases. What must be recognized is that
the rep is an agent whose willingness to be "controlled" is
a function of both the formal and informal relationship that
has developed between him and his manufacturer principal.
Thus, the relationship is never fully defined by any
contract which might exist between the rep and the
manufacturer. Nor can it be. Typically, contracts only
deal with the formal aspects of a relationship. Even for
these, the dynamic nature of the competitive situation makes
written contracts incomplete. In the absence of exhaustive
statements of the formal rights and obligations of the
parties, "agency theory" has developed to explain the
behaviors of principal and agent typified by the
manufacturer/rep relationship.

27
Agency Theory
Agency is an arrangement which enables decision makers
to control the activities of the agents to whom they
delegate decision-making authority (Anderson and Oliver
1987; Jensen and Meckling 1976). Control is acquired
primarily through incentives and monitoring, to provide
optimum benefit to both the principal and agent, although
with an emphasis on the principal's benefit. Agency theory
offers a distinctive perspective into: the behavioral
effects of risk preference and decision making under
uncertainty, the determination of incentives or monitoring
used to minimize the divergence of goals among principals
and agents, and the use and value of information (Eisenhardt
1989).
Agency theory developed in response to the problems
created by the separation of ownership and control within
the modern corporation, and the need for the corporation to
be responsive to the needs of non-resident owners (cf.
Baiman 1982; Berle and Means 1932; Jensen and Smith 1985;
Levinthal 1988; March and Simon 1958; Ouchi and Maguire
1975; and Williamson 1975).
Agency theory recognizes that the contract which
typically defines the principal/agent relationship balances
the costs of administering the contract, and the benefits
conferred. The theory focuses on determining the most
efficient managerial relationship between a principal and

28
agent given some basic assumptions about people (e.g., self-
interest, bounded rationality, risk aversion), organizations
(e.g., goal conflict among members), and information (e.g.,
asymmetrical in distribution, purchasable) (Eisenhardt
1989).
The foregoing assumptions form three major
classifications: 1) human influence factors; 2)
organizational/environmental factors; and 3) informational
factors. These factors influence the form of control
exercised in the agency relationship. For example, no
employee can be expected to properly perform a task which is
in direct opposition to their self-interest. Under these
conditions, very close monitoring (i.e., behavior-based
control) would be required.
An overview of the personal selling task provides some
insight into the role of agency theory in the management of
the rep sales force. Once the manufacturer decides that
personal selling is necessary then a series of decisions
must be made. First, the manager must examine the economics
of the situation in concert with needs of the organization
[or himself] for control of the sales force in meeting the
strategic goals of the business. Rep's can be the lower
cost alternative in many situations but are harder to
control. Likewise, strategic considerations such as
limiting the dissemination of critical information may be
important. Second, no matter what type of sales force is

29
selected (i.e., direct or indirect) they must be managed.
The two basic methods of managing the sales force are
behavior-based and output-based control. Many factors
influence the decision about which form is best in a given
situation. For example, whether the company has the
expertise or manpower to sell direct. Are reps available?
Often they are not, especially in high tech industrial
markets. Whether the product is seasonal. The company may
not need a sales force year round. Agency influence factors
act in concert with these and other considerations to
influence the control form choice (see Figure 2.1, p.30).
Finally, the sales outcomes must be evaluated. Two measures
of performance are the sales person's selling behaviors, and
the salesperson's satisfaction derived from the sales
process. Selling behaviors refers to the list of things
that the sales person does to sell the product. See Figure
2.1.
Human Influence Factors
People are assumed to be goal-oriented, self-
interested, opportunistic, rational maximizers, but by their
very nature are limited in availability of time, knowledge,
skills, resources, and willingness to take risks or to
undertake tasks in which they have minimal interest. These
factors require little elaboration because they are basic
economic assumptions which are well established and widely
held.

o CO
0) o Q| H-—» L. tD 01 </> Ol
CM
W
o H fa
EH £
W
§
W
0
H
h3 W CO
W K Eh
W
o Eh O
s
w o
w
3 fa iz;
H
J*
u
w
* * * * * * * * *
(O CO
</> U_ H-
C. ••-Q> 0) t-01) U <U W •— "M c o •«-m x L z: u u
D>
0) 41 10
<0 c *-* o c >*
0} •M 4-» c. 10 •r> o c N mmt o 4-» o CO C-u E c (0 •M 4-» o o c > u. (A CO 5 o c
C/> O
TB CO >»
o _ U D) 0 i • - >» C m- • -^ w ^ .r- s- L.
—' h- c t- M- ja <g c •- <o uj — C O ID£ —* O L3 *•*</> 4-*
• - L 41 3 <M (0 w 01 ^ ^ o* S f e § g . 2 ! o U J
I S 0 3 " (0 CO *>**>*•> *"> CD U- T- CM ro N* o

31
Opportunism. Opportunism occurs when individuals
pursue self-interest with guile or cunning (Thornton 1984).
Therefore, opportunism suggests behavior beyond a simple
forthright exchange. It implies a lack of candor or honesty
in transactions (Williamson 1975). Opportunism also
involves shirking or failing to fulfill promises or
obligations, and withholding and distorting information
(John 1984), or making false or empty threats or promises
and cutting corners for undisclosed personal advantage
(Williamson and Ouchi 1981). It can be practiced by either
party to a transaction (Anderson and Weitz 1983). The
recognition of the existence of opportunism is critical to
the need to control agent behavior. Without opportunism,
"principals would simply extract promises from agents in a
stewardship fashion, while agents would reciprocally ask
principals to behave in good faith." (Williamson 1981,
p.1545).
These views do not go unchallenged (See e.g., Barney
1990; Donaldson 1990a,b; Griesinger 1990). Nevertheless,
this study accepts the traditional assumption of self-
interested opportunism but recognizes its inherent
limitations.
Bounded Rationality. Human beings are also assumed to
have limited cognitive capability due to incomplete or
incorrect information, problem solving skills and knowledge,
and/or limits in formulating and solving problems (cf.,

32
Arthur 1991; Lipman 1991; Radner 1972; Simon 1957, 1972;
Williamson 1975, 1991). This limitation, or bounding, of
intendedly rational behavior (bounded rationality) produces
incomplete contracting because the parties to the contract
lack the requisite information, skills, or capacity to make
fully rational choices given the realities and complexities
of the decision situation. Williamson (1991) notes that
this does not imply irrationality or satisficing on the part
of agents attempting to effectively cope.
Bounded rationality may thus produce behavior which
appears to be irrational from a market perspective but fully
rational from the individuals perspective. The individual
is simply unable to take cognizance of, the full situation.
Risk Aversion. Risk can also be associated with the
individual (or firm) in the form of a stable personality
trait (or business climate) which predisposes individual (or
business) behavior (i.e., risk aversion)(Oliver and Weitz
1991). A risk averse individual (or firm) is unwilling to
take a "fair" bet even from a position of certainty (Arrow
1965). A risk premium would be required in order to induce
either the individual or firm to take a risky alternative
over a sure one (cf., Coughlan and Sen 1989). Therefore,
risk averse decision makers prefer relatively low risks and
are willing to sacrifice some expected return in order to
reduce the variation in possible outcomes (March and Shapira
1987; Puto, Patton, and King 1985). Agents are commonly

33
assumed to be more risk averse than principals in agency
theory research because they generally have fewer resources
and are less able to bear risk (cf., Basu et al. 1985;
Coughlan and Sen 1989; Diamond and Stiglitz 1974; Lai and
Srinivasan 1988; Spence and Zeckhauser 1971; Yaari 1969).
Organizational Factors
As Figure 2.1 shows, agency theory is also bounded by
organizational, and environmental assumptions. These
include:
(1) Goal conflict between the principal and agent;
(2) Uncertainty;
(3) Risk-sharing; and
(4) Market efficiency and equilibrium.
Goal Conflict. A central assumption of agency theory
is that agents have goals which are independent of their
principal's goals (i.e., cf., Jensen and Meckling 1976; Ross
1973). This produces conflict (i.e., "an agency problem")
within the principal/agent relationship, and the need to
craft arrangements which minimize the divergence of goals
and desires, and control agent behavior in an optimal way
(Eisenhardt 1989).
Uncertainty. Uncertainty is an inability to directly
link actions to outcomes with certitude. Under uncertainty,
there is a subjective feeling that the outcome of action may
not be due solely to the agent (Arrow 1972). The result of

34
uncertainty is that approximation must replace exactness in
reaching a decision (Simon 1957). Decisions under
uncertainty are the result of the subjective value of an
outcome and the strength of the belief in their possible
occurrence (Radner 1972).
Agency theory incorporates the subjective feelings of
principals and agents about the value and probability of
outcomes via its measure of "outcome uncertainty." Knight
(1921, p.267) explains that, without uncertainty, "every
individual being in possession of perfect knowledge of the
situation, there would be no occasion for anything in the
nature of responsible management or control of productive
activity."
Uncertainty introduces risk into the relationship and
produces the need to both monitor the behavior of risk-
averse agents, and to compensate agents for bearing risk.
Risk-Sharing. Any economic endeavor involves risk.
Risk is inherent in choice, and in economic arrangements.
Risk modifies behavior based upon a subjective assessment of
outcomes, their probabilities of occurrence, and their
subjective values (March and Shapira 1987). When parties
cooperate in a venture a significant concern is how risk
will be partitioned or shared among the parties. Each member
to a relationship assesses risk individually, and requires
compensation tailored to their perceived need.

35
A significant concern of agency research is the
influence of risk on cooperating parties when each may
prefer different actions due to different risk preferences
(Eisenhardt 1989). This difference in risk preference
influences the form of the arrangement between the parties,
the acceptability of compensation, and the need for
incentives within a principal/agent relationship. Many
economic arrangements involve problems of risk sharing which
can be modeled using agency theory (Shavell 1979).
Market Efficiency and Equilibrium. Market dynamics can
also influence the nature and form of the principal/agent
relationship. Markets are assumed to be efficient, and in
or near equilibrium, so principals and agents can freely
enter and exit from contractual relationships (Barney and
Ouchi 1986). This forces the governance structures which
regulate the contract to provide acceptable incentives, and
reasonable administration (Hill and Jones 1992).
Informational Factors
Informational factors contribute to the difficulties of
control in two ways, through information asymmetry, and due
to the fact that information is a purchasable product.
Information Asymmetry. Information asymmetry
(impactedness — cf., Williamson 1975; imperfect information
— cf. Anderson and Weitz 1983) arises because "individual
actions cannot be observed and hence contracted upon"
36
(Holstrom 1979, p.74). Unobserved individual action can
lead to the absence of information, or its asymmetrical
distribution, among agents and can lead to incomplete and/or
inefficient contracting in situations involving uncertainty
and risk (Harris and Raviv 1979). This asymmetry can be
overcome by investing resources into monitoring agents
behaviors. The difficulty is that it is often impossible to
fully monitor behaviors or prohibitively costly to do so
(Holmstrom 1979). Nevertheless, the role of information in
the determination of the contractual form employed within an
agency relationship is a traditional concern of agency
research (cf., Alchian and Demsetz 1972; Baiman 1982;
Crocker and Snow 1992).
Purchasable Commodity. Information is a purchasable
commodity which can effect the optimal contract between the
principal and agent via its cost, availability, and
distribution (Eisenhardt 1989). Each individual acts based
upon his own information (Baiman 1982). Additional
information can be purchased but the cost must be balanced
against the benefits conferred. Information and its
asymmetrical distribution acts to: mediate the form of the
relationship; determine acceptable compensation; and govern
the form of the outcome in an agency relationship.
Table 2.2 summarizes traditional agency theory and
provides an overview along with the assumptions under which
it is applied in this study.

37
TABLE 2.2 AGENCY THEORY OVERVIEW
Key Idea Principal/agent contracts should reflect the value and use of information, partition risk-bearing costs, and minimize the divergence of goals between principal and agent to maximize organizational outcomes
Problem domain
Relationships in which principals and agents have partially differing goals and risk preferences
Unit of analysis
Contract between principal and agent
Contracting problems
Controlling agent opportunism (moral hazard, holdup, shirking, and adverse selection), partitioning risk between principal and agent, and defining expectations and outcomes of the principal-agent relationship
Point of View Principal initiates, executes, and is main focus of any benefits conferred
Human assumptions
Self-interested and opportunistic, bounded rationality, agents are risk averse, principals are risk neutral
Organizational/ Environmental assumptions
Partial goal conflict between principal and agent, efficiency of the relationship in terms of resource use versus outcomes as the effectiveness criterion, uncertainty, risk-sharing, rational decision making, and markets are efficient and in equilibrium
Information assumptions
Information asymmetry between principal and agent. Information is a purchasable commodity which can effect the optimal organizational structure via its cost, availability, and distribution
Adapted from Eisenhardt (1989, p. 59).
Within the manufacturer/rep relationship, the existence
of uncertainty and complexity along with bounded rationality
and self-interest produces information asymmetry and the
need for controls. Under these conditions, managers cannot
anticipate every contingency or eventuality (Anderson and
Weitz 1983). The joining of bounded rationality with
uncertainty makes contractual completeness expensive, if not
impossible, to attain. Bounded rationality plus uncertainty
is often given as a primary reason for the existence of

38
company (internal) mediated decisions rather than have all
transactions mediated by the market (cf., Coase 1937,
Williamson 1975). It also a prime reason why behavior-based
control may be preferred over output-based control in
situations which are perceived as complex, uncertain, or in
which one party may feel that the other party is withholding
needed information, or simply that the requisite information
upon which to found a considered decision is unavailable.
However, whether either behavior or output based controls
are effective in bringing the manufacturer and rep closer
together is an important issue.
Chapter Summary
In recent years, there has been a growing tendency to
use a manufacturer's representative (rep) rather than a
direct sales force to perform the personal selling function.
Reps generally act as an agent for the manufacturer.
However, not everyone uses reps. The successful use of a
rep requires that they be managed differently than the in-
house salesforce. Reps are independent businesses with
their own needs. Reps are managed or controlled only to the
degree to which they recognize the benefits to be gained
within the relationship. Both formal and informal means are
used to control the manufacturer/rep relationship. The sum
of these methods is described as either behavior-based
control or output-based control.

CHAPTER REFERENCES
Alchian, Armen A. and Harold Demsetz (1972), "Production, Information Costs, and Economic Organization," The American Economic Review. 62 (December), 777-95.
Anderson, Erin M. (1985), "The Salesperson as Outside Agent or Employee: A Transaction Cost Analysis," Marketing Science. 4 (3), 234-254.
and Anne T. Coughlan (1987), "International Market Entry and Expansion via Independent or Integrated Channels of Distribution," Journal of Marketing. 51 (January), 71-82.
and Richard L. Oliver (1987), "Perspectives on Behavior Based Versus Outcome-Based Salesforce Control Systems," Journal of Marketing. 51 (October), 76-88.
and Barton A. Weitz (1992), "The Use of Pledges to Build and Svistain Commitment in Distribution Channels," Journal of Marketing Research. 29 (February), 18-34.
and Barton A. Weitz (1983), "A Framework for Analyzing Vertical Integration Issues in Marketing," working paper, 83-110, Marketing Science Institute, Cambridge, Ma.
Leonard M. Lodish, and Barton A. Weitz (1987), "Resource Allocation Behavior in Conventional Channels," Journal of Marketing Research. 24 (February), 85-97.
Arrow, Kenneth J. (1965), Aspects of the Theory of Risk Bearing. Helsinki: Yrjo Jahnssonin Saatio: Helsinki, Finland; also, K.J. Arrow, "Essays in the Theory of Risk-Bearing," Chicago: Markham, 1971.
(1972), "Exposition of the Theory of Choice Under Uncertainty," in Decision and Organization, eds., C.B. McGuire and Roy Radner, New York: American Elsevier Publishing Inc., 19-55.
Arthur, W. Brian (1991), "Designing Economic Agents that Act Like Human Agents: A Behavioral Approach to Bounded Rationality," AEA Papers and Proceedings. 81 (2), 353-59.
Baiman, Stanley (1982), "Agency Research in Managerial
39

40
Accounting: A Survey," Journal of Accounting Literature. 1, 154-213.
Barney, Jay B. (1990), "The Debate Between Traditional Management Theory and Organizational Economics: Substantive Differences or Intergroup Conflict?" Academy of Management Review. 15 (3), 382-93.
and William G. Ouchi (1986), Organizational Economics. San Francisco: Jossey-Bass Publishers.
Basu, Amiya K., Rajiv Lai, V. Srinivasan, and Richard Staelin (1985), "Salesforce Compensation Plans: An Agency Theoretic Perspective," Marketing Science. 4 (4), 267-91.
Berle, Adolf A. Jr. and Gardiner C. Means (1932), The Modern Corporation and Private Property. New York: The MacMillan Company.
Burke, Marian C. (1984), "Strategic Choice and Marketing Managers: An Examination of Business-Level Marketing Objectives," Journal of Marketing Research. 21 (November), 345-59.
Coase, R. H. (1937), "The Nature of the Firm," Economica. 4 (November), 386-405.
Coughlan, Anne T., and Subrata K. Sen (1989), "Salesforce Compensation: Theory and Managerial Implications," Marketing Science. 8 (4), 324-42.
Crocker, Keith J. and Arthur Snow (1992), "The Social Value of Hidden Information in Adverse Selection Economies," Journal of Public Economics. 48, 317-47.
Diamond, P. A. and J. E. Stiglitz (1974), "Increases in Risk and in Risk Aversion," Journal of Economic Theory. 8, 337-60.
Donaldson, Lex (1990a), "The Ethereal Hand: Organizational Economics and Organizational Theory," Academy of Management Review. 15 (3), 369-81.
^ (1.990b) , "A Rational Basis for Criticisms of Organizational Economics: A Reply to Barney," Academy of Management Review. 15 (3), 394-401.
Eisenhardt, Kathleen M. (1982), "Organizational Control From the Perspective of Agency Theory: A Field Setting Example," Unpublished dissertation, Graduate School of Business, Stanford University.

41
(1989), "Agency Theory: An Assessment and Review," Management Review. 14 (1), 57-74.
Flamholtz, Eric G. (1979), "Organizational Control Systems as a Managerial Tool," California Management Review. 22 (2), 50-9.
Govindarajan, Vijay, and Joseph Fisher (1990), "Strategy, Control Systems, and Resource Sharing: Effects on Business-Unit Performance," Academy of Management Journal. 33 (2), 259-85.
Griesinger, Donald W. (1990), "The Human Side of Economic Organization," Academy of Management Review. 15 (3), 478-99.
Harris, Milton and Artur Raviv (1979), "Optimal Incentive Contracts with Imperfect Information," Journal of Economic Theory. 20, 231-59.
Heide, Jan B. and George John (1988), "The Role of Dependence Balancing in Safeguarding Transaction-Specific Assets in Conventional Channels," Journal of Marketing. 52 (January), 20-35.
(1992), "Do Norms Matter in Marketing Relationships?" Journal of Marketing. 56 (April), 32-44.
Hill, Charles W.L. and Thomas M. Jones (1992), "Stakeholder -Agency Theory," Journal of Management Studies. 29 (2), 131-54.
Hofstede, Geert (1978), "The Poverty of Management Control Philosophy," Academy of Management Review. 3, 450-61.
Holstrom, Bengt (1979), "Moral Hazard and Observability," Bell Journal of Economics. 10 (Spring), 74-91.
Jaeger, Alfred M. and B.R. Baliga (1985), "Control Systems and Strategic Adaptation: Lessons from the Japanese Experience," Strategic Management Journal. 6, 115-34.
Jaworski, Bernard J. (1988), "Toward a Theory of Marketing Control: Environmental Context, Control Types, and Consequences," Journal of Marketing. 52 (July), 23-39.
and Deborah J. Maclnnis (1989), "Marketing Jobs and Management Controls: Toward a Framework," Journal of Marketing Research. 26 (November), 406-19.
42
Jensen, Michael C. and William H. Meckling (1976), "Theory of the Firm: Managerial Behavior, Agency Costs and Ownership Structure," Journal of Financial Economics. 3 (July), 305-60.
and Clifford W. Smith Jr. (1985), "Stockholder, Manager, and Creditor Interests: Applications of Agency Theory," In Recent Advances in Corporate Finances, eds., Edward I. Altman and Marti G. Subrahmanyam, Richard D. Irwin: Homewood, IL., 93-131.
John, George (1984), "An Empirical Investigation of Some Antecedents of Opportunism in a Marketing Channel," Journal of Marketing Research. 21 (August), 278-89.
Klein, Saul, Gary L. Frazier, and Victor J. Roth (1990), "A Transaction Cost Analysis Model of Channel Integration in International Markets," Journal of Marketing Research. 27 (May), 196-208.
Knight, Frank H. (1921), Risk. Uncertainty and Profit. Houghton Mifflin Company: Boston, MA.
Lai, Rajiv and V. Srinivasan (1988) , "Salesforce Compensation Plans: A Dynamic Perspective," working paper, Graduate School of Business, Stanford University.
Levinthal, Daniel (1988), "A Survey of Agency Models of Organizations," Journal of Economic Behavior and Organization. 9, 153-85.
Lipman, Barton L. (1991), "How to Decide How to Decide How to...: Modeling Limited Rationality," Econometrica. 59 (4), 1105-25.
March, Jamess G. and A. Simon (1958), Organizations. New York: John Wiley & Sons, Inc.
arid Zur Shapira (1987), "Managerial Perspectives on Risk and Risk Taking," Management Science. 33 (11), 1404-18.
Merchant, Kenneth A. (1985), Control in Business Organizations. Boston: Pitman Publishing Co.
(1988), "Progressing Toward a Theory of Marketing Control: A Comment," Journal of Marketing. 52 (July), 40-44.
Noordewier, Thomas G., George John, and John R. Nevin
43
(1990), "Performance Outcomes of Purchasing Arrangements in Industrial Buyer-Vendor Relationships," Journal of Marketing. 54 (October), 80-93.
Novick, Harold J. (1982), "The Case for 'Reps' vs. Direct Selling Can Reps Do it Better?" Industrial Marketing. 67 (March), 92-7.
(1988), Selling Through Independent Reps. New York: American Management Association.
Oliver, Richard L. and Barton A. Weitz (1991), "The Effects of Risk Preference, Uncertainty and Incentive Compensation on Salesperson Motivation," Report Number 91-104. Cambridge, MA: Marketing Science Institute (February).
Ouchi, William G. (1977), "The Relationship Between Organizational Structure and Organizational Control," Administrative Science Quarterly. 22 (March), 95-113.
(1979), "A Conceptual Framework for the Design of Organizational Control Mechanisms," Management Science. 25 (9), 833-48.
and Mary Ann Maguire (1975), "Organizational Control: Two Functions," Administrative Science Quarterly. 20 (December), 559-69.
Phillips, Lynn W. (1982), "Explaining Control Losses in Corporate Marketing Channels: An Organizational Analysis," Journal of Marketing Research. 19 (November), 525-49.
Porter, Michael E. (1980), Competitive Strategy: Technigues for Analyzing Industries and Competitors. New York: Free Press.
(1985), Competitive Advantage. New York: Free Press.
Powers, Thomas L. (1991), Modern Business Marketing. St. Paul MN: West Publishing Company.
Puto, Christopher P., Wesley E. Patton III, and Ronald H. King (1985), "Risk Handling Strategies in Industrial Vendor Selection Decisions," Journal of Marketing. 49 (Winter), 89-98.
Radner, Roy (1972), "Normative Theory of Individual Decision: An Introduction," in Decision and Organization, eds. C.B. McQuire and Roy Radner, New York NY: American Elsevier Publishing Company, Inc., 2-18.
44
Ross, Stephen A. (1973), "The Economic Theory of Agency: The Principal's Problem," American Economic Association. 63 (2), 134-9.
Shavell, Steven (1979), "Risk Sharing and Incentives in the Principal and Agent Relationship," The Bell Journal of Economics. '55-73
Sibley, Stanley D., and R. Kenneth Teas (1979), "The Manufacturer's Agent in Industrial Distribution," Industrial Marketing Management. 8, 286-92.
Simon, Herbert A. (1957), Models of Man. New York: John Wiley & Sons, Inc.
(1972), "Theories of Bounded Rationality," in Decision and Organization, eds. C.B. McQuire and Roy Radner, New York: American Elsevier Publishing Company, Inc., 161-176.
Snell, Scott A. (1992), "Control Theory in Strategic Human Resource Management: The Mediating Effect of Administrative Information," Academy of Management Journal. 35 (2), 292-327.
Spence, Michael and Richard Zeckhauser (1971), "Insurance, Information, and Individual Action," American Economic Association. 380-91.
Tannenbaum, Arnold S. (1968), Control in Organizations. New York: McGraw Hill Book Company.
Thompson, James D. (1967), Organizations in Action. New York: McGraw-Hill Book Company.
Thornton, Daniel B. (1984), "A Look at Agency Theory For The Novice — Part 1," CA Magazine. September, 90-97.
Tyagi, Pradeep K. (1985), "Organizational Climate, Inequities, and Attractiveness of Salesperson Rewards," Journal of Personal Selling and Sales Management. November, 31-7.
Washburn, Stewart A. (1983), "How to Find the Manufacturers* Rep Who'll Really Work for You," Business Marketing. June, 82-9.
Williamson, Oliver E. (1975), Markets and Hierarchies: Analysis and Antitrust Implications. New York: The Free Press.
(1981), "The Modern Corporation: Origins,

45
Evolution, Attributes," Journal of Economic Literature. 19 (December), 1537-68.
(1991), "The Logic of Economic Organization," in The Nature of the Firm; Origins. Evolution, and Development. Oliver E. Williamson and Sidney G. Winter, eds., New York: Oxford University Press, 90-116.
, and William G. Ouchi (1981), "The Markets and Hierarchies and Visible Hand Perspectives," in Perspectives on Organizational Design and Behavior. Andrew H. Van De Ven and William F. Joyce, eds., New York, NY: John Wiley and Sons, 347-70.
Yaari, Menahem E. (1969), "Some Remarks on Measures of Risk-Aversion and on their Uses," Journal of Economic Theory. I, 315-29.

CHAPTER III
CONSTRUCTS AND HYPOTHESES
This chapter specifies the theoretical model,
constructs, statistical hypotheses, and the research design
which was used to operationalize and test the proposed model
of the manufacturer/rep relationship under agency theory.
A major premise of this research is that salesforce
management style, characterized as behavior-based or output-
based control, can influence rep performance. Further, that
management style encompasses economic, environmental, task,
and humanistic factors. Thus, control is assumed to be an
overall pattern of influence. Finally, that this pattern of
influence can best be understood under an agency theoretic
model.
The organizational set, rather than the channel dyad
approach, (Anderson, Lodish, and Weitz 1987; Evan 1969) will
be used to examine the determinants of management control.
This approach considers the entire set of elements
constituting the managerial situation when making a decision
rather than focusing on each element individually. The
impact of interorganizational climate on performance is not
considered apart from the influence of compensation.
46

47
Introduction to the Model
As discussed in previous chapters, management of the
rep involves economic as well as control/strategic
considerations. These include: costs, efficiency, market
factors, sales force factors, company and industry factors,
and selling task characteristics including uncertainty.
Additionally, management involves humanistic considerations
including: individual goals, self-interest, opportunism,
risk aversion, and bounded rationality.
These considerations define the manufacturer/rep
relationship. They should also be the basis for any system
of managerial control. This reasoning is the cornerstone
for combining agency theory with organizational control
theory. Neither theory alone adequately explains actual
relationships nor provides satisfactory guidance to
management.
Eisenhardt (1982, p.3) combined agency theory and a
form of organizational control theory developed by Thompson
(1967) in an attempt to better understand organizational
control, and, among other things, "...demonstrate that task
design, performance evaluation, and forms of rewards have a
relationship, and that this relationship is moderated by the
risk attitudes of the various actors, and by the overall
uncertainty in the situation." Risk attitudes are
determined by individual self-interests, goals, risk
aversion, risk assessment, availability of information and

48
the ability to assess it (bounded rationality), along with
relationship factors such as commitment, dependance, and
longevity of a relationship.
In agency theory, outcome is assumed to be a function
of agent behaviors and environmental factors such as
competitor actions, government policies, the economy,
technological change, etc., which introduce uncertainty and
risk. Thus, outcome is not solely determined by agent
behaviors. Further, risk, combined with the risk
preference, or attitude, of the principal and agent,
influences the form of the principal/agent relationship and
the required compensation and control structure.
In organizational control theory, task characteristics
are emphasized. Model outcomes are assumed to be a function
of the characteristics of the task being performed. If the
task process is well understood, then the form of control is
mediated by the ability to measure the behaviors or outputs
from the task. If agent behaviors or outputs can be
monitored, either or both can be used to control the agent.
If the task process is not well understood, and neither
behaviors nor outputs can be measured readily, then formal
control is impossible and agent behaviors must be governed
by social control. Table 3.1 illustrates the foregoing.
That is, knowledge of the transformation process
used to convert inputs to outputs during work, plus the
ability to measure the behaviors used to perform work,

49
determines the feasibility of a particular form of control.
All variables shown in the model are continuous but modeled
as dichotomous for purposes of exposition. The variable
labels represent the bounds of the continuum for each
variable. Most organizations can be expected to use a
combination of behavior-based and output-based control
(Ouchi 1977). The model is normative, implying that an
organization should use the form of control specified
(Govindarajan and Fisher 1990).
TABLE 3.1 THE CONTROL MODEL
Knowledge of Transformation Process (Task Programmability)
Perfect
Availability of High 1) Behavior or 3) Output-Output: Measures Output-Based Based
Control Control
Low 2) Behavior 4) Social -Based Control Control
Based on Thompson (1967).
The Manufacturer/Rep Model
In this study, a combined agency/control model is used
to investigate the optimum form of control, as related to
overall performance, utilized within a manufacturer/rep
relationship. The optimal control form is theorized as
being influenced by a composite of: (1) the nature of the
product, (2) the need for transaction specific assets to
sell products, (3) the importance of the relationship to the

50
manufacturer <ind rep, (4) the relative warmth or lack of
warmth of the interorganizational climate existing between
the manufacturer and rep, and (5) the selling task
characteristics. Performance is theorized as being a
function of the satisfaction derived from, and the selling
behaviors performed within, the manufacturer/rep
relationship. These factors, and how they impact sales
management, are the focus of this study. Specifically —
the nature-of-the-product, the existence-of-specific-assets,
the importance-of-the-relationship, interorganizational-
climate, and selling-task-characteristics are constructs
which are measured by the independent variables in the
study. Rep control form is a managerial summation (i.e.,
behavior/output based control) of an overall pattern of
influence which acts to moderate the outcome of the
manufacturer/rep relationship. See Figure 3.1.
Figure 3.2 provides more detailed information on
control forms and furnishes insight into how each factor can
affect rep management. Note the difference in the
description of each factor, under behavior versus output
based control. The description of each factor under the two
forms of control, maps a control continuum which describes
the type of control used in managing the rep in particular
situations. No one factor is assumed to fully control the
form of the relationship. The combination of all factors

H
i n
* * * * * * * * * * * * * * * * * * *
r»
W g o
E-»
5 3
W
w
o
5 5
H
h 3
w
w
X
o
£ 5
w
o <
w
s c
B
W
P S
o
E-*
U <«
Em
W a
H
o «
o
Q O
a
E-»
W
S S
§
Eh %
O
u
o w n
I' to o
CO 41 U L.
— ' +•> o> o <o :J C •«-CO c> — >
—• <0 —* JC 41 o CO CQ
L. O
2 1 ! > " 8 t; -c: (0 (0 Gl Cft C x: <o *•* 05 O 4) 0) CO • CO u a: CO i O i
•J 8 0) <D o L-4> O 4)
c_ a «J O X
(. "E
</> u. I— O
CQ CO
- p a) o
a) a - P - H CO »H (d <P
w w 43 B w < ! (0 * H * H
0 1 C H M
• P • P U O CJ <1) 0 O * H * H 1 - p fd ? U CH * 3 - H (G <d rd
O O H C M a) ^ a) a) o td a cm a r t - H x :
1 W 1 4 J o 0 a) i u <d i xi X5 <w O N M o < P O 1 * H W
1 1 Q) C <d T5 <w a) o <d E-t O O O C t P 1 X5 i G «d k • P a> a) - p o c a) J-l «P M M - H £ 3 w o a> h
4 J - H 4-> « H
r-H i c x e c d ) O 1 5 W H H W
*—<» #-> «—s, X—s
c H CNJ CO LO
0 u
q> at t-CD O 4)
CL CO
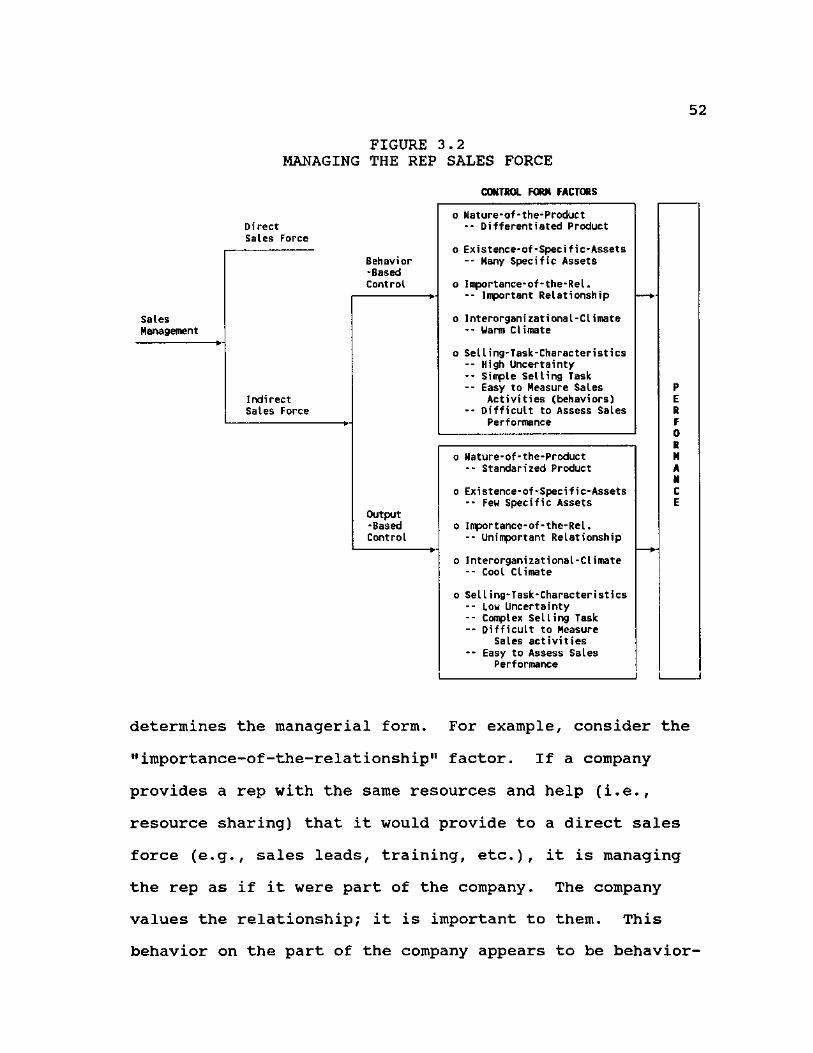
52
FIGURE 3.2 MANAGING THE REP SALES FORCE
CONTROL FORM FACTORS
Direct Sales Force
Behavior -Based Control
Sales Management
Output -Based Control
Nature-of-the-Product -- Differentiated Product
Existence-of-Specific-Assets -- Many Specific Assets
Importance-of-the-Rel. -- Important Relationship
Interorganizational-Climate
Selling-Task-Characteristics -- High Uncertainty -- Simple Selling Task -- Easy to Measure Sales
Activities (behaviors) -- Difficult to Assess Sales
Performance
o Nature-of-the-Product -- Standarized Product
o Existence-of-Specific-Assets -- Few Specific Assets
o Importance-of-the-Rel. -- Unimportant Relationship
o Interorganizational-Climate -- Cool Climate
o Selling-Task-Characteristics -- Low Uncertainty -- Complex Selling Task -- Difficult to Measure
Sales activities -- Easy to Assess Sales
Performance
P E R F 0 R N A N C E
determines the managerial form. For example, consider the
"importance-of-the-relationship" factor. If a company
provides a rep with the same resources and help (i.e.,
resource sharing) that it would provide to a direct sales
force (e.g., sales leads, training, etc.), it is managing
the rep as if it were part of the company. The company
values the relationship; it is important to them. This
behavior on the part of the company appears to be behavior-

53
based control refering back to Figure 3.2. However, this
conclusion must be weighed together with the other factors
such as existence-of-specific-assets in the relationship,
interorganizational-climate, nature-of-the-product, and
selling-task-characteristics of the selling situation to
make a final determination of overall control type. Thus,
the relationship results from many factors. Additionally,
these factors may interact. For example, the nature-of-the-
product as influenced by the manufacturer's product strategy
(e.g., standarization vs. differentiation), in concert with
the form of control exercised, could influence rep
performance. Consequently, the outcome of the relationship
would be a function of whether the product is standardized
or differentiated, and whether behavior or output based
control is employed (cf., Porter 1980).
Thus, the control form factors shown in Figure 3.2
influence the form of control that is used to manage the
manufacturer/rep relationship. Further, they describe or
indicate the managerial form on a variable-by-variable
basis. Figure 3.3 illustrates how each factor as well as
its constituents contributes to the overall control form
determination used to manage the relationship based on
theory, the literature and previous discussion.
In an operational sense, each factor is assessed by
one or more measures which place the variable on the
behavior-based versus output-based control continuum. To

54
FIGURE 3.3 EXPECTED CONTROL FORM VERSUS REP MANAGEMENT FACTORS
F 0 R M
0 F R
E P
C 0 N T R
0 L
Behavior Control
Output Control
Nature-of-the-Product
o Standardized vs. Differentiated - Relative Price of Product High Low - Relative Product Quality High Low - Relative Product Features Many Few - Relative Brand Image Low High
Existence-of-Specific-Assets
o Human Assets o Physical Assets
Many Many
Few Few
Importance-of-the-Relationship
Overall Measure Important Unimportant Performance
o Partnering High Low of Rep - Resource Sharing High Low
of Rep
- Quality of Communications High Low — • o Selling - Working together in Goal Setting High Low Behaviors - Support High Low - Involvement (Participation) High Low o Satisfaction - Frequency arid Quality of Visits High Low
o Acceptability of Rewards ... —
Interorganfzational-Climate
Overall Measure Warm Cold
o Dependence High Low o Similarity of Goals and Expectations High Low o Trust High Low o Consi derat ion/Goodwi11 High Low o Future Potential of Relationship - Length of Relationship Long Short - Commitment By Manufacturer High Low - Probability of Rep Replacement Lower Higher
SelI i rig-Task-Characteristics
o Environmental Uncertainty o Task Programmability o Behavior MeasurabiIity o Output MeasurabiIity
High Perfect High Low
Low Imperfect Low High

55
facilitate this placement, all scales are 7-point semantic-
differential. A low average value for a factor indicates
output-based control (i.e., 1 to 3.5) whereas a high value
indicates behavior-based control (i.e., 4.5 to 7). A value
of between 3.5 and 4.5 is indeterminate. Thus, the average
numeric value of each factor is an assessment of its
individual control form so no additional measure of control
is needed (see Figure 3.4).
FIGURE 3.4 CONCEPTUAL REP MANAGEMENT MODEL
ANTECEDENTS OF PERFORMANCE
Selling Behaviors
Satisfaction
Nature of the Product
Interorgani zat i onaI Climate
Selling Task Characteristics
Existence of Specific Assets
Importance of
Relationship
0 0
To complete the model, demographic information must be
considered. Throughout marketing, demographic information
has generally been found to be an important influence on how
firms manage the marketing effort. For this study:

56
experience — the length of time the firm has been in
business or maintained a relationship with their most
important principal; longevity — the rep's selling
experience and experience as a rep; and size — in total
sales dollars and the number of inside and outside reps, are
assumed to influence performance.
To this point, the influence of individual control
factors on performance has been the primary focus of
thediscussion,. However, additional insight can be gained by
considering the combined influence of all factors
concurrently. This research proposes that the individual
factors form a pattern of influence which uniquely describes
the manufacturer/rep relationship, and can thus aid the
marketing manager in evaluating and managing the rep.
To test this proposition, an overall measure of control
form must be determined. For the individual respondent,
this is accomplished by adding the average control form
values for all factors to produce a composite or overall
control indicant. All measures are semantic differential,
7-point scales to facilitate this summation. No weighing of
the contribution of individual factors to the overall
composite will be employed as there is no theoretical basis
available for the determination of such weights. Once an
indicant is determined for a respondent, it will be used to
categorize the overall control form based on the value of
the composite. High values are behavior-based control.

57
Medium values are a mix of behavior and output-based control
thus are indeterminate. Low values are classified as
output-based control. Figure 3.5 illustrates the model that
will be used to test the proposition.
COMPOSITE CONTROL FORM
Behavior -Based Control
Mixed or
Indeterminate Control
Output -Based Control
FIGURE 3.5 THE OVERALL-CONTROL-FORM MODEL
CONTROL FORM FACTORS
> —
OUTCOMES
» -
- • > —
Performance
- Selling Behaviors
- Satisfaction
o Nature-of-the-Product o Existence-of-Specific-Assets o Importance-of-the-Relationship o Interorganizational-Climate o Selling-Task-Characteristics
o Nature-of-the-Product o Existence-of-Specific-Assets o Importance-of-the-Relationship o Interorganizational-Climate o Selling-Task-Characteristics
o Nature-of-the-Product o Existence-of-Specific-Assets o Importance-of-the-Relationship o Interorganizational-Climate o Selling-Task-Character!sties
Constructs and Their Statistical Hypotheses
Identifying which variables constitute the
manufacturer/rep relationship and quantifying their
respective influence on performance is the central problem
addressed by this research. Each variable forms one link in
the overall control used to manage the relationship and to
optimize rep performance. Control is the managerial
summation of the entire pattern of influences used to guide
and direct the manufacturer/rep relationship.

58
The following section will present each of the
variables which assess the pattern of control within the
relationship and measure the resultant outcomes. The
dependent variables are presented first followed by the
independent veiriables.
The Dependent Variable — Performance
Sales force performance is a critical concern to most
industrial firms, yet measurement of what constitutes
performance hcis been hindered by both conceptual and
methodological problems (Behrman and Perreault 1982).
Identifying the relevant dimensions of performance is one
such problem (Avila, Fern, and Mann 1988; Brown 1979).
Churchill et al. (1985) conclude that no single
determinant can explain a very large proportion of variation
in sales performance. They advise that theoretical models
should base hypotheses of sales performance on multiple
determinants, and categories of determinants. Determinants
might include physical behaviors such as: selling products,
demonstrating technical knowledge about the manufacturer's
product, providing information to the manufacturer, and
working with the customer to identify solutions to his/her
problems or needs. It might also include summary measures
of performance relating to the degree of overall
acceptability of the relationship assessed as satisfaction.
Consequently, performance can be measured as a
composite of the selling behaviors used within the

59
relationship to make sales (i.e., performance-behaviors) and
the satisfaction derived from the relationship (i.e.,
performance-satisfaction). Performance-behaviors measures
focus on overt tangible actions of the rep while
performance-satisfaction measures capture the affective
dimensions of performance. Together, performance-behaviors
and performance-satisfaction assess the "overall-
performance11 of the manufacturer/rep relationship.
Performance-Behaviors. Performance-behaviors is
defined as a summary index of organizational outcomes for
which the individual is at least partly responsible (e.g.,
generating sales, identifing new accounts, maintaining
technical knowledge of the manufacturer's product, etc.).
Churchill et al. (1985) note that performance measures
should be based on the behaviors of salespeople over which
they have some control. Therefore, performance should be
evaluated based on tasks actually accomplished by the rep
(Jaworski and Young (1992). That is, on the observable
tasks actually performed by the rep in selling the
manufacturer's product such as submitting call reports to
the manufacturer.
Performance-behaviors is measured using a multi-item
scale and in terms of perceived behaviors. A subjective
measure of performance-behaviors may act to reduce the
influence of different products, industries, or overall
strategies, which would tend to modify the applicability of

60
certain performance measures (cf., Govindarajan 1988;
Govindarajan cind Fisher 1990; Govindarajan and Gupta 1985;
and Gupta and Govindarajan 1984).
Performance-Satisfaction. Performance-satisfaction is
defined as the degree of overall approval of the
manufacturer/rep relationship (cf., (Frazier, Gill, and Kale
1989; Gaski and Nevin 1985), or more generally, a positive
affective state resulting from the appraisal of all aspects
of a firm's working relationship with another firm (Anderson
and Narus 1984, 1990; Frazier 1983). Performance-
satisfaction is assessed simply as the willingness of the
rep to "do it over again" if he knew how it would come out
and there was plenty of other opportunities (cf., Hunt and
Nevin 1974). It is also assessed by two statements: (1) "I
am generally satisfied with my overall relationship with my
manufacturers," and (2) "on the whole, I am happy about my
firm's relationship with the manufacturers" (cf., Frazier,
Gill, and Kale 1989; Gaski and Nevin 1985).
Relationships with higher levels of performance-
satisfaction should be expected to: (1) have a warmer
interorganizational-climate; (2) have a similarity of
overall goals and expectations for the relationship; (3)
exhibit more consideration/cooperation; (4) be less likely
to have members who terminate the contract voluntarily; (5)
have higher levels of trust; (6) have longer term

61
relationships; and (7) have more respect and liking for
their partner.
Overall-Performance. Overall-performance combines
performance-beihaviors and performance-satisfaction in a
single measure to better assess the overall manufacturer/rep
relationship. Performance-behaviors assess the actual
actions of the rep in selling the manufacturer's product
while satisfaction assesses the overall approval of the rep
for the outcomes of the relationship. The rep is expected
to be more satisfied with higher performing relationships.
This formulation yields two benefits: (1) performance-
satisfaction may provide a similar measure of the outcome of
a relationship and thus enhance the overall measurement of
performance, and (2) may provide an improved ability to
predict how best to control the rep relationship which is
one goal of the agency model. This suggestion agrees in
principal with Anderson and Narus (1990). They counsel that
satisfaction may not only be a close proxy for perceived
selling behaviors but also be more predictive of future
actions.
Independent Variables
The form of control used to manage the manufacturer/rep
relationship appears to be a major determinate of the
outcome of the relationship. Five measures of control are
proposed: the nature-of-the-product, the existence-of-

62
specific-assets, the importance-of-the-relationship, the
interorganizational-climate, and the selling-task-
characteristics .
Nature-of-the-Product
The characteristics or nature of a product influence
how it is supported and sold. Highly complex products
(e.g., computer installations) often require a great deal of
support and may require a lengthy selling process. Simple
products (e.g., notebook paper) may require little support
and a relatively short selling cycle. The nature-of-the-
product is a result of the strategy pursued by the
manufacturer.
Porter (1980) identifies two opposing strategies for
creating a defendable position in an industry: 1) the low-
cost (standardized) strategy, and 2) the differentiation
strategy. The standardized strategy involves: 1) vigorously
pursuing cost reduction and control, 2) employing people
with high levels of experience including process engineering
skills (i.e., transaction-specifics assets), 3) a routinized
task environment, and 4) a standard undifferentiated product
(Dess and Davis 1984; Govindarajan and Fisher 1990; Murray
1988; Porter 1980). Since little support is required from
the manufacturer during the selling process, output-based
control would be indicated.
Companies which follow a differentiation strategy offer
a product or service which is perceived industry-wide as

63
unique (Porter 1980). A differentiation strategy is
indicated when firms compete based on quality, superior
performance, creativity, or superior service, or product
attributes (Gupta 1986). Uniqueness implies a greater risk
of nonperformance which must be borne by the rep resulting
in higher costs. Behavior-based control can lower the risk
to the rep producing lower costs as well as providing
resources to help sell the product due to the closer
relationship inherent with behavior-based relationships.
The product strategy pursued by the manufacturer has
been shown to influence the structure and subsequent
performance of companies and relationships (cf., Anderson
and Zeithaml 1984; Govindarajan 1986, 1988; Govindarajan and
Fisher 1990; Govindarajan and Gupta 1985; Grinyer, Yasai-
Ardekani, and Al-Bazzaz 1980; Gupta and Govindarajan 1984;
Keats and Hitt 1988; Miller 1988). Specifically, Dess and
Davis (1984), Kim and Lim (1988) support Porter's (1980)
assertion that commitment to a generic strategy will result
in higher performance.
Consequently the outcome of the manufacturer/rep
relationship is a function of whether the manufacturer
pursues a differentiated or standardized product strategy,
and whether behavior or output based control is employed
(cf., Porter 1980). Further, product strategy in concert
with the form of rep control exercised, will influence
performance (See Figure 3.6).

64
FIGURE 3.6 ORGANIZATIONAL THEORY MODEL OF PERFORMANCE
(Modified to Include Strategy)
Environment
Structure
Strategy Business Performance
Based on White and Hamermesh (1981, p.217).
Existence-of-Specific-Assets
Transaction-specific-assets, or asset specificity,
refers to the degree to which specialized investments or
resources (e.g., human and/or physical, tangible or
intangible) are needed to support an exchange (Heide and
John 1988; Klein, Frazier, and Roth 1990). A distinguishing
characteristic of such assets is that their value derives
from their presence within a particular relationship. If
the asset specificity is high, the value of the asset within
the relationship is high, and conversely much lower outside
the relationship (John and Weitz 1988).
Williamson (1983) identifies four types of asset
specificity (cf., Griesinger 1990; Joskow 1988; Williamson
1981):
(1) Site Specificity: Buyers and sellers are located very close to one another to minimize transportation and inventory costs. It might also be extended to include

6 5
the gains made in being able to better serve the manufacturer/customer relationship through enhanced communication and responsiveness. In just-in-time relationships, once they are in place, the assets are generally highly immobile.
(2) Physical Asset Specificity: This occurs when one or both parties to a transaction make investments in physical assets such as equipment or machinery specific to the transaction. These assets would have a lower value if alternately employed.
(3) Human Asset Specificity: Investments in relationship specific human capital that often arises in a learning-by-doing process (e.g., employer specific knowledge or skills)
(4) Dedicated Assets: General investment that would not otherwise be made except for the prospect of selling a significant amount of product to a specific customer. Dedicated assets lose value if employed elsewhere. They are put in place contingent upon particular supply agreements.
Each of the foregoing assets could be shown to influence
selling activities. However, while both human and physical
assets will be discussed, the study will only consider
physical assets such as special equipment or samples which
the rep had to purchase to facilitate the sales process.
The manufacturer/rep relationship is often
characterized by transaction-specific investments for both
parties. For a rep, this might be time, effort, and selling
expenses to develop a market for the principal's product
line. Or, it might be dedicated equipment used to sell or
service a product. The manufacturer can also invest in
human specific assets by providing training on company
specifics, and/or on the product.
The existence of transaction-specific-assets (TSA) has
both positive and negative managerial implications.
Positive, in that, the existence of TSA tends to make
exchanges more efficient and less costly (Day and Klein

66
1987) . TSA can also act as a barrier to entry for new
competition. Negative, in that, the existence of TSA can
make replacement and training of the sales force more
costly. TSA can also make market exit more difficult and
expensive (cf., Porter 1980).
The existence of transaction-specific-assets can also
produce discord within the agency relationship by mis-
aligning the self-interests of the manufacturer and rep.
TSA investment by the rep can introduce risk to the rep and
encourage opportunism by the manufacturer. A heavy
investment in specific assets by the rep is a threat (i.e.,
a risk of loss) because specific assets have little value
outside the relationship, and the principal can replace the
rep at any time (Heide and John 1988). Even if outright
termination does not occur, the principal can reduce
commissions or reduce the rep's business by increasing the
use of house accounts (i.e., behave opportunistically), and
thereby effectively expropriate "quasi rents" on those
assets (Klein, Crawford, and Alchian 1978; Monteverde and
Teece 1982).
For the manufacturer, protection is typically achieved
by moving toward closer relationships such as vertical
integration, and through the use of contracts. When using
reps, however, vertical integration is not feasible.
Likewise, principals are generally not interested in
vertical integration because it is the agent's investment

67
that is at risk (Heide and John 1988). Contracts can
provide some protection, but are often no better than the
goodwill of the people who enter into them (DuBois and Grace
1987). Obtaining protection through contracts depends on
having sufficient bargaining power initially to extract
safeguards. Reps generally do not have such power because
of the difference in size between the rep and the
manufacturer.
One remedy to this situation is to have the
manufacturer equally invest in specific assets, or to
balance the rep's exposure by having the rep establish close
relationships with the manufacturer's customer (Day and
Klein 1987; Heide and John 1988). This would position the
rep to exact a price, in the form of a lost customer for the
manufacturer, for violating the relationship. This
balancing is essential to the stability of a relationship
when specific assets are present (Dant and Wilson 1990).
In Chapter II, it was demonstrated that the nature of
the products sold will influence the management of the sales
force (i.e., behavior or output based control). The
underlying attributes of transactions are similarly
affected. There is a link between the nature of a product
and the form that transactions will assume. Differentiated
products are both sold and supported in a different manner
than standardized products. This general assertion is
supported by Williamson (1983, p.537) who notes that
68
"...governance structures need to be matched to the
underlying attributes of transactions in a discriminating
way if the efficient purposes of economic organization are
to be realized..." Similarly, Williamson (1975, 1985)
notes that the most important factor which explains the form
of economic organization is asset specificity.
From the foregoing, higher degrees of assets
specificity lead to behavior-based control.
Importance-of-the-Relationship
During the last few years, there has been an increasing
awareness of the importance of relationships within
marketing. These relationships include: buyer-suppliers
(Heide and John 1990); distributor-manufacturers (Anderson
and Narus 1990), manager-salespeople (Castleberry and Tanner
1986; Tanner and Castleberry 1990); buyer-vendor
(Noordewier, John, and Nevin 1990); manufacturer-suppliers
(Heide and John 1992); or more generally: the value of
cooperative behavior (Day and Klein 1987); or interfirm
adaption in business relationships (Hallen, Johanson, and
Seyed-Mohamed 1991).
The central theme of this research is that the quality
exhibited within relationships affects their outcomes, and
in general, better relationships have better outcomes. With
this in mind, this study theorizes that the perceived
importance of the manufacturer/rep relationship will affect
the performance derived from the association as well as the

69
optimum managerial method. The importance will be a
function of the degree of partnering in the relationship,
and the acceptability of both basic compensation as well as
special incentives (i.e., rewards).
In the study, tangible factors pertaining to managing
manufacturer/rep relationships (e.g., mutual participation
in selling effort — partnering, compensation plus
incentives —rewards) are handled separately from intangible
factors (e.g., cognitive, emotive or affective) which color
or influence relationships but do not directly take part.
In many cases this separation cannot be done flawlessly,
some intermingling is inevitable as many managerial
situations have important tangible as well as intangible
dimensions. The tangible/intangible delineation is an
attempt to more fully describe the managerial situation and
to recognize the contribution of intangible factors in a
relationship apart from the mechanics or economics which are
the typical focus of such research. Tangible factors
include: sharing of resources and mutual effort, and rewards
(i.e., compensation and incentives). Intangible factors
include: consideration/goodwill, dependence, the alignment
of goals and expectations, trust, and the future potential
of the manufacturer/rep relationship. Tangible relationship
factors are handled under the "importance-of-the-
relationship" construct, and intangible factors are handled
under the "interorganizational-climate" construct.

70
The importance of the relationship is assessed by two
variables: (1) partnering and (2) rewards.
Partnering. Partnering is defined as the degree to
which exchange partners work together to achieve a common
goal. It embodies mutual participation, cooperation, and
responsibility for the outcomes from a relationship. In
this situation, partnering is the degree to which the
manufacturer and rep work together to accomplish the selling
task. It includes: (1) mutual participation in goal setting
and forecasting, (2) the quality of communications (e.g.,
frequency, timeliness, feedback), (3) support (e.g.,
training programs, literature, help with sales), (4)
involvement (e.g, advice and council sought on marketing,
being kept informed on new developments, working with
manufacturer on planning, evaluation of training programs,
etc.), (5) frequency and quality of manufacturer visits, and
(6) the degree of resource sharing of manufacturers market
assets with rep (e.g., market information, sales leads,
etc.).
Partnering is a concept whose managerial importance
reflects the needs and limitations of the people involved.
When resources are shared: risk to the rep due to
uncertainty is reduced, individual self-worth is recognized,
association is extended, and many limitations (e.g., bounded
rationality, information asymmetry) of the rep are
acknowledged, accepted, and diminished. This acts to align

71
the goals and self-interest of the firm and the rep. Closer
relationships also diminish opportunism through closer
monitoring.
A high degree of partnering (simply called resource
sharing by Govindarajan and Fisher 1990) can produce
important synergies such as reduced costs, improved
coordination of the marketing effort, and more rep
involvement (Govindarajan and Fisher 1990)(cf., Bobrow 1982;
Gupta and Govindarajan 1986; Porter 1980, 1985). This
finding is in line with the advice commonly given in
practitioner publications. That is, that manufacturers
should treat reps as part of the firm and give them the
support they require, i.e., sales leads, sales aids, market
information, cidvertising support, motivation efforts,
training, recognition, and inclusion in company affairs as
the direct sales people (cf., Bobrow 1991; Koch 1980;
Mahajan et al. 1984; Novick 1982).
Weitz (1981) noted that manufacturers could also
influence the effectiveness of selling behaviors via company
resources such as reputation, range of alternatives the
salesperson cein offer, and the degree to which the
salesperson can alter the characteristics of the extended
product (price, delivery, terms, etc,).
Dickson (1981) determined that mutual influence on
decision-making and policy (i.e., participation) was a way
for organizations to control employee behaviors.

72
Participation was defined as a complex process involving
employee interaction, communication among the participants
with the intent of mutual influence over each other. Thus,
how the manufacturer manages the relationship directly
influences performance (cf., Childers, Dubinsky, Skinner
1990; Kohli 1989; Teas 1981; Tyagi 1985a; Walker, Churchill,
and Ford 1977). Adequate communication has also been found
to be an important determinant of partnering and performance
(cf., Anderson, Lodish, and Weitz 1987; Jaworski and Kohli
1991; Mohr and Nevin 1990; Teas 1983; Tyagi 1985a; Walker,
Churchill and Ford 1977).
Rewards. Salesforce compensation has been identified
as being one of the most important rewards used to motivate
salespeople (Churchill, Ford, and Walker 1979; John and
Weitz 1989; John, Weiss, Weitz 1987). In many firms it is
also the number one marketing expenditure (Basu et al.
1985). Anderson, Lodish, and Weitz (1987) determined that
financial incentives were an important determinant of how
reps decided how much selling time to allocate to their
various principals. Novick (1982) and Bobrow (1991)
counseled that both the size of the commission that a rep
receives as well as the ease of the working relationship
determined how reps allocated their time. Compensation was
not the sole concern. Novick (1982) noted that reps may
purposely reduce their efforts if they feel that the
manufacturer might replace them with a direct sales force if
73
sales get too high. Moreover, commissions may not motivate
if they are not timely, or if they are marginal for the
efforts involved. Outcome uncertainty and its resultant
risk of nonperformance is also important. Reps are less
likely to expend effort on accounts or products that they
feel are speculative or risky. In such a situation, they
may require additional compensation (cf., Eisenhardt 1985,
1989) . Bobrow (1991) stressed the need for strong
leadership from the manufacturer and a good working
relationship which motivated the rep and provided adequate
support and recognition as well as compensation.
One way to overcome the need to provide additional
compensation is to use behavior-based control which
compensates the rep based on activities rather than on
outcomes and thereby lowers the rep's risk of nonperformance
(Eisenhardt 1985, 1989). This may require a change in
management attitudes because managers typically tend to
prefer outcome measures which are easy to implement and link
to individual performance (Anderson and Oliver 1987; Bush et
al. 1990; Churchill et al. 1985).
Interorganizational-Climate
Churchill, Ford and Walker (1976) advise that the
organizational environment is an important determinant of
organizational climate and worker satisfaction.
Organizational climate represents the worker's perceptions
of his work environment, including the characteristics of
74
the organization as well as the nature of the member's
relationships with others. Moreover, Churchill, Ford, and
Walker (1976) note that job satisfaction cannot be explained
solely using compensation and promotion practices. People's
attitudes are influenced by a wide range of factors which
constitute the working environment. Climate reflects the
norms, leadership, and membership composition of an
organization, and provides a context for interpersonal
communication (Mohr and Nevin 1990).
Anderson, Lodish, and Weitz (1987) conclude that how
reps allocate their selling time is influenced, among other
things, by the interorganizational-climate characterized by
goal congruency, good communications, relative dependence,
and mutual trust. Direct (active) involvement (e.g.,
communication, field visits, giving positive as well as
negative feedback, or even interference in the management of
the agency) by a principal in the activities of the rep also
seemed to produce a positive effect on allocation behavior.
The richness of the relationship between manufacturers
and reps is more constrained than that between the
manufacturer and the direct employee. Manufacturers and
reps are independent businesses with different goals and
motivations. Furthermore, there is often a great deal of
geographic separation which limits communication and mutual
influence. For this reason, climate must be defined more
narrowly than for the direct employee. In this study,

75
climate is defined as the feelings of manufacturers and reps
about the level of trust and mutual supportiveness in
interorganizational relationships (cf., Mohr and Nevin 1990;
Anderson, Lodish, and Weitz 1987). This definition centers
on the dimensions of leader consideration. In most selling
situations involving the use of independent agents or reps,
manufacturers act as leaders and reps act as subordinates.
On the basis of the empirical evidence, interorganizational-
climate, as perceived by the rep, would seem to be
positively related to the rep's performance and satisfaction
with the manufacturer/rep relationship. Furthermore, warmer
climates (i.e., closer relationships) will be positively
related with behavior-based control.
Interorganizational-climate is assessed in this study
as a composite of: (1) consideration/goodwill, (2)
dependence, (3) goals and expectations, (4) trust, and (5)
the future potential of the relationship.
Consideration/Goodwill. Considerate leadership
involves "the extent to which salespeople feel that their
ideas and opinions are sought by the supervisor and taken
into consideration in designing jobs which affect their
performance" (Tyagi 1985b). Further, considerate leaders
foster a working environment which sustains a climate of
psychological support, mutual trust and respect,
helpfulness, and friendliness (Kohli 1989). Considerate
leadership can act to align the goals of the manufacturer

76
and rep, and strengthen the rep's beliefs that good
performance will lead to the attainment of extrinsic rewards
(e.g., compensation, incentives, recognition, respect)
(Tyagi 1985a). Additionally, consideration can encourage
rep participation in the planning, selling, and evaluative
process. Thus, the leader's behavior is important to the
rep's motivation, and ultimately, to the successful
attainment of the desired outcomes in a relationship.
Kohli (1989) investigated the effects of supervisory
initiation of structure and consideration on salespeople who
differ in their self-esteem, need for clarity, sales
experience, and self-perceived performance. The study
sample consisted of 127 industrial salespeople in three
organizations. The findings indicate that managerial
consideration has a significant influence on job
satisfaction among highly experienced salespeople but not
among salespeople with little experience. Also, that
consideration had a significant impact on salespeople with a
high self-esteem and less on those with low self-esteem.
Finally, salespeople who perceived themselves to be
performing well expect to be treated with consideration and
will be upset if they are not. These finding are
particularly noteworthy when managing reps who are generally
highly experienced, have a high self-esteem, and are high
performers. Research by Teas (1981) on department store
salespeople closely agreed with these basic findings.

77
Dependence. Manufacturer/rep dependence is the degree
to which each needs to maintain the relationship in order to
achieve desired goals (Frazier, Gill, and Kale 1989; Kale
1986). Dependence involves issues concerning: the
replaceability of an exchange partner, the link between
power and dependence, the effect of mutual dependence, and
perceived power.
Dant and Wilson (1990) used Emerson's (1962) classic
work on power-dependence to analyze the power relationships
of manufacturers and reps. They noted that dependence has
two primary characteristics: (1) it is a joint function of
motivational investment and availability of alternatives,
and (2) it is always mutual.
Investments by manufacturers or reps in specific assets
which support relationships are common. These may include
training on company products, supplying sales materials,
purchase of samples, and/or purchase or supply of
specialized facilities. These investments create dependence
and possible instability in the relationship. Dant and
Wilson (1990) noted that if the rep's specific asset
investments can be threatened by the use of superior power
by the manufacturer, the manufacturer/rep relationship will
be neither stable nor enduring. This instability could also
occur if well established rep firms hold significant
advantage in relation to firms they represent (e.g., small
or new firms with little market experience). In fact,

78
control of the relationship may depend on the existence and
use of specific assets. Barney and Ouchi (1986) note that
the presence or existence of specific assets represents a
condition of interfirm dependence where the party receiving
the investment (e.g., rep training, company secrets
essential to the reps ability to sell effectively, etc.) may
actually control the relationship.
In some situations there are few alternatives available
to either the manufacturer or to the rep. If either is to
succeed, they must work together. Common sense would
indicate that this could produce a stable long-term
relationship. However, there could be a situation where the
imbalance favors either the manufacturer or the rep (e.g.,
if the manufacturer has many reps it can choose to work with
and the rep has few, or conversely the rep has many and the
manufacturer has few. This imbalance can create instability
in the relationship as either member may feel insecure or
threatened. It may also have cost and control implications.
Based on transaction-cost-analysis, John and Weitz
(1989) suggest that supervision-based control (i.e.,
behavior-based control), is most cost efficient (and most
likely to be used) when salespeople are difficult to
replace, or if they fail to produce the expected output.
Conversely, incentive-based control (i..e, output-based
control) is most efficient when labor markets are highly

79
competitive such that the firm can contract with salespeople
to make sales and only pay when sales are delivered.
From Emerson (1962), the mutuality of dependence is
also a factor. Mutual dependence, or interdependence
(Govindarajan 1986; Pfeffer 1976), is fundamental to the
manufacturer/rep relationship because neither member fully
controls the relationship or its outcomes.
Perceived power can also influence dependence. In a
channel context, such as the manufacturer/rep relationship,
perceived power constitutes the potential for influence of
an exchange partner (Anderson, Lodish, and Weitz 1987), or
the ability to influence the behavior, perceptions, and/or
decision making of exchange partners (El-Ansary and Stern
1972; Frazier 1983). This study follows Anderson and Narus
(1990, p.43) in using the constructs "influence over the
working partner firm" and "influence by the partner firm" to
reflect the interdependent nature of working partnerships,
and reflect the need for mutual action that facilitates
better outcomes from the manufacturer/rep relationship. A
rep could be expected to focus on accounts which he feels
are important to his success. Conversely, manufacturers can
use their power to influence behavior. For example,
National Semiconductor Inc. uses selected reps, which it can
dominate by generating the majority of the rep*s income, to
produce sales. National, "believes that the importance of

80
its commissions to its reps gives the company the strong
control needed to achieve its objectives" (Novick 1982).
Goals-and-Expectations. An organization's goals and
expectations are important influences on performance (Bush
et al. 1990). Jaworski and Young (1992) determined that
goal congruence strongly influenced role conflict among
marketing managers. As goal congruence increased, job
conflict decreased. They submitted that the reduction in
conflict should lead to a reduction in dysfunctional
behavior.
Goals-and-expectations refers to the degree of
similarity of expectations for manufacturers and reps (e.g.,
growth objectives, goals), and the extent to which the
manufacturer and rep perceive that their purposes for being
in the relationship are compatible. Moreover, their
individual goals can be achieved by working together (cf.,
Anderson, Lodish, and Weitz 1987; Eliashberg and Michie
1984). Reps could be expected to contribute more to, and be
more comfortable with, relationships that had expectations
and goals which were very similar to their own. Frazier
(1983) suggests that goal compatibility contributes to
overall satisfaction, and high levels of satisfaction will
generally be associated with positive outcomes for the
relationship. Thus, goals in the study refers to a global
purpose which contributes to the interorganizational
climate, and can form a common basis for the achievement of

81
desired outcomes in a relationship. It does not refer to
targeting specific quotas or objectives concerning product
sales or activities.
Trust. Rarely can both parties in a manufacturer/rep
relationship simultaneously fulfill their obligations, nor
can their every behavior be monitored or coerced. Trust is
critical to the success of the relationship (Fields 1985).
Trust is confident reliance on the integrity, and veracity
of a person or firm to meet its commitments, or to meet the
expectations of those with whom it deals (Webster 1972).
The need for trust is not unique to the manufacturer/rep
relationship. "Business firms in general place a high value
on trust and a sense of fairness in their interfirm
relationships" (Frazier and Summers 1986, p.171). Not all
behaviors can be monitored or controlled economically. Nor
can they be fully specified a priori in a contract. This is
particularly true in relationships where termination is a
credible threat (Anderson, Lodish, and Weitz 1987). In
these circumstances, trust is most likely to develop and be
valued (Young and Wilkinson 1989).
Trust can be influenced by the existence-of-specific-
assets. Although, this influence may be one-sided. Heide
and John (1990) found that specific asset investment
increased the expectation of continuity or longevity of the
relationship but only from the point of view of the
manufacturer's supplier (i.e., the rep). Manufacturers did
82
not have significant expectations of continuity based on
specific asset investment. This would seem to be in keeping
with Heide and John's (1988) earlier findings that
manufacturers were not concerned about the risk of loss for
reps who make specific asset investments.
Future-Potential-of-the-Relationship. The future-
potential-of-the-relationship is based on the rep's
perception of the probability of a continuing and profitable
relationship. It is measured by: (1) the frequency with
which the manufacturer replaces reps, (2) the termination
likelihood of the rep, (3) the commitment of the
manufacturer and rep to the relationship, and (4) length of
the current relationship. Two additional measures that can
be used to assess the long-term viability of a relationship
are: (1) the expected growth in the manufacturer's product
offering, and (2) the synergy between the manufacturer's
product line and the rest of the lines carried by the rep
(Anderson, Lodish, and Weitz 1987).
Long-term relationships are important to reps. They
reward good performance and punish poor performance which
produces goal congruence, reduces opportunistic tendencies,
and subsequently, the need to monitor performance (Ouchi
1980). Long-term relationships can create an atmosphere of
trust because members of a relationship assume some
commonality of purpose. Good reps want to be able to profit
from their investments in time and money developing clients
83
markets and products, and realize that many of the rewards
only materialize in the long run (Bellizzi and Glacken
1986). Reps will be motivated to allocate resources to
manufacturers if they believe the future stream produced by
those resources is secure (Anderson, Lodish, and Weitz 1987,
p.87). Conversely, if the relationship is perceived as
tenuous, manufacturers and reps will discount future returns
and be reluctant to allocate resources (e.g., for the rep:
selling time or investment in specific assets; for the
manufacturer: training, resource sharing, etc.).
Commitment is an important aspect of long-term
relationships. "Commitment refers to an implicit or explicit
pledge of relational continuity between exchange partners"
(Dwyer, Shurr, and Oh 1987). It is based on confidence in
the stability of the relationship, and implies a willingness
to make short-term sacrifices to realize long-term benefits
(Anderson and Weitz 1992).
Past performance is also an important measure of the
future-potential-of-the-relationship. Teas and McElroy
(1986) suggested that past performance was an important
factor in forming a salesperson's expectancy beliefs about
future outcomes from a relationship. Salespeople may
anticipate positive outcomes for future task performance
when past outcomes were positive and, in their opinion,
resulted from the salesperson's abilities or efforts and not
from chance. Expectancy is the salesperson's estimate of
84
the probability that expending a given amount of effort on a
task will lead to an improved level of achievement on some
dimension of performance (Lawler 1973; Vroom 1964; Walker,
Churchill, and Ford 1977).
Selling-Task-Characteristics
The difficulty with which salespeople's performance and
activities are assessed affects the degree to which
compensation or other forms of management can be used to
control the salesforce (John and Weitz 1988). Monitoring
minimizes opportunism and helps align the goals of
manufacturers and reps as does acceptable compensation which
benefits both parties. This study identifies four selling
task characteristics that have been shown to influence sales
force control and management: (1) outcome uncertainty, (2)
task programmability, (3) output measurability, and (4)
behavior measurability.
Outcome-Uncertainty. Agency relationships incorporate
the understanding that every decision, or work process,
involves risk and uncertainty. Outcomes are assumed to be a
function of human behaviors and random effects (Eisenhardt
1985). Uncertainty introduces an inability to directly link
actions to outcomes with certitude, and introduces risk into
the principal/agent relationship which must be balanced by
acceptable compensation, and/or information systems capable

85
of monitoring and thus controlling agent behavior to some
degree.
Uncertainty also influences the integration of
administrative control mechanisms with strategic choice,
specifically, uncertainty which includes the dimensions of
unpredictability and complexity (cf., Child 1975;
Govindarajan 1988; Williamson 1975).
Prior research supports this association. Chandler
(1962, p.393) noted that product market diversification
tended to "enlarge the range, number, and complexity" of
activities required by management which resulted in greater
uncertainty for the firm. This assertion agrees with
strategic business unit (SBU) research which indicates that
the task environment is more uncertain for a differentiated
SBU than a low-cost SBU (Govindarajan and Fisher 1990;
Miller 1988). Gupta and Govindarajan (1984), and
Govindarajan (1986) argued that SBUs with build strategies
faced a more uncertain task environment than SBUs with
harvest strategies.
Task-Proqrammability. Task-programmability is defined
as "a task's susceptibility to clear definition of the
behavior needed to perform it" (Govindarajan and Fisher
1990, p.261). Thompson (1967, p.86) labeled this as the
"beliefs about cause/effect knowledge" of the transformation
process (i.e., whether it is complete or incomplete), or the
link between the actions of agents and the results they

86
achieve. Ouchi (1977, 1979) called it "knowledge of the
transformation process", and Snell (1992) called it
"knowledge of cause/effect relations." When knowledge of
the task programmability of a process is "perfect", managers
fully understand the work input/output transformation
process, and can translate their intentions into specific
actions. Under these conditions, a firm could employ
behavior-based control. When knowledge of the
transformation process is 11 imperfect", managers have
incomplete knowledge of the transformation process and it is
very difficult for them to translate their intentions into
specific actions (cf., Ouchi 1977, 1979; Ouchi and Maguire
1975; Govindarajan and Fisher 1990; Snell 1992; Thompson
1967; Turcotte 1974).
Output-Measurabilitv. Output-measurability, also known
as: "standards of desirability" (Thompson 1967),
"availability of output measures" (Jaeger and Baliga 1985;
Ouchi 1977), "ability to measure outputs" (Ouchi 1979), and
"standards of desirable performance" (Snell 1992) describes
the degree to which outcomes from a work process can be
measured with reliability and validity (Eisenhardt 1985,
1989; Govindarajan and Fisher 1990). Assessing sales
performance is negatively affected by complex selling
situations, the use of team selling, long selling cycles,
the predominance of missionary selling, and when non-selling
activities are more important than selling activities (John
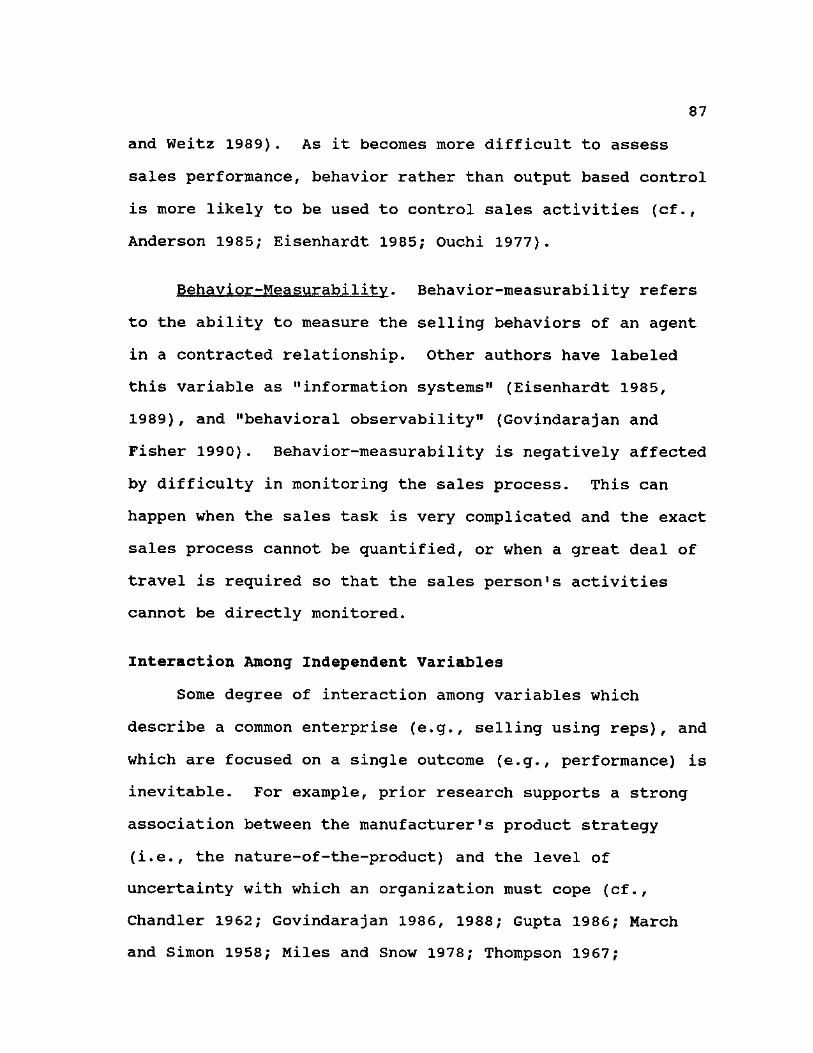
87
and Weitz 1989). As it becomes more difficult to assess
sales performance, behavior rather than output based control
is more likely to be used to control sales activities (cf.,
Anderson 1985; Eisenhardt 1985; Ouchi 1977).
Behavior-Measurabilitv. Behavior-measurability refers
to the ability to measure the selling behaviors of an agent
in a contracted relationship. Other authors have labeled
this variable as "information systems" (Eisenhardt 1985,
1989), and "behavioral observability" (Govindarajan and
Fisher 1990). Behavior-measurability is negatively affected
by difficulty in monitoring the sales process. This can
happen when the sales task is very complicated and the exact
sales process cannot be quantified, or when a great deal of
travel is required so that the sales person's activities
cannot be directly monitored.
Interaction Among Independent Variables
Some degree of interaction among variables which
describe a common enterprise (e.g., selling using reps), and
which are focused on a single outcome (e.g., performance) is
inevitable. For example, prior research supports a strong
association between the manufacturer's product strategy
(i.e., the nature-of-the-product) and the level of
uncertainty with which an organization must cope (cf.,
Chandler 1962; Govindarajan 1986, 1988; Gupta 1986; March
and Simon 1958; Miles and Snow 1978; Thompson 1967;

88
Williamson 1975). Also, the presence of uncertainty can
interact with specific assets to affect sales force
management (cf., Anderson 1985). Finally, the nature of the
product interacts with the presence of specific assets to
modify optimal organizational and managerial form (cf., Levy
1985).
Thus, while interactions are clearly supported by the
literature, and could be a source of numerous hypotheses as
to their influence, for simplicity, this study will assume
that no interactions exist among the independent variables.
The existence of these interactions is presented to
recognize their potential importance, and to serve as a
basis for future research.
Constructs Summary
Table 3.2 summarizes the constructs, their variables,
and describes each.
General Hypotheses
It is hypothesized that the performance of the
manufacturer/rep relationship is largely determined by
economic, job, and human factors. Additionally, it is
hypothesized that the nature-of-the-product, existence-of-
specific-assets, importance-of-the-relationship,
interorganizational-climate, and selling-task-
characteristics are major determinants of the performance of
the relationship.

89
TABLE 3.2 REP SALES FORCE MANAGEMENT CONSTRUCTS,
VARIABLES, AND DESCRIPTIONS
Const nrts Maclahlflis Drsnx:I nt im.nf Mariahl PS , and nonsturts
Nature-of-the-Product
Standardized Low-cost, undifferentiated product or service which competes based on cost.
Nature-of-the-Product
Differentiation Product or service which is perceived industry wide as uniaue.
Existence-of-Specific-Assets
Human-Assets Investments in relationship specific human capital such as employer specific knowledge or skills.
Existence-of-Specific-Assets
Physical-Assets Investments in physical assets such as equipment or machinery specific to a transaction which would have a lower value if alternately employed.
Importance-of-the-Relationship
(Tangible Factors)
Partnering (Mutual Participation in Selling Effort)
Degree to which manuf./rep work together to accomplish selling task. Mutual participation in goal setting and forecasting; quality and frequency of communications; Resource snaring of manufacturers market assets with rep.
Importance-of-the-Relationship
(Tangible Factors)
Rewards Acceptability of compensation arid incentives, availability of special incentives.
Interorganlzat ionaI -Climate
(Intangible Relationship Factors)
Consideration/ Goodwi11
Recognition of reps/manufacturer's efforts. Mutual respect aria liking for exchange partner.
Interorganlzat ionaI -Climate
(Intangible Relationship Factors)
Goals-arid-Expectations
Similarity of expectations for relationship (e.g.. growth objectives, goals).
Interorganlzat ionaI -Climate
(Intangible Relationship Factors)
Trust Confident reliance on the integrity, and veracity of a person or firm to meet its obligations.
Interorganlzat ionaI -Climate
(Intangible Relationship Factors)
Future-Potent ial -of-Relationship
The probability of a continuing and profitable relationship.
Selling-Task-Characteristies
Outcome-Uncertainty
Inability to link actions to outcomes with certitude.
Selling-Task-Characteristies
Task-Prog rammabiIitv
The ability to clearly define the behaviors needed to perform a task.
Selling-Task-Characteristies
Output-MeasurabiIi ty
The ability to measure selling task performance or outputs. Function of the complexity of the selling situation, the number of non-selling activities reauired. and amount of team selling.
Selling-Task-Characteristies
Behavior-MeasurabiIi tv
The ability to monitor or measure selling task activities.
Performance Selling-Behaviors
Refers to a summary index of organizational outcomes for which the sales person is at least partly responsible.
Performance
Satisfaction Degree to which expectations are met within the manufacturer/rep relationship.

90
It is further hypothesized that performance is
influenced by demographic factors. These include: the size
of the firm (size), the length of time the firm has been in
business or maintained a relationship with their most
important principal (experience), and the number of years of
selling experience of the rep answering the survey
(longevity). It is hypothesized that the greater a firm's
experience and size, and the rep's selling experience, the
greater will be the performance. There are many possible
reasons for this, for example:
1. As a firm gets larger, it is better able to provide selling aids, training, or other help to the rep. Larger firms will probably use more reps and be more experienced in managing them as well as more able to pay commissions in a timely manner.
2. Longer working relationship between manufacturers and reps should lead to easier and more efficient interfaces as well as greater product and firm knowledge for the rep. Firms can be expected to drop lower performing reps.
3. As reps become more experienced, they should become more productive as they learn more about the industry, customers, products, and how to sell effectively.
Specific Hypotheses
The theory previously presented in this dissertation is
the basis of the following statistical hypotheses. For the
hypotheses in sections I and V, refer to Figure 3.7. For
section VI refer to Figure 3.5 on page 57. It should be
noted that the form of control exercised within the
manufacturer/rep relationship is a managerial summation of
the totality of the relationship between the manufacturer

91
FIGURE 3.7 OPERATIONAL REP MANAGEMENT MODEL
Selling-Task-Characteristics (X5)
Experience (Xe) Longevity (X7) Size of Rep Firm (X8)
Performance (Y)
Nature-of-the-Product
Interorganizat i onaI-Climate
Existence-of-Specific Assets (X2)
Importance-of-the-Relationship (X3)
and rep. Form of control provides a useful way of
categorizing relationships to aid the manager. Further,
control theory provides a rationale for the direction or
linkage of variables defined by agency theory to be operant
within the manufacturer/rep relationship. Thus, while
control theory informs as to the relationship of variables
hypothesized to influence performance, it is not necessary
to include control as part of the hypotheses. Control form
is inherent in the scales used to assess the constructs.
Study hypotheses are given in the conventional null
form. The null hypothesis merely states that no
relationship exists between two variables or groups of
variables (Kidder, Judd, and Smith 1986).

92
Each hypothesis is stated twice once for the most-
important-principal responses (hypotheses H u through H^),
and once for the least-important-principal responses
(hypotheses H12 through H92) . A paired t-test indicated that
the responses for the most-important-principal versus least-
important-principal were significantly different for all
variables.
Constructs (Most-Important-Principal);
I. Nature-of-the-Product
Hu: There is no relationship between the nature-of-the-product and overall-performance.
II. The Existence-of-Specific-Assets
H21: There is no relationship between the existence-of-specific-assets and overall-performance.
III. The Importance-of-the-Relationship
Hj,: There is no relationship between the importance-of-the-relationship and overall-performance.
IV. Interorganizational-Climate
H4,: There is no relationship between interorganizational-climate and overall-performance.
V. Selling-Task-Characteristics
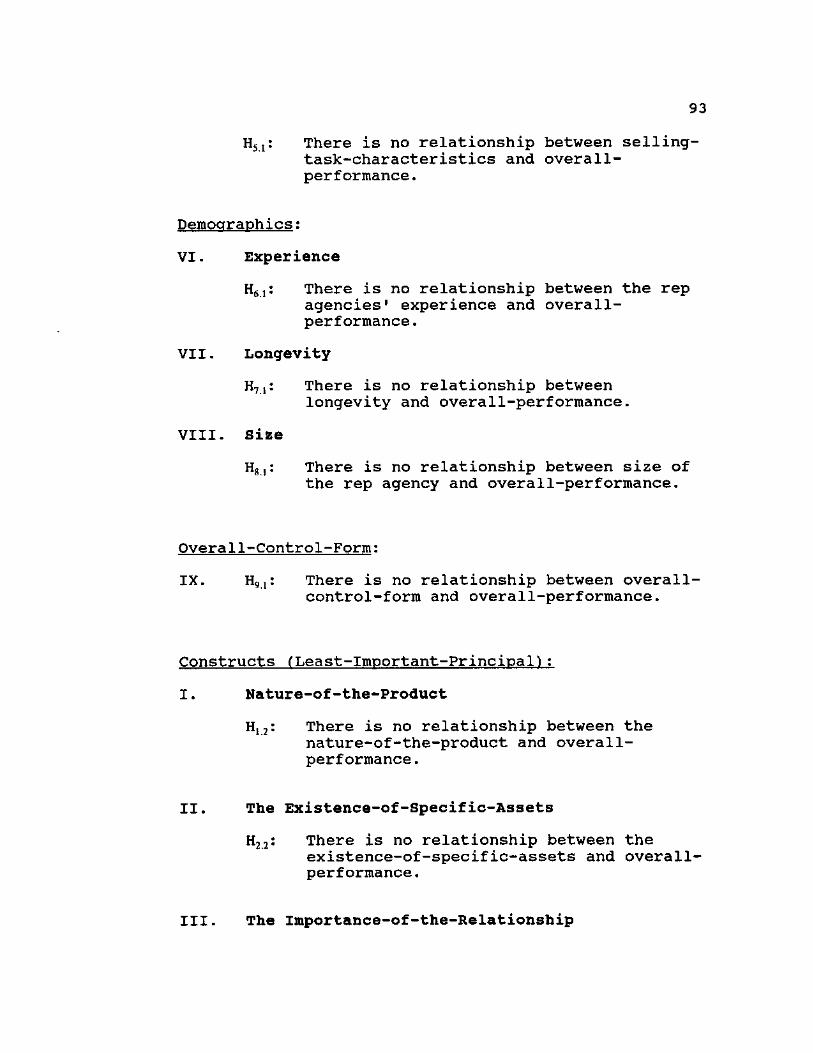
93
H51: There is no relationship between selling-task-characteristics and overall-performance.
Demographics;
VI. Experience
H6,: There is no relationship between the rep agencies' experience and overall-performance.
VII. Longevity
H71: There is no relationship between longevity and overall-performance.
VIII. Size
Hg,: There is no relationship between size of the rep agency and overall-performance.
Overall-Control-Form:
IX. H9,: There is no relationship between overall-control-form and overall-performance.
Constructs (Least-Important-Principal^;
I. Nature-of-the-Product
H12: There is no relationship between the nature-of-the-product and overall-performance.
II. The Existence-of-Specific-Assets
H22: There is no relationship between the existence-of-specific-assets and overall-performance.
III. The Importance-of-the-Relationship

94
H32: There is no relationship between the importance-of-the-relationship and overa11-performance.
IV. Interorganizational-Climate
H42: There is no relationship between interorganizational-climate and overall-performance.
V. Selling-Task-Characteristics
H52: There is no relationship between selling-task-characteristics and overall-performance.
Demographics:
VI. Experience
H62: There is no relationship between the rep agencies* experience and overall-performance.
VII. Longevity
H72: There is no relationship between longevity and overall-performance.
VIII. Size
H82: There is no relationship between size of the rep agency and overall-performance.
Overall-Control-Form:
IX. H92: There is no relationship between overall-control-form and overall-performance.
All of these hypotheses were tested. The findings are
reported in Chapter IV.

95
METHODOLOGY
Research Design
This study explores the determinants of rep performance
and control using the organizational set (Evan 1969) rather
than the manufacturer/rep dyad as the unit of analysis (cf.,
Anderson, Lodish, and Weitz 1987). The network of
organizations with which a particular organization (i.e.,
the focal organization) interacts is its "organizational
set" (Evan 1969). In this study, the organizational set
examined is composed of the rep and the principal(s)
represented.
Research Instrument
The questionnaire is composed of three parts: (1)
descriptive information about the rep agency, (2) questions
concerning the rep's perception of his relationship with his
most-important and least-important principal, and (3)
questions soliciting the rep's perception of his
performance. Though reps often represent more than two
principals, focussing on the most-important-principal versus
the least-important-principal should provide some insight
into the influence of commissions paid to the rep firm on
performance and control form. Comparing the most and least
important principals may also help to account for rep
attitude or belief halo effects. From common sense, the rep
should be most concerned, as well as have the most positive

96
outlook, about those principals which he believes are tied
most closely to his welfare. The converse could also be
true in relation to least-important-principals. This
proposition will not be formally tested but is used merely
as a guide in interpreting the results from the survey.
Halo effects should also be minimized by asking the
respondent to evaluate both principals simultaneously on
each question rather than having them answer for one
principal at a time on all questions (cf., Anderson Lodish,
and Weitz 1987). For example, both principals will be
evaluated in terms of the existence-of-specific-assets, then
interorganizational-climate, etc.
Each construct is assessed using scales which are
intended to model the behavior/output based continuum.
Thus, a scale mean of 1-3.5 indicates output-based control,
a scale mean of 4.5-7 indicates behavior-based control, and
a scale mean of more than 3.5 but less than 4.5 is
indeterminate. Therefore, if the mean value of
"performance" and "the-nature-of-the-product" increase
together (i.e., a positive relationship) that would indicate
a behavior-based relationship. The absolute value of each
construct is not the basis for the hypotheses. Agency
theory together with control theory informs as to which
variables are to be measured and the direction of that
proposed relationship.

97
The questionnaire is based largely on pre-existing
scales modified to better assess the constructs of interest
from the viewpoint of the rep rather than the manufacturer.
The Manufacturer's Representatives Educational Research
Foundation (MRERF) helped in pretesting and refining the
questionnaire.
Churchill's (1979) procedure for developing better
measures of constructs will be used as a guide to help
refine the questionnaire as to reliability and validity (See
Table 3.3).
TABLE 3.3 CHURCHILL'S PROCEDURE FOR DEVELOPING
BETTER MEASURES OF CONSTRUCTS
Steps Procedure
1. Specify the Domain of the Construct Perform Literature Search
2. Generate a Sample of Items a. Consult Literature b. Conduct Interviews with Reps c. Work with Manufacturer's Rep.
Association
3. Collect Data Administer Questionnaire with Selected Reps
4. Purify the Measure a. Cronbach's Alpha b. Corrected Item-Total Correlations c. Factor Analysis
5. Assess Reliability a. Cronbach's Alpha b. Corrected Item-Total Correlations
6. Assess Validity a. Evaluation of Instrument by Faculty Members
b. Evaluation of Instrument by members of the Manufacturer's Representative Educational Research Foundation
c. Factor Analysis
7. Establish Norms Examine The Total Distribution of Scores

98
Pilot Study. A pilot study was conducted before the
actual survey was undertaken to: (1) test the reliability of
the various scales; (2) make necessary corrections to the
items composing the scales; (3) evaluate the length and
composition of the survey instrument; (4) determine what
additional questions might be required in terms of pre-
qualification of respondents, order of scales and scale
items, and wording or ambiguity of scale items; (5) make any
needed changes to the research design; and (6) determine how
best to administer the survey including what was needed in
the cover letter's wording and content.
The pilot study was conducted in four stages.
Initially, the questionnaire was evaluated by selected
faculty members. Second, the survey was administered to a
local manufacturer's representative who was later
interviewed in depth. Changes were made to the
questionnaire and the rep was retested. The cover letter
was also resviewed and edited. Third, the questionnaire and
cover letter was sent to the Manufacturers Representative
Educational Research Foundation (MRERF) for evaluation.
Finally, the questionnaire and cover letter were sent to the
Power-Motion Technology Representative Association (PTRA) to
be distributed to their one-hundred and sixty-five members.
The members were asked to fill out the questionnaire
according to the cover letter and additionally to critique
the questionnaire and scale items by recording any comments

99
on the questionnaire. These responses and comments were
then used to update the questionnaire.
Reliability. Following data collection, the survey
responses were analyzed to determine if they were reliable,
and significantly contributed to the assessment of the
appropriate constructs. Measures which failed to be
reliable or significantly contribute were dropped.
Reliability refers to the degree with which a scale
consistently or dependably yields predictable results
(Kidder, Judd, and Smith 1986; Kerlinger 1986). Two ways of
determining reliability are: (1) to measure the same objects
at two different points in time and to compare the results
(stability); and (2) to determine the internal consistency
or internal homogeneity of the sets of items forming a scale
based on the average correlation among items within a test
(equivalence) (Churchill 1987; Nunnally 1978). Since it is
not possible to test-retest the instrument, the equivalence
method was used to evaluate reliability. In general, two
methods used to determine equivalence are split-half and
Cronbach's coefficient alpha. The split-half reliability
method divides the total set of items into two equivalent
parts which are then correlated. The correlation results
are taken as a measure of reliability. The problem with
this method is knowing where to split the data so as not to
introduce a systematic bias. Coefficient alpha, the method
primarily used in this study, assesses the internal

100
homogeneity existing among all scale items simultaneously,
and therefore does not suffer from this complication (cf.,
Churchill 1987; Nunnally 1978).
Following the reliability analysis and allied scale
purification process, the nature-of-the-product assessment
consisted of four measures with a Cronbach alpha of .8301
for the least-important-principal, and an alpha of .8321 for
the most-important-principal. The existence-of-specific-
assets analysis yielded six measures with an alpha of .7865
for the least-important-principal, and five measures with an
alpha of .7512 for the most-important-principal.
Importance-of-the-relationship was assessed using twelve
measures with an alpha of .8842 for the least-important-
principal, and nine measures with an alpha of .8296 for the
most-important-principal. Interorganizational-climate was
assessed via ten measures with an alpha of .8690 for the
least-important-principal, and twelve measures with an alpha
of .9070 for the most-important-principal. Selling-task-
characteristics was assessed using eleven measures with an
alpha of .7417 for both the least and most important
principals. The survey respondents were not asked to
differentiate between the least-important-principal or the
most-important-principal for the selling-task-
characteristics construct. Performance-satisfaction was
assessed using three measures with an alpha of .7222 for the
least-important-principal, and using three measures with an

101
alpha of .7429 for the most-important-principal. Finally,
performance-behaviors was assessed using twelve measures
with an alpha of .8893 for the least-important-principal,
and twelve measures with an alpha of .8452 for the most-
important-principal. The reliability coefficients for each
of the study constructs are shown in Table 3.4 for both the
"least" and "most" important principals. Nunnally (1978)
notes that reliabilities of .70 or higher will suffice for
the early stages of research.
Validity. An assessment of the validity of the
resulting scales was conducted following the reliability and
purification process. Reliability is a necessary but not
sufficient requirement to have valid measures so must be
accomplished before the other constituents of validity are
assessed. Validity refers to the degree to which scales
measure what they are supposed to measure. Thus, "... a
measuring instrument is valid to the extent that differences
in scores among objects reflect the object's true
differences on the characteristic that the instrument tries
to measure " (Churchill 1992, p.75). Three types of
validity are of primary interest: content, predictive, and
construct. Content validity assesses the representativeness
or sampling adequacy of a measuring instrument, or the
degree to which the domain of the characteristic being
measured is captured (Churchill 1992; Kerlinger 1986).
Content validity was determined throughout this study by

102
TABLE 3.4 RELIABILITY COEFFICIENTS FOR THE STUDY
Study Constructs Reliability Coefficient — Least-Important-
Principal
Reliability Coefficient — Most-Important-
Principal
Nature-of-the-product
Scale items® vll, v20, v22, v23
Alpha®.8301
Scale items® vll, v20, v21, v22, v23
Alpha®.8321
Existence-of-Specific-Assets
Scale items® vlOl, vl03, vl05, vl07, vl09, vlll
Alpha®.7865
Scale items® vl04, vl06, vl08, vllO, vll2
Alpha®.7512
Import ance-o f-the-Relationship
Scale items® v201, v203, v205, v207, v207, v209, v211, v213, v215, v217, v219, v229
Alpha®.8842
Scale items® v202, v204, v210, v212, v214, v218, v230, v234, v236
Alpha®.8296
Interorganizational -Climate
Scale items® vll5, vlll, vll9, vl23, vl25, vl21, vl29, vl31, vl33, vl35
Alpha®.8690
Scale items® vll4, vll6, vll8, vl20, vl22, vl24, vl26, vl28, vl30, vl32, vl34, vl36
Alpha®.9070
Selling-Task-Characteristics
Scale items® vl2, vl3, vl5, vl6, vl7, vl8, v31, v35, v36, v37, v38
Alpha®.7417
Scale items® vl2, vl3, vlS, vlS, vll, v31, v35, v31, v38
Alpha®.7417
Performance-Satisfaction
Scale items® v64, v66, v68
Alpha®.7222
Scale items® v65, v67, v69
Alpha®.7429
Performance-Behaviors
Scale items® v40, v42, v44, v46, v48, v50, v52, v54, v56, v58, v60, v62
Alpha®.8893
Scale items® v41, v43, v45, v47f v49, v51, v53, v55f
v57, v59, v61, v63
Alpha®.8452
(1) The reliability determination is based on 1032 sets of data. (2) Final numbers are standardized item alpha

103
using various experts (e.g., selected reps and
representative associations or foundations, experienced
marketing personnel, etc.) to evaluate the basic problem
determination, the theoretical foundation for the study ,
test methodology, the test instrument, and finally examine
the completed instrument to determine if it looked as it
should.
Predictive validity is the ability of a measure to
assess future differences or predict the criterion
(Churchill 1992; Judd, Kidder, and Smith 1986). This form
of validity will not be assessed as part of this study as no
base determination has been previously made as to the
validity of the measurements used in this study.
Construct validity "...is the level of confidence
researchers (and reviewers) have about the degree to which a
measure represents a particular construct" (Peter and
Churchill 1986, p.2). Peter and Churchill (1986) note that
at least three types of evidence can be used in determining
the degree of construct validation. First are the
procedures used to create and develop the measures including
content validation. Second are estimations of trait
validity including reliability, convergent and discriminant
validity. These estimates help assess how much variance is
not accounted for by error and can be tentatively accepted
as variance in the trait or construct. Third are the
estimates of nomological, or lawlike, validity. These

104
estimates attempt to determine the degree to which a measure
behaves as predicted by theory. Thus, the results of the
evaluation of the study hypotheses presented in chapter IV
provide a measure of the nomological validity of the
instrument and its related measures.
Convergent validity is defined as the correlation
between two or more different measures claiming to measure
the same construct. Conversely, discriminant validity is
defined as the extent to which a measure is unique and not
simply a reflection of other variables (Peter and Churchill
1986). Thus, discriminant validity provides information
about what a measure does not correlate with.
One method for determining which measures assess the
same thing (are correlated) and the extent to which they
measure what they measure (and not measure what they are not
supposed to measure) is factor analysis (Kerlinger 1986).
Factor analysis can be particularly important in construct
validation if the problem can be conceptualized in terms
that theoretically group variables [and measures] into sets
which purportedly measure different aspects of different
constructs (Nunnally 1978). For example, the literature on
the manufacturer/rep relationship indicated that many
factors and issues were operant within the relationship.
Upon examination, these factors and issues seemed to be a
result of seven unique constructs (nature-of-the-product,
etc.) as explicated by agency theory. Thus, in essence, the

105
study was conceptualized in terms of factor analysis. As
Nunnally (1973) notes: The hypotheses would receive
substantial support if: (1) the individual measures
concerning each construct correlate substantially with each
other, and (2) the average correlation between measures for
individual constructs [in each group] is low. Both of these
requirements were met as follows.
A principal components factor analysis with varimax
rotation (used to maximize the correlation with the factor,
i.e., loadings, and subsequently the explained variances,
i.e., the square of the loadings, of the variables composing
each factor) was employed to verify that each measure
uniquely contributed to the explained variance of the
correct construct [factor] based on theory, and
substantially correlated with other measures which
purportedly assessed the same construct. Seven factors were
specified in the analysis a priori in accordance with
theoretical expectations (see Nunnally 1978, p.421). As
predicted, the majority of scale variables used to assess
each construct grouped together and uniquely on each factor
[construct] thus indicating both convergent and discriminant
validity (see Table 3.5, p.109).
For the least-important-principal analyses, nature-of-
the-product was assessed by five measures with loadings
ranging from .59298 to .80872. Existence-of-specific-assets
was assessed by six measures with loadings ranging from

106
.40035 to .57960. Importance-of-the-relationship was
assessed by fifteen measures with loadings ranging from
.43160 to .67 325. Interorganizational-climate was assessed
by ten measures with loadings ranging from .46670 to .70963.
Selling-task-characteristics was assessed by ten measures
with loadings ranging from .41603 to .75581. Performance-
behaviors was assessed by twelve measures with loadings
ranging from .49961 to .75623. Performance-satisfaction was
assessed by three measures with loadings ranging from .43464
to .57077. A loading of around .40 or higher was used to
indicate a significant contribution to the explained
variance of a factor. Nunnally (1978) notes that factor
loadings of around 0.5 or better are preferred when deciding
whether a factor is significant, but the determination of a
factor's significance also depends on the number and
correlation of the variables used to assess the construct,
as well as the size of the sample. The sample size for this
study was large and the average correlations among the
variables used to assess each construct were above 0.4.
Thus, most of the common factors appeared to be significant,
and to agree with the theoretical model. However, there
were some problems.
The performance-satisfaction variables grouped together
with the interorganizational-climate variables thus
indicating a high degree of correlation between the
constructs. This was acceptable as one was a dependent

107
measure while the other was an independent measure. Of more
interest, two of the scales used to assess selling task
characteristics loaded on separate factors in the analysis
thus indicaiting a low intercorrelation among the scales.
This was not necessarily a problem, but points to the need
for additional development of the selling-task-
characteristics construct. The existence of this issue was
also indicated in the scale purification process, when
assessing reliability. Two of the subconstructs which had
been thought to be part of the selling-task-characteristics
construct were shown to be insignificant so were dropped.
None of the items generated from the reliability analysis
refused to load or substantially correlated with the wrong
construct.
Another problem, was that there was some blurring of
the importance-of-the-relationship construct and the
interorganizational-climate construct in the minds of the
survey respondents as indicated by three variables which
were correlated with each somewhat equally. This may
indicate that these measures require some reconsideration as
to their design, or may point to a more fundamental issue.
This viewpoint is reinforced by the most-important-principal
analysis in which all of the measures for both the
importance-of the-relationship and interorganizational-
climate constructs loaded on the same factor.

108
Table 3.5, documents the factor analysis for the least-
important-principal. For the most-important-principal
analyses, nature-of-the-product was assessed by five
measures with loadings ranging from ..62021 to .78390.
Existence-of-specific-assets was assessed by four measures
with loadings ranging from .38193 to .56189 Importance-of-
the-relationship was assessed by eight measures with
loadings ranging from .40074 to .61884.
Interorganizational-climate was assessed by eleven measures
with loadings ranging from .55198 to .77134. Selling-task-
characteristics was assessed by ten measures with loadings
ranging from .44233 to .73185. Performance-behaviors was
assessed by twelve measures with loadings ranging from
.47962 to .64502. Performance-satisfaction was assessed by
three measures with loadings ranging from .42756 to .69421.
Thus, most of the common factors appeared to be significant,
and to agree with the hypothetical model. However, there
were some problems.
In the most-important-principal analysis,
interorganizational-climate loaded with performance-
satisfaction, as in the previous analysis, but also loaded
with importance-of-the-relationship. One possible reason
for this might be that the rep is more objective when
considering the least-important-principal versus the most-
important-principal. As in the least-important analysis,
the selling task construct scales loaded separately.

109
TABLE 3.5 FACTOR ANALYSIS OF STUDY VARIABLES
Item Nature of product
Exist. of Specific Assets
luport. of Rel.
Inter. Climate
Selling Task Charac.
Perfor. Behav.
Perfor. Satis.
v11, v20, v21, v22, v23
.62275
.80496
.80872
.70585
.59298
v101, v103, v105, v107, v109, V111
.57960
.49844
.55958
.39208
.48317
.40035
.48678
v201, v203, v205, v207, v209, v211, v213, v215, v217( v219, v229, v231, v233, v235, v237
.43950
.46921
.50394
.56238
.49250
.53788
.57306
.67325
.61066
.55517
.43160
.50389
.54959
.68582
.48990
.44880
.42597
v115, v117, v119f v123# v125# v127, vt29# v131, v133, v135
.39105
.49210
.68284
.61076
.55106
.70828
.70069
.46670
.59953
.59740
.70963
(1) Varimax Rotation (2) A l l loadings around 0.4 and above are reported (.39 is rounded to 0.4)
Finally, variables v31 and v38 loaded across two constructs
(i.e., nature-of-the-product and the selling-task
characteristics) which indicated the possible need for
further scale development or analysis.
Table 3.6 presents a summary of the results achieved
using factor analysis of the scale variables for each

110
Table 3,5 — CONTINUED —
I tens Nature of Product
Exist. of Specific Assets
Import, of Rel.
Inter. Climate
Selling Task Charac.
Perfor. Behav.
Perfor. Satis.
See Note **
v12, v!3, vt5, v16, v17, v32, v35, v36, v37, v38
.67650
.64510
.75581
.75374
.73990
.48103
.51931
.55072
.41603
.50672
v40, v42, v44, v46, v48, v50, v52, v54, v56, v58, v60, v62
.49961
.68858
.69538
.73789
.69853
.68641
.50496
.67510
.75623
.68936
.69152
.69841
v64f v66, v68
See Note ***
.57077
.49481
.43464
Note Selling-task-characteristics is the summation of two factors which group together under the selling task construct Performance-satisfaction is a dependent measure and highly correlated with interorganizationaI-climate in the factor analysis but is shown separately in the factor table for purposes of exposition.This would seem to demonstrate that some reconceptualization of the selling-task-characteristics construct may be required in later studies.
construct. The scale variables for the selling task
construct are shown together in accordance with theory.
Likewise, performance-satisfaction is shown separately.

Ill
TABLE 3.6 FACTOR ANALYSIS OF STUDY VARIABLES
I teas Nature of Protiluct
Exist. of Specific Assets
Inport. of Rel.
Inter. CLinate
Selling Task Charac.
Perfor. Behav.
Perfor. I Satis.
v11. v20, v21, v22. v23
.63454
.77281
.78390
.69367
.62020
< < < <
o o
rv> o oo a*
.38193
.55574
.42104
.56189
v202, v204, v210, v212, v214f v218f v230, v236
See Note * .50866 .61884 .53569 .40074 .43637 .48932 .41513 .42368
v114, v116, v118f v120, v124, v126, v128f v130, v132f v134, v136
See Note * .55198 .60322 .72657 .61164 .66325 .77045 .77134 .64758 .62606 .60877 .69532
and with performance-satisfaction when dealing with the "Most-Important-Pri shown as a separate factor for purposes of exposition in line with theory.
(1) The table is produced using Varimax Rotation
Hail Survey amd Non-Response Study
Data was obtained through a self-administered
questionnaire from industrial sales reps or firms which are
members of twenty-six associations which compose the
Manufacturer's Representative Educational Research
Foundation (MRERF). Members are independent multi-line
representatives involved in the sale of industrial goods

112
Table 3,6 CONTINUED —
Iteas Nature of Product
Exist. of Specific Assets
Import. of Rel.
Inter. Climate
Selling Task Charac.
Perfor. Behav.
Perfor. Satis.
See Note **
v12f v13, v15f v16, v17, v31, v35, v36# v37, v3 8
.42835
.46345
.63694
.60432
.73185
.68231
.70771
.45942
.44233
.53192
.50737
.50555
v41, v43, v45, v47, v49# v51, v53, v53, v57, v59, v61, v63
.54565
.64502
.61695
.60488
.54657
.55841
.51029
.54188
.62527
.47962
.59707
.60605
See Note ***
v65, v6 7, v69
.69421
.42756
.44720
Notes **: Selling-task-character!sties is the summation of two factors which group together under the selling task construct
***; Performance-satisfaction is a dependent measure and highly correlated with interorganizational-climate in the factor analysis but is shown separately the factor table for purposes of exposition.
in
across the United States. Support was obtained from MRERF
and the Power-Motion Transmission Representative Association
(PTRA)in the form of two grants to cover mailing and
printing costs. Mail lists were also provided along with
acknowledged affiliation to help the response rate.
Non-response to mail surveys is typically a significant
problem in industrial marketing (Faria and Dickinson 1992;

113
Jobber 1986; Karimabady and Brunn 1991). Non-response
introduces uncertainty about whether a sample represents a
population accurately, and severely impedes the ability to
generalize sample outcomes to the population. Those not
sampled may have responded differently. The most commonly
stated solution is to limit non-response by using various
survey methodologies to increase the response rate (London
and Dommeyer 1990; Walker, Kirchmann, and Conant 1987).
Lacking being able to increase the response rate [or
in concert with], non-response error may be estimated to
ascertain the degree of any possible problem (Armstrong and
Overton 1977). Of the various estimation methods presented
by Armstrong and Overton (1977)(i.e., comparison with known
values for the population, subjective estimates, and
extrapolation methods), extrapolation is probably the most
relevant for this study. The comparison method requires
known values of non-response bias. Few studies similar to
this one have been attempted. Subjective estimates require
some basis. It is not clear how this might be accomplished.
Extrapolation methods assume that respondents who return
their questionnaire less readily are more like non-
respondents than respondents (Armstrong and Overton 1977).
With this in mind, early returns can be compared to late
returns to ascertain if a significant difference exists and
non-response bias is an issue.
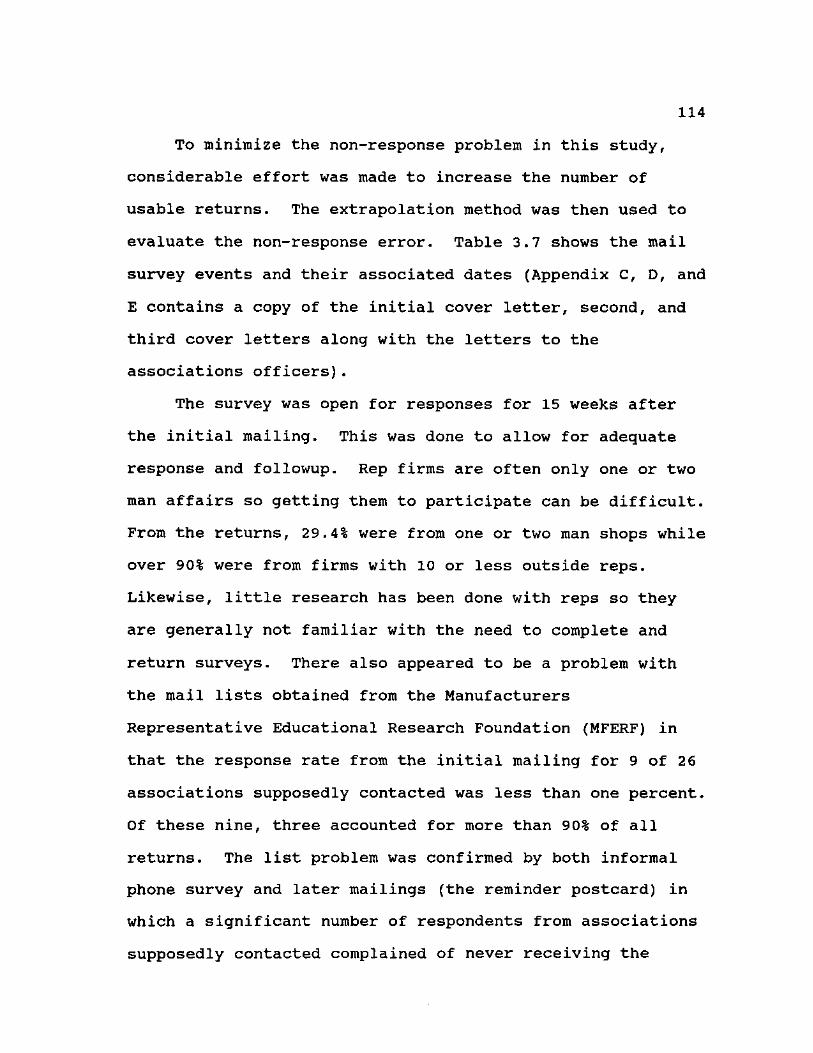
114
To minimize the non-response problem in this study,
considerable effort was made to increase the number of
usable returns. The extrapolation method was then used to
evaluate the non-response error. Table 3.7 shows the mail
survey events and their associated dates (Appendix C, D, and
E contains a copy of the initial cover letter, second, and
third cover letters along with the letters to the
associations officers).
The survey was open for responses for 15 weeks after
the initial mailing. This was done to allow for adequate
response and followup. Rep firms are often only one or two
man affairs so getting them to participate can be difficult.
From the returns, 29.4% were from one or two man shops while
over 90% were from firms with 10 or less outside reps.
Likewise, little research has been done with reps so they
are generally not familiar with the need to complete and
return surveys. There also appeared to be a problem with
the mail lists obtained from the Manufacturers
Representative Educational Research Foundation (MFERF) in
that the response rate from the initial mailing for 9 of 26
associations supposedly contacted was less than one percent.
Of these nine, three accounted for more than 90% of all
returns. The list problem was confirmed by both informal
phone survey and later mailings (the reminder postcard) in
which a significant number of respondents from associations
supposedly contacted complained of never receiving the

115
TABLE 3.7 MAIL SURVEY EVENTS
Event # Event Date
1 Mail letters asking for participation in study to all foundation members, and return postcard.
7/5/94
2 Mail first wave of cover letter, and questionnaire to participation group (first class mail).
8/8/94
3 Mail out survey to all foundation members not in the participation group (bulk mail)•
8/11/94
4 Mail letter to the officers of the twenty -six member association of MRERF asking for their active involvement.
9/12/94
5 Begin phone calls to association officers to follow-up the letter asking for their help in assuring participation.
8/17/94
6 Mail second letter to association officers with additional information.
8/17/94
7 Mail reminder postcard. 8/25/94
8 Start sending letters along with questionnaires to those who have sent back incomplete questionnaires asking that they complete and return them.
9/1/94
9 Mail third letter to association officers thanking them for their offers of help and to get information about the exact timing and nature of their support.
9/20/94
10 Mail second wave of cover letter, and questionnaire to participation group.
9/22/94
11 Begin coding questionnaires. 10/1/94
12 Data entry begins. 10/19/94
13 Mail third wave of cover letter, and questionnaire to participation group.
10/21/94
14 Close survey. 12/1/94
initial mailing. There was also a substantial number of
reps who phoned or sent faxes asking to be included
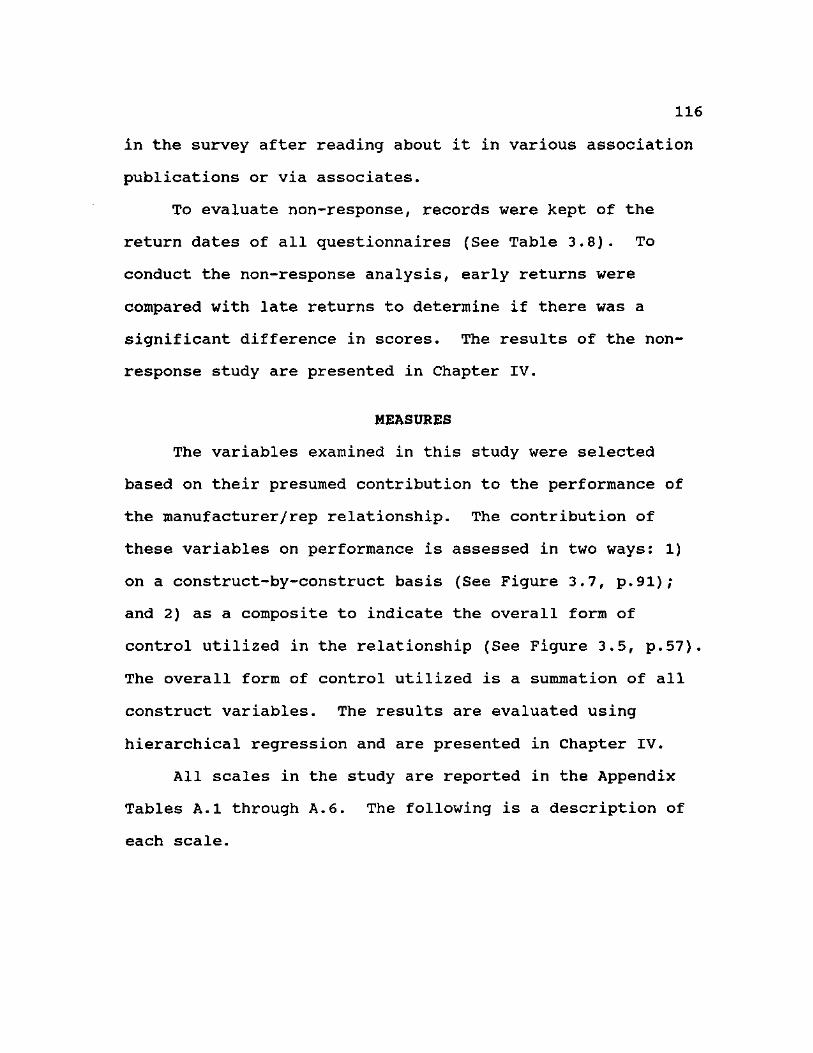
116
in the survey after reading about it in various association
publications or via associates.
To evaluate non-response, records were kept of the
return dates of all questionnaires (See Table 3.8). To
conduct the non-response analysis, early returns were
compared with late returns to determine if there was a
significant difference in scores. The results of the non-
response study are presented in Chapter IV.
MEASURES
The variables examined in this study were selected
based on their presumed contribution to the performance of
the manufacturer/rep relationship. The contribution of
these variables on performance is assessed in two ways: 1)
on a construct-by-construct basis (See Figure 3.7, p.91);
and 2) as a composite to indicate the overall form of
control utilized in the relationship (See Figure 3.5, p.57).
The overall form of control utilized is a summation of all
construct variables. The results are evaluated using
hierarchical regression and are presented in Chapter IV.
All scales in the study are reported in the Appendix
Tables A.1 through A.6. The following is a description of
each scale.
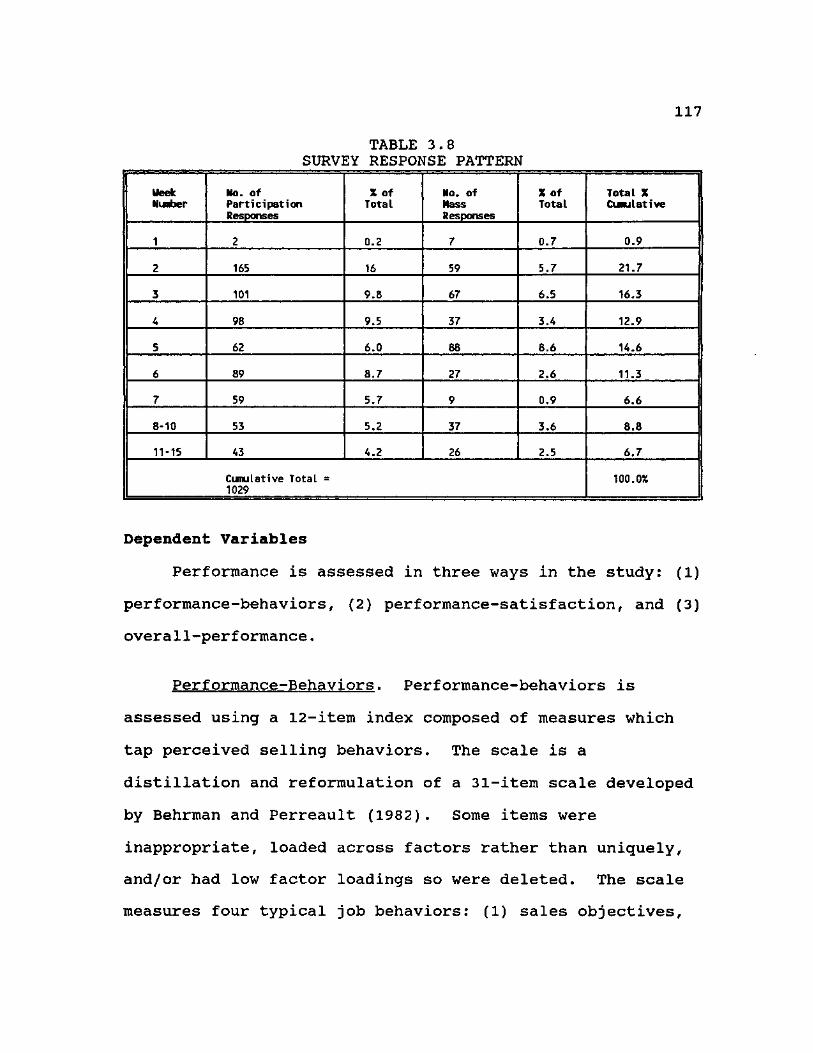
117
TABLE 3.8 SURVEY RESPONSE PATTERN
Meek Nusber
No. of Participation Responses
X of Total
No. of Mass Responses
X of Total
Total X Cumulative
1 2 0.2 7 0.7 0.9
2 165 16 59 5.7 21.7
3 101 9.8 67 6.5 16.3
4 98 9.5 37 3.4 12.9
5 62 6.0 88 8.6 14.6
6 89 8.7 27 2.6 11.3
7 59 5.7 9 0.9 6.6
8-10 53 5.2 37 3.6 8.8
11-15 43 4.2 26 2.5 6.7
Cumulative Total = 1029
100.0%
Dependent Variables
Performance is assessed in three ways in the study: (1)
performance-behaviors, (2) performance-satisfaction, and (3)
overall-performance.
Performance-Behaviors. Performance-behaviors is
assessed using a 12-item index composed of measures which
tap perceived selling behaviors. The scale is a
distillation and reformulation of a 31-item scale developed
by Behrman and Perreault (1982). Some items were
inappropriate, loaded across factors rather than uniquely,
and/or had low factor loadings so were deleted. The scale
measures four typical job behaviors: (1) sales objectives,

118
(2) technical knowledge, (3) providing information, and (4)
sales presentations.
One scale item in the performance-behaviors scale
assesses overall perceived performance as suggested by
Avila, Fern, and Mann (1988) but modified to account for
reps' performance perceptions rather than sales managers'.
No reliability outcome was predicted due to the many changes
in the original scales. A 7-point semantic differential
scale is employed for all scales. The anchors vary from
scale to scale.
Performance-Satisfaction. Performance-satisfaction is
measured by a 3-item instrument based on a composite of the
research of Frazier, Gill, and Kale (1989), Gaski and Nevin
(1985), and Hunt and Nevin (1974). The instrument asks
about the degree of overall approval of the manufacturer/rep
relationship. Performance-satisfaction measures the sum of
the contribution of those elements dealing with how the
parties to the relationship feel about it, and is viewed as
a summary measure of the affective portion of the
relationship.
Overall-Performance. Overall-performance is assessed
by combining the performance-behaviors and performance-
satisfaction scales to produce an overall assessment of
performance. The values for all of the variables which
comprise the performance-behaviors and performance-

119
satisfaction scales are added together to produce a simple
simulated scale.
Independent Variables
Nature-of-the-Product. The 5-item, 7-point scale is
based on a composite of items shown to describe Porter's
(1980) two opposing generic product strategies: (1)
standardized, and (2) differentiation.
Existence-of-Specif ic-Assets. The 6-item specific
asset scale is a modification and combination of two
idiosyncratic investment scales developed by Anderson and
Weitz (1992) to investigate distributor/supplier
relationships. The scales were modified to better assess
the aggregate use of specific assets within a
rep/manufacturer relationship. The reported Cronbach alpha
reliability of the original scales is .81 and .80.
Importance-of-the-Relationship. Partnering is defined
as the degree to which exchange partners work together to
achieve a common goal, and is assessed using a 14-item index
composed of three scales: (1) communication adequacy, (2)
degree of mutual participation, and (3) amount of resource
sharing. From theory, a high degree of partnering (i.e.,
scale average is greater than four) indicates an "important"
versus "unimportant" relationship. The first 10 items were
developed by Anderson, Lodish, and Weitz (1987). The
reliability of the scale was not specifically reported but

120
low correlations among independent variables along with high
factor loadings suggest that it is adequate. The final
items are based on research by Burke (1984) on how
multiproduct firms determine strategic marketing objectives
for business units. The scale is 7-point with a reported
reliability of .87. The original scale was modified to
account for the differences in perspective between reps and
firm managers.
Interorcranizational-Climate. The 11-item scale is a
composite of five scales which assess the subconstructs:
consideration/goodwill, goals-and-expectations, trust, and
future-potential-of-the-relationship. The composite scale
assesses a range of climatic values from cool to warm. Warm
climates have an overall mean of greater than 3.5. Cool
climates have means of less than 4.5. A value of between
3.5 and 4.5 is indeterminate.
Consideration/goodwill refers to the extent to which
the working environment fosters a sense of mutual support,
respect, helpfulness, and friendliness. Warmer climates are
characterized as exhibiting more consideration/goodwill
compared to colder climates. It is assessed via a 6-item,
7-point scale primarily based on work by House and Dressier
(1974), Teas (1981), and Anderson, Lodish, and Weitz (1987).
Goals-and-expectations refers to the degree of
alignment between the manufacturer and rep on relationship
expectations and growth objectives for the relationship.

121
From theory, the greater the degree of similarity the warmer
the climate. Goals-and-expectations are assessed via a 2-
item 7-point scale based on the work of Anderson, Lodish,
and Weitz (1987). Trust is assessed via a 2-item 7-point
scale based on the work of Anderson, Lodish, and Weitz
(1987) .
The future-potential-of-the-relationship (FPR) refers
to the probability of a continuing and profitable
relationship. Relationships with a greater future potential
should be warmer. FPR is assessed by a single item based on
work by Anderson, and Weitz (1992), and Anderson, Lodish,
and Weitz (1987).
Dependence was originally thought to be part of
interorganizational climate but was dropped due to low
loadings and further theoretical consideration.
Sellinq-Task-Characteristics. The 10-item scale is a
composite of two scales which assess the subconstructs:
outcome-uncertainty, and output-measurability. The
subconstructs task-programmability and behavior-
measurability were dropped because of poor loading. The
means for each scale assess the degree of uncertainty, or
measurability respectively (a seven indicates a great deal
of uncertainty, programmability, or measurability).
Outcome-uncertainty assesses the inability to directly
link work inputs to desired outcomes. It is measured via a
5-item 7-point scale based on work by John and Weitz (1988).

122
The reported reliability of the original scale was 0.73.
Output-measurability describes the degree to which outcomes
from a work process can be measured with reliability and
validity. It is assessed using a 5-item 7-point scale which
is a composite of scales developed by John and Weitz (1989),
and Anderson (1984). The reported reliability for the
original scales was 0.89 and 0.63 respectively.
Demographic Variables
Based on common practice, demographics are hypothesized
to influence rep performance as shown in Figures 3.6 and
3.7. For simplicity, only a few demographic variables
[constructs] are evaluated in this study: (1) experience —
the length of time the rep firm has been in business, and
maintained a relationship with their most and least
important principals; (2) longevity — the firm's time in
business, the rep's selling experience, and the rep's
experience as an agent; and (3) size — the total sales
dollars for the firm, and the number of inside and outside
reps employed by the firm. The demographic constructs:
experience, longevity, and size were assessed by three
measures for each based an a factor analysis which indicated
a high degree of similarity between the individual measures.
Model Specifications
Based on arguments by Cohen and Cohen (1983), multiple
regression/correlation analysis (MRC), or more specifically,

123
hierarchical analysis of sets was deemed to be the most
appropriate analytic method for this study. MRC is defined
by Cohen and Cohen (1983, p.3) as:
—a data-analytic system which gives measures of the magnitude of the whole relationship of a factor to the dependent variable, as well as its partial (unique, net) relationship, that is, its relationship over and above that of other research factors (proportions of variance and coefficients of correlation and regression).
MRC, — may be used whenever a quantitative variable (the dependent variable) is to be studied as a function of, or a relationship to, any factors of interest (expressed as independent variable).
Hierarchical analysis consists of a series of k
multiple regression/correlation analysis, each with one more
variable than its predecessor. For example:
Y, = B0 + BjX, + B2X2 + B3X3
Yj = Bq -I" B|X| "I* B2X2 B3X3 *1" B4X4
Yj = B0 + BjX, + B2X2 + B3X3 + B4X4 + B5X5
This approach allows the researcher to specify the
order in which independent variables, or sets of variables,
are evaluated based on the logic of the research and on
their respective contribution to R2. The significance of
this contribution may be determined using the F test. The
order may be varied based on causal priority, to remove
spurious relationships (multicollinearity), or to allow for
the structural properties of the research factors.
Hierarchical regression may be approached in a top-down
or bottom-up fashion. In the top-down approach, all
variables are in the model initially and the researcher

124
subtracts them one at a time based on some causal priority.
The significance of the relative contribution is evaluated
using the F-test. This study used the top-down approach to
examine the overall model. Following this, the bottom-up
approach was used in line with the recommendations of Cohen
and Cohen (1983) to gain the highest control as well as
information about the individual contribution of variables
to provide the most robust test of theory. This was done
because the contribution to R2 associated with a specific
variable may be highly dependent on what other variables are
in the model. Thus, the researcher can gain understanding
of the phenomena being studied by entering variables in a
considered manner based on theory. The main problem is
knowing which variables and in what order they should be
added. The contribution to R2 for any variable may
critically depend on what else is already in the equation.
An additional feature of hierarchical regression is
that the variables used in the analysis may be sets of
variables rather than individual variables. This is
fortunate because much marketing data is gathered and
organized as sets (e.g., demographics data, personality
inventory tests, etc.). Sets are defined as a group
classified as belonging together for some reason. Each set
may be composed of a single variable or set of variables
which may, in turn, be composed of additional sets. There
are two basic reasons for forming sets of independent

125
variables: (1) structure of the research, and (2) the
function, or substantive content, of the independent
variables to the logic of the research. Structural sets of
independent variables might be used to represent a research
factor: (1) when observations are classified as nominal, or
qualitative, more than one independent variable may be
required to represent the factor; (2) when using
quantitative scales where a factor may have both linear and
nonlinear aspects; and (3) when data is missing from a set
of observations. Functional sets may be used when a
dependent variable is modeled as being a function of
multiple scales, or other constructs which themselves may be
made up of one or more variables. It might also be used to
partial out the effect of confounding variables or
constructs.
In this study, sets of variables are used to measure
various aspects of constructs which are used in conjunction
with other constructs, or independent variables, to assess
their individual and joint contribution in explaining the
variance of the dependent variable. The general form of the
hierarchical procedure is as follows:
R2YSTUVW = ^ Y S + R 2 Y ( T S ) + ^ 2 y- (UST) + R 2 Y(VSTU) + R2Y(WSTUV)
Y = The dependent variable
S,T,U,V,W = Sets of independent variables (one set for each construct) which are regressed on the dependent variable

126
R2 = The proportion of the variance of the dependent variable which is explained by the sets of independent variables (S,T,U,V,W)
The form of the equation would appear to indicate the
order in which each variable should be added to the
equation. However, in the foregoing, the ordering of the
variables is coincidental. It is not clear, based on the
literature, what order would produce the highest explained
variance. Thus, some experimentation with ordering will be
necessary.
Demographics factors are hypothesized to also influence
the dependent variable within the manufacturer/rep
relationship. Although a possible interaction may exist
between demographic variables and independent variables, or
between demographic variables and independent variables
separately, no interaction is assumed or will be evaluated.
The form of the equation for the model (Figure 3.7
p.91) is as follows.
Y = X„ X2, X3) X4, X5, X6, X7) X8 (Main Effects only)
For the proposed model:
X, — Nature-of-the-product: standardized, differentiated.
X2 — Existence-of-specific-assets.
X3 — Importance-of-the-relationship: partnering, rewards.
127
X4 — Interorganizational-climate: consideration/goodwill, goals-and-expectations, trast, future-potential-of-the-relationship.
X3 — Selling-task-characteristics: outcome-uncertainty, task-programmability, output-measurability, behavior-measurability.
X6 — Experience: Time in Business, the length of the rep's relationship with their principal's
X7 — Longevity: The reps's selling experience or experience as a rep.
Xg — Size: Measured as the total dollar sales for the firm, or number of inside and outside reps.
Y — Overall-Performance: Combination of performance-behaviors and performance-satisfaction.
Centering (i.e., setting the mean to zero), using mean
deviation, was used to reduce possible correlation among
independent variables (multicollinearity)(Cohen and Cohen
1983). After centering the data the degree of
multicollinearity was checked. Multicollinearity is an
issue because substantial correlation among independent
variables can produce problems with the interpretation of
partial coefficients, their sampling stability, and
computational accuracy. It was thought that this might have
been an issue in this study because the sets of variables
which assessed each construct were intended to be highly
correlated. The presence of multicollinearity was evaluated
by examining the pairwise correlations among all independent
variables, and by employing variance inflation factors
(VIF). Berry and Feldman 1985) note that a correlation of
0.85 or less might be appropriate as one test of

128
multicollinearity. No pair of variables had a correlation
of 0.85 or more. However, both Berry and Feldman (1985) and
Ofir and Khuri (1986) caution that this test is not
sufficient. It is only useful as a first step in diagnosing
the presence of multicollinearity. Variance inflation
factors (VIF) are much more useful in detecting
multicollinearity (Ofir and Khuri 1986). VIFs are the
diagonal elements of the inverse of the (X'X) correlation
matrix for the regression model. A ten or less would
indicate that the multicollinearity is probably not a
problem. Conversely, more than ten would indicate that it
might be a problem. No VIF exceeded 4 for any analysis
which confirmed the findings from the pairwise analysis.
Multicollinearity was not a problem.

CHAPTER REFERENCES
Anderson, Erin M. (1984), "The Salesperson as Outside Agent or Employee: A Transaction Cost Analysis," Report No. 84-107, Cambridge, Ma: Marketing Science Institute.
(1985), "The Salesperson as Outside Agent or Employee: A Transaction Cost Analysis," Marketing Science. 4 (3), 234-254.
and Richard L. Oliver (1987), "Perspectives on Behavior-Based Versus Outcome-Based Salesforce Control Systems," Journal of Marketing. 51 (October), 76-88.
and Barton A. Weitz (1992), "The Use of Pledges to Build and Sustain Commitment in Distribution Channels," Journal of Marketing Research. 29 (February), 18-34.
Leonard M. Lodish, and Barton A. Weitz (1987), "Resource Allocation Behavior in Conventional Channels," Journal of Marketing Research. 24 (February), 85-97.
Anderson, Carl R., and Carl P. Zeithaml (1984), "Stage of the Product Life Cycle, Business Strategy, and Business Performance," Academy of Management Journal. 27 (1), 5-24.
Anderson, James C., and James A. Narus (1984), "A Model of the Distributor's Perspective of Distributor-Manufacturer Working Relationships," Journal of Marketing. 48 (Fall), 62-74.
(1990), "A Model of Distributor Firm and Manufacturing Firm Working Partnerships," Journal of Marketing. 54 (January), 42-58.
Armstrong, J. Scott and Terry S. Overton (1977), "Estimating Nonresponse Bias in Mail Surveys," Journal of Marketing Research. 14 (August), 396-402.
Avila, Ramon A., Edward F. Fern, and O. Karl Mann (1988), "Unravelling Criteria for Assessing the Performance of Salespeople: A Causal Analysis," Journal of Personal Selling and Sales Management. 8 (May), 45-54.
Barney, Jay B. and William G. Ouchi (1986), "Organizational Economics." San Francisco: Jossey-Bass Publishers.
Basu, Amiya, K., Rajiv Lai , V. Srinivasan, and Richard
129

130
Staelin (1985), "Salesforce Compensation Plans: An Agency Theoretic Perspective," Marketing Science. 4 (4), 267-91.
Bellizzi, Joseph A. and Christine Glacken (1986), "Building a More Successful Rep Organization," Industrial Marketing Management. 15, 207-13.
Behrman, Douglas N., and William D. Perreault (1982), "Measuring the Performance of Industrial Salespersons," Journal of Business Research. 10, 355-70.
Berry, William D. and Stanley Feldman (1985), Multiple Regression in Practice. Beverly Hills Ca.: Sage Publications Inc.
Bobrow, Edwin E. (1982), "Is the Independent Sales Agent for You," Management Aids, MA 4.005, Washington, D.C.: The Small Business Administration.
^ (1991), "Reps and Recognition: Understanding What Motivates," Sales and Marketing Management. September, 82-6.
Brown, James R. (1979), "Channel Cooperation: Its Relationship to Channel Performance," In: Contemporary Issues in Marketing Channels. Robert F. Lusch and Paul H. Zinszer eds., University of Oklahoma Press, 87-101.
Burke, Marian C. (1984), "Strategic Choice and Marketing Managers: An Examination of Business-Level Marketing Objectives," Journal of Marketing Research. 21 (November), 345-59.
Bush, Robert P., Alan J. Bush, David J. Ortinau, and Joseph F. Hair, Jr. (1990), "Developing A Behavior-Based Scale to Assess Retail Salesperson Performance," Journal of Retailing. 66 (1), 119-36.
Castleberry, Stephen B. and John F. Tanner, Jr. (1986), "The Manager-Salesperson Relationship: An Exploratory Examination of the Vertical-Dyad Linkage Model," Journal of Personal Selling and Sales Management. 6 (November), 29-37.
Chandler, Alfred D., Jr. (1962), "Strategy and Structure: Chapters in the History of the Industrial Enterprise." Cambridge, Ma.: The M.I.T. Press.
Child, John (1975), "Managerial and Organizational Factors Associated with Company Performance Part II. A Contingency Analysis," The Journal of Management Studies. February, 12-27.
131
Childers, Terry L., Alan J. Dubinsky, and Steven J. Skinner (1990), "Leadership Substitutes as Moderators of Sales Supervisory Behavior," Journal of Business Research. 21, 363-82.
Churchill, Gilbert A. Jr. (1979), "A Paradigm for Developing Better Measures of Marketing Constructs," Journal of Marketing Research. 16 (February), 64-73.
(1987), Marketing Research: Methodological Foundations. 4th ed., Chicago: The Dryden Press; Holt, Reinhart, Winston Co.
(1992), "Better Measurement Practices are Critical to Better Understanding of Sales Management Issues," Journal of Personal Selling & Sales Management. 12(2)(Spring), 73-80.
and Orville C. Walker, Jr. (1976), "Organizational Climate and Job Satisfaction in the Salesforce," Journal of Marketing Research. 13 (November), 323-32.
and (1979), "Personal Characteristics of Salespeople and the Attractiveness of Alternative Rewards," Journal of Business Research. 7, 25-50.
Neil M. Ford, Steven W. Hartley, and Orville C. Walker Jr. (1985), "The Determinants of Salesperson Performance: A Meta-Analysis," Journal of Marketing Research. 22 (May), 103-18.
Cohen, Jacob, and Patricia Cohen (1983), "Applied Multiple Regression/Correlation Analysis for the Behavioral Sciences." 2nd ed., Hillsdale, NJ: Lawrence Erlbaum Associates.
Dant, Shirish P., and David T. Wilson (1990), "The Role of Agent Performance in Dependence Balancing in Principal-Agent Dyad," IBSM Report 10-1990, Institute for the Study of Business Markets, Pennsylvania State University, University Park, PA.
Day, George S. and Saul Klein (1987), "Cooperative Behavior in Vertical Markets: The Influence of Transaction Costs and Competitive Strategies," in Review of Marketing. Michael J. Houston ed., Chicago, IL: American Marketing Association.
Dess, Gregory G., and Peter S. Davis (1984), "Porter's

132
(1980) Generic Strategies as Determinants of Strategic Group Membership and Organizational Performance," Academy of Management Journal. 27 (3), 467-88.
Dickson, John W. (1981), "Participation as a Means of Organizational Control," Journal of Management Studies. 18 (2), 159-76.
DuBois, Lois C. and Roger H. Grace (1987), "The Care and Feeding of Manufacturers' Reps," Business Marketing. December, 52-63.
Dwyer, F. Robert, Paul H. Schurr, and Sejo Oh (1987), "Developing Buyer-Seller Relationships," Journal of Marketing. 51 (April), 11-27.
Eisenhardt, Kathleen M. (1982), "Organizational Control From the Perspective of Agency Theory: A Field Setting Example," Unpublished dissertation, Graduate School of Business, Stanford University.
(1985), "Control: Organizational and Economic Approaches," Management Science. 31 (2), 134-49.
(1989), "Agency Theory: An Assessment and Review," Management Review. 14 (1), 57-74.
El-Ansary, Adel I., and Louis W. Stern (1972), "Power Measurement in the Distribution Channel," Journal of Marketing Research. 9 (February), 47-52.
Eliashberg, Jehoshua, and Donald A. Michie (1984), "Multiple Business Goals Sets as Determinants of Marketing Channel Conflict: An Empirical Study," Journal of Marketing Research. 21 (February), 75-88.
Emerson, Richard M. (1962), "Power-Dependence Relations," American Sociological Review. 27 (February), 31-41.
Evan, William M. (1969) "Toward a Theory of Inter Organizational Relations," in Distribution Channels: Behavioral Dimensions. Louis Stern, ed., Boston: Houghton-Mifflin Co., 73-88.
Faria, A. J. and John R. Dickinson (1992), "Mail Survey Response, Speed, and Cost," Industrial Marketing Management. 21, 51-60.
Fields, Gene E. (1985), "A Matter of Trust," Sales and Marketing Management. March, 69.
Frazier, Gary L. (1983), "Interorganizational Exchange
133
Behavior in Marketing Channels: A Broadened Perspective," Journal of Marketing. 47 (Fall), 68-78.
James D. Gill, and Sudhir H. Kale (1989), "Dealer Dependence Levels and Reciprocal Actions in a Channel of Distribution in a Developing Country," Journal of Marketing. 53 (January), 50-69.
and John 0. Summers (1986), "Perceptions of Interfirm Power and Its Use Within a Franchise Channel of Distribution," Journal of Marketing Research. 23 (May), 169-76.
Gaski, John F. and John R. Nevin (1985), "The Differential Effects of Exercised and Unexercised Power Sources in a Marketing Channel," Journal of Marketing Research. 22 (May), 130-42.
Govindarajan, Vijay (1986), "Decentralization, Strategy, and Effectiveness of Strategic Business Units in Multi-Business Organizations," Academy of Management Review. 11 (4), 844-56.
(1988), "A Contingency Approach to Strategy Implementation at the Business-Unit Level: Integrating Administrative Mechanisms with Strategy," Academy of Management Journal. 31 (4), 828-53.
, and Gupta (1985), "Linking Control Systems to Business Unit Strategy: Impact on Performance," Accounting. Organizations and Society. 10 (1), 51-66.
, and Joseph Fisher (1990), "Strategy, Control Systems, and Resource Sharing: Effects on Business-Unit Performance,11 Academy of Management Journal. 33 (2), 259-85.
Griesinger, Donald W. (1990), "The Human Side of Economic Organization," Academy of Management Review. 15 (3), 478-99.
Grinyer, Peter H., Masoud Yasai-Ardekani, and Shawki A1 -Bazzaz (1980), "Strategy, Structure, the Environment, and Financial Performance in 48 United Kingdom Companies," Academy of Management Journal. 23 (2), 193-220.
Gupta, Anil K. (1986), Matching Managers to Strategies: Point and Counterpoint," Human Resource Management. 25 (2), 215-34.
, and Vijay Govindarajan (1984), "Business Unit

134
Strategy, Managerial Characteristics, and Business Unit Effectiveness at Strategy Implementation," Academy of Management Journal. 27 (1), 25-41.
and (1986), "Resource Sharing Among SBUs: Strategic Antecedents and Administrative Implications," Academy of Management Journal. 29 (4), 695-714.
Hallen, Lars, Jan Johanson, and Nazeem Seyed-Mohamed (1991), "Interfirm Adaption in Business Relationships," Journal of Marketing. 55 (April), 29-37.
Heide, Jan B. and George John (1988), "The Role of Dependence Balancing in Safe Guarding Transaction-Specific Assets in Conventional Channels, Journal of Marketing. 52 (January), 20-35.
(1990), "Alliances in Industrial Purchasing: The Determinants of Joint Action in Buyer-Supplier Relationships," Journal of Marketing Research. 27 (February), 24-36.
(1992), "Do Norms Matter in Marketing Relationships?" Journal of Marketing. 56 (April), 32-44.
House, Robert J., and Gary Dessler (1974), "The Path-Goal Theory of Leadership: Some Post-Hoc and A Priori Tests in Contingency Approaches to Leadership. James G. Hunt and Lars L. Larson, eds. Carbondale, IL: Southern Illinois University Press.
Hunt, Shelby D., and John R. Nevin (1974), "Power in a Channel of Distribution: Sources and Consequences," Journal of Marketing Research. 11 (May), 186-93.
Jaeger, Alfred M. and B.R. Baliga (1985), "Control Systems and Strategic Adaptation: Lessons from the Japanese Experience," Strategic Management Journal. 6, 115-34.
Jaworski, Bernard J., and Ajay K. Kohli (1991), "Supervisory Feedback: Alternative Types and Their Impact on Salespeople's Performance and Satisfaction," Journal of Marketing Research. 28 (May), 190-201.
and S. Mark Young (1992), "Dysfunctional Behavior and Management Control: An Empirical Study of Marketing Managers," Accounting. Organizations and Society. 17 (1), 17-35.
, Vlasis Stathakopoulos, and H. Shanker Krishnan

135
(1993), "Control Combinations in Marketing: Conceptual Framework and Empirical Evidence," Journal of Marketing. 57 (January), 57-69.
Jobber, David (1986), "Improving Response Rates in Industrial Mail Surveys," Industrial Marketing Management. 15, 183-95.
John, George and Barton A. Weitz (1988), "Forward Integration into Distribution: An Empirical Test of Transaction Cost Analysis," Journal of Law. Economics, and Organization. 4 (2), 337-55.
and (1989), "Salesforce Compensation: An Empirical Investigation of Factors Related to Use of salary Versus Incentive Compensation," Journal of Marketing Research. 26 (February), 1-14.
, Allen M. Weiss, and Barton A. Weitz (1987), "An Organizational Coordination Model of Salesforce Compensation Plans: Theoretical Analysis and Empirical Test," Journal of Law. Economics, and Organization. 3 (2), 373-95.
Joskow, Paul (1988), "Asset Specificity and the Structure of Vertical Relationships: Empirical Evidence," Journal of Law. Economics and Organization. 4 (Spring), 95-117.
Kale, Sudhir H. (1986), "Dealer Perceptions of Manufacturer Power and Influence Strategies in a Developing Country," Journal of Marketing Research. 23 (November), 387-93.
Karimabady, H., and P.J. Brunn (1991), "Postal Surveys to Small Manufacturers," Industrial Marketing Management. 20, 319-26.
Keats, Barbara W., and Michael A. Hitt (1988), "A Causal Model of Linkages Among Environmental Dimensions, Macro Organizational Characteristics, and Performance," Academy of Management Journal. 31 (3), 570-98.
Kerlinger, Fred N. (1986), Foundations of Behavioral Research. 3rd ed., Fort Worth: Holt, Rinehart and Winston, Inc.
Kidder, Louise H., Charles M. Judd, and Eliot R. Smith (1986), Research Methods in Social Relations. New York: Holt, Rinehart, and Winston, Inc.
Kim, Linsu and Yooncheol Lim (1988), "Environment, Generic

136
Strategies, and Performance in a Rapidly Developing Country: A Taxonomic Approach," Academy of Management Journal. 31 (4), 802-27.
Klein, Benjamin, Robert G. Crawford, and Armen A. Alchian (1978), "Vertical Integration, Appropriable Rents, and the Competitive Process," Journal of Law and Economics. 21 (October), 297-325.
Klein, Saul, Gary L. Frazier, and Victor J. Roth (1990), "A Transaction Cost Analysis Model of Channel Integration in International Markets," Journal of Marketing Research. 27 (May), 196-208.
Koch, Peter F. (1980), "Working With Reps: Ten Ways to Insure Success," Journal of Applied Management. May/June, 22-5.
Kohli, Ajay K. (1989), "Effects of Supervisory Behavior: The Role of Individual Differences Among Salespeople," Journal of Marketing. 53 (October), 40-50.
Lawler, E.E., III (1973), Motivation in Work Organizations. Monterey California: Porter/Cole, Inc.
Levy, David T. (1985), "The Transactions Cost Approach to Vertical Integration: An Empirical Examination," The Review of Economics and Statistics. 67 (August), 438-45.
London, Sandra J. and Curt J. Dommeyer (1990), "Increasing Response to Industrial Mail Surveys," Industrial Marketing Management. 19, 235-41.
Mahajan, Jayashree, Gilbert A. Churchill, Jr., Neil M. Ford, and Orville C. Walker, Jr. (1984), "A comparison of the Impact of Organizational Climate on the Job Satisfaction of Manufacturers' Agents and Company Salespeople: An Exploratory Study," Journal of Personal Selling and Sales Management, May, 1-10.
March, J.G. and A. Simon (1958), Organizations. New York: John Wiley & Sons, Inc.
Miles, R.E., and C.C. Snow (1978), Organization Strategy. Structure. and Process. New York: McGraw-Hill Book Co.
Miller, Danny (1988), Relating Porter's Business Strategies to Environment and Structure: Analysis and Performance Implications," Academy of Management Journal. 31 (2), 280-308.
Mohr, Jakki, and John R. Nevin (1990), "Communication

137
Strategies in Marketing channels: A Theoretical Perspective," Journal of Marketing. 54 (October), 36-51.
Monteverde, Kirk and David J. Teece (1982), "Appropriable Rents and Quasi-Vertical Integration," Journal of Law & Economics. 25 (October), 321-328.
Murray, Alan I. (1988), "A Contingency View of Porter's •Generic Strategies'" Academy of Management Review, 13 (3), 390-400.
Noordewier, Thomas G., George John, and John R. Nevin (1990), "Performance Outcomes of Purchasing Arrangements in Industrial Buyer-Vendor Relationships," Journal of Marketing. 54 (October), 80-93.
Novick, Harold J. (1982), "The Case for 'Reps' vs. Direct Selling Can Reps Do it Better?" Industrial Marketing. 67 (March), 92-7.
Nunnally, Jum C. (1978), Psychometric Theory. 2nd ed., New York: McGraw-Hill Publishing Co.
Ofir, Chezy and Andre Khuri (1986), "Multicollinearity in Marketing Models: Diagnostics and Remedial Measures," International Journal of Research in Marketing. 3, 181-205.
Ouchi, William G. (1977), "The Relationship Between Organizational Structure and Organizational Control," Administrative Science Quarterly. 22 (March), 95-113.
(1979), "A Conceptual Framework for the Design of Organizational Control Mechanisms," Management Science. 25 (9), 833-48.
(1980), "Markets, Bureaucracies, and Clans," Administrative Science Quarterly. 25 (March), 129-41.
and Mary Ann Maguire (1975), "Organizational Control: Two Functions," Administrative Science Quarterly. 20 (December), 559-69.
Peter, John J. and Gilbert A. Churchill, Jr. (1986), "Relationships Among Research Design Choices and Psychometric Properties of rating Scales: A Meta-Analysis," Journal of Marketing Research. 23 (February), 1-10.
Pfeffer, Jeffrey (1976), "Beyond Management and the Worker: The Institutional Function of Management," Academy of Management Review. April, 36-46.

138
Porter, Michael E. (1980), "Competitive Strategy: Techniques for Analyzing Industries and Competitors." New York: Free Press.
(1985), "Competitive Advantage." New York: Free Press.
Snell, Scott A. (1992), "Control Theory in Strategic Human Resource Management: The Mediating Effect of Administrative Information," Academy of Management Journal. 35 (2), 292-327.
Tanner, John F. Jr. and Stephen B. Castleberry (1990), "Vertical Exchange Quality and Performance: Studying the Role of the Sales Manager," Journal of Personal Selling and Sales Management. 10 (Spring), 17-27.
Teas, R. Kenneth (1981), "A Test of a Model of Department Store Salespeople's Job Satisfaction," Journal of Retailing. 57 (1), 3-25.
(1983), "Supervisory Behavior, Role Stress, and the Job Satisfaction of Industrial Salespeople," Journal of Marketing Research. 20 (February), 84-91.
, and James C. McElroy (1986), "Causal Attributions and Expectancy Estimates: A Framework for Understanding the Dynamics of Salesforce Motivation," Journal of Marketing. 50 (January), 75-86.
Thompson, James D. (1967), Organizations in Action. New York: McGraw-Hill Book Company.
Turcotte, William E. (1974), "Control Systems, Performance, and Satisfaction in Two State Agencies," Administrative Sciences Quarterly. 60-73.
Tyagi, Pradeep K. (1985a), "Relative Importance of Key Job Dimensions and Leadership Behaviors in Motivating Salesperson Work Performance," Journal of Marketing. 49 (Summer), 76-86.
(1985b), "Organizational Climate, Inequities, and Attractiveness of Salesperson Rewards," Journal of Personal Selling and Sales Management. November, 31-7.
Vroom, V.H. (1964), Work and Motivation. New York: John Wiley and Sons, Inc.
Walker, Orville C. Jr., Gilbert A. Churchill Jr., and Neil

139
M. Ford (1977), "Motivation and Performance in Industrial Selling: Present Knowledge and Needed Research," Journal of Marketing Research. 14 (May), 156-68.
Walker, Bruce J., Wayne Kirchmann, and Jeffrey S. Conant (1987), "A Method to Improve Response to Industrial Mail Surveys," Industrial Marketing Management. 16, 305-14.
Webster (1972), The New American Dictionary, eds. Albert and Loy Morehead, Chicago: New American Library, Times Mirror.
Weitz, Barton A. (1981), "Effectiveness in Sales Interactions: A Contingency Framework," Journal of Marketing. 45 (Winter), 85-103.
White, Roderick E., and Richard G. Hamermesh (1981), "Toward a Model of Business Unit Performance: An Integrative Approach," Academy of Management Review. 6 (2), 213-23.
Williamson, Oliver E. (1975), Markets and Hierarchies: Analysis and Antitrust Implications. New York, NY: The Free Press.
(1981), "The Modern Corporation: Origins, Evolution, Attributes," Journal of Economic Literature. 19 (December), 1537-68.
(1983), "Credible Commitments: Using Hostages to Support Exchange," American Economic Review. 73 (September), 519-540.
(1985), The Economic Institutions of Capitalism: Firms. Markets. Relational Contracting. New York: The Free Press.
Young, Louise C. and Ian F. Wilkinson (1989), "The Role of Trust and Co-operation in Marketing Channels: A Preliminary Study," European Journal of Marketing. 23 (2), 109-22.
CHAPTER IV
RESULTS
This chapter is divided into two sections. The first
section contains information about the response rate for the
sample and an analysis of the response pattern. The second
section evaluates the hypotheses in accordance with chapter
III. The chapter concludes with a summary of the
statistical results.
The Response Pattern Analysis
A total of 3732 letters were sent out to representative
association members explaining the purpose of the survey and
asking for their participation. This mail-out represented
around 12.4% of all rep firms in the United states based
upon DuBois and Grace's (1987) estimate (30,000) of the
total number of independent industrial sales agencies in the
United States. Those agreeing to participate in the survey
sent back a signed postcard. Self-selection was used
because it was felt that greater control could be exercised.
Additionally, there was some question about the soundness of
the mail lists that were provided by the Manufacturers
Representatives Educational Research Foundation (MRERF).
This concern proved to be valid. Of the twenty-six
associations that were supposedly included in the lists,
140

141
only nine associations had a greater than one-percent
response rate. Further, of the nine, three provided more
than 90% of the entire return. Subsequent investigation as
to the cause for the poor response from many of the
associations, indicated that many reps failed to appreciate
the value or usefullness of the survey to them. This
occurred even for those requests which were placed in the
monthly newsletter from their rep association (i.e., roughly
one half of all associations surveyed).
The response rate for the survey was seventy-one
percent for those firms or individual reps (516 total) who
agreed to participate in the survey by returning the initial
participation postcard. The adjusted response rate for the
total mailing was 28% (1032 good returns/3732 total mail-
out) . This response is somewhat misleading because of
multiple returns from firms (the firms were asked to have
each rep employed individually fill out and return a
questionnaire).
An analysis of response patterns was conducted to
determine if the survey results needed to be adjusted for
nonresponse bias. During the fifteen weeks of the survey,
records were kept of the daily responses. Manova was used
to compare the first-half of the returns to the second-half.
No significant difference was found at the .142 level using
Hotellings T. Thus, there appeared to be no difference

142
between the early respondents and the late respondents, and
also between the respondents and the non-respondents.
Another concern was the comparability of the returns
from those firms which agreed to participate (672) versus
those firms which responded without the postcard (357).
Manova was used to compare the responses. A significant
difference was found at the .002 level using Hotellings T.
This was determined to be the result of demographic
differences in the returns. When demographics were run as a
covariate in a Manova which compared the group's responses,
no significant differences were found.
Demographic Analysis of Respondents
Standard demographic measures were included in the
survey in order to characterize the sample. The measures
included: (1) qualification questions such as whether the
respondent was employed by, or the owner of, a multi-line
manufacturers rep agency, the respondent's primary area of
responsibility (i.e., inside sales, outside sales territory
mgmt., other), and whether the respondent had answered this
survey previously; (2) demographics relating to the
respondent's agency such as its age, size, and industry; (3)
demographics of the respondent such as his/her position and
title, education, and training; (4) and miscellaneous
demographics such as the geographic distribution of returns
and the timing of the returns.

143
Approximately twenty-two percent, of those who
responded to the survey, were either owners or partners in
the rep agency while another 44.1 percent were presidents or
vice-presidents. Almost all respondents were highly
experienced in sales (average overall sales experience of
21.6 years, 14.2 years as a rep) and well educated (54.8%
have a bachelors or better college degree, 36.5% have some
form of special training). Most were male (92.5%). The
respondent's agencies were, on average, well established (21
years in business, $12.9 million in sales), employed an
average 5.6 outside salespeople and 3.6 inside salespeople,
represented 13.9 principals and 18.3 product lines, and
primarily sold electronic, electrical, or power transmission
products (54.5%, 13.6%, 6.9% respectively). Most sales were
conducted within the United States (79.2%).
The survey responses were fairly evenly distributed
across the United States with a little higher return from
the west and southwest states.
The majority of the returns occurred in the first 4.5
weeks of the survey (58.4%). The survey lasted 15 weeks.
Table 4.1 illustrates the overall demographic findings
for the study. Table 4.2 contrasts the study demographics
with the findings from the Sibley and Teas (1979) study for
comparison purposes. Sibley and Teas surveyed five state
associations of manufacturers* agents in 1977 and 1978. To

144
TABLE 4.1 SUMMARY OF DEMOGRAPHIC FINDINGS
Measure Survey Average
Qualification Item: 1. Employed by (or owner of) a multi-line Yes: 97.6%
manufacturers' rep agency... No: 2.4% 2. Primary area of responsibility... Inside Sales: 3.6%
Outside Sales: 47.7% Territory/Agcy Mgmt: 47.7%
Other: 1.0% 3. Answered questionnaire before... <*) Yes: 0
No: 1032
(*) All who answered yes were dropped
Agency Demographics: 1. Length of time in business... : 21.0 years 2. Total annual sales dollars... : $12.9 million 3. Number of reps in agency... Outside: 5.6
Inside: 3.6 4. Number of principals... : 13.9 5. Length of agency's relationship with this principal... Most Important: 13.4 years
Least Important: 4.5 years 6. Number of product lines represented... : 18.3 lines 7. Industry... Electronics: 54.5%
Electrical: 13.6% Power Trans.: 6.9%
8. Sell outside United States... Yes: 20.6% No: 79.2%
Respondent Demographics: 1. Position and Title... Owner/Partner: 21.2%
President: 35.6% Vice President: 8.5%
Sales/Account Mgr.: 2.9% App/Sales Eng.: 7.9%
Inside/Field Sales: 18.3% Other: 5.6%
2. Overall sales experience... : 21.6 years 3. Rep sales experience... : 14.2 years 4. Degree... Associates: 5.4%
Bachelors: 46.0% Masters: 8.7%
PhD: 0.1% 5. Special training... : 36.5% 6. Gender... Male: 92.5%
Female: 7.5%
Misc. Demographics: 1. Geographic distribution of responses... MA, RI, VT, CT, NY: 10.8%
PA, MD, VA, NC, GA: 13.2% FL, AL, TN, MS, ICY: 4.1% OH, IN, MI, IA, UI: 14.7% MN, MT, IL, MO, ICS: 15.2% NE, LA, OK, TX, CO: 19.8% ID, UT, AZ, NM, CA: 17.6%
HI, OR, UA, AK: 4.6% 2. Timing of responses.. First 2.5 weeks: 35.8%
Second 2 weeks: 22.6% Third 2 weeks: 21.4% Fourth 2 weeks: 8.0% Fifth 2 weeks: 7.2%
Last 4.5 weeks: 5.0%
Note: ns1032
145
aid interpretation, roost of the demographics are reported
for the total of those responding and for the lower 90
percentile [approximately] level to reduce [and document]
the influence of non-normal distributions and outliers on
the averages.
Certain of the numbers (e.g., sales dollars, and the
number of principals) seem to have increased over the years
(i.e., $2.9 million vs. $12.9 million, or +345%, and 6.1 vs.
13.8, or +126%). The 1978 dollars are stated without
adjustment and in 1993 dollars, based on the Producer Price
Index, to aid comparison. The average number of salespeople
has correspondingly increased from a total of 2.4 to a total
of 9.5 [5.6 outside sales, 3.9 inside sales], or +283%. The
number of rep agencies has also increased from 23,000 in
1972, as reported by Sibley and Teas (1979), to 30,000 based
on DuBois and Grace (1987), or an increase of 30.4%.
Interestingly, while the number of sales dollars
generated per salesperson has apparently risen [$1.21
million vs. $1.40 million], if these numbers were stated in
1993 dollars for the sales generated per salesperson, they
would have dropped from $2.2 million to $1.40 million.
To summarize, these findings seem to agree with the
literature which indicates that, since the 1970s, reps have
increasingly become a preferred choice for industrial
selling (cf., Hitchcock 1984; O'Connell and Keenan 1990;
Taylor 1981, 1990).

146
TABLE 4.2 DEMOGRAPHIC PROFILE OF STUDY
Aspect Sibley and Teas (1979) Study (*)
Present Study Percent Change
Comments
Education College Grad (43%)
Compared to:
Avg. Hale Grads. 25 and over in U.S. in 1979 (20.4%) ***
College Grad(54.8%)
Compared to:
Avg. Male Grads. 25 arid over in U.S. in 1993 (24.8%) ***
+11.8%
+4.4%
Compares the educational attainment of those answering the survey in 1978 versus 1993 for the male U.S. population as a whole (92.5% of respondents in survey).
Gender of Respondents
Not Reported 92.5% male 7.5% female
Years Selling
19.9 years 21.6 years (overall)
19.6% (92% of returns)
+8.5% A reduced percentage of returns is shown to indicate the effect of outliers on the reported numbers.
Years as a Rep
14.0 years 14.2 years 12.1 years (90% of
returns)
+1.4%
-13.6%
Average Number of Principals
6.1 13.8 (overall) 11.7 (90% of
returns)
+126%
+91.8%
Agency's Average Total Sales Dollars
$2.9 million (1978 $) **
$5.2 million (1993 $) ***
$12.9 million (overall)
$2.6 million (lowest 92% of returns)
+345% overall (1978 $)
+148% overall (1993 $)
-10.3%
1978 dollars are converted into 1993 dollars using the Producer Price Index to aid comparison. ***
Based on 1978 $ and 92% of returns of current survey.
Average Number of Salespeople in Agency
2.4 total salespeople
5.6 outside-sales 3.9 (90% of
returns)
3.6 inside-sales 2.3 (91% of
returns)
+283% overall
+158% (91% of returns)
Calculated $ Sales Per Salesperson
$2.9/2.4= $1.21 million (1978 $)
$2.2 million (1993 $) ***
$12.9/9.2(5.6+3.6)= $1.40 million
$2.6/6.2= $0.42 million (90-92% of returns)
+15.7%
-65.3% Based on 1978 $ and 90-92% of returns of current survey.
Number of Industrial Agencies reported in Studies
23,000 in 1972 30,000 (DuBois and Grace 1987) ****
50,000 (Taylor 1990)
+30.4%
+117%
Shows overall growth in the number of industrial rep agencies from 1972 to the present.
respectively. Calculated number based on the reported average total commission ($215,134) divided by average commission rate of 7.4 percent. Adjustment based on 1980 & 1994 Statistical Abstracts of the U.S. 102nd & 112th editions respectively. U.S. Dept. of Commerce, Bureau of the Census. The estimates for the number of industrial agencies vary widely in the literature so both numbers are given.

147
Hypotheses Testing
Two separate analyses were performed on the data using
top-down hierarchical multiple linear regression. In the
course of evaluating the survey responses, a paired t-test
had indicated that a significant difference existed between
the responses for the most versus least important principals
for all variables thus requiring a separate analysis for
each.
All variables were in the mean deviation form to reduce
any possible multicollinearity due to differences in the
mean of each variable. The independent variables were
entered or removed from the model in sets [one set per
independent construct]. The dependent variables were
summated to facilitate the multiple regression procedure
which requires a single variable for the analysis.
Summation was accomplished by simply adding the values of
all of the variables making up the dependent construct into
a single sum. This sum was then converted into the mean
deviation form by subtracting the overall (grand) mean of
the variable for all respondents from the value of the
variable for an individual respondent. Three dependent
measures were used: (1) performance-behaviors — the
tangible measure of the rep's behaviors; (2) performance-
satisfaction — the intangible measure of the rep's
attitudes; and (3) overall-performance (i.e., performance
behaviors and satisfaction combined). Initially, all

148
variables were entered into the model and then selectively
removed. If the change in R2 was significant the variable
would be re-entered in the next step of the analysis.
Significance was indicated if F was .05 or less.
Each variable was also evaluated independently as to
its ability to explain the variance in the dependent
variable without the influence of the other variables. This
was accomplished starting with an empty model (no
independent variables) and then entering the variable of
interest into the model and evaluating its contribution to
R2. In this circumstance, the R2 change is equal to the
overall R2.
Initially, the order in which the variables were
evaluated was arbitrary. A subsequent run entered the
variables in the reverse order to determine if an order bias
existed. No order bias was observed.
The following are the results of the multiple linear
regression analysis for the most-important-principal. Five
constructs were evaluated along with three demographic
variables. The constructs were: nature-of-the-product,
existence-of-specific assets, importance-of-the-
relationship, interorganizational-climate, and selling-task-
characteristics. The demographic variables were:
experience, longevity, and size. The explained variance was
significant at the .05 level of significance for the nature-
of-the-product when evaluated by itself for both

149
performance-behaviors and overall-performance, but failed to
be significant when evaluated with all variables in the
model (significance of the change in R2 for removing the
variable is .1107, .1612, and .1807 for each dependent
evaluated respectively). Existence-of-specific-assets
explained a significant amount of the variance of each
dependent variable when evaluated by itself (at the .05 sig.
of F level), but failed to be significant in the full model
for performance-satisfaction (sig. of F for R2 change is
.1744). Importance-of-the-relationship explained a
significant amount of the variance of each dependent
variable when evaluated by itself, but failed to be
significant in the full model for performance-behaviors
(sig. of F for R2 change is .0981). Interorganizational-
climate explained a significant amount of the variance of
each dependent variable when evaluated by itself, and in the
full model. Selling-task-characteristics explained a
significant amount of the variance of each dependent
variable when evaluated by itself, but failed to be
significant in the full model for performance-satisfaction
(sig. of F for R2 change is .0608). Experience failed to
explain a significant amount of the variance of any
dependent variable when evaluated by itself, and when
evaluated with the full model. Longevity failed to explain
a significant amount of the variance of any dependent
variable when evaluated by itself, but did explain a

150
significant amount of the variance of the dependent
variables when evaluated in the full model. Size explained
a significant amount of the variance of performance-
behaviors and overall-performance when evaluated by itself,
but failed to be a significant predictor when evaluated with
the full model.
The overall models produced by the hierarchical
regression procedure had adjusted R2ls of .29024, .49444,
and .37505 for performance-behaviors, performance-
satisfaction, and overall-performance respectively, and were
all significant. The variance-inflation-factors (VIF) were
less than 10 for all variables indicating low
multicollinearity. The Durban-Watson statistic was around
two for all models indicating low autocorrelation among
residuals (an assumption for the regression procedure).
The adjusted R2 was used because of the high number of
variables evaluated (each construct was composed of three or
more measures).
The overall-performance model produced by the multiple
regression procedure included: existence-of-specific-assets,
importance-of-the-relationship, interorganizational-climate,
selling-task-characteristics, and longevity. This model was
used to evaluate the study hypotheses. Table 4.3 documents
the results of the most-important-principal analysis.
The results were somewhat different for the regression
procedure used with the least-important-principal. Nature-

TABLE 4.3
151
Constructs Performance Measure
R2 Change
if Removed
From Model
Sig. of F Change If Removed
R2 Change of
Variable
by Itself
Nature-of-the-Product (X,)
Behaviors Satisfaction Both Combined <Y)
-.1709
-.01017 -.01274
.1107
.1612
.1807
.03173 sig.=.0435
.02571 sig.=.0974
.03130 sig.=.0474
Ex i stence-of-Spec i f i c -Assets ( X 2 )
Behaviors
Satisfaction
Both Combined (Y)
-.06903
-.00998
-.05960
.0000
.1744
.0000
.18890 sig.=.0000
.12056 sig.=.0000
.22145 sig.=.0000
Importance-of-the-Relationship (X3)
Behaviors Satisfaction Both Combined <Y)
-.03100 -.06804 -.03677
.0981
.0000
.0185
.19530 sig.=.0000
.32377 sig.=.0000
.27291 sig.=.0000
Interorganizat i ona i-Climate (X4)
Behaviors Satisfaction Both Combined (Y)
-.04101 -.17027 -.05213
.0323
.0000
.0016
.16700 sig.=.0000
.42747 sig.=.0000
.24630 sig.=.0000
Selling-Task-
Characteristies (X5) Behaviors Satisfaction Both Combined (Y)
-.04942 -.02238 -.04480
.0046
.0608
.0036
.08045 sig.=.0010
.07383 sig.=.0018
.08476 sig.=.0006
Demographic Variables
Experience (X6):
v301# v316# v318 Behaviors Satisfaction Both Combined (Y)
-.00332 -.00539 -.00480
.6292
.2441
.4163
.00424 sig.=.6797
.00743 sig.=.4367
.00573 sig.=.5661
Longevity (X7):
v330, v332, v334 Behaviors Satisfaction Both Combined (Y)
-.02034 -.01384 -.01863
.0147
.0142
.0123
.02038 sig.=.0624
.00055 sig.=.9771
.01615 sig.=.1241
Size (X8):
v303, v308, v311
Behaviors Satisfaction Both Combined (Y)
-.00638 -.00315 -.00614
.3425
.4871
.3033
.03322 sig.=.0074
.01930 sig.=.0658
.03100 sig.=.0110
Overall for Models Behaviors Adj. R2 = .29024
VIF's = 1.3-3.1
Durban-Watson
= 1.946
F = 4.9006
sig. = .0000
Combined Model:
Y=X2, X3# X4, X5, X7
(main Effects)
Satisfaction
Both Combined (Y)
Adj. R2 = .49444
VIF's = 1.2-2.8
Durban-Watson
= 1.8654 F = 16.852
sig. = .0000
Adj. R2 = .37505
VIF's = 1.2-3.1
Durban-Watson = 1.9468
F = 6.708 sig. = .0000

152
of-the-product failed to explain a significant amount of
variance in the dependent variable when evaluated by itself,
or when evaluated with all variables in the model.
Existence-of-specific-assets explained a significant amount
of the variance of each dependent variable when evaluated by
itself (at the .05 sig. level), and explained a significant
amount of variation of performance-behaviors and overall-
performance in the full model (sig. of F for R2 change is
.0005 and .0000 respectively)(note: the analysis procedure
only reports significance levels to 4 digits so the last
digit may be inaccurate). Importance-of-the-relationship
explained a significant amount of the variance of each
dependent variable when evaluated by itself, but was only
significant for performance-behaviors and overall-
performance in the full model (sig. of F for R2 change is
.0069 and .0064 respectively). Interorganizational-climate
explained a significant amount of the variance of each
dependent variable when evaluated by itself, and in the full
model. Selling-task-characteristics failed to explain a
significant amount of the variance of any dependent variable
when evaluated by itself, or in the full model. Experience
failed to explain a significant amount of the variance of
any dependent variable when evaluated by itself, or when
evaluated with the full model. Longevity explained a
significant amount of variance of performance-satisfaction
when evaluated by itself, and when evaluated in the full

153
model. All other assessments were insignificant. Size
failed to explain a significant amount of the variance in
any dependent variable when evaluated by itself, or when
evaluated with the full model.
The overall models produced by the hierarchical
regression procedure had adjusted R2,s of .24622, .30263,
and .32724 for performance-behaviors, performance-
satisfaction, and overall-performance respectively, and were
all significant. The variance-inflation-factors (VIF) were
less than 10 for all variables indicating low
multicollinearity. The Durban-Watson statistic was around
two for all models indicating low autocorrelation among
residuals (an assumption for the regression procedure).
The adjusted R2 was used because of the high number of
variables evaluated (each construct was composed of three or
more measures).
The overall performance model produced by the multiple
regression procedure included: existence-of-specific-assets,
importance-of-the-relationship, and interorganizational-
climate. This model was used to evaluate the study
hypotheses (see Table 4.4).
Testing the Assumptions
Kvanli, Guynes, and Pavur (1989) list three assumptions
which must be met when using a multiple linear model: (1)
the errors are normally distributed with a mean of zero — a

154
TABLE 4.4 REGRESSION RESULTS; Least-Important-Principal
Constructs Performance Measure
R Change If Removed From Model
Sig. of F Change If Removed
R Change of Variable by Itself
Nature-of-the-Product (X,)
Behavi ors Satisfaction Both Combined (Y)
.01858
.00396
.01291
.1341
.8497
.2631
.02340
.00648
.01823
sig. sig. sig.
.1635
.8161
.3039
Ex i stence-of-Spec ific-Assets (X2)
Behaviors Satisfaction Both Combined (Y)
.05618
.01804
.06570
.0005
.1635
.0000
.12395
.11412
.16285
sig. sig. sig.
.0000
.0000
.0000
Importance-of-the-Relationship (X3)
Behaviors Satisfaction Both Combined (Y)
.07002
.04140
.06406
.0069
.1082
.0064
.16742
.21467
.21780
sig. sig sig.
.0000
.0000
.0000
Interorganizat i ona t-Climate (X4)
Behaviors Satisfaction Both Combined (Y)
.07543
.12545
.09144
.0004
.0000
.0000
.17930
.30176
.24593
sig. sig. sig.
.0000
.0000
.0000
Selling-Task-Characteristics (X5)
Behaviors Satisfaction Both Combined (Y)
.01812
.01183
.01736
.6051
.8240
.5605
.03442
.02828
.03722
sig. sig. sig.
.3211
.4598
.2638
Demographic Variables
Experience (X6):
v301, v316, v318 Behaviors Satisfaction Both Combined (Y)
.01404
.00487
.01408
.0980
.4805
.0722
.02330 sig.s.0489
.01012 sig.=.3203
.02176 sig.-.0650
Longevity (X7): v8, v330, v332, v334
Behaviors Satisfaction Both Combined (Y)
.00993
.02485
.01042
.3530
.0137
.2755
.00992 sig.=.5060
.03493 sig.=.0157
.01213 sig.=.4054
Size (X8):
v303, v308, v311 Behaviors Satisfaction Both Combined (Y)
.00858
.00103
.00723
.2815
.9131
.3125
.00680 sig.=.5172
.00158 sig.=.9092
.00407 sig.=.7201
Overall for Models
Combined Model:
Y=X2# X3f X4
(main effects model)
Behaviors
Satisfaction
Both Combined (Y)
Adj. R2 = .24622 VIF's = 1.3-2.5 Durban-Watson
= 1.90053 F = 4.65849
sig. = .0000
Adj. R2 = .30263 VIF's = 1.3-2.0
Durban-Watson = 1.93913
F = 11.756 sig. = .0000
Adj. Ra = .32724 VIF's = 1.3-2.5
Durban-Watson = 1.92370
F = 6.3667 sig. = .0000

155
histogram of the sample residuals may be used, the
distribution should be relatively normal; (2) the variance
of the errors remains constant — a scatterplot of the
sample residuals can be plotted against the predicted
values, no pattern should exist; and (3) the errors are
independent — the Durbin-Watson statistic may be used to
demonstrate that no autocorrelation among residuals exists,
a value of 2 indicates that little or no autocorrelation
exists and the errors are independent.
Norusis (1988) notes that additional information about
the normality of the distribution of residuals may be
obtained by plotting the standardized expected values of the
residuals against the observed values. If the two
distributions are equal a straight line results.
Figure 4.1 indicates that the distribution is basically
normal, with a standard deviation of 1.04 and a mean of
zero, for the
regression standardized
residual of the
over a 11-per f ormance
dependent variable
evaluation for the
least-important-
principal. Figure 4.2
confirms the apparent
Histogram: Overall Performance Least Important Principal
Std. Dev » 1 W Mean- .09 N« 823.00
Regression Standardized Residual
FIGURE 4.1
normality. The line is basically straight in accordance

156
with the normality of the residuals requirement for multiple
regression as per Kvanli, Guynes, and Pavur (1989). Figure
4.2 plots the expected cumulative probabilities versus
observed cumulative
Norm. Prob. Plot Stand. Resit
Overall Performance
s i a ) 1 n
Least Important Principal
s i a ) 1 n LL.
E -re
2 -0)
LL.
E -re
2 -0) U „ CL) 2 5 <
m oxio.
0.00 25 .50 .75 1.00
Observed Cum Prob
FIGURE 4.2
probabilities of the
standardized residuals
produced when
evaluating overall-
performance for the
least- important-
principal. Figure 4.3
is a scatterplot of
the regression residuals versus the regression predicted
values produced when evaluating overall performance for the
least- important-principal. No pattern seems to exist thus
confirming that the
§ 60
I « 1 -o 8 0 8? u> -20 a>
££ -40
Scatterplot: Overall Performance Least Important Principal
-30 -20 -10 0
Regression Predicted Value
FIGURE 4.3
variance of the errors
remains constant in
accordance with the
requirements for
multiple regression.
All of the plots
shown are for overall-
performance for the least-important- principal. The
remaining plots can be found in Appendix D. There appear

157
to be no problems with any of the assumptions for the
multiple regressions.
Overa11-Contro1-Porm
This research proposed that the individual factors
which describe a manufacturer/rep relationship form a
pattern of influence known as control which affects
performance. This pattern can be most clearly seen by
examining the means of each measure used to assess the study
constructs for the least-important-principal and the most-
important-principal. These two relationships tend to differ
widely on many factors. Most-important relationships are
differentiated from least-important relationships by the
amount of commissions they paid to the rep agency.
Table 4.5 documents the differences between the
responses for the least-important-principal versus the
responses for the most-important-principal, and gives the
managerial summation of the form of control employed.
For two constructs (i.e., nature-of-the-product, and
selling-task-characteristics), the survey respondents were
not asked to differentiate between the least-important-
principal versus the most-important-principal so the means
do not differ. Additionally, some of the measures for the
constructs shown were dropped in later analyses due to poor
explanatory power but contribute substantial information so
are included in this analysis. The variables included are
listed in Appendices A.1-A.6.

158
TABLE 4.5 COMPARISON OF THE CONTROL FORM OF EACH
CONSTRUCT VS. THE TYPE OF PRINCIPAL
Construct Least-Important-Principal (Mean)
Most-Important-Principal (Mean)
Nature-of-the-Product: Product Complexity... Technical Level... Sophistication... Commodi ty/Customi zat i on... Price...
4.7 5.1 4.9 4.5 4.5
4.7 5.1 4.9 4.5 4.5
Grand Mean; Control Form;
; 4.7 ; Behavior
Grand Mean: Control Form;
: 4.7 : Behavior
Exi stence-of-SDeci f i c-Assets: Problems redeploying assets... Degree of training supplied... Investment in facilities... Investment in people... Difficulty recouping... Training programs...
1.9 2.8 2.2 2.1 2.5 2.1
; 4.8 : 4.9 : 4.6 : 4.6 ; 4.9 : 4.4
Grand Mean: 2.27 Control Form: Output
Grand Mean: 4.7 Control Form: Behavior
Imoortance-of-the-Relationshio: Mutual Communications (4 measures)... Mutual Participation (6 measures)... Resource Sharing (4 measures)...
3.3 3.1 3.3
5.1 5.0 4.8
Grand Mean: 3.2 Control Form: Output
Grand Mean: 5.0 Control Form: Behavior
Interoraani zat i onaI -CIi mate: GoaIs-and-expectations (2 measures)... Trust (2 measures)... Consideration/Goodwill (6 measures)... Future-potent i aI-of-the-
relationship (9 measures)...
3.8 5.2 4.4
: 4.4
5.6 5.9 5.4
: 5.0
Grand Mean: 4.4 Control Form: Indeterm.
Grand Mean: 5.5 Control Form: Behavior
Selling-Task-Characteristics: Outcome-Uncertainty (7 measures)... Task-Programmability (2 measures)... Output-Measurability (6 measures)... Behavior-Measurability (2 measures)...
4.2 5.3 5.1 4.9
4.2 5.3 5.1 4.9
Grand Mean: 4.9 Control Form: Behavior
Grand Mean: 4.9 Control Form: Behavior
Performance: Behaviors (11 measures)... Satisfaction (3 measures)...
: 4.5 : 4.2
: 5.9 : 6.3
Grand Mean: 4.4 Control Form: Indeterm.
Grand Mean: Control Form
: 6.1 : Behavior

159
The significance of the influence of the overall form
of control exercised within the manufacturer/rep
relationship for all aspects of performance was evaluated as
follows. The values of all variables which formed
individual scales were added together and then categorized
into three groups: (1) output-based control — values of 1-
3.5 based on a 1-7 scale; (2) behavior-based control —
values of 4.5-7; and (3) indeterminate control —values of
greater than 3.5 and less than 4.5. Manova was then used to
determine if performance varied based on control form. The
independent variable was control form. The dependent
measures were sets of variables which assessed the three
aspects of performance: behaviors, satisfaction, and
overall-performance. As predicted, significant variation
was found using Hotellings t (reject H0 if sig. of F is .05
or lower). Behavior-based control was clearly the preferred
form of overall control used with the most-important-
principal. The overall-control-form for the least-
important-principal was indeterminate.
The same basic procedure used to determine the overall-
control-form was also applied to each construct individually
to classify the individual control form.
For the most-important-principal, nature-of-the-product
was classified as using behavior-based control because the
mean of the summated scale average was greater than 4.5. As
predicted, control form produced a significant variation in

160
both performance-behaviors and overall-performance (sig. of
F for Hotellings T was .000 and .004 (analysis procedure
rounded the significance level to the nearest 3 digits)
respectively thus indicating that performance varied as
control form varied). Control form failed to be a
significant predictor of performance-satisfaction (sig. of F
was .598). Existence-of-specific-assets was classified as
using behavior-based control (mean was 4.70), and produced a
significant variation in all performance measures (sig. of F
was .0000 for all measures). Interorganizational-climate
was classified as using behavior-based control (mean was
5.51), and produced a significant variation in all
performance measures (sig. of F was .0000 for all measures).
Importance-of-the-relationship was classified as using
behavior-based control (mean was 4.84), and produced a
significant variation in all performance measures (sig. of F
was .0000 for all measures). Selling-task-characteristics
was classified as using output-based control (mean was
2.31), and failed to produce a significant variation in any
performance measure (sig. of F was .801, .272, and .773 for
performance-behaviors, performance-satisfaction, and
overall- performance respectively). Finally, the overall-
control-form was classified as using behavior-based control
(mean was 4.96), and produced a significant variation in all
performance measures (sig. of F was .0000 for all measures).

161
For the least-important-principal, nature-of-the-
product was classified as using behavior-based control (the
mean was 4.75), and failed to produce a significant
variation in any performance measure (sig. of F for
Hotellings T was .144, .601, and .193 respectively thus
indicating that performance did not vary as control form
varied). Existence-of-specific-assets was classified as
using output-based control (mean was 2.26), and produced a
significant variation in all performance measures (sig. of F
was .0000 for all measures). Interorganizational-climate
was classified as using an indeterminate control form (mean
was 4.44), and produced a significant variation in all
performance measures (sig. of F was .0000 for all measures).
Importance-of-the-relationship was classified as using
output-based control (mean was 3.26), and produced a
significant variation in all performance measures (sig. of F
was .0000 for all measures). Selling-task-characteristics
was classified as using behavior-based control (mean was
4.67), and failed to produce a significant variation in any
performance measure (sig. of F was .590, .497, and .593 for
performance-behaviors, performance-satisfaction, and
overall- performance respectively). Finally, the overall-
control-form was classified as using an indeterminate form
of control (mean was 3.87) and produced a significant
variation in all performance measures (sig. of F was .002,
.000, and .000 for each performance measure respectively).

162
A summation of this analysis appears in Table 4.6 and
Table 4.7. Table 4.6 is for the most-important-principal
while Table 4.7 is for the least-important-principal.
TABLE 4.6 OVERALL CONTROL PROFILE
Constructs Construct Sinmated Scale Average: Mean Std. Dev.
Control form
1-3.5 Output-Based 4.5-7 Behavior-Based
Performance Measure
Control vs. Performance Sig. of F Hotellings
Nature-of-the-Product
4.75 1.12 Behavior-Based Behaviors: Satisfaction: Overa11:
.000
.598
.004
Existence-of-Specific-Assets
4.70 1.28 Behavior-Based Behaviors: Satisfaction: Overall:
.000
.000
.000
Interorgani zat i onaI -Climate
5.51 0.91 Behavior-Based Behaviors: Satisfaction: Overall:
.000
.000
.000
Importance-of-Relationship
4.84 1.01 Behavior-Based Behaviors: Satisfaction: Overall:
.000
.000
.000
Selling-Task-Characteristics
2.31 0.51 Output-Based Behaviors: Satisfaction: Overall:
.801
.272
.773
OveraU-Control-Form
4.96 0.60 Behavior-Based Behaviors: Satisfaction: Overall:
.000
.000
.000
Conclusion
Tables 4.8 and 4.9 summarize the results from the
hypotheses tests based on the multiple regression analyses
except for H9A and H9 2 which are based on the control form
analyses. The results agree in large part with the control
form analysis. Table 4.8 gives the results for the most-
important-principal analysis (hypotheses HU1 thru H9>1) while
Table 4.9 gives the results for the least-important-
principal (hypotheses H, 2 thru H9 2) .
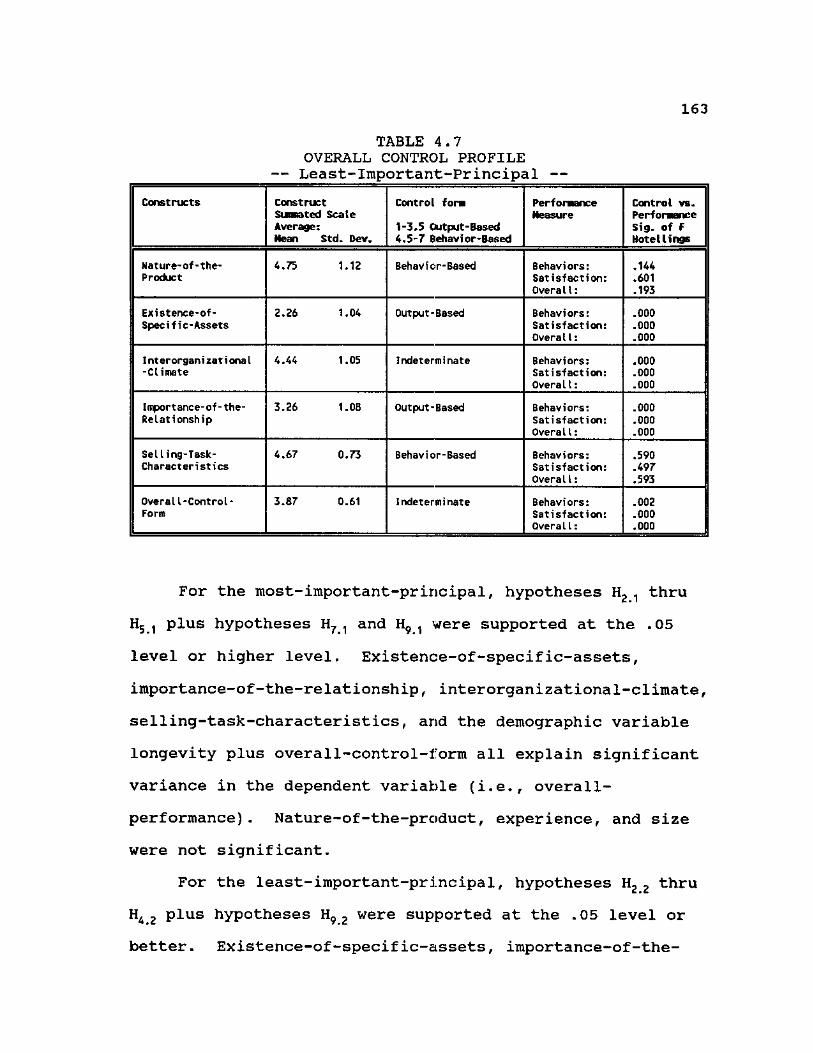
163
TABLE 4.7 OVERALL CONTROL PROFILE
— Least-Important-Principal —
Constructs Construct Suranated Scale Average: Mean Std. Dev.
Control form
1-3.5 Output-Based 4.5-7 Behavior-Based
Performance Measure
Control vs. Performance Sig. of F Hotellings
Mature-of-the-Product
4.75 1.12 Behavior-Based Behaviors: Satisfaction: Overall:
.144
.601
.193
Existence-of-Specific-Assets
2.26 1.04 Output-Based Behaviors: Satisfaction: Overall:
.000
.000
.000
Interorganizat ionaI -Climate
4.44 1.05 Indeterminate Behaviors: Satisfaction: Overall:
.000
.000
.000
Importance-of-the-Relationship
3.26 1.08 Output-Based Behaviors: Satisfaction: Overall:
.000
.000
.000
Selling-Task-Characteristics
4.67 0.73 Behavior-Based Behaviors: Satisfaction: Overall:
.590
.497
.593
OveralI-Control-Form
3.87 0.61 Indeterminate Behaviors: Satisfaction: Overall:
.002
.000
.000
For the most-important-principal, hypotheses H2, thru
H5 ,, plus hypotheses H7 and H9 were supported at the .05
level or higher level. Existence-of-specific-assets,
importance-of-the-relationship, interorganizational-climate,
selling-task-characteristics, and the demographic variable
longevity plus overall-control-form all explain significant
variance in the dependent variable (i.e., overall-
performance) . Nature-of-the-product, experience, and size
were not significant.
For the least-important-principal, hypotheses Hz 2 thru
H A 2 plus hypotheses H 9 2 were supported at the .05 level or
better. Existence-of-specific-assets, importance-of-the-

164
TABLE 4.8 HYPOTHESES RESULTS
— Most-Important-Principal —
Hypotheses Conclusion
Hlt: There is no relationship between the nature-of-the-product and overall-performance.
This hypothesis was supported.
H2<1 There is no relationship between the existence-of-specific- assets and overa11-performance.
This hypothesis was not supported. There is a significant relationship.
H31: There is no relationship between the importance-of-the- relationship and overa11-performance.
This hypothesis was not supported. There is a significant relationship.
H41 There is no relationship between interorganizational-climate and overaII-performance.
This hypothesis was not supported. There is a significant relationship.
H5.1: There is no relationship between se11 ing- task-character ist ics arid overa 11-performance.
This hypothesis was not supported. There is a significant relationship.
H61 There is no relationship between the rep's experience and overall-performance.
This hypothesis was supported.
H71 There is no relationship between longevity and overa11-performance.
This hypothesis was not supported. There is a signficant relationship.
K81 There is no relationship between size of the rep agency arid overall-performance.
This hypothesis was supported.
H9>1: There is no relationship between the overa11-control-form and overall-performance.
This hypothesis was not supported. There is a significant relationship.
relationship, interorganizational-climate, and overall
control form all explain significant variance in the
dependent variable (i.e., overa11-performance). Hypotheses
H, 2,H5 2 thru H8A were not supported (nature-of-the-product,
experience, longevity, and size).
Chapter Summary
This chapter dealt with the response pattern for the
study, the demographic analysis of the respondents, and the
testing of the study hypotheses. Eighteen different

165
TABLE 4.9 HYPOTHESES RESULTS
— Least-Important-Principal —
Hypotheses Conclusion
H, 2: There is no relationship between the nature-of-the-product and overall-performance.
This hypothesis was supported.
H2.2: There is no relationship between the existence-of-specific- assets and overa11-performance.
This hypothesis was not supported. There is a significant relationship.
H32: There is no relationship between the importance-of-the- relationship and overa11-performance.
This hypothesis was not supported. There is a significant relationship.
H42: There is no relationship between interorganizational-climate and overa11-performance.
This hypothesis was not supported. There is a significant relationship.
H52: There is no relationship between selling-task-character!sties and overa11-performance.
This hypothesis was supported.
H62; There is no relationship between the rep experience and overall-performance.
This hypothesis was supported.
H72; There is no relationship between longevity and overall- performance.
This hypothesis was supported.
He.2: There is no relationship between size of the rep agency and overall-performance.
This hypothesis was supported.
H92: There is no relationship between the overall-control-form and overall-performance.
This hypothesis was not supported. There is a significant relationship.
hypotheses were tested to determine their influence on the
dependent variable, overall-performance. Multiple linear
regression of sets was the main testing method.
The findings reported in this chapter indicate
significant main effects for many of the control form
factors.
The next chapter, Chapter V, will conclude the analysis
and present recommendations for future research.

CHAPTER REFERENCES
DuBois, Lois C. and Roger H. Grace (1987) , "The Care and Feeding of Manufacturers* Reps," Business Marketing. December, 62-9.
Hitchcock, Earl (1984), "What Manufacturers Love About Their Manufacturers' Rep," Sales and Marketing Management. September, 60-5.
Kvanli, Alan H., C. Stephen Guynes, and Robert J. Pavur (1989), Introduction to Business Statistics; A Computer Integrated Approach. 2nd Ed., New York: West Publishing Co.
O'Connell, William A., and William Kennan Jr. (1990),"The Shape of Things to Come," Sales and Marketing Management. January, 37-41.
Norusis, Marija J. (1988), SPSS-X Advanced Statistics Guide. 2nd Ed., Chicago, II: SPSS Inc.
Sibley, Stanley D., and R. Kenneth Teas (1979), "The Manufacturer's Agent in Industrial Distribution," Industrial Marketing Management. 8, 286-92.
Taylor, Ronald K. (1990), "Manufacturers' Representatives; The March to Professionalism," Journal of Personal Selling & Sales Management. Vol. X (Winter), 53-5.
Taylor, Thayer C. (1981),"A Raging 'Rep'idemic," Sales and Marketing Management. June 8, 33-5.
166

CHAPTER V
REVIEW, CONCLUSIONS, AND RECOMMENDATIONS
In this, the final chapter of the dissertation, a
review of the study is presented. Conclusions and possible
implications of the findings for both industrial
manufacturers and independent multi-line industrial
representatives are discussed. Limitations and extraneous
factors which may have affected the study are addressed.
Finally, areas for future research are outlined.
Review of the Study
The objective of this study was to examine whether the
factors which constitute the manufacturer/rep relationship,
defined by agency theory, influence performance as predicted
by control theory. In addition, the study evaluated the
contribution of selected demogrciphic factors such as size of
the firm, and the rep's experience, on performance.
Performance was used as summary measure of the usefulness or
productivity of the relationship. Performance consists of
tangible factors which assess rep behaviors over which he
has control (selling behaviors), and of intangible factors
which the rep influences (satisfaction). It was theorized
that the individual scales which assessed each relationship
factor [construct] bridged a control continuum bounded by
167

168
output-based control on one extreme and behavior-based
control on the other extreme. Thus, each measure assesses
one aspect of a control profile which uniquely described the
relationship existing between the manufacturer and rep. It
was thought that this knowledge might help in managing the
selling effort when using reps. Members from several multi-
line industrial representative associations from across the
United States, and in many different product areas, were
surveyed. Eighteen hypotheses were evaluated.
Based on the problem set forth in the study, both the
academic literature and the practitioner literature was
consulted to produce a listing of all variables which had
been found to be operant within the manufacturer/rep
relationship. These variables were organized into a logical
grouping of constructs and were shown to be both rational
and appropriate based on an extension of classical agency
theory. Control theory was then employed to link these
variables to selected aspects of performance. These aspects
were selected based on their ability to be controlled by the
behaviors of the rep. Multiple linear hierarchical
regression of sets was used to measure the contribution of
the study constructs to performetnce. Multiple analysis of
variance was used to evaluate the linkage of the form of
control employed within the relationship to performance for
each construct and overall.
169
A self-selected convenience sample of 1032 members of
the Manufacturer's Representative Educational Research
Foundation were the subjects of the study. A self-
administered questionnaire was mailed to each respondent.
Follow-ups using postcards and further mailings were used to
increase the response rate. A usable response rate of 71
percent was achieved. An analysis of the early returns to
the late returns indicated that nonresponse error was not
significant and no corrective actions were necessary.
Although, an examination of the differences between the
rep's responses for the most-important-principal versus the
least-important-principal indicated the need for a separate
analysis for each.
The measurement scales used in this study to assess the
constructs were primarily adaptions of existing scales used
in other studies. Changes were made in the scales to adapt
them to the needs of the study eind to the rep's viewpoint.
Scale evaluation showed that the resulting scales were both
reliable and valid. The analysis also confirmed the
soundness of the study's theoretical model of the
manufacturer/rep relationship. Factor analysis produced
common factors which agreed in large part with the proposed
model both as to the variables which composed the groups of
independent variables which measured each construct, and as
to the orthagonality of the study constructs.

170
The results of the analysis of the contribution of the
factors [constructs] constituting the manufacturer/rep
relationship to performance indicated that there was a
significant influence from most factors thus confirming the
majority of the hypotheses; although there was some
difference between the findings for the most-important-
principal versus the least-important-principal.
Demographics such as the rep's selling experience,
longevity, or the size of the rep agency, proved to be less
of an influence on performance than the literature had
seemed to indicate. Most of thes demographic factors tested
produced no significant impact on performance. The only
factor which proved to be significant was longevity for the
most-important-principal analysis regression model.
Control form was theorized as being a managerial
assessment of a method used to manage the manufacturer/rep
relationship. Two extremes weres predicted: output-based
control and behavior-based control. The concept of control
form was shown to be inherent in the scales which assessed
the study constructs. Output-based control was indicated
by scale values of 1-3.5. Behavior-based control was
indicated by values of 4.5-7. Values of greater than 3.5
but less than 4.5 were defined as indeterminate. As
predicted, the form of control significantly influenced
performance for most constructs. Likewise, the pair-wise
correlation of the variables constituting each construct

171
indicated that as each tended to become more behavior-based
(i.e., higher scale values), performance also tended to
become more behavior-based. Further, as predicted, the
overall relationship between the manufacturer and the rep,
when considering the most-important relationship, was
behavior-based while the overall control form for the least-
important relationship was indeterminate. Behavior-based
relationships tend to be characterized by closer working
relationships: more communication, more cooperation, more
trust, a close reliance and mutual liking for the members of
the relationship.
One factor that might expleiin this difference is that
most-important relationships (10.8 years on average) tend to
be longer than least-important relationships (3.0 years on
average). Thus, relationships become more important as they
age which leads to closer ties between the rep and the
manufacturer. It takes time for a rep to learn the
manufacturer's product line and how to sell it. It also
takes time for the manufacturer to learn how to work with
the rep. There is also the possibility that, on average,
only those relationships which cire important to both parties
last a significant period of time.
Implications of the Findings
The implications are dealt with according to the
independent variables of the study: nature-of-the-product,
existence-of-specific-assets, importance-of-the-

172
relationship, interorganizational-climate, and selling-task-
characteristics .
Nature-of-the-Product
The research indicated that the product strategy
pursued by the manufacturer does not influence performance
when it is viewed in combination with all other relationship
factors. By itself, the nature-of-the-product significantly
(though weakly) predicts performance-behaviors and overall
performance for the most-important-principal.
The characteristics of a product are, by nature,
primarily tangible so tend to directly influence the
tangible measures of performance. However, the rep has very
little control over a product's nature so will probably have
very little day-to-day involvement, and even less emotional
involvement. The lack of control is confirmed by the lack
of a significant influence on any aspect of performance by
the form of control exercised in the relationship (see Table
5.2, p.185). Under these circumstances, the rep is not
likely to strongly link product attributes to performance
measures for either the most-important-principal or the
least-important-principal. This would probably be even more
prevalent for products which do not generate a lot of
commission such as the least-important-principal's. Also,
the rep could be expected to know a lot less about products
which he has been selling for a relatively short time, and
which are a small proportion of his total sales or efforts.

173
The findings indicate that the least-important-principal
provides substantially less selling aids, information, and
communication overall than the most-important-principal.
Existence-of-Specific-Assets
The existence-of-specific-assets in a relationship
strongly influences all aspects of performance when
considered by itself, and for the tangible aspects of
performance when it is viewed in combination with all other
relationship factors.
Relationship specific investments such as product
training, selling knowledge, territory knowledge, developing
selling aids, or show booths, or knowledge of the
principals' procedures, methodologies and people requires a
substantial investment for both the rep and for the
manufacturer. These investments often have no immediate
payoff but enable the rep to sell more effectively, and as
documented in the findings, can directly influence the
performance of the manufacturer/rep relationship. An
examination of the differences in the degree of asset
investment versus the amount of commissions earned can
illustrate the importance of the contribution of this factor
in understanding the manufacturer/rep relationship. The
amount of assets earned can be modeled by examining the
differences in responses for the least-important-principal
versus the responses for the most-important-principal.

174
Clearly, the most-important-principal relationship
involved far greater investments than least-important-
principal relationship for both the rep and manufacturer.
Table 5.1 summarizes these findings and compares the
response means for each. A higher mean indicates a greater
investment. The scale range is one to seven.
TABLE 5.1 COMPARISON OF THE LEAST IMPORTANT VS. MOST IMPORTANT PRINCIPALS:
— Existence-of-Specific-Assets —
Specific Asset Under Consideration Responses (neans)
Least Important Principal
Most Important Principal
Specificity of asset investment in people and facilities by rep overall
1.9 4.8
Degree of investment in learning product 2.8 4.9
Degree of investment in facilities by rep 2.2 4.6
Principals specific investment in training 2.1 4.6
Specificity of asset investment by principal overall 2.5 4.9
Degree of investment in training provided by principal 2.1 4.4
Importance-of~the-Relationship
A central theme of this study was that the quality of a
relationship influences its outcome, and in general, better
relationships have better outcomes. From this, it was
proposed that the mutual sharing of resources, depth and
quality of communications, and mutual involvement in the
sales process (i.e, participation) would play a vital part
in the success of the manufacturer/rep relationship. These
factors are embodied by the importance-of-the-relationship

175
construct. It was also thought that the acceptability of
basic compensation or special incentives would contribute to
this construct. Such proved not to be the case so they were
dropped from consideration.
The research indicates that the importance-of-the-
relationship significantly influences the performance-
satisfaction and overall-performance for the most-important-
principal relationship and performance-behaviors and
overall-performance of the least-important-principal
relationship when they are considered in combination with
all other relationship factors. By itself, the importance-
of-the-relationship factor is a significant predictor of all
aspects of performance for both the most and least important
principal. This finding is significant but importance
factors are rarely considered in isolation. They are only
one aspect of a complete relationship.
The dichotomy between the most-important-principal
relationships and performance-satisfaction versus the least-
important-principal relationships and performance-behaviors
deserves some consideration. Relationships which are
considered to be the most important are central to the
success [survival] of the rep agency so that perhaps
questions of mutual cooperation, or partnering, might be
more of a satisfaction issue than a behaviors issue. The
rep will do whatever he has to do to be successful so
questions of cooperation or help from the principal are less

176
germane. The question is whether he will be happy.
Performance behaviors deals with actions performed by the
rep in the execution of the selling task. Performance-
satisfaction deals with the overall approval the rep holds
toward the relationship.
Another interpretation of the results may be that most-
important-principals are most important because they provide
a high degree of shared resources, communicate well, and
encourage mutual participation in the selling task. So that
factors associated with the importance of a relationship are
more associated with the rep's overall feeling about the
relationship rather than about the execution of particular
behaviors. In sum, most-importcint-principals may better
manage the rep relationship and treat the rep as part of the
overall salesforce (behavior-based control). Conversely,
least-important-principals provide less overall compensation
to the rep, by definition. They also provide less
resources, communicate less, and participate less in the
overall selling process. The rep is basically on his own
and making sales is the prime issue (output-based form of
control).
Interorganizational-Climate
Organizational-climate embodies the individual's
perceptions of his work environment, and provides a context
for interorganizational and interpersonal communication. It
is the feelings of the manufacturer and the rep about the

177
level of trust and mutual supportiveness in the
interorganizational relationship, and is assessed as a
composite of: (1) the congruency of the goals and
expectations of the manufacturer and the rep, (2) trust, (3)
consideration/goodwill, and (4) the future potential of the
relationship. Warmer climates should lead to better (i.e.,
closer and more productive) relcitionships. People generally
work better with those they like and trust, and who have
work goals and expectations which agree with theirs. These
expectations are supported by the findings.
The research indicates that the interorganizational-
climate of the manufacturer/rep relationship significantly
influences all aspects of performance whether it is viewed
in combination with all other relationship factors, or by
itself, for both the least-important-principal and the most-
important-principal. However, there is a substantial
difference in how least-important relationships are managed
in comparison to most-important relationships.
Most-important-principal relationships tend to involve
more sharing of resources and mutual participation in the
selling task which leads to a behavior-based relationship.
Conversely, least-important relationships involve little
sharing or mutual participation and thus tend to be output-
based relationships. Close working relationships help to
build trust through common effort toward mutual goals, and
due to greater and more frequent communication. This would
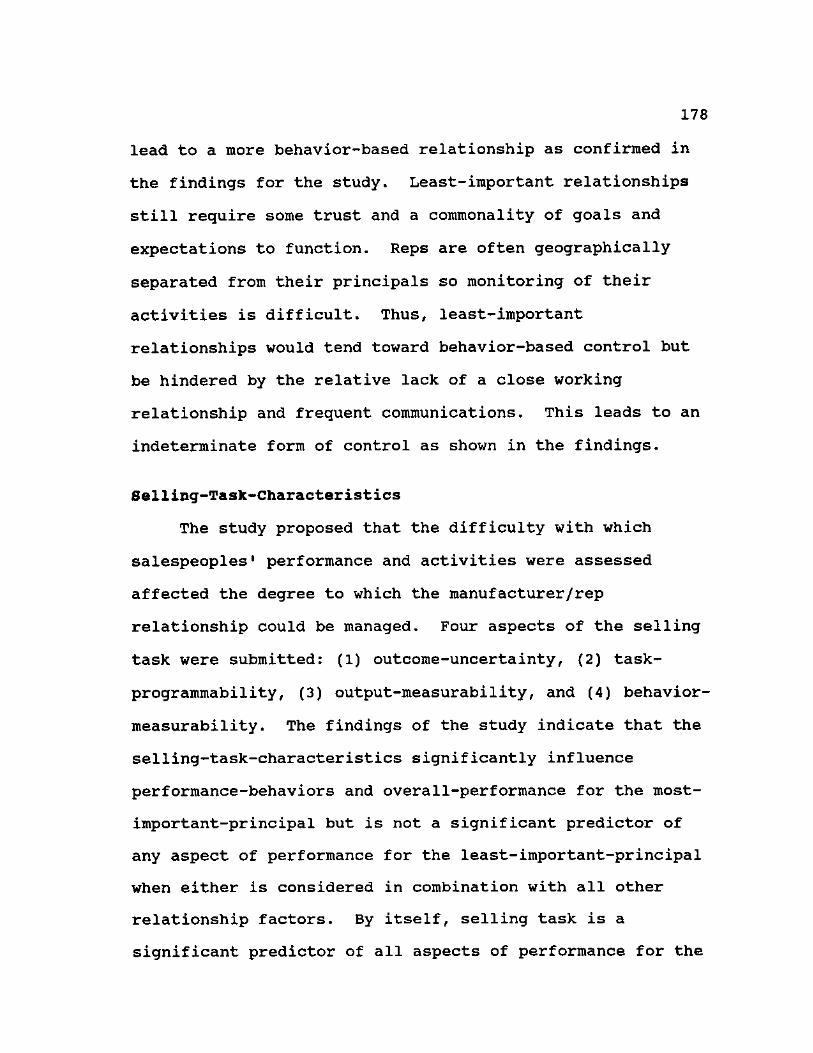
178
lead to a more behavior-based relationship as confirmed in
the findings for the study. Least-important relationships
still require some trust and a commonality of goals and
expectations to function. Reps are often geographically
separated from their principals so monitoring of their
activities is difficult. Thus, least-important
relationships would tend toward behavior-based control but
be hindered by the relative lack of a close working
relationship and frequent communications. This leads to an
indeterminate form of control as shown in the findings.
Selling-Task-Characteristics
The study proposed that the difficulty with which
salespeoples1 performance and activities were assessed
affected the degree to which the manufacturer/rep
relationship could be managed. Four aspects of the selling
task were submitted: (1) outcome-uncertainty, (2) task-
programmability, (3) output-measurability, and (4) behavior-
measurability. The findings of the study indicate that the
selling-task-characteristics significantly influence
performance-behaviors and overall-performance for the most-
important-principal but is not a significant predictor of
any aspect of performance for the least-important-principal
when either is considered in combination with all other
relationship factors. By itself, selling task is a
significant predictor of all aspects of performance for the

179
most-important-principal but not for the least-important-
principal.
As with the nature-of-the-product construct, selling
task items are not directly controllable by the rep. They
merely document the selling situation. This assertion is
confirmed by the lack of a significant influence on any
aspect of performance by the form of control exercised in
the relationship (see Table 5.2). Nevertheless, for most-
important-relationships, selling-task-characteristics
provides a significant [though small] influence on two
aspects of performance. It should be easier to sell in
stable, predictable markets in which sales can be accurately
be forecasted.
Control Form
The control form used to describe the manufacturer/rep
relationship is a managerial summation of an overall pattern
of influence which acts to moderate the outcome from the
totality of the relationship. Control form provides a way
to identify the constituents of a relationship, and their
relative contribution to performance, to enable the
marketing manager to better control and manage the
relationship. The study findings largely confirm this
assertion.
Based on a multiple analysis of variance (MANOVA)
analysis, the control form exercised for: the existence-of-
specific-assets, interorganizational-climate, and the

180
importance-of-the-relationship constructs significantly
influences all aspects of performance. Nature-of-the-
product significantly influences performance- behaviors and
overall-performance but not performance- satisfaction.
Selling-task-characteristics fails to influence any aspect
of performance.
Control form was also examined on an overall basis for
the relationship. The findings confirmed that overall
control form was a significant predictor of all aspects of
performance.
That the form of control exercised within the
manufacturer/rep relationship significantly influenced all
aspects of performance was an important theme of this study
overall. The study also inferred that greater performance
would result from a behavior-based versus output-based
relationship when performance was defined as commissions
received [or sales generated] by the rep. This was also
confirmed. The sales generated or commissions received were
measured by comparing the responses for the least-important-
principal versus the most-important-principal. This was
possible because the rep had been asked to separately answer
most questions based on the commissions received from his
least versus most important principal. The least-important-
principal provides the least commissions, on average, to the
rep and the most-important-principal provides the most
commissions. A paired t-test indicated that the mean of all

181
measures were significantly different, and that the mean of
the responses for the most-important-principal significantly
exceeded, or was more behavior-based, than those of the
least-important-principal. Thus, behavior-based
relationships perform better than output-based relationships
when measured from a total sales dollars or commissions
viewpoint.
Manufacturers1 Marketing Managers
To maximize the rep's selling performance, the
manufacturer should actively work with the rep, and involve
him as much as possible in the selling process. That is,
the manufacturer should use behavior-based control and
manage the relationship so as to produce a most-important
relationship. Most-important relationships are those that
generate the most commissions for the rep and the greatest
sales for the manufacturer. The manufacturer should invest
in specific assets, encourage trust, be supportive,
communicate often and in detail, and freely share or provide
selling aids and information. The rep should be treated as
a valued member of the selling team and of the business.
Implications for Reps
Traditionally, manufacturers have failed to use reps
because of a lack of immediate control or accountability of
their actions. Nevertheless, reps are often the most
efficient way to sell. The key to using reps is to

182
understand their needs and to properly manage them. Reps
are independent businesses which must generate an adequate
income to remain viable. To do this, they must optimize
their selling effectiveness. The main way in which this may
be accomplished is to maximize the number of the rep's most-
important principal relationships versus least-important
relationships. Both types of relationships tend to require
the same kinds of activities from the rep but to a different
degree. However, most-important relationships generate more
commission, and tend to be longer term.
Reps should also be concerned with converting least-
important relationships into most-important ones by
encouraging and helping the principal to properly manage the
relationship. Reps need to encourage trust through frequent
communication both verbal and written. Professionalism is
important. Reps should invest in specific assets such as
training. They should plan to make the principal's visits
productive, and encourage such visits. Reps should also
visit the factory as often as is practical and productive,
and try to get to know the manufacturer's people, products,
and processes both administrative and product. Reps should
be involved in goal setting and territory planning. The
rep's expectations and goals for the relationship should be
clearly communicated to the manufacturer. Reps should
provide documentation which details their sales process and
progress. They need to treat the manufacturer as if he were
183
a valued customer and continuously sell him on the job they
are doing for him. A close behavior-based relationship is
the goal.
Problems are inevitable, when selling products. A
close working relationship can provide a ready basis for
solving them: knowing which people to contact and having
them promptly accept the rep's call and take action, knowing
the proper procedures to follow to receive quick turnaround
on a warranty replacement issue, or getting first
consideration for products which are on allocation.
A close relationship also allows the rep to work with
the manufacturer on new products which might then be
tailored to the reps customer's needs shortening the sales
cycle and increasing the chance of customer acceptance.
Table 5.2 summarizes the analyses of the study
hypotheses and the form of control used to manage the
manufacturer/rep relationship. From the left, column one
identifies the construct or overall control form under
consideration. Column two indicates whether the study
hypotheses were accepted or rejected at the .05 significance
level for both the least important principal and for the
most important principal. Column three summarizes the
findings for control. Form refers to the managerial
determination of the form of control exercised within the
manufacturer/rep relationship for the least important
principal and for the most-important-principal.

184
Significance identifies whether the findings are meaningful.
The general assessment of direction refers to the
correlation of the variables which assess each construct and
the summated performance variables. If performance
increases or decreases in step with the construct under
consideration, the relationship should be positive (+).
Conversely, if performance decreases as the value of a
construct increases the relationship is negative (-). Thus,
if the mean value of performance increases (i.e., becomes
more behavior-based), a positively related construct also
becomes more behavior-based.
Contributions of the Study
This study extends the bounds of channel research
lconcerning industrial reps both from a theoretical and a
managerial viewpoint. A few contributions of the study are
as follows:
1) A new model of channel relationships, was tested and confirmed. The model incorporated a large number of factors shown by the literature to be operant within channel relationships including those inherent to people (i.e., self-interest, opportunism, etc.). No research to-date has attempted to theoretically organize as large a number of factors.
A basic tenet of this research is that all aspects of a relationship should be examined together. Most research to-date has concentrated on a single aspect of a relationship (e.g., trust, commitment, self-interest, motivation, sales, etc.) rather than on all aspects of a relationship simultaneously. This model provides that simultaneity.

185
TABLE 5.2 SUMMARY OF ANALYSIS RESULTS
Construct
Performance Measure
Accept Hyp.
Least Most Imp. Imp. Prin. Prin.
Control
Form least Most
Significance Least Most
General Assessment of Relat.
Least Most
Nature-of-the-Product
Singly:
In Model:
Behaviors No Yes Beh. Beh. No Yes + + Satisfaction No No Beh. Beh. No No + + Overall No Yes Beh. Beh. No Yes + + Behavi ors No No - - - - n.a. n.a Satisfaction No No - - - - n.a. n.a Overall * No No - - - - n.a. n.a
Ex i stence-of-Spec i f i c-Assets
Singly:
In Model:
Behaviors Satisfaction Overall Behaviors Satisfaction Overall *
Yes Yes Yes Yes No Yes
Yes Yes Yes Yes No Yes
Out. Out. Out.
Beh. Beh. Beh.
Yes Yes Yes
Yes Yes Yes
+
+ + n.a. +
• + + + n.a. +
Importance-of-the-Relationship
Singly:
In Model:
Behaviors Yes Yes Out. Beh. Yes Yes + Satisfaction Yes Yes Out. Beh. Yes Yes + Overa11 Yes Yes Out. Beh. Yes Yes + Behaviors Yes No - - - . + Satisfaction No Yes - - - - n.a Overall * Yes Yes - - . +
Interorgani zat i onaI-CIi mate
Singly:
In Model:
Behaviors Satisfaction Overall Behaviors Satisfaction Overall *
Yes Yes Yes Yes Yes Yes
Yes Yes Yes Yes Yes Yes
Ind. Ind. Ind.
Beh. Beh. Beh.
Yes Yes Yes
Yes Yes Yes
Selling-Task-Characteristies
Singly:
In Model:
Behaviors No Yes Satisfaction No Yes Overall No Yes Behaviors No Yes Satisfaction No No Overall * No Yes
Ind. Beh. No No Ind. Ind. Ind. Beh. No No Ind. -
Ind. Beh. No No Ind. Ind. - - - - n.a. Ind. - - - - n.a. n.a. - - - - n.a. Ind.
Control form
Overa11-Cont rol-Form
Singly:
In Model:
Behaviors Satisfaction Overall Behaviors Satisfaction Overall *
Ind. Ind. Ind.
Beh. Beh. Beh.
Yes Yes Yes
Yes Yes Yes
(*) Used in formal hypotheses tests; Ind. -- Indeterminate; n.a. -- not part of model (+) The general assessment of the control form used in a relationship is based on the correlation
of the set of variables which assess a specific construct with tne indicated summated performance variable.

186
2) Agency theory was shown to be an appropriate way to look at channel relationships, and more specifically at the relationship between reps and their principals. The importance of people in a channel relationship was advanced and confirmed by the findings.
3) The study provides a broader definition of control than previous literature. Control is used to describe an overall pattern of influence which acts to moderate the outcome of the totality of the relationship. The pattern provides a diagnostic and normative tool to both examine and manage the manufacturer/rep relationship.
4) The role of the form of control utilized within the manufacturer/rep relationship was shown to be significantly linked with performance. Better relationships were shown to have higher performance.
Limitations of the study
This research has a number of limitations. First, few
industries or products are well represented by the survey.
Also, the industries that are represented have somewhat
similar products: electronics, electrical products, and
power-motion technology. This makes for a good test of
theory but limits generalization.
Second, only reps who were members of a national
representative associations affiliated with MRERF
(Manufacturers' Representatives Educational Research
Foundation) were sampled. Reps who were not members may
hold different opinions. Also, the sample was not randomly
drawn from these associations but was self-selected.
However, the sample does represent a highly professional and
experienced group of manufacturers' representatives. These

187
issues merely highlight the need to exercise care in
generalizing on the results of the study.
Third, relationships between manufacturers and reps are
influenced by factors which reflect the direct
interorganizational relationship of the manufacturer and
rep. They are also probably influenced by other, more
global, considerations such as the legal, political,
technical, or competitive environments that exists in the
marketplace. For example, trade wars between the U.S. and
foreign countries could influence the availability and price
of competing products or technologies. Or the lack of
patent protection in certain foreign countries, may
overshadow other more immediate relationship factors by
threatening the very survival of a U.S. industry. Changes
in technology may obsolete a product and terminate, severely
modify, or simply stress a manufacturer/rep relationship.
Conclusions that are drawn from this research must be
somewhat tentative lacking a more formal determination of
the possible influence of such factors.
Fourth, some industrial reps sell products primarily to
manufacturers, as OEMs or end users, while others sell
primarily to institutions or government agencies. Also,
reps sell to distributors who then resell the product.
These differences in customers may significantly influence
the manufacturer/rep relationship, and need to be considered
in future studies. This information was not collected in

188
this study because the main focus was on documenting and
understanding the antecedents of the form of control used to
manage the behaviors or actions of the rep.
Finally, possible interaction between any of the
relationship factors, or between any of the demographic
factors and relationship factors, were not dealt with in the
study due to time and complexity considerations.
Areas for Further Research
One area of research centers on examining a wider range
of industrial relationships. There might well be
differences in the structure of relationships for different
products, industries, and markets. This might be
particularly true for foreign markets.
Manufacturer/rep relationships, as was shown in this
study, are largely the result of intangible factors relating
more to the people involved than to the strictly mechanical
elements of buying and selling. People relate and interact
under a code dictated by culture, and norms, and there are
often large differences in the culture and resultant
business practices between different industries, and
especially, countries. Manufacturer/rep relationships are
probably quite different the United States versus other
countries. A study to determine the extent of these
differences both between industries and between countries
would appear to be quite worthwhile.

189
A second area of research involves the investigation
into other factors which might influence the performance of
the manufacturer/rep relationship. At best, this study only
accounted for around 49% of the variance in the performance
of the manufacturer/rep relationship. This would seem to
indicate that other important factors are at work.
Likewise, several of the proposed constituents of many
of the constructs failed to significantly assess either
their constructs or to influence the performance of the
manufacturer/rep relationship. Yet, surprisingly, these
factors were included in this study because the literature
indicated their significance. Is the literature wrong? Or
were these factors used incorrectly, or perhaps in the wrong
context?
Finally, any relationship involves more than one
viewpoint. Only examining the manufacturer/rep relationship
from the rep's point of view ignores half of the relevant
insights and potential understandings to be gained from such
a study, and can lead to biases in the findings. Much could
be gained by asking manufacturers that use reps to respond
to these same issues. This basic concern also extends to
other industrial distribution relationships such as
distributors with reps, and manufacturers with distributors,
or brokers.

APPENDIX A
RESEARCH INSTRUMENT
190

191
SURVEY OF U.S. MANUFACTURERS REPRESENTATIVES "Optimizing the Manufacturer/Rep Relationship"
The statements in this survey are intended to measure your perception of the relationship between you and your principals. Your responses will help us to better understand how to optimize this relationship to maximize performance.
Please indicate your response to each of the following statements by circling the number that most closely matches your opinion.
When thinking about vour most important principal (in Total Revenue
How would you describe the MARKET for that principal's products? Please circle your response.
Simple 1 2 3 4 5 6 7 Stable market 1 2 3 4 5 6 7
Easy to monitor trends 1 2 3 4 5 6 7 Few new products 1 2 3 4 5 6 7
Stable industry volume 1 2 3 4 5 6 7 Can forecast sales accurately 1 2 3 4 5 6 7
Predictable 1 2 3 4 5 6 7 Few new competitors 1 2 3 4 5 6 7
Complex Volatile market Hard to monitor trends Many new products
Volatile industry volume Can not forecast sales accurately Unpredictable "Many new competitors
How would you describe the principal's PRODUCT line?
Nontechnical 1 2 3 4 5 6 7 Unsophisticated 1 2 3 4 5 6 7
Commodity 1 2 3 4 5 6 7 Low relative price 1 2 3 4 5 6 7
Low relative quality 1 2 3 4 5 6 7 Hard to sell 1 2 3 4 5 6 7
High sales growth 1 2 3 4 5 6 7 High synergy with your other product lines 1 2 3 4 5 6 7
Poor backup support from manufacturer 1 2 3 4 5 6 7
Technical Sophisticated Customized High relative price
High relative quality Easy to sell Low sales growth Low synergy Excellent backup support
How would you describe the SELLING TASK?
- 1 typically travel a great deal servicing my principal's accounts.
- Selling my principal's product is very straightforward.
- The purchase decision evolves over a long time period.
- 1 am seldom involved in post-sales problems or service.
• There exists a clearly defined body of knowledge or subject matter that can guide me in doing my work.
* My performance can be adequately assessed using existing documents.
Strongly Disagree 1 2 3 4 5 6 7 Strongly Agree
Strongly Disagree 1 2 3 4 5 6 7 Strongly Agree
Strongly Disagree 1 2 3 4 5 6 7 Strongly Agree
Strongly Disagree 1 2 3 4 5 6 7 Strongly Agree
Strongly Disagree 1 2 3 4 5 6 7 Strongly Agree
Strongly Disagree 1 2 3 4 5 6 7 Strongly Agree
- My principal's products require considerable post-sale follow up.
»The customer's purchase decision is made quickly.
- A number of people are involved in the purchase decision.
* A lot of information is required prior to the purchase decision.
»The customer considers the purchase decision to be routine.
»My salespeople devote considerable time to nonselling activities.
Strongly Disagree 1 2 3 4 5 6 7 Strongly Agree
Strongly Disagree 1 2 3 4 5 6 7 Strongly Agree
Strongly Disagree 1 2 3 4 5 6 7 Strongly Agree
Strongly Disagree 1 2 3 4 5 6 7 Strongly Agree
Strongly Disagree 1 2 3 4 5 6 7 Strongly Agree
Strongly Disagree 1 2 3 4 5 6 7 Strongly Agree
PLEASE TURN TO PAGE TWO

192 Please compare your most important principals to your least important principal...
How important are the following PERFORMANCE MEASURES in how these principals rate your performance?
• Knowing the design and specifications of this principal's products Unimportant
Least Important Principal
1 2 3 4 5 6 7
Most Important Principal
1 2 3 4 5 6 7 Important
• Producing a high market share for this principal Unimportant 1 2 3 4 5 6 7 1 2 3 4 5 6 7 Important
* Generating a high level of dollar sales Unimportant 1 2 3 4 5 6 7 1 2 3 4 5 6 7 Important
- Quickly generating sales of new products Unimportant 1 2 3 4 5 6 7 1 2 3 4 5 6 7 Important
• Identifying and selling to major accounts Unimportant 1 2 3 4 5 6 7 1 2 3 4 5 6 7 Important
* Submitting required reports on time Unimportant 1 2 3 4 5 6 7 1 2 3 4 5 6 7 Important
• Using established contacts to develop new customers Unimportant 1 2 3 4 5 6 7 1 2 3 4 5 6 7 Important
- Knowing the applications and functions of the principals1 products Unimportant 1 2 3 4 5 6 7 1 2 3 4 5 6 7 Important
- Maintaining records for the principal that are accurate, complete, and up to date Unimportant 1 2 3 4 5 6 7 1 2 3 4 5 6 7 Important
• Keeping abreast of the principals' production and technological developments Unimportant 1 2 3 4 5 6 7 1 2 3 4 5 6 7 Important
• Working out solutions to a customer's questions or objections Unimportant 1 2 3 4 5 6 7 1 2 3 4 5 6 7 Important
* Working attentively to identify and understand the real concerns of the principals* customer Unimportant 1 2 3 4 5 6 7 1 2 3 4 5 6 7 Important
• On the whole, how satisfied are with your overall relationship with this principal? Very Dissatisfied 1 2 3 4 5 6 7 1 2 3 4 5 6 7 Very Satisfied
- Would you agree to sell this principal's products again if you could remake the decision? No Way 1 2 3 4 5 6 7 1 2 3 4 5 6 7 Absolutely
• Would your principal engage your services again? NoWay 1 2 3 4 5 6 7 1 2 3 4 5 6 7 Absolutely
- How much of your time is spent on nonselling activities for your principals? None 1 2 3 4 5 6 7 1 2 3 4 5 6 7 A Great Deal
Concerning SPECIALIZED training or ASSETS required to sell your principals' products..
• If you decided to stop representing this principal you would nave a lot of trouble redepfoying your people and facilities presently serving this principal.
- You give extensive training to your customers on how to use this principals product.
• You have made a substantial investment in facilities dedicated to this principal's line.
- This principal has made a significant investment in training your people.
• It would be difficult for the principal to recoup his investment in you if he switched to a new rep agency.
• The principal puts on helpful programs that are designed to enhance your overall business.
Least Important Most Important Principal Principal
Strongly Disagree 1 2 3 4 5 6 7 1 2 3 4 5 6 7 Strongly Agree
Strongly Disagree 1 2 3 4 5 6 7 1 2 3 4 5 6 7 Strongly Agree
Strongly Disagree 1 2 3 4 5 6 7 1 2 3 4 5 6 7 Strongly Agree
Strongly Disagree 1 2 3 4 5 6 7 1 2 3 4 5 6 7 Strongly Agree
Strongly Disagree 1 2 3 4 5 6 7 1 2 3 4 5 6 7 Strongly Agree
Strongly Disagree 1 2 3 4 5 6 7 1 2 3 4 5 6 7 Strongly Agree
PLEASE TURN TO PAGE THREE

What is your perception of the level of TRUST and mutual SUPPORTIVENESS that exists agency and your principals?
Least Important Most Important Principal Principal
1 2 3 4 5 6 7
1 2 3 4 5 6 7
1 2 3 4 5 6 7
1 2 3 4 5 6 7
1 2 3 4 5 6 7
1 2 3 4 5 6 7
1 2 3 4 5 6 7
1 2 3 4 5 6 7
193
between your
Very Much
Very Much
Completely
Completely
Never 1 2 3 4 5 6 7 1 2 3 4 5 6 7 Always
Agreement on growth objectives Very little
Agreement on relationship expectations Very Little
You trust your principal to be fair Not at all
Your principal trusts you to be fair Not at all
You are willing to make short-term sacrifices if they help the relationship
Your principal is willing to make short-term sacrifices if they help the relationship Never 1 2 3 4 5 6 7 1 2 3 4 5 6 7 Always
My principal is friendly and approachable Never 1 2 3 4 5 6 7 1 2 3 4 5 6 7 Always
My principal helps make my job more pleasant Never 1 2 3 4 5 6 7 1 2 3 4 5 6 7 Always
My principal does little things to make it pleasant to be associated with him Never 1 2 3 4 5 6 7 1 2 3 4 5 6 7 Always
Competency of principals' people that you deal with Very Low 1 2 3 4 5 6 7 1 2 3 4 5 6 7 Very High
The principals1 people are very experienced Strongly Disagree 1 2 3 4 5 6 7 1 2 3 4 5 6 7 Strongly Agree
You personally like the principals' people that you deal with Very Little 1 2 3 4 5 6 7 1 2 3 4 5 6 7 Very Much
Your salespeople like your principals' people Very Little 1 2 3 4 5 6 7 1 2 3 4 5 6 7 Very Much
Likelihood this principal will take your house accounts Not Very Likely 1 2 3 4 5 6 7 1 2 3 4 5 6 7 Very Likely
Likelihood of being terminated Not Very Likely 1 2 3 4 5 6 7 1 2 3 4 5 6 7 Very Likely
Likelihood of you severing the relationship Not Very Likely 1 2 3 4 5 6 7 1 2 3 4 5 6 7 Very Likely
Please indicate the DEGREE OF DEPENDENCE that you feel exists between your agency and principal..
» To what extent does your performance depend upon the performance or this principal?
- To what extent does this principal
depend on you?
* If you no longer represented this principal...
• The loss of the line would hurt sales of other related products.
• You could easily compensate for it by switching your efforts to other lines.
• You could easily replace his line with a similar line from another principal,
* It would be relatively easy for your agency to diversify into selling new products.
* If Your relationship with this principal were terminated, you could suffer a.significant loss in income, despite your best efforts.
- Many principals in this industry are unable to to find reps who will represent them.
Least Important Most Important Principal Principal
Very Little 1 2 3 4 5 6 7 1 2 3 4 5 6 7 Very Much
Very Little 1 2 3 4 5 6 7 1 2 3 4 5 6 7 Very Much
Strongly Disagree 1 2 3 4 5 6 7 1 2 3 4 5 6 7 Strongly Agree
Strongly Disagree 1 2 3 4 5 6 7 1 2 3 4 5 6 7 Stroogly Agree
Strongly Disagree 1 2 3 4 5 6 7 1 2 3 4 5 6 7 Strongly Agree
Strongly Disagree 1 2 3 4 5 6 7 1 2 3 4 5 6 7 Strongly Agree
Strongly Disagree 1 2 3 4 5 6 7 1 2 3 4 5 6 7 Strongly Agree
Strongly Disagree 1 2 3 4 5 6 7 1 2 3 4 5 6 7 Strongly Agree
PLEASE TURN TO THE FINAL PAGE
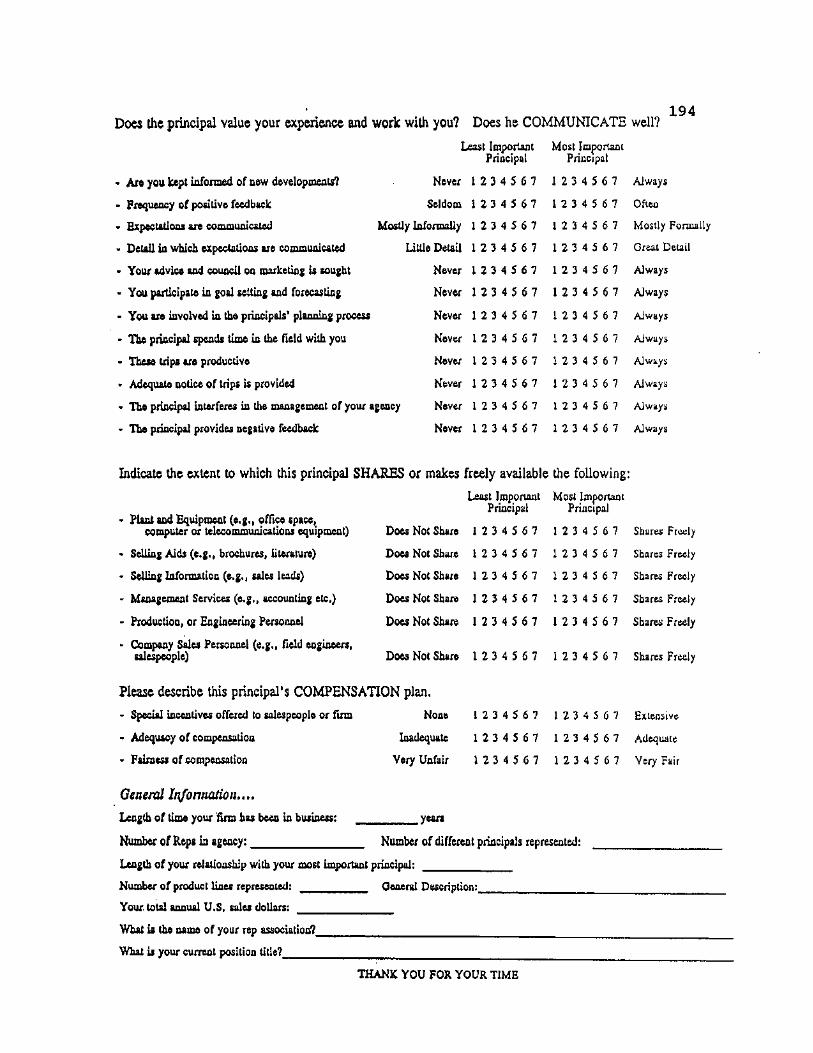
Does the principal value your experience and work with you? Does he COMMUNICATE well? 194
Least Important Principal
Most Important Principal
• Are you kept informed of new developments? Never 1 2 3 4 5 6 7 1 2 3 4 5 6 7 Always
- Frequency of positive feedback Seldom 1 2 3 4 5 6 7 1 2 3 4 5 6 7 Often
* Expectations are communicated Mostly Informally 1 2 3 4 5 6 7 1 2 3 4 5 6 7 Mostly Formally
• Detail in which expectations are communicated Little Detail 1 2 3 4 5 6 7 1 2 3 4 5 6 7 Great Detail
» Your advice and council on marketing is sought Never 1 2 3 4 5 6 7 1 2 3 4 5 6 7 Always
• You participate in goal setting and forecasting Never 1 2 3 4 5 6 7 1 2 3 4 5 6 7 Always
• You are involved in the principals' planning process Never 1 2 3 4 5 6 7 1 2 3 4 5 6 7 Always
• The principal spends time in the field with you Never 1 2 3 4 5 6 7 1 2 3 4 5 6 7 Always
• These trips are productive Never 1 2 3 4 5 6 7 1 2 3 4 5 6 7 Always
• Adequate notice of trips is provided Never 1 2 3 4 5 6 7 1 2 3 4 5 6 7 Always
• The principal interferes in the management of your agency Never 1 2 3 4 5 6 7 1 2 3 4 5 6 7 Always
* The principal provides negative feedback Never 1 2 3 4 5 6 7 1 2 3 4 5 6 7 Always
Indicate the extent to which this principal SHARES or makes freely available the following:
Plant and Equipment (e.g., office space,( computer or telecommunications equipment)
Selling Aids (e.g., brochures, literature)
Selling Information (e.g., sales leads)
Management Services (e.g., accounting etc.)
Production, or Engineering Personnel
Company Sales Personnel (e.g., Held engineers, salespeople)
Least Important Principal
Does Not Share 1 2 3 4 5 6 7
Does Not Shure 1 2 3 4 5 6 7
Does Not Share 1 2 3 4 5 6 7
Does Not Share 1 2 3 4 5 6 7
Most Important Principal
1 2 3 4 5 6 7 Shares Freely
1 2 3 4 5 6 7 Shares Freely
1 2 3 4 5 6 7 Shares Freely
1 2 3 4 5 6 7 Shares Freely
1 2 3 4 5 6 7 Shares Freely Does Not Share 1 2 3 4 5 6 7
Does Not Share 1 2 3 4 5 6 7 1 2 3 4 5 6 7 Shares Freely
Please describe this principal's COMPENSATION plan.
« Special incentives offered to salespeople or firm None
« Adequacy of compensation Inadequate
* Fairness of compensation Very Unfair
1 2 3 4 5 6 7 1 2 3 4 5 6 7 Extensive
1 2 3 4 5 6 7 1 2 3 4 5 6 7 Adequate
1 2 3 4 5 6 7 1 2 3 4 5 6 7 Very Fair
General Information.,..
Length of time your firm has been in business:
Number of Reps in agency:
# years
Number of different principals represented:
Length of your relationship with your most important principal: ^
Number of product lines represented: _ _ _ _ _ _ _ _ General Description:^
Your total annual U.S. sales dollars:
What is the name of your rep association?^
What is your current position title?
THANK YOU FOR YOUR TIME

APPENDIX B
SCALE ITEMS FOR RESEARCH INSTRUMENT
195

196
TABLE A . l NATURE-OF-THE-PRODUCT SCALE ITEMS
Scale Final Scale Items Sources Variables
Standardized Please describe your principal's product line. New Versus Scale
Differentiation Simple 1 - 7 Complex based on V l l Nontechnical 1 - 7 Technical literature V20 Unsophisticated 1 - 7 Sophisticated V21 Commodity 1 - 7 Customized V22 Low Relative Price 1 - 7 High Relative Price V23
TABLE A . 2 E X I S T E N C E - O F - S P E C I F I C - A S S E T S SCALE ITEMS
Scales Final Scale Items Sources Variables
Human 1. If you decided to stop representing Modification V101/V102* Assets this principal, you would have a lot and
& of trouble redeploying your people combination of Physical and facilities presently serving this Anderson and Assets principal Weitz (1992) V103/V104
2. You give extensive training to your idiosyncratic customers on how to use this Investment principal's product. scales; Alpha
3. You have made a substantial reported as investment in facilities dedicated to .81 and .80 V105/V106 this principal's line for the scales
4. This principal has made a significant V107/V108 investment in training your people.
5. It would be difficult for the principal to recoup his investment in you if V109/V110 they switched to a new rep agency.
6. The principal puts on helpftil V111/V112 programs that are designed to enhance your overall business.
final scale for the most important principal due to poor loading.

197
TABLE A.3 IMPORTANCE-OF-THE-RELATIONSHIP SCALE ITEMS
Scale Final Scale Items Source Variables
Partnering: 1. You are kept informed of new Adapted V201/V202 o Mutual developments from:
2. Frequency of positive feedback Anderson, V203/V204 Communication 3. Expectations communicated... Lodish, V205/V206*
4. Detail in which principal's and Weitz V207/V208* expectations are communicated (1987)
5. Your advice and council on marketing V209/V210 o Mutual is sought
Participation 6. You participate in goal setting and V211/V212 forecasting
7. You are involved in the principal's V213/V214 planning process
8. TTie principal spends time in the field V215/V216* with you
9. These trips are productive V217/V218 10. Adequate notice of trips is provided Based on V219/V220*
interfere Burke 11. Selling Information (e.g., Sales (1984) V229/V230
o Resource Leads) scale; Sharing 12. Management services (e.g., Alpha of V231/V232*
accounting etc.) original 13. Production or Engineering personnel scale .87 V233/V234 14. Company sales personnel (e.g., field V235/V236
engineers, salespeople) * Item not used in final scale for the most important principal due to poor loading

198
TABLE A.4 INTERORGANIZATIONAL-CLIMATE SCALE ITEMS
Scale Final Scale Items Source Variables
Goals and 1. Agreement on growth objectives Anderson, V113/V114 Expectations 2. Agreement on relationship Lodish, V115/V116
expectations. Weitz (1987)
Trust 1. You trust your principal to be V117/V118 fair.
2. Your principal trusts you to be V119/V120 fair.
Consideration/ Goodwill
o Liking 1. My principal is friendly and Based on V125/V126 approachable (Never/Always). House
2. My principal helps make my job and Dressier V127/V128 more pleasant. (1974), Teas
3. My principal does little things to (1981) V129/V130 make it pleasant to be associated with him.
o Competency 4. Competency of the principal's V131/V132 people that you deal with Anderson,
5. The principal's people are very Lodish, V133/V134 experienced. and Weitz
6. You personally like the principal's (1987) V135/V136 people you deal with.
Future 1. Your principal is willing to make V123/V124 Potential of short-term sacrifices if they help Relationship the relationship.

199
TABLE A . 5 SELLING-TASK-CHARACTERISTICS SCALE ITEMS
Scale Final Scale Items Sources Variables
Outcome How would you describe the MARKET Adapted Uncertainty for your principal's products as compared from
to other products in general? John and
1. Stable market 1 - 7 Volatile market Weitz 2. Easy to Difficult to (1988); V12
monitor trends 1 - 7 monitor trends Alpha= 3. Stable Volatile .73 V13
indus. volume 1 - 7 indus. volume 5 Can forecast Cannot forecast V15
sales accur. 1 - 7 sales accur. V16 6. Predictable 1 - 7 Unpredictable V17
Task Programmability Jaworski
V33* o Procedural 1. There exists a clearly defined body of and V33* Knowledge knowledge or subject matter that can Maclnnis
guide me in doing my work. (1989); o Performance 2. My performance can be adequately Alpha = V34*
Documentation assessed using existing documents. .50, .76
Output John and Measurability Weitz o Selling Task 1. The customer's purchase decision is (1989); V36
Complexity made quickly Alpha= - Selling Cycle 2. A number of people are involved in .89 V37 - Team buying the purchase decision - Technical 3. A lot of information is required prior V38
product to the purchase decision 4. The purchase decision evolves over a Based on V31
long period of time Anderson o # of 5. My principal's products require (1984);
Nonselling considerable post-sale followup. Alpha= V35 Activities .63
Behavior Based on Measurability 1. I typically travel a great deal servicing work by V29*
my principal's accounts. Anderson 2. Selling my principal's product is very (1984) V30*
straightforward and theory in chapter 3
* Item not in final sea e due to poor loading.

200
TABLE A - 6 PERFORMANCE SCALE ITEMS
Scale Final Scale Items Sources Variables
Satisfaction 1. On the whole, how satisfied are with your overall relationship with this principals?
2. Would you agree to sell this principal's products again if the decision could be redone?
3. Would your principal engage your services again?
Adopted from: Frazier, Gill, and Kale (1989); Gaski and Nevin (1985). Hunt and Nevin (1974)
V64/V65
V66/V67
V68/V69
Selling Behaviors
o Sales Objectives
o Technical Knowledge
o Providing Information
o Ability to deal with Customers Effectively
1. Producing a high market share for this principal.
2. Generating a high level of dollar sales.
3. Quickly generating sales of new products.
4. Identifying and selling to major accounts.
5. Knowing the applications and functions of your principal products.
6. Knowing the design and specifications of the product
7. Keeping abreast of your principals' production and technological developments.
8. Submitting required reports on time.
9. Maintaining records for your principal that are accurate, complete, and up to date.
10. Using established contacts to develop new customers.
11. Working out solutions to a customer's questions or objections.
12. Working attentively to identify and understand the real concerns of the principals' customer.
Adopted and modified from Behrman and Perreault (1982); Alpha reported as over .75 for all original scales
Adapted from Avila, Fern, and Mann (1988) Behrman and Perreault (1982)
V44/V45
*V46/V47
V48/V49
V50/V51
V56/V57
V42/V43
V58/V59
V52/V53
V40/V41
V54/V55
V60/V61
V62/V63
* Item not in final scale for the least-important-principal due to poor loading.

APPENDIX C
SURVEY COVER LETTER
201

202
University of North Texas
Marketing Department College of Business Administration
April 1, 1994
Dear Manufacturers' Representative:
As you well know, representatives play a very important role in marketing industrial products. Yet, surprisingly, this critical area has received little attention in terms of research. As a consequence, it is poorly understood when compared to other areas such as advertising or purchasing. The enclosed questionnaire investigates the perceptions of independent manufacturers1
representatives about the relationship that exists between them and their principals.
Your responses to the survey will offer an in-depth look at a broad cross-section of manufacturers' representative firms, and should offer many opportunities for improving the productivity of rep/manufacturer relationships. The individual answers that you provide will be held in strict confidence. They will be used for aggregate statistical analysis purposes by combining them with the answers given by other manufacturers' representative professionals.
The questionaire takes about 20 minutes to fill out. Please feel free to make any comments you have on the questionnaire itself. Your comments are most welcome. If you have any questions concerning this survey please contact me. A summary of the results will be provided to your association for distribution to you.
Thank you for your help.
John C. Crawford, PhD. Associate Professor of Marketing

APPENDIX D
REGRESSION ASSUMPTIONS
203

204
Histogram:. Performance Effectiveness Least Important Principal
Std. Dev • 1.03 Mean - X)0 N - 837DO
%%%%%% Regression Standardized Residual
Scatterplot: Performance Effectiveness
_ Least Important Principal <S 60
3 S3 QL
U
40
20
e s» QL .40
20
• • " l" ' "Jfv.'V „ .. ..: y. <•
:: -• "•
•20 -10 0 Regression Predicted Value
10 20 30
Norm. Prob, Plot. Stand. Resi Performance Effectiveness Least important Principal
0.00 .25 SO .75 1.00
Observed Cum Prob

205
Histogram: Performance Satisfaction Least Important Principal
Regression Standardized Residual
S t d . D e v • 1 . 0 2
M e a n - , 0 3
N - 7 0 2 . 0 0
20
Scatterplot: Performance Satisfaction Least Important Principal
i CD 1 0
£
c
O o in K -io
-20
• « ^
- 8 - 6 - 4 - 2 0
Regression Predicted Value
Norm. Prob. Plot Stand. Resi< Performance Satisfaction Least Important Principal
s 0 J X 25 . 5 0 . 7 5 1 . 0 0
Observed Cum Prob

206
Histogram: Overall Performance Least Important Principal
Std. Pev -1.04 Meon « .09 N - 8 23 DO
Regression Standardized Residual
60
" 40
Q> w
Scatterplot: Overall Performance Least Important Principal
1 20
"w o 8 o> -20 CJ Ct >40
•• • 1 X.'» • M •• i M
*30 •20 .10 6 10 20 30 40
Regression Predicted Value
Norm. Prob. Plot Stand. Resit Overall Performance Least Important Principal
•o 11)0
0JD0 .25 .50 .75 1.00 Observed Cum Prob
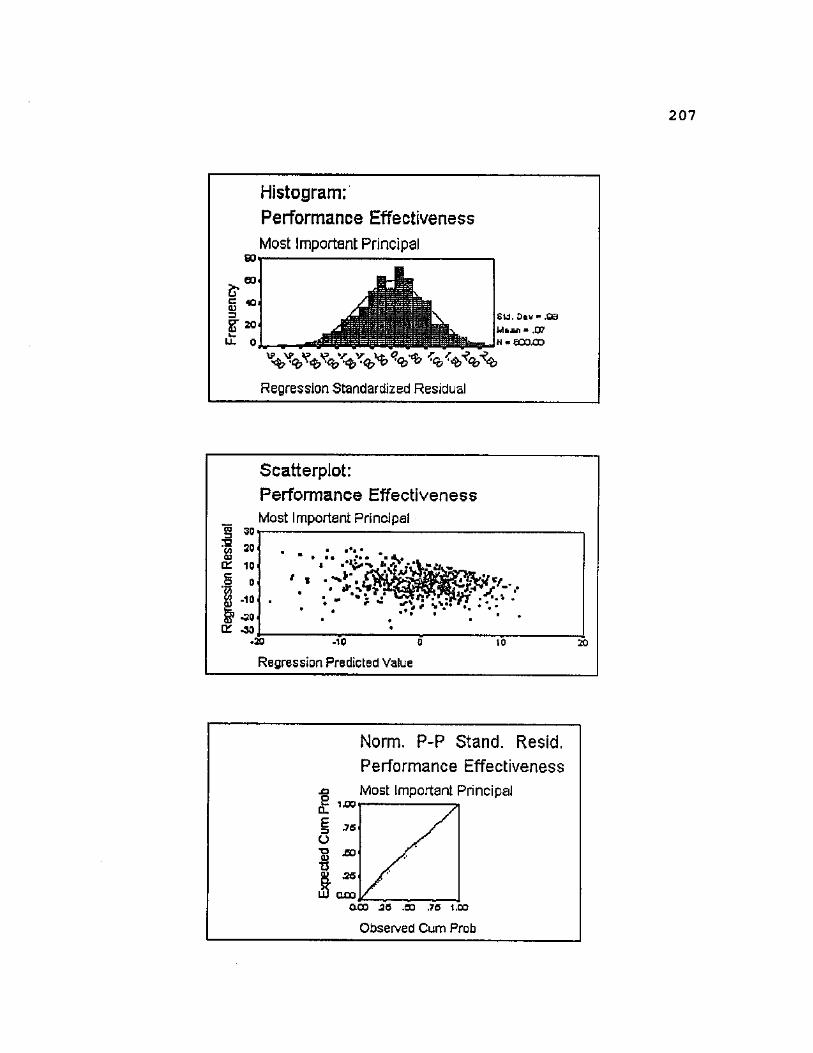
207
80
BO
Histogram: Performance Effectiveness Most Important Principal
I *° 120 it 0
6W. Dtv- .00 Miian » .07
000.00
Regression Standardized Residual
Scatterpiot: Performance Effectiveness
_ Most Important Principal § 30 M 20 03
q: 10 c .9 0 $ -10 5? -20
& -30
• « * i
• •• .
- -• ̂ • • ••• • * ,
-20 -10 0
Regression Predicted Value
10 20
Norm. P-P Stand. Resid. Performance Effectiveness Most Important Principal
O.GO M .00 .76 1.00
Observed Cum Prob

208
Histogram: Performance Satisfaction Most Important Principal
Std. Pcv-1.12 Mean »-.01 N - 650.00
Regression Standardized Residual
CO
3 & g "8 e
Scatterplot: Performance Satisfaction Most Important Principal
IV '10
a: .12 • 6 - 4 - 2
Regression Predicted Value
Norm. P-P Stand. Resid. Performance Satisfaction Most Important Principal
0.00 .25 .50 .75 IjOO Observed Cum Prob

209
BO
60
40
g-ao U. 0
Histogram: Overall Performance Most Important Principal
GJ Sto. Dev * .90 Mean ® .07 N • 537.00
Regression Standardized Residual
30
Scatterplot: Overall Performance Most Important Principal
0£ s 1 fe. £
20
10 0
-10
-20 -30
• • • •. - s
• • • , v • • • • ** •
-30 -20 -10
Regression Predicted Value 10 20
-S ixo
Norm. P-P Stand. Resid. Overall Performance Most Important Principal
§ 0.00 .25 £0 .75 1.00
Observed Cum Prob
BIBLIOGRAPHY
Alchian, Armen A. and Harold Demsetz (1972), "Production, Information Costs, and Economic Organization," The American Economic Review. 62 (December), 777-95.
Anderson, Erin M. (1984), "The Salesperson as Outside Agent or Employee: A Transaction Cost Analysis," Report No. 84-107, Cambridge, Ma: Marketing Science Institute.
(1985), "The Salesperson as Outside Agent or Employee: A Transaction Cost Analysis," Marketing Science, 4 (3), 234-254.
and Anne T. Coughlan (1987), "International Market Entry and Expansion via Independent or Integrated Channels of Distribution," Journal of Marketing. 51 (January), 71-82.
and Richard L. Oliver (1987), "Perspectives on Behavior-Based Versus Outcome-Based Salesforce Control Systems," Journal of Marketing. 51 (October), 76-88.
and Barton A. Weitz (1983), "A Framework for Analyzing Vertical Integration Issues in Marketing," working paper, 83-110, Marketing Science Institute, Cambridge, Ma.
and Barton A. Weitz (1992), "The Use of Pledges to Build and Sustain Commitment in Distribution Channels," Journal of Marketing Research. 29 (February), 18-34.
, Leonard M. Lodish, and Barton A. Weitz (1987), "Resource Allocation Behavior in Conventional Channels," Journal of Marketing Research. 24 (February), 85-97.
Anderson, Carl R., and Carl P. Zeithaml (1984), "Stage of the Product Life Cycle, Business Strategy, and Business Performance," Academy of Management Journal. 27 (1), 5-24.
Anderson, James C., and James A. Narus (1984), "A Model of the Distributor's Perspective of Distributor-Manufacturer Working Relationships Journal of Marketing. 48 (Fall), 62-74.
(1990), "A Model of Distributor Firm and Manufacturer Firm Working Partnerships," Journal of Marketing. 54 (January), 42-58.
210

211
Armstrong, J. Scott and Terry S. Overton (1977), "Estimating Nonresponse Bias in Mail Surveys," Journal of Marketing Research, 14 (August), 396-402.
Arrow, Kenneth J. (1965), Aspects of the Theory of Risk Bearing. Helsinki: Yrjo Jahnssonin Saatio: Helsinki, Finland; also, K.J. Arrow, "Essays in the Theory of Risk-Bearing," Chicago: Markham, 1971.
(1972), "Exposition of the Theory of Choice Under Uncertainty," in Decision and Organization, eds., C.B. McGuire and Roy Radner, American Elsevier Publishing Inc.: New York, 19-55.
Arthur, W. Brian (1991), "Designing Economic Agents that Act Like Human Agents: A Behavioral Approach to Bounded Rationality," AEA Papers and Proceedings. 81 (2), 353-59.
Avila, Ramon A., Edward F. Fern, and 0. Karl Mann (1988), "Unravelling Criteria for Assessing the Performance of Salespeople: A Causal Analysis," Journal of Personal Selling and Sales Management. 8 (May), 45-54.
Baiman, Stanley (1982), "Agency Research in Managerial Accounting: A Survey," Journal of Accounting Literature. 1, 154-213.
Banerji, Shumeet, and Carol Simon (1991), "Franchising vs. Ownership: A Contracting Explanation," mimeo, Graduate School of Business, University of Chicago.
Barney, Jay B. (1990), "The Debate Between Traditional Management Theory and Organizational Economics: Substantive Differences or Intergroup Conflict?," Academy of Management Review. 15 (3), 382-93.
and William G. Ouchi (1986), Organizational Economics. San Francisco: Jossey-Bass Publishers.
Basu, Amiya K., Rajiv Lai, V. Srinivasan, and Richard Staelin (1985), "Salesforce Compensation Plans: An Agency Theoretic Perspective," Marketing Science. 4 (4), 267-91.
Bellizzi, Joseph A. and Christine Glacken (1986), "Building a More Successful Rep Organization," Industrial Marketing Management. 15, 207-13.
Behrman, Douglas N., and William D. Perreault (1982), "Measuring the Performance of Industrial Salespersons," Journal of Business Research. 10, 355-70.
Bergen, Mark E. and George John (1991), "Understanding the

212
Participation Rate Decision in Cooperative Advertising Plans," Working Paper #87, Marketing Technical Report and Reprint Series, Graduate School of Business, University of Chicago.
Shantanu Dutta, and Orville C. Walker, Jr. (1992), "Agency Relationships in Marketing: A Review of the Implications and Applications of Agency and Related Theories," Journal of Marketing. 56 (July), 1-24.
Berle, Adolf A. Jr. and Gardiner C. Means (1932), The Modern Corporation and Private Property. New York: The MacMillan Company.
Berry, William D. and Stanley Feldman (1985), Multiple Regression in Practice. Beverly Hills Ca.: Sage Publications, Inc.
Brickley, James A. and Frederick H. Dark (1987), "The Choice of Organizational Form: The Case of Franchising," Journal of Financial Economics. 18 (June), 401-20.
Bobrow, Edwin E. (1982), "Is the Independent Sales Agent for You," Management Aids, MA 4.005, Small Business Administration, Washington, D.C.
_ (1991), "Reps and Recognition: Understanding What Motivates," Sales and Marketing Management. September, 82-6.
Brown, James R. (1979), "Channel Cooperation: Its Relationship to Channel Performance," In: Contemporary Issues in Marketing Channels. Robert F. Lusch and Paul H. Zinszer eds., University of Oklahoma Press., 87-101.
Burke, Marian C. (1984), "Strategic Choice and Marketing Managers: An Examination of Business-Level Marketing Objectives," Journal of Marketing Research. 21 (November), 345-59.
Bush, Robert P., Alan J. Bush, David J. Ortinau, and Joseph F. Hair, Jr. (1990), "Developing A Behavior-Based Scale to Assess Retail Salesperson Performance," Journal of Retailing. 66 (1), 119-36.
Castleberry, Stephen B. and John F. Tanner, Jr. (1986), "The Manager-Salesperson Relationship: An Exploratory Examination of the Vertical-Dyad Linkage Model," Journal of Personal Selling and Sales Management. 6 (November), 29-37.
Chandler, Alfred D., Jr. (1962), Strategy and Structure:

213
Chapters in the History of the Industrial Enterprise. Cambridge, Ma.: The M.I.T. Press.
Child, John (1975), "Managerial and Organizational Factors Associated with Company Performance Part II. A Contingency Analysis," The Journal of Management Studies. February, 12-27.
Childers, Terry L., Alan J. Dubinsky, and Steven J. Skinner (1990), "Leadership Substitutes as Moderators of Sales Supervisory Behavior," Journal of Business Research. 21, 363-82.
Churchill, Gilbert A. Jr. (1979), "A Paradigm for Developing Better Measures of Marketing Constructs," Journal of Marketing Research. 16 (February), 64-73.
(1987), Marketing Research; Methodological Foundations. 4th ed., Chicago: The Dryden Press; Holt, Reinhart, Winston Co.
(1992), "Better Measurement Practices are Critical to Better Understanding of Sales Management Issues," Journal of Personal Selling & Sales Management. 12(2)(Spring), 73-80.
Churchill, Gilbert A. Jr., Neil M. Ford, and Orville C. Walker, Jr. (1985), Sales Force Management: Planning. Implementation, and Control. Richard D. Irwin Inc., Homewood, Illinois.
/ / and (1976) , "Organizational Climate and Job Satisfaction in the Salesforce," Journal of Marketing Research. 13 (November), 323-32.
/ ^ , and (1979) , "Personal Characteristics of Salespeople and the Attractiveness of Alternative Rewards," Journal of Business Research. 7, 25-50.
t , Steven W. Hartley, and Orville C. Walker Jr. (1985), "The Determinants of Salesperson Performance: A Meta-Analysis," Journal of Marketing Research. 22 (May), 103-18.
Coase, R. H. (1937), "The Nature of the Firm," Economica. 4 (November), 386-405.
Cohen, Jacob, and Patricia Cohen (1983), Applied Multiple Regression/Correlation Analysis for the Behavioral Sciences. 2nd ed., Lawrence Erlbaum Associates: Hillsdale, NJ.

214
Coughlan, Anne T., and Subrata K. Sen (1989), "Salesforce Compensation: Theory and Managerial Implications," Marketing Science. 8 (4), 324-42.
Crocker, Keith J. and Arthur Snow (1992), "The Social Value of Hidden Information in Adverse Selection Economies," Journal of Public Economics. 48, 317-47.
Dant, Shirish P., and David T. Wilson (1990), "The Role of Agent Performance in Dependence Balancing in Principal-Agent Dyad," IBSM Report 10-1990, Institute for the Study of Business Markets, Pennsylvania State University, University Park, PA.
Day, George S. and Saul Klein (1987), "Cooperative Behavior in Vertical Markets: The Influence of Transaction Costs and Competitive Strategies," in Review of Marketing. Michael J. Houston ed. American Marketing Association: Chicago, 111.
Dearden, James A. and Gary L. Lilien (1990), "On Optimal Salesforce Compensation in the Presence of Production Learning Effects," International Journal of Research in Marketing. 7, 179-88.
Dess, Gregory G., and Peter S. Davis (1984), "Porter's (1980) Generic Strategies as Determinants of Strategic Group Membership and Organizational Performance," Academy of Management Journal. 27 (3), 467-88.
Diamond, P. A. and J. E. Stiglitz (1974), "Increases in Risk and in Risk Aversion," Journal of Economic Theory. 8, 337-60.
Dickson, John W. (1981), "Participation as a Means of Organizational Control," Journal of Management Studies. 18 (2), 159-76.
Donaldson, Lex (1990), "The Ethereal Hand: Organizational Economics and Organizational Theory," Academy of Management Review. 15 (3), 369-81.
(1990), "A Rational Basis for Criticisms of Organizational Economics: A Reply to Barney," Academy of Management Review. 15 (3), 394-401.
DuBois, Lois C. and Roger H. Grace (1987), "The Care and Feeding of Manufacturers' Reps," Business Marketing. December, 62-9.
Dwyer, F. Robert, Paul H. Schurr, and Sejo Oh (1987),

215
"Developing Buyer-Seller Relationships," Journal of Marketing. 51 (April), 11-27.
Eisenhardt, Kathleen M. (1982), "Organizational Control From the Perspective of Agency Theory: A Field Setting Example," Unpublished dissertation, Graduate School of Business, Stanford University.
(1985), "Control: Organizational and Economic Approaches," Management Science. 31 (2), 134-49.
(1989), "Agency Theory: An Assessment and Review," Management Review. 14 (1), 57-74.
El-Ansary, Adel I., and Louis W. Stern (1972), "Power Measurement in the Distribution Channel," Journal of Marketing Research. 9 (February), 47-52.
Eliashberg, Jehoshua, and Donald A. Michie (1984), "Multiple Business Goals Sets as Determinants of Marketing Channel Conflict: An Empirical Study," Journal of Marketing Research. 21 (February), 75-88.
Emerson, Richard M. (1962), "Power-Dependence Relations," American Sociological Review. 27 (February), 31-41.
Evan, William M. (1969) "Toward a Theory of Inter Organizational Relations," in Distribution Channels: Behavioral Dimensions. Louis Stern, ed. Houghton-Mifflin Co., Boston., 73-88.
Faria, A. J. and John R. Dickinson (1992), "Mail Survey Response, Speed, and Cost," Industrial Marketing Management. 21, 51-60.
Fields, Gene E. (1985), "A Matter of Trust," Sales and Marketing Management. March, 69.
Flamholtz, Eric G. (1979), "Organizational Control Systems as a Managerial Tool," California Management Review. 22 (2), 50-9.
T.K. Das, and Anne S. Tsui (1985), "Toward an Integrative Framework of Organizational Control," Accounting. Organizations and Society. 10 (1), 35-50.
Frazier, Gary L. (1983), "Interorganizational Exchange Behavior in Marketing Channels: A Broadened Perspective," Journal of Marketing. 47 (Fall), 68-78.
(1990), "The Design and Management of Channels of

216
Distribution," in The Interface of Marketing and Strategy, ed. George Day, Barton A. Weitz, and Robin Wensley. JAI Press Inc: Greenwich, CT. 255-304.
James D. Gill, and Sudhir H. Kale (1989), "Dealer Dependence Levels and Reciprocal Actions in a Channel of Distribution in a Developing Country," Journal of Marketing. 53 (January), 50-69.
and John 0. Summers (1986), "Perceptions of Interfirm Power and Its Use Within a Franchise Channel of Distribution," Journal of Marketing Research. 23 (May), 169-76.
Gaski, John, and John Nevin (1985), "The Differential Effects of Exercised and Unexercised Power Sources in a Marketing Channel," Journal of Marketing Research. 22 (May), 130-42.
Govindarajan, Vijay (1986), "Decentralization, Strategy, and Effectiveness of Strategic Business Units in Multi-Business Organizations," Academy of Management Review. 11 (4), 844-56.
(1988), "A Contingency Approach to Strategy Implementation at the Business-Unit Level: Integrating Administrative Mechanisms with Strategy," Academy of Management Journal. 31(4), 828-53.
and Gupta (1985), "Linking Control Systems to Business Unit Strategy: Impact on Performance," Accounting. Organizations and Society. 10 (1), 51-66.
and Joseph Fisher (1990), "Strategy, Control Systems, and Resource Sharing: Effects on Business-Unit Performance," Academy of Management Journal. 33 (2), 259-85.
Griesinger, Donald W. (1990), "The Human Side of Economic Management," Academy of Management Review. 15 (3), 478-99.
Grinyer, Peter H., Masoud Yasai-Ardekani, and Shawki A1 -Bazzaz (1980), "Strategy, Structure, the Environment, and Financial Performance in 48 United Kingdom Companies," Academy of Management Journal. 23 (2), 193-220.
Gupta, Anil K. (1986), Matching Managers to Strategies: Point and Counterpoint," Human Resource Management. 25 (2), 215-34.
, and Vijay Govindarajan (1984), "Business Unit

217
Strategy, Managerial Characteristics, and Business Unit Effectiveness at Strategy Implementation," Academy of Management Journal. 27 (1), 25-41.
and (1986), "Resource Sharing Among SBUs: Strategic Antecedents and Administrative Implications," Academy of Management Journal. 29 (4), 695-714.
Harris, Milton and Artur Raviv (1979), "Optimal Incentive Contracts with Imperfect Information," Journal of Economic Theory. 20, 231-59.
Hallen, Lars, Jan Johanson, and Nazeem Seyed-Mohamed (1991), "Interfirm Adaption in Business Relationships," Journal of Marketing. 55 (April), 29-37.
Heide, Jan B. and George John (1988), "The Role of Dependence Balancing in Safe Guarding Transaction-Specific Assets in Conventional Channels," Journal of Marketing. 52 (January), 20-35.
(1990), "Alliances in Industrial Purchasing: The Determinants of Joint Action in Buyer-Supplier Relationships," Journal of Marketing Research. 27 (February), 24-36.
(1992), "Do Norms Matter in Marketing Relationships?" Journal of Marketing. 56 (April), 32-44.
Hill, Charles W.L. and Thomas M. Jones (1992), "Stakeholder -Agency Theory," Journal of Management Studies. 29 (2), 131-54.
Hitchcock, Earl (1984), "What Marketers Love About Their Manufacturers' Reps," Sales and Marketing Management. September, 60-5.
Hofstede, Geert (1978), "The Poverty of Management Control Philosophy," Academy of Management Review. 3, 450-61.
Holstrom, Bengt (1979), "Moral Hazard and Observability," Bell Journal of Economics. 10 (Spring), 74-91.
House, Robert J., and Gary Dessler (1974), "The Path-Goal Theory of Leadership: Some Post-Hoc and A Priori Tests," in Contingency Approaches to Leadership. James G. Hunt and Lars L. Larson, eds. Carbondale, IL: Southern Illinois University Press.
Hunt, Shelby D., and John R. Nevin (1974), "Power in a Channel of Distribution: Sources and Consequences," Journal of Marketing Research. 11 (May), 186-93.

218
Jaeger, Alfred M. and B.R. Baliga (1985), "Control Systems and Strategic Adaptation: Lessons from the Japanese Experience," Strategic Management Journal. 6, 115-34.
Jaworski, Bernard J. (1988), "Toward a Theory of Marketing Control: Environmental Context, Control Types, and Consequences," Journal of Marketing. 52 (July), 23-39.
and Ajay K. Kohli (1991), "Supervisory Feedback: Alternative Types and Their Impact on Salespeople's Performance and Satisfaction," Journal of Marketing Research, 28 (May), 190-201.
and Deborah J. Maclnnis (1989), "Marketing Jobs and Management Controls: Toward a Framework," Journal of Marketing Research. 26 (November), 406-19.
and S. Mark Young (1992), "Dysfunctional Behavior and Management Control: An Empirical Study of Marketing Managers," Accounting. Organizations and Society. 17 (1), 17-35.
, Vlasis Stathakopoulos, and H. Shanker Krishnan (1993), "Control Combinations in Marketing: Conceptual Framework and Empirical Evidence," Journal of Marketing. 57 (January), 57-69.
Jensen, Michael C. and William H. Meckling (1976), "Theory of the Firm: Managerial Behavior, Agency Costs and Ownership Structure," Journal of Financial Economics. 3 (July), 305-60.
and Clifford W. Smith Jr. (1985), "Stockholder, Manager, and Creditor Interests: Applications of Agency Theory," In Recent Advances in Corporate Finances, eds. Edward I. Altman and Marti G. Subrahmanyam, Richard D. Irwin:Homewood, 111., 93-131.
Jobber, David (1986), "Improving Response Rates in Industrial Mail Surveys," Industrial Marketing Management. 15, 183-95.
John, George (1984), "An Empirical Investigation of Some Antecedents of Opportunism in a Marketing Channel," Journal of Marketing Research. 21 (August), 278-89.
and Barton A. Weitz (1988), "Forward Integration into Distribution: An Empirical Test of Transaction Cost Analysis," Journal of Law. Economics, and Organization. 4 (2), 337-55.
and (1989), "Salesforce Compensation: An

219
Empirical Investigation of Factors Related to Use of salary Versus Incentive Compensation," Journal of Marketing Research. 26 (February), 1-14.
Allen M. Weiss, and Barton A. Weitz (1987), "An Organizational Coordination Model of Salesforce Compensation Plans: Theoretical Analysis and Empirical Test," Journal of Law. Economics, and Organization. 3 (2), 373-95.
Joskow, Paul (1988), "Asset Specificity and the Structure of Vertical Relationships: Empirical Evidence," Journal of Law. Economics and Organization. 4 (Spring), 95-117.
Kale, Sudhir H. (1986), "Dealer Perceptions' of Manufacturer Power and Influence Strategies in a Developing Country," Journal of Marketing Research. 23 (November), 387-93.
Karimabady, H., and P.J. Brunn (1991), "Postal Surveys to Small Manufacturers," Industrial Marketing Management. 20, 319-26.
Keats, Barbara W., and Michael A. Hitt (1988), "A Causal Model of Linkages Among Environmental Dimensions, Macro Organizational Characteristics, and Performance," Academy of Management Journal. 31 (3), 570-98.
Kerlinger, Fred N. (1986), Foundations of Behavioral Research. 3rd ed., Fort Worth: Holt, Rinehart and Winston, Inc.
Kidder, Louise H., Charles M. Judd, and Eliot R. Smith (1986), Research Methods in Social Relations. New York: Holt, Rinehart, and Winston, Inc.
Kim, Linsu and Yooncheol Lim (1988), "Environment, Generic Strategies, and Performance in a Rapidly Developing Country: A Taxonomic Approach," Academy of Management Journal. 31(4), 802-27.
Klein, Benjamin, Robert G. Crawford, and Armen A. Alchian (1978), "Vertical Integration, Appropriable Rents, and the Competitive Process," Journal of Law and Economics. 21(October), 297-325.
and Keith B. Leffler (1981), "The Role of Market Forces in Assuring Contractual Performance," Journal of Political Economy. 89 (4), 615-41.
Klein, Saul, Gary L. Frazier, and Victor J. Roth (1990), "A

220
Transaction Cost Analysis Model of Channel Integration in International Markets," Journal of Marketing Research. 27 (May), 196-208.
Knight, Frank H. (1921), Risk. Uncertainty and Profit. Houghton Mifflin Company: Boston, MA.
Koch, Peter F. (1980), "Working With Reps: Ten Ways to Insure Success," Journal of Applied Management. May/June, 22-5.
Kohli, Ajay K. (1989), "Effects of Supervisory Behavior: The Role of Individual Differences Among Salespeople," Journal of Marketing. 53 (October), 40-50.
Kvanli, Alan H., C. Stephen Guynes, and Robert J. Pavur (1989), Introduction to Business Statistics: A Computer Integrated Approach. 2nd Ed., New York: West Publishing Co.
Lai, Rajiv (1990), "Improving Channel Coordination Through Franchising," Marketing Science. 9 (4), 299-318.
and V. Srinivasan (1988), "Salesforce Compensation Plans: A Dynamic Perspective," working paper, Graduate School of Business, Stanford University.
and Richard Staelin (1986), "Salesforce Compensation Plans in Environments with Asymmetric Information," Marketing Science. 5 (3), 179-98.
, Donald Outland, and Richard Staelin (1990), "Salesforce Compensation Plans: An Empirical Test of the Agency Theory Framework," working paper, Graduate School of Business, Stanford University.
Lawler, E.E., III (1973), Motivation in Work Organizations. Monterey California: Porter/Cole, Inc.
Levinthal, Daniel (1988), "A Survey of Agency Models of Organ i z at ions," Journal of Economic Behavior and Organization. 9, 153-85.
Levy, David T. (1985), "The Transaction Cost Approach to Vertical Integration: An Empirical Examination," The Review of Economics and Statistics. 67 (August), 438-45.
Lipman, Barton L. (1991), "How to Decide How to Decide How to...: Modeling Limited Rationality," Econometrica. 59 (4), 1105-25.
London, Sandra J. and Curt J. Dommeyer (1990), "Increasing

221
Response to Industrial Mail Surveys," Industrial Marketing Management. 19, 235-41.
Mahajan, Jayashree, Gilbert A. Churchill, Jr., Neil M. Ford, and Orville C. Walker Jr.(1984), "A Comparison of the Impact of Organizational Climate on the Job Satisfaction of Manufacturers* Agents and Company Salespeople: An Exploratory Study," Journal of Personal Selling & Sales Management. May, 1-10.
March, James G. and A. Simon (1958), Organizations. New York: John Wiley & Sons, Inc.
and Zur Shapira (1987), "Managerial Perspectives on Risk and Risk Taking," Management Science. 33 (11), 1404-18.
Mathewson, George F. and Ralph A. Winter (1984), "An Economic Theory of Vertical Restraints," The Rand Journal of Economics. 15 (Spring), 27-38.
and (1985), "The Economics of Franchise Contracts," Journal of Law and Economics. 28 (October), 503-26.
and (1986), "The Economics of Vertical Restraints in Distribution," New Developments in the Analysis of Market Structures. Joseph E. Stiglitz and G. Frank Mathewson, eds., Cambridge, MA: MIT Press.
Merchant, Kenneth A. (1985), Control in Business Organizations. Boston: Pitman Publishing Co.
(1988), "Progressing Toward a Theory of Marketing Control: A Comment," Journal of Marketing. 52 (July), 40-44.
Miles, R.E., and C.C. Snow (1978), Organization Strategy. Structure, and Process. New York: McGraw-Hill Book Co.
Milgrom, Paul and John Roberts (1982), "Predation, Reputation and Entry Deterrence," Journal of Economic Theory. 27 (August), 280-312.
Miller, Danny (1988), Relating Porter's Business Strategies to Environment and Structure: Analysis and Performance Implications," Academy of Management Journal. 31 (2), 280-308.
Mohr, Jakki, and John R. Nevin (1990), "Communication Strategies in Marketing channels: A Theoretical Perspective," Journal of Marketing. 54 (October), 36-51.
222
Monteverde, Kirk and David J. Teece (1982), "Appropriable Rents and Quasi-Vertical Integration," Journal of Law & Economics. 25 (October), 321-328.
Moorthy, K. Sridhar (1987), "Managing Channel Profits: Comment," Marketing Science. 6 (4), 375-9.
Murray, Alan I. (1988), "A Contingency View of Porter's •Generic Strategies'" Academy of Management Review. 13(3), 390-400.
Nelson, Phillip (1974), "Advertising as Information," Journal of Political Economy. 82 (July/August), 729-54.
Noordewier, Thomas G., George John, and John R. Nevin (1990), "Performance Outcomes of Purchasing Arrangements in Industrial Buyer-Vendor Relationships," Journal of Marketing. 54 (October), 80-93.
Norton, Seth W. (1988), "An Empirical Look at Franchising as an Organizational Form," Journal of Business. 61 (2), 197-218.
Norusis, Marija J. (1988), SPSS-X Advanced Statistics Guide. 2nd Ed., Chicago, II: SPSS Inc.
Novick, Harold J. (1982), "The Case for 'Reps' vs. Direct Selling Can Reps Do it Better?" Industrial Marketing. 67 (March), 92-7.
(1988), Selling Through Independent Reps. New York: American Management Association.
Nunnally, Jum C. (1978), Psychometric Theory. 3rd ed., New York: McGraw-Hill Publishing Co.
Ofir, Chezy and Andre Khuri (1986), "Multicollinearity in Marketing Models: Diagnostics and Remedial Measures," International Journal of Research in Marketing. 3, 181-205.
O'Connell, William A. and William Keenan Jr. (1990), "The Shape of Things to Come," Sales and Marketing Management. January, 37-41.
Oliver, Richard L. and Barton A. Weitz (1991), "The Effects of Risk Preference, Uncertainty and Incentive Compensation on Salesperson Motivation," Report Number 91-104. Cambridge, MA: Marketing Science Institute (February).
Ouchi, William G. (1977), "The Relationship Between

223
Organizational Structure and Organizational Control," Administrative Science Quarterly. 22 (March), 95-113.
(1979), "A Conceptual Framework for the Design of Organizational Control Mechanisms," Management Science. 25 (9), 833-48.
(1980), "Markets, Bureaucracies, and Clans," Administrative Science Quarterly. 25 (March), 129-41.
and Mary Ann Maguire (1975), "Organizational Control: Two Functions," Administrative Science Quarterly. 20 (December), 559-69.
Peter, John J. and Gilbert A. Churchill (1986), "Relationships Among Research Design Choices and Psychometric Properties of rating Scales: A Meta-Analysis," Journal of Marketing Research. 23 (February), 1-10.
Pfeffer, Jeffrey (1976), "Beyond Management and the Worker: The Institutional Function of Management," Academy of Management Review. April, 36-46.
Phillips, Lynn W. (1982), "Explaining Control Losses in Corporate Marketing Channels: An Organizational Analysis," Journal of Marketing Research. 19 (November), 525-49.
Porter, Michael E. (1980), Competitive Strategy: Technigues for Analyzing Industries and Competitors. New York: Free Press.
(1985), Competitive Advantage. New York: Free Press.
Powers, Thomas L. (1991), Modern Business Marketing. St Paul, MN: West Publishing Company.
Puto, Christopher P., Wesley E. Patton III, and Ronald H. King (1985), "Risk Handling Strategies in Industrial Vendor Selection Decisions," Journal of Marketing. 49 (Winter), 89-98.
Radner, Roy (1972), "Normative Theory of Individual Decision: An Introduction," in Decision and Organization, eds., C.B. McQuire and Roy Radner, New York NY: American Elsevier Publishing Company, Inc., 2-18.
Rao, Akshay R. and Mark E. Bergen (1991), "Price Premium Variations as a Consequence of Buyers' Lack of Information," working paper #88, Marketing Technical

224
Report and Reprint Series, Graduate School of Business, University of Chicago.
and Kent B. Monroe (1991), "The Causes and Consequences of Price Premiums: Linking Product Quality and Profitability," working paper, Carlson School of Management, University of Minnesota
Rey, Patrick and Jean Tirole (1986), "The Logic of Vertical Restraints," The American Economic Review. 76 (5), 921-39.
Ross, Stephen A. (1973), "The Economic Theory of Agency: The Principal's Problem," American Economic Association. 63 (2), 134-9.
Shavell, Steven (1979), "Risk Sharing and Incentives in the Principal and Agent Relationship," The Bell Journal of Economics. 55-73
Sibley, Stanley D., and R. Kenneth Teas (1979), "The Manufacturer's Agent in Industrial Distribution," Industrial Marketing Management. 8, 286-92.
Simon, Herbert A. (1957), Models of Man. New York: John Wiley & Sons, Inc.
(1972), "Theories of Bounded Rationality," in Decision and Organization, eds. C.B. McQuire and Roy Radner, New York: American Elsevier Publishing Company, Inc., 161-176.
Snell, Scott A. (1992), "Control Theory in Strategic Human Resource Management: The Mediating Effect of Administrative Information," Academy of Management Journal. 35 (2), 292-327.
Spence, Michael and Richard Zeckhauser (1971), "Insurance, Information, and Individual Action," American Economic Association. 380-91.
Tannenbaum, Arnold S. (1968), Control in Organizations. New York: McGraw Hill Book Company.
Tanner, John F. Jr. and Stephen B. Castleberry (1990), "Vertical Exchange Quality and Performance: Studying the
Role of the Sales Manager," Journal of Personal Selling and Sales Management. 10 (Spring), 17-27.
Taylor, Ronald K. (1990), "Manufacturers' Representatives; The March to Professionalism," Journal of Personal Selling & Sales Management. 10 (Winter), 53-5.
225
Taylor, Thayer C. (1981),"A Raging 'Rep' identic, " Sales and Marketing Management. June 8, 33-5.
Teas, R. Kenneth (1981), "A Test of a Model of Department Store Salespeople's Job Satisfaction," Journal of Retailing. 57 (1), 3-25.
(1983), "Supervisory Behavior, Role Stress, and the Job Satisfaction of Industrial Salespeople," Journal of Marketing Research. 20 (February), 84-91.
, and James C. McElroy, (1986), "Causal Attributions and Expectancy Estimates: A Framework for Understanding the Dynamics of Salesforce Motivation," Journal of Marketing. 50 (January), 75-86.
Thompson, James D. (1967), Organizations in Action. New York: McGraw-Hill Book Company.
Thornton, Daniel B. (1984), "A Look at Agency Theory For The Novice — Part 1," CA Magazine. September, 90-97.
Turcotte, William E. (1974), "Control Systems, Performance, and Satisfaction in Two State Agencies," Administrative Sciences Quarterly. 60-73.
Tyagi, Pradeep K. (1985), "Organizational Climate, Inequities, and Attractiveness of Salesperson Rewards," Journal of Personal Selling and Sales Management. November, 31-7.
(1985), "Relative Importance of Key Job Dimensions and Leadership Behaviors in Motivating Salesperson Work Performance," Journal of Marketing. 49 (Summer), 76-86.
Vroom, V.H. (1964), Work and Motivation. New York: John Wiley and Sons, Inc.
Washburn, Stewart A. (1983), "How to Find the Manufacturers' Rep Who'll Really Work for You," Business Marketing. June, 82-9.
Walker, Orville C. Jr., Gilbert A. Churchill Jr., and Neil M. Ford (1977), "Motivation and Performance in Industrial Selling: Present Knowledge and Needed Research," Journal of Marketing Research. 14 (May), 156-68.
Walker, Bruce J., Wayne Kirchmann, and Jeffrey S. Conant (1987), "A Method to Improve Response to Industrial Mail Surveys," Industrial Marketing Management. 16, 305-14.
Webster (1972), The New American Dictionary, eds. Albert and

226
Loy Morehead, Chicago: New American Library, Times Mirror.
Weitz, Barton A. (1981), "Effectiveness in Sales Interactions: A Contingency Framework," Journal of Marketing. 45 (Winter), 85-103.
White, Roderick E., and Richard G. Hamermesh (1981), "Toward a Model of Business Unit Performance: An Integrative Approach," Academy of Management Review. 6 (2), 213-23.
Williamson, Oliver E. (1970), Corporate Control and Business Behavior: An Inguirv into the Effects of Organizational Form on Enterprise Behavior. Englewood Cliffs NJ: Prentice-Hall Inc.
(1975), Markets and Hierarchies: Analysis and Antitrust Implications. New York, NY: The Free Press.
(1979), "Transaction-Cost Economics: The Governance of Contractual Relations," Journal of Law and Economics. 22 (October), 233-62.
(1981), "The Modern Corporation: Origins, Evolution, Attributes," Journal of Economic Literature. 19 (December), 1537-68.
(1983), "Credible Commitments: Using Hostages to Support Exchange," American Economic Review. 73 (September), 519-540.
(1985), The Economic Institutions of Capitalism: Firms. Markets. Relational Contracting. New York: The Free Press.
(1991), "The Logic of Economic Organization," in The Nature of the Firm: Origins. Evolution, and Development. Oliver E. Williamson and Sidney G. Winter, eds., New York: Oxford University Press, 90-116.
, and William G. Ouchi (1981), "The Markets and Hierarchies and Visible Hand Perspectives," in Perspectives on Organizational Design and Behavior, Andrew H. Van De Ven and William F. Joyce, eds., New York, NY: John Wiley and Sons, 347-70.
Yaari, Menahem E. (1969), "Some Remarks on Measures of Risk-Aversion and on their Uses," Journal of Economic Theory. I, 315-29.
Young, Louise C. and Ian F. Wilkinson (1989), "The Role of Trust and Co-operation in Marketing Channels: A Preliminary Study," European Journal of Marketing. 23 (2),

227
109-22.


![Compact performance − smart cubic - festo.com€¦[740 311] Compact performance − smart cubic. Contents and general instructions Festo P.BE−CPVSC−EN en 0809e I](https://img.pdfslide.us/doc/110x75/5b81d8f87f8b9ae47b8d34d5/compact-performance-smart-cubic-festocom-740-311-compact-performance-.jpg)