Embed Size (px)
Citation preview
© Nature Publishing Group1984
~~~8------------------------------------LETTERSTONATURE----------------~NA~T~U~R~E~V~O~L.~3~lO~9~AU~G~U~S~T~1~984
E ::: 5 i " ,. i '" " ~ 0
2
o
A/Ao
o
o TA06 o Ce-5 x Ce-8 • Ce-13
Fig.3 The venical profiles of bottom excess 227 Ac (or 227Th). The values were calculated by subtracting 231Pa activity measured, or if not measured, assumed, based on the profile shown in Fig. 2 from 227 Ac (or 227Th) activity, and represented as the fraction of the extrapolated activity at the sea floor. The same symbols are used as for the stations in Fig. 2. Two model curves (see text) are
also shown.
near bottom 222Rn profiles, - 30 cm2 s -I from 228Th e28Ra) profiles for the bottom 2 km, and -I cm2
S-I from 14C between I and 4 km in the North Pacific. Sarmiento et al. 13 have demonstrated that the apparent diffusion coefficient is inversely correlated to the vertical density gradient. For waters below 3 km in the western North Pacific, the vertical gradient of potential density, although small, increases with the distance from the bottom. Considering these, as exponentially decreasing formula, D = Do exp (-{3z) was assumed for the vertical variation. Then the solution of the model is given by
A= Ao exp ((3:) [ KI(~~' exp (~z)) / KI(~~)] where KI is the modified Bessel function of the second kind of first order. Figure 3 shows the best fit curve where D = 30 exp (-1O-~ z)(z in cm). The curve appears to be a better fit than when D is constant and also to be more consistent with the trend of variation of D estimated from other tracer distributions such as 222Rn, 228Ra and 14C.
Despite the consistency of the vertical model, the effect of horizontal transport was implicitly ignored in the calculation. However, some oceanographers l4
,1' believe that the lateral mixing coupled with slope boundary turbulent diffusion is an important control on the distribution of chemical properties in the deep ocean. Indeed, the similarity of the vertical profiles of 227 Ac, regardless of the difference of locations (Fig. 2), is not inconsistent with the idea, For more detailed arguments a threedimensional data set, as well as information on the geographical variations of 227 Ac flux from sediments, are needed. In any case, simultaneous use of 227 Ac and 228Ra as tracers will provide one of the most useful means of resolving the problem regarding the role of diapycnal and isopycnal mixing in the deep ocean.
I thank Dr Y. Horibe for encouragement and T. Nakanishi for useful comments on the analytical method. This work was partially supported by the Ministry of Education, Culture and Science, Japan, under grant no. 65117009 to the University of Tokyo.
Received 6 February; accepted 4 June 1984.
I. Broecker, A. S. in Symp. un Diffusion in Oceans and Fr<sh Warm (ed. (chiye, T.) 116-145 (Lamont.Doheny Geological Observatory, Palisades, 1965).
2. Moore, W. S. & Sackett, W. M. J. geophys. Res. 69, 5401-5405 (1964). 3. Horibe, Y. (ed.) Preliminary Report of the Hakuho Maru Cruise KH·80·2 and KH·82·1
(Ocean Research Institute, University of Tokyo, 1983).
4. Nozaki, Y. &. Horibe, Y. Earth planer. SeL Len. 6!5, 39-50 (1983). 5. Amin, B. S., Krishnaswami, S. & Somayajulu. B. l. K. Earth planet. Sc[ Lett. 21, 342-344
(1974). 6. Anderson, R. F. & Fleer, A. P. An"'yt. Chern. 54, 1142-1147 (1982). 7. Latimer, W. M. Oxidation Potentials 2nd cdn (Prentice Hall, New Jersey, 1952). 8. Klinkhammer, G., Elderfield, H. & Hudson, A. Nature 305, 185-188 (1983). 9. Cochran, J. K. thesis, Yale Univ. (1979).
10. Kaufman, A., Tri«, R. M. & Broecker, W. S. J. geophy,. Res. 78, 8827-8848 (1973). II. Li, Y. H., Feely H. W. & Toggwei1er, J. R. Deep Sea Res. 27, 545-555 (1980). 12. Nozaki, Y .• Tsubota, H. & Horibe, Y. Earth planer. Sci. Lerr. 54, 203-216 (1981). 13. Sarmiento, J. L., Feely, H. W., Moore, W. S., Bainbridge. A. E & Broecker, W. S. Earth
planet. Sci. Lerr. 32, 357-370 (1976) . 14. Armi, L. J. mar. Res. 37, 515-530 (1979). IS. Broecker, W. S. & Peng, T. H. Tracers in the Sea (Eldigio, Palisades, 1982).
Latitudinal dependency of geomagnetic polarity transition durations
Bradford M. Clement & Dennis V. Kent
Lamont-Doherty Geological Observatory and Depanment of Geological Sciences, Columbia University. Palisades, New York 10964. USA
Palaeomagnetic records of the Matuyama-Brunhes polarity transition were obtained from seven, low sedimentation rate, deepsea cores from the Pacific Ocean. The cores were taken near the 180° meridian and provide a latitudinal transect of transition records extending from 45.3° N to 33.4° S. Examination of these records suggests that low sedimentation rate cores may not be capable of recording the fine details of transitional field behaviour, but there are indications that these cores may, in fact, provide accurate records of the more general features of the reversal. Most notable of these features is that the duration of the transition is dependent on the site latitude, with durations at mid-latitudes being more than a factor of 2 longer than at equatorial latitudes.
Palaeomagnetic records of polarity transitions, particularly those of the Matuyama-Brunhes reversal, indicate that the field did not maintain a dipolar geometry during the reversal process 1,2. Higher-order symmetries, however, cannot be precisely defined because of the small number of detailed records and their poor geographical distribution,
There are inherent difficulties in obtaining an adequate data base because polarity reversals take a short time (geologically) to occur. Our approach to this problem has been to use microsampling techniques3
-5 which allow us to obtain detailed records
from deep-sea sediment cores which are characterized by low to moderate, yet uniform, sedimentation rates (0.5-6 cm kyr- I
).
This method greatly increases the possibility of obtaining a wide geographical distribution of records of the same reversal. The second advantage is that accumulation rates in cores are usually well determined and, therefore, it is possible to estimate rates and durations of processes recorded in the cores. A disadvantage is that there seem to be intrinsic problems in interpreting field behaviour from such low sedimentation rate cores4
• These problems relate to the scale at which homogeneous magnetizations exist in the sediment whereby resolution of field behaviour does not seem to be proportionately improved by finer scale sampling. Therefore, we believe that the interpretation of such records should be limited to gross features of polarity transitions, such as the duration of the transition.
The cores were selected on the basis of earlier magnetostratigraphical studies (ref. 6 and N. Opdyke, personal communication) to investigate the possible latitudinal dependency of trans ition features. Seven cores from the Pacific Ocean, mostly distributed along the 180· meridian, were studied in an effort to minimize possible longitudinal effects on the transitional field geometry. One core from the Atlantic Ocean (V30-45), however, was also included (Table I). In each ofthe cores the MatuyamaBrunhes reversal was sampled by sawing successive 4-5 mm slices from the dried, split half of the core. Each slice was subdivided to give three independent specimens per stratigraphical level for measurement using a two-axis cryogenic magnetometer. Pilot specimens from the cores were subjected
© Nature Publishing Group1984
NATURE VOL. 310 9 AUGUST 1984 LETIERSTO NATURE 489
Table 1 Boundaries, transition zone thickness, sedimentation rate and transition duration for each core
Brunhes-Matuyama transition zone Sedimentation Standard Sedimentation Transition
Top Bottom Thickness rate* error* ratet duration* Core Lat. Long. (cm) (cm) (cm) (cmkyr-1) (cmkyr-l) (cmkyr-l) (kyr)
RCI0-182 45.3rN 177.5° E 820.7 832.3 11.6 1.10 0.063 1.13 10.5 V20·108 45.27° N 180.86° E 791.4 800.5 9.1 I.ll O.oz5 1.09 8.2 V20·107 43.24°N 181.48° E 525.3 532.3 7.0 0.73 0.044 0.74 9.6 V20·104 37.18° N 181.90° E 611.6 617.8 6.2 0.79 0.01l 0.83 7.8 V30·45 6.18° N 340.44° E 622.3 624.8 2.3 0.53 0.020 0.722 4.3 RC15-21 1.33° N 227.41°E 83D.6 835.7 5.1 0.98 0.015 1.11 5.2 RC9-1\9 23.23° S 188.42° E 661.5 664.1 2.6 0.69 0.073 0.87 3.8 RC9·ll4 33.41 ° S 194.98° E 875.4 882.7 7.3 1.2 1.2 6.1
* Calculation based on the depths of the Brunhes and Jaramillo reversals. t Calculation with the origin included as a data point.
to progressive alternating field (a.f.) demagnetization studies at 2.S-S.0-mT increments up to 60 mT to identify the coercivity spectra of characteristic magnetization components. The remaining specimens were then demagnetized at the appropriate peak field level.
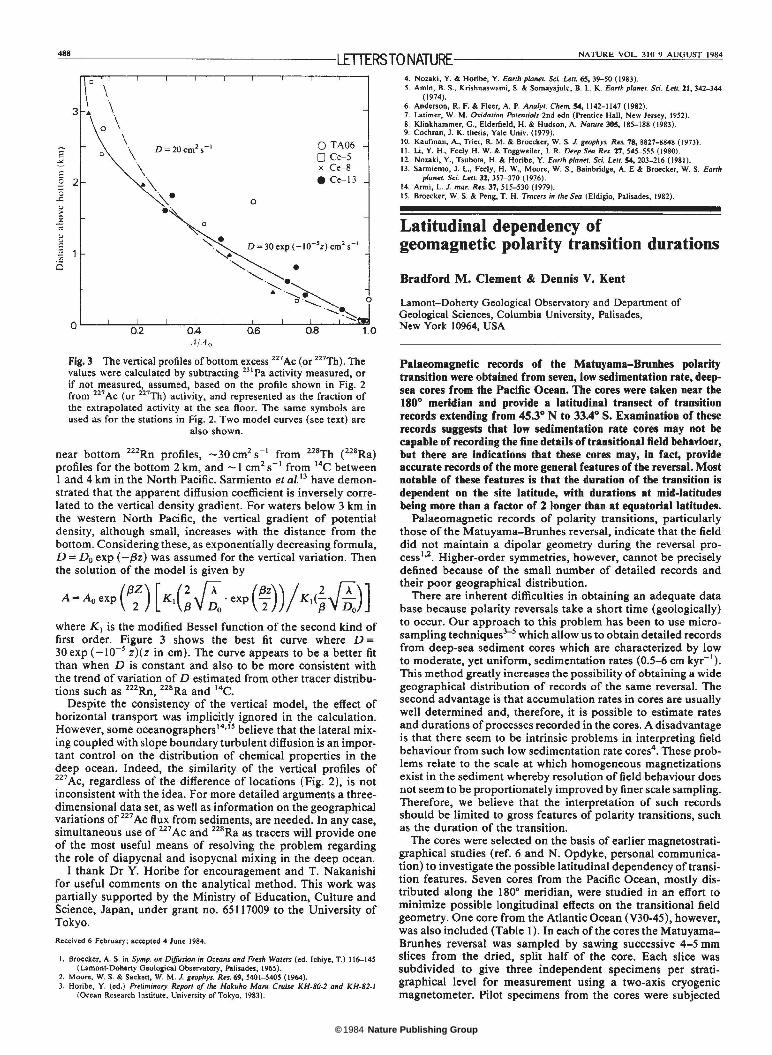
The results of blanket demagnetization at 10-20 mT produced records with inclinations in excellent agreement with the axial dipole field for the core site latitudes both above (normal) and below (reversed) the polarity transition zone. The internal consistency of the data and the agreement of the observed directions with axial dipole field values indicates that the sediment has been an accurate recorder of the geomagnetic field. The data are presented in Fig. I as virtual geomagnetic pole (VGP) latitude versus age (the ages were determined based on the sedimentation rates of the cores) to allow comparison of results from different site latitudes. As the cores were not oriented when taken, it was assumed that the mean declinations for intervals exhibiting normal (reversed) polarity inclinations were equal to 0° (I800). The entire declination record for each core was then
uniformly reoriented to reach the best agreement with this assumption. VGP positions were calculated from the unit-vector mean? of the three observed directions at each stratigraphical level.
The criteria which are used to define the boundaries of polarity transition zones have an important effect on the calculated thickness especially when dealing with detailed recordss. While defining the boundaries as the depths at which the VGP positions cross the ±60° or ±4S0 latitude2
,8 provides an objective definition, it is clear in many of these records that transitional behaviour is recorded above and below these boundaries. The problem of defining the depths at which the transition is first (last) recorded becomes one of distinguishing a transitional direction from the reversed (normal) direction. We have, therefore, defined the transition zones as including the depth levels at which the VGPs exceed the circular standard deviation? (c.s.d.) of the mean VGPs ofthe reversed and normal polarity zones. The boundaries defined in this manner and the resulting transition zone thickness for each core are listed in Table I.
RC9-114 RC9-119 RClS-21 V20-104 V20-107 V20-10S RClO-lS2
720
,..... .... 730 ;>.
~
'" 01)
<:
740
7S0
-90 90 -9'r"0_-r-_",,,90 -9rO_-,_,90.1-~,...:..0_--.-_.::...,9? -;-90'-----.-_.:.,90. -9r=0_--.-_:c.;90 -90 90
.' "
'It I , *' . , ,
t ,
i x' I ,
x . '" . , l x
\ x , , , x,. , x x , ~ ,
f I ~
, , -40° _200 _10° 0
x .. . x
" x , : ~ \ ~ " ~ , , x '--
Lat.
'" x
, , : ~
: .. ~ x x ,
IOU
\ x x I (
x x
x , : x. : ,
X
I I
1. . , 'x" r l
't ~ ,
x I x • x
20° 30° 40°
x",
::~ x :
x x
Fig. 1 VGP latitudes plotted against age for the seven cores. Each point represents the unit vetor mean of the three VGPs determined at each stratigraphicalleve!. The latitudes of the core site locations are indicated.
© Nature Publishing Group1984
-=.:490'-=-----------------------LETIERSTO NATURE _________ '-'.NA'-'.T"-'U'-'.R=Ec.....V-'-'OL. 310 9 AUGUST 1984
Time (Myr) 0.2 0.6 1.0 1.4
4
6 g ..c Q.
" 0 10
12 v.a 0..10->
14 v.J. o..~ -1'(' CJ'
16 Is,,;
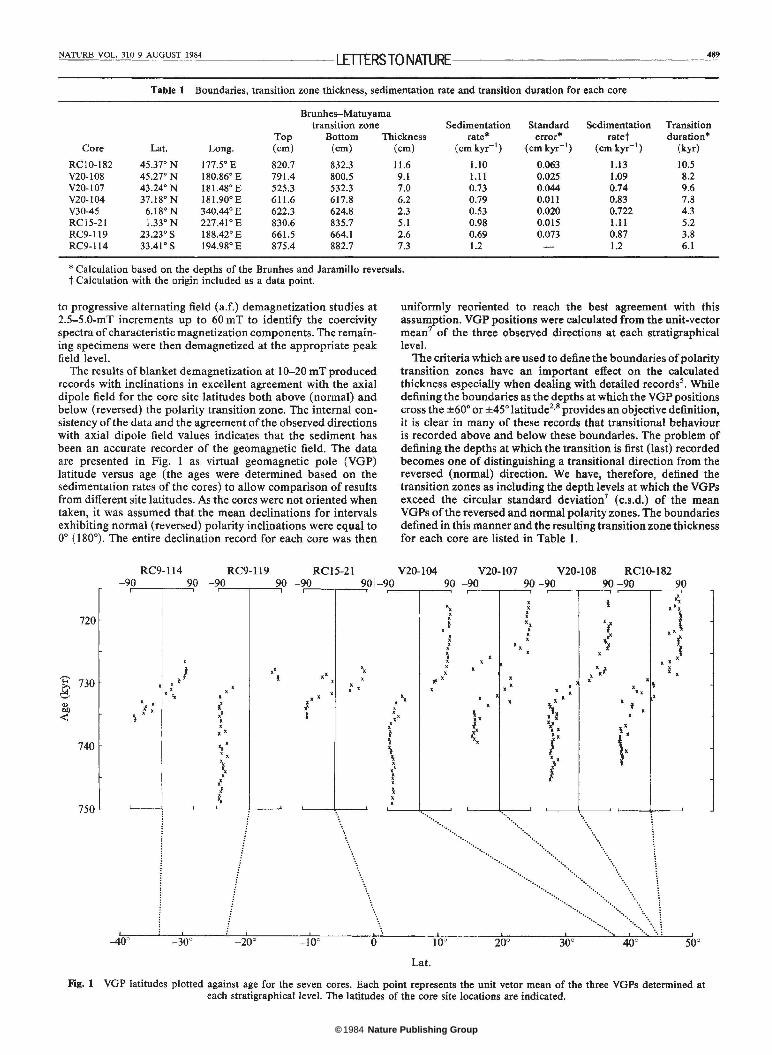
Fig. 2 Time-depth plot for the cores. The depths of the Brunhes, Jaramillo and Olduvai reversals are indicated.
!>. ~ c .g 1: ;:I
0
12
10
6
4
2
OL-~40~~-_~20~~~O-~-720~~-4~O~
La!.
Fig. 3 Durations calculated for each core, plotted as solid circles versus core site latitude. The duration obtained from the Matuyama-Brunhes transition in V30-4S is plotted as an open
circle.
18 a
16 /./-------_._._._-------......... "
14 / \ / \
~ 12 / \
~ 10 i \ ~ . \
6
La!.
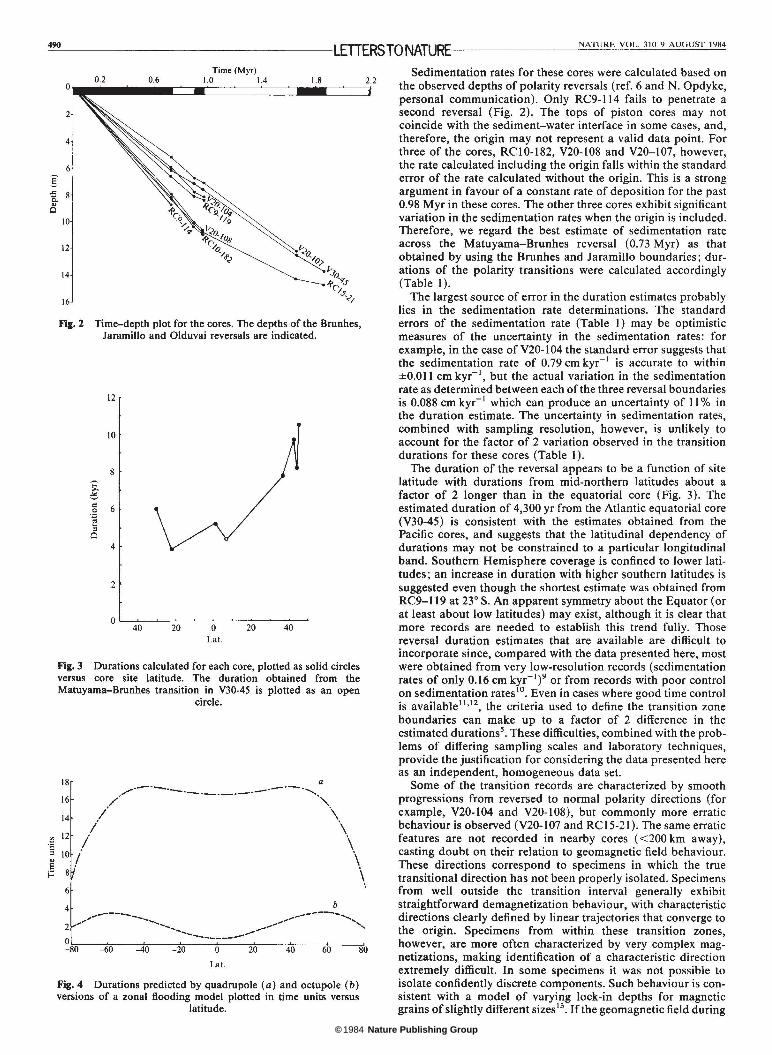
Fig.4 Durations predicted by quadrupole (a) and octupole (b) versions of a zonal flooding model plotted in time units versus
latitude.
Sedimentation rates for these cores were calculated based on the observed depths of polarity reversals (ref. 6 and N. Opdyke, personal communication). Only RC9-114 fails to penetrate a second reversal (Fig. 2). The tops of piston cores may not coincide with the sediment-water interface in some cases, and, therefore, the origin may not represent a valid data point. For three of the cores, RCIO-182, V20-108 and V20-107, however, the rate calculated including the origin falls within the standard error of the rate calculated without the origin. This is a strong argument in favour of a constant rate of deposition for the past 0.98 Myr in these cores. The other three cores exhibit significant variation in the sedimentation rates when the origin is included. Therefore, we regard the best estimate of sedimentation rate across the Matuyama-Brunhes reversal (0.73 Myr) as that obtained by using the Brunhes and Jaramillo boundaries; durations of the polarity transitions were calculated accordingly (Table I).
The largest.source of error in the duration estimates probably lies in the sedimentation rate determinations. The standard errors of the sedimentation rate (Table I) may be optimistic measures of the uncertainty in the sedimentation rates: for example, in the case of V20-1 04 the standard error suggests that the sedimentation rate of 0.79 cm kyr- 1 is accurate to within ±0.01l cm kyr- 1
, but the actual variation in the sedimentation rate as determined between each of the three reversal boundaries is 0.088 cm kyr- 1 which can produce an uncertainty of I I % in the duration estimate. The uncertainty in sedimentation rates, combined with sampling resolution, however, is unlikely to account for the factor of 2 variation observed in the transition durations for these cores (Table I).
The duration of the reversal appears to be a function of site latitude with durations from mid-northern latitudes about a factor of 2 longer than in the equatorial core (Fig. 3). The estimated duration of 4,300 yr from the Atlantic equatorial core (V30-45) is consistent with the estimates obtained from the Pacific cores, and suggests that the latitudinal dependency of durations may not be constrained to a particular longitudinal band. Southern Hemisphere coverage is confined to lower latitudes; an increase in duration with higher southern latitudes is suggested even though the shortest estimate was obtained from RC9-119 at 23 0 S. An apparent symmetry about the Equator (or at least about low latitudes) may exist, although it is clear that more records are needed to establish this trend fully. Those reversal duration estimates that are available are difficult to incorporate since, compared with the data presented here, most were obtained from very low-resolution records (sedimentation rates of only 0.16 cm kyr-1)9 or from records with poor control on sedimentation rates lO
• Even in cases where good time control is available I1
,12, the criteria used to define the transition zone boundaries can make up to a factor of 2 difference in the estimated durations5
• These difficulties, combined with the problems of differing sampling scales and laboratory techniques, provide the justification for considering the data presented here as an independent, homogeneous data set.
Some of the transition records are characterized by smooth progressions from reversed to normal polarity directions (for example, V20-104 and V20-108), but commonly more erratic behaviour is observed (V20- I 07 and RC I 5-21). The same erratic features are not recorded in nearby cores «200 km away), casting doubt on their relation to geomagnetic field behaviour. These directions correspond to specimens in which the true transitional direction has not been properly isolated. Specimens from well outside the transition interval generally exhibit straightforward demagnetization behaviour, with characteristic directions clearly defined by linear trajectories that converge to the origin. Specimens from within these transition zones, however, are more often characterized by very complex magnetizations, making identification of a characteristic direction extremely difficult. In some specimens it was not possible to isolate confidently discrete components. Such behaviour is consistent with a model of varying lock-in depths for magnetic grains of slightly different sizes 13. If the geomagnetic field during
© Nature Publishing Group1984
~NA~T~U~R~E~V~O~L~. ~31~O~9~A~U~G~U~ST~19~B~4 ___________________ LETTERSTONATURE-------------------------------------~~l
a reversal was changing more rapidly than a specimen thickness (4-5 mm) of sediment was passing through the lock-in zone, then grains with overlapping coercivities within a thin stratigraphical level might have been locked-in at slightly different times thereby recording different field directions. A.f. demagnetization of such a specimen would not be able to isolate discrete components. Although this suggests that there may be problems with the detailed interpretation of transitional directions with regard to geomagnetic field behaviour in low sedimentation rate cores ( < I cm kyr- I
), the lack of a correlation between sedimentation rate and duration suggests that the variation in transition duration is not strongly dependent on the magnetization process. Instead, the data presented here indicate that there is a dependence of transition duration on the site latitude as predicted by zonal transitional field models.
The sense ofthe latitudinal dependence of durations, however, is different from that predicted by Williams and Fuller's model of the Matuyama-Brunhes transitional field l4
• The model of combined low-order zonal terms seems to give a reasonable account for many of the observed inclination and intensity records across the reversal. It would, however, predict that durations from the Southern Hemisphere should be significantly longer than those from low latitudes and the Northern Hemisphere, whereas the data presented here show mid-northern latitude durations which are roughly twice as long as the equatorial and low-southern latitude durations.
It is not immediately obvious why this discrepancy exists between the Williams and Fuller model of the BrunhesMatuyama reversal 14 and the results presented here. Some insight, however, might be gained from examining two very simple representations of transitional field geometries, one dominated only by a zonal quadrupole field and another by a zonal octu~ole field. These transitional fields are modelled using Hoffman's technique which is based on the Parker-Levyl5,16
approach to reversals. In this model the dipole field is simulated by placing a series of monopoles along a centred axis of length equal to the diameter of the Earth's core. Monopoles on opposite sides of the Equator are assigned opposite signs. The reversal is modelled by progressively reversing the signs of the monopoles, beginning at the Equator (octupolar transitional geometry) or at one end of the axis (quadrupolar) and evaluating the field observed at the Earth's surface for each of 200 configurations. For the 200 steps, each of which is arbitrarily defined as one time unit, the signs of two monopoles change. Relative durations are calculated by defining the boundaries of the transition as the points when the VGPs exceeded the normal and reversed polarity VGPs by ISO (by analogy to the c.s.d. of the core data).
Both the quadrupole (Fig. 4a) and octupole (Fig. 4b) versions of the model exhibit a symmetry about the Equator, with equatorial durations being shorter than mid-latitude durations. We do not know whether a similar symmetry exists in the data. However, the difference between the mid- and low-latitude durations shows a striking similarity with the durations from the deep-sea core records and is consistent with the dominance of the transitional field by low-order zonal terms. Unfortunately, the similar sense of variation from low to middle latitudes in both the octupole and quadrupole versions of this model makes it difficult to distinguish between the two with the given data set. A diagnostic feature, however, is that the quadrupole version yields durations at any given nonpolar latitude which are far greater than the octupole model. Thus in the quadrupole model this change is a small percentage of the maximum observed duration. When this difference is scaled using the core duration data, the quadrupole model predicts unrealistically long (70,000 yr) durations at mid-latitudes. On the other hand, because the difference is a much larger portion of the total in the octupole model, it predicts durations much closer to the observed values (6,000 yr) at mid-latitudes.
While there is a clear preference for the octupole model within the context of the narrow range of models considered here, transitional fields are, of course, likely to be more complex than
that described by a single zonal term. Until the pattern of duration with site latitude is more fully established, it will be difficult to use the duration data to assess the contribution of addition terms. In particular, duration as well as transitional direction and intensity data from the Southern Hemisphere will be critical in constraining transitional field models.
We thank N. D. Opdyke and L. Tauxe for useful discussions. Helpful comments by S. Cande, J. LaBrecque and K. Hoffman significantly improved the manuscript. This work was supported by NSF grant OCE83-00356. Lamont-Doherty Geological Observatory contribution 3674.
Received 6 February: accepted 4 June 1984.
I. Hillhouse, J . 8< Cox, A. Earth plan.,. Sci. UIt. 19, 51-64 ( 1976). 2. Fuller, M., Williams, J. 8< HoHman, K. Rev. Geophys. Space PIIy~ 17, 179-203 (1979). 3. Kawai. N .• OIofuji, Y. 8< Kobayashi. K. J. atOma,n. GtMloctr. 28, 395-412 (1976). 4. Clement. B., Kent, D.8< Opdyke, N. Phil. Trans. R. Soc. A306, 113-119 (1982). 5. Clement, B. 8< Kent, D. J. ,<ophys. Res. IW, IG49-1058 (1984). 6. Ninkovitch, D., Opdyke, N., Heezen, B. 8< Foster. J. Earlhplanet. Sct Lett. 1,476-492 (1%6). 7. Fisher, F. Proc. R. Soc. All7, 295-305 (1953). 8. Hoffman, K. Science 196, 1329-1332 (1977). 9. Harrison, C. 8< Somayajulu, B. Nature %1%, 1193-1195 (1966).
10. Niitsuma. N. Tohuku Univ. Sci. Rep. 2nd Ser. 43,1-39 (1971). I J. Valet, J·P. 8< Laj, C. Earth planet. Sd Lett. 54, 53-63 (1981). 12. Hammond, S. , Seyb, S. 8< Theyer, F. Earth planet. Sct utt.44, 165-175 (1979). 13. Tucker, P. Oeophys. J. R. aslr. Soc. 63, 149-163 (1980). 14. Williams, I. & Fuller, M. J. geophys. Ru 87, 11,657-11,665 (1982). IS. Parker, E. Asrrophys. I. 158, 8 IS (1969). 16. Levy, E. Asrrophys. J. 171,621 (1972),
Thermoluminescence dating of periods of loess deposition and soil formation in Normandy
A. G. Wintle*, N. J. Shackleton· & J. P. Lautridout
• Godwin Laboratory, Sub-department of Quaternary Research, University of Cambridge; Free School Lane, Cambridge CB2 3RS, UK t Centre de Geomorphologie du CNRS, rue des Tilleuls, 14000 Caen, France
The least incomplete records of Pleistocene climate change come from the study of deep-sea sediments in which the stratigraphil: record of oxygen isotope variations, reflecting terrestrial ice volume, is the primary correlation medium. On continents, the available record is far less complete because many of the characteristics of glaciation are erosional rather than depositional. The areas of loess deposition may provide the best deposits in which to develop relatively complete regional stratigraphies that may be compared with the deep-sea recordI.l. In this study we use thermoluminescence (TL) dating of loess, and of soil developed on loess, to test this model. We have confined ourselves to the last complete alacial cycle within which the reproducibility of the age determinations is similar to the time resolution of most deep-sea core records,
The selected site is in a disused brick pit (now used as the town's rubbish tip) at Saint Romain on the plateau of the Pays de Caux, about 20 km east of Le Havre. It is typical of the Normandy loess sites and a reference section for the 'limons a doublets'. The section totals IS m but we are concerned with the upper 5 m. Figure I shows this part of the section, which was sampled for TL dating (by A.G.W. and N.J.S.) in May 1982 during and after a field excursion (led by 1-P.L.).
Sixteen samples (TL reference numbers QTL20a-p) were taken from the section which has been described elsewhere3,4 .
The lowest samples p (450 cm) and 0 (420 cm) are from the 'older loess' which lies below the Saint-Romain soil. The latter is distinguished from the underlying loess by its redness, its higher clay content and its polyhedric structure. It was first thought to be interstadial3 but subsequently has been described as a leached, brown interglacial soil4. It is overlain by a brown, lamellar, early Weichselian loam4 containing evidence of slope wash and solifluxion processes. Three samples k (300 cm), j