Embed Size (px)
Citation preview
Unibet Group plc Year end report January - December 2014 (unaudited) As reported in the second quarter, the result for January to December 2014 includes Kambi’s results up to 31 May 2014 and a significant non-recurring net gain of GBP 35.3 million as a result of the disposal of Kambi. Please also see table on page 4 for a list of all non-recurring items during 2014.
Fourth quarter highlights
Gross winnings revenue amounted to GBP 78.0 (74.4) million for the fourth quarter of 2014 and GBP 312.0 (268.0) million for the full year 2014.
Earnings before interest, tax, depreciation and amortisation (EBITDA) for the fourth quarter of 2014 were GBP 18.9 (20.2) million. EBITDA for the full year 2014 was GBP 115.7 (63.4) million.
Profit from operations for the fourth quarter of 2014 amounted to GBP 15.3 (15.5) million and
GBP 98.9 (44.5) million for the full year 2014.
Profit before tax for the fourth quarter of 2014 amounted to GBP 15.4 (15.4) million and GBP
99.0 (43.3) million for the full year 2014.
Profit after tax for the fourth quarter of 2014 amounted to GBP 13.5 (14.7) million and GBP
93.4 (40.1) million for the full year 2014.
Earnings per share for the fourth quarter of 2014 were GBP 0.476 (0.526) and GBP 3.311
(1.434) for the full year 2014.
Operating cash flow before movements in working capital amounted to GBP 18.6 (20.4)
million for the fourth quarter of 2014 and GBP 78.2 (63.8) million for the full year 2014.
Number of active customers at the end of the quarter was 570,360 (516,799).
The Board of Directors proposes a dividend of GBP 1.640 (1.100) per share/SDR, which is approximately SEK 20.90 (11.70) per share/SDR and amounts to a proposed distribution to shareholders of GBP 46.7 (30.8) million.
AGM to be held on 12 May 2015, in Stockholm.
“Gross Winnings Revenue up 16 per cent pure organically”
“Compared with the fourth quarter 2013 this quarter is significantly influenced by exchange rate movements on Unibet’s main currencies. If the average exchange rates for the fourth quarter 2013 were applied to this quarter, gross winnings revenue would be approximately GBP 84.5 million. Excluding the effects of exchange rate movements and excluding Kambi’s contribution the underlying growth in gross winnings revenue was 16 per cent compared to the fourth quarter 2013.”
“In spite of a sports betting margin below the long term average, Unibet’s markets continue to show strong growth and profitability. Also our mobile offering continues to grow and is now over 43 per cent of the gross winnings revenue.”
“The strong performance of the Group resulted in an increase in the free cash flow of 41 per cent. Against this background, the Board has proposed a cash dividend of GBP 1.640 which is approximately SEK 20.90, a growth of 79 per cent in SEK.”
“The Q4 report also includes a negative FX charge of GBP 1.6 million of which GBP 1.2 million relates to unrealised translation differences. A major component of this translation adjustment relates to net cash balances that Unibet holds in SEK to fund the proposed 2015 dividend.”
“In the first five weeks of the first quarter average daily gross winnings revenue has increased by approximately 5 per cent in GBP and approximately 16 per cent in local currencies over the same period in 2014”, says Henrik Tjärnström, CEO of Unibet. Today, Wednesday 11 February 2015, Unibet’s CEO Henrik Tjärnström will host a presentation in English at FinancialHearings, Operaterrassen in Stockholm at 9.00 CET.
Please go to www.financialhearings.com to sign in.
For those who would like to participate in the telephone conference in connection with the presentation, the telephone number is UK: +44 20 3428 1410 or the USA: +1 646 502 5120.
Please call in advance and register.
The presentation is also web cast live on www.unibetgroupplc.com

Unibet Group plc Year end report January - December 2014 (unaudited) 2
Unibet Group plc “Fawwara Bldgs", Msida Road, Gzira GZR1402, Malta
Tel: +356 2133 3532 Fax: +356 2343 1510 Website: www.unibetgroupplc.com Email: [email protected]
Registered office: c/o Camilleri Preziosi, Level 2, Valletta Buildings, South Street, Valletta, Malta. Company No: C 39017. Registered in Malta.
SUMMARY TABLE Q4 AND PRIOR YEAR
This table and the contents of this announcement are unaudited
GBP Q4 Full Year
2014 2013 2014 2013
GBPm GBPm GBPm GBPm
Gross winnings revenue 78.0 74.4 312.0 268.0
EBITDA¹ 18.9 20.2 115.7 63.4
Profit before tax 15.4 15.4 99.0 43.3
Profit after tax 13.5 14.7 93.4 40.1
Net cash² 37.0 22.1 37.0 22.1
Bank debt - - - -
GBP GBP GBP GBP
EBITDA¹ per share 0.666 0.723 4.102 2.267
Earnings per share 0.476 0.526 3.311 1.434
Net cash² per share 1.297 0.783 1.297 0.783
SEK Q4 Full Year
2014 2013 2014 2013
SEKm SEKm SEKm SEKm
Gross winnings revenue 917.4 784.8 3,524.7 2,730.9
EBITDA¹ 222.3 213.4 1,307.1 645.9
Profit before tax 181.1 162.7 1,118.4 441.2
Profit after tax 158.8 155.2 1,055.1 408.5
Net cash² 446.2 235.2 446.2 235.2
Bank debt - - - -
SEK SEK SEK SEK
EBITDA¹ per share 7.833 7.623 46.336 23.100
Earnings per share 5.595 5.544 37.405 14.610
Net cash² per share 15.250 8.315 14.647 8.315
No. No. No. No.
Active customers 570,360 516,799
Registered customers (million) 9.7 8.6
Currency rate Q4 14 average: 1GBP = 11.762 SEK, Q4 13 average: 1GBP = 10.548 SEK, FY 14 average: 1GBP = 11.297 SEK, FY 13 average: 1GBP = 10.190 SEK, 31 December 2014: 1GBP = 12.059 SEK, 31 December 2013: 1GBP = 10.626 SEK. Unibet reports in GBP and the SEK figures presented above at period end rates are for information only and are not intended to comply with IFRS.
1 EBITDA = Profit from operations before depreciation & amortisation.
2 Net cash = Total cash at period end less customer balances.
Significant events during the fourth quarter of 2014
On 15 October 2014, the Carbon Disclosure Project (CDP) released their 2014 Climate Change Report which scored the largest 260 companies listed on the Nordic exchanges on their disclosures of greenhouse gas emissions, energy use and the risks and opportunities presented by climate change. Unibet Group plc was awarded a disclosure and performance rating of 90 D. This disclosure score puts Unibet among the leading Nordic listed companies considering and reacting to the impact of climate change. This is a significant achievement in only the Group’s third year of participation and reflects its continued commitment to corporate social responsibility. On 31 December 2014, Unibet disposed its investment in shares in Bingo.com Ltd and acquired the domain Bingo.com from Bingo.com Ltd (See page 4).
Significant events after the period end
On 6 January 2015, a Belgian player won the Mega Fortune pooled Jackpot of EUR 3.2 million. Pooled Jackpots are provided for at the game supplier and as such does not affect Unibet’s results for the quarter. On 23 January 2015, Unibet acquired the remaining part of the real money social gaming operator Bonza. The Bonza business will be integrated with Unibet’s business (See page 4).
Unibet Group plc Year end report January - December 2014 (unaudited) 3
Unibet Group plc “Fawwara Bldgs", Msida Road, Gzira GZR1402, Malta
Tel: +356 2133 3532 Fax: +356 2343 1510 Website: www.unibetgroupplc.com Email: [email protected]
Registered office: c/o Camilleri Preziosi, Level 2, Valletta Buildings, South Street, Valletta, Malta. Company No: C 39017. Registered in Malta.
On 2 February 2015, Unibet was awarded the two prestigious titles “Online Sportsbook Operator of the Year” and “In-Play Sports Operator of the Year” at the International Gaming Awards, IGA, in London.
Market
Unibet is one of Europe’s leading companies in Moneytainment, operating in 22 different languages in more than 100 countries. Unibet offers pre-game sports betting, live betting, poker, casino and games and bingo on unibet.com, unibet.it and unibet.dk and pre-game sports betting, live betting, French horse racing and poker on unibet.fr. On unibet.be and unibet.ee pre-game sports betting, live betting, poker and casino is offered and on unibet.com.au sports betting and racing is offered to the Australian market. While Unibet’s core markets are in Europe and Australia, it addresses global markets excluding only territories that Unibet has consistently blocked for legal reasons such as the USA, Turkey and similar markets. Through the Maria brand, Unibet offers bingo, lotteries, casino and games on maria.com and mariacasino.ee and casino on mariacasino.dk. Maria.com is the female brand in the Unibet family. Apart from the site Maria.com, the business area also drives Bingo.se and Bingo.com. While both Bingo and Casino are used for acquisition marketing and attracting new customers, Casino & Games is the main source of revenue representing over 70 per cent of gross winning revenue offering.
Current products
Sports betting Unibet’s pre-game sports betting and live betting service offers a comprehensive range of odds on a variety of international and local sports events, to a worldwide customer base (excluding restricted markets as described above) 24 hours a day, 7 days a week. Bets are placed via Unibet’s sites and mobile apps. Unibet’s live betting offer is popular across a wide range of sports, including football, tennis, basketball and volleyball. Unibet had 20,608 live betting events in the fourth quarter of 2014 and streamed 6,182 events. Unibet customers were able to watch 6,081 of those streamed sport events on their mobile devices. The majority of Unibet’s business is largely determined by the seasons for key sports such as the major football leagues in Europe, major golf and tennis tournaments and ice hockey leagues in the Nordic countries and North America. The seasonality of these events results in fluctuations in the Group’s quarterly performance, especially in terms of gross turnover. However, quarterly results can also vary widely, due to the volatility of gross winnings margins in sports betting. Please also refer to page 4 for more information about the margin.
Casino & Games Unibet Casino features a suite of over 500 games from more than 30 different software providers. Players are offered a choice of games including Roulette, Blackjack, Video Poker and Slots. Unibet now offers 18 completely exclusive casino games as well as access to the jackpot game ‘Mega Fortune Dreams’ which has paid out over EUR 5 million to Unibet players since launch. Unibet offers a choice of two Live Casinos each with its own unique look, feel and functionality. Recently ‘bet behind’ functionality was introduced to the Blackjack tables meaning players do not have to wait for an empty seat to play. A new mobile app was launched providing players with a better Live Casino experience on phones and tablets. Mobile gaming continues to grow in popularity at Unibet. Players now have a choice of over 130 games to choose from. The Spin City native mobile application was recently named ‘App of the Year’ at the IGA awards. iPad users can download the new ‘Unibet Casino’ app which allows access to a number of flash games previously only available to desktop users.
Poker In mid-December, Unibet poker dealt its hundred millionth hand since re-launch, which was celebrated by awarding EUR 80,000 to players dealt into the milestone hand. During the hundred millionth hand, Unibet poker had the second most players seated in cash games of any online site. The Unibet Open celebrated its 30th edition with a tournament in London attended by 399 players, won by Iaron Lightbourne. In the days before the tournament, Unibet live streamed a golden cash game, attended by players such as Viktor Blom, Dan Glimne, Teddy Sheringham and Esa Tikkanen.
Customers
The total number of registered customers has continued to increase and exceeded 9.7 (8.6) million at 31 December 2014, whilst at 30 September 2014, over 9.5 million customers were registered. For the fourth quarter of 2014 the number of active customers amounted to 570,360 (516,799) compared with 573,074 for the third quarter of 2014. An active customer is defined as one placing a bet in the last three months.

Unibet Group plc Year end report January - December 2014 (unaudited) 4
Unibet Group plc “Fawwara Bldgs", Msida Road, Gzira GZR1402, Malta
Tel: +356 2133 3532 Fax: +356 2343 1510 Website: www.unibetgroupplc.com Email: [email protected]
Registered office: c/o Camilleri Preziosi, Level 2, Valletta Buildings, South Street, Valletta, Malta. Company No: C 39017. Registered in Malta.
Financial review
The financial information has been presented in accordance with International Financial Reporting Standards as adopted by the European Union. The accounting policies remain unchanged from the last published Annual Report and Accounts for the year ended 31 December 2013. Kambi results are consolidated in Unibet’s result until 31 May 2014.
Non-recurring items The result for January to December 2014 includes the following non-recurring items:
Q2 Q4 Full Year
GBP 'm 2014 2014 2014
Net gain on disposal of Kambi 35.3 35.3
Adjustment carrying value of Betchoice acquisition contingent consideration 2.2 2.2
Net gain on disposal of investment of Bingo.com 2.9 2.9
Adjustment of carrying value of loan to Bonza -2.4 -2.4
TOTAL 37.5 0.5 38.0
Net gain on disposal of investment of Bingo.com On 31 December Unibet disposed of the15 million shares it held in Bingo.com for a consideration of USD 0.4 per share. This has resulted in a non-recurring net gain on disposal of GBP 2.9 million.
Adjustment to carrying value of loan to Bonza
In light of the post balance sheet acquisition of Bonza, Unibet has been required to fair value its loan to Bonza, As a result Unibet has taken a non-recurring, non-cash amortisation charge in the fourth quarter of GBP 2.4 million.
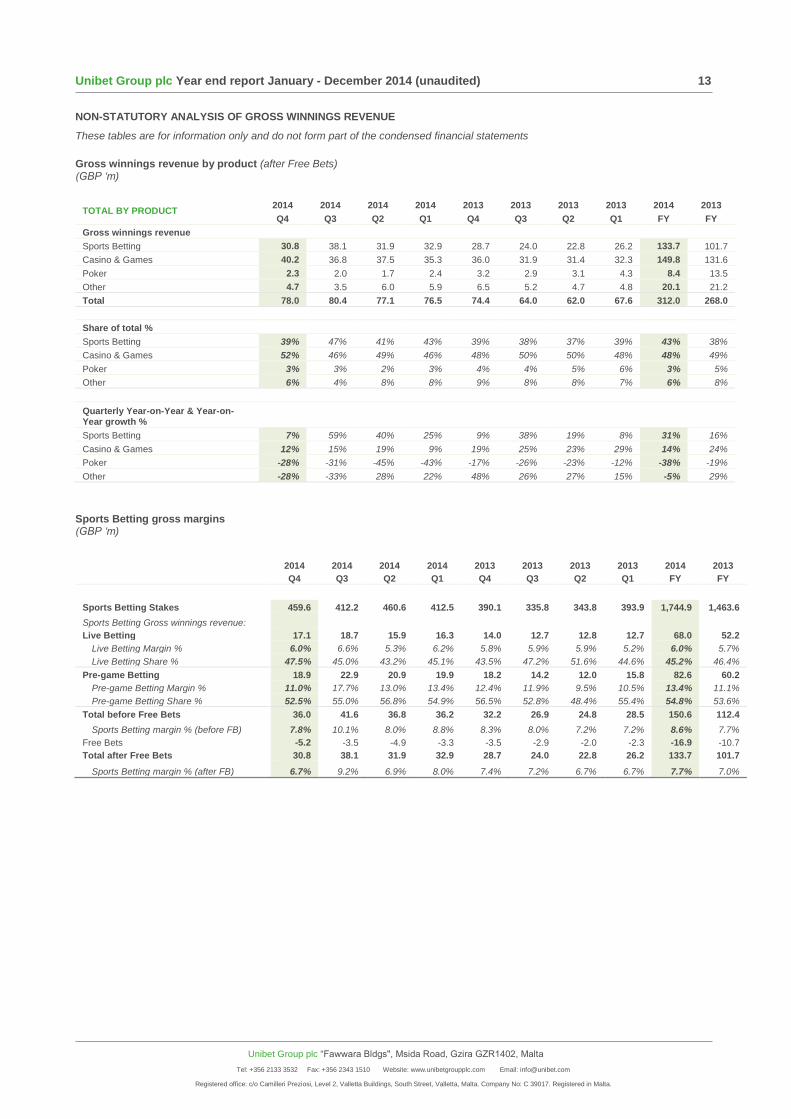
Gross winnings revenue Gross winnings revenue on sports betting represents the net receipt of bets and payouts for the financial period, as reduced for Free Bets. Free Bets are bonuses granted or earned in connection with customer acquisition. Gross winnings revenue for sports betting amounted to GBP 30.8 (28.7) million for the fourth quarter of 2014. For the full year 2014, gross winnings revenue for sports betting amounted to GBP 133.7 (101.7) million. In the fourth quarter of 2014, live betting accounted for 62.0 (62.8) per cent of turnover on sports betting and 47.5 (43.5) per cent of gross winnings revenue on sports betting. Gross winnings revenue for other products amounted to GBP 47.2 (45.7) million for the fourth quarter of 2014. For the full year 2014, gross winnings revenue for other products amounted to GBP 178.3 (166.3) million. Please refer to pages 12 and 13 for more information on gross winnings revenue per region and products.
Gross margin on sports betting The gross margin for pre-game sports betting before Free Bets for the fourth quarter of 2014 was 11.0 (12.4) per cent. The gross margin for total sports betting for the fourth quarter of 2014 before Free Bets was 7.8 (8.3) per cent. The gross margin for total sports betting for the fourth quarter of 2014 after Free Bets was 6.7 (7.4) per cent.
0
100
200
300
400
500
600
700
Q1
2005
Q2
Q3
Q4
Q1
2006
Q2
Q3
Q4
Q1
2007
Q2
Q3
Q4
Q1
2008
Q2
Q3
Q4
Q1
2009
Q2
Q3
Q4
Q1
2010
Q2
Q3
Q4
Q1
2011
Q2
Q3
Q4
Q1
2012
Q2
Q3
Q4
Q1
2013
Q2
Q3
Q4
Q1
2014
Q2
Q3
Q4
Thousand
Active Customers

Unibet Group plc Year end report January - December 2014 (unaudited) 5
Unibet Group plc “Fawwara Bldgs", Msida Road, Gzira GZR1402, Malta
Tel: +356 2133 3532 Fax: +356 2343 1510 Website: www.unibetgroupplc.com Email: [email protected]
Registered office: c/o Camilleri Preziosi, Level 2, Valletta Buildings, South Street, Valletta, Malta. Company No: C 39017. Registered in Malta.
Please refer to page 13 for more information on sports betting margins.
Sports betting gross margins can vary quite significantly from one quarter to the next, depending on the outcome of sporting events. However, over time these margins will even out. This can be seen in the table below. The bars show total sports betting gross margin by quarter and full year.
Sportsbetting Gross Win % (before and after Free Bets)
Cost of sales Cost of sales includes betting duties, marketing revenue share and other costs of sales. For the fourth quarter of 2014 betting duties were GBP 7.0 (5.3) million and marketing revenue share amounted to GBP 5.0 (5.0) million. Betting duties for the full year 2014 were GBP 23.6 (16.3) million and marketing revenue share for the full year 2014 amounted to GBP 19.6 (18.4) million.
Gross profit Gross profit for the fourth quarter of 2014 was GBP 53.0 (54.7) million. Gross profit for the full year 2014 was GBP 221.1 (198.3) million.
Operating costs (marketing and administrative expenses) Operating costs include all indirect costs of running the business and are a combination of activity-related costs and fixed costs such as marketing, salaries and other administrative expenses.
During the fourth quarter of 2014, operating costs were GBP 36.2 (37.2) million. Of the operating costs in the fourth quarter, GBP 16.3 (14.1) million were marketing costs and GBP 10.3 (11.0) million were salaries. During the full year 2014, operating costs were GBP 156.6 (149.3) million. Of the operating costs in the full year 2014, GBP 69.7 (58.3) million were marketing costs and GBP 42.6 (43.7) million were salaries.
The comparison of expenditure is affected by the spin-off of Kambi in the second quarter of 2014. Administrative expenses for the fourth quarter 2013 included GBP 5.0 million that related to Kambi. Capital expenditure in the fourth quarter 2013 included GBP 1.2 million that related to Kambi.
FX rates The following FX rates are those used for translation of the Group’s SEK, NOK, EUR, and DKK Balance Sheet and Income Statement items into GBP on 31 December 2014:
Balance sheet rates:
Rate to GBP 31-Dec-13 30-Sep-14 31-Dec-14 Q4 14 vs Q3 14
Delta
SEK 10.626 11.767 12.059 -13.5%
NOK 10.031 10.445 11.609 -15.7%
EUR 1.199 1.287 1.284 -7.1%
DKK 8.947 9.576 9.559 -6.8%
Income statement averages for the quarter:
Rate to GBP Avg Q4 13 Avg Q3 14 Avg Q4 14 Q4 14 vs Q3 14
Delta
SEK 10.548 11.597 11.762 -11.5%
NOK 9.811 10.426 10.906 -11.2%
EUR 1.190 1.260 1.267 -6.5%
DKK 8.876 9.389 9.432 -6.3%
0.0%
1.0%
2.0%
3.0%
4.0%
5.0%
6.0%
7.0%
8.0%
9.0%
10.0%
11.0%
Q12010
Q2 Q3 Q4 YR Q12011
Q2 Q3 Q4 YR Q12012
Q2 Q3 Q4 YR Q12013
Q2 Q3 Q4 YR Q12014
Q2 Q3 Q4 YR
Sports Betting before Free Bets Sports Betting after Free Bets
Unibet Group plc Year end report January - December 2014 (unaudited) 6
Unibet Group plc “Fawwara Bldgs", Msida Road, Gzira GZR1402, Malta
Tel: +356 2133 3532 Fax: +356 2343 1510 Website: www.unibetgroupplc.com Email: [email protected]
Registered office: c/o Camilleri Preziosi, Level 2, Valletta Buildings, South Street, Valletta, Malta. Company No: C 39017. Registered in Malta.
EBITDA and Profit from operations Earnings before interest, tax, depreciation and amortisation (EBITDA) for the fourth quarter of 2014 was GBP 18.9 (20.2) million and for the full year 2014 was GBP 115.7 (63.4) million. Profit from operations for the fourth quarter of 2014 was GBP 15.3 (15.5) million. Profit from operations for the full year 2014 was GBP 98.9 (44.5) million.
Development and acquisition costs of intangible assets In the fourth quarter of 2014, expenditure of GBP 2.3 (4.0) million has been capitalised, bringing the total for the full year 2014 to GBP 11.7 (16.0) million. The key drivers of capitalised development costs during 2014 are local licensing requirements, customer experience improvements, data analytics and information mining. On 31 December 2014, Unibet acquired the domain Bingo.com at a fair value of GBP 5.1 million and as with other intangibles with an indefinite useful life will be subject to an annual impairment review.
Finance costs/income Net finance income for the fourth quarter of 2014 was GBP 0.1 (0.0) million. Net finance income for the full year 2014 was GBP 0.4 (1.0 finance cost) million.
Profit before tax Profit before tax for the fourth quarter of 2014 was GBP 15.4 (15.4) million. Profit before tax for the full year 2014 was GBP 99.0 (43.3) million.
Profit after tax Profit after tax for the fourth quarter of 2014 was GBP 13.5 (14.7) million. Profit after tax for the full year 2014 was GBP 93.4 (40.1) million.
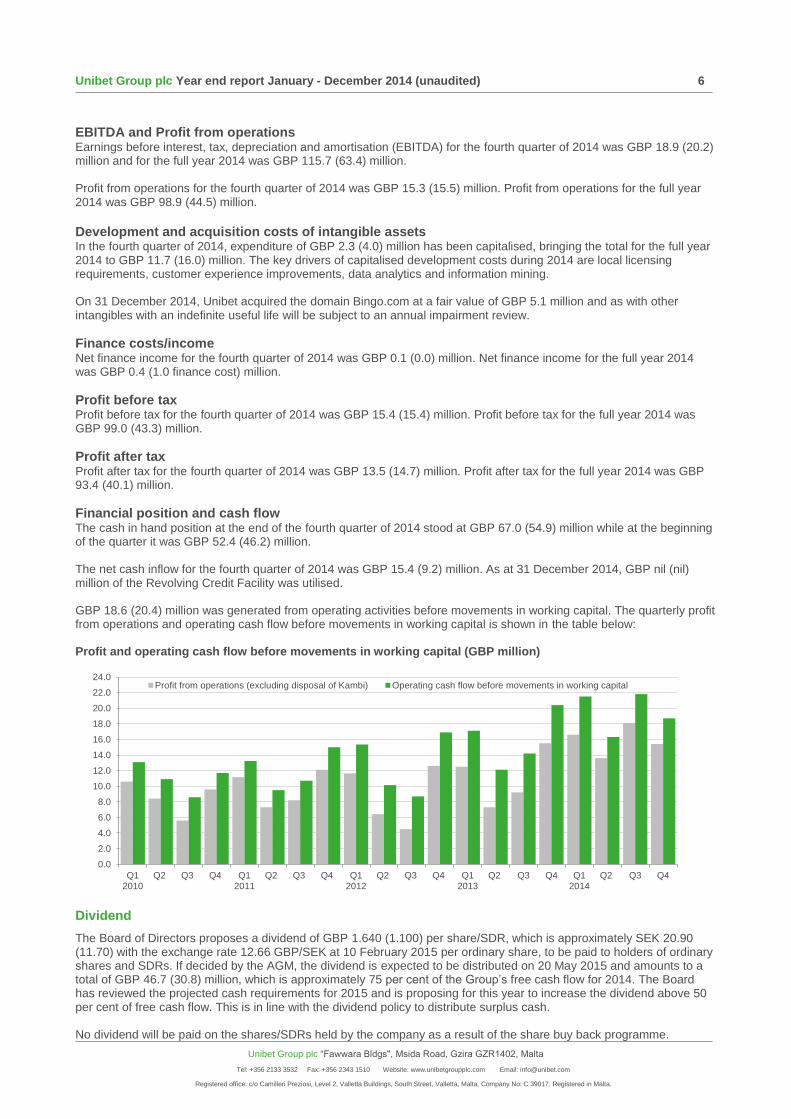
Financial position and cash flow The cash in hand position at the end of the fourth quarter of 2014 stood at GBP 67.0 (54.9) million while at the beginning of the quarter it was GBP 52.4 (46.2) million. The net cash inflow for the fourth quarter of 2014 was GBP 15.4 (9.2) million. As at 31 December 2014, GBP nil (nil) million of the Revolving Credit Facility was utilised. GBP 18.6 (20.4) million was generated from operating activities before movements in working capital. The quarterly profit from operations and operating cash flow before movements in working capital is shown in the table below: Profit and operating cash flow before movements in working capital (GBP million)
Dividend
The Board of Directors proposes a dividend of GBP 1.640 (1.100) per share/SDR, which is approximately SEK 20.90 (11.70) with the exchange rate 12.66 GBP/SEK at 10 February 2015 per ordinary share, to be paid to holders of ordinary shares and SDRs. If decided by the AGM, the dividend is expected to be distributed on 20 May 2015 and amounts to a total of GBP 46.7 (30.8) million, which is approximately 75 per cent of the Group’s free cash flow for 2014. The Board has reviewed the projected cash requirements for 2015 and is proposing for this year to increase the dividend above 50 per cent of free cash flow. This is in line with the dividend policy to distribute surplus cash. No dividend will be paid on the shares/SDRs held by the company as a result of the share buy back programme.
0.0
2.0
4.0
6.0
8.0
10.0
12.0
14.0
16.0
18.0
20.0
22.0
24.0
Q12010
Q2 Q3 Q4 Q12011
Q2 Q3 Q4 Q12012
Q2 Q3 Q4 Q12013
Q2 Q3 Q4 Q12014
Q2 Q3 Q4
Profit from operations (excluding disposal of Kambi) Operating cash flow before movements in working capital

Unibet Group plc Year end report January - December 2014 (unaudited) 7
Unibet Group plc “Fawwara Bldgs", Msida Road, Gzira GZR1402, Malta
Tel: +356 2133 3532 Fax: +356 2343 1510 Website: www.unibetgroupplc.com Email: [email protected]
Registered office: c/o Camilleri Preziosi, Level 2, Valletta Buildings, South Street, Valletta, Malta. Company No: C 39017. Registered in Malta.
Employees
Unibet had 652 (909) employees equivalent to 641 (871) full time employees at 31 December 2014, compared to 644 employees equivalent to 616 full time employees at 30 September 2014. Of the employees at 31 December 2013, 319 were employed by Kambi.
Exercise of options
In the exercise window ending on 15 November 2014 under the rules of Unibet Group plc Executive Option Scheme, 228,099 share options were exercised. The options were exercised by issuing 228,099 ordinary shares with a par value of GBP 0.005. In connection with this exercise, Unibet has received SEK 39,174,296.00 from the option holders which has, in full, been taken to equity. Of these Unibet’s CEO Henrik Tjärnström has exercised 92,977 options of which 32,977 has been sold and the proceeds of this sale were reinvested into the exercise of the remaining 60,000. Following this exercise, the total amount of shares issued in Unibet Group plc is 28,537,950 ordinary shares with a par value of GBP 0.005. Of the total issued shares, 85,364 from the Share buy-back programmes initiated in 2007 and 2011 continue to be held by Unibet in form of SDRs.
Principal risks
Unibet manages strategic, operational and financing risks on a group-wide basis. The principal risks affecting the Group are market risks, foreign exchange risks, credit risks and legal risks. Further details of Unibet’s risk management and risks arising from the legal environment can be found on pages 14-17 and pages 55-56 of the Annual Report for the year ended 31 December 2013 available from www.unibetgroupplc.com.
Next AGM and Nomination Committee
The Annual General Meeting of Unibet Group plc 2015 will be held on Tuesday 12 May 2015 in Stockholm. In view of the scheduled date for publishing the Notice of the Annual General Meeting, proposals have to be received by the Company and the Nomination Committee not later than Monday 2 March 2015 in order to have sufficient time for including them in the Notice and the meeting’s agenda. The Nomination Committee consists of Evert Carlsson, Swedbank Robur Fonder (chairman), Anders Ström, Johan Strandberg, SEB Fonder and Johan Ståhl, Lannebo Fonder. The nomination committee can be contacted at the following address: Unibet Group plc, "Fawwara Bldgs", Msida Road, Gzira GZR1402, Malta, or by email to: [email protected].
Forthcoming financial reporting timetable
Interim Report January – March 2015 29 April 2015 Interim Report January – June 2015 5 August 2015 Interim Report January – September 2015 4 November 2015 Full Year Report 2015 10 February 2016 The Board of Directors and the CEO certify that the interim report gives a fair reflection of the Group's operations, financial position and results of operations, and describes significant risks and uncertainties facing the Group.
Malta, 11 February 2015
Henrik Tjärnström CEO For further information please contact:
Inga Lundberg, Investor Relations +44 7887 996 116 Henrik Tjärnström, CEO +44 7515 975 629 This report is unaudited. Unibet Group plc Company number C 39017 Registered in Malta. About Unibet Unibet was founded in 1997 and is an online gambling company listed on Nasdaq Stockholm. Unibet is one of the largest privately-owned gambling operators in the European market and provides services in 22 languages through www.unibet.com, www.unibet.dk, www.unibet.fr, www.unibet.it, www.unibet.be, www.unibet.ee, www.unibet.co.uk, www.unibet.com.au, www.maria.com, www.mariacasino.ee, www.mariacasino.co.uk and www.mariacasino.dk. Today, Unibet has 9.7 million registered customers in over 100 countries. Unibet is a member of the EGBA, European Gaming and Betting Association, RGA, Remote Gambling Association in the UK and is audited and certified by eCOGRA in relation to responsible and fair gaming.
More information about Unibet Group plc can be found on www.unibetgroupplc.com and twitter.com/UnibetGroup

Unibet Group plc Year end report January - December 2014 (unaudited) 8
Unibet Group plc “Fawwara Bldgs", Msida Road, Gzira GZR1402, Malta
Tel: +356 2133 3532 Fax: +356 2343 1510 Website: www.unibetgroupplc.com Email: [email protected]
Registered office: c/o Camilleri Preziosi, Level 2, Valletta Buildings, South Street, Valletta, Malta. Company No: C 39017. Registered in Malta.
CONSOLIDATED INCOME STATEMENT Unaudited Unaudited Unaudited Audited
GBP 'm Q4 Q4 Full Year Full Year
2014 2013 2014 2013 *
Continuing operations:
Gross winnings revenue 78.0 74.4 312.0 268.0
Betting duties -7.0 -5.3 -23.6 -16.3
Marketing revenue share -5.0 -5.0 -19.6 -18.4
Other cost of sales -13.0 -9.4 -47.7 -35.0
Cost of sales -25.0 -19.7 -90.9 -69.7
Gross profit 53.0 54.7 221.1 198.3
Marketing costs -16.3 -14.1 -69.7 -58.3
Administrative expenses -19.9 -23.1 -86.9 -91.0
Underlying profit before items affecting comparability: 16.8 17.5 64.5 49.0
Settlement of litigation - -1.1 - -1.1
Amortisation of acquired intangible assets -0.4 -0.5 -1.8 -2.8
Adjustment to carrying value of contingent consideration - - 2.2 -
Net gain on disposal of Kambi - - 35.3 -
Adjustment of carrying value of loan to joint venture -2.4 - -2.4 -
Net gain on disposal of associate 2.9 - 2.9 -
Foreign currency loss on operating items -1.6 -0.4 -1.8 -0.6
Profit from operations 15.3 15.5 98.9 44.5
Finance costs -0.0 -0.0 -0.2 -1.1
Finance income 0.1 0.0 0.6 0.1
Share of loss from associates -0.0 -0.1 -0.3 -0.2
Profit before tax 15.4 15.4 99.0 43.3
Underlying income tax expense -1.9 -0.7 -5.9 -3.2
Tax on disposal of Kambi - - 0.3 -
Income tax expense -1.9 -0.7 -5.6 -3.2
Profit after tax 13.5 14.7 93.4 40.1
Earnings per share (GBP) 0.476 0.526 3.311 1.434
Weighted average number of ordinary shares 28,381,219 27,996,781 28,208,537 27,959,892
for the purposes of calculating
basic earnings per share
Fully diluted earnings per share (GBP) 0.466 0.516 3.243 1.415
Weighted average number of ordinary shares 28,968,146 28,535,499 28,802,760 28,330,762
for the purposes of calculating
diluted earnings per share
CONSOLIDATED STATEMENT OF COMPREHENSIVE INCOME Unaudited Unaudited Unaudited Audited
GBP 'm Q4 Q4 Full Year Full Year
2014 2013 2014 2013 *
Profit after tax for the period 13.5 14.7 93.4 40.1
Other comprehensive income
Currency translation adjustments taken to equity -0.7 -2.5 -9.0 -2.0
Total comprehensive income for the year 12.8 12.2 84.4 38.1
* In connection with the separation of Kambi in Q2 2014, Unibet has reclassified certain items. More information is available at www.unibetgroupplc.com

Unibet Group plc Year end report January - December 2014 (unaudited) 9
Unibet Group plc “Fawwara Bldgs", Msida Road, Gzira GZR1402, Malta
Tel: +356 2133 3532 Fax: +356 2343 1510 Website: www.unibetgroupplc.com Email: [email protected]
Registered office: c/o Camilleri Preziosi, Level 2, Valletta Buildings, South Street, Valletta, Malta. Company No: C 39017. Registered in Malta.
CONSOLIDATED BALANCE SHEET Unaudited Audited
GBP 'm 31 Dec 31 Dec
2014 2013
Assets
Non-current assets
Goodwill 143.5 150.4
Other intangible assets 34.4 40.0
Investment in associates 1.5 2.2
Property, plant and equipment 4.3 6.9
Deferred tax assets 8.7 1.7
Convertible bond 5.9 -
Loan to joint venture 0.8 2.2
199.1 203.4
Current assets
Trade and other receivables 14.3 14.9
Taxation recoverable 8.0 21.3
Cash and cash equivalents 67.0 54.9
89.3 91.1
Total assets 288.4 294.5
Equity and liabilities
Capital and reserves
Share capital 0.1 0.1
Share premium 78.1 74.4
Currency translation reserve 3.0 12.0
Reorganisation reserve -42.9 -42.9
Retained earnings 164.6 155.7
Total equity 202.9 199.3
Non-current liabilities
Other non-current liabilities - 3.3
Deferred tax liability 1.2 1.3
1.2 4.6
Current liabilities
Borrowings - -
Trade and other payables 32.9 29.9
Customer balances 30.0 32.7
Deferred income 2.0 2.0
Tax liabilities 19.4 26.0
84.3 90.6
Total liabilities 85.5 95.2
Total equity and liabilities 288.4 294.5
Unibet Group plc Year end report January - December 2014 (unaudited) 10
Unibet Group plc “Fawwara Bldgs", Msida Road, Gzira GZR1402, Malta
Tel: +356 2133 3532 Fax: +356 2343 1510 Website: www.unibetgroupplc.com Email: [email protected]
Registered office: c/o Camilleri Preziosi, Level 2, Valletta Buildings, South Street, Valletta, Malta. Company No: C 39017. Registered in Malta.
CONSOLIDATED CASH FLOW STATEMENT Unaudited Unaudited Unaudited Audited
GBP 'm Q4 Q4 Full Year Full Year
2014 2013 2014 2013
Operating activities
Profit from operations 15.3 15.5 98.9 44.5
Adjustments for:
Depreciation of property, plant and equipment 0.6 0.8 2.9 3.3
Amortisation of intangible assets 3.0 3.9 13.9 15.6
Loss on disposal of property, plant & equipment 0.0 - 0.2 0.0
Net gain on disposal of Kambi - - -35.3 -
Adjustment of carrying value of loan to joint venture 2.4 - 2.4 -
Net gain on disposal of associate -2.9 - -2.9 -
Adjustment to fair value of contingent consideration - - -2.4 -
Share-based payment 0.2 0.2 0.5 0.4
Operating cash flows before movements in working capital 18.6 20.4 78.2 63.8
(Increase) / decrease in trade and other receivables -0.0 3.0 -4.7 0.4
(Decrease) / increase in trade and other payables, including customer balances -0.3 -3.3 7.7 -2.0
Cash generated from operations 18.3 20.1 81.2 62.2
Income taxes paid net of tax refunded -1.4 -0.5 -5.1 -1.4
Net cash generated from operating activities 16.9 19.6 76.1 60.8
Investing activities
Investment in associate -0.6 -1.1 -0.6 -1.1
Proceeds from sale of associate 3.8 - 3.8 -
Convertible bond subscription - - -6.0 -
Interest received 0.0 0.0 0.2 0.0
Interest paid -0.0 -0.2 -0.2 -0.4
Purchases of property, plant and equipment -0.3 -0.4 -2.4 -3.6
Purchase of Bingo.com brand -5.1 - -5.1 -
Development and acquisition costs of intangible assets -2.3 -4.0 -11.7 -16.0
Loans granted to joint venture -0.3 -0.2 -1.0 -2.2
Net cash used in investing activities -4.8 -5.9 -23.0 -23.3
Financing activities
Dividends paid - - -31.1 -19.6
Disposal of treasury shares - 1.1 2.2 1.3
Proceeds of issue of new shares for share options 3.3 - 3.7 0.1
Proceeds from borrowings - - 16.3 11.8
Repayment of borrowings - -5.6 -15.9 -25.9
Net cash used in financing activities 3.3 -4.5 -24.8 -32.3
Net cash transferred on disposal of Kambi - - -11.3 -
Net increase in cash and cash equivalents 15.4 9.2 17.0 5.2
Cash and cash equivalents at beginning of period 52.4 46.2 54.9 49.9
Effect of foreign exchange rate changes -0.8 -0.5 -4.9 -0.2
Cash and cash equivalents at end of period 67.0 54.9 67.0 54.9
Unibet Group plc Year end report January - December 2014 (unaudited) 11
Unibet Group plc “Fawwara Bldgs", Msida Road, Gzira GZR1402, Malta
Tel: +356 2133 3532 Fax: +356 2343 1510 Website: www.unibetgroupplc.com Email: [email protected]
Registered office: c/o Camilleri Preziosi, Level 2, Valletta Buildings, South Street, Valletta, Malta. Company No: C 39017. Registered in Malta.
CONSOLIDATED STATEMENT OF CHANGES IN EQUITY Unaudited Unaudited Unaudited Audited
GBP 'm Q4 Q4 Full Year Full Year
2014 2013 2014 2013
Opening balance at beginning of period 186.2 185.8 199.3 179.0
Comprehensive income
Profit for the period 13.5 14.7 93.4 40.1
Other comprehensive income:
Translation adjustment -0.7 -2.5 -9.0 -2.0
12.8 12.2 84.4 38.1
Transactions with owners
Share options - value of employee services 0.2 0.2 0.5 0.4
Deferred tax credit relating to share option scheme 0.4 - 0.4 -
Proceeds from shares issued 3.3 - 3.7 0.1
Disposal of treasury shares - 1.1 2.2 1.3
Dividend paid - - -31.1 -19.6
Distribution of Kambi - - -56.5 -
3.9 1.3 -80.8 -17.8
Closing balance at end of period 202.9 199.3 202.9 199.3
KEY RATIOS This table is for information only and does not form part of the condensed financial statements
Unaudited Unaudited Unaudited Audited
Q4 Q4 Full Year Full Year
2014 2013 2014 2013
Operating margin, % 20% 21% 32% 17%
(Profit from operations/revenue for the period)
Return on total assets, % 5% 5% 32% 14%
(Profit after tax/average of opening and closing assets for
the period)
Return on average equity, % (annualised) 31% 32% 49% 24%
(EBIT/average of opening and closing equity for the period)
Equity/assets ratio, % 70% 68% 70% 68%
EBITDA margin, % 24% 27% 37% 24%
Net cash/EBITDA (rolling 12 months basis) 0.320 0.349 0.320 0.349
Employees at period end 652 909 652 909
Gross cash per share (GBP) 2.348 1.940 2.348 1.940
(cash at end of period/number of shares at end of period)
Net cash less debt per share (GBP) 1.297 0.783 1.297 0.783
(total cash at period end less customer liabilities and
borrowings/number of shares at end of period)
Operating cash flow before movements in working capital 0.655 0.728 2.772 2.281
per share (GBP)
Earnings per share (GBP) 0.476 0.526 3.311 1.434
Fully diluted earnings per share (GBP) 0.466 0.516 3.243 1.415
Number of shares at period end¹ 28,537,950 28,283,122 28,537,950 28,283,122
Fully diluted number of shares at period end 29,031,863 28,865,510 29,031,863 28,865,510
Average number of shares 28,381,219 27,996,781 28,208,537 27,959,892
Average number of fully diluted shares 28,968,146 28,535,499 28,802,760 28,330,762
1 As at 31 December 2014 the total issued shares was 28,537,950. Of these 85,364 are owned by the Company as a result of previous years share buy back programmes. The intention of the Board is either to cancel the shares (requires further shareholder approval), use as consideration for an acquisition, or issue to employees under share option programmes.
Unibet Group plc Year end report January - December 2014 (unaudited) 12
Unibet Group plc “Fawwara Bldgs", Msida Road, Gzira GZR1402, Malta
Tel: +356 2133 3532 Fax: +356 2343 1510 Website: www.unibetgroupplc.com Email: [email protected]
Registered office: c/o Camilleri Preziosi, Level 2, Valletta Buildings, South Street, Valletta, Malta. Company No: C 39017. Registered in Malta.
NON-STATUTORY ANALYSIS OF GROSS WINNINGS REVENUE
These tables are for information only and do not form part of the condensed financial statements
Gross winnings revenue by region (based on country of residence of customer) (GBP ‘m)
SPORTS BETTING BY REGION 2014 2014 2014 2014 2013 2013 2013 2013 2014 2013
Q4 Q3 Q2 Q1 Q4 Q3 Q2 Q1 FY FY
Gross winnings revenue
Nordics 12.9 15.3 12.2 13.1 12.4 11.5 10.0 12.4 53.5 46.3
Western Europe 14.3 18.9 16.2 16.1 13.5 8.6 8.3 10.4 65.5 40.8
Central, Eastern and Southern Europe 1.8 2.6 2.6 2.9 2.1 2.2 3.3 1.5 9.9 9.1
Other 1.8 1.3 0.9 0.8 0.7 1.7 1.2 1.9 4.8 5.5
Total 30.8 38.1 31.9 32.9 28.7 24.0 22.8 26.2 133.7 101.7
Quarterly Year-on-Year & Year-on-Year growth %
Nordics 4% 33% 22% 6% 10% 47% 19% 10% 16% 19%
Western Europe 6% 120% 95% 54% 32% 31% 12% 16% 61% 23%
Central, Eastern and Southern Europe -14% 18% -21% 92% 3% 119% 84% -45% 9% 21%
Other 157% -24% -25% -57% -77% -11% -23% 48% -13% -29%
Total 7% 59% 40% 25% 8% 39% 19% 8% 31% 16%
OTHER PRODUCTS - CASINO, POKER, & OTHER GAMES BY REGION
2014 2014 2014 2014 2013 2013 2013 2013 2014 2013
Q4 Q3 Q2 Q1 Q4 Q3 Q2 Q1 FY FY
Gross winnings revenue
Nordics 25.5 23.2 24.8 23.9 26.3 24.2 23.4 24.5 97.4 98.4
Western Europe 16.5 14.9 14.4 13.3 12.6 10.2 11.1 11.3 59.1 45.2
Central, Eastern and Southern Europe 4.7 3.9 4.1 4.2 4.6 4.1 3.5 4.4 16.9 16.6
Other 0.5 0.3 1.9 2.2 2.2 1.5 1.2 1.2 4.9 6.1
Total 47.2 42.3 45.2 43.6 45.7 40.0 39.2 41.4 178.3 166.3
Quarterly Year-on-Year & Year-on-Year growth %
Nordics -3% -4% 6% -2% 9% 16% 19% 24% -1% 17%
Western Europe 31% 46% 30% 18% 31% 13% 13% 19% 31% 19%
Central, Eastern and Southern Europe 2% -5% 17% -6% 18% 28% 15% 11% 2% 18%
Other -77% -80% 58% 94% 175% 119% 71% 28% -20% 96%
Total 3% 6% 15% 5% 19% 19% 18% 21% 7% 19%
TOTAL BY REGION 2014 2014 2014 2014 2013 2013 2013 2013 2014 2013
Q4 Q3 Q2 Q1 Q4 Q3 Q2 Q1 FY FY
Gross winnings revenue
Nordics 38.4 38.5 37.0 37.0 38.7 35.7 33.4 36.9 150.9 144.7
Western Europe 30.8 33.8 30.6 29.4 26.1 18.8 19.4 21.7 124.6 86.0
Central, Eastern and Southern Europe 6.5 6.5 6.7 7.1 6.7 6.3 6.8 5.9 26.8 25.7
Other 2.3 1.6 2.8 3.0 2.9 3.2 2.4 3.1 9.7 11.6
Total 78.0 80.4 77.1 76.5 74.4 64.0 62.0 67.6 312.0 268.0
Share of total %
Nordics 49% 48% 48% 49% 52% 56% 54% 55% 48% 54%
Western Europe 40% 42% 40% 38% 35% 29% 31% 32% 40% 32%
Central, Eastern and Southern Europe 8% 8% 9% 9% 9% 10% 11% 9% 9% 10%
Other 3% 2% 3% 4% 4% 5% 4% 4% 3% 4%
Quarterly Year-on-Year & Year-on-Year growth %
Nordics -1% 8% 11% 0% 9% 25% 19% 19% 4% 18%
Western Europe 18% 80% 58% 35% 32% 20% 13% 17% 45% 21%
Central, Eastern and Southern Europe -3% 3% -1% 19% 13% 50% 41% -11% 4% 19%
Other -21% -50% 17% 0% -24% 24% 6% 40% -16% 6%
Total 5% 26% 24% 13% 15% 25% 18% 16% 16% 18%
Unibet Group plc Year end report January - December 2014 (unaudited) 13
Unibet Group plc “Fawwara Bldgs", Msida Road, Gzira GZR1402, Malta
Tel: +356 2133 3532 Fax: +356 2343 1510 Website: www.unibetgroupplc.com Email: [email protected]
Registered office: c/o Camilleri Preziosi, Level 2, Valletta Buildings, South Street, Valletta, Malta. Company No: C 39017. Registered in Malta.
NON-STATUTORY ANALYSIS OF GROSS WINNINGS REVENUE
These tables are for information only and do not form part of the condensed financial statements
Gross winnings revenue by product (after Free Bets) (GBP ‘m)
TOTAL BY PRODUCT 2014 2014 2014 2014 2013 2013 2013 2013 2014 2013
Q4 Q3 Q2 Q1 Q4 Q3 Q2 Q1 FY FY
Gross winnings revenue
Sports Betting 30.8 38.1 31.9 32.9 28.7 24.0 22.8 26.2 133.7 101.7
Casino & Games 40.2 36.8 37.5 35.3 36.0 31.9 31.4 32.3 149.8 131.6
Poker 2.3 2.0 1.7 2.4 3.2 2.9 3.1 4.3 8.4 13.5
Other 4.7 3.5 6.0 5.9 6.5 5.2 4.7 4.8 20.1 21.2
Total 78.0 80.4 77.1 76.5 74.4 64.0 62.0 67.6 312.0 268.0
Share of total %
Sports Betting 39% 47% 41% 43% 39% 38% 37% 39% 43% 38%
Casino & Games 52% 46% 49% 46% 48% 50% 50% 48% 48% 49%
Poker 3% 3% 2% 3% 4% 4% 5% 6% 3% 5%
Other 6% 4% 8% 8% 9% 8% 8% 7% 6% 8%
Quarterly Year-on-Year & Year-on-Year growth %
Sports Betting 7% 59% 40% 25% 9% 38% 19% 8% 31% 16%
Casino & Games 12% 15% 19% 9% 19% 25% 23% 29% 14% 24%
Poker -28% -31% -45% -43% -17% -26% -23% -12% -38% -19%
Other -28% -33% 28% 22% 48% 26% 27% 15% -5% 29%
Sports Betting gross margins (GBP ‘m)
2014 2014 2014 2014 2013 2013 2013 2013 2014 2013
Q4 Q3 Q2 Q1 Q4 Q3 Q2 Q1 FY FY
Sports Betting Stakes 459.6 412.2 460.6 412.5 390.1 335.8 343.8 393.9 1,744.9 1,463.6
Sports Betting Gross winnings revenue:
Live Betting 17.1 18.7 15.9 16.3 14.0 12.7 12.8 12.7 68.0 52.2
Live Betting Margin % 6.0% 6.6% 5.3% 6.2% 5.8% 5.9% 5.9% 5.2% 6.0% 5.7%
Live Betting Share % 47.5% 45.0% 43.2% 45.1% 43.5% 47.2% 51.6% 44.6% 45.2% 46.4%
Pre-game Betting 18.9 22.9 20.9 19.9 18.2 14.2 12.0 15.8 82.6 60.2
Pre-game Betting Margin % 11.0% 17.7% 13.0% 13.4% 12.4% 11.9% 9.5% 10.5% 13.4% 11.1%
Pre-game Betting Share % 52.5% 55.0% 56.8% 54.9% 56.5% 52.8% 48.4% 55.4% 54.8% 53.6%
Total before Free Bets 36.0 41.6 36.8 36.2 32.2 26.9 24.8 28.5 150.6 112.4
Sports Betting margin % (before FB) 7.8% 10.1% 8.0% 8.8% 8.3% 8.0% 7.2% 7.2% 8.6% 7.7%
Free Bets -5.2 -3.5 -4.9 -3.3 -3.5 -2.9 -2.0 -2.3 -16.9 -10.7
Total after Free Bets 30.8 38.1 31.9 32.9 28.7 24.0 22.8 26.2 133.7 101.7
Sports Betting margin % (after FB) 6.7% 9.2% 6.9% 8.0% 7.4% 7.2% 6.7% 6.7% 7.7% 7.0%