Embed Size (px)
Citation preview
Experimental
83
3.1. PLAN OF WORK
The plan of work of the present investigation has been set as follows:
Selection of plants based upon literature survey.
Collection, Identification and Authentication of Plant(s)
Preparation of Extracts (Pet. Ether, Chloroform, Ethanol, Aqueous extracts)
Qualitative Phytochemical study of the extracts
SECTION – I (Hypoglycemic and Anti-diabetic study)
Selection of potent extracts from each plant on alloxan induced hyperglycemic
models
Determination of Dose of the potent extracts by LD50 Determination (Acute toxicity
study)
Oral Glucose Tolerance Test of the extracts
Hypoglycemic activity study of the extracts:
Single dose treated Normoglycemic rats
Multi dose treated Normoglycemic rats
Anti-diabetic activity study of the extracts:
Single dose treated Hyperglycemic rats
Multi dose treated Hyperglycemic rats
Determination of Plasma insulin levels, Beta cell degranulation score, urine sugar in
the multi-dose treated diabetic animals.
Estimation of Glycogen Concentration in Liver & Kidney; and Peripheral glucose
uptake by isolated rat hemi-diaphragm.
Sub-acute Toxicity Study of the extracts: To be carried out for 30 days according to
standard procedures.
• Lipid profile study to find out the correction levels.
• Changes in levels of Serum Enzymes, Total Proteins, Total Bilirubin, Direct
Bilirubin, Albumin and Globulin etc. are to be determined in serum.
• Estimation of Hematological parameters in the last day of study.
• Determination of loss of body weight at intervals during the study.
• Histopathology of liver and kidney of extract treated rats to establish the tissue
changes.
SECTION – II (Anti-oxidant activity study)
Anti-oxidant activity study of the extracts in both in-vitro & in-vivo models.
SECTION – III (Isolation and Characterization)
Isolation and Characterization of new phytochemical from the most potent extract.
Experimental
84
3.2. Animals
Screening methods generally have been carried out on rodents and non-rodents
respectively. As per the concept, male albino wistar rats, weighing 150–200 g and Swiss
albino mice, weighing 20–25 g were used.
3.3. Experimental model for induction of Diabetes
Diabetes was induced by intraperitoneal injection of Alloxan monohydrate (150
mg/kg b.w.) dissolved in the distilled water (Dash et al, 2001). Blood was withdrawn (0.1 ml)
from the tip of the tail of each rat under mild ether anaesthesia. The blood glucose level was
checked before alloxanisation and after alloxanisation regularly in 24h intervals. Animals
were considered diabetic when the blood glucose level was in between 200-300 mg/dl of
blood. This condition was observed at the end of 72 h after alloxanisation.
Alloxan was one of the most widely used chemical diabetogens during initial research
work on experimental diabetes. It is freely soluble in water and slightly acidic with a pKa of
6.63 (Labes and Ferisburger, 1930). Alloxan acts as a diabetogen in rats mice, rabbies, doges
hamster, sheep and monkey, but guinea pigs are resistant to alloxan induced diabetes (Rerup,
1970; Johnson, 1950). It is also effective in neonates, though, very young animals are
resistant to the diabetogenic effect of alloxan (Creutzfeldt, 1949). Alloxan can be
administered by virtually through all routes, i.e. I.V (Bailey and Bailey, 1942), I.M (Dunn
and Mcletchie, 1943), I.P (Gomori and Goldner, 1943), S.C (Dunn and Mcletchie, 1943) and
also by the oral route (Ruben and Yardumian, 1946). The exact mechanism of beta cell
destruction is not clear but several hypotheses have been put forward (Rerup, 1970). In
normal non-fasted animals the blood glucose level after alloxan injection fluctuates in a tri-
phasic pattern. There is early marked hyperglycemia of short duration and then hypoglycemia
for transient period followed by hyperglycemia of long duration (Bonnag et al, 1967;
Lazarow, 1952; Rerup, 1968; Waisbren, 1948)
3.4. Plant Materials
Fresh and mature plant of S. nigrum Linn. and M. pentaphylla Linn. was collected
from Konark, Orissa, India and authenticated by the taxonomist, Dr. A. K. Pradhan,
Professor, Department of Botany, PPD Mahavidyalaya, Tigiria, Cuttack, Orissa, India. The
voucher specimens of S. nigrum Linn. and M. pentaphylla Linn. (Regdn. No.
SPS/SOAU/2009/008 and SPS/SOAU/2008/005 respectively) has been preserved in the
institution herbarium of School of Pharmaceutical Sciences, Siksha ‘O’ Anusandhan
University for future reference. After due authentication, fresh matured leaves of S. nigrum
and aerial parts of M. pentaphylla were collected in bulk, cleaned thoroughly with distilled

Experimental
85
water, followed by shade drying for 12 days. The shade dried materials were coarsely
powdered in an electrical grinder and preserved in a nylon bag in a deep freezer, till further
use.
3.5. Preparation of the extract
Powdered plant material of leaves of S. nigrum (550 g) and aerial parts of M.
pentaphylla (750 g) were first defatted using petroleum ether (60-80 0C) as solvent followed
by successive extraction using the solvents of increasing order of polarity such as chloroform
and ethanol by the process of soxhletion. Then the residual plant products were refluxed with
1500 ml & 2000ml of distilled water, respectively for 48 h. The percentage yield of the
aqueous extracts obtained with respect to the dried plant materials was 21.52% w/w for S.
nigrum and 29.72% w/w for M. pentaphylla.
3.6. Preparation of the test samples
The measured quantity of extracts of both the plants and the standard drug
glibenclamide (2.5 mg/kg) was suspended in 25% Tween-20 in distilled water and used as for
oral administration.
3.7. Preliminary Qualitative Phytochemical study of the plant extracts
The presence of phytoconstituents in the extracts were determined by standard &
prescribed chemical procedure (Kokate et al, 2007; Trease and Evans, 1989; Adetuyi and
Popoola 2001; Sofowora, 1982; Harbone and Baxter 1993) as follows:
Test for Carbohydrates:
Fehling’s solution test: To 5 ml of extract solution, mixed with 5 ml of Fehling’s
solution was boiled for 5 minutes. Formation of brick red colored precipitate demonstrated
the positive test for reducing sugar.
Benedict’s test: To 5 ml of the extract solution, 5 ml of Benedict’s solution was
added in a test tube and boiled for few minutes. Brick red precipitate was developed confirm
the presence of carbohydrates.
Molisch’s test: To 5 ml of the extract solution, 5 ml of of α-napthol was added in a
test tube and concentrated sulphuric acid solution was gently poured into the test tube.
Appearance of purple coloured ring below the aqueous solution confirms the presence of
carbohydrates.
Test for Pentose: To a few ml of extract solution, concentrated hydrochloric acid and
phloroglucinol (1:1) were added and heated. Red coloration confirms the presence of pentose.

Experimental
86
Test for Glycosides:
Legal test: The extract is dissolved in pyridine, sodium nitroprusside solution was
added to it and made alkaline. Formation of pink or red coloration confirms the presence of
glycosides.
Keller-Killani Test: Weigh about 0.5 gm of plant extract in a separate test tube with
2 ml of glacial acetic acid containing a drop of ferric chloride solution. This was under
layered with 1 ml of concentrated tetra oxo sulphate (VI) acid. And observe for brown ring
formation at the interface (Finar, 1983).
Test-3: To the 5 ml of extract solution, 5 ml of sulphuric acid was added. Formation
of green colour shows the presence of glycosides.
Test-4: 200 mg of extract was boiled in a test tube with 5 ml of dilute (10%)
sulphuric acid on a water bath at 1000C for 2 min., centrifuged and pitted out the supernatant
solution. The acidic extract was neutralized with 5 ml of 5% solution of NaOH. To the
neutral solution, 0.1 ml of each Fehlings solution A and Fehlings solution B were added and
heated on the water bath for 2 minutes. Development of red coloration indicates presence of
reducing sugar and glycosides.
Test for Polypeptides or Proteins:
Millon’s reagent test: Small quantities of the extracts are dissolved in a few ml of
water in a test tube and 2 ml of Millon’s reagent was added to the test tube and then warmed.
Formation of red colouration shows the presence of proteins or polypeptides.
Test for Saponins:
Forth Formation Test: 1 ml of extract solution was diluted with distilled water to 20
ml and shaken in a graduated cylinder for 15 minutes. Development of stable foam suggested
the presence of saponins.
Lead acetate Test: 1 ml of extract solution was treated with 1% lead acetate solution.
Formation of white precipitate indicated the presence of saponins.
Test for Tannins:
Ferric chloride Test: 5 ml of extract solution was allowed to heat with 1 ml of 5%
Ferric chloride solution. Greenish black coloration indicated the presence of tannins.
Gelatin Test: To the extract solution, 1% gelatin solution containing 10% sodium
chloride was added. Formation of a white colored precipitate confirmed the presence of
tannins.

Experimental
87
Lead acetate Test: 5 ml of extract solution was treated with 1 ml of 10% lead acetate
solution in water. Yellow colored precipitation gave the test for tannins.
Test for Fats and oils:
Test-1: A small quantity of extracts is pressed separately between two filter papers.
Oil stains on the paper indicate the presence of fixed oils.
Test-2: Few drops of 0.5 N alcoholic potassium hydroxide is added to a small
quantity of the extracts along with drop of phenolphthalein. The mixture is heated on water
bath for 1-2 hours. Formation of soap or partial neutralization of alkali indicates the presence
of fixed oils and fats.
Test for alkaloids:
Mayer’s Reagent: 1.5 ml of extract was taken in a test tube. 0.2 ml of dilute
hydrochloric acid and 0.1 ml of Mayer’s reagent were added. Formation of cream color
precipitate gives positive test for alkaloids.
Dragendroff’s Reagent: 0.1 ml of dilute hydrochloric acid and 0.1 ml of
Dragendroff’s reagent were added in 2 ml solution of extract in a test tube. Development of
orange brown color precipitate suggested the presence of alkaloids.
Wagner’s Reagent: 2 ml of extract solution was treated with dilute hydrochloric acid
and 0.1 ml of Wagner’s reagent. Formation of reddish brown precipitate indicated the
positive response for alkaloids.
Hager’s Reagent: 2 ml of extract was allowed to react with 0.2 ml of dilute
hydrochloric acid and 0.1 ml Hager’s reagent. Yellowish precipitate suggested the presence
of alkaloids
Test for Phytosterols:
The extracts are refluxed with solution of alcoholic potassium hydroxide till complete
saponification takes place. The saponification mixture is diluted with distilled water and
extracted with ether. The ethereal extract is evaporated and the residue (unsaponificable
matter) is subjected to Liebermann Burchard’s test.
Test for flavonoids:
Alkaline Reagent Test: 5 ml of extract solution was hydrolysed with 10 % v/v
sulphuric acid and cooled. Then it was extracted with diethyl ether and dissolved into 3
portions in 3 separate test tubes. 1 ml of dilute ammonia, 1ml of dilute sodium bicarbonate
Experimental
88
and 1 ml of 0.1(N) sodium hydroxide were added to the first, second and third test tube
respectively. In each test tube development of yellow color indicated the presence of
flavonoids.
Shinoda Test: The extract was dissolved in alcohol. 1 piece of magnesium followed
by concentrated hydrochloric acid was added drop wise to that and heated. Appearance of
magenta color demonstrated the presence of flavonoids.
Test for Terpenoids:
Test-1: Weigh about 0.5 g plant extract in separate test tubes with 2 ml of chloroform.
And concentrated Sulphuric acid carefully added to form a layer. And observed for presence
of reddish brown color interface to show positive results for the presence of terpenoids.
Test-2: To the extract solution, alcoholic solution of Sudan III is added, Red colour
obtained by the globules indicates presence of terpenoids.
Test-3: To the extract solution, a drop of tincture alkana is added. Red colour
indicates the presence of terpenoids.
Test for Steroids:
Libermann-Burchard Test: 10 mg of extract was dissolved in 1 ml of chloroform. 1
ml of acetic anhydride was added following the addition of 2 ml of concentrated sulphuric
acid. Formation of reddish violet color indicated the presence of steroids & Triterpenes.
Salkowski Test: 1ml of concentrated sulphuric acid was added to 10 mg of
methanolic extract dissolved in 1 ml of chloroform reddish blue color exhibited by
chloroform layer and green fluorescence by the acid layer suggested the presence of steroids.

Experimental
89
SECTION - I
Hypoglycemic and Anti-Diabetic Study

Experimental
90
3.8. Maintenance of Animals and approval of protocol
Prior to the experiments, the selected animals were housed in acrylic cages in standard
environmental conditions (temp: 20–25 0C; relative humidity: 45-55 % under 12 h light/dark
cycle), fed with standard rodent diet supplied by M/s Hindustan Lever Ltd., Bangalore, India,
for 1 week in order to adapt to the laboratory conditions and water ad libitum. They were
fasted overnight (12 h) before experiments, but were allowed free access to water. The place
where the experiments were conducted kept very hygienic by cleaning with antiseptic
solutions. The husk, which was for the purpose of keeping as a bed to the animals, was
autoclaved and cleaned. Six animals were used for each group of study. All the experiments
on animals were conducted in accordance with the internationally accepted principles for
laboratory animal use and as per the experimental protocols duly approved by the
Institutional Ethical Committee (IAEC No. 1171/C/08/CPCSEA) with the project approval
no. 08/09/IAEC/SOAU, the dated. 21/03/2009.
3.9. Selection of potent extracts in reducing blood glucose level on alloxan induced
hyperglycemic acute model
The acclimatized animals (wistar rats) were kept fasting for 24 h with water ad
libitum and injected intraperitoneally a dose of 150 mg/kg of alloxan monohydrate in normal
saline. After 1 h, the animals were provided feed ad libitum. The blood glucose level was
checked before alloxanisation and after alloxanisation regularly in 24h intervals. As described
above, after 72 hrs, the animals showing blood glucose levels in between 200-300 mg/dl were
selected and were segregated into six groups of six rats in each. Group I served as solvent
control and received only vehicle (Tween + water - 2 ml/kg b.w.) through oral route. Group II
received glibenclamide (2.5 mg/kg b.w.). Groups III, IV, V and VI received Petroleum ether,
Chloroform, Ethanol and Aqueous extracts of each plant at the selected doses in a similar
manner. Blood glucose level of each rat was estimated at 1, 2, 4, 6, 8 and 10 h, respectively.
(Basing on the previous works cited in various literatures, the trial doses for the various
extracts of both the plants were selected i,e. 100mg/kg b.w. for S. nigrum extracts and
500mg/kg b.w. for M. pentaphylla extracts.) (Dash et al., 2001).
3.10. Acute toxicity study: (LD50 determination of the potent extracts)
The purpose of this acute toxicity study is to determine the nature and extent of the
untoward reaction that might follow the administration of a single dose (or an overdose) of
the drug. A quantitative aspect of the acute toxicity testing is the determination of the lethal
dose of the test samples. This is usually alone and it conveys less information than does the
ratio of lethal to effective dose (LD50: ED50), a quantity which is known as Therapeutic index.
Experimental
91
The method of Seth et al. (1972) was followed. Five groups for the aqueous extract of
leaves of S. nigrum (ALSN) and Six groups for aqueous extract of aerial parts of M.
pentaphylla (AAMP), of ten mice each, of mixed sex fasted overnight were kept under
laboratory conditions and allowed free access to water. The aqueous extracts from both the
plants at increasing concentrations dissolved in distilled water were administered orally via a
gastric catheter. After administration of test sample, the animals were observed critically for
first 4 h for any behavioural changes, followed by occasional observation for 6h and finally
mortality was recorded after 48 hours.
There are several methods used to calculate LD50 value, namely, the graphical
method, arithmetical method and statistical approach. For research purpose, the most widely
used method is that of Litchfield and Wilcoxon (1949). Determination of LD50 demands the
use of a relatively large number of animals and it is customary to make an accurate
determination of LD50 on only one species (rat or mouse) by standard method. An advantage
of determining this LD50 value at an early stage in the investigation of a new drug is that the
doses used to establish the drug’s spectrum of pharmacological activities can be related to its
lethal dose.
3.11. Determination of blood glucose levels
Fasting blood glucose concentration was measured, using a Glucometer (Optium
make), based on the glucose oxidase method. Blood samples were collected from the tip of
tail at the defined time patterns (Aslan et al., 2007a,b). The Screening for antihyperglycaemic
activity was performed as per the standard procedures (Dash et al., 2001).
Principle of Glucometer system in measuring blood glucose level
(http://en.wikipedia.org/wiki/Glucose_meter)
A glucose meter (or glucometer) is a medical device for determining the approximate
concentration of glucose in the blood. It is a key element of home blood glucose monitoring
(HBGM) by people with diabetes mellitus or hypoglycemia. A small drop of blood, obtained
by pricking the skin with a lancet, is placed on a disposable test strip that the meter reads and
uses to calculate the blood glucose level. The meter then displays the level in mg/dl or
mmol/l. Since approximately 1980, a primary goal of the management of type 1 diabetes and
type 2 diabetes mellitus has been achieving closer-to-normal levels of glucose in the blood
for as much of the time as possible, guided by HBGM several times a day. The benefits
include a reduction in the occurrence rate and severity of long-term complications from
hyperglycemia as well as a reduction in the short-term, potentially life-threatening
complications of hypoglycemia.

Experimental
92
Many glucose meters employ the oxidation of glucose to gluconolactone catalyzed by
glucose oxidase (sometimes known as GOx). Others use a similar reaction catalysed instead
by another enzyme, glucose dehydrogenase (GDH). This has the advantage of sensitivity over
glucose oxidase but is more susceptible to interfering reactions with other substances.
The first-generation devices relied on the same colorimetric reaction that is still used
now-a-days in glucose test strips for urine. Besides glucose oxidase, the test kit contains a
benzidine derivative, which is oxidized to a blue polymer by the hydrogen peroxide formed
in the oxidation reaction. The disadvantage of this method was that the test strip had to be
developed after a precise interval (the blood had to be washed away), and the meter needed to
be calibrated frequently.
Most glucometers today use an electrochemical method. Test strips contain a capillary
that sucks up a reproducible amount of blood. The glucose in the blood reacts with an
enzyme electrode containing glucose oxidase (or dehydrogenase). The enzyme is reoxidized
with an excess of a mediator reagent, such as a ferricyanide ion, a ferrocene derivative or
osmium bipyridyl complex. The mediator in turn is reoxidised by reaction at the electrode,
which generates an electrical current. The total charge passing through the electrode is
proportional to the amount of glucose in the blood that has reacted with the enzyme. The
coulometric method is a technique where the total amount of charge generated by the glucose
oxidation reaction is measured over a period of time. This is analogous to throwing a ball and
measuring the distance it has covered so as to determine how hard it was thrown. The
amperometric method is used by some meters and measures the electrical current generated at
a specific point in time by the glucose reaction. This is analogous to throwing a ball and using
the speed at which it is travelling at a point in time to estimate how hard it was thrown. The
coulometric method can allow for variable test times, whereas the test time on a meter using
the amperometric method is always fixed. Both methods give an estimation of the
concentration of glucose in the initial blood sample.
3.11.1. Effect of the selected extracts on glucose loaded hyperglycemic rats (oral glucose
tolerance test)
The animals were segregated into six groups of six rats in each. Group I served as
solvent control and received only vehicle (Tween + water - 2 ml/kg b.w.) through oral route.
Group II received glibenclamide (2.5 mg/kg b.w.). Groups III and IV received aqueous
extract of leaves of S. nigrum (ALSN) at the dose levels of 50 and 100 mg/kg b.w.
respectively. Groups V and VI received aqueous extract of aerial parts of M. pentaphylla
(AAMP) at the dose levels of 250 and 500 mg/kg b.w. respectively. All the administrations

Experimental
93
have been done through oral route. The animals were ingested with glucose (1 g/kg) in
distilled water 30 minutes after the administration of the drug and extract treatments. The
blood glucose levels were measured at 0, 0.5, 1, 2, and 4 hrs interval respectively.
3.11.2. Hypoglycemic activity study of the selected extracts on normoglycaemic animals
The hypoglycemic activity study has been carried out in the following two models:
Single dose treated normoglycemic rats
Multi dose (30 days) treated normoglycemic rats
3.11.2.1. In single dose treated normoglycaemic rats
The animals were fasted for 12 h, but were allowed to free access of water during
course of the experiment. At the end of the fasting period, taken as zero time (0 h), the
normal rats were then divided into six groups of six animals each. Group I served as solvent
control and received only vehicle (2 ml/kg) through oral route, Group II received
glibenclamide (2.5 mg/kg) and served as reference control. Groups III and IV received
aqueous extract of leaves of S. nigrum (ALSN) at the dose levels of 50 and 100 mg/kg b.w.
respectively.; Groups V and VI received aqueous extract of aerial parts of M. pentaphylla
(AAMP) at the dose levels of 250 and 500 mg/kg b.w. respectively, in a similar manner.
Blood was withdrawn (0.1 ml) from the tip of the tail of each rat under mild ether
anaesthesia. Blood glucose levels were examined after 1, 2, 4, 6, 8 and 10 h of administration
of single dose of test and control samples.
3.11.2.2. In multi dose treated normoglycaemic rats
The animals were fasted for 12 h, but were allowed free access to water before and
throughout the duration of experiment. The rats were then divided into six groups of six
animals each. Group I served as solvent control and received only vehicle (2 ml/kg) through
oral route, Group II received glibenclamide (2.5 mg/kg) and served as reference control.
Groups III and IV received aqueous extract of leaves of S. nigrum (ALSN) at the dose levels
of 50 and 100 mg/kg b.w. respectively.; Groups V and VI received aqueous extract of aerial
parts of M. pentaphylla (AAMP) at the dose levels of 250 and 500 mg/kg b.w. respectively, in
a similar manner. The test extracts, standard drug and solvent were administered to respective
group once daily for 30 days. Blood was withdrawn (0.1 ml) from the tip of the tail of each
rat under mild ether anaesthesia. The blood glucose level was measured on 0, 5, 10, 15, 20,
25 and 30 day of treatment.

Experimental
94
3.11.3. Anti-diabetic activity study of the selected extracts on alloxan induced diabetic
animals
The anti-diabetic/ antihyperglycemic activity study has been carried out in the
following two models:
Single dose treated alloxan induced hyperglycemic rats
Multi dose (30 days) treated alloxan induced hyperglycemic rats
3.11.3.1. In single dose treated alloxan induced hyperglycemic rats
The acclimatized animals were kept fasting for 24 h with water ad libitum and
injected intraperitoneally a dose of 150 mg/kg of alloxan monohydrate in normal saline. After
1 h, the animals were provided feed ad libitum. After 72h, the diabetic animals were
segregated into six groups of six rats in each. Group I served as solvent control and received
only vehicle (2 ml/kg) through oral route. Group II received glibenclamide (2.5 mg/kg).
Groups III and IV received aqueous extract of leaves of S. nigrum (ALSN) at the dose levels
of 50 and 100 mg/kg b.w. respectively.; Groups V and VI received aqueous extract of aerial
parts of M. pentaphylla (AAMP) at the dose levels of 250 and 500 mg/kg b.w. respectively, in
a similar manner. Blood glucose level of each rat was estimated at 1, 2, 4, 6, 8 and 10 h,
respectively.
3.11.3.2. In multi dose treated alloxan induced hyperglycemic rats
The animals were kept fasting for 24 h with water ad libitum and injected
intraperitoneally a dose of 150 mg/kg of alloxan monohydrate in normal saline. After 1 h, the
animals were provided rodent-feed ad libitum. The blood glucose level was measured 72 h
after administration of alloxan. The diabetic animals were segregated into six groups of six
rats each. Group I served as solvent control and received only vehicle (2 ml/kg) through oral
route. Group II received glibenclamide (2.5 mg/kg); Groups III and IV received aqueous
extract of leaves of S. nigrum (ALSN) at the dose levels of 50 and 100 mg/kg b.w.
respectively.; Groups V and VI received aqueous extract of aerial part of M. pentaphylla
(AAMP) at the dose levels of 250 and 500 mg/kg b.w. respectively, in a similar manner. The
test extracts, standard drug and solvent were administered to respective group once daily for
30 days. The blood glucose level was measured on 0, 5, 10, 15, 20, 25 and 30th
day of
treatment.
3.12. Determination of Urine Sugar in Multi- dose treated in diabetic rats
Capillary tube method of urine collection was used to collect the urine sample from
the diabetic rats on 0th
, 10th
, 20th
and 30th
day of treatment (Hayashi and Sakaguchi, 1975)

Experimental
95
The rat was held with one hand and the lower part of the abdomen, around the urinary
bladder, was pressed with the thumb and the third finger of the other hand of the collector, to
cause urinary excretion. The urine excreted was immediately collected directly into two
capillary tubes held between the index and middle fingers. The method was found to be
suitable for routine urinalysis in rats and mice.
After collection, Urinary blood glucose was determined using by reagent based
Uristix from Bayer Diagnostics. Only one drop of urine is kept on the test strips and the color
change on the test strip was evaluated to determine the concentration of glucose by referring
to the color index on test strip container [The Institutional Animal Care and Use Committee
(IACUC) standard procedures.
Web: http://www.iacuc.ucsf.edu/Policies/GlucoseMonitoringUrine.doc.
3.13. Study of Glucose-uptake by isolated rat hemi-diaphragm
The rats’ hemi diaphragms were isolated from the selected healthy albino rats
immediately after killing the animals by decapitation, at the end of the 30 days of treatment.
The diaphragms were divided into two halves. The hemidiaphragms were then placed in
culture tubes containing 2ml tyrode solution with 2g% glucose and incubated for 30 min at
37 0C in an atmosphere of 95% O2 – 5% CO2 with shaking. Ten sets of similar experiments
were performed, in which, (I) corresponds to diabetic control (II) reference standard insulin
(0.25 IU/ml), (III) ALSN (50 mg/ml), (IV) ALSN (100 mg/ml), (V) AAMP (250 mg/ml), (VI)
AAMP (500 mg/ml), (VII) insulin (0.25 IU/ml + ALSN (50 mg/ml), (VIII) insulin (0.25 IU/ml
+ ALSN (100 mg/ml), (IX) insulin (0.25 IU/ml + AAMP (250 mg/ml) and (X) insulin (0.25

Experimental
96
IU/ml + AAMP (500 mg/ml) respectively. Following incubation, the hemidiaphragms were
taken out and weighed. The glucose content of the incubated medium was measured. Glucose
uptake was calculated as the difference between the initial and final glucose content in the
incubation medium (Chattopadhyay et al. 1992).
3.14. Study of Glycogen concentration in liver and kidney
At the end of the experimental period (after 30 days of daily dosing), animals were
sacrificed by cervical dislocation. Liver and kidney samples were removed out and washed
immediately with ice cold saline to remove as much blood as possible, and then the tissues
were subjected to estimate glycogen concentration (Morales et al, 1973). Known weight of
the liver & kidney tissues were subjected to alkali digestion with 30% KOH in boiling water
bath for 20 minutes. 3.0ml of ethanol was added and tubes were kept in a freezer overnight.
They were centifuged at 3000rpm for 40 minutes. The precipitate was dissolved in warm
water, re-precipitated with ethanol ad centrifuged again. The final precipitate was dissolved
in 3.0 ml of distilled water and heated for 5 minutes in a boiling water bath. Aliquots of the
sample were mixed with 4.0ml of Anthrone reagent, heated in a boiling water bath for 20
minutes. The green colour developed was read at 600 nm using Systronics UV – VIS
spectrophotometer. The glycogen content in the tissues is expressed as mg/g wet tissue.
3.15. Study of the Plasma Insulin levels in multi-dose treated diabetic rats
Six groups of rats were taken out of which Group I served as diabetic control, Group
II animals received oral daily dose of glibenclamide (2.5 mg/kg), Group III and Group IV
received ALSN (50mg/kg) & ALSN (100 mg/kg), Group V and Group VI received AAMP
(250mg/kg) & AAMP (500mg/kg) respectively. Blood was collected at 0, 5, 10, 20 & 30th
day
and plasma insulin was measured by following the method of Radio Immunoassay (RIA),
employing double antibody technique using insulin kit (Saxena et al.,1996). Insulin values
were expressed as µU/ml.
3.16. Study of the effect of the extracts on Beta cell degranulation score in multi-dose
treated diabetic rat pancreas
The animal groups and treatment for the study were made similar to that of the above
experiment, the animals were sacrificed and pancreas collected, at different intervals from 0th
to 30th
days of post-treatment. Pancreas was fixed in Bouin’s fluid followed by paraplast
sectioning. Serial sections, measuring about 5 µm each, were stained with Mowry’s aldehyde
fuchsin and by peroxidase-antiperoxidase (PAP) immunohistochemical method for beta cell
granules and immuno-stainable insulin, respectively (Saxena et al 1993). Using the following

Experimental
97
scoring criteria, the degree of beta cell degranulation / loss of immunostainable insulin
content was determined (Saxena et al 1996):
0 = Normal granularity, + = About 25 % of cells are degranulated, ++ = About 50 %
of cells are degranulated, +++ = About 75 % of cells are degranulated, ++++ = Almost all the
are cells degranulated. At least 3 randomly selected sections from each of the treatment group
were used for scoring.
3.17. Sub –acute study of the extracts on the diabetic rats at the end of 30th
day of
treatment.
3.17.1. Study of the effect of the extracts on Serum lipid profile in multi-dose treated
diabetic rat.
At the end of 30 days of treatment with the test extract, the animals were sacrificed by
decapitation under ether anesthesia and blood samples were collected from test, standard and
solvent treated groups including normal animal as reference. The serum supernatant was
separated out by centrifugation for 20 min at 2000rpm by a high speed REMI centrifuge and
was subjected for the determination of the lipid profile studies such as total lipids,
phospholipids, total cholesterol, triglycerides, HDL, LDL, VLDL and free fatty acids as per
the standard experimental procedures described.
3.17.1.1. Estimation of Total Lipids (Sulphophosphovanilin method) (Frings et al. 1972)
Lipids react with vanillin in the presence of sulphuric acid and phosphoric acid to
form a pink colored complex.
Reagents:
1. Total lipid standard: 1000 mg/dl
It is prepared by dissolving 1.0 gm of olive oil in chloroform.
2. Colour reagent (Phosphovanilin): It is prepared by mixing
a. 0.61 gm/dl vanillin : 350 ml.
b. Orthophosphoric acid : 600 ml.
c. Distilled water : 50 ml.
3. Concentrated sulphuric acid (AR)
Pipetted in the tubes labeled as follows;
Test Standard
Solution 1 - 0.05 ml
Serum 0.05 ml -
Reagent 3 2.0 ml 2.0 ml

Experimental
98
Mixed thoroughly and plugged with cotton wool. Then it was kept in a boiling water
bath for 10 mins. Then cooled in cold water bath and again pipetted into dry test tubes as
follows:
Test Standard Blank
From above solution, ml 0.10 0.10 -
Reagent 3, ml - - 0.10
Coloring agent, ml 2.5 2.5 2.5
Mixed thoroughly and kept at room temperature (25oC ± 5
oC) for 15 minutes. Read
absorbance of test and std against blank in a dry cuvette at 546 nm.
Calculation: Serum Total lipids (mg/dl) = (O.D. of test/O.D. of Std.) X 100
3.17.1.2. Estimation of Phospholipids (Stewert, 1980)
Reagents:
1. Ammonium ferrotjiacyanate solution (0.1 M). 27.03 gm of ferric chloride hexahydrate
and 30.40 gm of ammonium thiocyanate was dissolved in double distilled water, and
the volume was adjusted up to 1000 ml with distilled water.
2. Anhydrous sodium sulphate.
3. Standard Phospholipid (1 mg/ml). %0 mg of egg lecithin was dissolved in 10 ml of
chloroform. 2 ml of this solution was diluted to 10 ml with chloroform. This solution
of 1 mg/kg was used for the preparation of calibration curve.
0.5 ml of sample was mixed with 0.2 ml of ammonium ferrothiocyanate solution and 2.5
ml of chloroform. The contents of the tubes were vortexed vigorously on cyclo-mixer for 15
seconds and centrifuged at 1000 rpm. The lower layer was removed by using syringe with
long needle and retained in another test tube containing a pinch of anhydrous sodium
sulphate. The absorbance of solution was taken at 485 nm using a blank.
From calibration curve: y = 0.1229 x + 0.0024.
3.17.1.3. Estimation of Total Cholesterol (TC) (CHOD-PAP-Phosphotungstate method)
(Richmond, 1973; Hendry, 1974)
In vitro quantitative determination of the activity of Cholesterol in serum was
estimated by CHOD-PAP method using an Enzymatic Diagnostic Kit from Monozyme India
limited. Cholesterol and its esters are released from lipoproteins by detergents. Cholesterol
esterase (CHE) hydrolyses the cholesterol esters. In the subsequent enzymatic oxidation, the
free cholesterol is oxidized by cholesterol oxidase (CHO) to choloest-4-ene-3-one and H2O2.
Hydrogen peroxide is converted into a colored quinonimine in a reaction with 4-
Experimental
99
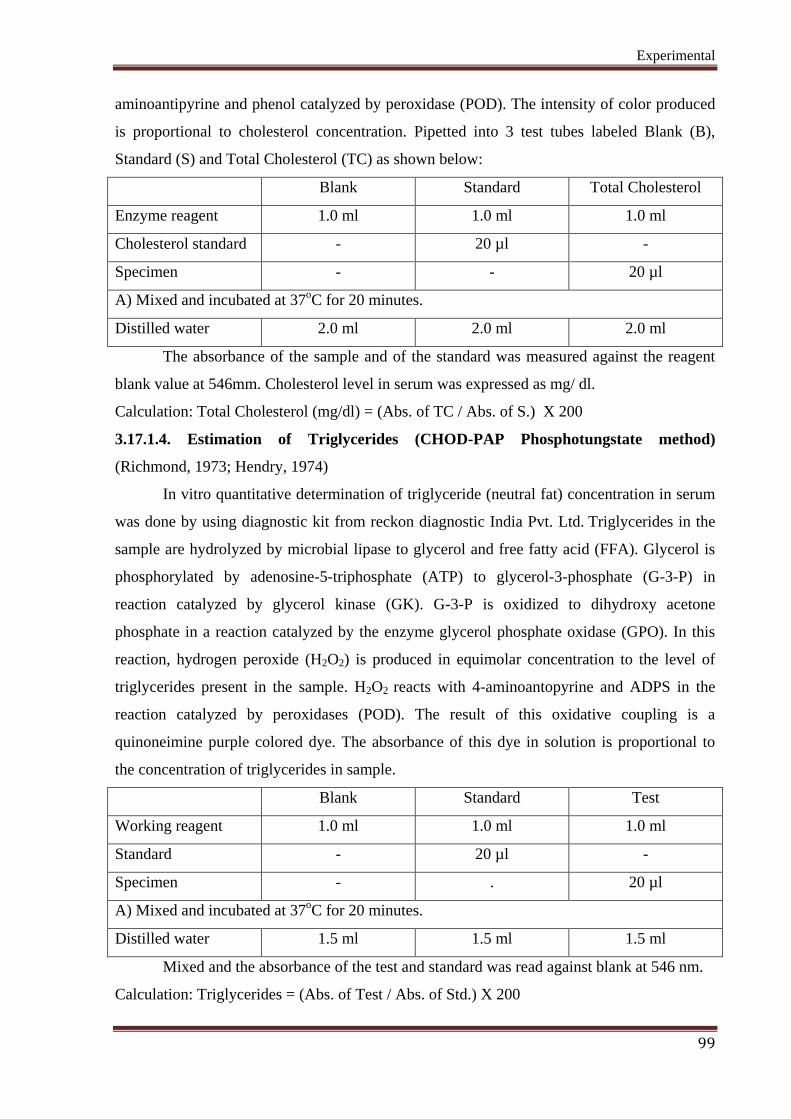
aminoantipyrine and phenol catalyzed by peroxidase (POD). The intensity of color produced
is proportional to cholesterol concentration. Pipetted into 3 test tubes labeled Blank (B),
Standard (S) and Total Cholesterol (TC) as shown below:
Blank Standard Total Cholesterol
Enzyme reagent 1.0 ml 1.0 ml 1.0 ml
Cholesterol standard - 20 µl -
Specimen - - 20 µl
A) Mixed and incubated at 37oC for 20 minutes.
Distilled water 2.0 ml 2.0 ml 2.0 ml
The absorbance of the sample and of the standard was measured against the reagent
blank value at 546mm. Cholesterol level in serum was expressed as mg/ dl.
Calculation: Total Cholesterol (mg/dl) = (Abs. of TC / Abs. of S.) X 200
3.17.1.4. Estimation of Triglycerides (CHOD-PAP Phosphotungstate method)
(Richmond, 1973; Hendry, 1974)
In vitro quantitative determination of triglyceride (neutral fat) concentration in serum
was done by using diagnostic kit from reckon diagnostic India Pvt. Ltd. Triglycerides in the
sample are hydrolyzed by microbial lipase to glycerol and free fatty acid (FFA). Glycerol is
phosphorylated by adenosine-5-triphosphate (ATP) to glycerol-3-phosphate (G-3-P) in
reaction catalyzed by glycerol kinase (GK). G-3-P is oxidized to dihydroxy acetone
phosphate in a reaction catalyzed by the enzyme glycerol phosphate oxidase (GPO). In this
reaction, hydrogen peroxide (H2O2) is produced in equimolar concentration to the level of
triglycerides present in the sample. H2O2 reacts with 4-aminoantopyrine and ADPS in the
reaction catalyzed by peroxidases (POD). The result of this oxidative coupling is a
quinoneimine purple colored dye. The absorbance of this dye in solution is proportional to
the concentration of triglycerides in sample.
Blank Standard Test
Working reagent 1.0 ml 1.0 ml 1.0 ml
Standard - 20 µl -
Specimen - . 20 µl
A) Mixed and incubated at 37oC for 20 minutes.
Distilled water 1.5 ml 1.5 ml 1.5 ml
Mixed and the absorbance of the test and standard was read against blank at 546 nm.
Calculation: Triglycerides = (Abs. of Test / Abs. of Std.) X 200

Experimental
100
3.17.1.5. Estimation of HDL Cholesterol (CHOD-PAP-Phosphotungstate method)
(Richmond, 1973; Hendry, 1974)
In vitro quantitative determination of the activity of Cholesterol in serum was
estimated by CHOD-PAP method using an Enzymatic Diagnostic Kit from Monozyme India
limited. The VLDL and LDL fractions of serum sample are precipitated using PTA and then
HDL in the supernatant is separated by centrifugation and measured for its cholesterol
content. The enzyme cholesterol ester hydrolase (CHE) hydrolyses the ester cholesterol. Then
cholesterol is oxidized by cholesterol oxidase (CHO) to cholest-4-en-3-one and H2O2.
Hydrogen peroxide in presence of enzyme peroxidase (POD) reacts with 4-aminoantipyrine
and phenol to produce a red colored complex, whose absorbance is proportional to HDL-
cholesterol concentration. Pipetted into a centrifuge tube as follows:
Serum 0.2 ml
Precipitating Reagent 0.3 ml
Mixed well and allowed standing at RT for 5 minutes. Then centrifuged at 3000 rpm
for 10 minutes to get a clear supernatant. If the supernatant is not clear (high TG level), then
dilute the sample 1:1 with normal saline. Pipetted into 3 test tubes labeled Blank (B),
Standard (S) and HDL cholesterol (H) as shown below;
Blank Standard HDL Cholesterol
Enzyme reagent 1.0 ml 1.0 ml 1.0 ml
Cholesterol Standard - 20 µl -
Supernatant - . 20 µl
A) Mixed and incubated at 37oC for 20 minutes.
Distilled water 1.5 ml 1.5 ml 1.5 ml
The absorbance of the sample and of the standard was measured against the reagent
blank value at 546mm. HDL Cholesterol level in serum was expressed as mg/dl.
Calculations: HDL Cholesterol (mg/dl) = (Abs. of H / Abs. of S.) X 50
3.17.1.6. LDL & VLDL Cholesterol (Friedwald et al, 1972)
LDL and VLDL Cholesterol were estimated by the standard formula as follows and
were expressed as mg/dl.
VLDL = Triglycerides /5
LDL cholesterol = Total cholesterol – (HDL cholesterol + VLDL cholesterol)
3.17.1.7. Free Fatty acids determination
The centrifuged supernatant from the collected serum of the multi-dose treated rats
were subjected for the determination of the levels of free fatty acids as per the standard
experimental procedure described in Falholt et al, 1973.
Experimental
101
3.17.2. Study of the effect of the extracts on levels of Serum Enzymes, Total Proteins,
Total Bilirubin, Direct Bilirubin, Albumin and Globulin in multi-dose treated diabetic
rat.
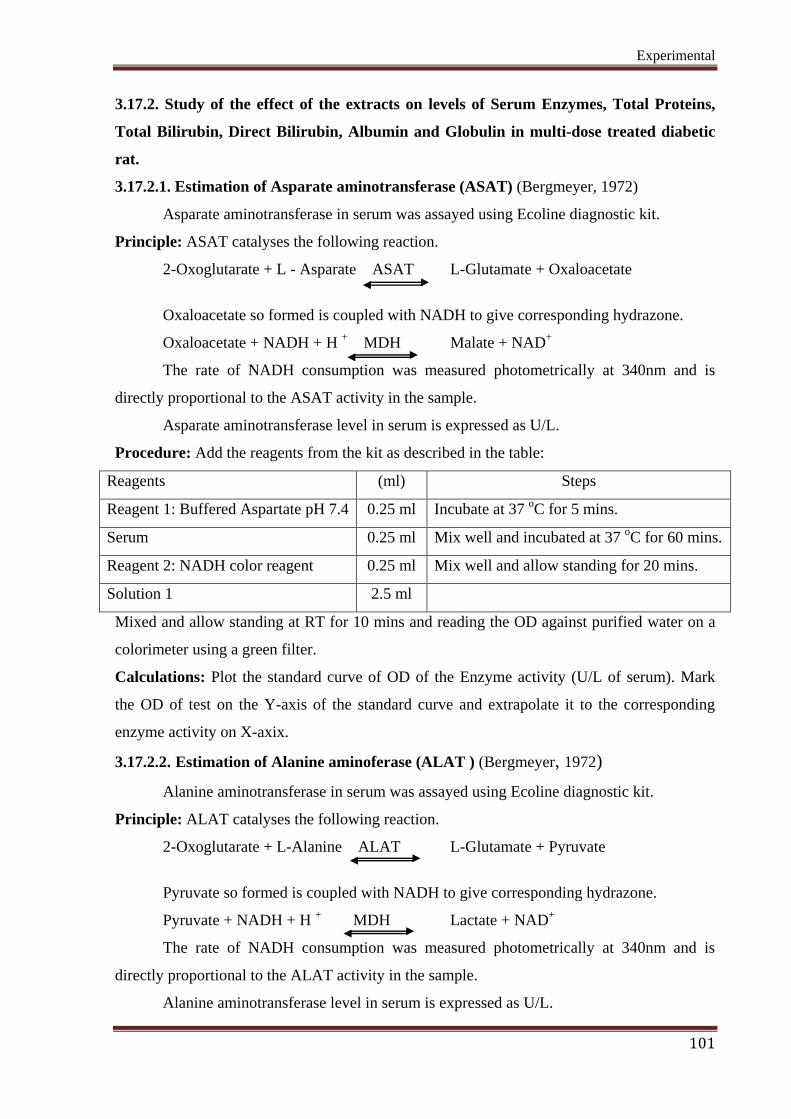
3.17.2.1. Estimation of Asparate aminotransferase (ASAT) (Bergmeyer, 1972)
Asparate aminotransferase in serum was assayed using Ecoline diagnostic kit.
Principle: ASAT catalyses the following reaction.
2-Oxoglutarate + L - Asparate ASAT L-Glutamate + Oxaloacetate
Oxaloacetate so formed is coupled with NADH to give corresponding hydrazone.
Oxaloacetate + NADH + H + MDH Malate + NAD
+
The rate of NADH consumption was measured photometrically at 340nm and is
directly proportional to the ASAT activity in the sample.
Asparate aminotransferase level in serum is expressed as U/L.
Procedure: Add the reagents from the kit as described in the table:
Reagents (ml) Steps
Reagent 1: Buffered Aspartate pH 7.4 0.25 ml Incubate at 37 oC for 5 mins.
Serum 0.25 ml Mix well and incubated at 37 oC for 60 mins.
Reagent 2: NADH color reagent 0.25 ml Mix well and allow standing for 20 mins.
Solution 1 2.5 ml
Mixed and allow standing at RT for 10 mins and reading the OD against purified water on a
colorimeter using a green filter.
Calculations: Plot the standard curve of OD of the Enzyme activity (U/L of serum). Mark
the OD of test on the Y-axis of the standard curve and extrapolate it to the corresponding
enzyme activity on X-axix.
3.17.2.2. Estimation of Alanine aminoferase (ALAT ) (Bergmeyer, 1972)
Alanine aminotransferase in serum was assayed using Ecoline diagnostic kit.
Principle: ALAT catalyses the following reaction.
2-Oxoglutarate + L-Alanine ALAT L-Glutamate + Pyruvate
Pyruvate so formed is coupled with NADH to give corresponding hydrazone.
Pyruvate + NADH + H + MDH Lactate + NAD
+
The rate of NADH consumption was measured photometrically at 340nm and is
directly proportional to the ALAT activity in the sample.
Alanine aminotransferase level in serum is expressed as U/L.
Experimental
102
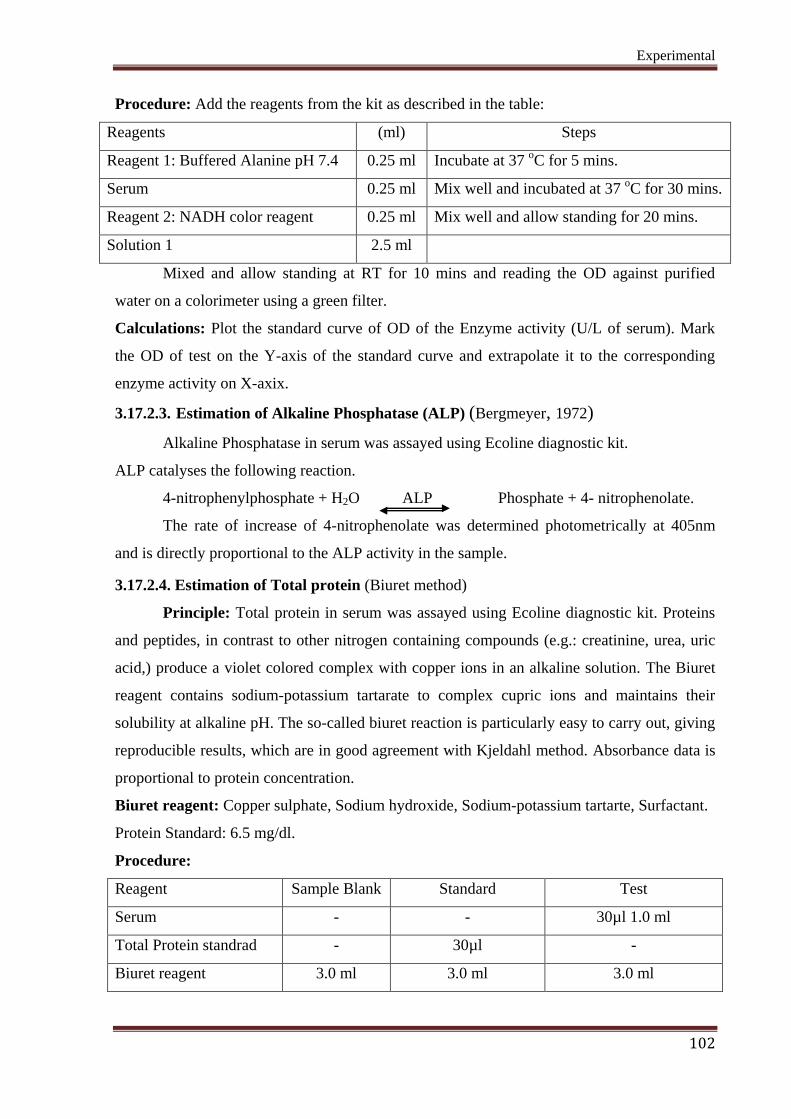
Procedure: Add the reagents from the kit as described in the table:
Reagents (ml) Steps
Reagent 1: Buffered Alanine pH 7.4 0.25 ml Incubate at 37 oC for 5 mins.
Serum 0.25 ml Mix well and incubated at 37 oC for 30 mins.
Reagent 2: NADH color reagent 0.25 ml Mix well and allow standing for 20 mins.
Solution 1 2.5 ml
Mixed and allow standing at RT for 10 mins and reading the OD against purified
water on a colorimeter using a green filter.
Calculations: Plot the standard curve of OD of the Enzyme activity (U/L of serum). Mark
the OD of test on the Y-axis of the standard curve and extrapolate it to the corresponding
enzyme activity on X-axix.
3.17.2.3. Estimation of Alkaline Phosphatase (ALP) (Bergmeyer, 1972)
Alkaline Phosphatase in serum was assayed using Ecoline diagnostic kit.
ALP catalyses the following reaction.
4-nitrophenylphosphate + H2O ALP Phosphate + 4- nitrophenolate.
The rate of increase of 4-nitrophenolate was determined photometrically at 405nm
and is directly proportional to the ALP activity in the sample.
3.17.2.4. Estimation of Total protein (Biuret method)
Principle: Total protein in serum was assayed using Ecoline diagnostic kit. Proteins
and peptides, in contrast to other nitrogen containing compounds (e.g.: creatinine, urea, uric
acid,) produce a violet colored complex with copper ions in an alkaline solution. The Biuret
reagent contains sodium-potassium tartarate to complex cupric ions and maintains their
solubility at alkaline pH. The so-called biuret reaction is particularly easy to carry out, giving
reproducible results, which are in good agreement with Kjeldahl method. Absorbance data is
proportional to protein concentration.
Biuret reagent: Copper sulphate, Sodium hydroxide, Sodium-potassium tartarte, Surfactant.
Protein Standard: 6.5 mg/dl.
Procedure:
Reagent Sample Blank Standard Test
Serum - - 30µl 1.0 ml
Total Protein standrad - 30µl -
Biuret reagent 3.0 ml 3.0 ml 3.0 ml

Experimental
103
Mixed well and incubated at 37oC for 5 minutes. The absorbance of the sample and
that of the standard measured against the biuret reagent and the absorbance of the blank
against water of 546nm. Total protein level in serum is expressed as g/l.
Calculation: (Abs. of Test / Abs. of Std.) X 6.5
[Kjeldahl method is usually considered to be the standard method of determining
protein concentration. Because this method does not measure the protein content directly, a
conversion factor (F) is needed to convert the measured nitrogen concentration to a protein
concentration. A conversion factor of 6.25 (equivalent to 0.16 g nitrogen per gram of protein)
is used for many applications, however, this is only an average value, and each protein has a
different conversion factor depending on its amino-acid composition. The Kjeldahl method
was developed in 1883 by a brewer called Johann Kjeldahl. A food is digested with a strong
acid so that it releases nitrogen which can be determined by a suitable titration technique. The
amount of protein present is then calculated from the nitrogen concentration of the food.]
3.17.2.5. Estimation of Total Bilirubin
(Jendrassik and Grof, 1938; Schellong and Wende, 1960)
Principle: Total bilirubin level in serum was assayed using an Ecoline Diagnostic
Kit. The total bilirubin in serum is determined by coupling with diazotised sulfanilic acid
after the addition of caffeine, sodium benzoate and sodium acetate. A blue azobilirubin is
formed in alkaline Fehlings solution II. This blue compound can also be determined
selectively in the presence of yellow by-products (Green mixed coloration) by photometry at
578 nm. The absorbance of the sample was measured against blank at 578 nm.
3.17.2.6. Estimation of Direct Bilirubin
(Jendrassik and Grof, 1938; Schellong and Wende, 1960)
Principle: Direct bilirubin in serum was assayed using Ecoline diagnostic kit. The
direct bilirubin is measured as the red azo dye at 546nm without the addition of alkali. This
method is based on the definition of direct bilirubin as the quantity of bilirubin, which,
without the addition of an accelerator, can be determined after a reaction time of 5 minutes.
This bilirubin comprises mainly the water soluble bilirubin glucuronides. Under the
conditions used here, free bilirubin reacts slowly. The samples were dispensed into tubes as
follows:
Reagent Sample Blank Test
Direct Bilirubin Reagent 1.0 ml 1.0 ml
Sodium Nitrite - 50µl
Distilled water 50µl -
Sample 50µl 50µl
Experimental
104
Mixed well and incubated for 5 minutes at room temperature. The absorbance of the
test against its sample blank was read at 546 nm.
Calculations: Direct Bilirubin (mg/dl) = (Abs. of Test – Abs. of Blank) X 15
3.17.2.7. Estimation of Albumin (Hendry, 1964; Weichselbaum, 1946)
Albumin in serum was assayed using Ecoline diagnostic kit. Albumin forms Blue-
green complex with bromocresol green at slightly acidic pH which is measured
photometrically. The absorbances of the sample and of the standard against blank at 546 nm.
Albumin level is serum is expressed as g/dl and is recorded.
3.17.2.8. Estimation of Globulin (Sood, 2003)
Globulin concentration in serum is indirectly determined by subtracting the albumin
concentration from the total protein concentration.
3.17.3. Determination of activities of Glucose-6-Phosphatase, Hexokinase, HMG CoA
reductase & Arginase in the Livers of experimented rats.
The activities of the hepatic marker enzymes like Glucose-6-Phosphatase (EC 3.1.3.9)
(Baginsky et al 1974; Nordlie and Arion, 1966), Hexokinase (EC2.7.1.1) (Sheela and Augusti
1992, Stanely Mainzen Prince et al 2000; Darrow and Colowick, 1962), HMG CoA reductase
(Rao and Ramakrishnan 1975), and Urea cycle enzyme Arginase (EC 3.5.3.1) (Hossain et al
1992) were also performed by using standard established procedures.
General Procedure: Blood (0.5 ml) was taken in a small tube containing 0.01 ml of
sodium heparin (1 %). To this was added 0.5 ml of sodium citrate solution (3.8 %), followed
by mixing and centrifugation at 1000 rev./min for 5 min. The supernatant was discarded, and
the pallet (red cells) was washed twice, each time with 5 ml of physiological saline. To
prepare a haemolysate, the final sediment was suspended in 1 ml of saline, to which were
added 1 ml of water, 0.7 ml of Tris/HCl buffer (50 mM, pH 7.5) and 0.3 ml of digitonin (1
%). After mixing and standing at room temperature for 15 min, the mixture was centrifuged
at 1000 rev./min for 15 min to remove the insoluble material.
The haemolysate thus prepared was used for assay of the above said enzymes. For the
determinations of these enzymes, 1 g of fresh/frozen liver was chopped and homogenized in
ice-cold sucrose (15 ml, 250 mM) with a homogenizer for 2 min, centrifuged at 1000
rev./min for 30 min, and the pellet was discarded and the supernatant was used as the source
of the above-mentioned enzymes.

Experimental
105
3.17.3.1. Enzymatic Assay of Glucose-6-Phosphatase (EC 3.1.3.9)
Principle: G-6-Pase was assayed according to Baginski et al, 1974 & Nordlie and
Arion, 1966; using 25 mM cacodylic buffer, pH 6.5, 25 mM glucose-6-phosphate and 0.1 ml
extraction medium A (0.4 ml final volume). Reactions were terminated by adding 0.4 ml 10%
trichloroacetic acid and the inorganic phosphate produced estimated according to Taussky-
Shorr method. Nonspecific phosphatase activities were estimated with 25 mM p-nitrophenol
phosphate replacing glucose 6-phosphate in the reaction medium. Inorganic Pi produced from
substrate and enzyme banks was subtracted from the total Pi to give enzyme-specific
activities.
1. G-6-P + H2O G-6-Pase
> Glucose + Pi
Liberated inorganic phosphate is quantified by the method of Taussky-Shorr method
(1953). Glucose-6-Phosphatase also catalyzes the following reactions:
2. (PPi or Nucleoside di - or triphosphate) + Glucose G-6-Pase
> G6 - P + (Pi or Nucleoside
mono or diphosphate)
3. PPi + H2O G-6-Pase
> 2Pi
Where; G 6-P - Glucose 6-Phosphate, G-6-Pase - Glucose-6-Phosphatase, Pi - Inorganic
Phosphate, PPi - Inorganic Pyrophosphate.
Conditions: T = 37°C, pH 6.5, A660nm, Light path = 1 cm
Method: Colorimetric
Reagents:
100 mM Cacodylate Buffer, pH 6.5 at 37°C (Prepare 50 ml in deionized water using
Cacodylic Acid, Sodium Salt. Adjust to pH 6.5 at 37°C with 1 M HCl.)
Glucose-6-Phosphatase Enzyme Solution (Immediately before use, prepare a solution
containing 1 - 2 units/ml of Glucose-6-Phosphatase in cold deionized water.)
200 mM Glucose 6-Phosphate Solution (G 6-P) (Prepare 5 ml in deionized water using D-
Glucose 6-Phosphate, Monosodium Salt.)
20% (w/v) Trichloroacetic Acid Solution (TCA) (Prepare 10 ml in deionized water using
Trichloroacetic Acid, 6.1 N Solution.)
Phosphorus Standard (Use Phosphorus Standard Solutio.The concentration is 20 µg/ml.)
10% (w/v) Ammonium Molybdate Solution (Amm. Moly.) (Prepare 25 ml in Reagent G
(H2SO4) using Molybdic Acid, Ammonium Salt, Tetrahydrate.)
5000 mM Sulfuric Acid (H2SO4) (Prepare 50 ml in deionized water using Sulfuric Acid.)

Experimental
106
Taussky-Shorr Color Reagent (TSCR) (Prepare by adding 10 ml Reagent F (Amm Moly)
to 70 ml of deionized water. Then add 5 g Ferrous Sulfate, Heptahydrate, Sigma Prod.
No. F-0131, and mix until dissolved. Add enough deionized water for a final volume of
100 ml.)
Glucose-6-Phosphatase Enzyme Solution (Enz). Immediately before use, prepare a
solution containing 1.0 – 2.0 units/ml in cold purified water
Procedure:
Pipetted, the following (in milliliters) into suitable containers:
Test Blank
Buffer (7.3.1.) 3.00 3.00
Substrate (7.3.2.) 1.00 1.00
Mixed, by swirling and equilibrate at 37°C for a minimum of 5 minutes, then added:
Enzyme (7.3.8.) 0.10 -----
Immediately mixed by swirling and incubated at 37°C for exactly 5 minutes, then added:
TCA (7.3.3.) 0.90 0.90
Enzyme (7.3.8.) ----- 0.10
Tightly capped and mixed by inversion. Incubated for 5 minutes at 25°C and centrifuge
all sample and blank reaction mixtures at 4,000 rpm for 10 minutes. Use the supernatant
in the color development step.
Color Development:
Prepared, a standard curve by pipetting (in milliliters) the following into suitable
containers:
Test Test
Blank Std 1 Std 2 Std 3 Std 4 Std 5
Std
Blank
Purified Water ----- ----- 1.80 1.60 1.40 1.20 1.00 2.00
Standard (7.3.4.) ----- ----- 0.20 0.40 0.60 0.80 1.00 -----
Test (7.4.4.) 2.00 ----- ----- ----- ----- ----- ----- -----
Blank (7.4.4.) ----- 2.00 ----- ----- ----- ----- ----- -----
Mixed all samples, blanks and standards by swirling and then add:
TSCR (7.3.7.) 2.00 2.00 2.00 2.00 2.00 2.00 2.00 2.00
Let all samples, blanks and standards incubate at 25°C for 5-6 minutes. Transfer all
solutions to appropriate cuvettes and record the A660nm for each. It is important to let all

Experimental
107
color development reaction mixtures incubate for the same period of time as the color
complex will continue to develop over time.
Calculations:
Calculate the ΔA660nm of the standards as follows:
ΔA660nm = (A660nm Std - A660nm Std Blank)
Plot ΔA660nm of the standards versus μmoles of phosphorus and obtain the slope (m) and
y-intercept (b) of the linear regression. Use these in the calculations for the test reaction
mixtures.
Calculate the ΔA660nm of each test solution as follows:
ΔA660nm = (A660nm Test - A660nm Test Blank)
Calculate the μmoles of Pi liberated as follows:
μmoles Pi = (ΔA660nm Test - b)
m
Calculate the units per mg of enzyme as follows:
Units/mg S= (μmoles Pi * 5.0 * df)
(T * 0.1 * 2.0)
Where:
5.0 = the final volume (in milliliters) of the enzymatic reaction
0.10 = volume (in milliliters) of the enzyme solution used
2.0 = volume (in milliliters) of enzyme assay used in color development
df = dilution factor of the enzyme solution
Final assay concentration: In a 15.30 ml reaction mix, the final concentrations are 78.4 mM
sodium cacodylate, 39.2 mM glucose 6-phosphate and 0.3 - 0.6 unit glucose-6-phosphatase.
3.17.3.2. Enzymatic Assay of Hexokinase (EC2.7.1.1)
Principle: Hexokinase was assayed (Sheela and Augusti, 1992; Stanely Mainzen Prince
et al, 2000; Darrow and Colowick, 1962) using an ATP regenerating system in a medium
containing 85 mM Tris-HCI, pH 7.5, 8 mM MgClb 0.8 mM EDTA, 1 mM glucose, 2.5 mM
ATP, 0.4 mM NADP, 10 mM phosphoryl creatine, 100 µg creatine phosphokinase and 100
µg glucose-6-phosphate dehydrogenase (1 ml final volume).
Glucose + ATP Hexokinase> Glucose 6-Phosphate + ADP + H+
Cresol Red + H+ > Reduced Cresol Red

Experimental
108
Abbreviations used:
ATP = Adenosine 5'-Triphosphate
ADP = Adenosine 5'-Diphosphate
Conditions: T = 25°C, pH 8.5, A560nm, Light path = 1 cm
Method: Continuous Spectrophotometric Rate Determination
Reagents:
100 mM Glycylglycine Buffer, pH 8.5 at 25°C. (Prepared, 100 ml in deionized water
using Glycylglycine, Free Base, Prod. No. G-1002. Adjust to pH 8.5 at 25°C with 1 M
HCl.)
200 mM Adenosine 5'-Triphosphate Solution (ATP) (Prepared, 10 ml in deionized water
using Adenosine 5'-Triphosphate, Disodium Salt.
200 mM Glucose Solution (Gluc) (Prepared, 10 ml in deionized water using ß-(+)-
Glucose.)
0.01% Cresol Red with 128 mM Magnesium Chloride Solution (Cresol Red) (Prepared,
200 ml in deionized water using Cresol Red, Sodium Salt, and Magnesium Chloride,
Hexahydrate. Facilitate by first dissolving Cresol Red into 6.6 ml of 95% ethanol. This
solution transfered to a 200 ml graduated cylinder and add 5.2 g of Magnesium Chloride,
Hexahydrate. Diluted to 200 ml with deionized water.)
100 mM Hydrochloric Acid Standardized Solution (HCl) (Prepare 1 liter in deionized
water using Concentrated Hydrochloric Acid. Standardize against Tris Base with Sigma
121 indicator. Color change is from orange to pink.)
0.5% Glucose Solution (Prepare 50 ml using ß-D-Glucose.)
Hexokinase Enzyme Solution (Immediately before use, prepare a solution containing 10
units/ml of Hexokinase in Reagent F.)
Procedure:
Prepared, a reaction cocktail by pipetting (in milliliters) the following reagents into a
suitable container:
Reagent B (ATP) 5.0 ml
Reagent D (Cresol Red) 6.6 ml

Experimental
109
Mixed and slowly added 0.1 M NaOH until the solution just turns from red to purple
(pH about 8.2). Then added:
Deionized Water 33.40 ml
Reagent A (Buffer) 5.00ml
Mixed n Adjusted to pH 8.5 at 25°C with 100 mM HCl or 100 mM NaOH.
Titer Determination:
Titer of reaction cocktail was determined by pipetting (in milliliters) the following
reagents into a suitable cuvette:
Reaction Cocktail 2.50 ml
Reagent C (Glucose) 0.40 ml
Mixed by inversion and equilibrate to 25°C. Monitor the A560nm until constant, using
a suitably thermostatted spectrophotometer. Record the initial A560nm. Then add:
Reagent D (HCl) 0.10 ml
Mixed and immediately record final A560nm.
(A560nm initial - A560nm final) (2.9)
Titer =
(1000) (0.1) (Molarity of Reagent D)
2.9 = Volume of Titer reaction Mix
1000 = Coversion from millimolar to micromolar
0.1 = Volume of Reagent D used
Sample: Pipetted (in milliliter) the following reagents into suitable cuvettes:
Test Blank
Reaction Cocktail 2.50 2.50
Reagent C (Gluc) 0.40 0.40
Mixed by inversion and equilibrate to 25°C. Monitor the A560nm until constant, using
a suitably thermostatted spectrophotometer. Then add:
Reagent F (Diluent) 0.10
Reagent G (Enzyme Solution) 0.10
Immediately mixed by inversion and record the decrease in A560nm for approximately
5 minutes. Obtain the A560nm/minute using the maximum linear rate for both the Test and
Blank.

Experimental
110
Calculations:
A560nm/min Test - A560nm/min Blank
Units/mg enzyme =
(titer) (mg enzyme/ml RM)
RM = Reaction Mix
Final assay concentrations:
In a 3 ml reaction mix, the final concentrations are 8.3 mM glycylglycine, 17 mM
ATP, 0.0011% cresol red, 14 mM magnesium chloride, 27 mM glucose and 1 unit
hexokinase.
3.17.3.3. Enzymatic Assay of HMG CoA reductase (EC 1.1.1.88)
Principle: 3-hydroxy-3-methylglutaryl-CoA reductase (HMGR) is a transmembrane
glycoprotein, located on the endoplasmic reticulum. This enzyme catalyzes the four-electron
reduction of HMG-CoA to coenzyme A (CoA) and mevalonate, which is the rate-limiting
step in sterol biosynthesis.
HMG CoA reductase was assayed according to Rao and Ramakrishnan (1975) using
the ratio of ‘absorbance of HMG CoA / absorbance of mevalonate’ as an index of the activity
of HMG CoA reductase required to convert HMG CoA to Mevalonate in the presence of
NADPH. The assay is based on the spectrophotometric measurement of the decrease in
absorbance at 340 nm, which represents the oxidation of NADPH by the catalytic subunit of
HMG CoA reductase in the presence of the substrate HMG-CoA.
HMG-CoA + 2NADPH + 2H+ HMG CoA reductase Mevalonate + 2NADP+ + CoA-SH
Reagents:
Saline arsenate solution: 1 g of sodium arsenate/litre of physiological saline.
Dilute perchloric acid: 50 ml fliter
Hydroxylamine hydrochloride reagent: 2 mol/l
Hydroxylamine hydrochloride reagent for G-6Pase, HMGCoA reductase, Hexokinase
and Arginase.
Ferric chloride reagent: Dissolve 5.2 g of trichloroacetic acid and 10g of ferric
chloride in 50 ml of 0.65 mol/litre HCl and dilute to 100 ml with the latter.
Ethanol/ether mixture (3/1 by vol.).
Ethanol/acetone mixture (1/1 by vol.)
Potassium hydroxide solution, 10mol/liter
Digitonin solution, 5 g/litre in ethanol/water (1/1)
Ether acetone mixture (2/1 by vol.)
Triton X-100: a surfactant
Sodium Phenobarbital.

Experimental
111
Equipment: 1 ml spectrophotometer cuvette (quartz), UV/Vis Spectrophotometer.
Procedure: Equal volumes of 10% tissue homogenate and dilute perchloric acid was
mixed and allowed to stand for 5 mins and centrifuged (at 2000rpm, 10mm). Then 1 ml of the
filtrate was treated with 0.5 ml of freshly prepared hydroxylamine reagent (for HMG CoA
reductase), mixed, after 5 mins, 1.5 ml of ferric chloride reagent was added to it and shaken
well. The readings were taken after 10 mins at 540 nm vs. a similarly treated saline/arsenate
blank.
3.17.3.4. Enzymatic assay of Arginase (L-arginine ureohydrolase EC 3.5.3.1)
The method of Hossain et al, 1992 followed. Arginase catalyzes the conversion of
arginine to ornithine and urea, completing the last step in the urea cycle. Arginase activity is a
key diagnostic indicator.
Principle: L-Arginine + H2O Arginase L-Ornithine + Urea
Conditions: T = 37°C, pH = 9.5, A535nm, Light path = 1 cm
Method: Colorimetric
Reagents:
A. 50 mM Manganese Maleate Activation Buffer, pH 7.0 at 37°C
The following components are made separately:
1. 100 mM Manganese Sulfate Solution (Prepare 60 ml in deionized water using
Manganese Sulfate)
2. 125 mM Maleic Acid Solution, pH 8.0 at 37°C (Prepare 50 ml in deionized water using
Maleic Acid. Adjust the pH to 8.0 at 37°C using 2 M NaOH.).
Combine 50 ml of Component 1 and 40 ml of Component 2 and mix. Equilibrate to 37°C
and adjust to pH 7.0 using 0.1 M HCl. Dilute to a final volume of 100 ml with deionized
water.
B. 713 mM L-Arginine Substrate Solution: (Prepare 50 ml in deionized water using L-
Arginine, Free Base. Equilibrate to 37°C and adjust to pH 9.5 using 5 M HCl. The L-
Arginine will dissolve upon the addition of the HCl.)
C. Arginase Enzyme Solution: (Prepare a solution containing 40-60 units/ml in Reagent A.
Activate the enzyme by incubating for 4 hours at 37°C. Dilute 0.1 ml of activated enzyme
to 50 ml using deionized water, immediately prior to use.)
D. 20 mM Urea Stock Solution, pH 9.5: (Prepare 50 ml in deionized water using Urea. Adjust
to pH 9.5 using 0.1 N NaOH.)

Experimental
112
E. 4 mM Urea Standard Solution, pH 9.5: (Prepare 10 ml by diluting 2 ml of Reagent D to 10
ml with deionized water.)
F. BUN Acid-Color Reagent (BUN): (Urea Nitrogen Kit, immediately before use, add 60 ml
of BUN Acid Reagent to 40 ml of BUN Color Reagent and mix.)
Procedure:
Pipetted, (in milliliters) the following reagents into suitable vials:
Test Test
Blk
Std 1 Std 2 Std 3 Std 4 Std 5 Std.
Blk
Reagent C (Enzyme
Soln)
0.30
----
----
----
----
----
----
----
Reagent E (Urea
Standard Soln)
----
----
0.03
0.05
0.10
0.20
0.30 ----
Deionized Water 0.30
0.30
0.57
0.55
0.50
0.40
0.30
0.60
Mix by inversion and equilibrate to 37°C. Then add:
Reagent B (Substrate
Soln)
0.40 0.40 0.40 0.40 0.40 0.40 0.40 0.40
Mix by inversion and incubate at 37°C for exactly 30 minutes. Then add:
Reagent F (BUN) 8.00
8.00
8.00
8.00
8.00
8.00
8.00
8.00
Reagent C (Enzyme
Soln)
----
0.30
----
----
----
----
----
----
Mixed by inversion and place all the vials in a boiling water bath for 12 minutes.
Remove and place the vials in an ice bath for 3 minutes. Transfer the solutions to suitable
cuvettes and read the absorbance at 535 nm for each of the vials using de-ionized water as a
reference.
Calculations:
Standard Curve:
A 535nm Standard = A535nm Standard - A535nm Standard blank
Plot the r A 535nm of the Standards vs µmoles of urea
Sample Determination:
A 535nm Sample = A535nm Test - A535nm Test Blank
Determine the µmoles of urea liberated using the Standard Curve.
(µmoles of urea liberated)(df)
Units/ml enzyme =
(30)(0.3)
df = Dilution factor
30 = Time of assay in minutes
0.3 = Volume (in milliliter) of enzyme used
Experimental
113
units/ml enzyme
Units/mg solid =
mg solid/ml enzyme
units/ml enzyme
Units/mg protein =
mg protein/ml enzyme
Final assay concentration:
In a 1.00 ml reaction mix, the final concentrations are 0.03 mM manganese malate,
285 mM L-arginine and 0.024 - 0.036 unit arginase.
3.17.4. Determination of Haematological parameters (Ghai, 2004)
The haematological studies include total RBC count, total WBC count, clotting time
and differential count and % Hb. Haemoglobin concentration in the blood samples was
estimated as per the standard procedures. The Hb concentration in blood was expressed as
g%. W.B.C count was expressed as number of cells/l of whole blood. The W.B.C count was
expressed as number of cells/l of whole blood. Clotting time was determined as per the
standard procedure, it was expressed in minutes.
3.17.5. Body weight Analysis
Initial body weights of the experimented rats were recorded. The final body weights
of rats were recorded on 0th
, 10th
, 20th
and 30th
day. The percentage losses in body weight
were calculated after 30 days and the weight variation was noted from treated groups and
compared with normal, Alloxan control group.
3.17.6. Histopathological studies (Jaysekhar et al, 1997)
Histopathology deals with the microscopic study of sections of tissues that is done by
using fixed specimens. Although parts of living or dead may be examined with a microscope,
fixed specimens are more frequently studied. Fixed specimens are pieces of animal or plant
material that have been structurally stabilized, usually by chemical treatment. Fixation arrests
postmortem decay and also gives a harder consistency to many tissues.
Chemicals and Reagents: 10% formal saline, absolute alcohol, isopropyl alcohol, Xylene,
Dibutyl phthalate Xylene (DPX), Haematoxylin and Eosin stain.
Tissue Processing: After the 30 days of treatment with the solvent control, standard drug
glibenclamide and the both the extracts (ALSN and AAMP) at both the dose levels, as

Experimental
114
mentioned earlier, to the various groups, the animals were sacrificed by decapitation under
ether anesthesia. The livers and kidneys were excised quickly, serially sectioned into 10-
15mm thickness and fixed in 10% neutral buffered formalin (10% formal saline). These were
then processed routinely for washing, dehydration and clearing, and Paraffin wax blocks were
prepared. Sections of about 5µ thickness were cut by using the Microtome and stained by
routine H & E method (stained with Haematoxylin and Eosin) and mounted in neutral DPX
medium, and subjected for histological evaluation.
Experimental
115
SECTION - II
Anti-oxidant activity study

Experimental
116
3.18. Anti-oxidant activity study of the extracts
The antioxidant activity of the aqueous extracts from S. nigrum and M. pentaphylla
were determined by both in vitro and in vivo models.
3.18.1. Anti-oxidant activity in-vitro
The in vitro methods include the determination of Total phenolic content, Total
flavonoid content, Total antioxidant capacity and Ferric reducing power. Besides these, the
antioxidant activity of the extracts were determined in different in-vitro experimental
methods like Diphenyl-picryl-hydrazyl (DPPH) radical, Superoxide free radical (O2•−),
Peroxide radical (H2O2), and Nitric oxide (NO) free radical scavenging activity with
reference to standard antioxidant ascorbic acid.
3.18.1.1. Determination of total phenolic content of the extracts
Total soluble phenolics in the aqueous extract of S. nigrum and M. pentaphylla were
determined with Folin Ciocalteu reagent using pyrocatechol as a standard (Slinkard Singleton
1977). Briefly, 0.1 ml of extract solution (contain 1000 µg extract) in a volumetric flask was
diluted in distilled water (46ml). About 1 ml of Folin Ciocalteu reagent was added and the
content of the flask was mixed thoroughly. After 30 min, 3 ml of sodium bicarbonate was
added, and then the mixture was allowed to stand for 2h with intermittent shaking. The
absorbance was measured at 760 nm. The concentration of total phenolic content in the
extracts was determined as microgram of pyrocatechol equivalent by using an equation that
was obtained from standard pyrocatechol graph. The equation calculating the pyrocatechol
was: Absorbance = 0.001 x pyrocatechol (µg) – 0.003
3.18.1.2. Determination of total flavonoid content
Aluminium chloride colorimetric method was used for flavonoid content
determination (Chang et al 2002). Each extract (0.5 ml of 1 : 10 g/ml) in methanol was mixed
with 1.5 ml of methanol, 0.1 ml 10 % aluminium chloride, 0.1 ml of 1 M potassium acetate
and 2.8 ml of distilled water. It remained at room temperature for 30 min; the abosorbance of
the reaction mixture was measured at 415 nm. The calibration curve was prepared by
preparing quercetin solutions at concentrations 12.5 to 100 µg/ml in methanol.
3.18.1.3. Evaluation of Total antioxidant activity
The assay was done according to Prieto et al. (1999). The antioxidant activity of
extracts was evaluated through the principle of the formation phosphomolybdenum complex.
In this method, an aliquot of 0.4 ml of sample solution (100 ppm in methanol) was mixed in a
vial with 4 ml of reagent solution (0.6 M sulphuric acid, 28 mM sodium phosphate and 4 mM

Experimental
117
ammonium molybdate). The blank was prepared by replacing the sample with 0.4 ml of
methanol. The vials were capped and incubated in a water bath at 95 0C for 90 mins. After
cooling the samples at room temperature, the absorbances were measured at 695 nm against
the blank. The antioxidant activity was expressed relative to that of ascorbic acid.
3.18.1.4. Assay of Ferric Reducing Power
This Ferric Reducing Antioxidant Power (FRAP Assay) of various extracts was
performed based on the method Yildrim et al 2001; Lu and Foo, 2000. The assay mixture i.e.
1 ml of plant extract solution (final concentration 100- 500 mg/l) was mixed with 2.5 ml
phosphate buffer( 0.2 M, pH 6.6) and 2.5 ml potassium ferricyanide [ K3Fe(CN6)] (10g/l),
then mixture was incubated at 50 degree C for 20 minutes. Two and one-half, 2.5 ml of
trichloroacetic acid (100g/l) was added to the mixture, which was then centrifuged at 3000
rpm for 10 min. Finally, 2.5 ml of the supernatant solution was mixed with 2.5 ml of distilled
water and 0.5 ml Fecl3 (1g/l) and absorbance measured at 700nm in V-600 UV-Visible
Spectrophotometer (JASCO Ltd, JAPAN). Ascorbic acid was used as standard and phosphate
buffer used as blank solution. The absorbances of the final reaction mixture were expressed
as mean ± standard error mean. Increased absorbance of the reaction mixture indicates
stronger reducing power.
3.18.1.5. DPPH free-radical scavenging activity
(Koleva et al, 2002; Lee et al, 2003; Mathiesen et al, 1995)
The free radical scavenging capacity of the aqueous extracts of S. nigrum and M.
pentaphylla was determined using DPPH (1, 1-diphenyl-2-picryl-hydrazyl). DPPH solution
(0.004% w/v) was prepared in 95% methanol. The extracts were mixed with 95% methanol to
prepare the stock solution (100 mg/100mL). The concentration of this extracts solution was
100 mg /100 ml or 1000µg/ml. From stock solution 1ml, 2ml, 3ml, 4ml & 5ml of this
solution were taken in five test tubes & by serial dilution with same solvent were made the
final volume of each test tube up to 10 ml whose concentration was then 100µg/ml,
200µg/ml, 300µg/ml, 400µg/ml & 500µg/ml respectively. Freshly prepared DPPH solution
(0.004% w/v) was added in each of these test tubes containing extracts (100µg/ml, 200µg/ml,
300µg/ml, 400µg/ml & 500µg/ml) and after 10 min, the absorbance was taken at 517 nm
using V-600 UV-Visible Spectrophotometer (JASCO Ltd, JAPAN). Ascorbic acid was used
as a reference standard and dissolved in distilled water to make the solution with the
concentration 100µg/ml. Control sample was prepared containing the same volume without

Experimental
118
any extract and reference ascorbic acid. 95% methanol was used as blank. % scavenging of
the DPPH free radical was measured using the following equation:
% DPPH radical-scavenging = [(Absorbance of control - Absorbance of test Sample) /
(Absorbance of control)] x 100
3.18.1.6. Superoxide (O2•−) free-radical scavenging activity
Measurement of superoxide anion (O2•−) scavenging activity of extracts was based on
the method described (Liu et al, 1997; Oktay et al, 2003) with slight modification. O2¯
radicals are generated non-enzymatically in Phenazine methosulphate–Nicotinamide adenine
dinucleotide phosphate (PMS–NADH) systems by the oxidation of NADH and assayed by
the reduction of NBT. In this experiment, the superoxide radicals were generated in 1 mL of
Tris-HCl buffer (16 mM, pH 8.0) containing nitro blue tetrazolium (NBT) (50 µM) solution
and NADH (78 µM) solution. The reaction was started by adding PMS solution (10 µM) to
the mixture. The reaction mixture was incubated at 25°C for 5 min, and the absorbance at 560
nm in a spectrophotometer was measured against blank samples. Decreased absorbance of the
reaction mixture indicated increased superoxide anion scavenging activity. The percentage
inhibition of superoxide anion generation was calculated using the following formula:
(%) I = (A0 – A1) / (A0) x 100
Where A0 was the absorbance of the control and A1 was the absorbance of extract and the
standard compound.
3.18.1.7. Peroxide free radical (H2O2) scavenging activity
Scavenging of H2O2 by the extract was determined by the method of Ruch et al.
(1989). One millilitre of C. siamea flower extract solution [prepared in phosphate buffered
saline (PBS)] was incubated with 0.6 ml of 4mM H2O2 solution (prepared in PBS) for 10
min. The absorbance of the solution was measured at 230 nm against a blank solution
containing the extract without H2O2. The concentration of H2O2 was spectrophotometrically
determined from absorption at 230 nm using the molar absorptivity of 81 M−1
cm−1
.
3.18.1.8. Nitric oxide free radical (NO) scavenging activity
Nitric oxide (NO) was generated from sodium nitropruside (SNP) and measured by
Greiss reaction (Green et al, 1982). SNP in aqueous solution at physiological pH instinctively
generates NO, which intermingles with oxygen to generate nitrite ions that can be anticipated
by Greiss reagent (1% sulphanilamide, 2% phosphoric acid and 0.1% naphthyl ethylene
diamine dihydrochloride). Scavengers of NO with oxygen leading to reduced production of
NO. SNP (5 mM) in phosphate buffer saline (PBS) was mixed with different concentration of
(100-500 µg/mL) drug dissolved in suitable solvent and incubated at 25oC for 150 min. The
Experimental
119
above samples were reacted with Greiss reagent. The absorbance of chromophore created
during diazotization of nitrite with sulphanilamide and following coupling with naphthyl
ethylene diamine was read at 546 nm and referred to the absorbance of standard solution of
potassium nitrite treated in the same way with Greiss reagent.
3.18.2. Anti-oxidant activity in-vivo
The aqueous extracts from both the plants of S. nigrum and M. pentaphylla has also
been studied for their antioxidant potential in vivo in the alloxan induced diabetic rats at the
end of 30 days of treatment (daily dosing) with the plant extracts keeping the standard drug as
glibenclamide.
After sacrificing the animals on 30th
day, the liver tissue from various groups of
animals were removed carefully followed by washing thoroughly with ice cold saline, 0.5
gms of the wet tissue was weighed exactly and homogenized in 0.1M Tris–HCl buffer, pH
7.4 at 4 0C in a Remi homogenizer with a Teflon pestle rotated at 600 rpm for 30 min. The
homogenate was centrifuged at 2500 rpm for 10 min at 4 oC using refrigerated centrifuge.
The supernatant was used for the assay of various lipid peroxidation products and antioxidant
enzymes.
The in vivo antioxidant potentiality of the plant extracts were undertaken by the
determination of the activities of various lipid peroxidation products (oxidants) like
Thiobarbituric Acid Reacting Substances (TBARS), Hydroperoxide (HP), Malondialdehyde
(MDA) and Conjugated Dienes (CD) and estimating the activities of different liver
antioxidant enzymes like Reduced Glutathione (GSH), Glutathione Peroxidase (GSH-Px),
Glutathione Reductase (GR), Superoxide Dismutase (SOD), and Catalase (CAT) were also
quantified using standard experimental procedures.
3.18.2.1. Determination of concentration of Thiobarbituric acid reactive substances
(TBARS)
After washing with 0.9% NaCl, the wet liver tissue (0.5 g) was weighed exactly and
homogenized in 4.5mL of 0.25M sucrose using a Remi homogenizer. The cytosolic fraction
was obtained by a two-step centrifugation first at 1000×g for 10 min and then at 2000×g for
30 min at 4oC. A volume of the homogenate (0.2 mL) was transferred to a vial and was mixed
with 0.2mL of a 8.1% (w/v) sodium dodecyl sulphate solution, 1.5mL of a 20% acetic acid
solution (pH 3.5) and 1.5mL of a 0.8% (w/v) solution of thiobarbituric acid and the final
volume was adjusted to 4.0mL with distilled water. Each vial was tightly capped and heated
in boiling water bath for 60 min. After cooling, equal volumes of tissue blank or test sample

Experimental
120
and 10% trichloroacetic acid (TCA) were transferred into a centrifuge tube and centrifuged at
1000×g for 10 min. The absorbance of the supernatant fraction was measured at 532nm
(Ohkawa et al., 1979; Jamall and Smith, 1985).
3.18.2.2. Determination of concentration of Hydroperoxides (HP)
Hydrogen Peroxide scavenging activity of the plant extracts was determined using a
modified method of Ruch et al (1989) by Gow Chin Yen and Hui - Yin Chen (1995). 4mM
solution of H2O2 was prepared in phosphate - buffered saline (PBS, pH 7.4). H2O2
concentration was determined spectrophotometrically from absorbance at 230nm using molar
absorptivity 81M-1
cm-1
. 20-400µg plant extract corresponding to 0.05, 0.10, 0.15, 0.20,
0.25ml of 1mg/ml plant extract stock solution in 4ml distilled water were added to 0.6ml
hydrogen peroxide - PBS solution. Absorbance of H2O2 at 230nm was determined 10 minutes
later against a blank solution containing plant extract in PBS without H2O2. 20 -400µg
Butylated hydroxyanisole was added in place of plant extract in 4ml distilled water and the
solution wad added to 0.6ml H2O2 solution in PBS. Absorbance was determined 10 minutes
later against a blank solution similar to that above.
Addition of H2O2 to cells in cultures can lead to transition metal ion dependent OH-
mediated oxidative DNA damage. Levels of H2O2 at or below about 20–50 mg seem to have
limited cytotoxicity to many cell types (Shon et al, 2003). Since phenolic compounds present
in the plant extract are good electron donors, they may accelerate the conversion of H2O2 to
H2O (Ruch et al, 1984), hence, the extracts might also help accelerate the conversion of H2O2
to H2O.
3.18.2.3. Determination of Malondialdehyde (MDA)
Reagents:
1. Thiobarbituric acid (0.67%) in 1Mtris HCl, pH 7.0, 0.67 g of thiobarbituric acid
s dissolved in 100 ml of distilled water.
2. 20 % Trichloroacetic acid (TCA)
3. Stnd. Malondialdehyde: (0-25 n.mol.)
Liver tissues were homogenized with ice cold 1.5% KCl to make a 10%
homogenate. Three milliliters of 1% phosphoric acid and 1ml of 0.6% thiobarbituric
acid (TBA) aqueous solution were added to 0.5 ml of 10% homogenate. The mixture
was heated for 45 min and after cooling; 4ml of n-butanol was added and mixed.
Absorbance of butanol phase was measured at 535 and 520 nm. The difference of

Experimental
121
the two measurements was used as the MDA value (µmol/g tissue) (Mihara and
Uchiyama, 1978).
3.18.2.3. Determination of Conjugated dienes (CD)
Liver homogenates (5% w/v) were prepared in cold 50mM potassium phosphate buffer
(pH 7.4) using a Remi homogenizer. The unbroken cells and cell debris were removed by
centrifugation at 1000 rpm for 10 using a Remi refrigerated centrifuge. The supernatant was
used for the estimation of Conjugated dienes (Recknagel and Glende, 1984).
3.18.2.4. Determination of activities of Reduced Glutathione (GSH) (Sedlak and Lindsay,
1968; Ellaman, 1959).
Reagents:
1. 10% trichloroacetic acid (TCA): accurately weighed 10gm TCA was dissolved in
100ml of distilled water.
2. Phosphate buffer (0.2 M, pH 8.0)
3. DTNB reagent: 60mg of DTNB was dissolved in 100ml 0.2M sodium phosphate
(pH 8.0)
4. Std. Glutathione: prepared by dissolving 10 mg of reduced glutathione in 100 ml
of distilled water.
Procedure:
Liver tissue samples were homogenized in 8.0mL of 0.02M EDTA in an ice bath.
Aliquots of 5.0mL of the homogenates were mixed in 15.0mL test tubes with 4.0mL distilled
water and 1.0mL of 50% TCA. The tubes were centrifuged for 15 min at approximately
3000×g, 2.0mLof supernatant was mixed with 4.0mL of 0.4M Tris buffer, pH 8.9, 0.1mL
Ellman’s reagent [5,5-dithiobis(2-nitro-benzoic acid)] (DTNB) added and the sample shaken.
The absorbance was read within 5min of the addition of DTNB at 412nm against a reagent
blank with no homogenate. Results were expressed as µmol GSH/g tissue
3.18.2.5. Determination of activities of Glutathione Peroxidase (GSH-Px)
Liver homogenates (5% w/v) were prepared in cold 50mM potassium phosphate
buffer (pH 7.4) using a Remi homogenizer. The unbroken cells and cell debris were removed
by centrifugation at 1000 rpm for 10 using a Remi refrigerated centrifuge. The supernatant
was used for the estimation of Glutathione peroxidase (GSH Px). (Robak and Gryglwsk
1988, Beers and Sizer 1952 & Rotruck et al. 1973)
3.18.2.6. Determination of activities of Glutathione Reductase (GR)
Experimental
122
Liver homogenates (5% w/v) were prepared in cold 50mM potassium phosphate
buffer (pH 7.4) using a Remi homogenizer. The unbroken cells and cell debris were removed
by centrifugation at 1000 rpm for 10 using a Remi refrigerated centrifuge. The supernatant
was used for the estimation of Glutathione Reductase. (Pinto and Bartley, 1969 & David et al.
1983)
3.18.2.7. Determination of activities of Superoxide dismutase (SOD)
Reagents:
1. Carbonate buffer (0.05 M, pH 10.2): 16.8 gm of Sodium bicarbonate & 22 gm of
sodium carbonate was dissolved in 500ml of distilled water & the final volume was
made up to 1000ml with distilled water.
2. EDTA 0.49 M: 1.82 gm of EDTA was dissolved in 1000ml of distilled water.
3. SOD standard: Dissolve 1 mg (1000units/mg) of SOD from bovine liver in 100 ml of
carbonate buffer.
This assay (Richard et al., 1976) is based on the inhibitory effects of SOD on the
initial rate of 6-hydroxydopamine autoxidation (6-OHDA). Liver tissues were homogenized
with 0.05M carbonate buffer at pH 10.2 containing EDTA. The tissue homogenates were
centrifuged at 4 ◦C for 15 min at 1500×g and supernatants were removed, kept on ice until
the enzyme assay. 6-Hydroxydopamine hydrobromide was prepared in distilled water and
added to the buffer containing tissue so that the final 6-OHDA concentration was 10−4M.
The increase in absorbance was then measured for 15s at 490 nm using V-600 UV-Visible
Spectrophotometer (JASCO Ltd, JAPAN). Activity was expressed as a percentage inhibition
of autoxidation in the tested sample, and this percentage was then expressed as units/mg
protein.
3.18.2.8. Determination of activities of Catalase (CAT)
Catalase exerts a dual function, decomposition of H2O2 to give H2O and O2, and
oxidation of H donors. In the ultraviolet range H2O2 shows a continual increase in
absorption with decreasing wavelength. The decomposition of H2O2 can be followed
directly by the decrease in absorbance at 240 nm. The difference in absorbance per
unit time is a measure of catalase activity (Aebi, 1984).
Reagents:
1. Phosphate buffer: 50 mM/l, pH 7.0.
a. Dissolve 6.81g KH2PO4 in water and made up to 1000ml.
b. Dissolve 8.9 g NaH2PO4.2H2O in water & made up to 100ml.

Experimental
123
Mixed the soln. (a) & (b) in proportion 1:15 (v/v).
2. Hydrogen peroxide (30mM/l): Dissolve 0.34 ml of 30% hydrogen peroxide with
phosphate buffer up to 100ml.
Procedure:
Liver tissues were homogenized with 0.05M phosphate buffer at pH 7.0. The
tissue homogenates were centrifuged at 4oC for 15 min at 1500×g. The
supernatants were removed and kept on ice until the enzyme assay. Sample was
read against a blank containing 2.8 ml (1:500 v/v) phosphate buffer instead of H2O2
(30mM hydrogen peroxide) and 0.2 ml enzyme solution. The reaction was started by
addition of H2O2. The initial absorbance should be A = 0.500, following the decrease
in absorbance for about 30s. Catalase activity was expressed as units representing
the calculated rate constant (K)/mg protein.
Calculations: Log A/B x 2297.3
Where, A = Initial absorbence
B = Final absorbance (after 30 second)
Units: µmoles of H2O2 consumed/min/mg of protein.
3.19. Statistical analysis
All the results were analyzed statistically evaluated using one-way analysis of
variance followed by Dunnet’s t-test. All the results were expressed as Mean ± S.E.M.A p-
value less than 0.05 were considered significant.

Experimental
124
SECTION - III
Isolation and Characterization

Experimental
125
3.20. Isolation and Characterization of a new compound from the aqueous extract of
aerial parts of M. pentaphylla Linn. (AAMP)
3.20.1. Preparation of plant extracts
The aqueous extract of aerial parts of M. pentaphylla was prepared using method
described in section 3.5 of chapter 3.
3.20.2. Thin layer chromatographic study of the extract
3.20.2.1. Preparation of plates
Required quantity of silica gel G was taken in a glass mortar and mixed with water to
get a smooth consistency. The slurry was spread over the glass plates normally a thickness of
0.2 mm and allowed to settle and dry in air. Then the plates were activated before use by
putting them in hot air oven at 1050C for 1 hour.
3.20.2.2. Development of chromatogram
From 1 % solution of the extract, 2µl was spotted with the help of capillary tube. The
spot was kept 2 cm above the bottom of the coated plate. The development chamber or tank
was lined inside with filter paper moistened with the mobile phase so as to saturate the
atmosphere. If this kind of saturation of the atmosphere is not done, edge effect or tailing
effect occurs where the solvent front in the middle of TLC plate moves faster than that of the
edge. The solvent front was allowed to rise to a distance about 80 % of the plate length. Then
the plate was removed from the tank and allowed to dry in air (Peach and Tracey, 1955;
Stahl, 1969).
3.20.2.3. Detection
After the development of TLC plate, the spots were detected by using different
reagent and iodine chamber. The aqueous extract of the plant was taken for TLC study to
develop the proper solvent system by several trial and error methods. Hexane-Ethyl acetate
solvent system with different ratio was found to be the best suitable solvent system, giving
good resolution and showing 3 to 4 spots on exposure to iodine vapour by forming the intense
brown color at the spotted area. So the same solvent system (Hexane-Ethyl acetate) has been
selected for the further column chromatographic study (Peach and Tracey, 1955; Stahl, 1969).
3.20.3. Column chromatographic study
3.20.3.1. Preparation of column
About 50 cm length and 4 cm width of the column, the bottom portion of the column
was plugged with cotton wool or sintered glass above which the column of adsorbent was
packed. The column was packed with adsorbent by using wet packing technique. The

Experimental
126
required quantity of adsorbent was mixed with the mobile phase and poured into the column.
The stationary phase settled uniformly in the column and there was no entrapment of air
bubbles and there was no crack in the column of adsorbent. After packing the column, the
extract material, dissolved in chloroform-acetone (1:1) and mixed with silica gel (60-120
mesh size). The solvent is then evaporated slowly in water bath to get dried sample (Peach
and Tracey, 1955; Stahl, 1969).
3.20.4. Instuments
The Soxhlet extractor was used for the extraction process for the plant of M.
pentaphylla Linn. IR spectra were recorded on a Shimadzu-FTIR-8400S spectrophotometer
using KBr powder. 1
H NMR and 13
C NMR spectra of the compound were recorded on a
Bruker DRX-500 NMR spectrometer using MeOD as the solvent at 500 MHz and 125 MHz
respecively. The Liquid chromatography Mass spectra (LCMS) of the compound were
recorded on a Shimadzu-Mass spectrophotometer. The TLC was run on silica gel GF254 and
column chromatography was carried out over silica gel (60-120 mesh, Merck). A glass
column, 50 cm in length, 4 cm inner diameter fitted with a stopcock was used. The elemental
analysis of the compound was done with elemental analyzer (Perkin Elmer-2400). Molecular
weight of the compound was determined by Rast’s method was close to the theoretical value.
3.20.5. Experimental design
3.20.5.1. Isolation of the compound
The column was eluted with gradient solvent system (n-hexane-ethyl acetate). The
dried aqueous extract (20 gm) was mixed with 60 gm silica gel to make the material to get
adsorbed in the silica gel. The column was eluted with solvent gradually starting from 100 %
n-hexane, followed by increasing order of ethyl acetate in n-hexane (0, 10, 20, 30, 50, 60, 65,
75% ethyl acetate in n-hexane) and 78 fractions were collected as mentioned in the following
table. After the solvent was evaporated all the fractions were subjected to TLC analysis. On
the basis of Rf values, similar fractions were pooled. The pools which gave single spot in
iodine exposure were 7-10, 16-19, and 50-60. Among them, on the basis of high
concentration, 50-60 pool of fractions was taken for purification (See the following Table).

Experimental
127
S.No Fractions % of solvent Volume of solvent
used in ml
1 1-5 100% Hex 250
2 6-11 10:90(EAC:Hex) 300
3 12-19 20:80(EAC:Hex) 400
4 20-36 30:70(EAC:Hex) 400
5 37-44 50:50(EAC:Hex) 400
6 45-54 60:40(EAC:Hex) 500
7 55-64 65:35(EAC:Hex) 500
8 65-72 75:25 (EAC:Hex) 400
9 73-78 100%EAC 300
Hex = Hexane EAC = Ethyl acetate
3.20.5.2. Purification of the compound
Mixed fractions of 50-60, after concentration, was taken for thin layer
chromatographic study using various solvent systems. Among them the ethyl acetate: n-
hexane (9:1) gave good resolution in the TLC studies and this solvent system was selected for
preparative TLC. The concentrated pool was taken in acetone and the solution was spotted in
the preparative TLC plates. The spotted plates were kept in completely saturated chamber of
selected mobile phase. After development of chromatogram, the plates were exposed to
iodine vapour and the band (Rf =0.563) was identified and scrapped out from the plates. The
collected powder was then suspended in n-hexane and filtered through whatman filter paper.
The filtrate was concentrated and the isolated product was obtained as brown solid (50 mg).
The compound was found to be highly soluble in n-hexane, chloroform, ethyl acetate and
acetone. The process of isolation was repeated to get substantial amount for analytical
purpose. The isolated compound was then subjected for characterization through FTIR, 1H-
NMR (500 MHz), 13
C-NMR (125 MHz) and LC-MS techniques to ascertain the chemical
structure.


![Sulphuric Acid Data[1]](https://img.pdfslide.us/doc/110x75/577d23741a28ab4e1e99d41e/sulphuric-acid-data1.jpg)