Embed Size (px)
Citation preview

31. MIGRATION OF Ci TO C8 VOLATILE ORGANIC COMPOUNDS IN SEDIMENTS FROM THEDEEP SEA DRILLING PROJECT, LEG 75, HOLE 530A1
John P. Jasper, Jean K. Whelan, and John M. Hunt, Woods Hole Oceanographic Institution,Woods Hole, Massachusetts
ABSTRACT
The distribution of C, to C% hydrocarbons in sediment samples from DSDP Leg 75, Hole 53OA, indicates that sig-nificant amounts of methane and ethane have migrated from organic-rich to organic-lean shales in close proximity.Most compounds larger than ethane are not migrating out of black shales, where they occur in high concentrations.These results lead to a general model for assessing migration. In addition, three shale types are identified on the basis oforganic carbon and pyrolysis products and patterns.
INTRODUCTION
Sediments of Cretaceous age were recovered fromthe Southeastern Atlantic, Hole 53OA. The generallygreen and gray shales contained thin layers (generally ofmillimeter thicknesses) of black shale. The organic mat-ter in these shales was analyzed to determine (1) whetherdepositional conditions for the black shale layers weresimilar; (2) whether migration of Q-Cg hydrocarbonscould be observed between the alternating green andblack shales; and (3) whether volatile Q - Q hydrocar-bons occurred as found in many other DSDP sediments(see, for example Hunt, 1975; Whelan and Hunt, 1982and references cited therein). The close sampling of in-terbedded shales and large differences in organic carbonover short intervals presented the possibility of deter-mining whether migration is occurring between thesegeothermally immature (<40°C) shales. Previous anal-yses from this laboratory have suggested that the sorbedlight hydrocarbons in Deep Sea Drilling Project (DSDP)sediments correlate well with lithology (see, for exam-ple, Hunt and Whelan, 1978; Whelan, 1979); however,in many cases, it has been difficult to define the influ-ence of migrational changes on these compositions.
EXPERIMENTAL METHODSediment samples collected on DSDP Leg 75, Hole 53OA, were
analyzed for (1) Cj to Q hydrocarbons by a headspace technique, (2)pyrolyzable hydrocarbons by a thermal distillation-pyrolysis tech-nique, and (3) total carbon (mass percent relative to dry weight of sed-iment) and organic carbon by a combustion technique.
The headspace technique employed here was described previously(Whelan, 1982) with a minor modification: Sample sizes were 2 to 6 gwet weight of sediment. Some of the methane and ethane is lost duringcoring so that all levels reported here are minimum values and repre-sent primarily gases sorbed on the sediment (see discussion section).The headspace technique involves placing the frozen sediment in astainless steel vessel equipped with a septum, a screw cap, and twometal ball bearings. Distilled water (100 ml) and a helium gas head-space are sealed into the vessel along with the sediment. The vessel isshaken on a commercial paint shaker (the stainless steel balls break upthe sediment during this process) and heated in a 95° C water bath for
Hay, W. W., Sibuet, J . -C, et al.. Init. Repts. DSDP, 75: Washington (U.S. Govt.Printing Office).
30 minutes. The headspace gases are then analyzed by gas chromatog-raphy.
The thermal distillation-pyrolysis technique is that of Whelan,Hunt, and Hue (1980), with the following modification to the heatingprogram. The samples were heated from room temperature to 250°Cat 140°C/min. and remained at 250°C for 20 minutes to drive off vol-atile (P,) hydrocarbons. They were then heated at 40°C/min. to55O°C, pyrolyzing the organic matter and releasing pyrolysis (P2) hy-drocarbons. The samples remained at the final temperature for 10minutes before cooling.
Carbon content was determined by combustion, using a Leco Ap-paratus. Total carbon was determined on ground, dried samples andorganic carbon was determined on ground, dried, and decarbonated(by HC1 vapor) samples.
RESULTS AND DISCUSSIONThe results of headspace analysis for C to C8 hydro-
carbons are presented in Table 1. Analyses of the solidphases are presented in Table 2. Calculation of produc-tion indices (PI) from the relationship PI = P\/(P\ +P2) gives low values (0.0004 to 0.1), indicating that thesediments are immature with respect to petroleum gen-eration (Barker, 1974; Espitalie, et al., 1977; Hue andHunt, 1980).
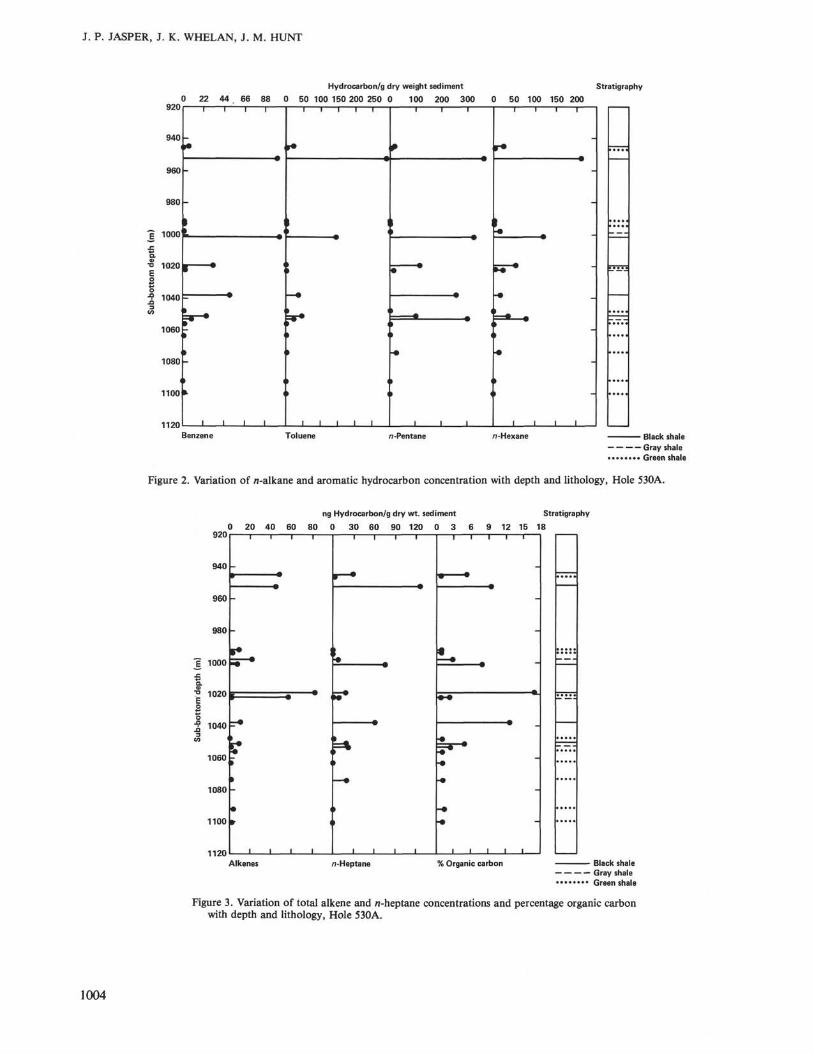
Some typical depth profiles of Q through C7 com-pounds at Hole 53OA are shown in Figures 1 through 3.Black shales (typically with Corg, > 3%) are indicated bysolid horizontal lines and less organic-rich gray shales(1.5% < Corg < 3%) are indicated by broken horizontallines on the scale at the far right. All other samples aregreen shales (with Corg < 1.5%), and they are indicatedby dotted horizontal lines. Figures 1 through 3 show thatalmost all compounds (except methane and ethane) areconcentrated mainly in black shales and are relativelydepleted in the gray and green shales. It appears that thelightest hydrocarbons (e.g., methane and ethane) aremigrating from organic-rich to organic-lean shales, where-as heavier hydrocarbons are remaining in the black shalelaminae where they were generated.
On an organic carbon normalized basis, the nonblackshales (that is, the green shales and gray shales, hereaf-ter referred to as "green shales") have disproportionate-ly high concentrations of methane and ethane. In orderto demonstrate this fact, we define a parameter calledthe "enrichment factor" (EF), extending ideas original -
1001

J. P. JASPER, J. K. WHELAN, J. M. HUNT
Table 1. Ci to Cg hydrocarbons and total amounts of volatile compounds, DSDP Leg 75, Walvis Ridge (headspace analysis).
Core-Section(interval in cm)Sub-bottom depth (m)Shale typeAge8
Compound
MethaneEthanePropane/-Butanen-Butanei-Pentaneπ-Pentane2,2 DimethylbutaneCyclopentane2,3 Dimethylbutane2-Methylpentane3-Methylpentaneπ-HexaneMethylcyclopropane +
2,2 Dimethylpentane2,4 DimethylpentaneBenzene2,2,3 TrimethylbutaneCyclohexane3,3 Dimethylpentane2 Methylhexane +
2,3 Dimethylpentane3 Methylhexanel-t-3 Dimethylcyclopentanel-t-2 Dimethylcyclopentane3 Ethylpentane +
2,2,4 Trimethylpentane1 -c-3 Dimethylcyclopentanen-Heptane1 -c-2 DimethylcyclopentaneMethylcyclohexane +
1,1 Dimethylcyclopentane2,2 DimethylhexaneEthylcyclopentaneToluene2,3,4, Trimethylpentanel-t-4 Dimethylcyclohexanen-Octane
Totals
AlkenesC2 + C3C 4 - C 7CgAromatics
5-5, 32-33169
Graye. Plio.
14000000000000.100
000000
0000
0000
000000
500.100
62-3, 106-108708
GreenCreta. (Camp.)
29315000000000000
000000
0000
0000
000000
1515000
8 7 A 103-105945
BlackCreta. (Coniac.)
17220
5.51.434.19.24.001.7
203.3
243.7
4504.614.5
2002
025.6
04
00
15407
4625.5
140.11120
8 7 A 125-127945.7Green
Creta. (Coniac.)
293164.606.6000000000
000000
0000
0000
000000
020.6
6.600
88-3, 31-33952.3Black
Creta. (Coniac.)
93-2, 36-39992
GreenCreta. (Coniac.)
(ng compound/g dry sediment w
2472547
113199173356
01416.816.621
20824
7100
0140
67.6
14770
0126
034.5
00
29000
100
4272
1822.3100390
220140f:0
0
000000
0:>0000
0000
0000
00:.'000
5.614000
93-3, 44-46
993.5Green
Creta. (Coniac.)
t.)
1547.40:000
000000
00f:
000
0000
0000
000I")
00
1.27.4000
93-6, 89-92998
GrayCreta. (Coniac.)
988000(I
0001.7
18.61.9
10.42.4
000002
0.5000
05.500
000000
208
4300
94-2, 38-401001
BlackCreta. (Coniac.)
2041771
168233220322
09
13120
1611768
25102
027
058
78
140
1174
071.5
00
140000
4.888
1823.50
242
96-2, 18-201019
BlackCreta. (Turon.)
Ill3285
181139118112
00
1586134944
4.7
31050
12
5.40
1540
17.5160
16
2.300000
81117879.6
2.331
' Ages correspond to those of Steinmetz et al., this volume.
920
9401-
960 -
980 -
J 1000
fΦ
g 1020
I 1040P
1060^
1O8θP
1100
ng Hydrocarbon/g dry wt. sediment Stratigraphy
0 100 200 300 0 10 20 30 40 50 60 0 40 80 120 160 0 50 100 150 200 250
1120
I
-
-
=—ti
—
1
•
1 1 1 f 1
-1 1 1 1
1 '
1
1
1
1 1
1
1
1
1
1
1
1
»
1
1 1 1
11
1
1
(
1
1
I
11
1
1
1
1
1
1
1 '
1 1
1
-
-
-
-
Methane Ethane Propane π-Butane Black shaleGray shale
. . . . . . . . Green shale
Figure 1. Variation of n-alkane concentration with depth and lithology, Hole 53OA.
1002

MIGRATION OF VOLATILE ORGANIC COMPOUNDS
Table 1. (Continued).
96-4, 14-161021.6Green
Creta. (Turon.)
1126.80.96000006.900000
000000
0000
0000
000000
07.766.900
96-4, 29-311021.8Gray
Creta. (Turon.)
1398.103.34.7
12 311.6004
40.24.2
17.69.1
100
1.600I)
14
2.005.3
10.5
76.70
10
000000
568.1
253.60
1.6
98-3, 37-391038
BlackCreta. (Turon.)
14060
181245264205253
03.2
10.210.511.41314.6
10.648.6
015.30
31.2
8.227.440.3
0
22358.7
28.8267
014.630.8
000
8.6241
1834.40
79.4
99-3, 105-1071048
GreenCreta. (Turon.)
482.50.6600.57
000000000
000000
0000
000
0
000000
03.16J.5700
99-5, 130-1321051
BlackCreta. (Cenoman.)
100-1, 97-991053
GrayCreta. (Cenoman.)
(ng compound/g dry sedi
679.4
41.110110297.497
028.6
427.2
3322.5
4.123.6
05.90
14.6
4.11116.20
8.51912.418.3
00
41.2000
7.950.5
691.60
64.8
1812729
119
1352812 %
2
1161
97626
2.47.8040
13.3
4.90
1021
10.322
011
04.8
158.399
056
1159.526.322.8
100-3, 38-401056
GreenCreta. (Cenoman.)
ment wt.)
864.80.8200000000000
000000
0000
0000
000000
45.62000
101-1, 108-1101063.1Green
Creta. (Cenoman.)
886.6000000000000
000000
0000
0000
000000
06.6000
102-3, 84-861077.8Green
Creta. (Cenoman.)
31111
3.92.12.9
12.622
06.9
00
1210
0
000000
0
000
018
010
000
01
0
014.996.5
00
104-5, 142-1441092
GreenCreta. (Alb.)
1045.8000000004.703.30
000000
0000
0000
00000fi
35.8800
105-4, 135-1381100
GreenCreta. (Alb.)
1107.8
M00000000000
000000
0000
0000
000000
19.2000
Table 2. Pyrolysis and carbon data.
Sample(interval in cm)
Hole 53OA
5-5, 32-3362-3, 106-10887-4, 103-1058 7 A 125-12788-3, 31-3393-2, 36-39A93-2, 36-39B93.3, 44-4693-6, 89-9294-2, 38-4096-2, 18-2096-4, 14-1696-4, 29-3198-3, 37-3999-3, 105-10799-5, 130-132100-1, 97-99100-3, 39-40101-1, 108-110A101-1, 108-110B102-3, 84-86104-5, 142-144A104-5, 142-144B1 0 5 Λ 135-138
Hole 532
8-2, 24-2612-2, 31-34A12-2, 31-34B19-2, 42-4442-1, 146-148
Pyrolysis hydrocarbons
/ µg HC \\ g dry sed. wt. /
^1
952295
0480
25.48.4
1440
101708
069
120
485116
1.22358542319
14250610140110
Pi
5200227
10,0000
89,000321193821
408041,00096,000
4754420
73,000_
16,0009,540
313261513472540538290
33,00020,00021,00017,0009,900
Productionindex
[PX/(Pl + P2)]
0.0180.0880.0095
n.d.0.00540.00730.0420.0170.00970.00250.00730.00.0150.0016
_0.00300.00530.0490.00460.0430.110.0910.0410.061
0.000420.0120.0280.00820.011
Mass percent carbonrelative to
dry sediment
c total
4.481.724.830.6059.20.660.660.763.157.71
17.10.602.1
12.52.084.92.22.760.800.81.121.21.20.80
11.17.107.105.817.77
COrg
2.031.124.830.569.20.670.670.622.517.71
17.10.602.1
12.50.6934.92.20.740.780.780.941.21.20.80
5.014.614.613.303.58
Note: n.d. = not defined. "A" and " B " designate replicate samples.
ly proposed by Schaefer et al., 1982. The enrichmentfactor is the ratio of a hydrocarbon, X, normalized tomass percent of organic carbon in a green shale to thesame hydrocarbon, X, normalized to organic carbon inthe black shale, that is:
pp _ (mass of hydrocarbon A7mass Co r g, G) "Green"
(mass of hydrocarbon AVmass Co r g, B) B l a c k
A migration model can be derived using the enrich-ment factor. Two assumptions are made:
1) Mass transfer of hydrocarbon A" can occur between"green shale," black shale, and the surrounding system(migration).
2) The mass of hydrocarbon X as analyzed by head-space analysis is proportional to the mass of organiccarbon in a given sediment sample (see, for example,Karickhoff, et al., 1979) unless hydrocarbon migrationhas occurred (proportionality). The assumption of pro-portionality is made because pyrolysis results indicatethat potential hydrocarbon production is proportionalto mass organic carbon in sediments (see Figs. 4, 5, and6).
If these assumptions are valid, the enrichment factorcan be used to detect migration. For example, an enrich-ment factor of 1 would indicate that both shales releasedthe expected amounts of hydrocarbon gases upon head-
1003
J. P. JASPER, J. K. WHELAN, J. M. HUNT
920
940 -
960 -
980 -
1000
Hydrocarbon/g dry weight sediment Stratigraphy
0 22 44 66 88 0 50 100 150 200 250 0 100 200 300 0 50 100 150 200
I•S 1020
ε
•? 1040 -
1060 -
1080 -
1100
1120
f
1 !L .
W 1
1
> <
i i i i i
r
1 1i i
i i
t
{
I <
I 1 1
P
\
« *
r 1
1 |
-i i
t i
i i i
i i i i
r
1• .
-i
-i
i i i i
Benzene Toluene π-Pentane n-Hexane Black shaleGray shale
. . . . . . . . Green shale
Figure 2. Variation of n-alkane and aromatic hydrocarbon concentration with depth and lithology, Hole 53OA.
920
940 -
r
960 -
980 -
J 1000
IV 1020
g| 1040ECO
1060
1080
1100
ng Hydrocarbon/g dry wt. sediment Stratigraphy
20 40 60 80 0 30 60 90 120 0 3 6 9 12 15 18
1120
f :
i
•Φ i
• i
i i i i
i i i i
!
>
1
1
1
1
1 I 1 1
=3—• *
--1 1 1 1 1
Alkenes /7-Heptane % Organic carbon Black shaleGray shaleGreen shale
Figure 3. Variation of total alkene and n-heptane concentrations and percentage organic carbonwith depth and lithology, Hole 53OA.
1004

MIGRATION OF VOLATILE ORGANIC COMPOUNDS
B1 2
s 8
I ,o '
4
2
r
Δ0+
-
Δ
Δ
*" i
i 1 1 —
Black shale
Gray shale
Green shale
i i i
—i 1 1 1—
Y intercept =
Slope =
Correlation coefficient =
i i i i
1 1Δ
A
-
1.20.140.90
i
10 20 30 40 50 60 70
P2 (mg HC/g dry sediment wt.)
80 90 100
Figure 4. Graph and regression of percentage organic carbon versustotal pyrolysis-produced (p2) hydrocarbons for all samples inTable 2, Holes 53OA and 532.
18
16
14
g 12
| 10
8.a 8
Δ Black shale
O Gray shale
+ Green shale
Y intercept = 1.07
Slope - 0.45
Correlation coefficient = 0.99
8 12 16 20 24 28 32
Methane (mg HC/g dry sediment wt.)
36 40
Figure 5. Graph and regression of percentage organic carbon versuspyrolysis-produced (P2) methane for all samples in Table 2, Holes53OA and 532.
Δ Black shale
O Gray shale
+ Green shale
Y intercept = 1.13
Slope = 0.53
Correlation coefficient = 0.99
10 15 20 25
Ethane (mg HC/g dry sediment wt.)
30 35
Figure 6. Graph and regression of percentage organic carbon versuspyrolysis-produced (P2) ethane for all samples in Table 2, Holes53OA and 532.
space analysis (i.e., in proportion to their respectiveamounts of organic carbon) and migration did not oc-cur. An enrichment factor greater than 1 would indicatea mass transfer from black shale to the "green" shalebecause "green" shale would have a disproportionatelyhigh amount of hydrocarbon X relative to the blackshale. (This result could also be obtained by lateral mi-gration of hydrocarbons from other sections into thegreen shales section). An enrichment factor less than 1would indicate that the "green" shale released a dispro-portionately low amount of hydrocarbon X relative tothe black shale or that more hydrocarbons migrated outof the green shales than out of the black shales. We be-lieve that all measurable hydrocarbons in green shaleshave migrated there because: (1) C 3 + hydrocarbonswere generally not detected in green shales in amountsgreater than the headspace detection limit (20 pg hydro-carbon/g dry weight of sediment) and (2) no Q-C28 hy-drocarbons could be generated by pyrolysis in the greenshale sections (detection limits: 10 µg/g for methane and1 µg/g for other hydrocarbons). The pyrolysis gives atheoretical "upper limit" on the amount of hydrocar-bon a sediment could generate under optimum petrole-um generation conditions.
This model can be applied to shale pairs using datafrom Tables 1 and 2. Five "green" shale-black shalepairs were selected for this analysis on the bases thattheir percentage of organic carbon differed by at least afactor of three (denoted CB/CG in Table 3) and that theywere relatively closely spaced (from 20 cm to 7.5 m in a155-m section containing the black shales). For all fiveshale pairs examined, the enrichment factors (EF) aresignificantly greater than one for methane and ethane.The model would predict that the hydrocarbons had mi-Table 3A. Enrichment factors for black shale-"green" shale pairs.a
(interval in cm)
Black-green pairs87-4, 125-12787-4, 103-105Enrichment factorΔ Depth = 0.7 mC B / C G = 8.6b
99-3, 105-10799-5, 130-132Enrichment factorΔ Depth = 3 mC B / C G = 7.0
96-4, 14-1696-2, 18-20Enrichment factorΔ Depth = 2.6 mCß/CG = 2 8 5
93-3, 44-4694-2, 38-40Enrichment factorΔ Depth = 7.5 mC B / C G = 28.5
Black-gray pair93-6, 89-9294-2, 38-40Enrichment factorΔ Depth = 3 mC B / C G = 3.07
Depth(m)
945.7945
1,0481,051
1,021.61,019
993.51,001
9981,001
(%)
0.564.83
0.6934.85
0.6017.1
0.6207.71
2.517.71
Compound (ng HCA7g C o r g )
Methane
52,1003,560
14.6
6,9301,400
5.0
18,700649
28.8
24,8002,650
9.39
3,8202,650
1.45
Ethane
2,850410
6.9
360190
1.9
1,100187
6.1
1,190220
5.41
320220
1.45
Propane
820110
7.2
95847
0.11
160813
0.32
0921
0
0920
0
n-Butane
062
0
822,100
0.039
01,060
0.0
02,180
0
03,020
0
a "Green" shale = nonblack shale = green shale or gray shale.b C B / C Q = % C o r g black/% C o r g "green."
1005

J. P. JASPER, J. K. WHELAN, J. M. HUNT
Table 3B. Enrichment factors for "gray" shale-"green" shale pairs.a
Sample(interval in cm)
Gray-green shale pairs93-3, 44-4693-6, 89-92Enrichment factorΔ Depth = 4.5 mC A / C E = 4.05a
96^4, 14-1696-4, 29-31Enrichment factorΔ Depth = 0.2 mC A / C E = 3.5
100-3, 38-40100-1, 97-99Enrichment factorΔ Depth = 2.4 mC A / C E = 3.01
Depth(m)
993.5998
1,021.61,021.8
1,0561,053
(%)
0.6202.51
0.602.10
0.747.2
Note: n.d. = not defined.a C A / C E = % C o r g gray/% C o r g green.
Compound (ng HCA7g C o r g)
Methane
24,8003,800
6.5
18,7006,560
2.85
11,6008,200
1.4
Ethane
1,190320
3.7
1,100380
3.0
6501,200
0.53
Propane
0920
0
1600
n.d.
1101,300
0.084
n-Butane
03,020
0
0.1220
0
0.16,100
0
grated into the "green" shale. For almost all other com-pounds examined in the headspace analysis, the enrich-ment factors approach the EF detection limit of about3 × 10~4 for these samples.
If the model is correct, then all shale samples contain-ing any organic carbon (above the detection limit of0.02% Corg) should release some hydrocarbon (abovethe detection limit of 20 pg HC/g dry sediment), yield-ing an EF greater than 3 × 10~4. (The EF detectionlimit of 3 × 10 ~4 for this set of samples is determined byassuming organic carbon levels of about 0.6% and 3%as commonly found for green and black shales, respec-tively, and levels of about 360 ng hydrocarbon/g for theblack shale [a maximum observed] and 0.02 ng/g for thegreen shale [the minimum detectable]). Therefore, whenthe enrichment factor is less than 1 and approaches 3 ×10~4, either no hydrocarbon X (>20 pg/g sediment)has been produced in the green shales or all hydrocar-bon X (>20 pg/g sediment) has migrated out of thegreen shale. The former alternative (i.e., no measurableproduction) is more likely considering three observa-tions:
1) All the shales in this sedimentary column are im-mature with respect to petroleum generation.
2) Regression analyses (Figs. 4, 5, 6) of hydrocar-bons released by pyrolysis show that there is a criticalconcentration of organic carbon (about 1 % Corg) belowwhich detectable levels of hydrocarbons are not pro-duced.
3) Since both black shales and green shales are fine-grained they probably have very similar permeabilities(Fancher and Lewis, 1933; Barrer, 1941). Thus, a pref-erential migration of hydrocarbons out of the greenshale section seems unlikely.
For green shale-black shale pairs, the enrichmentfactors approach zero (i.e., 3 × I0"4) in most casesother than methane and ethane because no measurablehydrocarbons are released by the green shales, as indi-cated by headspace analysis. In these cases, the mass ofhydrocarbon gas X as analyzed from the headspace isclearly not proportional to the mass of organic carbonin the green shale sample. In the green shales, only two
compounds are found consistently (methane and ethane)and five compounds intermittently, whereas in blackshales an average of 26 compounds (including methaneand ethane) are found. In all cases for methane andethane, the enrichment factor is greater than one; thatis, the concentrations of methane and ethane are alwaysdisproportionately large in the green shales. Thus, evenif it were shown that significant hydrocarbon produc-tion were occurring in these green shales, their methaneand ethane concentrations would still be disproportion-ately high relative to organic carbon.
If it could be demonstrated that no measurable hy-drocarbons (i.e, 20 ng/g) are produced in the greenshale, an enrichment factor greater than 3 × 10~4) (i.e.,any detectable free hydrocarbon at all in the headspaceanalysis of the green shale) would indicate hydrocarbonmigration.
Employing an analysis similar to that of Whelan andHunt (1982), it was found that plotting the total (P2) py-rolysis hydrocarbons against percentage of organic car-bon, the organic carbon intercept is 1.19% (Fig. 4). Thisresult suggests that this value is a threshold level of or-ganic carbon (1.19%) in this set of samples below whichdetectable hydrocarbons are not produced, providingthat the linear (rather than a curvilinear) relationship isvalid. All the samples that are called green shales basedon pyrolysis fall below 1.19%; their average is about0.6% organic carbon. This result indicates that no de-tectable hydrocarbons are produced in the green shale,so that all hydrocarbons (predominantly methane andethane) in green shales have migrated there.
From this analysis, a sediment can be defined as eithera green shale or black shale on the bases of the pyrolysis(P2) capillary chromatograms and percent organic car-bon in addition to the sediment color. Black shales havea complex and characteristic pattern of organic com-pounds generated by pyrolysis, consisting primarily ofalkenes and alkanes from C7 to C27 (the range of ouranalysis) as shown in capillary gas chromatograms of P2hydrocarbons of two black shales (Fig. 7). The two sam-ples illustrated in Figure 7 were selected because theywere representative of all the black shales examined inthis study, and they were widely spaced in the sedimen-tary column. Their pyrolysis (P2) chromatograms aresimilar, indicating that black shale organic matter com-position is remarkably similar over the 27 m.y. rangesampled. In contrast, green shale pyrolysis (P2) chro-matograms are virtually blank. The green shale pyroly-sis patterns never exceed blank levels and are clearly dif-ferent from the black shale patterns, thus enabling py-rolysis-gas chromatography to be used to differentiategreen and black shales. Capillary gas chromatograms ofpyrolysis (P2) hydrocarbons allow definition of a thirdshale, the gray shale. The gray shale GC pattern is sig-nificantly greater than the blank levels, but not as com-plex as that seen in the black shales. The percentage oforganic carbon in the grey shale is in the range of 1.5-3%—between those of the green and black shales.
There are a few compounds (typically C3, n-C4, and/-C4) whose £F's are greater than 3 × 10 ~4, but oftenless than 1. Since it has been shown that detectable hy-
1006

MIGRATION OF VOLATILE ORGANIC COMPOUNDS
Sample 530A-98-3, 37-39 cm (1038 m)
Sample 530A-88-3,31-33 (952 m)
^ \ ^ \ ^ T W
ZI-ZSZ
Figure 7. Capillary gas chromatograms of pyrolyzable (P2) hydrocarbons in black shales, Hole 53OA.
drocarbon production does not occur in the green shales,these EF's indicate migration of a,small amount of hy-drocarbon. These compounds are slightly heavier thanmethane and ethane, which migrate into the green shales,but are smaller than the heavier C5+ compounds whichdo not.
The application of this migration model is not limitedto "green" shale-black shale pairs. In principle, it canbe applied to any lithology, up to the limitations im-posed by the error in the required measurements andsample variability. In such cases, the enrichment factoris defined such that the mass of hydrocarbon X and thepercentage of organic carbon in the sample containingless organic carbon is in the numerator and those of thesample containing more organic carbon are in the de-nominator.
Applying this methodology to green shale-gray shalepairs, it can be seen that in all cases examined (Table 3,Part B), migration of methane and ethane from the grayshale to the green shales could be occurring.
Whelan (1982) has noted that the measurement ofmethane in the headspace analysis is qualitative becauseof losses during and after sample collection. Kartsev etal. (1959) indicated that sorption of light hydrocarbonsby "soil" and "rock" samples is proportional to theamount of organic matter contained in them. Karickhoffet al. (1979) observed the same proportionality in un-consolidated lacustrine and fluvial sediments. This pro-portionality would favor organic-r/c/i sediments in re-taining volatile hydrocarbons. In spite of both thesefacts, methane and ethane were retained in dispropor-tionately high amounts relative to the percentage oforganic carbon in the organic-/eα/z sediment samples,and migration was still demonstrable on the basis of theenrichment factor.
No less significant than the demonstration of migra-tion of methane and ethane is the fact that an average of
21 hydrocarbons in the C3 to C8 range have not mi-grated from the black and/or gray shales to the greenshales in these sediments that are an average 95 m.y.old. Significant concentrations of these compounds arefound in black shales which are within centimeters tometers of green shales where no detectable amounts ofthe same hydrocarbons are found (see Table 1).
CONCLUSIONS
1. Most of the 36 Q to C8 hydrocarbons from sedi-ment samples analyzed by headspace analysis are foundin black shales.
2. The localized distribution of most hydrocarbonslarger than methane and ethane in black shales and en-richment factors less than or equal to about 3 × 10 ~4
for "green" shale-black shale pairs indicate that thesecompounds have not migrated from the black to the"green" shale.
3. Methane and ethane are distributed through all li-thologies.
4. The distribution of methane and ethane can be at-tributed to migration on the basis of the enrichment fac-tor.
5. Migration of methane and ethane from gray shalesto green shales is indicated by the enrichment factor.
6. The organic matter in all the black-shale layers issimilar, as indicated by pyrolysis products. This resultimplies similarity in depositional conditions for the var-ious layers.
7. A general model is proposed for migration basedon the enrichment factor.
ACKNOWLEDGMENTS
We would like to thank Christine Burton and Martha Tarafa forproviding invaluable technical assistance. This work was supported bythe National Science Foundation Grant OCE 8019508 and the BasicEnergy Science Division of the U.S. Department of Energy, ContractNo. EG-77-S-02-4392. John Jasper is supported by the MIT/WHOI
1007

J. P. JASPER, J. K. WHELAN, J. M. HUNT
Joint Program in Oceanography. This is WHOI Contribution No.5199.
REFERENCES
Barker, C , 1974. Pyrolysis techniques for source-rock evaluation.AAPGBull., 58:2349-2361.
Barrer, R. M., 1941. Diffusion In and Through Solids: Cambridge(Cambridge University Press), pp. 73-78.
Espitalié, J., Laport, J. L., Madec, M., Marquis, F., Leplat, P., Paul-et, J., and Boutefeu, A., 1977. Méthode rapide de caracterisationdes roches mères, de leur potential pétrolier et de leur degré devo-lution. Rev. Instit. Fr. Petrol., 32:23-42.
Fancher, G., and Lewis, J., 1933. Indust. Eng. Chern. 25:1139.Hue, A. Y., and Hunt, J. M., 1980. Generation and migration of hy-
drocarbons in offshore South Texas Gulf Coast sediments. Geo-chim. Cosmochim. Acta, 44:1081-1089.
Hunt, J. M., 1975. Origin of gasoline range alkanes in the deep sea.Nature, 254:411.
Hunt, J. M., and Whelan, J. K., 1978. Dissolved gases in Black Seasediments. In Ross, D. A., Neprochnov, Y. P., et al., Init. Repts.DSDP, 42, Pt. 2: Washington (U.S. Govt. Printing Office),661-665.
Karickhoff, S. W., Brown, D. S., and Scott, T. A., 1979. Sorption ofhydrophobic pollutants on natural sediments. Water Res., 13:241-248.
Kartsev, A. A., Tabasaranskii, Z. A., Subbota, M. I., and Mogilev -skii, G. A., 1959. Geochemical Methods of Prospecting and Ex-ploration for Petroleum and Natural Gas: Berkeley (University ofCalifornia Press), Ch. 5.
Sahores, J. J., and Witherspoon, P. A., 1970. Diffusion of light par-affin hydrocarbons in water from 2°C to 80°C. In Hobson, G. D.,and Spear, G. C. (Ed.), Advances in Organic Geochemistry, 1966:New York (Pergamon), pp. 219-230.
Schaefer, R. G., Leythaeuser, D., and von der Dick, H., in press.Generation and migration of low-molecular weight hydrocarbonsin sediments from Site 511 of DSDP/IPOD Leg 71, Falkland Pla-teau, South Atlantic. Advances in Organic Geochemistry.
Whelan, J. K., 1979. Ci~C7 hydrocarbons from IPOD Holes 397 and397A. In von Rad, U., Ryan, W. B. F., et al., Init Repts. DSDP Al,Pt. 1: Washington (U.S. Govt. Printing Office), 531-539.
, 1983. Volatile Ci~C8 compounds in marine sediments. InOdham, G., Larson, L., and Mardh, P. A. (Eds.), Gas Chroma-tography/Mass Spectrometry Applications in Microbiology: NewYork (Plenum Press), pp. 381-414.
Whelan, J. K., and Hunt, J. M., 1982. Q-Cg hydrocarbons in Leg 64sediments, Gulf of California. In Curray, J. R., Moore, D. G., etal., Init. Repts. DSDP, 64: Washington (U.S. Govt. Printing Of-fice), 763-780.
, 1983. The organic matter in DSDP Sites 504 and 505 sedi-ments studied by a thermal analysis-gas chromatography tech-nique. In Cann, J. R., Langseth, M. G., Honnorez, J., Von Her-zen, R. P., White, S. M., et al., Init. Repts. DSDP, 69: Washing-ton (U.S. Govt. Printing Office), 443-450.
Whelan, J. K., Hunt, J. M., and Hue, A. Y., 1980. Applications ofthermal distillation-pyrolysis to petroleum source rock studies andmarine pollution. /. Anal. Appl. Pyrol., 2:79-96.
Date of Initial Receipt: September 28, 1982
1008