Embed Size (px)
Citation preview
62
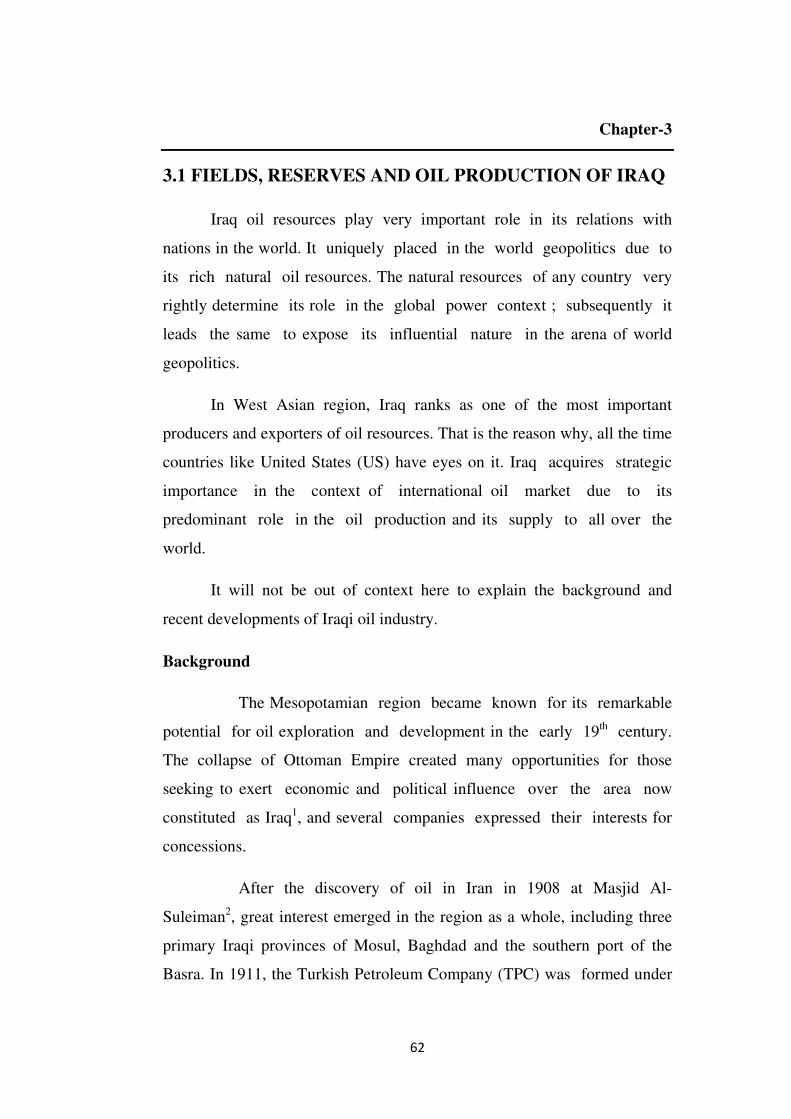
Chapter-3
3.1 FIELDS, RESERVES AND OIL PRODUCTION OF IRAQ
Iraq oil resources play very important role in its relations with
nations in the world. It uniquely placed in the world geopolitics due to
its rich natural oil resources. The natural resources of any country very
rightly determine its role in the global power context ; subsequently it
leads the same to expose its influential nature in the arena of world
geopolitics.
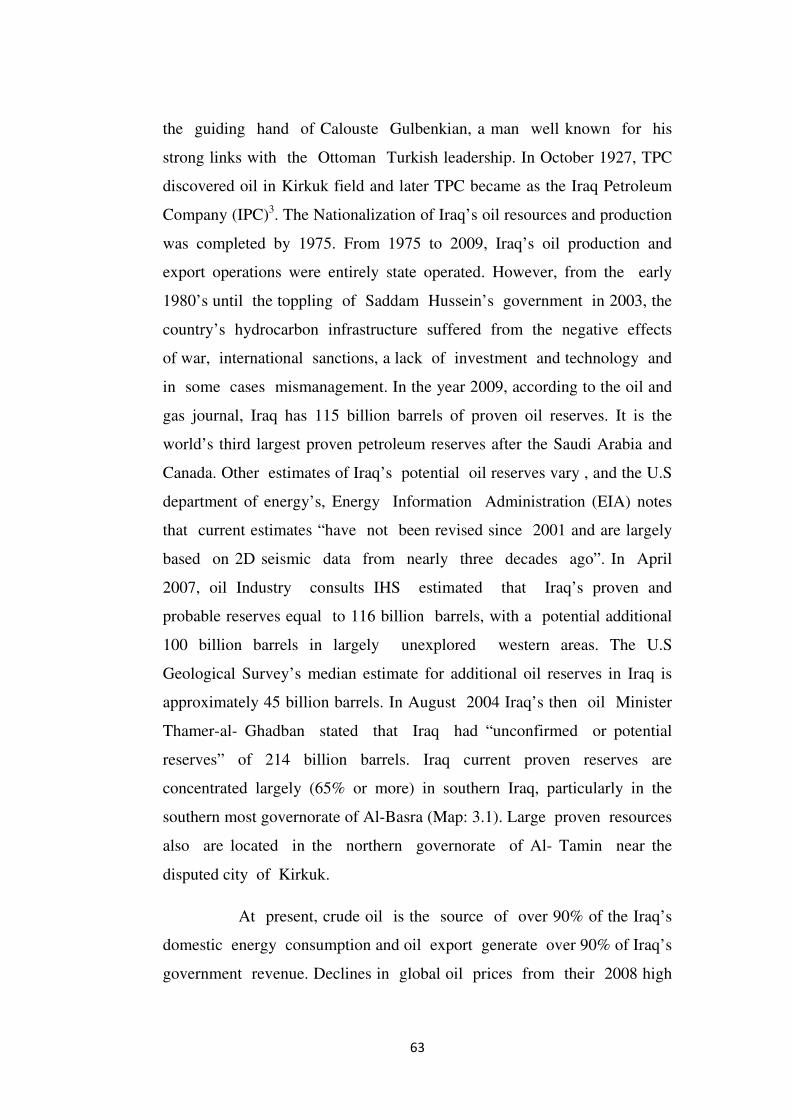
In West Asian region, Iraq ranks as one of the most important
producers and exporters of oil resources. That is the reason why, all the time
countries like United States (US) have eyes on it. Iraq acquires strategic
importance in the context of international oil market due to its
predominant role in the oil production and its supply to all over the
world.
It will not be out of context here to explain the background and
recent developments of Iraqi oil industry.
Background
The Mesopotamian region became known for its remarkable
potential for oil exploration and development in the early 19th century.
The collapse of Ottoman Empire created many opportunities for those
seeking to exert economic and political influence over the area now
constituted as Iraq1, and several companies expressed their interests for
concessions.
After the discovery of oil in Iran in 1908 at Masjid Al-
Suleiman2, great interest emerged in the region as a whole, including three
primary Iraqi provinces of Mosul, Baghdad and the southern port of the
Basra. In 1911, the Turkish Petroleum Company (TPC) was formed under
63
the guiding hand of Calouste Gulbenkian, a man well known for his
strong links with the Ottoman Turkish leadership. In October 1927, TPC
discovered oil in Kirkuk field and later TPC became as the Iraq Petroleum
Company (IPC)3. The Nationalization of Iraq’s oil resources and production
was completed by 1975. From 1975 to 2009, Iraq’s oil production and
export operations were entirely state operated. However, from the early
1980’s until the toppling of Saddam Hussein’s government in 2003, the
country’s hydrocarbon infrastructure suffered from the negative effects
of war, international sanctions, a lack of investment and technology and
in some cases mismanagement. In the year 2009, according to the oil and
gas journal, Iraq has 115 billion barrels of proven oil reserves. It is the
world’s third largest proven petroleum reserves after the Saudi Arabia and
Canada. Other estimates of Iraq’s potential oil reserves vary , and the U.S
department of energy’s, Energy Information Administration (EIA) notes
that current estimates “have not been revised since 2001 and are largely
based on 2D seismic data from nearly three decades ago”. In April
2007, oil Industry consults IHS estimated that Iraq’s proven and
probable reserves equal to 116 billion barrels, with a potential additional
100 billion barrels in largely unexplored western areas. The U.S
Geological Survey’s median estimate for additional oil reserves in Iraq is
approximately 45 billion barrels. In August 2004 Iraq’s then oil Minister
Thamer-al- Ghadban stated that Iraq had “unconfirmed or potential
reserves” of 214 billion barrels. Iraq current proven reserves are
concentrated largely (65% or more) in southern Iraq, particularly in the
southern most governorate of Al-Basra (Map: 3.1). Large proven resources
also are located in the northern governorate of Al- Tamin near the
disputed city of Kirkuk.
At present, crude oil is the source of over 90% of the Iraq’s
domestic energy consumption and oil export generate over 90% of Iraq’s
government revenue. Declines in global oil prices from their 2008 high
64
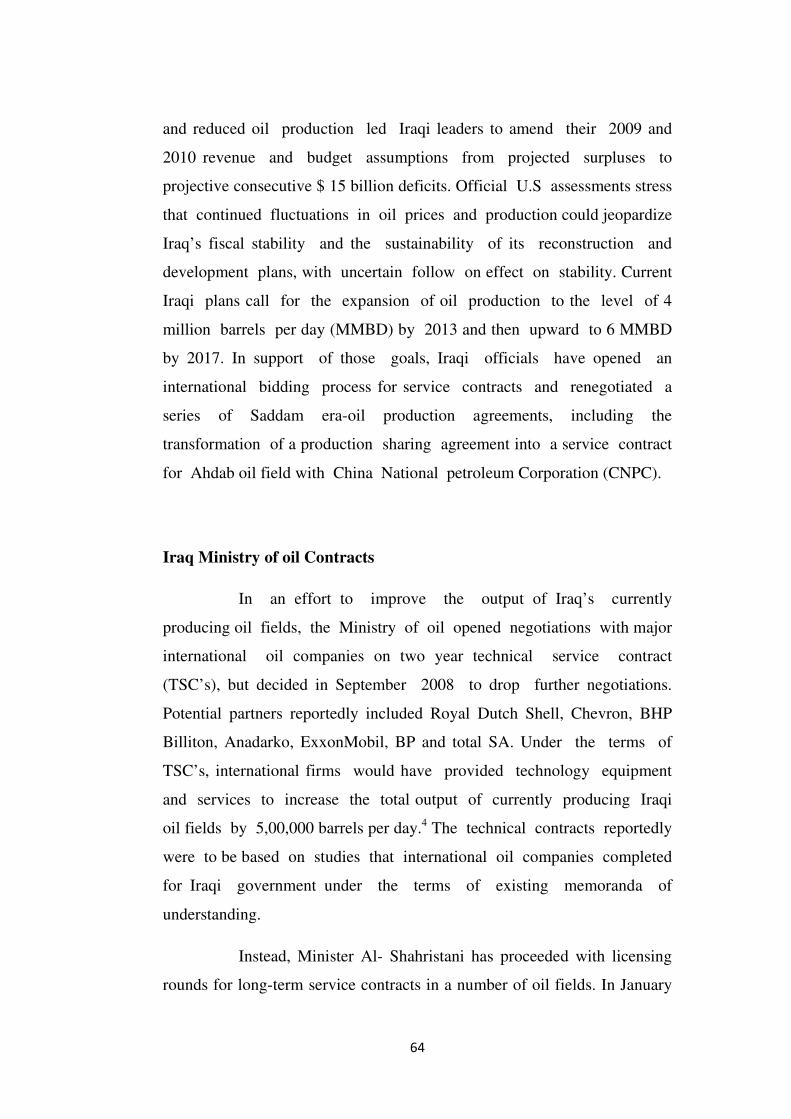
and reduced oil production led Iraqi leaders to amend their 2009 and
2010 revenue and budget assumptions from projected surpluses to
projective consecutive $ 15 billion deficits. Official U.S assessments stress
that continued fluctuations in oil prices and production could jeopardize
Iraq’s fiscal stability and the sustainability of its reconstruction and
development plans, with uncertain follow on effect on stability. Current
Iraqi plans call for the expansion of oil production to the level of 4
million barrels per day (MMBD) by 2013 and then upward to 6 MMBD
by 2017. In support of those goals, Iraqi officials have opened an
international bidding process for service contracts and renegotiated a
series of Saddam era-oil production agreements, including the
transformation of a production sharing agreement into a service contract
for Ahdab oil field with China National petroleum Corporation (CNPC).
Iraq Ministry of oil Contracts
In an effort to improve the output of Iraq’s currently
producing oil fields, the Ministry of oil opened negotiations with major
international oil companies on two year technical service contract
(TSC’s), but decided in September 2008 to drop further negotiations.
Potential partners reportedly included Royal Dutch Shell, Chevron, BHP
Billiton, Anadarko, ExxonMobil, BP and total SA. Under the terms of
TSC’s, international firms would have provided technology equipment
and services to increase the total output of currently producing Iraqi
oil fields by 5,00,000 barrels per day.4 The technical contracts reportedly
were to be based on studies that international oil companies completed
for Iraqi government under the terms of existing memoranda of
understanding.
Instead, Minister Al- Shahristani has proceeded with licensing
rounds for long-term service contracts in a number of oil fields. In January

65
2008, the ministry launched a pre-qualification review process for potential
international investors. Oil companies interested in bidding on oil extraction
and service licenses issued by Iraq’s national government were required to
submit a pre-qualification form to the Ministry’s directorate of petroleum
contracts and licensing by February 18, 2008.6 In march 2008, Minister Al
–Shahristani reported that approximately 150 companies had made
submissions, and by June 2008, 35 companies had been pre-qualified to bid
for long-term service contracts.
The first bid round opened on 30 June 2009, and covered
Iraq’s main oil field at Rumaila ,Kirkuk, Zubair,West Qurna (phase-I), Bai
Hasan, and Maysan, along with natural gas fields at Akkaz and
Mansouriyah. According to Middle East Economic Digest (MEED),
although there was strong competition for phase one of West Qurna
field and southern Zubair oil field, there was just one bid each for the Bai
Hasan, Missan, Kirkuk and Akkas fields.7 Only one bid originally was
accepted by Iraqi authorities- a joint bid by British Petroleum (BP)
company and China National Petroleum Corporation (CNPC) for the
Rumaila service contract. Cabinet approval is being sought for long-term
contract absence of hydrocarbon framework law, and the cabinet reportedly
approved the Rumaila bid in July 2009, paving the way for contract
negotiations. The Federation of workers councils and Unions in Iraq are
protecting the bidding process in general and the Rumaila proposal in
particular.

66
Table No. 3.1 Oil Fields for Bid in Iraq
First Bidding Round Reserves (Billion Barrels)
Rumaila 17
West Qurna, phase –I 8.7
Kirkuk 8.6
Zubair 4
Missan 2.5
Bai Hasan 2.3
First round total (Billion barrels) 43
Second Bidding Round Reserves (Billion Barrels)
West Qurna ,phase –II 12.9
Majnoon 12.6
East Baghdad 8.1
Halfaya 4.1
Gharah 0.9
Najmah 0.9
Qayarah 0.8
Kifil 0.2
West kifil 0.2
Marjan 0.2
Badra 0.1
Qamar 0.1
Gullabat 0.1
Naudoman 0.1
Second round total (Billion barrels) 41
Source: U.S Department of Energy, EIA, Country Analysis Brief: Iraq, June, 2009.
A second bidding round was scheduled for mid December
2009 or early 2010 to include eleven discovered but currently non-
producing fields, including the major fields at Halfaya, Majnoon, East
Baghdad and West Qurna (Phase- II). Interest reportedly remains high in
the proposed bidding round, although industry executives are watching
intently for signals from Baghdad about its plans to negotiate service
contract for the remaining fields from the first round, perhaps by
including them in a rescheduled second round for the an earlier date.

67
The misalignment of Iraq’s proposed compensation fees and the bids
offered by international oil companies in the first round suggested a
need for serious consultation among Iraqi officials and between them
and their prospective partners. Subsequent reported agreements with
consortia for the Rumaila and Zubair fields indicated that some parties
on both sides are willing to be flexible in the interest of reaching
agreements.
Distribution of oil fields according to Provinces
The currently producing fields (Table no.-3.2) are concentrated
in the provinces of Basra and Kirkuk. There is little production from the
other fields located in the provinces of Mesan, Baghdad, Salaheddin, Diala
and Mosul. There is also several discovered and undeveloped fields that
are scattered throughout most of the country’s provinces, except for
four where neither oil nor gas have so far been discovered.

68
Table No. 3.2 Oil reserves and production from the Developed current fields
according to provinces Province No. of
fields Oil
reserves(million of barrels)
Available
production(1,000
barrels/day)
Additional production(one
thousand barrels/day)
Basra 10 61,360 1,800 1,700
Amara 3 2,650 40 100
Nasiriya - - - -
Samawa - - - -
Diwaniya - - - -
Hilla - - - -
Najaf - - - -
Karbala - - - -
Waist - - - -
Anbar - - - -
Baghdad 1 6,500 20 80
Salaheddin 1 500 25 20
Diala 1 30 10 10
Kirkuk 4 12,350 570 155
Sulaimaniya - - - -
Erbil 1 2,200 30 70
Dahook - - - -
Mosul 3 1,040 30 115
Total 24 86,630 2,520 2,640
Source: http://www.iraqrevenuewatch.org
These four provinces are Diwaniya, Babel, Anbar and Dahook shown in the
(Table no.3.3).
69
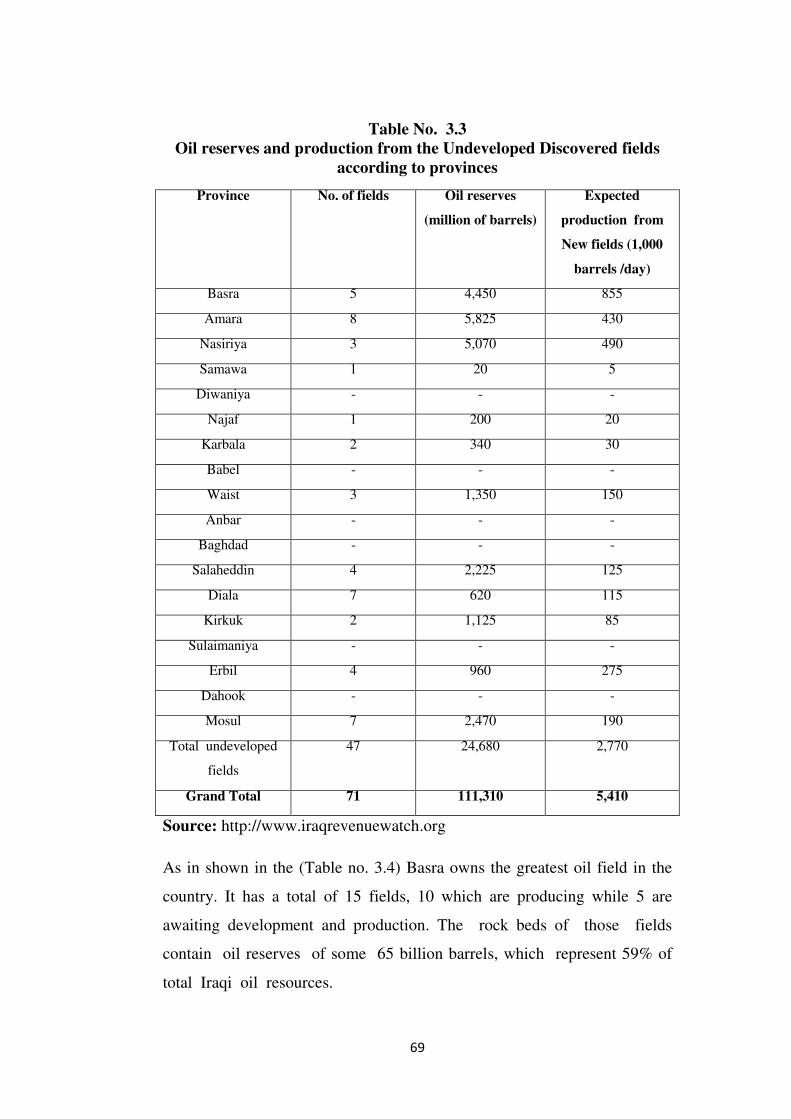
Table No. 3.3 Oil reserves and production from the Undeveloped Discovered fields
according to provinces
Province No. of fields Oil reserves
(million of barrels)
Expected
production from
New fields (1,000
barrels /day)
Basra 5 4,450 855
Amara 8 5,825 430
Nasiriya 3 5,070 490
Samawa 1 20 5
Diwaniya - - -
Najaf 1 200 20
Karbala 2 340 30
Babel - - -
Waist 3 1,350 150
Anbar - - -
Baghdad - - -
Salaheddin 4 2,225 125
Diala 7 620 115
Kirkuk 2 1,125 85
Sulaimaniya - - -
Erbil 4 960 275
Dahook - - -
Mosul 7 2,470 190
Total undeveloped
fields
47 24,680 2,770
Grand Total 71 111,310 5,410
Source: http://www.iraqrevenuewatch.org
As in shown in the (Table no. 3.4) Basra owns the greatest oil field in the
country. It has a total of 15 fields, 10 which are producing while 5 are
awaiting development and production. The rock beds of those fields
contain oil reserves of some 65 billion barrels, which represent 59% of
total Iraqi oil resources.

70
Table No. 3.4 Total oil reserves currently known according to provinces
Province No. of fields Total oil reserves
(million of barrels)
Percentage of total
(%)
Basra 15 65,810 59.1
Amara 11 8,500 7.6
Nasiriya 3 5,070 4.5
Samawa 1 20 -
Diwaniya - - -
Najaf 1 200 0.2
Karbala 2 340 0.3
Babel - - -
Waist 3 1,350 1.2
Anbar - - -
Baghdad 1 6,500 5.8
Salaheddin 5 2,725 2.5
Diala 8 650 0.6
Kirkuk 6 13,475 12.1
Sulaimaniya - - -
Erbil 5 3,160 2.9
Dahook - - -
Mosul 10 3,510 3.2
Total 71 111,310 100.0
Source: http://www.iraqrevenuewatch.org

71
Furthermore, there are 11 fields in Mesan , of which 3 are
productive and 8 are unproductive, comprising some 8.5 billion barrels
of oil reserves. If we add the reserves of Nasiriya field, which are about 5
billion barrels, the existing reserves in these three provinces, Basra, Mesan,
and Nasiriya, will be about 79.4 billion barrels, representing 71% of all the
Iraqi reserves. Kirkuk province has 6 oil fields, consisting of 4 that are
productive, and 2 that are unproductive and awaiting development.
Existing oil reserves in that province are estimated at about 13.5 billion
barrels, including 12.3 billion barrels in the currents fields, and the
remaining in underdeveloped fields. This means that oil reserves in
Kirkuk represent about 12% of total reserves, broken down at 7.5% in the
Kirkuk field and 4.5% in the other province fields. It should be pointed
out that production at the Kirkuk field started in 1934 and its accumulated
production until now has attained 62% of the original reserves existing in
the field8. That means that this super giant is at the final stages of its life
and that its current daily production capacity, amounting to about
470,000 barrels daily ,will plunge to about half of that ten years from
now, and so less than 100,000 barrels a day twenty five years from now.
It is worth pointing out that the region of Kurdistan , in its
current borders, possesses 5 oil fields, including the Khurmala dome,
which is northern extension of Kirkuk field. This field contain about 3.1
billion barrels, with daily production capacity estimated at 375,000 barrels a
day. That means that Kurdistan’s currently known oil reserves represent
about 3% of the total. Additionally, the Sulaimaniya province possesses two
large gas fields Chemchemal and Kormor.
It should be mentioned that exploration operation are still under
way in Iraq. When they are completed, the provinces oil and gas wealth
distribution map may radically change. However, the position of Basra will
most likely remain at the forefront. In addition, there are studies indicate
that the provinces in which oil has not been discovered until now have
72
solid oil and gas prospects, especially in the case of the two provinces
of Anbar and Mosul.
It can be seen in the enclosed (Map: 3.2) that there are several
joint fields and current fields. Among the most important fields are the
following:
Al-Fakkah Field
The Al- Fakkah field also known as Jabel Al- Fauqi. Its
geographical coordinates are 32°02’N to 47°37’ E. It is an onshore oilfield
located in the Maysan region in southern Iraq and Khuzestan province of
Iran. This oil field produced 50,000 barrels per day prior to the 2003 Gulf
War. Basically the Al-Fakkah field is part of Maysan oilfield complex,
which reserves of about 2.5 billion barrels.9 The oil field is considered
shared but an area of dispute between Iran and Iraq. Iraq unsuccessfully
put the oil field up for bidding in 2009.10 On December 18, 2009, about
a dozen Iranian troops crossed three hundred yards (a unit of linear
measure) into Iraq and seized oil well no. 4 in the Fakkah field, raising
the Iranian flag on site. The incident infuriated Iraq who demanded that
Iran should withdraw. While the Fakkah oil field is considered shared, Iraq
considers well no. 4 as theirs. The well was drilled 1979 and initially
produced 3,000 barrels per day, however production on the well ceased in
1980 due to Iran–Iraq war. On December 21st, after a series of political
negotiations, Iran withdrew from oil well number 4.11
Az- Zubair field
The Az- Zubair field, also known Az- Zubayr, is an oil field
located in southern Iraq, west of Basra. Its geographical coordinates are
30°21’ N to 47°36’ E. It is one of the largest field in the world and was
discovered in 1949. It has 4.5 billion barrels of proven reserves and
currently produces 195 thousand barrels per day but in the next year under

73
the field’s expansion programme, production is expected to reach a plateau
level of 1.125 million barrels per day.12 The development license has been
awarded to consortium led by Eni (32.81%) with occidental petroleum
corporation (23.44%), Korea gas corporation (18.78%) and Iraq state run
Missan oil company (25%).13
Baba Gurgur
The Baba Gurgur oil field is a large oil field near the city of
Kirkuk which was the first to discovered in northern Iraq in 1927. Its
geographical coordinates are 35°31’58’’ N to 44°20’09’’ E. It was
considered the largest oil field in the World until the discovery of the
Ghawar field in Saudi Arabia in the 1950’s. Baba Gurgur is located 16
kilometres northwest of Arrapha and is famous for its Eternal fire
located at the middle of its oil fields. The Eternal fire of Baba Gurgur
(Father of fire in Kurdish) is a name used describe the flames of the
Baba Gurgur oil field. It is estimated that the burning flames have been
around for more than 4,000 years .The Eternal fire was first discovered
by Herodotus and also has been described by other ancient Greek
authors such as Plutarch. Many believe the Eternal fire to be the same
fiery furnace in the book of Daniel, Chapter 3 , in the Tanakh (old
testament) into which King Nebuchadnezzar (c 630-562 BC), King of
Babylon threw 3 Jews for refusing to worship his golden idol.14 It has
a significant symbolic value for residents of Kirkuk. The burning
flames are the results of an emission of natural gas through cracks in
the Baba Gurgur areas rocks.
74
East Baghdad Field
East Baghdad field is a group of oil fields, located east of Baghdad,
Iraq. Its geographical coordinates are 330 21’ 8” N to 440 38’ 53” N. The
East Baghdad oil field is proven to hold 8 billion barrels a day. The oil
field was discovered in 1976 and 11 km wide 64 km long.15 Basically
this field lies in the two provinces of Baghdad and Salaheddin, and
probably extends Southward within the province of Wasit. Hence, it
should be jointly managed by the provinces of both Baghdad and
Salaheddin, and perhaps that of Wasit too. In December 2009, despite
previous negotiations with Japan’s petroleum exploration company
(JAPEX), there were no bids to work on the oil field. Iraq’s Ministry of
oil will likely work the site instead.16
Halfaya Field
Halfaya oil is an onshore oilfield. Its geographical coordinates are
31049’39” N to 47025’20” E. It is lactated east of Amarah, Iraq. Halfaya is
proven to hold 4.1 billion barrels of recoverable reserves and has
production potential 200- 530,000 barrels per day but only produces
3,000 barrels per day currently.17 In December 2009, the China National
Petroleum Corporation was awarded a 50% stake in the development
of the field and France’s total S.A along with Malaysia’s Petronas were
awarded a 25% stake. The consortium plans production at 353, 000 barrels
a day.18
Kirkuk Field
This is the super giant field comprises three domes that extend
from the southeast to the northwest by about 100 km . Two main domes
(Baba and Avana) are located in Kirkuk, while the third one (Khurmala) is
located within Erbil and currently produces an average of 30,000
barrels daily. It was discovered in 1927. The Kirkuk oil field was brought

75
into use by the Iraq petroleum Company (IPC) in 1934 and has ever
since remained the basis of northern Iraqi oil production with over ten
billion barrels (1.6 km3) of proven remaining oil reserves as of 1998.
After the seven decades of operation, Kirkuk still produces up to one
million barrels a day , almost half of all Iraqi oil exports. Oil from the
Kirkuk oilfield is exported through the Kirkuk-Ceyhan oil pipeline,
which runs to the Turkish port Ceyhan on the Mediterranean sea. Some
analysts believe that poor reservoir management practices during the
Saddam Hussein years may have seriously, and even permanently,
damaged Kirkuk’s oil field. One example showed an estimated 1.5
billion barrels of excess fuel oil being re-injected. Other problems
include refinery residue and gas- stripped oil. Fuel oil re-injected has
increased oil viscosity at Kirkuk making it more difficult and expensive
to get the oil out of the ground.19
Majnoon Oil Field
This is a super giant oilfield located 60 km from the Basra, Basra
governorate in southern Iraq.20 Majnoon is one of the richest oil fields in
the world with an estimated 23-25 billion and proven reserves of 12.6
billion of oil in place. The field was named Majnoon which means
crazy in Arabic in reference to excessive amount of oil in a dense area.21
This field was discovered by Braspetro, a Brazilian in 1975, in a
shallow upper cretaceous formation.22 Development came to a halt in
1980 during the engineering phase of the project, due to Iraq-Iran war,
particularly operation Kheibar. At the time, Braspetro had finished drilling
of 20 wells and pressed 14 drilling rigs into service. In the course of the
war, Iran occupied and sabotaged the area. After the war southern oil
company of Iraq restarted the production. In 1990’s total S.A of France
negotiated a development contract with Saddam Hussein but was
unable to sign the deal due to United Nations Sanctions imposed on
Iraq. The deal was eventually annulled by Hussein in 2002. Due to 2003

76
second Gulf War, the production was reduced to 46,000 barrels per day.23
In 2007, total and chevron signed an agreement with Iraqi government to
explore Majnoon field.24
On December 11, 2009 the Iraqi government awarded a licence to
a joint venture from Royal Dutch Shell and Petronas to take over operations
at Majnoon oil field, and triple production from the estimated reserves
nearly 12.6 billion barrels at a fee rate of $ 1.39 barrel.25 The consortium
was awarded the content out of 44 international companies, participating
in the auction, with China National Petroleum corporation (CNPC),
ExxonMobil , Sinochem corporation, total specially bidding of Majnoon
field.26 The finalist alliance of CNPC and total offering $ 1.75/ barrel lost
the bid. The deal intends a 20 year service and development of the field.27
The contract was approved by council of Ministers of Iraq on 5th January,
2010.
Majnoon Island
Majnoon Island is an Island in the southern Iraq near Al- Qurnah,
located in a centre for oil production of the Majnoon oil field. The area was
built out of sand dunes and mud to create pathways for oil pipelines. Before
Gulf War28, roughly a sixth of Iraq’s oil reserves, some seven million
barrels, passed through this Island. Production quickly recovered after the
site was a centre of fighting in the Iran-Iraq war , particularly operation
Kheibar in 1984. However, post the imposition if United Nations Sanctions
and the 2003 Iraq war, production has presently reduced to 46,000 barrels
per day.
In December 2009, the Iraqi government awarded a license to a
joint venture from Royal Dutch Shell and petronas to take over
operations at Majnoon oilfield, and triple production from the estimated
reserves of 13 billion barrels at a fee rate of $1.39 per barrel.29 Joint
77
venture company is 25% held by the Iraqi Ministry of oil , 45% by shell
and 30% by petronas.
Nahr Umr Field
This field lies in the province of Basra. Its geographical coordinates
are 30052’17” N to 47039’02” E. This oilfield discovered in 1949 by
British Petroleum.30 Its production began a long time ago from the layer
called Nahr Omar’s formation, with modest rates about 1,000 barrels a
day. However, the main reservoirs of that field, which are those of
Yamama, Zubair and Mishrif, are still undeveloped. Once developed, a
production capacity of 400-500 thousand barrels per day could be obtain.
Once more, it is seen that this field could be classified as a current field
because it has been producing for a long period of time; and yet
because its main reservoirs are still undeveloped, it may also be argued
that it is a new field.
Rumaila Field
Rumaila field is an oil field located in Kuwait and southern Iraq.
The dispute between Iraq and Kuwait over allegedly slant–drilling in the
field was one of reasons for Iraq’s invasion of Kuwait in 1990.31 This
giant oil field was discovered by British petroleum in 1953. Under the
Saddam Hussein, it was nationalized by Iraq. Since then, this massive oil
field remains under Iraqi and Kuwaiti control. Estimated to contain some
15% of Iraq’s oil reserves, British Petroleum (BP) and China National
Petroleum Corporation (CNPC) won a 20 year service contract to develop
Rumaila at the end of June 2009. It is the most productive oil field in Iraq;
the field was a great hope for cash from future oil exports in order to dreams
of modernization with new foreign machinery. This oil field represented
their path to economic independence. But this field was in critical situation
during the Gulf War. Iraq after accusing Kuwait of side- drilling launched
an attack on Kuwait soils that were allegedly drilling Iraqi oil.
78
West Qurna Field
West Qurna is one of the Iraq’s largest oilfields located North of
Rumaila field, west of Basra. West Qurna is believed to hold 21 billion
barrels of recoverable reserves, making it the second largest field in the
world after Saudi Arabia’s Gharwar oil field.32 The field was closed to
western firms due to year–long sanctions.33 It is currently partially
producing at about 300,000 barrels day compared with 800,000 barrels a
day when development is completed. Thus there are those who may
argue that this field belongs to the current fields, while others would
argue that it belongs to the new fields.
OIL RESERVES IN IRAQ
Oil reserves are the estimated of crude oil claimed to be recoverable
under existing economic and operating conditions. Many oil producing
nations do not reveal their reservoirs engineering field data, and instead
provide unsubstantiated claims for their oil reserves. Iraq is the world 13th
largest oil producer in 2008, and has the world third largest proven
petroleum reserves after Saudi Arabia and Canada. According to recent
Geological surveys and seismic data Iraq has the largest oil reserves in
the world.34 Just a fraction of Iraq’s known fields are in development,
and Iraq may be one of the few places left where vast reserves, proven
and unknown , have barely been exploited. Iraq’s energy sector is heavily
based upon oil, with approximately 94% of its energy needs meet with
petroleum.
According to oil and gas journal, Iraq proven oil reserves are 115
billion barrels, (fig.no.3.1) although these statistics have not been revised
since 2001 and are largely based on 2D seismic data from nearly ago.
International Geologists and Consultants have estimated that unexplored
territory may certain vastly largely reserves.35 The Geologists and
Consultant have estimated that relatively unexplored territory in the western

79
and southern deserts may certain an estimated additional 45 to 100 billion
barrels (bbl) of recoverable oil. While international Iraqi estimates have
ranged into the hundreds of billions of barrels of additional oil, the seismic
data under review by a host of international firms seem to be pointing to
more conservative, but significant increases. A major challenge to Iraq’s
development of the oil sector is that reserves are not evenly divided across
sectarian-demographic lines. Most known hydro-carbon resources are
concentrated in the Shiite areas of the South (Map: 3.3) and the ethnically
Kurdish north, with few resources in control of the Sunni minority. Passage
of the proposed hydro-carbon law, which would provide a legal framework
for investment in the hydrocarbon sector, remains a main policy objective.
The majority of the known oil and gas reserves in Iraq come from a
belt that runs along the eastern edge of the country. Iraq has 9 fields that are
considered “Super Giants” (over 5 billion barrels) as well as 22 known
“Giant field” (over 1 billion barrels). According to independent consults,
the cluster of Supergiant fields of south-eastern Iraq forms the largest
known concentration of such fields in the world and accounts for 70 to 80
percent of the country’s proven oil reserves. An estimated 20 percent of oil
reserves are in the north of Iraq, near Kirkuk, Mosul and Khanaqin. Control
over rights to reserves is a source of controversy between the ethnic Kurds
and other groups in the area.
80
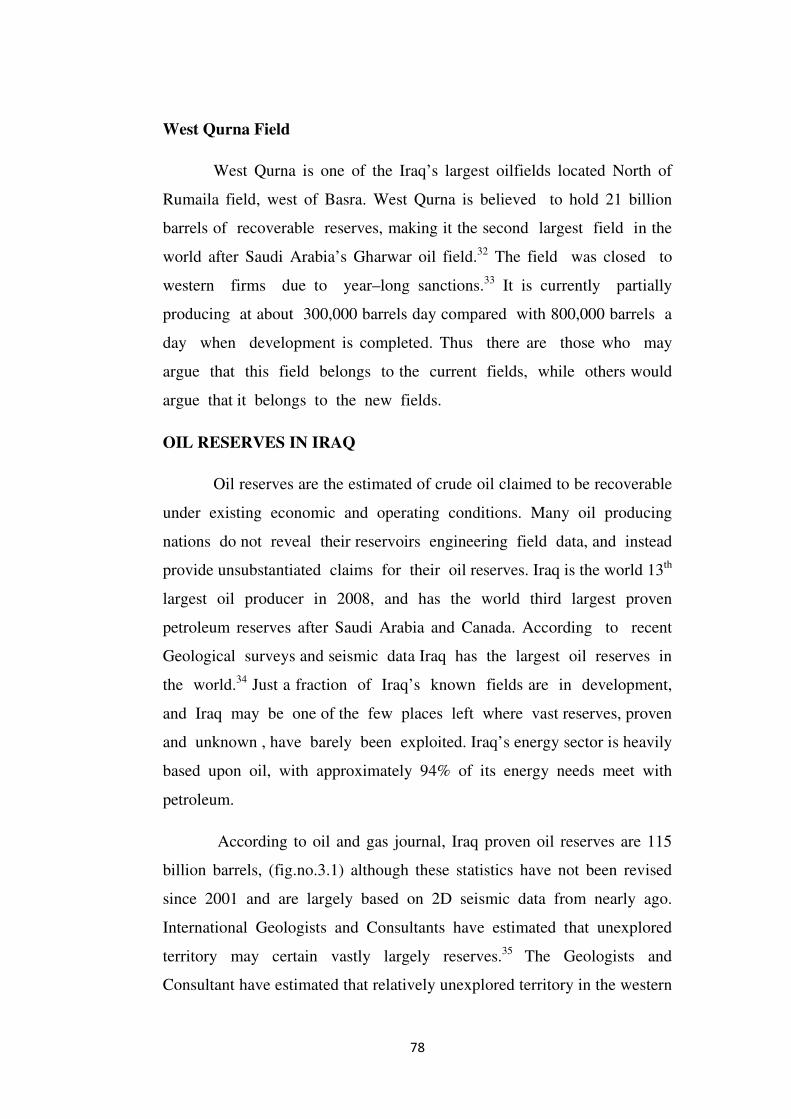
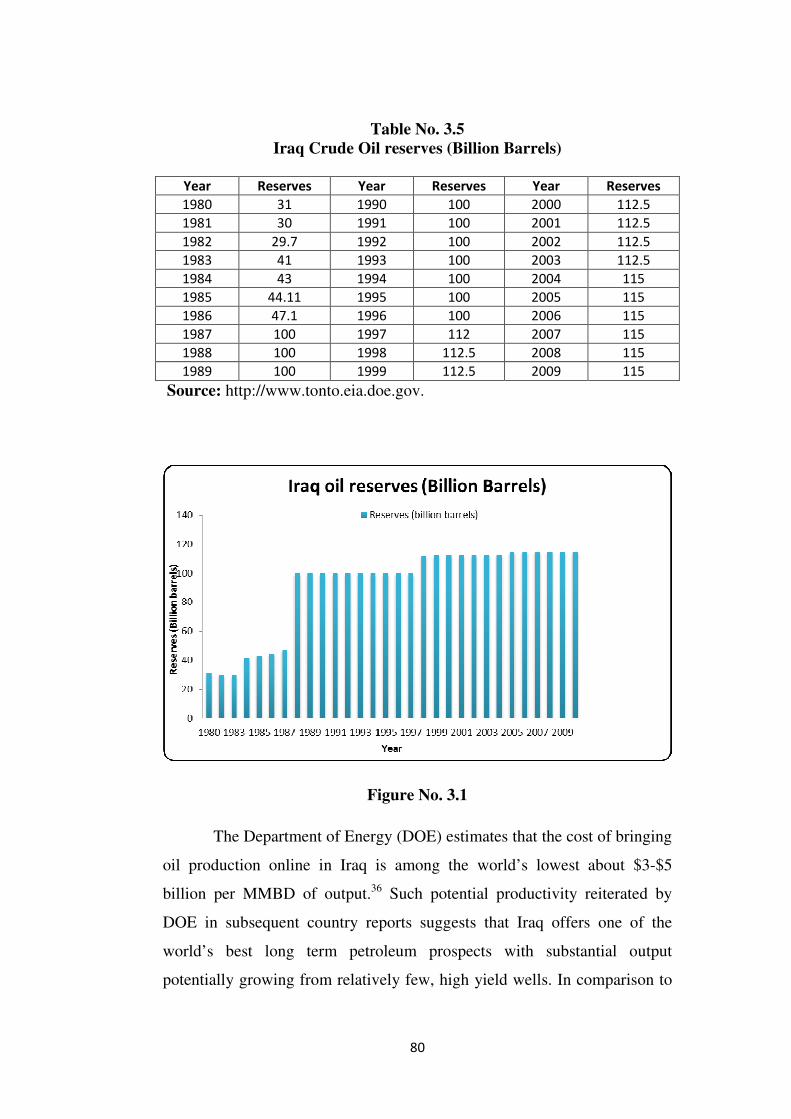
Table No. 3.5 Iraq Crude Oil reserves (Billion Barrels)
Year Reserves Year Reserves Year Reserves
1980 31 1990 100 2000 112.5
1981 30 1991 100 2001 112.5
1982 29.7 1992 100 2002 112.5
1983 41 1993 100 2003 112.5
1984 43 1994 100 2004 115
1985 44.11 1995 100 2005 115
1986 47.1 1996 100 2006 115
1987 100 1997 112 2007 115
1988 100 1998 112.5 2008 115
1989 100 1999 112.5 2009 115
Source: http://www.tonto.eia.doe.gov.
Figure No. 3.1
The Department of Energy (DOE) estimates that the cost of bringing
oil production online in Iraq is among the world’s lowest about $3-$5
billion per MMBD of output.36 Such potential productivity reiterated by
DOE in subsequent country reports suggests that Iraq offers one of the
world’s best long term petroleum prospects with substantial output
potentially growing from relatively few, high yield wells. In comparison to
81
a mature oil producing province such as United State of America, where
521,000 wells produce almost 5.8 MMBD37, Iraqi output comes from only
1,600 wells potentially able to produce almost 3 MMBD. The comparison
(U.S. wells average about 10 billion barrel per day, while Iraqi wells can
average several thousand) points up the profile nature of Iraq’s
hydrocarbon-bearing geology, and points towards easily realized
production increases with the application of current reservoir
management techniques the drilling of additional wells, and infrastructure
improvements.
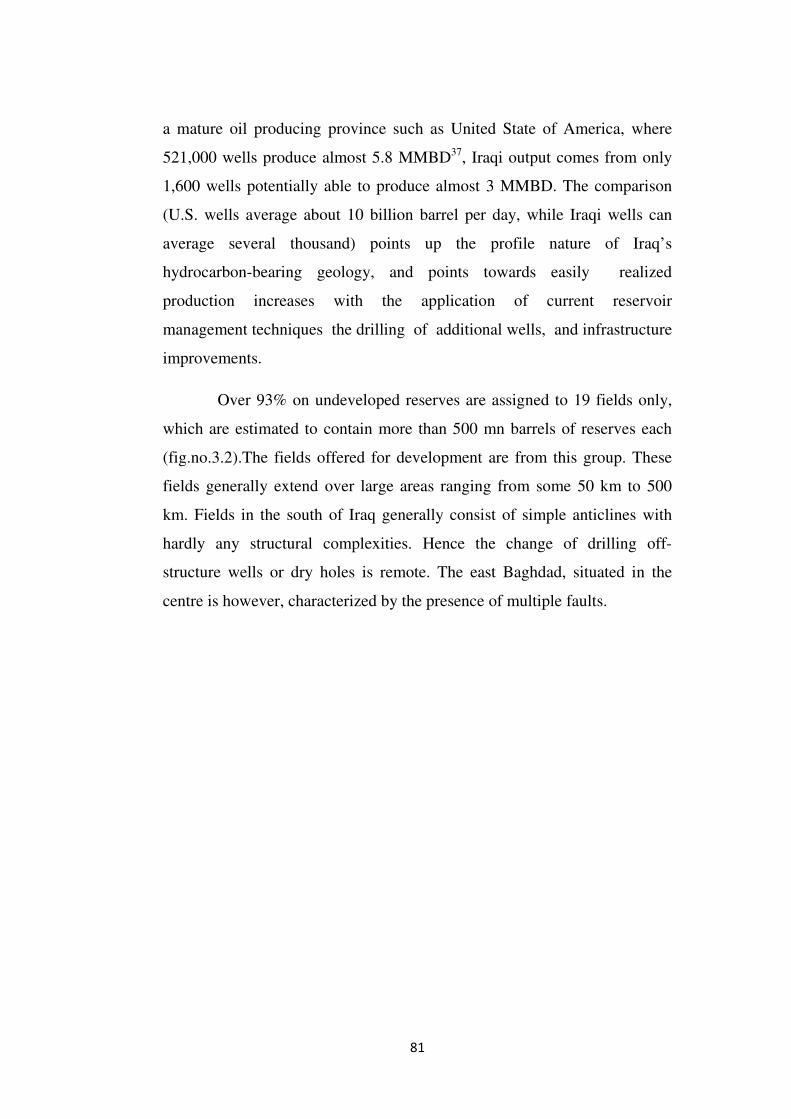
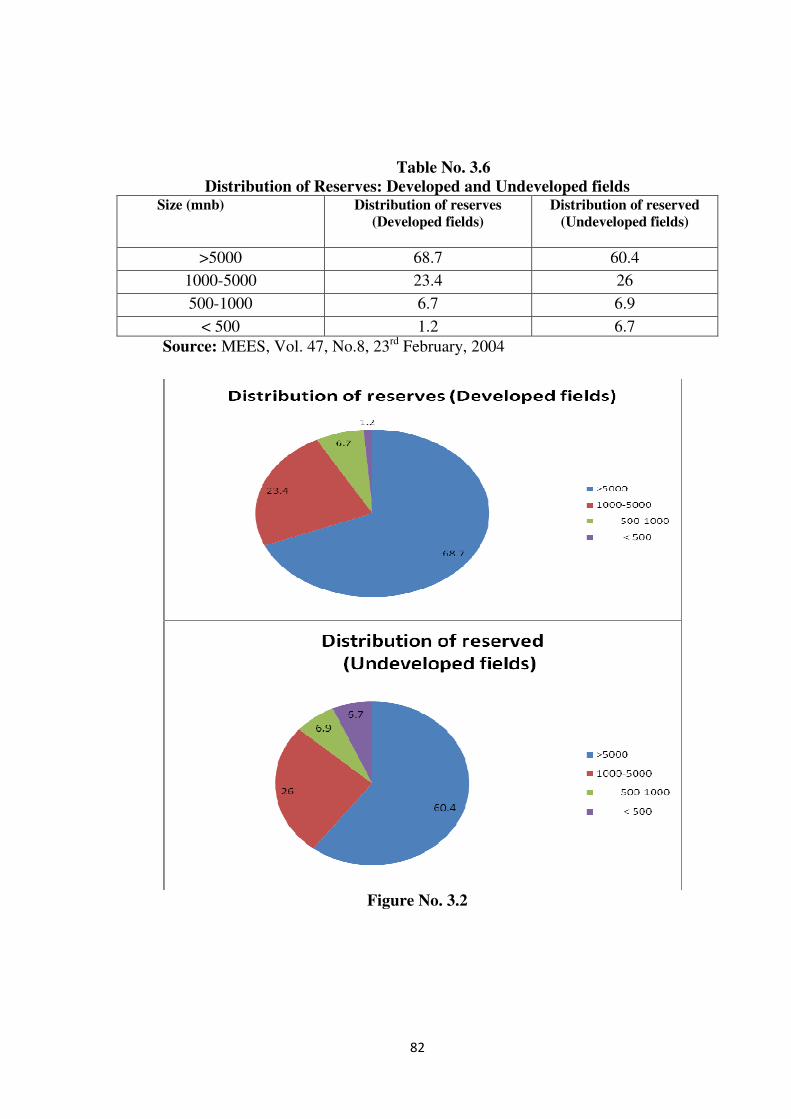
Over 93% on undeveloped reserves are assigned to 19 fields only,
which are estimated to contain more than 500 mn barrels of reserves each
(fig.no.3.2).The fields offered for development are from this group. These
fields generally extend over large areas ranging from some 50 km to 500
km. Fields in the south of Iraq generally consist of simple anticlines with
hardly any structural complexities. Hence the change of drilling off-
structure wells or dry holes is remote. The east Baghdad, situated in the
centre is however, characterized by the presence of multiple faults.
82
Table No. 3.6
Distribution of Reserves: Developed and Undeveloped fields Size (mnb) Distribution of reserves
(Developed fields) Distribution of reserved
(Undeveloped fields)
>5000 68.7 60.4
1000-5000 23.4 26
500-1000 6.7 6.9
< 500 1.2 6.7
Source: MEES, Vol. 47, No.8, 23rd February, 2004
Figure No. 3.2

83
IRAQ OIL PRODUCTION
Oil exploration and production in Iraq began in the 1920s under
the terms of a wide-ranging concession granted to a consortium of
international oil companies known as the Turkish Petroleum Company
and later as the Iraq Petroleum Company. The nationalization of Iraq’s oil
resources and production was complete by 1975. From 1975 to 2003, Iraq’s
oil production and export operations were entirely state operated. However,
from the early 1980s until the toppling of Saddam Hussein’s government
in 2003, the country’s hydrocarbon infrastructure suffered from the
negative effects of war, international sanctions, a lack of investment and
technology and, in some cases mismanagement.38
In 2008, Iraq’s crude oil production under control of the regional
state owned oil companies averaged 2.4 million barrels per day (MMBD),
up from its 2007 production of 2.1 MMBD. However, this still below its
pre- war production capacity level 2.8 MMBD in 2003. About two-thirds of
production comes from the southern field, with the remainder from
north-central field near Kirkuk. At present, the majority of Iraq oil
production comes from just three giant fields: North and South Rumaila and
Kirkuk (Map: 3.4). The Rumaila fields operated by Iraqi Parastatal south
oil company, along with a ring of nearly a dozen smaller fields ,including
Subha, Luhais, West Qurna and Az- Zubair, have producing 1.5 to 1.9
MMBD, close to pre-war levels. Controversially, average production at
Kirkuk and the northern fields of around 200,000 barrels per day (bbl /d) is
only fraction of the pre-war peak of around 680,000 bbl/d, due to
reservoirs damage from gas and water injection as well as shut in export
routes. In May 2007, The Iraqi Minister of oil (MoO) reported that total
production from the northern fields was 206,000 bbl /d , all of which
went to domestic compensation.
84
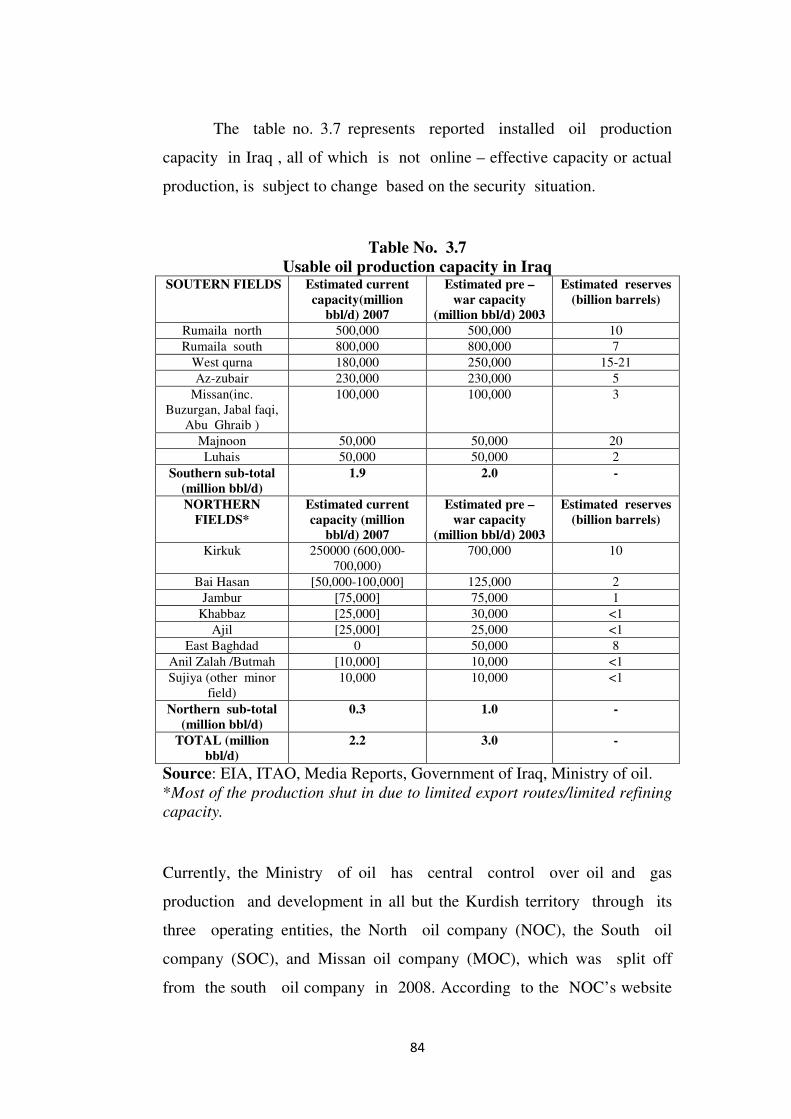
The table no. 3.7 represents reported installed oil production
capacity in Iraq , all of which is not online – effective capacity or actual
production, is subject to change based on the security situation.
Table No. 3.7
Usable oil production capacity in Iraq SOUTERN FIELDS Estimated current
capacity(million bbl/d) 2007
Estimated pre –war capacity
(million bbl/d) 2003
Estimated reserves (billion barrels)
Rumaila north 500,000 500,000 10
Rumaila south 800,000 800,000 7
West qurna 180,000 250,000 15-21
Az-zubair 230,000 230,000 5
Missan(inc. Buzurgan, Jabal faqi,
Abu Ghraib )
100,000 100,000 3
Majnoon 50,000 50,000 20
Luhais 50,000 50,000 2
Southern sub-total (million bbl/d)
1.9 2.0 -
NORTHERN FIELDS*
Estimated current capacity (million
bbl/d) 2007
Estimated pre –war capacity
(million bbl/d) 2003
Estimated reserves (billion barrels)
Kirkuk 250000 (600,000-700,000)
700,000 10
Bai Hasan [50,000-100,000] 125,000 2
Jambur [75,000] 75,000 1
Khabbaz [25,000] 30,000 <1
Ajil [25,000] 25,000 <1
East Baghdad 0 50,000 8
Anil Zalah /Butmah [10,000] 10,000 <1
Sujiya (other minor field)
10,000 10,000 <1
Northern sub-total (million bbl/d)
0.3 1.0 -
TOTAL (million bbl/d)
2.2 3.0 -
Source: EIA, ITAO, Media Reports, Government of Iraq, Ministry of oil. *Most of the production shut in due to limited export routes/limited refining
capacity.
Currently, the Ministry of oil has central control over oil and gas
production and development in all but the Kurdish territory through its
three operating entities, the North oil company (NOC), the South oil
company (SOC), and Missan oil company (MOC), which was split off
from the south oil company in 2008. According to the NOC’s website

85
,their concession and jurisdiction extends from the Turkish borders in
the north to 32.5 degrees latitudes (about 100 miles south of Baghdad),
and from Iranian borders in the east to Syrian and Jordanian borders in
the west. The company’s geographical operation area spans the following
governorates: Tamim (Kirkuk), Nineveh Irbil, Baghdad, Diyala and part of
Babil to Hilla and Waist to Kut. The remainder falls under the
jurisdiction of the SOC and MOC, and through smaller in geographical
size, includes the majority of proven reserves. MOC’s oil fields hold an
estimated 30 billion barrels of reserves. They include Amara, Halfaya,
Huwaiza, Noor, Rifaee, Dijaila, Kumit and East Rafidain.
Iraq resource base is considered the second largest in the world,
second to the Saudi Arabia, and its oil export policy has been a critical
element in setting international oil supply and pricing for over 30 years.
Iraq has generated virtually all of its export earnings through its production
of crude oil. Over the many years of production, the trend line has moved in
one direction and then another. For purposes of placing production in the
immediate pre-Gulf War period (table no. 3.8) in context, it should be noted
that informed authorities report production, essentially by IPC in 1954 to
have run at a rate of approximately 30 million tons annually, or 600,000
bbl/d.39 In 1955, that number increase to 32.7 million tons for the year, or
650,000 bbl/d.40 The 1956 Suez crisis and Arab-Israel war affected
production negatively for both that year and the next. The year 1956 saw
production of 30.6 million tons, or the equivalent of basically 600,000+
bbl/d.41 and 1957 registered a serious decline to 21.36 million tons or
427,200 bbl/d.42 by 1958 the upward production trend had resumed, with
34.93 million tons, or 698,000 bbl/d produced.43 In 1959 there were 40.9
million tons of crude production by IPC in Iraq, the equivalent of 818,000
bbl/d 44 , obviously, improved recovery technology, increased production
activity, and the sense within IPC that pressure on various fronts was
building from the Iraqi government resulted in jumping in 1960 to 47.5

86
million tons or 950,000 bbl/d.45 with the adaptation of law no. 80 in 1961,
production over the preceding year increased only marginally to about 49
million tons, or 980,000 bbl/d, with the same being the case for 1962.46 If
one compares the 980,000 bbl/d production rate in the immediate wake of
the 1961 nationalization with the production rate generated by the activities
of IPC and Iraq National Oil Company (INOC) and its international oil
company collaborators at the time of the adoption of law no.69, the second
and more comprehensive nationalization measure adopted by Iraq 1971-
1972, it is clear that the initial move toward nationalization spurred
production considerably. Information indicates that the 1971, rate of
production was 83.7 million tons for the year, or basically 1.6 million
barrels per day (MMBD).47 In 1972 production at the 1.5 MMBD rate.48
And by 1979, Iraqi crude oil production had increased to a level of 3.5
MMBD.49

87
Table No. 3.8 Iraq Crude Oil Production (Pre-Gulf War period)
Year Production
(mmbd) Year
Production
(mmbd) Year
Production
(mmbd) Year
Production
(mmbd) Year
Production
(mmbd)
1928 0.022 1964 1.26 1971 1.69 1978 2.56 1985 1.43
1940 0.055 1965 1.32 1972 1.47 1979 3.48 1986 1.69
1950 0.14 1966 1.39 1973 2.02 1980 2.51 1987 2.08
1960 0.97 1967 1.23 1974 1.97 1981 1.00 1988 2.69
1961 1.01 1968 1.50 1975 2.26 1982 1.01 1989 2.90
1962 1.01 1969 1.52 1976 2.42 1983 1.01 1990 2.04
1963 1.16 1970 1.55 1977 2.32 1984 1.21 ----- -----
Source: EIA, U.S energy information Administration and also available at
http://www.eia.doe.gov/aer/txt/ptb1105.htm.
Figure No. 3.3
The Iraq-Iran war broke out in September 1980, and its impact
on crude oil production was far reaching which dropped to 2.51 MMBD in
1980.50 By 1981- 1983, production had dropped roughly 1.01 MMBD
(figure no.3.3), climbing again in 1985 to the vicinity of 1.43 MMBD,
88
and by 1988 to approximately 2.69 MMBD . Following the conclusion of
the Iraq- Iran war in 1988 and up until the time of Saddam Hussein’s
invasion of Kuwait in the summer of 1990, Iraqi production of crude oil
had climbed from 2.90 MMBD in 1989 to earlier 1979 high level 3.48
MMBD by 1990.The invasion of Kuwait and the international community’s
response had serious repercussions for Iraqi crude oil production.
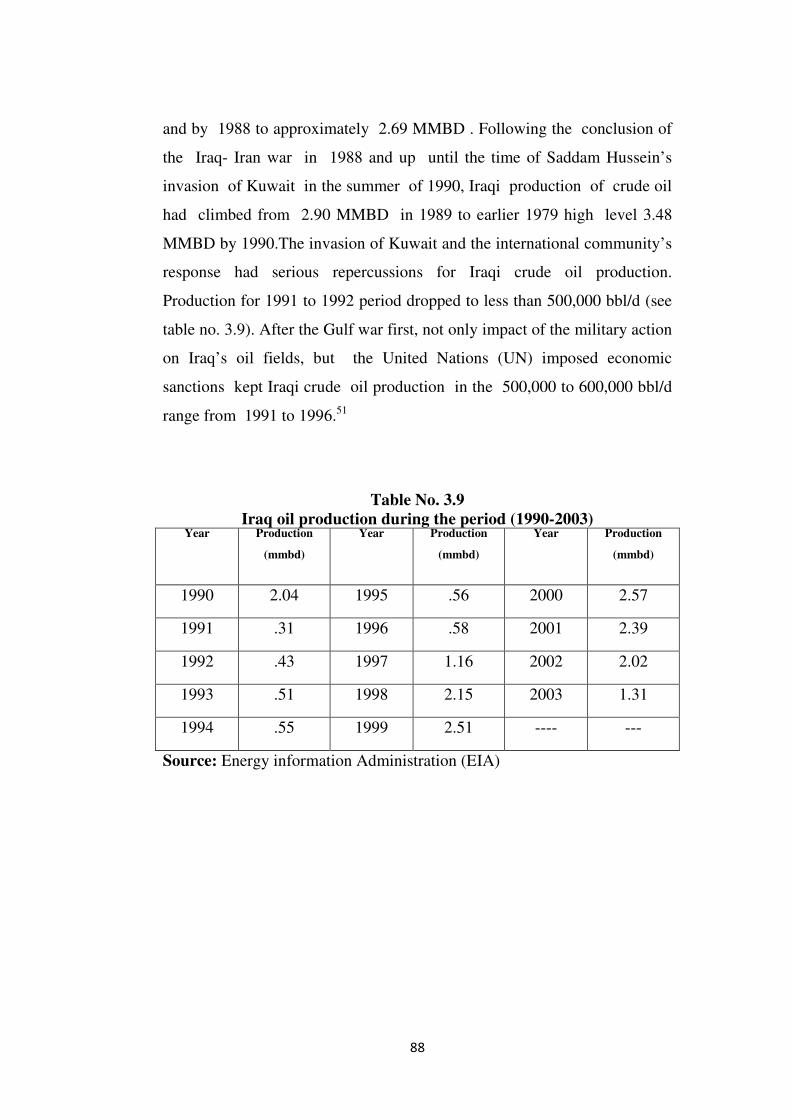
Production for 1991 to 1992 period dropped to less than 500,000 bbl/d (see
table no. 3.9). After the Gulf war first, not only impact of the military action
on Iraq’s oil fields, but the United Nations (UN) imposed economic
sanctions kept Iraqi crude oil production in the 500,000 to 600,000 bbl/d
range from 1991 to 1996.51
Table No. 3.9 Iraq oil production during the period (1990-2003)
Year Production
(mmbd)
Year Production
(mmbd)
Year Production
(mmbd)
1990 2.04 1995 .56 2000 2.57
1991 .31 1996 .58 2001 2.39
1992 .43 1997 1.16 2002 2.02
1993 .51 1998 2.15 2003 1.31
1994 .55 1999 2.51 ---- ---
Source: Energy information Administration (EIA)
89
Figure No. 3.4
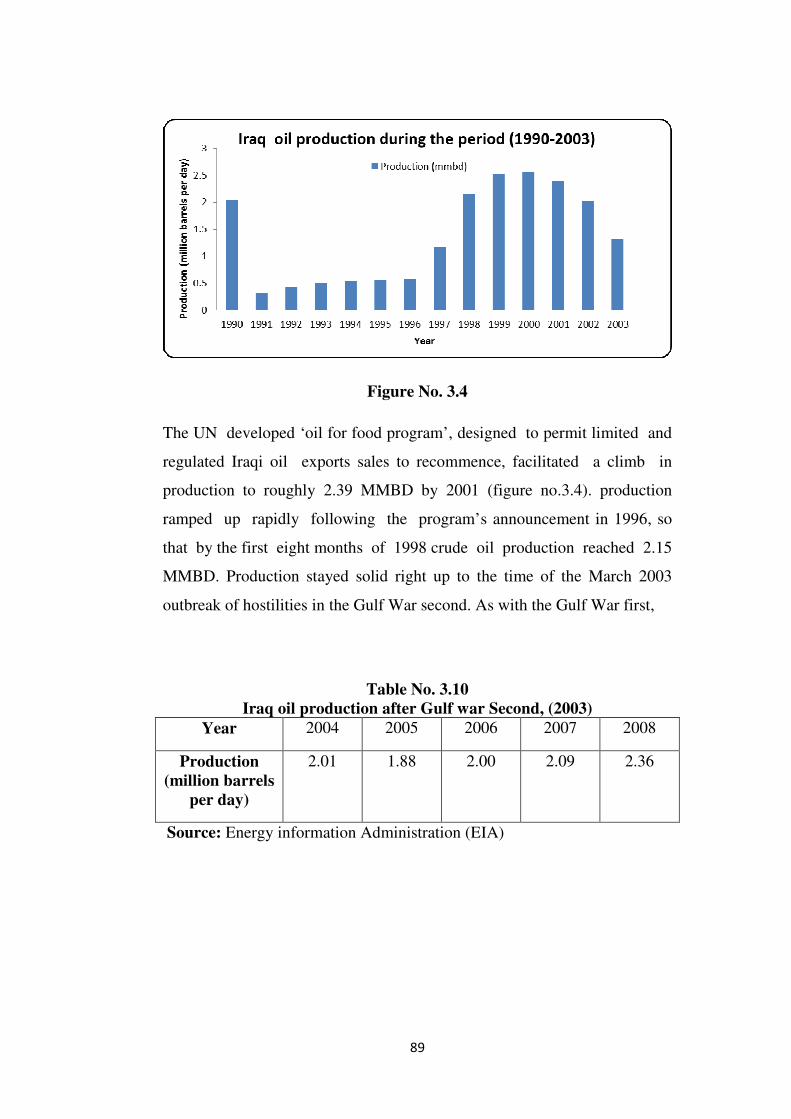
The UN developed ‘oil for food program’, designed to permit limited and
regulated Iraqi oil exports sales to recommence, facilitated a climb in
production to roughly 2.39 MMBD by 2001 (figure no.3.4). production
ramped up rapidly following the program’s announcement in 1996, so
that by the first eight months of 1998 crude oil production reached 2.15
MMBD. Production stayed solid right up to the time of the March 2003
outbreak of hostilities in the Gulf War second. As with the Gulf War first,
Table No. 3.10 Iraq oil production after Gulf war Second, (2003)
Year 2004 2005 2006 2007 2008
Production (million barrels
per day)
2.01 1.88 2.00 2.09 2.36
Source: Energy information Administration (EIA)

90
Figure No. 3.5
the effect of the second Gulf War on the oil fields were serious. These
have been further compounded by the continuing sectarian and ethnic
turmoil besting the nation. Reports of Iraq crude oil production from 2006
indicate that it came in at 2.00 MMBD (figure no.3.5) more than half a
million barrels per day short of pre-war production. In 2007 estimates
suggested a production rate basically in the same vicinity. However, U.S
Department of state reports from the Iraq transition office suggested
that production actually ended the year at 2.3 to 2.4MMBD.52 Interestingly,
the historical pattern suggests that domestic Iraqi consumption has
remained essentially steady at about 250,000 to 500,000 bbl/d, leaving
production amounts above that levels to be available for export to the
international market.53 And furthermore, of total crude oil production,
about two thirds has come from the southern oil field and one third
from the north. Indeed, it appears that in 2007, somewhere between 1.5
and 1.9 MMBD come from the north and south Rumaila field, in the
southern Iraq, and only about 200,000 bbl/d come from the Kirkuk field
in the country’s north. It has been suggested that, prior to Gulf War
second , as much 680,000 bbl/d was coming from the Kirkuk field.54
The drop-off in northern Iraq production can be somewhat attributed to

91
the number of pipeline and oil facility attacks in that area . However, in
a media report from early summer 2008, there were indications from
the Iraqi oil ministry that attacks in the area had been significantly
reduced , allowing production and consequent shipments by pipeline to
the world market terminals in Turkey to be increased to as 450,000
bbl/d.55
3.2 OIL RESOURCES OF OTHER GULF COUNTRIES
The world wide economy is built upon a petroleum foundation,
with hydrocarbon based energy resources forming the backbone of
worldwide transformation, transit and power generation. As such a serious
study of resources availability and security is a crucial component of
any forward looking economic or security analysis for individual
countries and the world at large.
West Asia has over half of the world proven oil reserves
(Map: 3.5), and remains the centre of gravity in the global oil market. It
is well established that West Asia oil production dominates worldwide
crude oil markets. What may less well known is that, according to
industry projections, this region will continue to grow in strategic
importance over the next several decades. There is no doubt that the
importance of the region is poised to grow. Major oil reserves and producer
country are Saudi Arabia, Iran, Iraq, Kuwait, United Arab Emirates (UAE),
Oman, Qatar, and Bahrain. Saudi Arabia is the world largest oil reserves,
producer and exporter.
92
Table No. 3.11 World oil reserves by Regions (2007)
Regions % of Reserves
Middle East 56%
North America 16%
Africa 9%
Central and South America 8%
Eurasia 7%
Asia& Oceania 3%
Europe 1%
World Total 100%
Source: US Energy information Administration, 2007
Figure No. 3.6
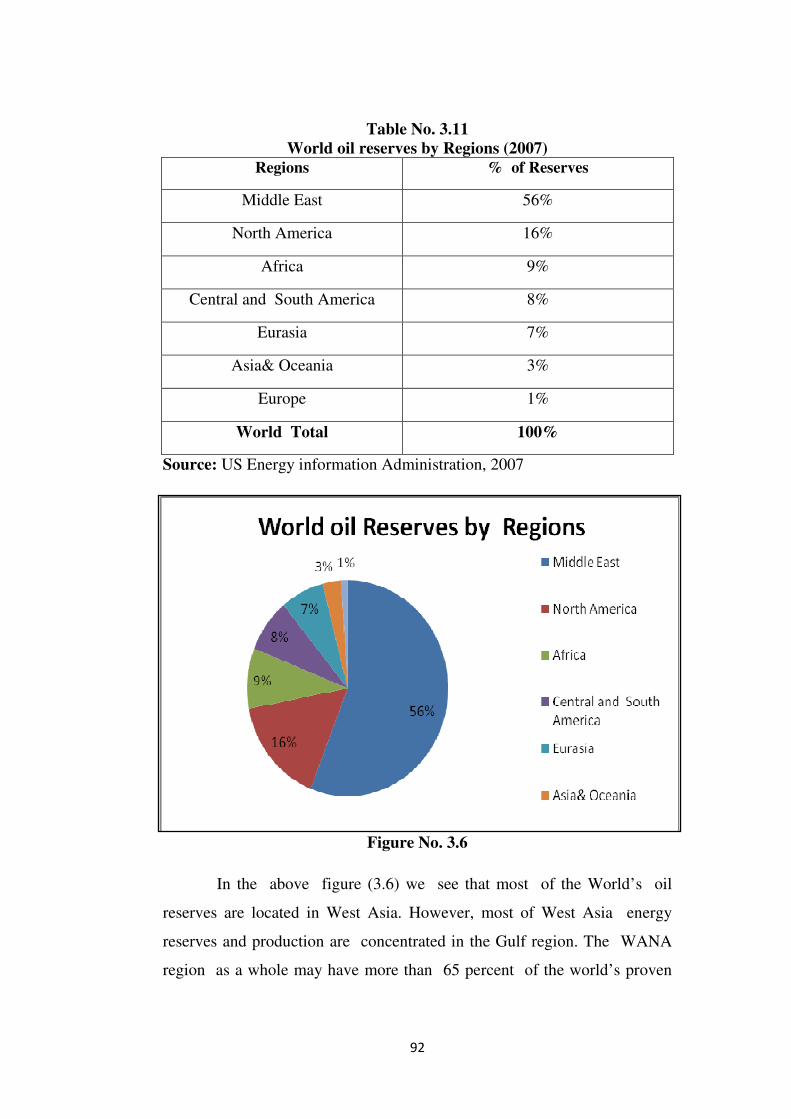
In the above figure (3.6) we see that most of the World’s oil
reserves are located in West Asia. However, most of West Asia energy
reserves and production are concentrated in the Gulf region. The WANA
region as a whole may have more than 65 percent of the world’s proven

93
oil reserves and 35 percent of its gas reserves, but over 94 percent of
these oil reserves are in the Gulf.
In addition, Gulf countries also normally maintain nearly a 90
percent share of the world’s surplus oil production capacity, although the
Iraq war has reduced excess world oil production capacity all in the Gulf
region.
In 2002, eight Gulf countries (Bahrain, Iran, Iraq, Kuwait, Oman,
Qatar,Saudi Arabia, and the United arab Emirates) produced about 25
percent of the of the world’s oil, and Gulf countries had estimated net oil
exports of 15.5 MMBD. Saudi Arabia exported the most, with an estimated
7.0 MMBD (45 percent of the total). Iran had estimated net exports of
around 2.3 MMBD (15 percent), followed by the United Arab emirates (2.1
MMBD- 13 percent), Kuwait (1 MMBD- 5 percent), and Bahrain (0.01
MMBD- 0.1 percent). Gross oil imports to the Organization of Economic
Cooperation and Development (OECD) countries from Persian Gulf
countries averaged about 10.6 MMBD or some 27 percent of the OECD’s
total gross oil imports.
Bahrain
Bahrain is composed of a group of small islands in the energy
rich persian Gulf. The country economy is highly dependent on oil sector,
with oil revenues amounting to about two-thirds of total goverment
revenues. While Bahrain is a net exporter of oil, it is the smallest West
Asian oil producer by volume, and unlike other Gulf states, Bahrain exports
refined petroleum product rather than crude oil. Domestically, the vast
majority of Bahrain total energy consumption comes from natural gas, with
the remainder supplied by oil. Hydrocarbons also provide the foundation
for the Bahrain’s two major industries refining and aluminium smelting.
The country only refinery, Sitra, is located the south of Manama and has a
capacity of 248,900 bbl/d. The Sitra refinery was built in 1936, and has

94
since undergone several modernizations. Bahrain is a net exporter of oil,
Bahrain exports much of oil in the form of refined petroleum products
rather than crude oil. Bahrain’s proven oil reserves stood at 125 million
barrels as of January 200856, all of which are located in the Awali field
(Map: 3.6). In addition to what is produced in its territory, Bahrain and
Saudi Arabia share the 300,000 barrels per day (bbl/d) of oil production
from the offshore Abu Saafa field.
Table No. 3.12 Bahrain Crude oil proved Reserves and Production
Year Reserves(Billi
on barrels) Production (1,000 b/d)
Year Reserves(Billi
on barrels) Production (1,000 b/d)
1980 0.24 48.2 1995 0.21 145.4
1981 0.225 45.2 1996 0.21 174.3
1982 0.209 43.9 1997 0.21 182.4
1983 0.197 41.4 1998 0.21 183.1
1984 0.185 41.2 1999 0.16 176.4
1985 0.17 41.8 2000 0.14811 180.3
1986 0.155 42.0 2001 0.14811 182.4
1987 0.14 42.3 2002 0.12456 187.3
1988 0.14055 43.0 2003 0.12456 188.6
1989 0.126 107.7 2004 0.12456 187.1
1990 0.11171 108.3 2005 0.12456 186.5
1991 0.09746 107.7 2006 0.12456 183.3
1992 0.08349 123.5 2007 0.12456 184.7
1993 0.06958 141.2 2008 0.12456 184.5
1994 0.06958 137.9 ------ ------- -------
Source: EIA, OPEC Annual Statistical Bulletin 1998, 2005 &2008.

95
Figure No. 3.7
In 2007, Bahrain produced an estimated 49,000 bbl/d of total oil
liquid, of which 35,000 bbl/d was crude oil, 11,000 bbl/d was natural gas
liquids, and 3,000 bbl/d was refinery gain, this amount excludes joint
production Abu Saafa field, of which Bahrain share is about 150,000
bbl/d, during 2007, Bahrain consumed an estimated 35,000 bbl/d of oil.57
Kuwait
Kuwait is another Gulf state that plays a critical role in any
projection of the world’s future oil supplies. Kuwait economy is heavily
dependent on oil export revenue which account for roughly 90 percent of
total export earnings. Kuwait channels around 10 percent of its oil revenue
in the “Future Generation Fund” for the day when oil income runs out.58

96
According to oil and gas journal, as of January 2010 Kuwait
territorial boundaries contained an estimated 101.5 billion barrels (bbl) of
proven oil reserves, roughly 8 percent of the world total.59 Most of the
Kuwait’s oil reserves are located south of Kuwait city (Map: 3.7). The 70
billion barrels Greater Burgan area, which comprises three structures:
Burgan, Magwa, and Ahmadi fields, is widely considered the world’s
second largest oil field, surpassed only by Saudi Arabia’s Ghawar field.
Table No. 3.13 Kuwait Crude oil proved Reserves and Production
Year Reserves(Billion barrels)
Production (1,000 b/d)
Year Reserves(Billion barrels)
Production (1,000 b/d)
1980 68.53 1663.7 1995 96.5 2006.6
1981 67.93 1129.7 1996 96.5 2005.6
1982 67.73 824.3 1997 96.5 2007.1
1983 67.15 1054.1 1998 96.5 2051.5
1984 66.7475 1163 1999 96.5 1872.7
1985 92.71 936.3 2000 96.5 1996.1
1986 92.464 1174.3 2001 96.5 1947
1987 94.5221 971.6 2002 96.5 1745.9
1988 95.525 1190.1 2003 96.5 2107.6
1989 94.525 1277.5 2004 99 2288.7
1990 97.125 858.6 2005 101.5 2573.4
1991 97.025 185.3 2006 104 2664.5
1992 96.5 1057.2 2007 101.5 2574.5
1993 96.5 1881.8 2008 104 2676.0
1994 96.5 2006.6 ----- ------ -----
Source: EIA, OPEC Annual Statistical Bulletin 1998, 2005 &2008.

97
Figure No. 3.8
Producing oil since the 1950’s, Greater Burgan generally producers
lighter crudes with API’s in the 280-360 range and has a production
capacity of 1.6 million bbl/d. The south Magwa field discovered in 1984
is estimated to hold at least 25 billion bbl of light crude. Other fields
surrounding the Grater Burgan area include Umm Gudair, Minagish and
Abdaliya. Umm Gudair and Minagish produce heavier crude oil, with
gravities in the 220-260 API range and have a combined production
capacity of 200,000 bbl per day. In January 2003, water injection began at
Minagish to enhance oil recovery and offset natural gas declines in
production. Table no. 3.13 shows the Kuwait reserves and production of
crude oil.
Iran
According to oil and gas journal as of January 2010, Iran has an
estimated 137.6 billion barrels of proven oil reserves, or roughly 10
percent of the world’s total reserves. Iran has 40 producing fields (27
onshore and 13 offshore). The majority of crude oil reserves located in
the south western Khuzestan region near the Iraqi border (Map: 3.8).

98
Iran crude oil generally medium in sulphur content and in the 280-350 API
range. In 2008, Iran exported about 2.4 million bbl/d of oil, primarily to
Asia and Organization for Economic Co-operation and Development
(OCED) Europe countries making it the fourth largest exporter in the
world .
Table No. 3.14 Iran Crude oil Reserves and production
Year Reserves(Billion barrels)
Production (1,000 b/d)
Year Reserves(Billion barrels)
Production (1,000 b/d)
1980 58 1467.4 1995 89.25 3595
1981 57.5 1262.8 1996 88.2 3596
1982 57 2420.6 1997 93 3603.4
1983 55.308 2441.7 1998 93 3714
1984 51 2032.4 1999 89.7 3439
1985 48.5 2192.3 2000 89.7 3661.3
1986 47.876 2037.1 2001 89.7 3572
1987 48.8 2297.6 2002 89.7 3248
1988 92.85 2478.5 2003 89.7 3741.6
1989 92.85 2814.1 2004 125.8 3834.2
1990 92.86 3135.3 2005 125.8 4091.5
1991 92.85 3406.8 2006 132.46 4072.6
1992 92.86 3431.6 2007 136.27 4030.7
1993 92.86 3425.2 2008 138.4 4055.7
1994 92.86 3596 ----- ------- ------
Source: EIA, OPEC Annual Statistical Bulletin 1998, 2005 &2008.

99
Figure No. 3.9
Production
In 2008 Iran produced approximately 4.2 million barrels per day
(bbl/d) of the total liquids of which roughly 3.9 million bbl/d was crude
oil, equal to about 5 percent of global production. For the most of 2009
it is estimated that Iran’s crude oil production was approximately 3.8
million bbl/d almost 500,000 bbl/d above Iran’s estimated 3.3 million
bbl/d OPEC quota. Iran’s 2009 crude oil production capacity estimated to
be 3.9 million bbl/d. Iran produce over 5 million bbl/d of oil in 1978,
but since the 1979 revolution a combination of war, limited investment,
sanctions and high rate of natural decline in Iran’s mature oil fields
have prevented a return to such production levels. Iran’s fields have a
natural annual decline rate estimated at 8 percent onshore and 11
percent offshore, with recovery rates at 20-25 percent. An estimated 4,
00,000-7, 00,000 bbl/d crude oil production is lost annually due to decline
nature of fields.60
100
Oman
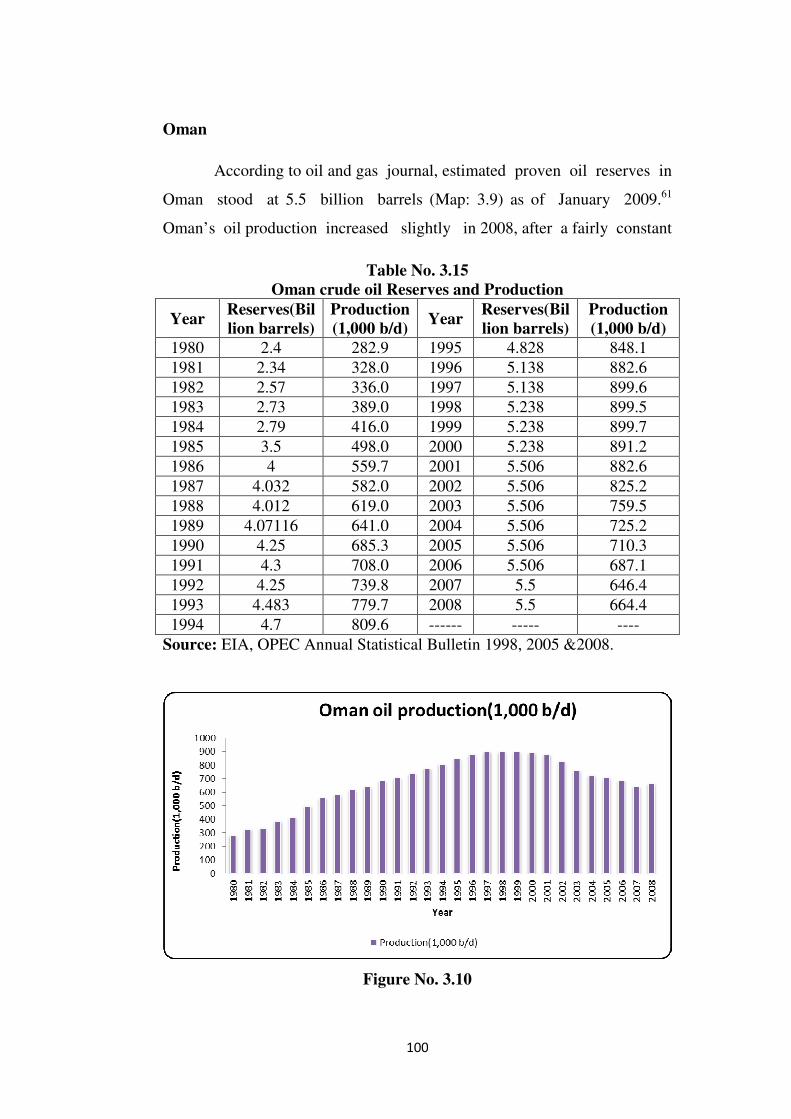
According to oil and gas journal, estimated proven oil reserves in
Oman stood at 5.5 billion barrels (Map: 3.9) as of January 2009.61
Oman’s oil production increased slightly in 2008, after a fairly constant
Table No. 3.15 Oman crude oil Reserves and Production
Year Reserves(Billion barrels)
Production (1,000 b/d)
Year Reserves(Billion barrels)
Production (1,000 b/d)
1980 2.4 282.9 1995 4.828 848.1
1981 2.34 328.0 1996 5.138 882.6
1982 2.57 336.0 1997 5.138 899.6
1983 2.73 389.0 1998 5.238 899.5
1984 2.79 416.0 1999 5.238 899.7
1985 3.5 498.0 2000 5.238 891.2
1986 4 559.7 2001 5.506 882.6
1987 4.032 582.0 2002 5.506 825.2
1988 4.012 619.0 2003 5.506 759.5
1989 4.07116 641.0 2004 5.506 725.2
1990 4.25 685.3 2005 5.506 710.3
1991 4.3 708.0 2006 5.506 687.1
1992 4.25 739.8 2007 5.5 646.4
1993 4.483 779.7 2008 5.5 664.4
1994 4.7 809.6 ------ ----- ----
Source: EIA, OPEC Annual Statistical Bulletin 1998, 2005 &2008.
Figure No. 3.10

101
state of decline from the total liquid peak of 970,000 barrels per day
(bbl/d) in 2000. Oman produces an estimated 760,000(bbl/d) of total oil
liquid in 2008, about 6 percent more than 2007 levels. Of 2008’s output
roughly 669,000 bbl/d was crude oil, 88,000 bbl/d was lease condensate,
and the remainder consider of natural gas plant liquids. Though Oman
is experiencing success with its Enhanced Oil Recovery (EOR) projects,
according to Energy information Administration (EIA) forecasts Omani
oil production to remain near 2008 levels through 2010, as increased
production from EOR projects roughly matches declining producing
maturing field. EOR projects are the primary reason for Oman’s production
increase in 2008. Currently underway, the Mukhaizna EOR project,
operated by the occidental Petroleum and UAE’s Mubadala, began
steam-flood operation in 2008. The EOR project has proven successful in
raising Mukhaizna production from10,000 bbl/d in 2006 to approximately
50,000 bbl/d in 2008.
Qatar
Qatari liquids are generally lighter and sweeter than typical West
Asian output. Gravity ranges from 300 API for Al-shaheen to 580 API for
north field condensate and sulphur content ranges from 2.15 to 0.22%
respectively.62 Qatar two important oil fields, one is Al-Shaheen oil field
which lies to the north-east of Qatar near the border with Iran in the Persian
Gulf63 (Map: 3.10). In 2006 Al-Shaheen’s production of 240,000 bbl/d
accounted for a significant portion of Qatar total production of 815,000
bbl/d. A development plan reached between Maersk oil Qatar (MOQ) and
Qatar petroleum (QP) in 2005 calling for an increase in field production to
525,000 bbl/d by late 2009.

102
Table No. 3.16 Qatar oil Reserves and Production
Year Reserves(Billion barrels)
Production(1,000 b/d)
Year Reserves(Billion barrels)
Production (1,000 b/d)
1980 3.76 471.1 1995 3.7 389.8
1981 3.585 415.2 1996 3.7 393.1
1982 3.434 332.0 1997 3.7 405.0
1983 3.425 269.0 1998 3.7 618.1
1984 3.33 325.3 1999 3.7 608.5
1985 3.35 289.3 2000 3.7 648.2
1986 3.3 305.7 2001 13.157 632.9
1987 3.154 218.9 2002 15.207 568.9
1988 3.15 228.0 2003 15.207 676.0
1989 3.15 320.2 2004 15.207 755.3
1990 4.5 405.6 2005 15.207 765.9
1991 4.5 391.2 2006 15.207 802.9
1992 3.729 423.2 2007 15.207 845.3
1993 3.729 390.3 2008 15.207 842.8
1994 3.729 378.7 ------ ----- ----
Source: EIA, OPEC Annual Statistical Bulletin 1999, 2005 &2008

103
Figure No. 3.11
This increase expected to account for the majority of growth in
Qatar’s petroleum output this time.64Another oil field of Qatar is Dukhan, it
is large petroleum producing field extending over an area of approximately
80 km in Qatar. The first oil drilled in 1939 and first export of petroleum
from Dukhan went out in 1949. The field produces up to 335,000 barrels of
crude oil per day. Table no. 3.16 indicates the Qatar’s oil reserves and
production.
Saudi Arabia
Saudi Arabia is one of the largest and most powerful states in the
Gulf.65 It is biggest oil producer and exporter in the World.66 According to
the oil and gas Journal, Saudi Arabia contain approximately 264 billion
barrels of proven oil reserves (including 2.5 billion barrels in the Saudi-
Kuwaiti shared “Neutral Zone”67), It is also claimed that it had a total of
700 billion barrels of “discovered reserves” and 200 billion barrels of
“undiscovered reserves” and projected that its discovered volume of oil
initially in place would reach 700 billion barrels by 2025. Although Saudi
Arabia has around 100 major oil and gas fields (and more than 1500 wells),
(Map: 3.11), over half of its reserves are contain in only eight fields,

104
including the giant 1,260 square mile Ghawar field. It is the world’s largest
oil field with estimated remaining reserves 70 billion barrels. The Ghawar
field (onshore) alone has more proven oil reserves than all but six other
countries. Another fields are Safaniya (offshore), It is third largest oil field
in term of production in 2007, but production declined in 2008 with the
drop in global oil demand, and the other oil fields are Khurais(onshore),
Qatif (onshore), Shaybah (onshore), Zuluf (offshore), Abqaiq (onshore).
Production
Saudi Arabia maintains the world’s largest crude oil production
capacity, estimated by U.S. Energy Information Administration (EIA) to be
around 11 million barrels per day, at midyear of 2009. In 2005, Saudi
Arabia Ministry of Petroleum and mineral resources announced the details
of a plan to increase this capacity up to12.5 million bbl/d by 2009. Although
the oil price collapse the end of 2008 led to delays in net capacity additions.
For 2008, EIA estimates that Saudi Arabia produced on average 10.8
million bbl/d of total oil, comprising crude oil, lease condensate, natural gas
liquids and other liquids (including half of the Saudi-Kuwaiti neutral zone’s
6,00,000bbl/d) see (Map: 3.12). In addition to 9.3 million bbl/d of crude oil,
Saudi Arabia produce around 1.5 million bbl/d of natural liquid gas (NGLs)
and other liquid, which are not to subject to OPEC quotas. Saudi Arabia, a
leading world producer of NGLs, has experienced a rise in demand for
NGLs from developing countries, including India (The leading export
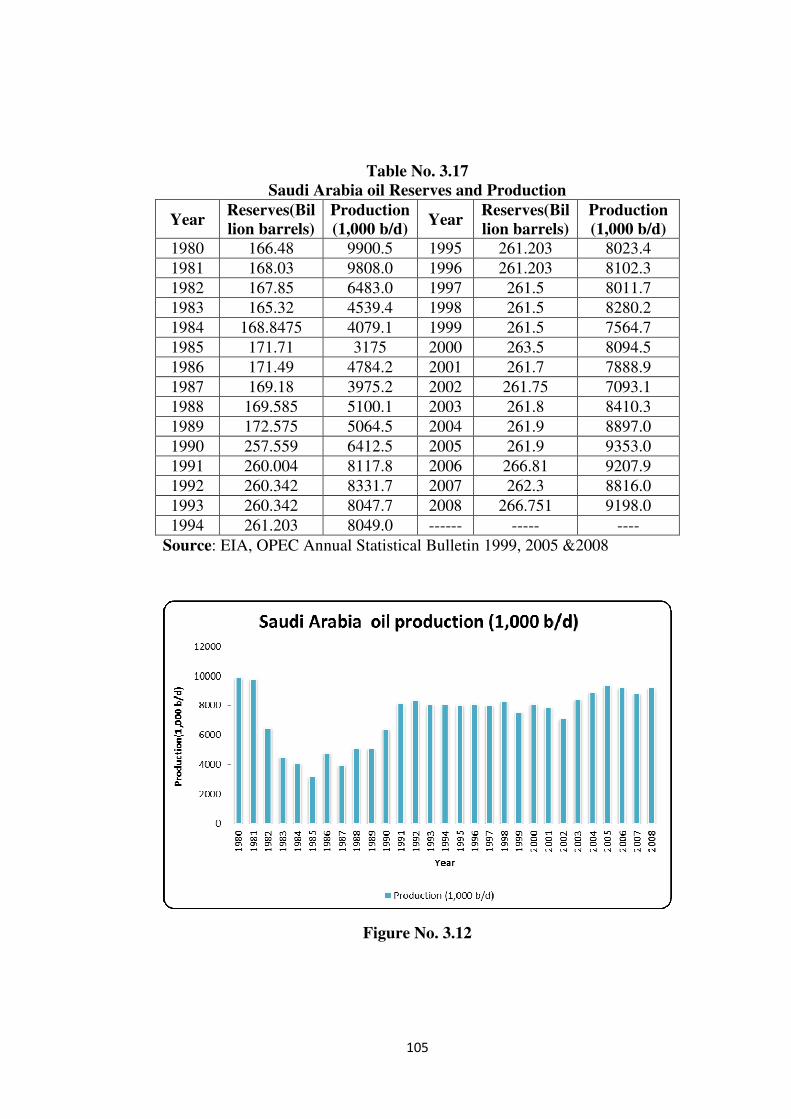
destination), where it is used for cooking and transportation. Table no. 3.17
shows the reserves as well as production records.
105
Table No. 3.17 Saudi Arabia oil Reserves and Production
Year Reserves(Billion barrels)
Production (1,000 b/d)
Year Reserves(Billion barrels)
Production (1,000 b/d)
1980 166.48 9900.5 1995 261.203 8023.4
1981 168.03 9808.0 1996 261.203 8102.3
1982 167.85 6483.0 1997 261.5 8011.7
1983 165.32 4539.4 1998 261.5 8280.2
1984 168.8475 4079.1 1999 261.5 7564.7
1985 171.71 3175 2000 263.5 8094.5
1986 171.49 4784.2 2001 261.7 7888.9
1987 169.18 3975.2 2002 261.75 7093.1
1988 169.585 5100.1 2003 261.8 8410.3
1989 172.575 5064.5 2004 261.9 8897.0
1990 257.559 6412.5 2005 261.9 9353.0
1991 260.004 8117.8 2006 266.81 9207.9
1992 260.342 8331.7 2007 262.3 8816.0
1993 260.342 8047.7 2008 266.751 9198.0
1994 261.203 8049.0 ------ ----- ----
Source: EIA, OPEC Annual Statistical Bulletin 1999, 2005 &2008
Figure No. 3.12
106
United Arab Emirates (UAE)
The UAE is a federation of seven Emirates- Abu Dhabi, Dubai,
Sharjah, Ajman, Fujairah, Ras-al- Khaimah and Umm- al-Qaiwai. Political
power is concentrated in Abu Dhabi, which controls the majority of the
UAE’s economic and resource wealth68 (Map: 3.13). Abu Dhabi crudes
are generally light and sweet by West Asia’s standards - gravity ranges
from 340 API for upper Zakum to 36.80 API for lower Zakum to 40.40
API for Murban.69 According to oil and gas Journal , the UAE’s proven
oil reserves were 97.8 billion barrels as of January, 2009. Abu Dhabi
leads the other emirates with 92.2 billion barrels followed by Dubai with
4 billion barrels, Sharjah with 1.5 billion barrels and Ras-al- Khaimah
with 100 million barrels. UAE crude oil streams are a light and sweet
composite. In 2008, the UAE produced 3 million barrels per day of total
oil liquids, of which 2.57 bbl/d was crude oil and 356,000 bbl/d was
natural gas liquids. The UAE’s domestic oil consumption averaged
only 525,000 bbl/d in 2008, and the majority of the oil production was
exported to the Asian countries. In the first 3 quarters of 2009, the UAE
produced an average of 2.2 million bbl/d of crude following a decision by
OPEC to cut production targets in the late 2008.70 However, UAE is a
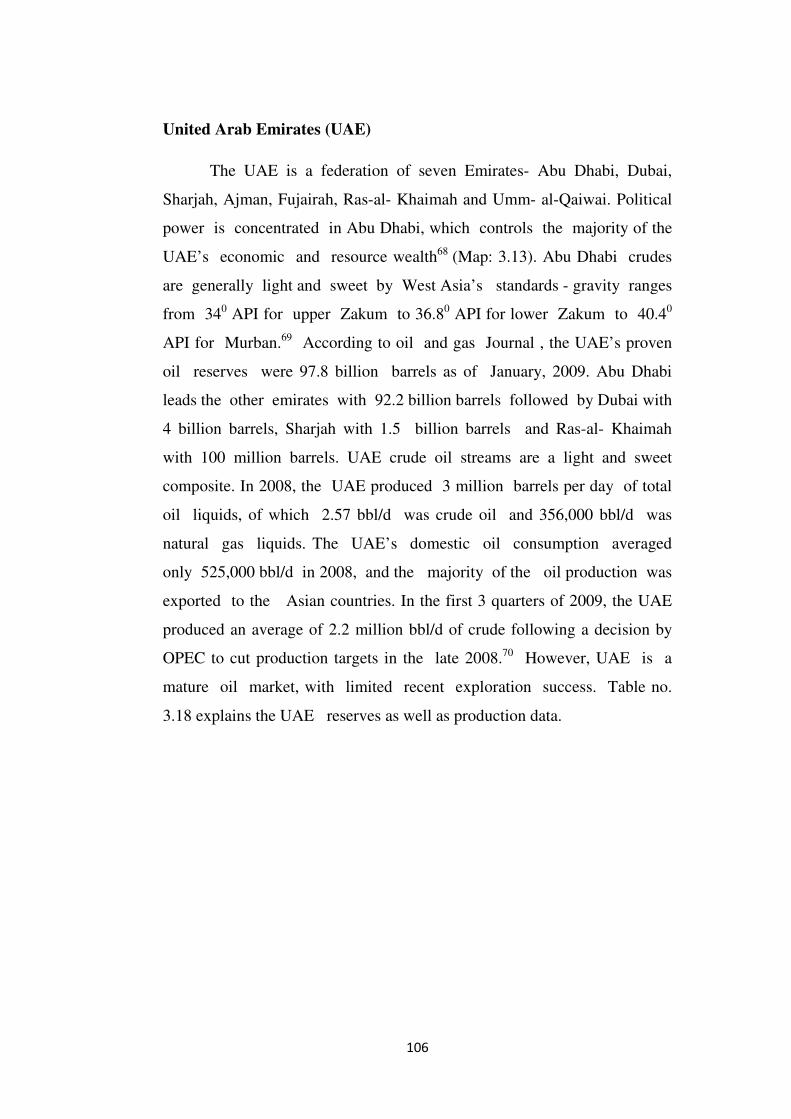
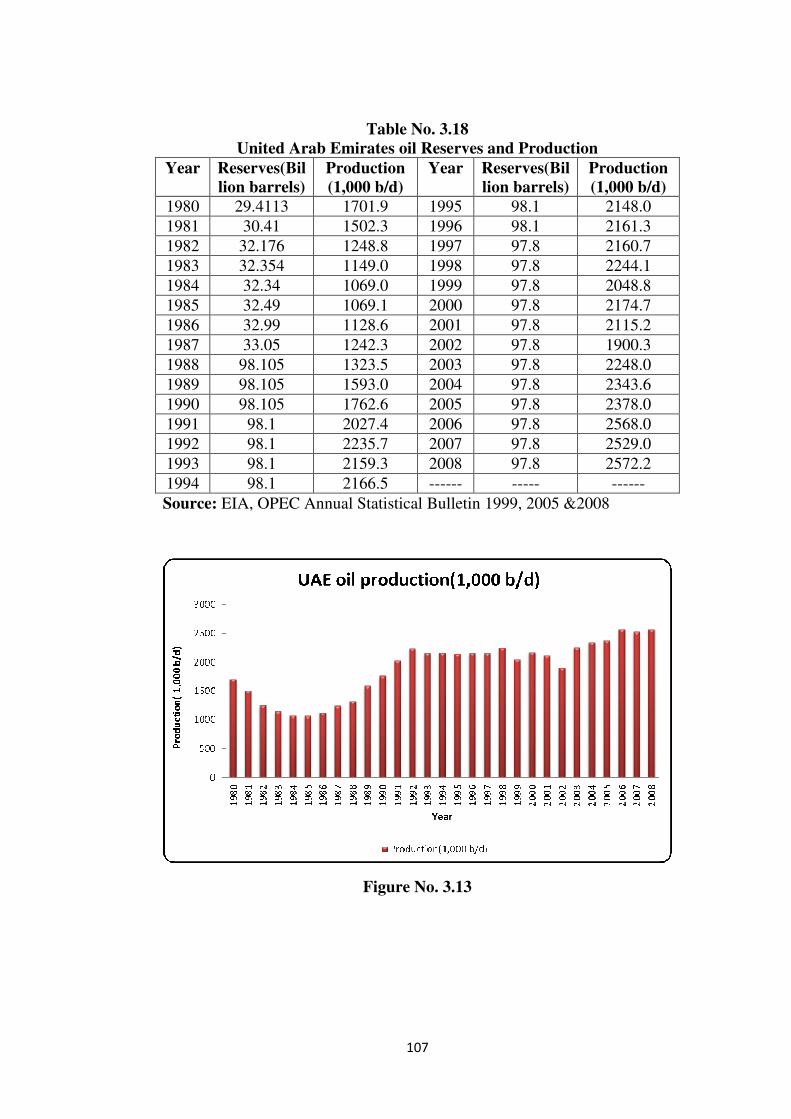
mature oil market, with limited recent exploration success. Table no.
3.18 explains the UAE reserves as well as production data.
107
Table No. 3.18 United Arab Emirates oil Reserves and Production
Year Reserves(Billion barrels)
Production (1,000 b/d)
Year Reserves(Billion barrels)
Production (1,000 b/d)
1980 29.4113 1701.9 1995 98.1 2148.0
1981 30.41 1502.3 1996 98.1 2161.3
1982 32.176 1248.8 1997 97.8 2160.7
1983 32.354 1149.0 1998 97.8 2244.1
1984 32.34 1069.0 1999 97.8 2048.8
1985 32.49 1069.1 2000 97.8 2174.7
1986 32.99 1128.6 2001 97.8 2115.2
1987 33.05 1242.3 2002 97.8 1900.3
1988 98.105 1323.5 2003 97.8 2248.0
1989 98.105 1593.0 2004 97.8 2343.6
1990 98.105 1762.6 2005 97.8 2378.0
1991 98.1 2027.4 2006 97.8 2568.0
1992 98.1 2235.7 2007 97.8 2529.0
1993 98.1 2159.3 2008 97.8 2572.2
1994 98.1 2166.5 ------ ----- ------
Source: EIA, OPEC Annual Statistical Bulletin 1999, 2005 &2008
Figure No. 3.13

108
3.3 GULF OIL EXPORTS
Oil is important resource of the Gulf region. The Gulf region
basically consists of eight countries namely Bahrain, Iran, Iraq, Kuwait,
Oman, Qatar, Saudi Arabia and United Arab Emirates. Among them
Saudi Arabia is a largest producer as well as the largest oil exporter in
the world. According to OPEC Annual Statistical Bulletin, 2008, it exported
7,321.7 thousand barrels per day.71 Following are the details of the Gulf
exporting countries.
Iran
Iran is a major energy exporter in the Gulf region whose production
and export capabilities have been sharply affected by the Iranian
Revolution, the hostage crisis with the United States that followed, the
Iran–Iraq War of 1980-1988, and U.S sanctions that seek to block U.S
and foreign investment in Iran energy sector.

109
Table No. 3.19 Iran oil Exports and Values of Petroleum exports
Year
Oil
exports
(1,000
b/d)
Value of
exports
(Million
US Dollar)
Year
Oil
exports
(1,000
b/d)
Value of
exports
(Million
US Dollar)
1980 796.7 11,693 1995 2621.0 14,973
1981 714.6 10,047 1996 2630.0 19,441
1982 1623.2 18,690 1997 2587.0 15,553
1983 1718.7 20,273 1998 2512.0 10,048
1984 1521.8 15,713 1999 2291.0 16,098
1985 1568.3 13,012 2000 2492.2 25,443
1986 1454.0 5,900 2001 2184.6 21,420
1987 1710.0 9,400 2002 2093.6 19,219
1988 1696.0 8,419 2003 2396.3 26,124
1989 2120.0 11,315 2004 2684.1 34,289
1990 2220.0 16,831 2005 2394.5 53,219
1991 2420.0 15,276 2006 2377.2 59,131
1992 2528.0 15,184 2007 2466.8 64,901
1993 2600.0 12,773 2008 2438.1 88,918
1994 2625.0 13,576 ------ ----- -----
Source: OPEC Annual Statistical Bulletin 1999, 2005 &2008, Vienna,
Austria.
Figure No. 3.14
110
Iran, a member of the organization of the Petroleum Exporting countries
(OPEC), ranks among the world’s top three holders of both proven oil
and natural gas reserves. Iran is OPEC’s second largest producer and
exporter after Saudi Arabia, and in 2008 was fourth–largest exporter of
crude oil globally after Saudi Arabia, Russia, and United Arab Emirates. In
2008, Iran exported 2438.1 thousand barrels per day of petroleum (figure
no. 3.14). Iranian heavy crude oil is Iran’s largest crude export followed by
Iranian light. In 2008, Iran’s net oil export revenues amounted to
approximately $73 billion. Oil exports provide approximately half of
Iran’s government revenues, while crude oil and its derivatives account
for nearly 80% of Iran’s total exports.
The above (table no. 3.19) explains the rate of oil export and value of
petroleum exports. The exporting rate is always increasing during the
period between 1980 to 2008 from 796.7 to 2438.1 thousand barrels per
day(1,000 b/d). On the other hand the value of petroleum exports
fluctuated during the period between 1980 to 1988 due to Iran –Iraq war.
However, after war it again started showing upward movement. On the eve
of the first Gulf war, bulk of Iran’s oil were destined to Western
Europe, Asia and Pacific regions. Eastern Europe and the Latin America
were also important destinations of Iran’s oil export. In Asia Pacific region,
India, Japan and China were the major countries for Iranian export.
Following (table no. 3.20) focuses on top Iranian exports destinations.

111
Table No. 3.20 Top Iranian Petroleum Exports Destinations (2008)
Country Exports (Million bbl/d) Japan 520
China 430
India 410
South Korea 210
Italy 160
Spain 140
Greece 110
France 90
South Africa 90
Other 440
Total Exports 2,600 Source: U.S, EIA and also see Global Trade Atlas.
Iraq
Iraq exported over 1.8 million bbl/d of crude oil in 2008.72 About
1.5 million bbl/d of this comes from Iraq’s Persian Gulf port of Basra, with
the rest exported via the Iraqi – Turkey pipeline in the north. The majority
of oil exports go to refineries in Asia, including china and India. Before the
Iran- Iraq war, Iraq was going through a period of ‘never had it so good’;
with years of sustained economic growth, the building of its infrastructure
and a rapid and unparalleled rise in oil exports and revenues (see table
no- 3.21 &3.22). Iraq’s oil sector has suffered over the past several decades
from sanctions and wars. Within the days of the war, many Iraqi refineries
loading facilities and pumping stations were put out of action and thus
Iraq was forced to suspend virtually all its oil exports.
112
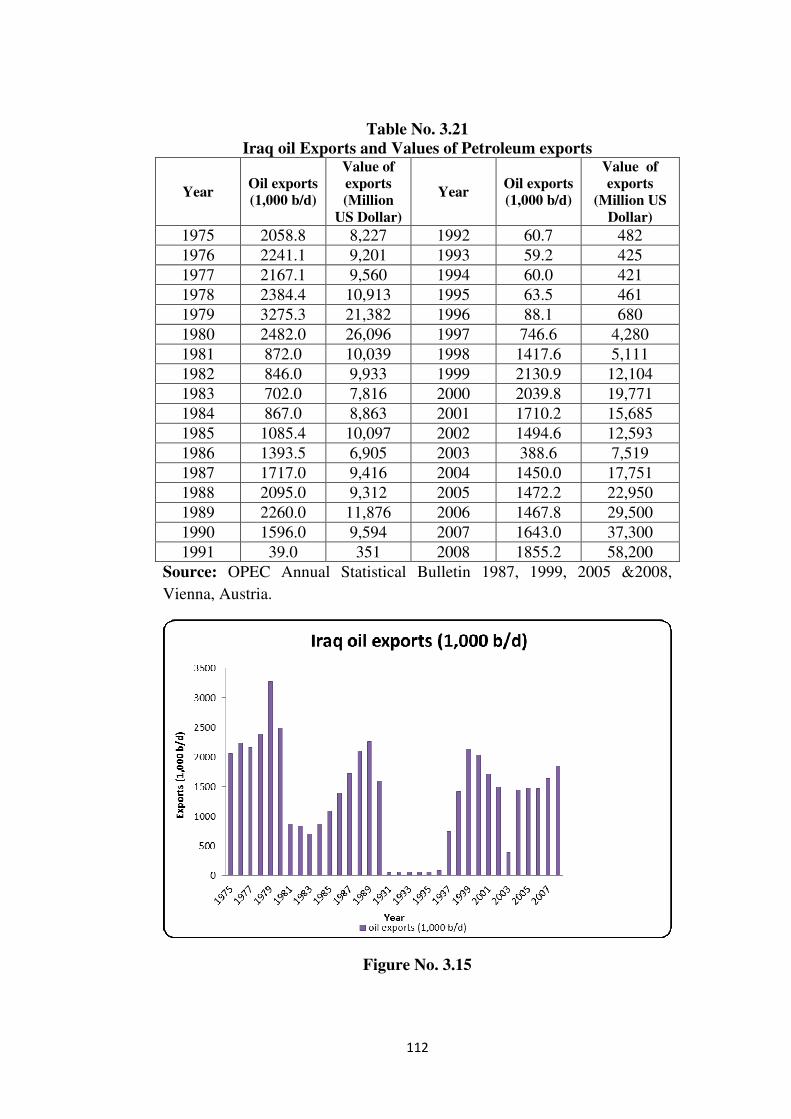
Table No. 3.21 Iraq oil Exports and Values of Petroleum exports
Year Oil exports (1,000 b/d)
Value of exports (Million
US Dollar)
Year Oil exports (1,000 b/d)
Value of exports
(Million US Dollar)
1975 2058.8 8,227 1992 60.7 482
1976 2241.1 9,201 1993 59.2 425
1977 2167.1 9,560 1994 60.0 421
1978 2384.4 10,913 1995 63.5 461
1979 3275.3 21,382 1996 88.1 680
1980 2482.0 26,096 1997 746.6 4,280
1981 872.0 10,039 1998 1417.6 5,111
1982 846.0 9,933 1999 2130.9 12,104
1983 702.0 7,816 2000 2039.8 19,771
1984 867.0 8,863 2001 1710.2 15,685
1985 1085.4 10,097 2002 1494.6 12,593
1986 1393.5 6,905 2003 388.6 7,519
1987 1717.0 9,416 2004 1450.0 17,751
1988 2095.0 9,312 2005 1472.2 22,950
1989 2260.0 11,876 2006 1467.8 29,500
1990 1596.0 9,594 2007 1643.0 37,300
1991 39.0 351 2008 1855.2 58,200
Source: OPEC Annual Statistical Bulletin 1987, 1999, 2005 &2008,
Vienna, Austria.
Figure No. 3.15

113
Table No. 3.22
Oil revenue of Iraq 1980-1988 ($ billion)
1980 1981 1982 1983 1984 1985 1986 1987 1988
26.0 10.4 10.2 9.7 11.2 12.5 7.0 11.3 11.0
Source: Survey of economic and social development in ESCWA region in
1980’s.
The significant decline in oil exports along with value of exports
during the first and the second Gulf War’s has been shown in the (table
no. 3.21). The oil exports of Iraq sharply declined from 2058.8 (1,000 b/d)
in 1975 to 872.0 (1,000 b/d) in 1981(figure no.3.15). Similarly value of
petroleum exports also went down during Iran –Iraq war. The decline in the
oil exports resulted in a massive reduction in oil revenues and foreign
exchanges. As can be noted, given the serious damage to oil exports
facilities, the revenue generated by petroleum exports fell drastically. The
value of petroleum exports fell from $ 26,096 million in 1980 to $ 10,039
million in 1981 and to $ 6,905 million in 1986 respectively.
The 1990/1991 Iraq–Kuwait crisis and the most recent war in
March/ April 2003, also seriously disrupted Iraq’s export facilities. Prior to
the Kuwait war, Iraq production capacity was around 3.1 million barrels a
day. In 1989 the Iraq exported 2260.0 (1,000 b/d) of oil which went down to
39.0 (1,000 b/d) in 1991. On the other hand value of petroleum exports also
declined. It fell down from $ 11,876 million in 1989 to $ 461 million
in1995. During the second Gulf War the rate of Iraqi oil exports and value
of petroleum exports sharply declined. Crude oil exports have fallen from a
post- war high of around 2.0 million barrels per day in 2004, to an average
of 1.5 million barrels per day in 2006. Geographically, Western Europe,
Eastern Europe and Latin America were important destinations of Iraq’s oil
export before the Iraq invasion of Kuwait.

114
Table No. 3.23 Iraq Crude oil Export by Destination (2008) Regions Exports (in percentage)
Western hemisphere 41%
Asia 34%
Europe 24%
Africa 1%
Total 100%
Source: U.S, EIA and also see Global Trade Atlas.
Figure No. 3.16
The above pie-chart shows the percentage of Iraqi crude oil export by
destination in 2008.
Kuwait
Kuwait is one of the world’s top exporters of oil, with about 2.4
million barrels per day exported in 2008.73 Kuwait economy is heavily
dependent on oil exports revenues which account for roughly 90 percent of
total export earnings. In 1980 Kuwait exported 1296.5 (1,000 b/d) as

115
shown in the (figure no. 3.17). And it sharply declined in 1981 due to Iran-
Iraq war. At the time of Iraq- Kuwait crisis, oil export of Kuwait was 85
(1,000 b/d). Similarly the value of petroleum exports in 1980 was 18,935
million US dollar and again it suddenly fell from $ 18,935 million in 1980
to $ 874 million in 1991 due to Iraq’s occupation. Prior to the invasion it
was selling oil products of 450,000 barrels per day from its downstream
operations. Kuwait’s three domestic refineries have a combined capacity of
Table No. 3.24 Kuwait Oil Exports and Values of Petroleum exports
Year Oil exports (1,000 b/d)
Value of exports
(Million US Dollar)
Year Oil exports (1,000 b/d)
Value of exports
(Million US Dollar)
1980 1296.5 18,935 1995 1186.4 12,054
1981 813.8 14,229 1996 1224.2 14,132
1982 368.8 9,066 1997 1134.2 13,468
1983 544.4 10,069 1998 1190.0 8,472
1984 658.0 10,996 1999 948.2 11,026
1985 475.9 9,451 2000 1230.7 18,185
1986 756.0 6,378 2001 1214.1 14,980
1987 607.0 7,523 2002 1138.0 14,060
1988 698.0 6,840 2003 1242.9 19,005
1989 850.0 10,432 2004 1414.9 26,675
1990 645.0 6,385 2005 1650.8 42,441
1991 85.0 874 2006 1723.4 53,178
1992 695.6 6,221 2007 1612.9 60,019
1993 1440.0 9,711 2008 1738.5 84,438
1994 1263.5 10,459 ------ ------- ------
Source: OPEC Annual Statistical Bulletin 1999, 2005 &2008, Vienna,
Austria.
roughly 936,000 b/d. The supreme petroleum council oversee Kuwait’s oil
sector and set oil policy. The Kuwait petroleum council (KPC) manages
domestic and foreign oil investment. Most Kuwait’s crude oil is sold on
term contracts, with the price of Kuwait crude oil tied to Saudi Arabian
Medium (for Western customers) and a monthly average of Dubai and
Oman crudes (for Asian buyers).

116
Figure No. 3.17
According to oil and gas journal, as of January 2010 Kuwait’s territorial
boundaries contained an estimated 101.5 billion barrels of proven oil
reserves roughly 8 percent of the world total. The partitioned Neutral
Zone, which Kuwait shares 50-50 with Saudi Arabia, holds an additional 5
billion barrels of reserves to 104 billion barrels. During the eight years Iran-
Iraq war, though Kuwait was not directly involved in the war, the close
proximity to the war zone adversely affected the oil sector. Thus in the
eighties Kuwait’s economy for most part was under recessionary spell.
According to Energy Information Administration (EIA), Kuwait’s total
exports of crude oil and refined products reached approximately 2.4
million barrels per day in 2008. Mina-al- Ahmadi is the country’s main
port for the export of crude oil. Kuwait also has operational oil exports
Terminals at Mina–Abdullah, Shuaiba, and at Mina Saud. To handle
increased production generated by project Kuwait a new terminal is planned
for construction on Bubiyan Island.
117
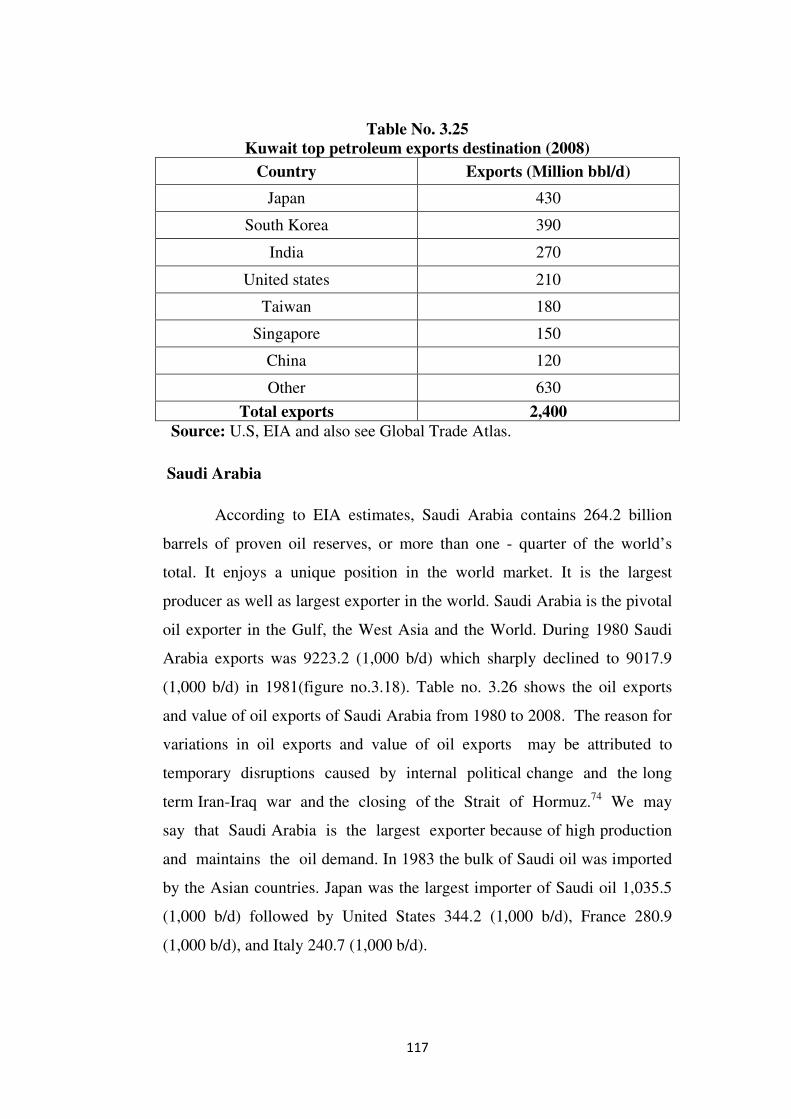
Table No. 3.25 Kuwait top petroleum exports destination (2008)
Country Exports (Million bbl/d)
Japan 430
South Korea 390
India 270
United states 210
Taiwan 180
Singapore 150
China 120
Other 630
Total exports 2,400 Source: U.S, EIA and also see Global Trade Atlas.
Saudi Arabia
According to EIA estimates, Saudi Arabia contains 264.2 billion
barrels of proven oil reserves, or more than one - quarter of the world’s
total. It enjoys a unique position in the world market. It is the largest
producer as well as largest exporter in the world. Saudi Arabia is the pivotal
oil exporter in the Gulf, the West Asia and the World. During 1980 Saudi
Arabia exports was 9223.2 (1,000 b/d) which sharply declined to 9017.9
(1,000 b/d) in 1981(figure no.3.18). Table no. 3.26 shows the oil exports
and value of oil exports of Saudi Arabia from 1980 to 2008. The reason for
variations in oil exports and value of oil exports may be attributed to
temporary disruptions caused by internal political change and the long
term Iran-Iraq war and the closing of the Strait of Hormuz.74 We may
say that Saudi Arabia is the largest exporter because of high production
and maintains the oil demand. In 1983 the bulk of Saudi oil was imported
by the Asian countries. Japan was the largest importer of Saudi oil 1,035.5
(1,000 b/d) followed by United States 344.2 (1,000 b/d), France 280.9
(1,000 b/d), and Italy 240.7 (1,000 b/d).

118
In 2008 oil export of Saudi Arabia to Asia and Pacific region 4281.7
(1,000 b/d) followed by North America 1618.3 (1,000 b/d), Western
Europe 852.0 (1,000 b/d) ,West Asia 302.0 (1,000 b/d), Africa 204.7 (1,000
b/d) and Latin America 63.1 (1,000 b/d).
Table No. 3.26 Saudi Arabia Oil Exports and Values of Petroleum exports
Year Oil exports
(1,000 b/d)
Value of
exports
(Million US
Dollar)
Year Oil exports
(1,000 b/d)
Value of
exports
(Million US
Dollar)
1980 9223.2 1,01,421 1995 6290.8 43,547
1981 9017.9 1,11,546 1996 6109.3 54,272
1982 5639.4 73,263 1997 6184.5 53,343
1983 3920.8 44,829 1998 6390.4 32,569
1984 3186.9 36,282 1999 5719.7 44,880
1985 2150.7 25,930 2000 6253.1 70,866
1986 3265.8 18,060 2001 6035.9 59,788
1987 2416.5 20,427 2002 5284.6 63,815
1988 3030.1 20,205 2003 6522.9 82,271
1989 3335.5 24,095 2004 6813.1 110,896
1990 4499.8 40,129 2005 7208.9 161,784
1991 6526.3 43,607 2006 7029.4 188,468
1992 6581.9 46,527 2007 6962.1 206,480
1993 6292.9 38,621 2008 7321.7 283,215
1994 6233.6 38,138 ------ ------- ------
Source: OPEC Annual Statistical Bulletin 1999, 2005 &2008, Vienna,
Austria.

119
Figure No. 3.18
Qatar
The state of Qatar lies on a mitten-shaped peninsula midway down
the east coast of the Arabian Peninsula. Qatar economy depends almost on
oil and gas revenues which account for roughly 89 percent of its export
earnings and 72 -75 percent of its government revenues. Most of
Qatar’s heavy industrial projects are tied closely to its petroleum sector.
They include a refinery with 50,000-60,000 barrels per day capacity. In
1980 Qatar’s exports was 465.7 (1,000 b/d) and it continuous witnessed
declining trend,(figure no.3.19) with some exception , due to Iran –Iraq
war and Iraq–Kuwait crisis. According to OPEC Annual Statistical Bulletin
Qatar oil export increased from 391(1,000 b/d) in 1981 to 703.1 (1,000 b/d)
in 2008 (table no. 3.27). Similarly the value of petroleum exports during the
period between 1980-1990 registered variations. The major destination of
Qatar oil exports are Asia and pacific region, Western Europe and Latin
America.

120
Table No. 3.27
Qatar Oil Exports and Values of Petroleum exports Year Oil exports
(1,000 b/d) Value of exports
(Million US Dollar)
Year Oil exports (1,000 b/d)
Value of exports
(Million US Dollar)
1980 465.7 5,372 1995 333.0 2,987
1981 391.0 5,496 1996 367.0 3,489
1982 322.8 4,214 1997 401.5 3,744
1983 279.5 2,993 1998 572.4 3,357
1984 324.2 4,386 1999 580.5 4,775
1985 280.0 3,068 2000 617.6 7,834
1986 297.0 1,720 2001 605.5 6,964
1987 214.0 1,829 2002 567.8 6,885
1988 226.0 1,709 2003 540.7 8,814
1989 320.0 1,955 2004 542.7 11,694
1990 347.8 3,273 2005 677.3 17,585
1991 336.6 2,828 2006 620.3 23,350
1992 362.3 2,870 2007 615.1 29,130
1993 340.6 2,811 2008 703.1 38,950
1994 322.6 2,623 ------ ------- -------
Source: OPEC Annual Statistical Bulletin 1999, 2005 & 2008, Vienna,
Austria.

121
Figure No. 3.19
United Arab Emirates (UAE)
The UAE is an important oil exporting country of the Gulf. The
UAE does, however, have some political problems and tensions in dealing
with the management of its oil resources. Under the UAE’s constitution,
each Emirate controls its own oil production and resource development.
The UAE still treats oil and gas as state industries.75 The UAE is a mature
oil market; with limited recent exploration success. It is one of the important
oil producers of the world.
In 1980 total daily oil export of the UAE was 1697.3 (1,000 b/d)
(figure no.3.20). But the pace of oil export could not be maintained due
to political instability caused by Iran-Iraq war. The pace of oil export
also effected the value of oil export of the UAE during the same period
, showing 25.96 percent decline. Major export destinations of the UAE’s
oil export are Asia and pacific regions, Western Europe and North America.
However in 2008 the exported 2.52 million bbl/d,76 mostly to Asian
countries , with over 40 percent going to Japan.

122
Table No.3.28 United Arab Emirates Oil Exports and Values of Petroleum exports Year Oil exports
(1,000 b/d) Value of exports
(Million US Dollar)
Year Oil exports (1,000 b/d)
Value of exports
(Million US Dollar)
1980 1697.3 19,390 1995 1925.0 12,822
1981 1439.0 18,761 1996 1943.2 14,980
1982 1167.0 15,956 1997 1949.0 15,269
1983 1077.3 13,016 1998 2039.0 11,131
1984 1036.7 12,037 1999 1919.0 15,021
1985 977.7 10,896 2000 1814.9 26,148
1986 1127.8 6,865 2001 1786.7 23,909
1987 1239.3 7,900 2002 1614.0 22,806
1988 1321.5 7,627 2003 2048.0 29,183
1989 1589.0 10,215 2004 2172.0 38,801
1990 1761.6 14,846 2005 2195.0 55,079
1991 2024.4 14,356 2006 2420.0 70,100
1992 2060.0 14,251 2007 2342.7 84,390
1993 1970.0 12,118 2008 2334.4 102,500
1994 1955.0 11,683 ------ ------- -------
Source: OPEC Annual Statistical Bulletin 1999, 2005 & 2008, Vienna,
Austria.

123
Figure No. 3.20
Oman
Oman’s oil and gas exports play a major role in future global energy
balances.77 Oman reserves relatively small. According to oil and gas
journal, estimated proven oil reserves in Oman stood at 5.5 billion
barrels (bbl) as of January, 2009 or only 0.5 percent of the world total.
Oman is not a member of the Organization of the Petroleum Exporting
Countries (OPEC), though it is a significant oil exporter. More than 90
percent oil production is exported. In 1980 Oman’s oil exports was
averaged 277.8 (1,000 b/d) and it reached a peak of 643.1 (1,000 b/d) in
1991 (figure no.21). Table no. 3.29 exhibits trend of crude oil exports of
Oman. In 1990, the majority of Oman’s oil exports were destined for the
Far East market ; Japan, the republic of Korea (South Korea), Singapore,
China, Taiwan, Thailand, and the Philippines, received 85 percent of total
Oman’s crude oil exports in 1990. Japan accounted for 40 percent of total
exports, South Korea for 26 percent, Singapore for 7 percent and less than 7
percent of crude oil exports were destined for the United States market.
During 2008, Oman’s net oil exports estimated at 680 thousand barrels per
day.78

124
Table No. 3.29 Oman Oil Exports and Values of Petroleum exports
Year Oil exports
(1,000 b/d)
Value of
exports
(Billion
US
Dollar)
Year Oil exports
(1,000 b/d)
Value of
exports
(Billion
US
Dollar)
1980 277.8 3.3 1988 578.3 n/a*
1981 328.4 4.4 1989 590.8 n/a*
1982 325.1 4.1 1990 628.0 n/a*
1983 351.1 4.2 1991 643.1 n/a*
1984 368.6 3.9 1992 689.2 n/a*
1985 450.5 4.7 1993 731.6 n/a*
1986 513.1 2.0 1994 780.5 n/a*
1987 539.4 n/a* 1995 832.6 n/a*
Source: Data is completed by various issues of OPEC Annual statistical
bulletin and OAPEC Secretary General thirteenth Annual Report, 1986.
*Data not available.
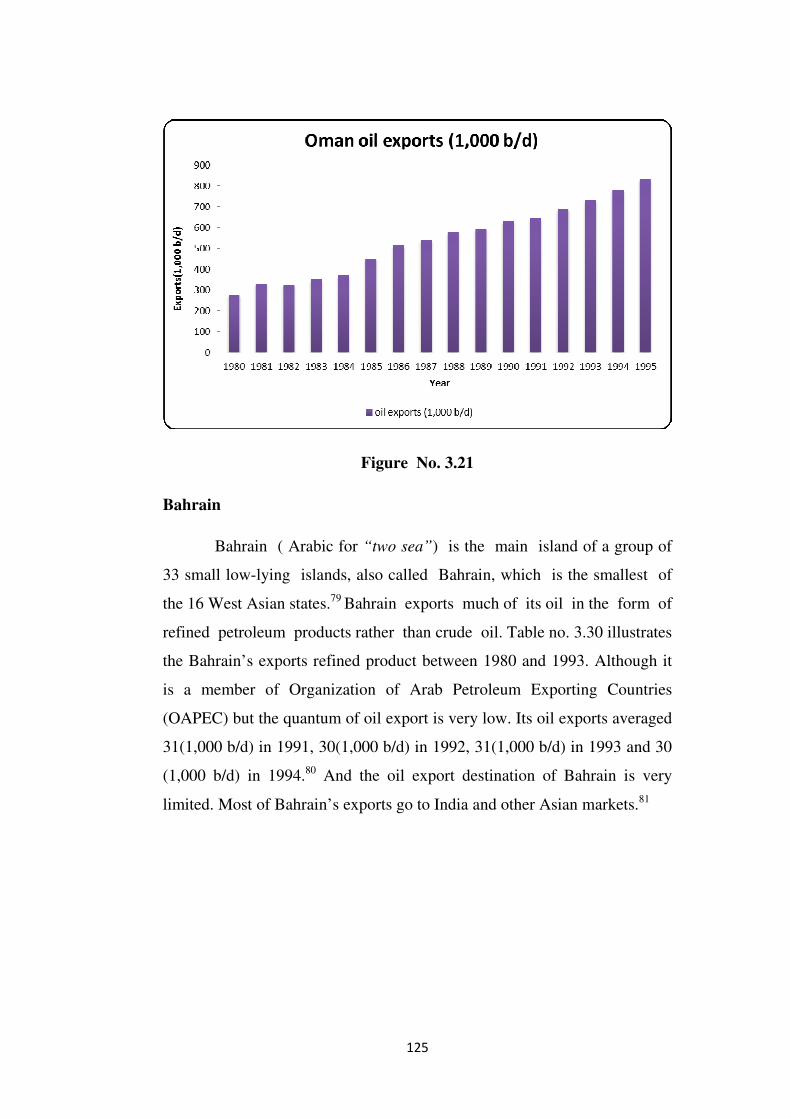
125
Figure No. 3.21
Bahrain
Bahrain ( Arabic for “two sea”) is the main island of a group of
33 small low-lying islands, also called Bahrain, which is the smallest of
the 16 West Asian states.79 Bahrain exports much of its oil in the form of
refined petroleum products rather than crude oil. Table no. 3.30 illustrates
the Bahrain’s exports refined product between 1980 and 1993. Although it
is a member of Organization of Arab Petroleum Exporting Countries
(OAPEC) but the quantum of oil export is very low. Its oil exports averaged
31(1,000 b/d) in 1991, 30(1,000 b/d) in 1992, 31(1,000 b/d) in 1993 and 30
(1,000 b/d) in 1994.80 And the oil export destination of Bahrain is very
limited. Most of Bahrain’s exports go to India and other Asian markets.81

126
Table No. 3.30 Bahrain Exports of Refined products and Values of petroleum exports
Year Exports of
refined
products(1,000
b/d)
Value of
Exports
(Billion
US Dollar)
Year Exports of
refined
products(1,000
b/d)
Value of
Exports
(Billion
US Dollar)
1980 n/a* 3.2 1987 230.15183 n/a*
1981 n/a* 3.9 1988 234.2003 n/a*
1982 n/a* 3.1 1989 232.6398 n/a*
1983 n/a* 2.6 1990 236.28244 n/a*
1984 n/a* 2.7 1991 237.718 n/a*
1985 n/a* 2.4 1992 239.40128 n/a*
1986 232.43056 1.8 1993 236.85819 n/a*
Source: U.S Department of energy, EIA and OAPEC Secretary General
thirteenth Annual Report, 1986. *Data not available.

127
Figure No. 3.22
Bahrain, Qatar, and Oman are not important oil producer as well as oil
exporters, but these states cannot be ignored in geopolitical analysis of oil in
the Gulf region. The oil reserves attest significance of these states in
geopolitics of oil. Qatar is a also major potential gas producer, with the
third largest reserves in the World. All three states play an important role
in U.S power projection. Bahrain with host to the US fifth fleet , Qatar is
agreed to allow the US to preposition brigade set on its soil , and Oman
provides prepositioning and port facilities.
However, oil is the important resources of the world and its
contribution in energy mix is nearly 60 percent. Hence it is an inevitable
resource and sustain economic growth depends on the smooth availability of
this strategic minerals. The uninterrupted flow of oil from the Gulf is a
political, a strategic, and an economic importance. Iraq –Kuwait crisis and
intervention of US and allied forces in the liberating Kuwait from Iraqi
occupation may be considered a significant development in geopolitics
of oil.

128
The present trend of oil consumption demonstrates that world’s oil
demand will rise in future. The Energy Information Administration (EIA)
estimates that world consumption will rise from 89.7 million barrels per
day (MMBD) in 2010 to 98.8 MMBD in 2015, 108.2 MMBD in 2020 and
118.8 MMBD in 2025.This represents only an average annual increase of
1.8 % per year and amounts to a total increase of 41.9 MMBD between
2020-2025 – a cumulative increase of 54 %. Thus the Gulf region has
been and will continue to be, a critical factor in meeting the world oil
demand and in providing oil exports for simple and straight forward
reasons.
The size of the Gulf oil reserves, current oil production capacity,
projected increases in Gulf oil exports through 2025 and direction of Gulf
oil exports and its importance in global economy, sufficiently indicate the
oil is a paramount resource in the energy mix and as well as an important
factor for the sustainable socio-economic growth in the world. The
estimates of various energy agencies, however, agree that the use of oil
in energy supply will continue to dominate in the world energy supply.
The experts of these agencies believe an annual increase of 1.2 to 2.6
percent in the use of oil. Although some experts assume that future
demand for oil and gas will be limited by the impact of other sources of
energy, advances in technology, advances in energy efficiency and the
impact of conservation , the projected estimates of different global energy
agencies are seems to be realistic in terms of the role petroleum will
play in the world’s future energy supply. Currently world oil consumption
is increasing an average annual growth rate of 1.7 percent. The
contribution of oil and gas in total energy supply at present is 68 percent.
The cost of production of oil and gas particularly in the Gulf region is much
lower than the other source of energy. Moreover, the oil and gas is easy to
transport from place of origin to consumer destinations. In addition to these,
oil and gas are found in abundance. All these points provide advantage to
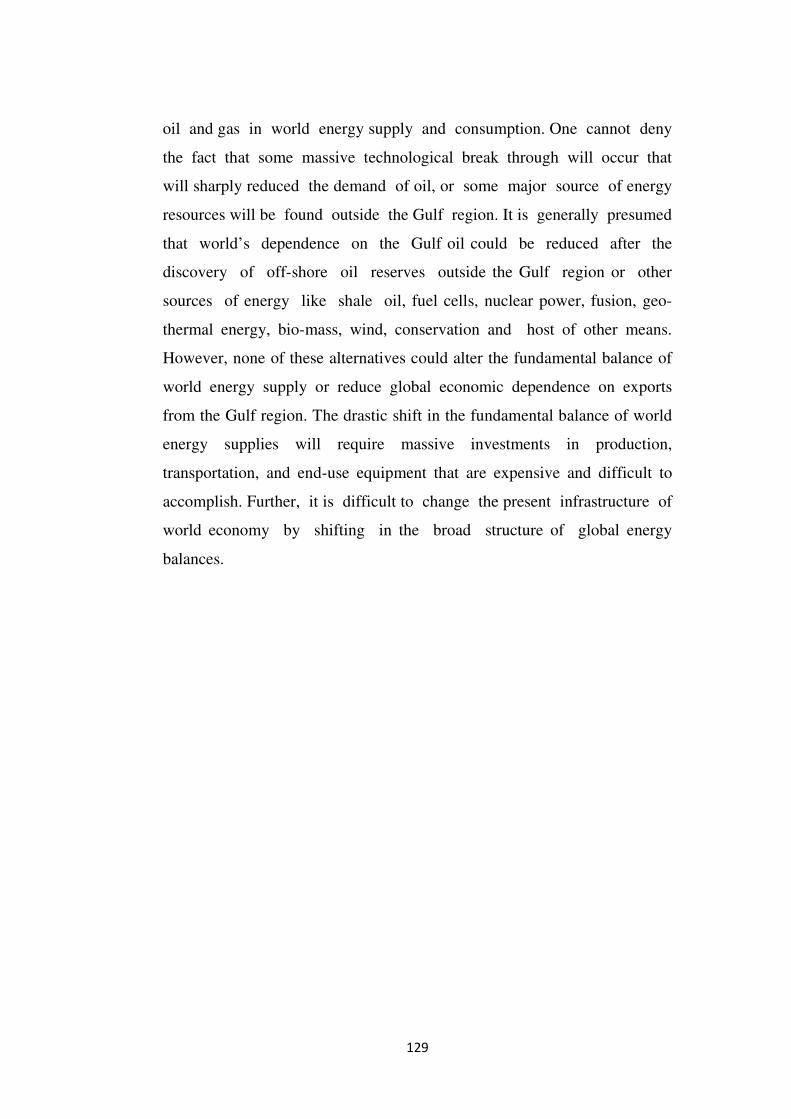
129
oil and gas in world energy supply and consumption. One cannot deny
the fact that some massive technological break through will occur that
will sharply reduced the demand of oil, or some major source of energy
resources will be found outside the Gulf region. It is generally presumed
that world’s dependence on the Gulf oil could be reduced after the
discovery of off-shore oil reserves outside the Gulf region or other
sources of energy like shale oil, fuel cells, nuclear power, fusion, geo-
thermal energy, bio-mass, wind, conservation and host of other means.
However, none of these alternatives could alter the fundamental balance of
world energy supply or reduce global economic dependence on exports
from the Gulf region. The drastic shift in the fundamental balance of world
energy supplies will require massive investments in production,
transportation, and end-use equipment that are expensive and difficult to
accomplish. Further, it is difficult to change the present infrastructure of
world economy by shifting in the broad structure of global energy
balances.

130
REFERENCES
1. Ferruh, Demirmen, “Oil in Iraq : The Byzantine Beginnings”
,Global policy Forum ,April 25,2003.
2. Ibid.
3. The Gulf oil and Gas Sector : Potential and Constraints, The
Emirates Centre For Strategic Studies And Research, UAE,
2006,p.104.
4. Mariam, Karouny, “Oil firms line up for contracts in Iraq”, Reuters,
March 1, 2008.
5. Vahe, Petrossian, “Iraq Opens Doors to Foreign Input”, Upstream,
March, 28, 2008.
6. Faleh al Khayat, “Iraq Prepares Oil Licensing Round without
Federal Oil Law”, Platts Commodity News, January 9th, 2008 & see
http://www.oil.gov.iq/pcld.pdf.
7. Perry, Williams,” A crushing blow to Baghdad’s plans”, Middle East
Economic Digest, July 10, 2009.
8. http://countrystudies.us/Iraq/53.htm.
9. http://online.wsj.com/article/SB126114921937697207.html and see
also U.S Department of Energy, Iraq Country Analysis Brief ,
June 2006.
10. http://www.khabaronline.ir/news-31942.aspx.
11. http://www.independent.ie/world-news/middle-east/iran-army-
withdraws-from-iraqi-oil-field-after-talks-1983302.html.
12. http://www.rigzone.com/news/article.asp?a_id=86237

131
13. http://www.eni.com/en_IT/media/press-releases.
14. Yergin, Daniel, “The Prize: The Epic Quest for Oil, Money, and
Power”, Simon & Schuster, United States, January 15, 1991. p. 204.
15. http://online.wsj.com/article/BT-CO-20091211-702741.html.
16. http://www.zawya.com/Story.cfm/sidANA20091211T091651ZPKJ5
1
17. http://in.biz.yahoo.com/091211/137/bauqpn.html.
18. Ibid.
19. http://www.globalsecurity.org/military/world/iraq/kirkuk.htm.
20. Adel Mirza, "Iraq agrees Majnoon oilfield development plan".
MEED, Middle East business intelligence since 1957, April 25th
2010.
21. http://www.offshore-technology.com/projects/majnoon-field.
22. Ibid.
23. Ibid.
24. Williams, Timothy, "Under Tight Security, Iraq Sells Rights to
Develop 2 Oil Fields". The New York Times, 11th December, 2009.
25. http://news.bbc.co.uk/2/hi/business/8407274.stm,and also available
http://www.france24.com/en/20091220-shell-petronas-first-oil-
initial-deal-iraq-majnoon-oilfield-development.
26. Ibid.
27. http://www.rigzone.com/news/article.asp?a_id=83440&rss=true and
http://online.wsj.com/article/SB10001424052748703522904574589
241516916598.html.

132
28. Hiro, Dilip, “The longest war”, Routledge Chapman Hall Inc., 1991,
p103.
29. http:// news.bbc.co.uk, No.25.
30. http://www.gulfoilandgas.com/webpro1/MAIN/Mainnews.asp?id=98
76
31. Thomas C. Hayes, CONFRONTATION IN THE GULF; The
Oilfield Lying Below the Iraq-Kuwait Dispute, The New York Times,
September 3, 1990.
32. http://www.forbes.com/2010/01/21/biggest-oil-fields-business-
energy-oil- fields.html.
33. Gina Chon, "Iraq Awards West Qurna-1 Oil Field to Exxon, Shell",
The Wall Street Journal, November 5th, 2009.
34. http://business.timeline.co.uk.
35. See U.S. Energy Information Administration, Iraq Country Analysis
Brief, 2007, available at http: // www. eia.doe. gov/ emeu/ cabs/ Iraq/
oil.html.
36. U.S Department of Energy, Iraq Country Analysis Brief, August
2003, p.03.
37. International Petroleum Encyclopedia, 2003, p.219.
38. http://www.crs.gov/RL34064
39. See An –Najah National University-Zajel, The Petroleum Company
1914-1982 (Feb.1, 2005), available: www. zajel. org. / article _ view.
asp?newsID=4519 &cat=15.
40. Ibid.
41. Ibid.
42. Ibid.
43. Ibid.
44. Ibid.

133
45. Ibid.
46. Ibid.
47. Ibid.
48. See U.S. Energy Information Administration, U.S. Department of
Energy (1998), available at http://www.arabchamber.com/arab-
countries/iraq/Y/iea2.html.
49. Ibid.
50. See Energy Information Administration, Official Energy Statistics
from the U.S Govt., Iraq: oil (Aug.2007), available at
www.eia.doe.gov/emeu/cabs/oil.html.
51. Ibid.
52. See U.S. Department of State, Iraq Transition Office, Essential
indicators Reports at 4 (oil production), Feb. 21, 2008. It is not
unusual to see some divergences on Iraqi oil production numbers
depending on their source.
53. EIA, No.50.
54. Ibid.
55. Sameer, N.Yacoub, “Iraq increases Oil Exports”, Albuquerque
Journal, June 21, 2008.
56. Oil and Gas Directory – Middle East, 2009.
57. Ibid.
58. Energy Information Administration, Country Analysis Brief
“Kuwait”, May, 2010.
59. Ibid.
60. Energy Information Administration, Country Analysis Brief “Iran”,
Jan., 2010.
61. Energy Information Administration, Country Analysis Brief
“Oman”, Jan. 2009.
62. Middle East Economic Survey (MEES), Vol. XLVI, No. 40,
October 6, 2003.
63. http://www.rocoil.com.au.

134
64. Energy Information Administration, Country Analysis Brief
“Qatar”, 2007. Available at http: // www. eia.doe.Gov / emeu /
cabs/ Qatar/ Oil.html.
65. Cordesman, Anthony H. “Energy Developments in the Middle
East”, Praeger Publishers, Westport, U.S.A, 2004, p.158.
66. MEES, Vol. XLVI, No.40, October 6, 2003.
67. The Saudi-Kuwaiti divided zone or the “Neutral zone”, 2230 square
miles between the borders of Saudi Arabia and Kuwait that was left
undefined in 1922 contains an estimated 5 billion barrels of proven
oil reserves, shared between the two countries from approximately
600,000 bbl/d is produced.
68. Cordesman, A.H, no. 65, p.201.
69. MEES, Vol. XLVI, No.40, October 6, 2003.
70. Energy Information Administration, Country Analysis Brief “United
Arab Emirates”, Jan. 2009.
71. Organization of Petroleum Exporting Countries (OPEC) Annual
Statistical Bulletin, Vienna, 2008.
72. British Petroleum Statistical Review of the world Energy 2009.
73. Energy Information Administration, Country Analysis Brief
“Kuwait”, May, 2010.
74. Qundt, William B., “Saudi Arab’s oil policy,” The Brookings
institution, Washington D.C, 1982.
75. Cordesman, Anthony H. No. 65, p.202.
76. Energy Information Administration, Country Analysis Brief “United
Arab Emirates”, 2010.
77. British Petroleum AMOCO Statistical Review of World Energy
2001, p 4, 20.

135
78. OPEC Annual Statistical Bulletin, 2008, Vienna, Austria.
79. The main Island was called Al- Awal in the past, hence the name
Awali for the oil field and oil town. Believed to have been the
ancient Dilmun, Bahrain was the classical Tylos: and to add to the
confusion, the name Bahrain was long applied to eastern Arabia
as well as to the Islands.
80. Organization of Arab petroleum Exporting Countries (OAPEC),
Secretary General’s Twenty –Second Annual Report, Kuwait, 1995.
81. Oil and Gas Directory Middle East, 2009.
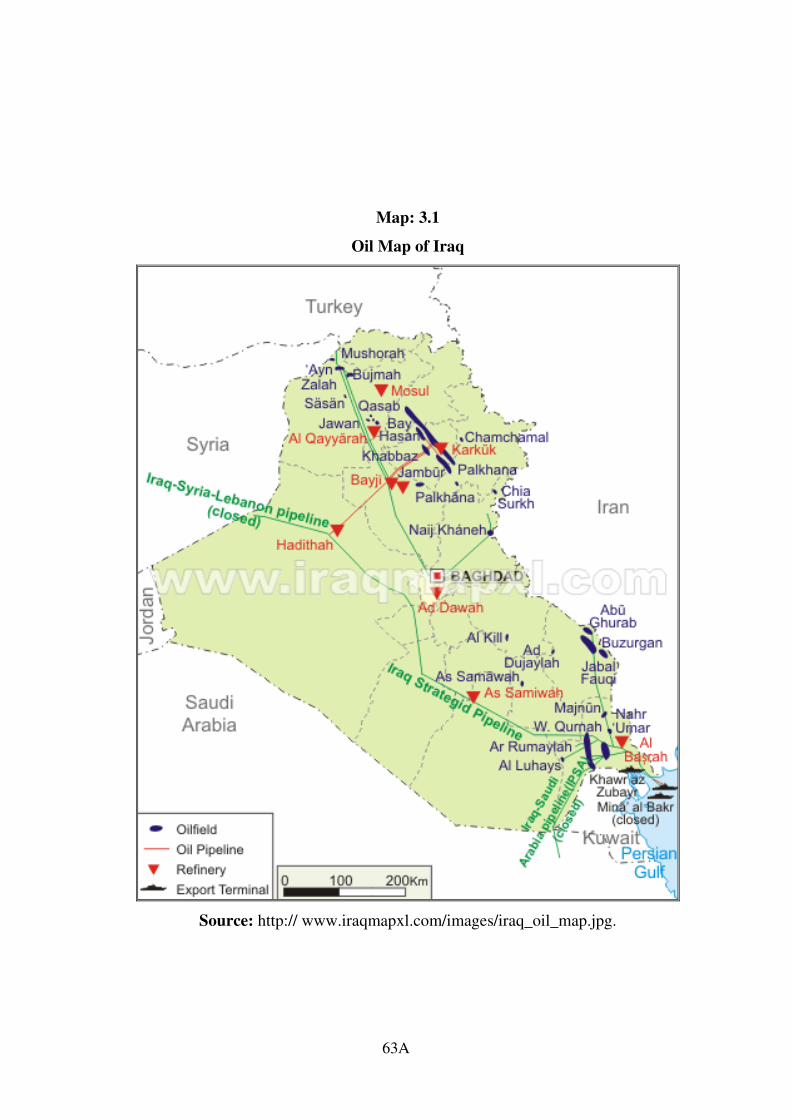
63A
Map: 3.1
Oil Map of Iraq
Source: http:// www.iraqmapxl.com/images/iraq_oil_map.jpg.

72A
Map: 3.2
Location of Iraq oil field structures and exploration blocks
Source: MEES, Vol. XLVI, No. 07, February 17, 2003.

79A
Map: 3.3
Iraq Oil fields
Source: http://www.lib.utexas.edu/maps/middle_east_and_asia/iraq_oil_2003.jpg

83A
Map: 3.4
Iraq oil fields and facilities
Source: http://www.lib.utexas.edu/maps/middle_east_and_asia/iraq_oilfield_1992.jpg
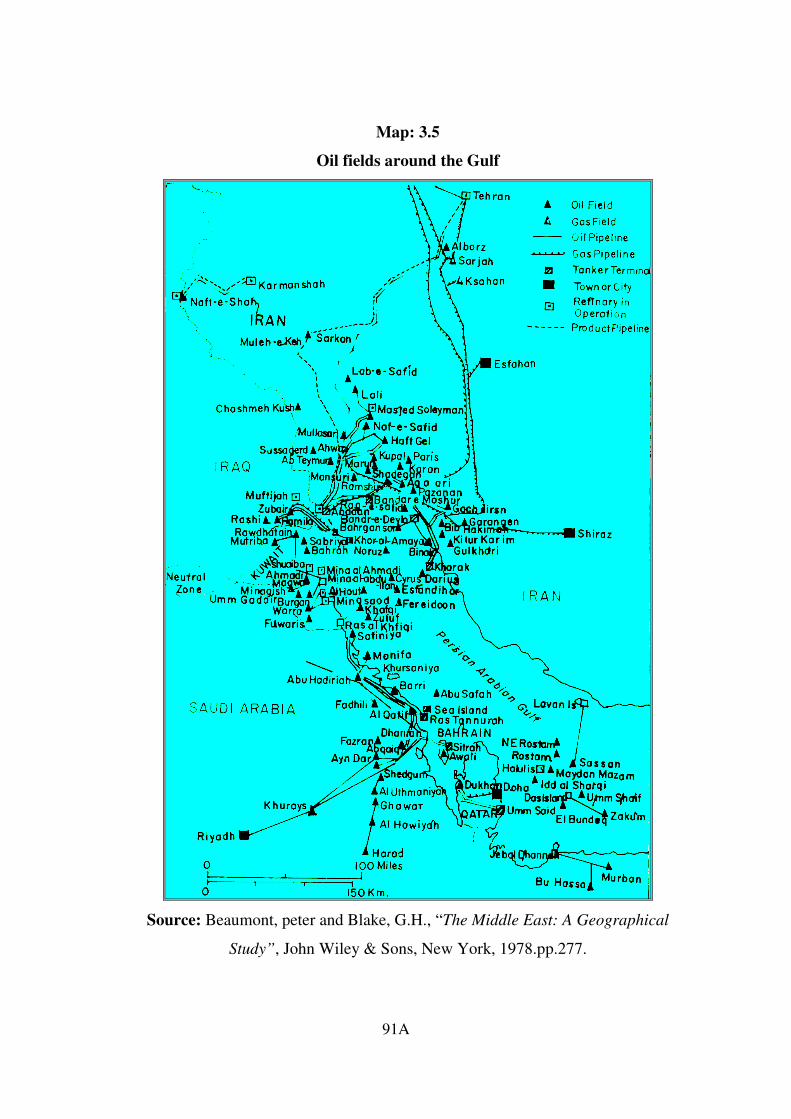
91A
Map: 3.5
Oil fields around the Gulf
Source: Beaumont, peter and Blake, G.H., “The Middle East: A Geographical
Study”, John Wiley & Sons, New York, 1978.pp.277.

94A
Map: 3.6
Bahrain oil fields
Source: http://ww.mafhoum.com/press/112E16.htm

96A
Map: 3.7
Kuwait Oil fields
Source: http://www.moo.gov.kw/default.aspx?pageld=49
97A
Map: 3.8
Iran Oil and Gas fields
Source: http://www.parstimes.com/images/iran_petroleum_facilities_2004.jpg

100A
Map: 3.9
Oman Oil and Gas fields
Source: http://www.gulfpetrolink.net/publictaionguide/graphics/oman
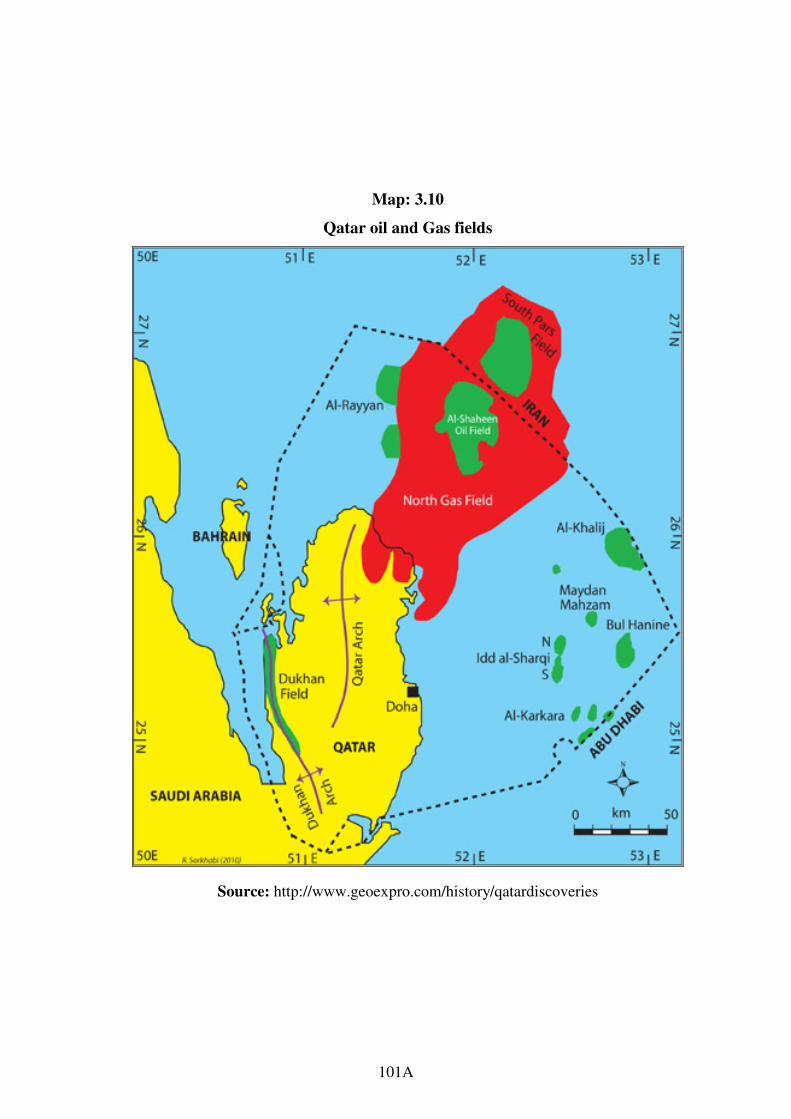
101A
Map: 3.10
Qatar oil and Gas fields
Source: http://www.geoexpro.com/history/qatardiscoveries
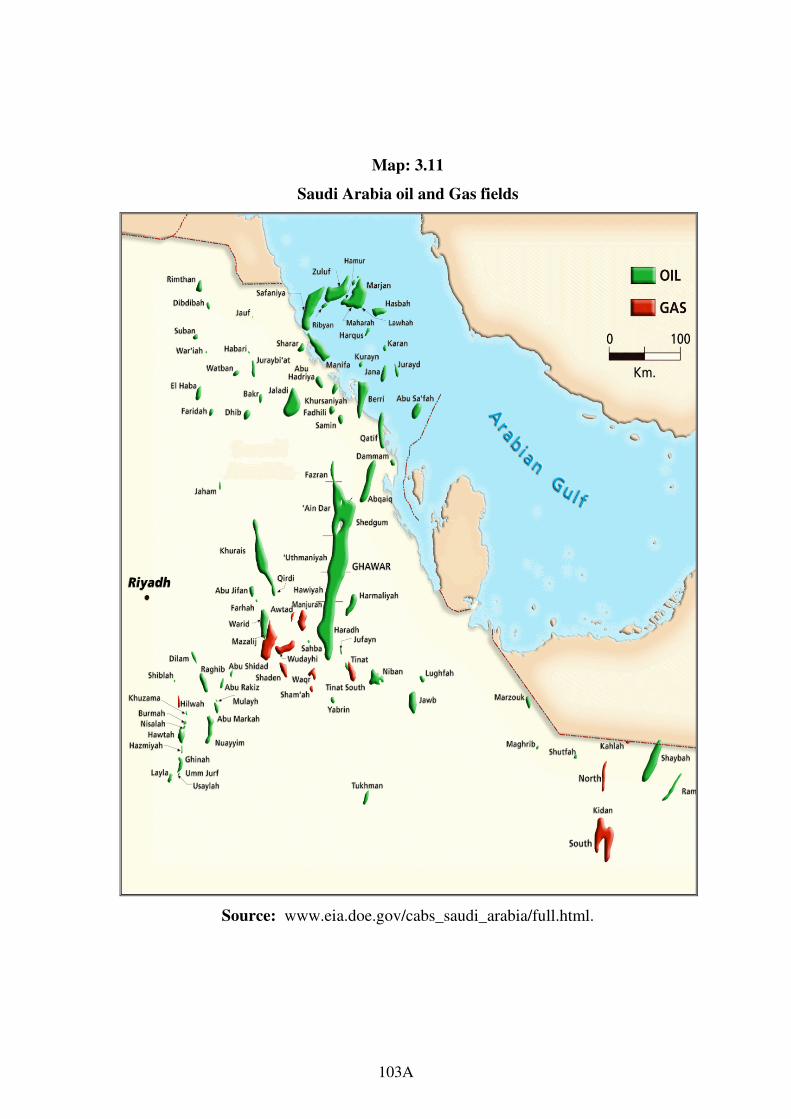
103A
Map: 3.11
Saudi Arabia oil and Gas fields
Source: www.eia.doe.gov/cabs_saudi_arabia/full.html.
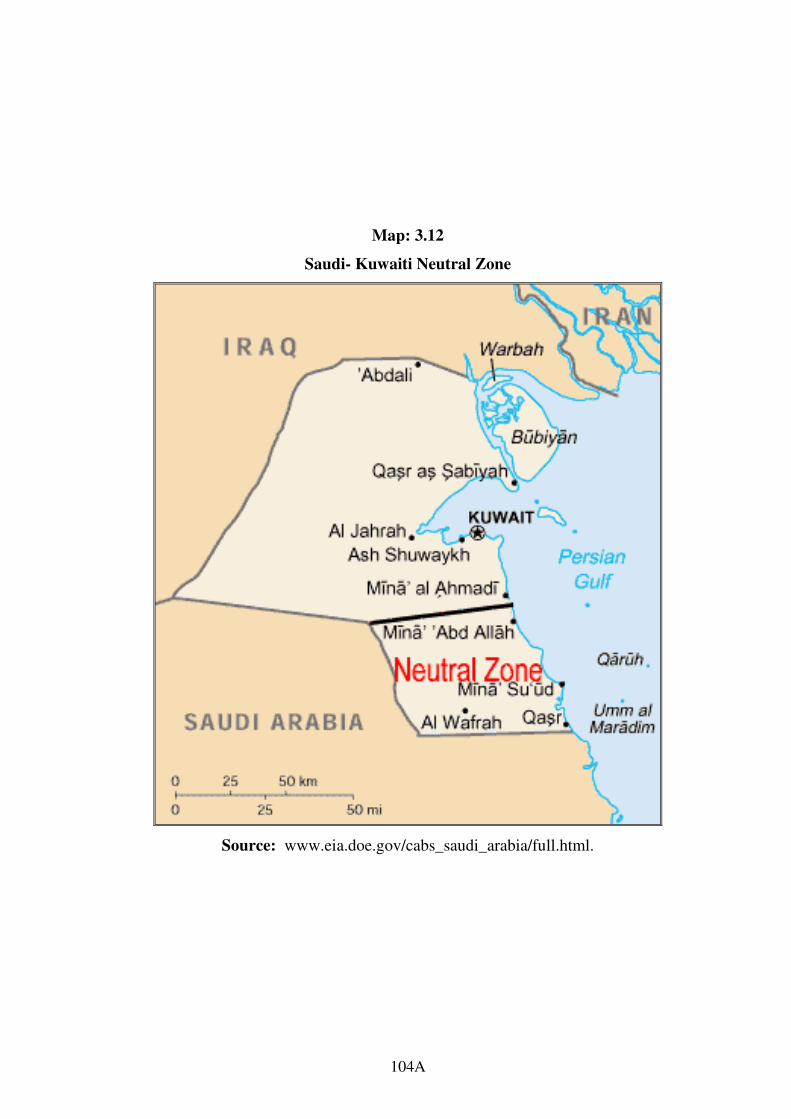
Map: 3.12
Saudi- Kuwaiti Neutral Zone
Source: www.eia.doe.gov/cabs_saudi_arabia/full.html.
104A
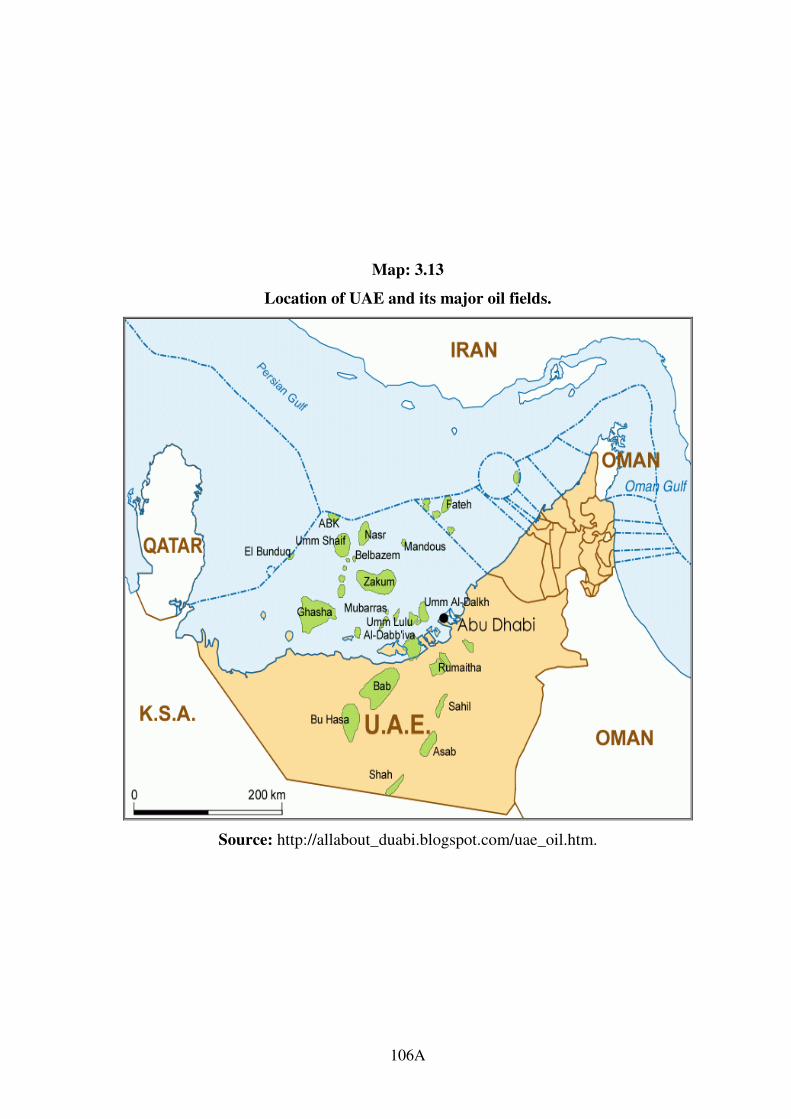
Map: 3.13
Location of UAE and its major oil fields.
Source: http://allabout_duabi.blogspot.com/uae_oil.htm.
106A


![Fields - Statisticsxhou/MAS5312S07/notes.pdfCHAPTER 3 Fields 3.1. Field Extensions Degree of extension. Let F ⊂K be fields. [K : F] := dim F K is called the degree of K over F](https://img.pdfslide.us/doc/110x75/5aa4bca67f8b9a517d8c4e22/fields-xhoumas5312s07notespdfchapter-3-fields-31-field-extensions-degree.jpg)