Embed Size (px)
Citation preview
CHAPTER 3
EXPERIMENTAL SETUP AND PROCEDURE
3.1 Introduction
The process of distillation is frequently used to extract desired component from a
chemical mixture. Among its type, the binary distillation is the process of separation
between two mixtures from a component. This process takes place in a closed
process columns where numbers of trays are placed inside. There are many types of
distillation columns used in the process industry. In continuous distillation columns,
the distillation column continually separates an incoming chemical mixture.
In this chapter, the concept of distillation column and the available process
variables are explained. The concept of a process variable selection in distillation
column is also discussed. The Advanced Process Control (APC) Continuous
Distillation Column pilot plant which has been used for experimental work is
modelled and explained. Plant descriptions and operating conditions are also shown
in tabular form. SI procedure which has been applied for collection of the input –
output data is discussed. The last section of this chapters shows the experimental
input-output results collected from the plant which were used for system
identification.
3.2 Distillation Column Process
Distillation Columns are widely used in industrial applications, especially in gas
plants to make the distillation more efficient. Distillation Columns are specially
designed columns in a tall cylindrical shaped column called as process column. This
38
process column is internally fitted with numbers of trays horizontally to achieve
efficient separation of a liquid feed which is inserted at one or various point of the
process column [43].
There are two types of distillation column which are batch column and continuous
column. For a Batch type distillation column the input feed to the column is
introduced batch-wise. This means that the some amount of input feed is inserted in
the process column, once the distillation process is completed a new fresh feed is sent
for another round of distillation.
Another type of distillation column is the continuous distillation column. In
continuous distillation column the input feed stream is continuously sent in the
process column and the distillation is in continuous process. No interruption occurs in
the process unless there is a problem in the surrounding process units. Continuous
distillation columns are the most common type of distillation column. Continuous
distillation column can be further classified into two: Binary and Multi-component. In
Binary process, the input feed contains only two components whereas in multi-
component feed contains more than two components [44]. In this work, the study is
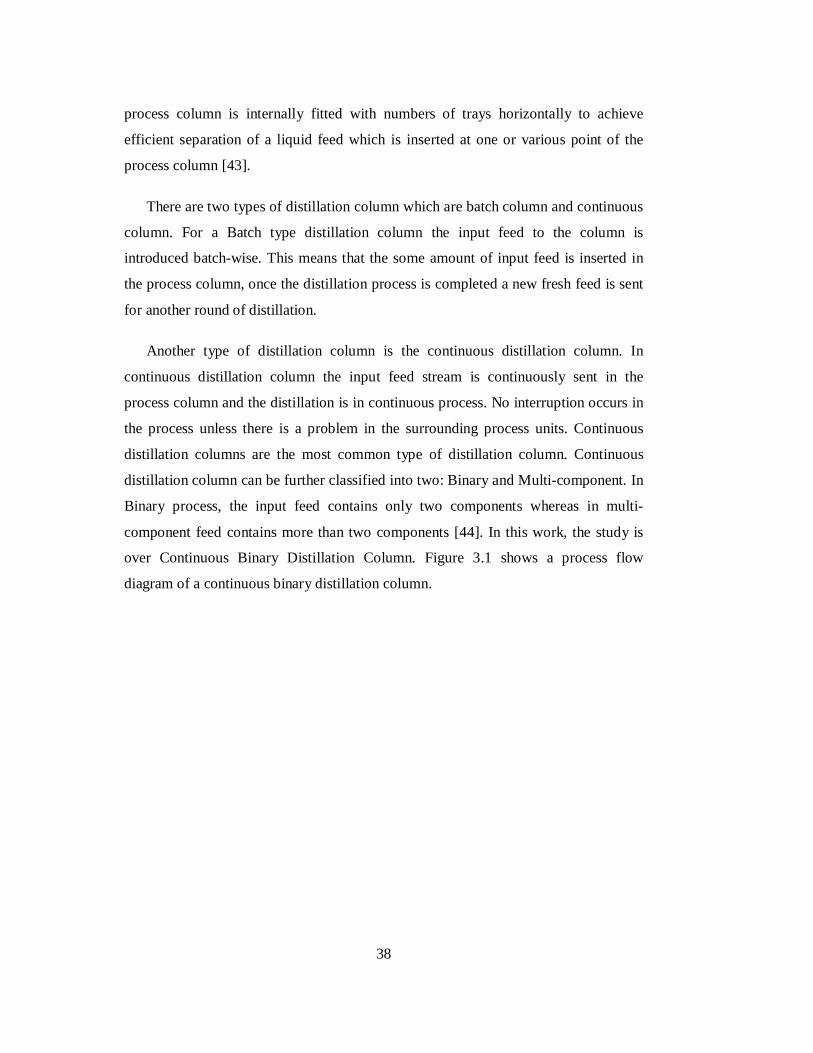
over Continuous Binary Distillation Column. Figure 3.1 shows a process flow
diagram of a continuous binary distillation column.
39
Figure 3.1: Process Flow Diagram of Distillation Column.
As shown in Figure 3.1, a continuous binary distillation column is divided into
five parts which are the reflux, the rectifying section, the input feed, the stripping
section and the rebolier. In the reflux is the condensed vapour collected from the top
of the process column which is collected as the top product and also been recycled
back to the column. The top section of the process column is the rectifying section.
Here the rising vapour from the bottom passing through the trays, contacts the liquid
flowing across them. Input feed point is where the fresh input feed is coming into the
column.
Near the bottom of the process column is the reboiler. In this section the liquid is
reheated or turned into vapour phase and feedback to the process column. At the
40
bottom of the process column is called the stripping section. Here the reheated liquid
in vapour form rises upward through the trays and contacts the down flowing liquid.
The operational process is as a binary mixture of liquid feed enters at one or more
points in the process column which contains a series of stacked trays. The liquid flows
over the plates and moves down the column. The liquid flowing over the plates comes
in contact number of times with the vapour moving upwards. This is the most
essential process in the distillation column. The bottom of the distillation column
consists of a large volume of higher boiling point liquid. Some of the liquid flow is
vaporized and fed back to the column and some are collected as the output product.
This is the boil up process. Vapour at the top of the process column is stored in a
condenser in liquid form. Ratio of the liquid is sent back into the process column
which is known as the reflux and the remaining is the top collected distillate product
[46].
3.2.1 Process Variables in Distillation Column
When a process plant is designed there are always some objectives to be considered.
In the view of process control system, there are seven control objectives which are the
followings:-
Safety
Environment Protection
Equipment Protection
Smooth operation and production rate
Product Quality
Profit
Monitoring and Diagnostic
41
Process variables in a distillation column like temperature, pressure, flowrates and
compositions should be monitored and controlled. These process variables inside
distillation system affects one another, whereby a change in one process variables will
result changes in other process variables. Therefore for controlling a distillation
column, it is necessary for looking to all the variables but not only focusing to one
variable. Each of the process variables has its own control loop and each of these
control loops keeps track of the associated process variables.
3.2.2 Control & Manipulated Variable Selection for Distillation Column
Pressure is often considered as the prime distillation column variable, as it affects
temperature, condensation, vaporization, composition, volatilities and almost any
other process that takes place inside the column. Column pressure control is often
integrated with the condenser control system. Increasing or decreasing the water flow
rate will change the temperature of the condensing in the column. This in turn
changes the pressure in the column [45].
Temperature is one of the important variables to be controlled in the process
column. Online analyzers are rarely used for measuring the composition of the top
and bottom of the product. This is because of its installation cost is very high.
Composition if often regulated indirectly using temperature (at constant pressure in
the column, there is a direct relationship of the temperature and composition for a
binary mixture) [46].
Top product composition is regulated by adjusting the reflux flow and for bottom
product composition the vapour flow is adjusted. Product composition can be
controlled by fixing the process columns temperature. The top temperature controller
manipulates the reflux flow and the bottom temperature manipulates the steam flow.
The advantage of this control scheme is that it has a faster closed loop response and
provides a better disturbance rejection [47].
42
3.2.2.1 Single Product Control
In this control strategy, the composition of one product is controlled while the
composition of the other product is allowed to change. 90% of the distillation columns
in industries are in use of single product control strategy instead of dual composition
control, in which the top and bottom product compositions are controlled.
It is easy to use single composition control than dual composition control. The
selection between single and dual composition control depends on the tradeoffs
between the supplementary cost related with dual composition (maintenance for the
controllers, analyzers cost, additional instrument costs, etc) and the financial
advantage of dual composition (a rise in product recovery and reducing service costs)
[49]. Moreover single composition control are mostly used for multiple staged
distillation columns where the top product is collected and the bottom product is sent
to another process column connected in series for further distillation process while
dual composition are mostly used in binary distillation processes.
3.2.2.2 Dual Product Control
Dual product control configuration is mostly applied in binary distillation columns
where the top and bottom product requires its independent control loop. The choice of
the proper configuration for dual product control is a more difficult problem than for
single product control because there are more feasible approaches and the analysis of
performance is more complex. The most commonly used control configuration is the
reflux/steam configuration because it provides good dynamic response, it is the least
sensitive to feed disturbances and is the easiest to implement [49].
On the other hand, the reflux/top and vapour/bottom configuration is in general the
least affected by disturbance and has good dynamic response but still there is no clear
choice for the best configuration for dual composition control of distillation columns.
For the cases when the overhead product is more important, reflux flow control is
usually the best to be used. When the bottoms product is more important, steam flow
is proper to be controlled [49].
43
Experimental work has been carried out for constant feed rate and feed
composition intended for variation in reflux flow and steam flow. The pressure in the
column is maintained at a constant value of 1 bar by controlling the cooling water
flow rate to the condenser placed at the top side of the column. The liquid levels in the
reflux drum and bottom of the process column are controlled by changing the flow
rates of top and bottom product. The reflux and steam flow rates are varied by
changing the set points value of the respective controllers in a PRBS sequence. In this
study, for system identification the signals of the reflux flow rate (FR) and steam flow
rate (FST) controllers are used as the input data where as the temperature signals
measured at tray 1 (T1) and tray 14 (T14) are taken as the output signals.
The inputs to the distillation column considered are the incoming reflux flow rate
(U1) and the steam flow rate at the reboiler (U2). The outputs are the process column
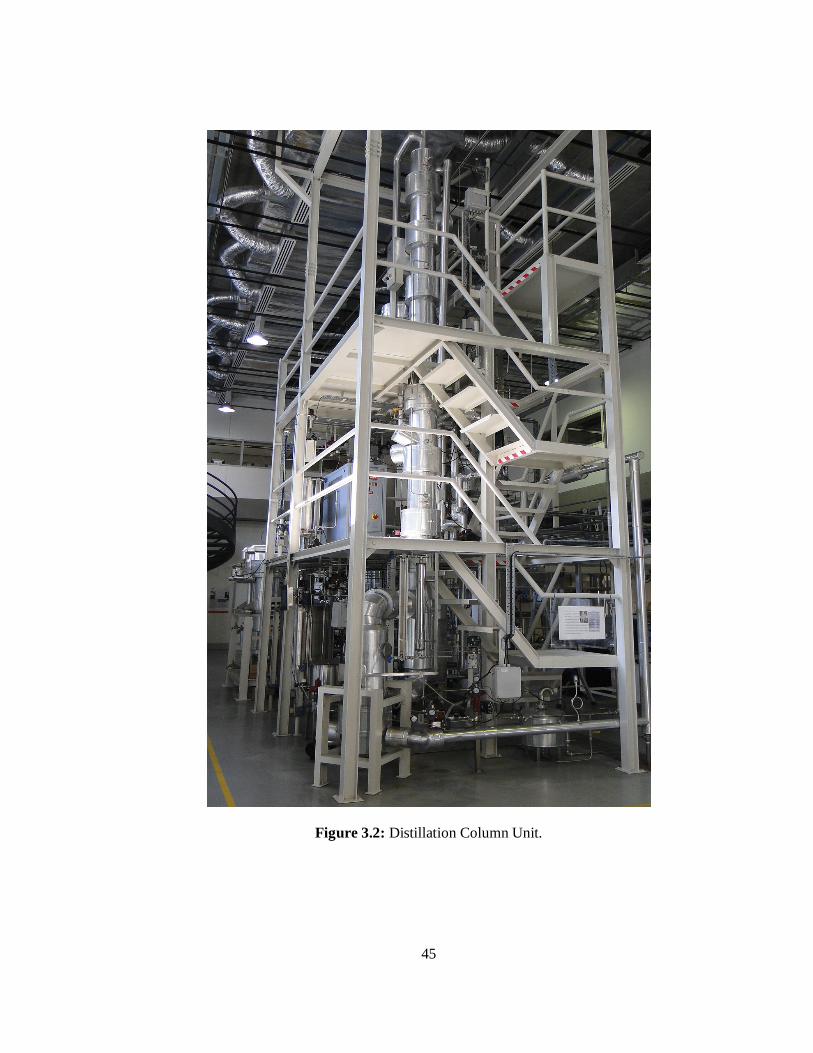
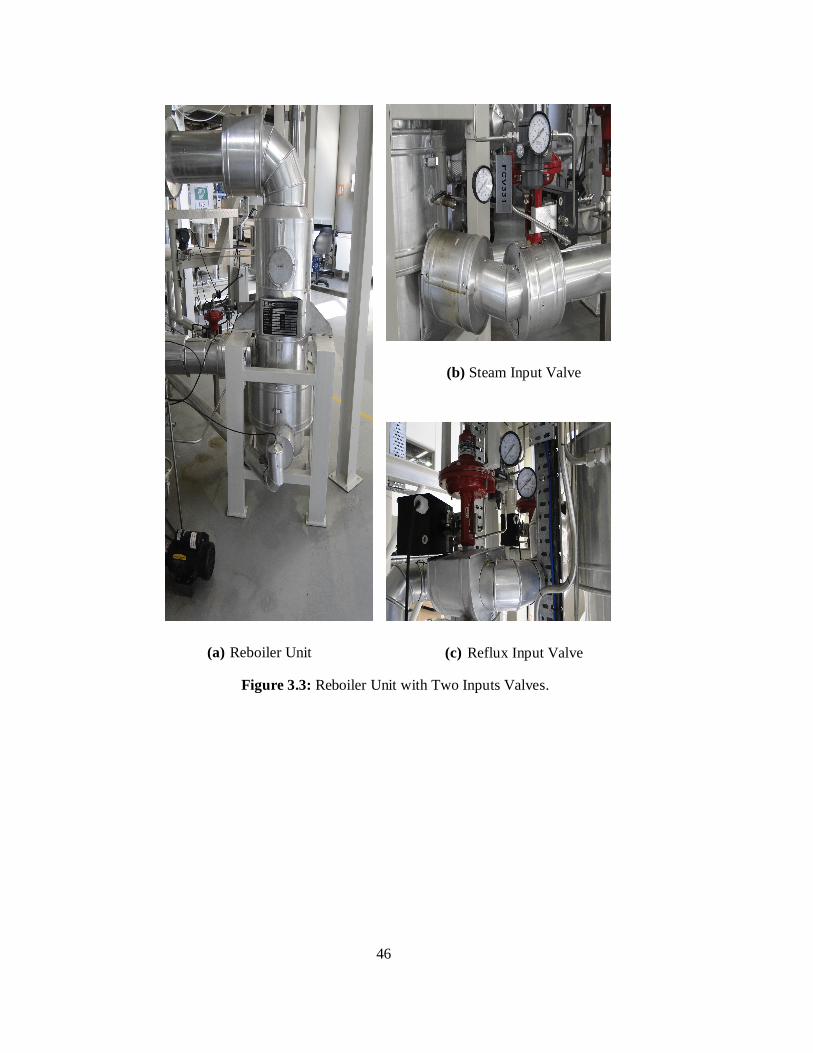
top temperature (Y1) and the bottom temperature (Y2). Figure 3.2 and Figure 3.3
shows the overall pilot plant (continuous binary distillation column) used for this
study.
3.3 Advanced Process Control (APC) Distillation Column Pilot Plant
In this research study, the distillation column being used for experimental data
collection and which is being modelled is a physical pilot plant located in the
Chemical Engineering department of Universiti Teknologi PETRONAS. This
continuous binary distillation column has a total number of 17 stages, considering the
over head as the 1st stage and the reboiler located at the bottom of the column as the
17th stage. The feed to the column is at the 7th tray counting from the top. The feed to
the tank is a mixture of Isopropyl Alcohol (IPA) and Acetone, while the outputs are
the separation of both the IPA and the acetone concentration. Acetone is being
collected as the top product and IPA being collected as the bottom product. Sampling
points along with RTD sensors are available at every tray location, flow meters are
installed in all flow lines such as the feed line and products steam lines and the reflux
line. Differential pressure measuring devices are connected across the stripping and
rectifying section of the process column and a pressure sensor on the top of the
44
column. Suitable sized control valves are connected in all flow lines. A Distributed
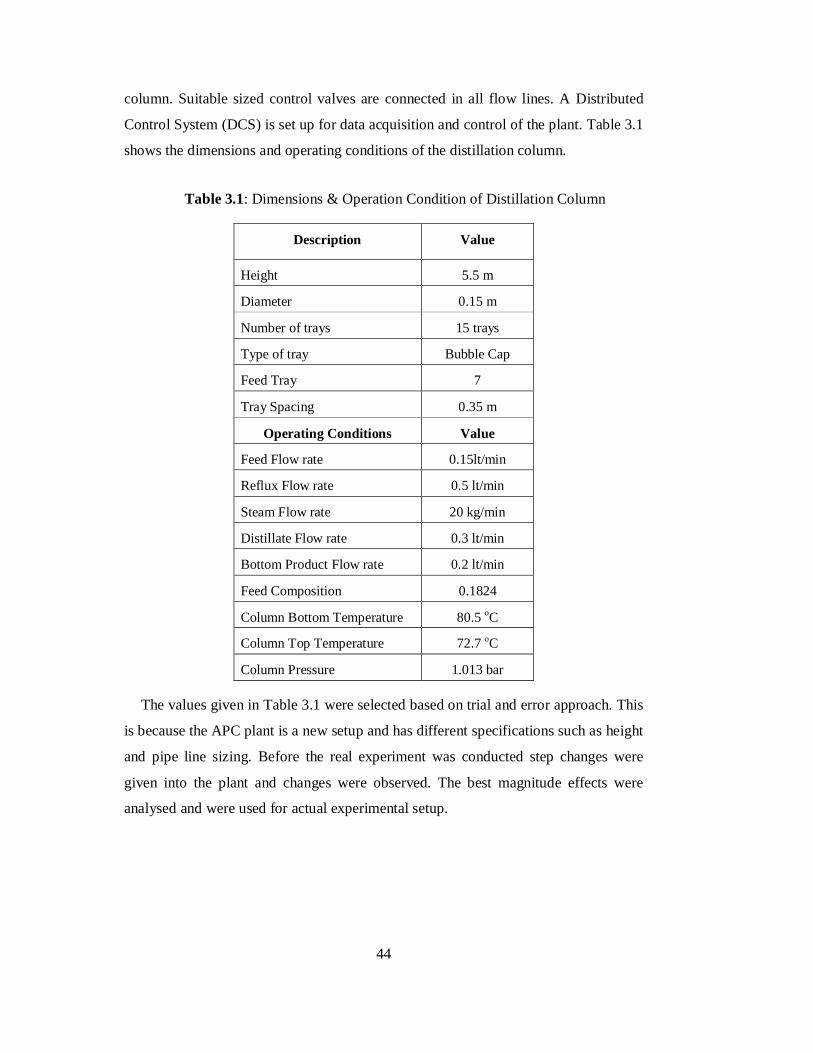
Control System (DCS) is set up for data acquisition and control of the plant. Table 3.1
shows the dimensions and operating conditions of the distillation column.
Table 3.1: Dimensions & Operation Condition of Distillation Column
Description Value
Height 5.5 m
Diameter 0.15 m
Number of trays 15 trays
Type of tray Bubble Cap
Feed Tray 7
Tray Spacing 0.35 m
Operating Conditions Value
Feed Flow rate 0.15lt/min
Reflux Flow rate 0.5 lt/min
Steam Flow rate 20 kg/min
Distillate Flow rate 0.3 lt/min
Bottom Product Flow rate 0.2 lt/min
Feed Composition 0.1824
Column Bottom Temperature 80.5 oC
Column Top Temperature 72.7 oC
Column Pressure 1.013 bar
The values given in Table 3.1 were selected based on trial and error approach. This
is because the APC plant is a new setup and has different specifications such as height
and pipe line sizing. Before the real experiment was conducted step changes were
given into the plant and changes were observed. The best magnitude effects were
analysed and were used for actual experimental setup.
45
Figure 3.2: Distillation Column Unit.
46
(a) Reboiler Unit
(b) Steam Input Valve
(c) Reflux Input Valve
Figure 3.3: Reboiler Unit with Two Inputs Valves.
47
3.4 System Identification Experiment over APC Distillation Column
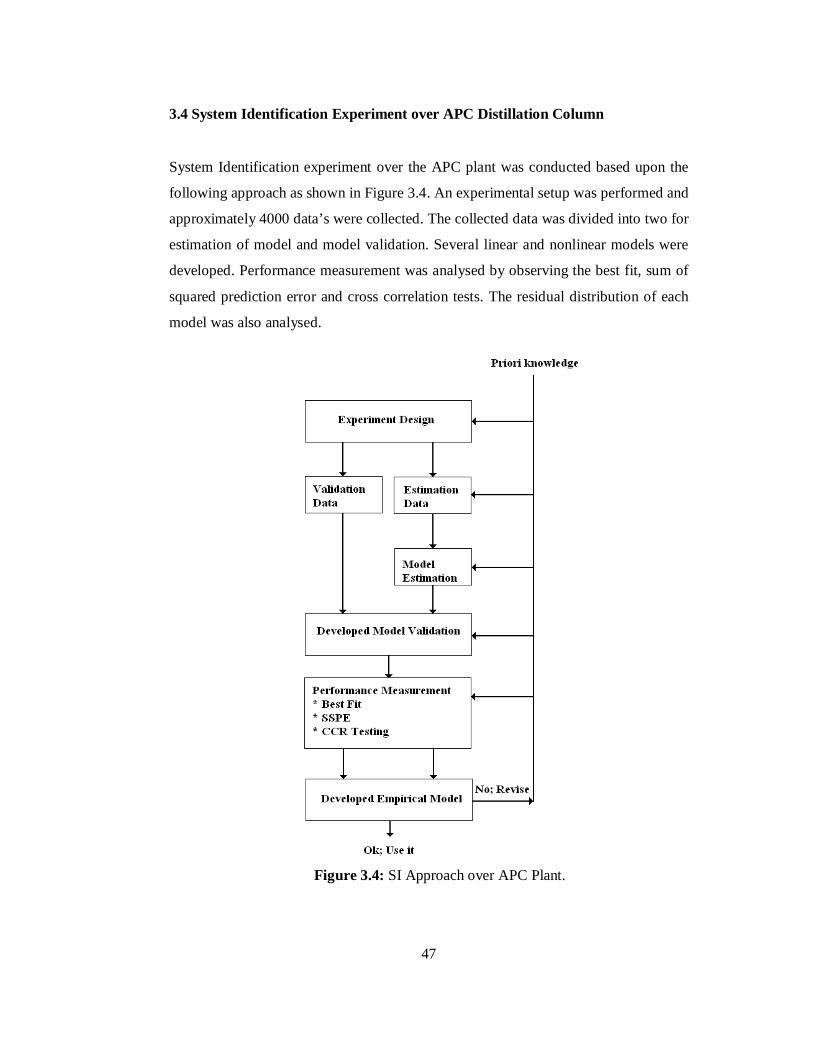
System Identification experiment over the APC plant was conducted based upon the
following approach as shown in Figure 3.4. An experimental setup was performed and
approximately 4000 data’s were collected. The collected data was divided into two for
estimation of model and model validation. Several linear and nonlinear models were
developed. Performance measurement was analysed by observing the best fit, sum of
squared prediction error and cross correlation tests. The residual distribution of each
model was also analysed.
Figure 3.4: SI Approach over APC Plant.
48
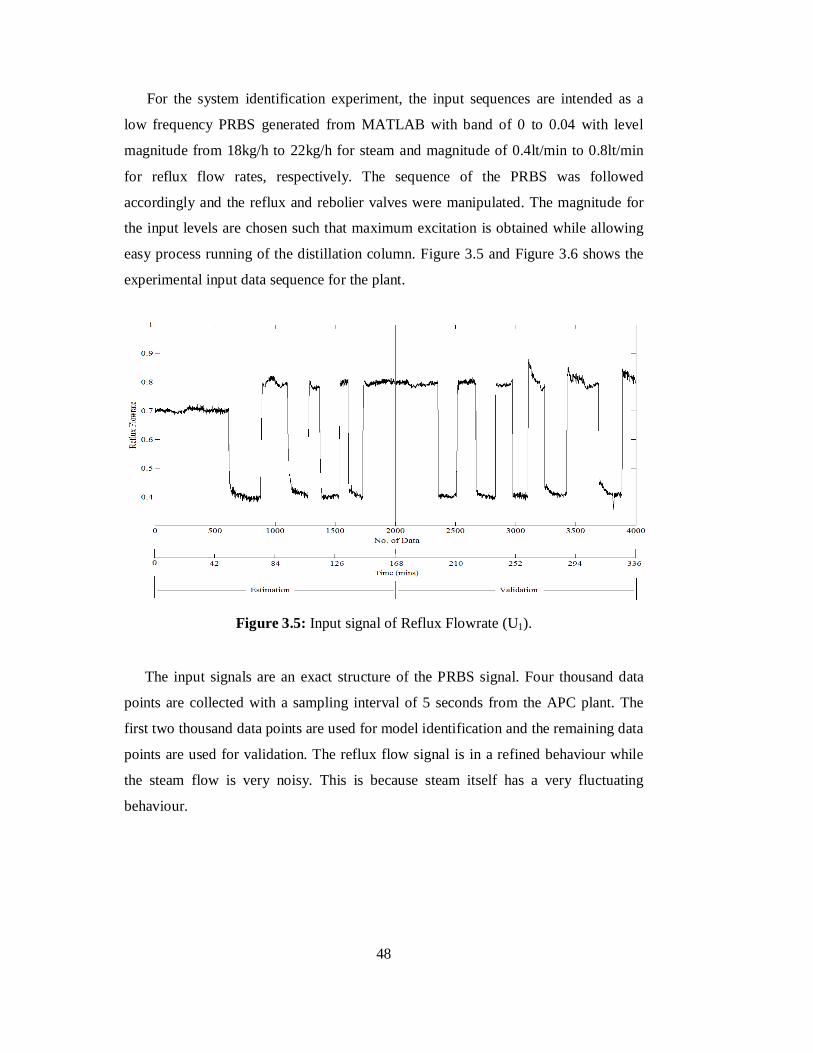
For the system identification experiment, the input sequences are intended as a
low frequency PRBS generated from MATLAB with band of 0 to 0.04 with level
magnitude from 18kg/h to 22kg/h for steam and magnitude of 0.4lt/min to 0.8lt/min
for reflux flow rates, respectively. The sequence of the PRBS was followed
accordingly and the reflux and rebolier valves were manipulated. The magnitude for
the input levels are chosen such that maximum excitation is obtained while allowing
easy process running of the distillation column. Figure 3.5 and Figure 3.6 shows the
experimental input data sequence for the plant.
Figure 3.5: Input signal of Reflux Flowrate (U1).
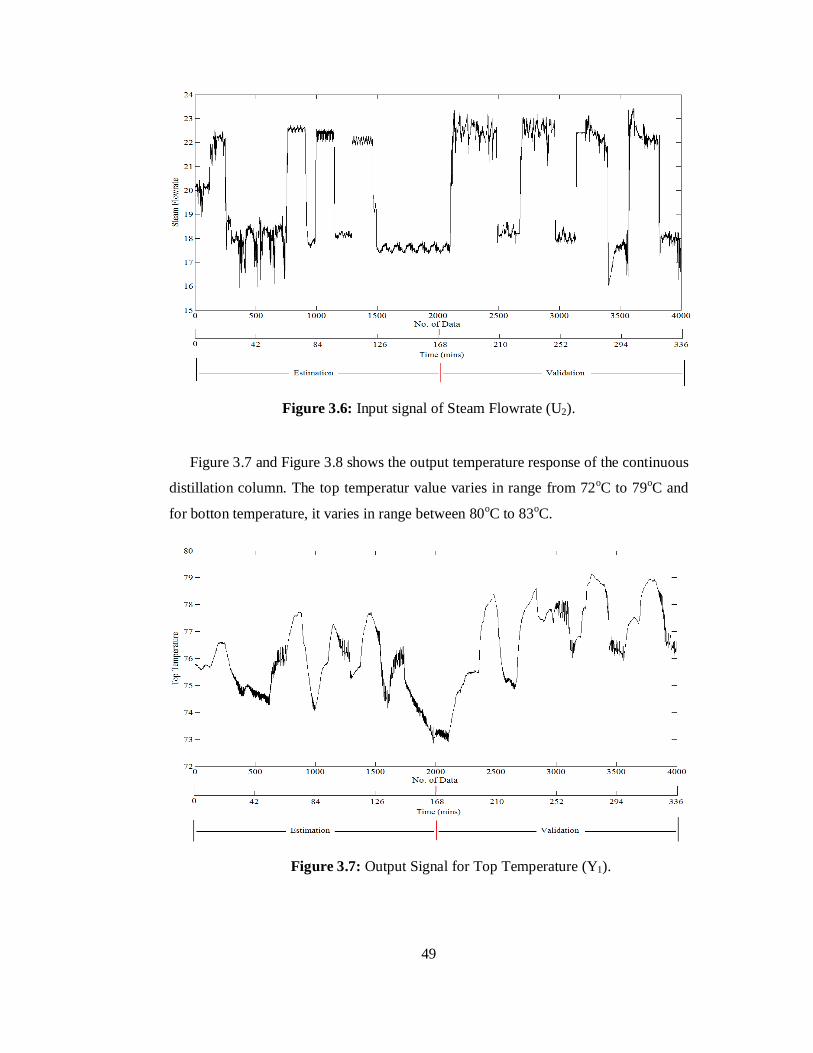
The input signals are an exact structure of the PRBS signal. Four thousand data
points are collected with a sampling interval of 5 seconds from the APC plant. The
first two thousand data points are used for model identification and the remaining data
points are used for validation. The reflux flow signal is in a refined behaviour while
the steam flow is very noisy. This is because steam itself has a very fluctuating
behaviour.
49
Figure 3.6: Input signal of Steam Flowrate (U2).
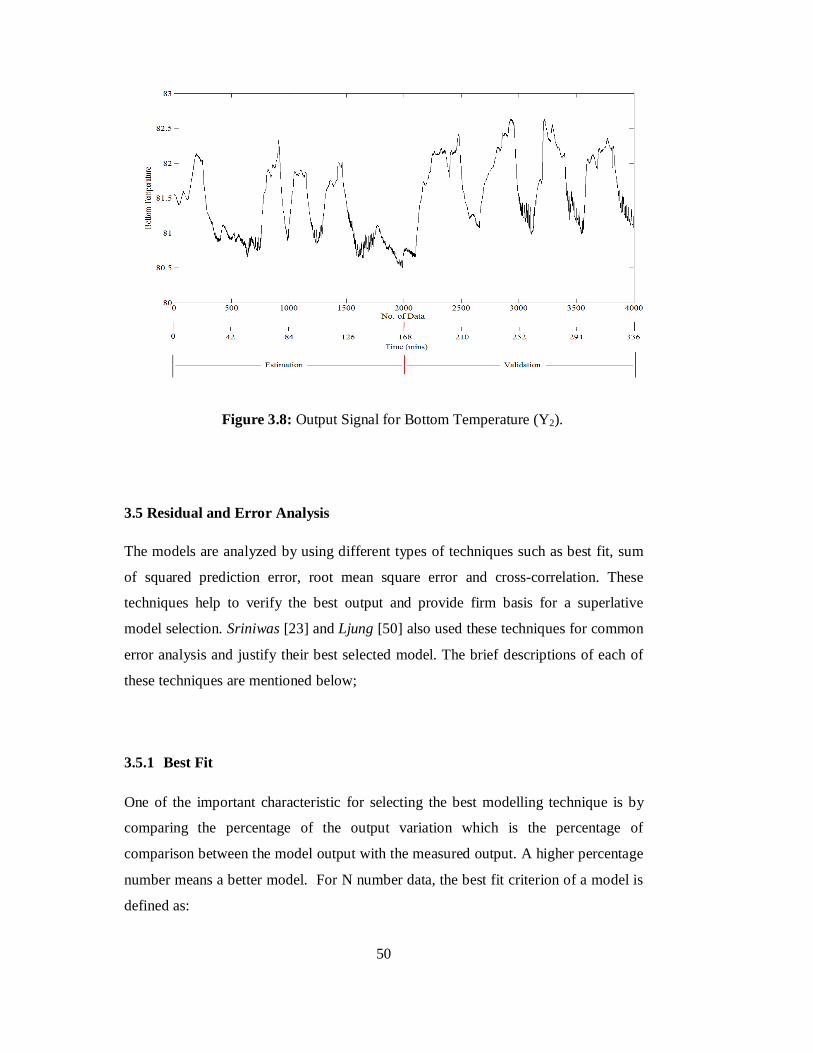
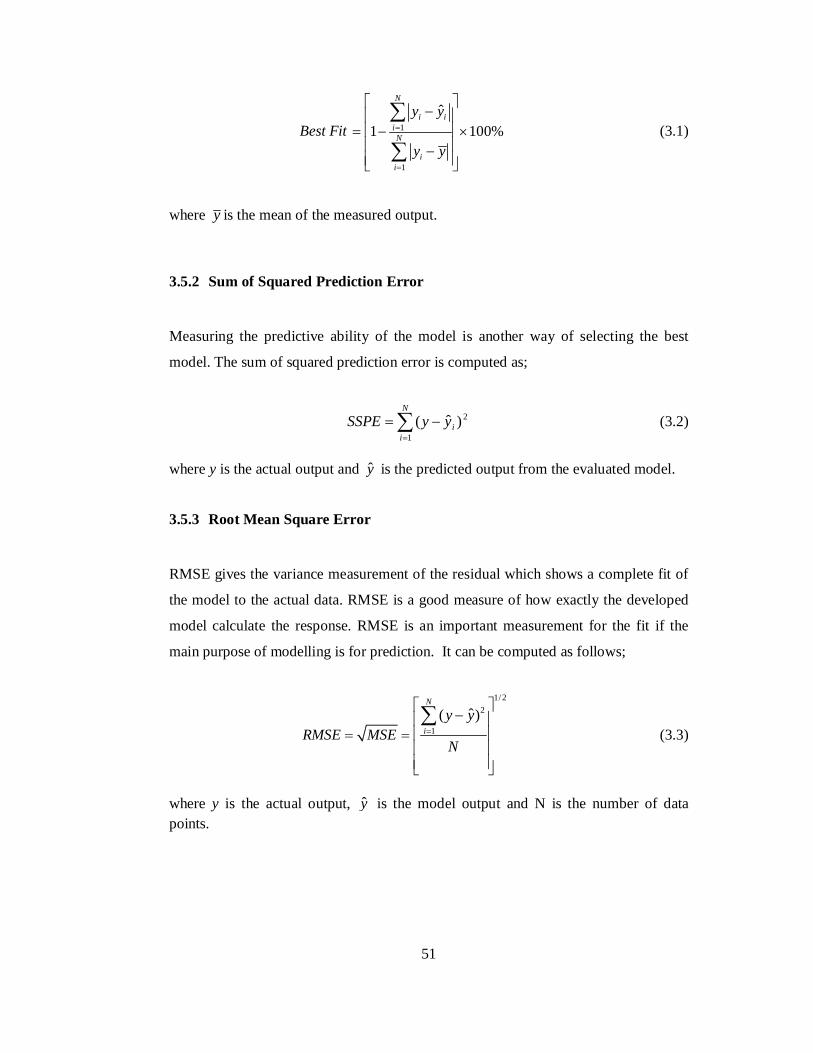
Figure 3.7 and Figure 3.8 shows the output temperature response of the continuous
distillation column. The top temperatur value varies in range from 72oC to 79oC and
for botton temperature, it varies in range between 80oC to 83oC.
Figure 3.7: Output Signal for Top Temperature (Y1).
50
Figure 3.8: Output Signal for Bottom Temperature (Y2).
3.5 Residual and Error Analysis
The models are analyzed by using different types of techniques such as best fit, sum
of squared prediction error, root mean square error and cross-correlation. These
techniques help to verify the best output and provide firm basis for a superlative
model selection. Sriniwas [23] and Ljung [50] also used these techniques for common
error analysis and justify their best selected model. The brief descriptions of each of
these techniques are mentioned below;
3.5.1 Best Fit
One of the important characteristic for selecting the best modelling technique is by
comparing the percentage of the output variation which is the percentage of
comparison between the model output with the measured output. A higher percentage
number means a better model. For N number data, the best fit criterion of a model is
defined as:
51
Best Fit 1
1
ˆ1 100%
N
i iiN
ii
y y
y y
(3.1)
where y is the mean of the measured output.
3.5.2 Sum of Squared Prediction Error
Measuring the predictive ability of the model is another way of selecting the best
model. The sum of squared prediction error is computed as;
N
iiyySSPE
1
2)ˆ( (3.2)
where y is the actual output and y is the predicted output from the evaluated model.
3.5.3 Root Mean Square Error
RMSE gives the variance measurement of the residual which shows a complete fit of
the model to the actual data. RMSE is a good measure of how exactly the developed
model calculate the response. RMSE is an important measurement for the fit if the
main purpose of modelling is for prediction. It can be computed as follows;
1/ 22
1
ˆ( )N
iy y
RMSE MSEN
(3.3)
where y is the actual output, y is the model output and N is the number of data points.
52
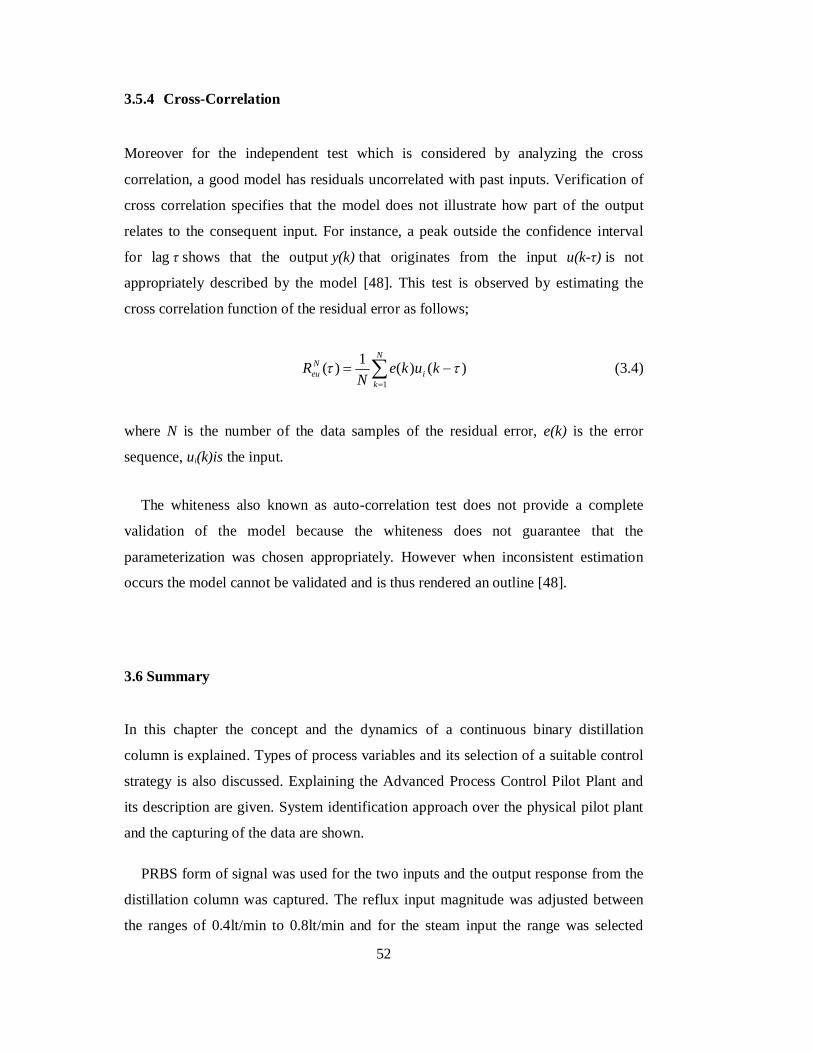
3.5.4 Cross-Correlation
Moreover for the independent test which is considered by analyzing the cross
correlation, a good model has residuals uncorrelated with past inputs. Verification of
cross correlation specifies that the model does not illustrate how part of the output
relates to the consequent input. For instance, a peak outside the confidence interval
for lag τ shows that the output y(k) that originates from the input u(k-τ) is not
appropriately described by the model [48]. This test is observed by estimating the
cross correlation function of the residual error as follows;
N
ki
Neu kuke
NR
1
)()(1)( (3.4)
where N is the number of the data samples of the residual error, e(k) is the error
sequence, ui(k)is the input.
The whiteness also known as auto-correlation test does not provide a complete
validation of the model because the whiteness does not guarantee that the
parameterization was chosen appropriately. However when inconsistent estimation
occurs the model cannot be validated and is thus rendered an outline [48].
3.6 Summary
In this chapter the concept and the dynamics of a continuous binary distillation
column is explained. Types of process variables and its selection of a suitable control
strategy is also discussed. Explaining the Advanced Process Control Pilot Plant and
its description are given. System identification approach over the physical pilot plant
and the capturing of the data are shown.
PRBS form of signal was used for the two inputs and the output response from the
distillation column was captured. The reflux input magnitude was adjusted between
the ranges of 0.4lt/min to 0.8lt/min and for the steam input the range was selected
53
between 18kg/hr to 22kg/hr. Maximum excitation of the process was observed under
smooth operation of the process column. The PRBS signal used as inputs showed a
significant output observation for the top and bottom temperature of the process
column. Four thousand data was captured from the process and are used for
identification. Two thousand data are used for model estimation and the rest for model
validation. Linear and Nonlinear models are developed using the real data collected
from the plant which are discussed in chapter 4 and chapter 5.