Embed Size (px)
Citation preview

1
INTU PROPERTIES PLC (Registration number UK3685527) ISIN Code: GB0006834344
JSE Code: ITU 28 FEBRUARY 2014
INTU PROPERTIES PLC AUDITED RESULTS FOR THE YEAR ENDED 31 DECEMBER 2013 David Fischel, Chief Executive of Intu Properties plc, commented “Intu advanced significantly in 2013 with a rebranding, strategic acquisitions, debt refinancing, equity issuance and key planning consents for our £1.2 billion development programme. The benefits to customers, retailers and staff from our rebranding as intu have surpassed our expectations. Successful multi-channel retailers continue to regard flagship stores in the larger super-regional and major city centres as core to their overall business. With the economy appearing to improve and total profit for the year including revaluations increased from £159 million to £364 million, we are prepared to withstand some minor reduction in like-for-like net rental income in the short term as we continue to invest in our centres to drive their total returns through our robust asset management approach, tenant mix repositioning and development projects.” Enquiries: Intu Properties plc David Fischel Chief Executive +44 (0)20 7960 1207 Matthew Roberts Finance Director +44 (0)20 7960 1353 Kate Bowyer Business Relations Director +44 (0)20 7960 1250 Public relations UK: Michael Sandler/Wendy Baker, Hudson Sandler +44 (0)20 7796 4133 SA: Frédéric Cornet/Nick Williams, Instinctif Partners +27 (0)11 447 3030 A presentation to analysts and investors will take place at UBS, 1 Finsbury Avenue, London EC2 at 09.30GMT on 28 February 2014. The presentation will also be available to international analysts and investors through a live audio call and webcast. The presentation will be available on the Group’s website intugroup.co.uk. A copy of this announcement is available for download from our website intugroup.co.uk. Contents: Page 2013 Highlights 3 Chairman’s Statement 4 Chief Executive’s Review 6 Financial Review 16 Key Risks and Uncertainties 22 Top Properties 24 Statement of Directors’ Responsibilities 26 Financial Information 27 Investment and Development Property 49 Financial Covenants 50 Underlying Profit Statement 52 Glossary 53 Dividends 56
Press ReleasePress ReleasePress ReleasePress Release

2
NOTES TO EDITORS Intu Properties plc (formerly Capital Shopping Centres Group PLC) is the UK’s leading developer, owner and manager of prime regional shopping centres. Intu owns and operates some of the best shopping centres, in some of the strongest locations right across the UK including ten of the UK’s top 25 and one of the top centres in Spain. With 18 million sq. ft. of retail, catering and leisure space, valued at £7.6 billion at the end of 2013, our centres attract around 350 million customer visits a year and two thirds of the UK population live within a 45 minute drive time of one of our centres. At the forefront of UK shopping centre evolution since the 1970s our focus is on creating compelling destinations for consumers, with added theatre. In 2013 we launched our nationwide consumer facing shopping centre brand – intu – transforming our customer experience and digital proposition including a transactional website, with a view to providing the UK’s leading shopping centre experience both on and offline. Intu has a UK development pipeline of £1.2 billion over the next ten years on active management projects at most of our centres and major extensions. Funding for this programme will include recycling of existing assets including possible disposals and introduction of partners. Intu also has interests outside the UK comprising an effective interest of 9 per cent in Equity One, a US retail REIT, a 32 per cent interest in Prozone, an Indian shopping centre developer, a joint venture in Spain for predevelopment activity on three major sites under option in Malaga, Valencia and Vigo and a joint partnership interest in a regional shopping centre in Oviedo, Northern Spain. Over 80,000 people are employed at our centres across the UK and we are fully committed to supporting our local communities and the wider environment through meaningful and hands-on initiatives.
This press release contains “forward-looking statements” regarding the belief or current expectations of Intu Properties plc, its Directors and other members of its senior management about Intu Properties plc’s businesses, financial performance and results of operations. These forward-looking statements are not guarantees of future performance. Rather, they are based on current views and assumptions and involve known and unknown risks, uncertainties and other factors, many of which are outside the control of Intu Properties plc and are difficult to predict, that may cause actual results, performance or developments to differ materially from any future results, performance or developments expressed or implied by the forward-looking statements. These forward-looking statements speak only as at the date of this press release. Except as required by applicable law, Intu Properties plc makes no representation or warranty in relation to them and expressly disclaims any obligation to update or revise any forward-looking statements contained herein to reflect any change in Intu Properties plc’s expectations with regard thereto or any change in events, conditions or circumstances on which any such statement is based. Any information contained in this press release on the price at which shares or other securities in Intu Properties plc have been bought or sold in the past, or on the yield on such shares or other securities, should not be relied upon as a guide to future performance.

3
2013 HIGHLIGHTS Robust asset management approach, focused on medium-term total property return
• high occupancy at 95 per cent • signed 201 long-term leases for £42 million new annual rent at an average 4 per cent above previous passing rent • encouraging tenant investment in stores - £70 million in 2013
Financial performance affected by repositioning
• underlying earnings per share 15.0 pence (2012 – 16.1 pence) reflecting £10 million impact of tenants who entered administration in late 2012 and early 2013
• property valuations increased 1.8 per cent, comparing favourably with IPD index which increased 0.8 per cent • total property return 7.3 per cent (2012 – 6.0 per cent) • net asset value per share (diluted, adjusted) reduced by 12 pence including reduction of 15 pence from early
termination of interest rate swaps and 7 pence dilution from equity placing Growth from acquisitions in UK and Spain with substantial organic development pipeline
• development pipeline now amounts to £1.2 billion programme over 10 years • representing some 2.6 million sq. ft. of new retail, restaurants and leisure of which 1.8 million sq. ft. (£0.7 billion) has
planning approval • funding will include recycling of existing assets including possible disposals and introduction of partners
Transformed debt structure
• £1.8 billion refinanced through bond issues and new bank facilities • achieved 40 basis points reduction in average cost of debt to 4.8 per cent and 2 year increase in weighted average
maturity to 8 years • cash, short-term investments and committed facilities of £325 million at 31 December 2013; £110 million further debt
raised 2014 to date Launched nationwide consumer-facing brand and digital proposition
• customer experience improved, with strong take-up of free Wi-Fi following installation of high capacity fibre-optic networks at nine centres; Intu owns platform and resulting data
• previously out-sourced facilities management and customer-facing teams brought in-house; all employees trained in World Class Service
• single brand for company and shopping centres bringing operating efficiencies and nationwide business opportunities
Financial highlights 1
Twelve months ended 31 December
2013 2012
Net rental income (£m) 370 363
Underlying earnings (£m) 140 138
Property revaluation surplus (£m) 126 41
Profit for the year (£m) 364 159
Underlying EPS (pence) 15.0 16.1
Dividend per share (pence) 15.0 15.0
As at 31 December
2013 2012
Market value of investment properties (£m) 7,624 7,073
Net external debt (£m) 3,698 3,504
NAV per share (diluted, adjusted) (pence) 380 392
Debt to assets ratio (per cent) 48.5 49.5
1 Please refer to glossary for definition of terms

4
CHAIRMAN’S STATEMENT
Introduction A year ago, following our announcement of the new brand and digital initiatives, I commented that we were at the beginning of a new phase in the Group’s life, with our market leadership position in the sector providing many opportunities for growth, both organically and by acquisition. Since then we have oriented the business around the principle that improved customer experience driven by motivated customer service attracting leading retailers is a powerful virtuous circle creating value for our shareholders, employees, communities and partners. Overview of 2013 activity I am delighted that the cultural change throughout the Group has exceeded all expectations – as have other changes associated with our brand. These include new signage, information desks and uniforms, World Class Service training, transfers of employment to Intu Retail Services, free Wi-Fi, the launch of an online business, the formation of intu Experiences for promotional activities and national marketing campaigns. We have only just begun to realise the full potential of our national consumer brand. But that was far from all we achieved in 2013. We acquired a great centre, Midsummer Place, Milton Keynes, filling a gap in our national coverage. We strengthened our financial position by raising equity and as capital markets improved we successfully refinanced, ahead of time and on a long-term basis, tranches of borrowings coming due between 2015 and 2017. We appreciate the commitment of our shareholders and lenders. Our asset management and development teams have been exceptionally busy, signing up new tenants, dealing with lease expiries, lodging planning applications and getting capital projects underway. We have plans for every centre. For example, we are on site transforming the malls at intu Eldon Square, remodelling the intu Lakeside food court, refurbishing intu Victoria Centre and reinvigorating what we now call Platinum Mall at intu Metrocentre. Major projects not yet on site, such as the extension of intu Watford into the adjoining Charter Place, are rapidly moving forward. Internationally, the highlight was the acquisition of a leading Spanish centre, Parque Principado, Oviedo, with a top quality partner, Canada Pension Plan Investment Board. 2013 financial performance As discussed in the Chief Executive’s Review, the Group’s financial performance for the year reflects some income reduction from tenant failures but robust valuations contributed to a healthy total property return. Looking forward Thinking ahead, how we combine retail, catering and leisure, how we adapt to the digital and smart phone era, how we take our brand forward, how we keep our centres fresh and appealing to customers, the next steps we take to grow our footprint in the UK regional shopping centre industry – these are the themes which will define our success in the years to come. In that context we will remain focused on achieving strong returns over the medium term from each of our assets individually, including through our significant plans for development, and through their combined power as the only UK national branded network of prime centres. Turning to external factors, it is encouraging to see some signs of recovery, with retailers continuing to address the impact of changing shopping habits on their own business models. In providing customers with fresh experiences in some of the best destinations, we offer retailers compelling opportunities to thrive, driving the total returns from our assets over the long term. Directors and staff I would like to record my thanks to the Board and all our staff for their commitment and dedication to intu’s values and vision in this year of fast-paced change. Further, I would like to welcome the 1,300 employees of Intu Retail Services who joined the Group in July and October 2013. Including expansion in other areas, we now have a team of over 2,000 people delivering our nationwide brand aspirations and values. Our third annual employee survey showed the overwhelming majority of our expanded workforce is enthusiastically supporting the evolution of the Group. On behalf of the Group I would like to thank Rob Rowley, who stepped down from the Board on 18 October 2013 after nine years, and Andrew Huntley and Adèle Anderson, who have taken on the roles of Senior Independent Director and Chairman of the Audit Committee respectively. Corporate responsibility Intu’s award-winning CR programmes reinforce our long-term commitment to sustainable and community-minded business practice in the development and promotion of our shopping centres and I take great personal interest and satisfaction from my involvement in many of our projects.

5
In 2013 we achieved an impressive seven per cent reduction in carbon emissions, a total of 18 per cent over two years and were awarded Gold in the annual Business in the Community CR Index. Our employees engaged with 12 regional and national community partners to deliver practical help to disadvantaged young people in the communities served by Intu centres and, overall, our projects directly reached almost 2,500 people in 2013. All our projects are subject to thorough evaluation and, as members of the London Benchmarking Group, we carry out an annual appraisal of all our community involvement efforts to ensure a close fit with the core goals of our business. Dividends The Directors are recommending a final dividend of 10.0 pence per share bringing the amount paid and payable in respect of 2013 to 15.0 pence, unchanged from 2012. A scrip dividend alternative will be offered. Details of the apportionment between the PID and non-PID elements per share will be confirmed in due course as the cash dividend is likely to be partly PID and partly non-PID and the scrip alternative wholly non-PID. Responsible corporate behaviour and high quality service are key underlying values which inform our approach to every aspect of our affairs. We take very seriously our responsibility as a good corporate citizen. Our staff work hard to provide real benefit to our customers, partners and the wider communities in which we are based. We know people like to deal with companies they can trust so, as well as intangible benefits, this approach reinforces our ability to provide real returns to our shareholders in the long term. Patrick Burgess Chairman 28 February 2014

6
CHIEF EXECUTIVE’S REVIEW INTRODUCTION Overview of 2013 activity Intu has moved forward markedly in the year with a high level of activity and dynamism. The cultural change we instigated as part of our rebranding has surpassed our expectations, we have reached significant milestones within our project pipeline and we have much improved our financial position with new debt and equity. We end the year better positioned to create long-term value through the opportunities afforded by the changing retail landscape. Significantly, we have:
• secured 30 planning consents, including for major extensions at intu Watford and intu Lakeside. Altogether 1.8 million sq. ft. (£0.7 billion) of the 2.6 million sq. ft. pipeline is now consented, over half of which is catering and leisure
• reached agreement with Nottingham City Council setting the way forward for intu Victoria Centre and intu Broadmarsh • made strategic acquisitions in the UK, including filling a gap in our national coverage at Milton Keynes • made a strategic acquisition with a strong partner in Spain, a market with considerable opportunity • refinanced most of the debt falling due in the next three years, reducing the cost of debt and achieving a duration
appropriate for our long-term income stream
• trained our operational and head office staff in World Class Service, initiating a process of cultural change to embed our values in every aspect of operations
• launched free Wi-Fi at more than half of our centres with the remainder imminent, and derived operational and infrastructural efficiencies from the fibre-optic platform
• rolled out our new brand, demonstrating physical change and new experiences to each visitor and the scale of our operations to retailers
A number of the positive actions which we have taken in the year have had the impact of reducing some of the 2013 headline financial measures. Total property return was a healthy 7.3 per cent supported by robust valuations particularly for our super-regional centres. Net asset value per share reduced by three per cent largely as a result of costs associated with reorganising our debt structure and the equity raising for the acquisition of Midsummer Place in which many of our major shareholders participated. Total financial return was one per cent. Good operational progress in the form of lettings was disappointingly masked in terms of earnings by the cost of tenants who entered administration in late 2012 and in early 2013. We continue to take a robust line to ensure that we achieve the right rental level for our prime product and we are prepared to withstand some short-term reduction in earnings as we continue to improve our centres. While we would prefer to see unbroken positive trends, we remain confident of our strategy for the medium- and long-term performance of our assets and that the underlying business remains on course. Outlook and priorities for 2014 We are encouraged that the UK economy has continued to recover during 2013. While household purchasing power remains stretched, there are signs of returning consumer confidence and increasing appetite for lending. Well configured space in the best shopping centres such as Intu’s will become increasingly important as retail businesses adapt to the challenge of changing shopping habits. Looking forward to 2014, the relative stability of the second half of 2013 has enabled us to prepare for upcoming developments by holding space vacant or on flexible terms to enable a timely start to a number of our projects. Altogether 2.4 per cent of ERV is now held for development, of which around a third is let on short-term leases for flexibility. Additionally the benefit of 2013’s new lettings will be more than offset by the short-term impact of lease expiry concentrations and the residual impact of 2013 tenant failures. We expect the combination of these factors to create a further year of reducing like-for-like net rental income. However, we are confident that our development projects, tenant mix repositioning and effective asset management approach will significantly enhance the long-term total return of the business.

7
We will continue to focus in 2014 on four main goals which, we believe, will result in strong total returns over the medium term: • optimising the performance of our existing assets, through active asset management • driving forward our £1.2 billion investment programme and, where appropriate opportunities arise, considering strategic
acquisitions • continuing to improve our financial flexibility through debt and capital recycling from existing assets including disposals
and possible introduction of partners • reinforcing our brand and digital presence including property management innovation to drive demand for our assets
and create broader commercial value

8
MARKET REVIEW
Investment market The value of UK shopping centre investment transactions in 2013 was well above the previous few years with strong demand pushing yields down. Investor appetite has spread well beyond London with good volumes in several regions. As well as international investors continuing to target the most prime assets, the improvement in macro indicators (see below) has stimulated increased interest in strong secondary assets. Demand from cash-funded investors has been supplemented by a significant improvement during 2013 in the range and depth of debt funding sources to the sector. These have extended to financing assets outside the most prime and should continue to underpin values. Shopping centre development across the UK remains at a fraction of the level of the mid 2000’s, providing limited new supply. Completions in 2013 and the pipeline for 2014 and beyond are focused on extensions and reconfigurations of existing centres.
Occupier market The UK economy showed signs of improvement in 2013, with four quarters of GDP growth and a sharp rebound in consumer confidence towards the end of the year. This has yet to be reflected in any significant increase in UK average household disposable income with the Asda benchmark index showing a rise of 1.8 per cent over the year. Whilst inflation has declined and employment has risen, year-on-year wage growth has fallen to below one per cent. Despite the continued constraints on household finances, consumer spending has been increasing with higher like-for-like non-food retail sales reported by the BRC throughout 2013, aggregating to around two per cent for the year. Retailer administrations continued at an elevated level in the early part of 2013 according to the Centre for Retail Research but reduced in the middle of the year to end slightly lower overall than the high levels of 2012. This trend was reflected in Intu’s portfolio with no significant tenant failures in the second half of 2013 after four per cent of the rent roll entered administration in the first half. The chart below shows a marginal pick up in vacancy across retail property categories in 2013, with notably lower levels in larger centres such as Intu’s.

9
Changing UK retail Our research shows that, with an increasing number of ways to buy products, customers come to shopping centres for much more than just purchasing. As the boundaries between shopping, entertainment and dining become blurred, our visitors want a place to socialise, to be entertained and to discover something new. The top shopping centres, such as Intu’s, are better able to offer this range and so it is no surprise that they are attracting an increasing share of national retail footfall and achieving a lower level of vacancy than small centres. With 12 per cent of retail sales conducted online in the last quarter of 2013 according to estimates, digital technology is an inseparable part of everyday life. Shopping now is browsing, trying, researching, asking opinions through social media, sharing ideas and transacting on and offline, using digital tools to make life easier. In that context, many successful retailers have developed effective on and offline capabilities and are continuing to review their store networks to best suit multi-channel strategies. Physical retailing space in the key destination centres is a core part of many business models, with continued space reductions in less core locations. For example Next, which has successfully converted its Directory business to a strong online offer, has made flagship investments at four Intu centres in 2013 and now occupies 650,000 sq. ft. across the portfolio, a third more than in 2008. Focusing on customer experience, with technology as an enabler With our rebranding in 2013, we have oriented every aspect of our asset management, operational delivery and property development around the customer experience in our centres. Examples of initiatives implemented during the year and in particular the increasing importance of providing catering and leisure options are discussed in Asset management below. Our digital strategy is to help customers to get more from our shopping centres, when they are physically there and when they are not. Digital connectivity is not a separate process, but an integral part of the physical experience, increasing convenience and widening our reach. Our digital initiatives are focused on using technology for example to help with practicalities and with sharing ideas. We chose to invest in a high quality fibre-optic backbone and Wi-Fi network infrastructure, owned rather than out-sourced, seeing it as the heart of our digital strategy. This means we manage the entire customer journey and the data which results from it. With an encouraging 60 per cent of our Wi-Fi registrants “opting in” to receive marketing information, the potential to make targeted offers is significant, with scope for development of a powerful single customer view across multiple interactions with Intu. Our ownership of the platform enables us to sell services to our commercial partners including both use of the infrastructure and marketing opportunities. We are also benefiting from operating synergies and cost savings as elements of building management, lighting and security systems migrate onto the platform. Other initiatives include a transactional website launched during 2013 offering high quality, editorial content which enables us to engage with customers both away from our shopping centres and within them. Its magazine-style content inspires customers and encourages sharing through social media. This offers our retailers around the clock interaction with our customers and vice versa, with the added convenience of click and collect of multiple retailer purchases at one point in our centres. We have also trialled a customer lounge and intend to roll out a concierge-style concept to other centres during 2014.

10
DELIVERING ON OUR STRATEGY 2013 performance: Valuation The aggregate like-for-like market value of our investment property increased by 1.8 per cent in the year, twice that of the IPD monthly index (up 0.8 per cent), with consistent progress in each of the two halves. This contributed to a robust total property return of 7.3 per cent (see Operating metrics below).
The weighted average nominal equivalent yield at 31 December 2013 was 5.79 per cent, a reduction of 15 basis points in the year, reflecting market conditions and our ongoing asset management initiatives maintaining the prime and resilient nature of our assets. Based on the gross portfolio value, the net initial yield “topped up” for the expiry of rent free periods was 4.97 per cent. The like-for-like change in ERV also continued to out-perform the benchmark with a further marginal increase in the second half of 2013.
Full Second First year half half 2013 2013 2013 Group revaluation surplus – like-for-like +1.8% +0.8% +1.0% IPD* capital growth +0.8% +2.0% -1.1% Group weighted average nominal equivalent yield 5.79% 5.79% 5.85% Like-for-like change in Group nominal equivalent yield -15bp -6bp -9bp IPD* equivalent yield shift -17bp -18bp +1bp Group “topped up” initial yield (EPRA) 4.97% 4.97% 5.10% Group change in like-for-like ERV +0.3% +0.1% +0.2% IPD* change in rental value index -1.3% -0.5% -0.8%
* IPD monthly index, retail
In general the larger super-regional and major city centres continue to out-perform with stronger valuation surpluses, with slight reductions in some centres where improvement expenditure has not yet been fully reflected in prospective ERVs. Notable changes in individual valuations include:
• intu Trafford Centre (+£94 million (H2 £47 million), +5.3 per cent) has benefited from an increase in headline rent and the satisfactory conclusion of 2013 lease expiries and rent reviews as well as market yield improvement for super-regional centres
• intu Lakeside (+£26 million (H2 £5 million), +2.4 per cent) has benefited from an earnings-enhancing food court redevelopment as well as market improvement in yield for super-regional centres
• intu Eldon Square (-£7 million (H2 -£3 million), -2.9 per cent) has been affected by refurbishment expenditure, the potential effect of which has not yet been reflected in the valuation ERV
• St David’s, Cardiff (+£16 million (H2 £7 million), +6.4 per cent) has benefited from continued growth of income in the 2009 extension as well as market yield improvement for top centres in major cities
• intu Bromley (-£7 million (H2 -£2 million), -4.1 per cent) has not yet benefited from the valuation impact of committed refurbishment expenditure
• Manchester Arndale (+£15 million (H2 £7 million), +3.7 per cent) continues to benefit from national evidence of stronger yields for top centres in major cities
• intu Potteries (-£6 million (H2 -£2 million), -3.6 per cent) has been affected by some pockets of ERV reduction as we conclude relettings following the 2013 lease expiries
• Cribbs Causeway (+£7 million (H2 £6 million), +2.8 per cent) has benefited from the satisfactory conclusion of 2013 lease expiries, increasing security of income and improving tenant mix, as well as market yield improvement for super-regional centres

11
Operating metrics
2013 2012 Occupancy 95% 96% – of which, occupied by tenants trading in administration 1% 3% Leasing activity – number, new rent 201, £42m 169, £44m
– new rent relative to previous passing rent 4% above 7% above Like-for-like change in net rental income -1.9% -2.7%
Total property return 7.3% 6.0% Footfall -2% -1% Retailer sales (like-for-like centres) +0%* +1% Rent to estimated sales (exc. anchors and major space users) 13.5% 13.9%
* excluding impact of trading interruptions during major tenant relocations at intu Braehead and Cribbs Causeway
• Occupancy remains firm at the 95 per cent level at which we have operated for most of the year and compares favourably to PMA’s vacancy measure for “big shopping centres” of ten per cent. In our view the rent foregone and direct cost of an extra one per cent vacancy in the year is a worthwhile investment in the ongoing quality, tenant mix and, ultimately, value of our prime assets
• We agreed 201 new long-term leases in the year, amounting to £42 million new annual rent, at an average of four per cent above previous passing rent (like-for-like units) and, excluding strategic deals reported in the third quarter, in line with valuers’ assumptions. Significant signings in the year include:
o new lettings addressing lease expiry concentrations at intu Trafford Centre, Cribbs Causeway and intu Potteries, also some important repositioning ahead of intu Braehead’s 2014 expiry concentration (see below)
o 12 retailers including Urban Outfitters, Adidas, Sealife, and The White Company took a unit in an Intu centre for the first time, with a substantial number of others opening further stores in additional centres
o 139 new shops opened or refitted in our centres in 2013, around five per cent of our 2,600 units. Tenants have invested around £70 million in these stores, a significant demonstration of their commitment to our centres. As well as major flagship store investments across the portfolio, Next chose intu Watford to launch their new concept Lipsy shopfit in December
• Like-for-like net rental income was 1.9 per cent lower in 2013 than 2012, with a narrower 0.9 per cent decrease in the second half. Tenants failing in late 2012 and early 2013 accounted for around £10 million of rent foregone and direct costs. Income interruption around concentrations of lease expiries also temporarily affected earnings from two centres
• At the property level, the total return from Intu’s portfolio has been robust at 7.3 per cent (2012 – 6.0 per cent) compared to the IPD quarterly index, retail, of 8.1 per cent (2012 – 1.5 per cent). The combination of capital value preservation and broadly stable income demonstrates the strength of Intu’s assets over the medium term
• The number of visitors to our centres has reduced marginally year-on-year in 2013, the two per cent decline representing a significant out-performance of Experian’s measure of UK national retail footfall which declined four per cent
• Estimated retailer sales in our centres were broadly flat in the year excluding the impact of trading interruptions during major tenant relocations at intu Braehead and Cribbs Causeway. The ratio of rents to estimated sales for standard units marginally reduced in the year to 13.5 per cent, continuing the trend of the previous few years
• The lease expiry cycle, while bringing the risk of some short-term earnings impact, is a good opportunity to effect significant repositioning. In the last two years 21 per cent of rent has been subject to expiry of which all but four per cent has been dealt with. In 2013, for example, six new retailers were introduced to intu Potteries and more than one in five stores were refitted. This gave a significant boost to the overall feel of the centre although the rental tone has settled at the lower level which was anticipated in the December 2012 valuation
At intu Braehead we created major new stores for Next and JD Sports, providing new anchors for areas of the centre and establishing improvement and change ahead of a concentration of expiries in 2014. The chart below illustrates that the pattern of lease expiries across the portfolio is broadly even, with a weighted average unexpired term of 7.5 years (31 December 2012 – 7.8 years)

12
Asset management We aim to create the best places to eat, drink, shop and socialise. We manage our centres to offer a mix of attractions to encourage our visitors to come from further, for longer, more often. This reinforces their position as must have locations for retailers. Experience As well as offering an evolving mix of the retail brands our customers want to see, with best flagship shopfits, and the catering and leisure options to encourage them to stay into the evening, we are focused on improving their overall experience in our centre including events, quality of service and environment:
• we have changed the look and feel of all our directly-managed centres with the roll out of the new brand’s refreshing style in the form of physical signage and new uniforms. More comprehensive refurbishments are also underway or imminent at a number of centres (see Looking to the future below)
• with the in-sourcing of facilities management and World Class Service training, we have aligned our teams with our nationwide brand aspirations and values, allowing us to take more control of the customer experience. Customer rating measured by our first Institute of Customer Services survey exceeded the retail sector benchmark
• our fibre-optic infrastructure now provides high quality Wi-Fi in nine centres with the final four to follow in early 2014 (see Market review above)
• as the only nationwide branded network of prime UK shopping centres, we can now entertain customers with quality events which offer a unique proposition to commercial partners. During the year we hosted significant footfall-driving events including a weekend-long nationwide performing arts expo, student nights attracting over 100,000 and generating over £2 million incremental sales, over 125,000 watching our Hello magazine-branded fashion shows, around 40,000 minutes of Cosmo-sponsored style advice plus the nationwide tour of a flagship arts programme, Elephant Parade
• with the single name for the Company and our centres, media coverage of events and news has roughly doubled
Catering and leisure Across the country, we have well over 400 catering and leisure outlets, which contribute 11 per cent of our rent roll. Our super-regional centres, which have always been day out destinations, have a notably higher proportion than most of those in city centres. Our research shows that those who eat or drink at one of our centres stay much longer and spend significantly more than just their extra dining expense. In 2013, around a third of visitors chose to dine and the amount on average they spent on catering rose by nine per cent. Our strategy for providing catering is not just about the volume of outlets – to encourage dwell and dine, we are focused on increasing the diversity of the offer. We offer a wider than ever range of operators with specific spend and dwell niches, regional as well as national and international operators. We have analysed gaps in each of our centres and are working on providing new clusters and zones to fill them. Our pipeline of investments (see below) will almost double the amount of dining and recreation space from 1.9 million sq. ft. to 3.4 million sq. ft., with the vast majority having obtained planning consent. At intu Lakeside, for example, our catering strategy is to close the current gap between the traditional fast food offer of the food court and the casual dining Boardwalk with its roughly three times longer dwell time and spend. We are introducing a range of new operators such as Wasabi, Rhythm Kitchen, Gino D’Acampo and Five Guys in a contemporary environment. Also the fourth champagne bar for our portfolio opened successfully at intu Lakeside just before Christmas.
UK acquisitions We believe that our scale and focus is key to our successful development and operation of UK prime regional shopping centres. Such assets are rarely traded, so where opportunities arise to acquire interests, particularly where our operator skills can be applied through our specialist asset and property management teams, we remain keen to consider the value creation opportunities.

13
We announced last month that we were in discussions with Westfield regarding the potential acquisition of its Derby shopping centre and its equity interest in Merry Hill, Dudley. Those discussions continue to progress satisfactorily. If the acquisition were to proceed, it is likely that it would be funded through a combination of new debt and equity raised through a rights issue. However, there can be no certainty that any transaction will be undertaken. In March 2013 we filled a gap in our national coverage, acquiring Midsummer Place, the aspirational fashion quarter of the UK’s number 16 retail destination by catchment spend, central Milton Keynes. Adjacent to centre:MK with the two centres treated as a single destination by shoppers, Midsummer Place’s major tenants include Debenhams, H&M, Apple, Superdry, Zara and Topshop. Since acquisition new retailers and catering operators including Hugo Boss, Timberland and Ed’s Diner have opened and Topshop/Topman has invested in a new flagship shopfit. In April 2013 we acquired Charter Place, Watford, adjacent to intu Watford, and have subsequently received planning consent for its replacement with a leisure- and catering-focused extension to the main centre (see Looking to the future below).
International In October 2013 we acquired with Canada Pension Plan Investment Board (“CPPIB”) Parque Principado Shopping Centre, Oviedo, a 75,000m
2 (approximately 800,000 sq. ft.) prime regional retail destination in Asturias, Northern Spain. One of Spain’s
top-ranked retail destinations with nine million visitors in 2013, the well-located and 98 per cent occupied centre is anchored by Primark, Zara, H&M, Cortefiel, C&A, Mango and Eroski hypermarket, with catering and leisure representing around 20 per cent of space. The net initial yield for the property at the implied purchase price of €162 million was 7.2 per cent. The acquisition, on attractive and earnings accretive terms, firmly establishes Intu’s presence on the ground in a country where we see considerable growth opportunities in the regional shopping centre industry and the potential to generate superior total returns over the long term. The market is quite fragmented in terms of ownership and considerable scope exists for improvement, along the lines of regionally pre-eminent destinations in the UK and elsewhere, in the shopping centre provision for many major catchments in Spain. Spain is one of the few major European countries without a committed pipeline of prime shopping centre developments and limited investor competition currently provides a contra-cyclical opportunity to acquire large, high quality centres at historically low pricing. Intu also has a site under option near Malaga in Andalucia, for 80,000m
2 of retail space with additional leisure and, as previously
announced, has entered into arrangements with Eurofund, a local partner with a track record of successful retail development, for pre-development activity on this site and at two major sites under option, in Valencia and Vigo. We are aiming to attract additional third party capital to assist with funding Intu’s Spanish activities without diverting significant financial resources from Intu’s organic development pipeline in the UK. In this context, we are actively investigating the creation of a special purpose investment vehicle for our Spanish activities, such as a Spanish REIT, following a number of recent regulatory improvements to this product. The Group also has the following other investments outside the UK:
• 11.4 million redeemable joint venture units in Equity One, a US retail REIT, providing an effective interest of nine per cent. These were received in January 2011 as a result of the restructuring of our previous direct investment in Californian property and are valued at £154 million based on the 31 December 2013 share price of $22.44. Dividends in the year amounted to $0.88 per unit. Equity One owns, develops and manages US neighbourhood shopping centres anchored by supermarket chains and has continued to be active in upgrading its property portfolio with an ongoing disposal programme of non-core assets. Operational metrics continued to improve in 2013 with leasing spreads on renewals and new leases showing good uplifts relative to previous rental levels
• 32 per cent of listed Indian shopping centre developer, Prozone, and ten per cent of its former parent company, the
Indian listed retailer Provogue, valued at a combined £37 million at 31 December 2013. Prozone has continued to progress the construction of its mixed-use projects at Coimbatore, Nagpur and Indore. Discussions are progressing with anchor tenants at the proposed Coimbatore shopping centre and an agreement has been signed with the multiplex cinema operator. The operational mall at Aurangabad has showed encouraging increases in tenant sales and footfall in 2013

14
LOOKING TO THE FUTURE
We have made significant progress in the year with our pipeline of organic development opportunities: • Two thirds of our 2.6 million sq. ft. of additional space has now received planning consent, including major extension
projects in Watford, Nottingham and at intu Lakeside • We have agreed with local authority partners in Watford and Nottingham a firm basis for major development
We have improved our financial flexibility to progress these projects by restructuring much of the debt which was to mature in the next few years. Since the end of 2013 we have increased the level of borrowing secured on intu Trafford Centre.
Further, we plan to recycle capital from existing assets to reinvest into these organic growth opportunities. This may include asset disposals and/or introducing partners into existing assets. For example intu Uxbridge is currently being marketed.
In the case of major extensions and creation of significant new or reconfigured space, we aim to achieve pre-letting of around two thirds of projects by space and the majority of the rent before proceeding with construction.
A particular area of focus is investment in improving the range, quality and setting of the dining and leisure options across our centres. These will reinforce the long-term attractiveness of the assets and, with operators keen to expand into our high footfall destinations, are intended to contribute to a superior financial return for shareholders.
Our plans include 1.5 million sq. ft. of extra catering and leisure space, an 80 per cent increase on the current level. 900,000 sq. ft. has already received planning consent and we have applied for a further 360,000 sq. ft.
Examples include the new food court at intu Lakeside, a new dining quarter at intu Eldon Square, a major new destination in the heart of Watford, a street food concept at Midsummer Place and a nine screen cinema at intu Potteries.
The table below sets out a summary of the project pipeline. In the case of expansionary projects which create additional space for which direct incremental rent can be identified, we would expect most projects to generate a stabilised initial yield on cost in the range of six to ten per cent and at least seven per cent for major projects. Where no significant additional space is created, we assess project return in the context of an internal rate of return based on the overall impact of the expenditure on centre performance through enhancing the ambience, the tenant mix and the rental tone.
Expected
Indicative Intu
Size1 construction investment
‘000 sq. ft. timing2 £m
Committed intu Lakeside food court refurbishment
3 – 2013-14 7
intu Victoria Centre refurbishment4 – 2014-15 40
intu Potteries leisure extension 58 2014-15 19 Other committed
5 41 2014-15 20
86 Active management pipeline
intu Trafford Centre – Barton Square courtyard
enclosure and second floor retail 112 2014-15 40
intu Bromley Queen’s Gardens restaurants 14 2014-15 4
intu Eldon Square “Sidgate” redevelopment and restaurants – 2014-15 12
intu Metrocentre “Qube II” restaurants – 2014-15 11
intu Lakeside hotel6 8 2014-15 7
Other active management5 89 2014-18 141
215
Major projects
intu Watford – Charter Place 380 2014-17 100
intu Broadmarsh redevelopment 51 2015-16 78
intu Lakeside leisure extension 225 2015-17 80
intu Lakeside Northern extension 438 2016-18 180
intu Braehead extension7 475 2016-18 200
Cribbs Causeway extension8 200 2018-20 30
intu Victoria Centre extension 505 2018-20 240
2,274 908
2,596 1,209
1 Represents net additional floor space of retail, catering and leisure
2 Timing subject to change due to a number of internal and external factors
3 Total project cost £9 million of which £2 million has already been spent
4 Total project cost £42 million of which £2 million has already been spent
5 Smaller committed and pipeline projects do not necessarily involve the creation of additional floor space
6 Size refers to catering element only
7 Size excludes arena and hotel
8 Intu share 33 per cent of total project cost of £90 million

15
Principal projects include: • intu Watford: our plans for a 380,000 sq. ft. extension to create a new shopping, dining and entertainment hub for
Watford received planning consent in January 2014. The anchor cinema is under offer and we are encouraged by the level of enquires for the large format retail and restaurant units. Subject to satisfactory pre-letting, we anticipate that enabling works could be under way by Winter 2014/15 with a target for completion in 2017
• Nottingham: we recently signed a major agreement with Nottingham City Council setting out a way forward for the complementary development of intu Broadmarsh and intu Victoria Centre. Our development of a restaurant quarter and significant refurbishment of intu Victoria Centre is underway. This project has already reignited interest from retailers currently not represented in the city. We will this year initiate public consultation on our leisure- and convenience-led refurbishment and redevelopment of intu Broadmarsh. Subject to legal and commercial preconditions, work could commence in 2015. Further, proposals for a possible extension of intu Victoria Centre have now received planning approval
• intu Lakeside: in addition to the food court refurbishment referred to above, we now have planning consent for two major projects which together would add over 600,000 sq. ft. of new retail, catering, leisure and hotel attractions, significantly increasing intu Lakeside’s draw and reach and providing more reasons to stay longer. Given the current high demand from restaurant and entertainment operators for the leisure scheme, we hope to secure sufficient pre-lets to start construction of a first phase in 2015
• intu Trafford Centre: having received planning consent to increase overall space and broaden the range of uses at Barton Square, we are in advanced negotiations with a major fashion retailer currently not represented at intu Trafford Centre for a flagship store on a new second floor. The enabling development, which we expect to start this year to complete in 2015, will include an impressive glass roof to enclose the central courtyard
• intu Metrocentre: as well as proceeding with our repositioning of Platinum Mall to create a more aspirational ambience, we have received planning consent for a 45,000 sq. ft. extension to the "Qube" dining area adjacent to the 12 screen Imax Odeon cinema. This will add a further 11 catering outlets and will introduce several new operators to the region. We anticipate securing sufficient pre-letting to start construction this year, to open in 2015
• intu Potteries: with a nine screen Cineworld cinema as a powerful anchor, we now have all five restaurant units exchanged or under offer and anticipate starting construction on the leisure extension shortly, for completion in 2015
• intu Eldon Square: our major refurbishment includes refreshing 65,000 sq. ft. of malls, replacing 13,000 sq. ft. of roof lights and constructing a new feature entrance from Northumberland Street and is due to complete later this year. We are carrying out the majority of the work overnight to minimise disruption to our shoppers and retailers, with up to 120 operatives on site each evening. Our proposed new restaurant cluster in the "Sidgate" mall area has received strong interest from operators new to the region as well as those already trading locally and, subject to pre-letting, we anticipate starting construction later this year
• intu Braehead: we are awaiting the outcome of the public enquiry by the Scottish Government into the Local Development Plan for Renfrew which should, amongst other things, confirm Braehead’s role as a town centre
Priorities for 2014 We will continue to focus in 2014 on four main goals which, we believe, will result in strong total returns over the medium term:
• optimising the performance of our existing assets, through active asset management – with customer experience as the focus for our business plan for each centre, we combine development, tenant mix and operational actions to address the needs and potential of each centre
• driving forward our £1.2 billion investment programme – as discussed above, with a majority of planning consents now secured, we will determine the timing of expenditure as we secure pre-lettings with the appropriate mix of retailers and operators to create new attractions for each of the destinations. In addition, where opportunities arise to acquire interests in appropriate assets, we will continue to consider strategic acquisitions
• continuing to improve our financial flexibility – we will proceed with debt issues and capital recycling from existing assets including disposals and possible introduction of partners in order to provide the funding at the appropriate time to undertake our investment programme. In February 2014 we issued further notes under the intu Trafford Centre CMBS transaction established in 2000
• reinforcing our brand and digital presence – following a successful roll out in 2013 we will develop our brand with its unique integration of digital and physical capabilities to drive demand for our assets and create broader commercial value. As well as completing our Wi-Fi installation programme at the final four centres, we are preparing trials of a number of property management and service innovations, analytical tools and upgraded online experience
David Fischel Chief Executive 28 February 2014

16
FINANCIAL REVIEW In 2013 the Group’s financial management has focused on creating the financing flexibility to advance the business. The Group has refinanced £1.8 billion of debt in the year, significantly de-risking the 2015-2017 debt maturities and demonstrating the Group’s prime assets can be financed at around 50 per cent loan to value at competitive interest margins. In addition to the £1.8 billion of debt financing, the Group issued 86 million new ordinary shares at 325 pence per share raising net proceeds, after costs, of £273 million to fund the acquisition of Midsummer Place. Key points of note
• A combination of market conditions and repositioning affected the financial results for the year (see Results for the year ended 31 December 2013 below):
o Underlying earnings of £140 million, up 2 per cent on 2012, giving earnings per share of 15.0 pence, down 7 per cent on 2012 due to higher level of shares in issue
o NAV per share at 380 pence; total financial return for the year 1 per cent • Improved financial flexibility (see Financial position at 31 December 2013 below):
o Debt to assets ratio at 48.5 per cent, below the Group’s target maximum level of 50 per cent. Actual ratio would reduce to around 44 per cent were the convertible bonds to convert to equity
o Interest cover ratio at 1.71x, above the Group’s targeted minimum level 1.60x RESULTS FOR THE YEAR ENDED 31 DECEMBER 2013 Income statement The Group recorded a profit for the year of £364 million, an improvement on the £159 million reported for the year ended 31 December 2012. At an underlying level, excluding valuation and exceptional items, earnings were £2 million higher at £140 million (2012 – £138 million). The major factors in the £205 million increase in profit to £364 million are valuation related items, including:
• an increase in the revaluation gain on property valuations to £126 million (2012 – £41 million) • an increase in the credit arising from the change in fair value of the Group’s financial instruments. 2013 benefited from a
£274 million credit, whereas 2012 included £31 million These positive factors were partially offset by:
• higher exceptional finance costs of £158 million (2012 – £61 million), largely interest rate swap terminations in connection with the debt refinancing in the year (see below in Interest rate swaps section of this report)
Underlying earnings, which excludes valuation and exceptional items, were £2 million ahead in 2013 at £140 million as shown in the chart below and as set out in the Underlying Profit Statement. Taking into account additional shares issued as part of the Midsummer Place acquisition, underlying earnings per share reduced by 7 per cent to 15.0 pence.

17
The principal components of the change in underlying earnings are as follows: • while increasing overall due to the impact of the acquisitions of Midsummer Place and Parque Principado, like-for-like
net rental income reduced by 1.9 per cent largely due to the impact of tenant administrations in the first half of the year. This has been partially offset by the favourable impact of new lettings and rent reviews at intu Trafford Centre, Manchester Arndale and intu Lakeside
• as detailed in the table below the Group’s net rental income margin has remained in line with the 87 per cent achieved in 2012 with property operating expense reducing despite the acquisitions in the year, offsetting higher void costs. Property operating expenses in the year ended 31 December 2013 includes £10 million (2012 - £10 million) in respect of car park operating costs and the Group’s contribution to shopping centre marketing of £8 million (2012 - £8 million)
Year ended Year ended
31 December 31 December
2013 2012
£m £m
Gross rental income 448 442 Head rent payable (24) (25) 424 417 Net service charge expense and void rates (16) (13) Bad debt and lease incentive write-offs (9) (10) Property operating expense (29) (31) Net rental income 370 363
Net rental income margin 87% 87%
• underlying net finance costs, which exclude exceptional items, reduced by £1 million due to the favourable impact of
lower interest rates following the debt refinancings that were completed in the year offsetting the slightly higher debt levels
• costs related to intu Digital totalling £3 million which were in line with our plans in its first year • the impact of ongoing administration expenses increasing to £28 million (2012 – £27 million), largely due to costs of
new employees recruited throughout the year continuing the process of broadening the Group’s skill base Balance sheet The Group’s net assets attributable to shareholders have increased by £0.5 billion to £3.5 billion at the end of 2013 due to equity raised in the year to fund the acquisition of Midsummer Place and the retained profit for the year after payment of dividends. As detailed in the table below, net assets (diluted, adjusted) have increased by £289 million from December 2012 to £3,804 million as at the end of December 2013.
31 December 31 December
2013 2012
£m £m
Investment, development and trading properties 7,551.8 7,011.8
Investments 190.7 189.7
Net external debt (3,698.4) (3,504.2)
Other assets and liabilities (423.0) (691.1)
Net assets 3,621.1 3,006.2
Non-controlling interest (102.3) (29.2)
Attributable to shareholders 3,518.8 2,977.0
Fair value of derivatives (net of tax) 198.1 481.8
Other adjustments 83.7 56.6
Effect of dilution 3.8 –
Net assets (diluted, adjusted) 3,804.4 3,515.4
The largest factor in the increase in investment and development properties of £540 million is the acquisition of Midsummer Place and Parque Principado, valued at £251 million and £145 million respectively at acquisition. The 1.8 per cent valuation gain added £126 million to the value of the Group’s properties. The investments of £191 million as at 31 December 2013 comprise the Group’s interests in the US and India. The investment in the US comprises 11.4 million shares in a joint venture with Equity One, a listed US REIT. Based on the Equity One share price of $22.44 at 31 December 2013 the Group’s investment has been valued at £154 million.

18
The remaining investments represent the Group’s interests in India, largely comprising a 32 per cent interest in Prozone, a shopping centre developer, listed on the Indian stock market. As Prozone is classified as an associate company of the Group, the holding is valued as the Group’s percentage share of the associate’s underlying net assets. The carrying value of the investment is based on the Group’s accounting policies and therefore includes property valuations undertaken in accordance with “Red Book” guidelines. At 31 December 2013 Prozone’s listed shares were trading at a 75 per cent, £27 million, discount to the Group’s carrying value. We believe utilising independent valuations is the most appropriate valuation methodology at this time and will continue to monitor the situation. The reduction in other assets and liabilities in the year is due to the reduction in the provision for fair value of derivative financial instruments largely due to payments made in the year. The increase in non-controlling interest represents CPPIB’s 49 per cent interest in Parque Principado. Adjusted net assets per share As illustrated in the chart below, diluted, adjusted net assets per share were 380 pence at 31 December 2013, a reduction of 12 pence in the year. The most significant factor in the reduction is the termination of interest rates swaps as part of the debt refinancings in the year. This was partially offset by the property valuation gain that contributed 13 pence per share to the Group’s adjusted net assets per share. Total dividends of 15 pence per share were covered by the 15 pence per share of underlying earnings generated for the year.
Cash flow The cash flow summary below shows a net decrease in cash and cash equivalents of £26.6 million in the year.
2013 2012
£m £m
Underlying operating cash generated 338.0 344.3
Net finance charges paid (180.7) (191.5)
Exceptional finance and other costs (179.2) (62.1)
Net movement in working capital 0.8 (4.0)
Taxation/REIT entry charge (0.7) (11.0)
Cash flow from operations (21.8) 75.7
Capital expenditure on property assets (44.6) (81.2)
Sale proceeds of property/investments 15.6 49.9
Other investing activities – (17.2)
Acquisition of businesses (391.0) (4.2)
Cash acquired with businesses 8.9 1.6
Dividends (90.9) (117.2)
Cash flow before financing and equity raises (523.8) (92.6)
Net debt raised 159.7 192.7
Equity capital raised 273.0 0.1
CPPIB funding of Parque Principado 71.1 –
Other (6.6) (2.3)
Net (decrease)/increase in cash and cash equivalents (26.6) 97.9

19
Acquisition of businesses includes £249 million in respect of Midsummer Place and £142 million on Parque Principado. £71 million was received from CPPIB, the Group’s partner in the acquisition, giving a net outflow of £71 million for the Group’s economic share of the asset. Capital expenditure on property assets includes £8 million in respect of the purchase of two properties adjacent to the Group’s interest in Charter Place, Watford. Expenditure on existing assets included intu Eldon Square (£5 million), intu Lakeside (£5 million) and intu Metrocentre (£4 million). Net debt raised is discussed in the Debt structure section below.
The table below illustrates that recurring cash flow covers the 2013 interim dividend of 5.0 pence per share that was paid in the year and the proposed final dividend of 10.0 pence per share that will be paid subject to approval at the Annual General Meeting. The actual cash dividend outlay will be less than the 15 pence per share dividend declared due to the impact of scrip dividends. The cash saving to the Group in 2013 from the scrip take up on the 2012 Final and 2013 Interim dividends amounted to £56.2 million.
2013
Pence per
share
Underlying operating cash generated 36.1
Net finance charges excluding exceptional items (19.3)
Convertible bond coupon (0.6)
Net movement in working capital 0.1
Recurring cash flow 16.3
Dividends paid and proposed for 2013 15.0
Capital commitments The Group has an aggregate cash commitment to capital projects of £86 million at 31 December 2013. In addition to the committed expenditure, the Group has an identified uncommitted pipeline of active management projects and major extensions that may become committed over the next five years (see Looking to the future above). It is anticipated that a total of approximately £70 million will be spent on capital projects in 2014. Tax strategy and charge for the year Being a Real Estate Investment Trust (REIT) significantly reduces the taxation costs of the Group, but brings with it the requirement to operate within the rules of the REIT regime. The Group’s approach to taxation is approved by the Board and is subject to regular review. The Group maintains an open, up-front and no-surprises policy in dealing with HMRC. The Group seeks pre-clearance from HMRC in complex areas and actively engages in discussions on potential or proposed changes in the taxation system that might affect property tax and REIT legislation. Since becoming a REIT in 2007 the Group has paid REIT entry charge payments of £199 million. The Group continues to pay tax on overseas earnings, any UK non-property income under the REIT rules, business rates, and transaction taxes such as stamp duty land tax and (until 17 July 2012, when it was abolished) the REIT entry charge. In the year ended 31 December 2013 the total of such payments to tax authorities was £26.5 million, of which £25.0 million was in the UK, £0.6 million in the US and £0.9 million in Spain. In addition, the Group also collects VAT, employment taxes and withholding tax on dividends for HMRC. Business rates, principally paid by tenants, in respect of the Group’s properties amounted to around £261 million in 2013. The tax credit in the year of £0.6 million comprises current tax expenses on the Group’s US and Spanish investments of £0.6 million and £0.2 million respectively, offset by a deferred tax credit of £1.4 million largely on the revaluation of interest rate swaps and investments.

20
FINANCIAL POSITION AT 31 DECEMBER 2013 At 31 December 2013, the Group had net external debt of £3,698 million, an increase of £194 million compared to 31 December 2012. In addition to cash balances of £166 million the Group had undrawn facilities of £90 million and £69 million of CMBS notes issued by intu Metrocentre which were received as cash in February 2014. This gave total headroom at the end of 2013 of £325 million. Debt structure A significant proportion of the Group’s debt has been refinanced in the year. The majority of the debt still remains largely arranged on an asset-specific basis, with limited or non-recourse from the borrowing entities to other Group companies. As a result of the refinancings the Group has diversified its sources of funding. The range of debt instruments now includes CMBS and other bonds plus syndicated bank debt with corporate-level debt remaining limited to the revolving credit facility and convertible bond.
Following the refinancing activity in the year the above chart illustrates that there is a minimal refinancing requirement in the next two years. During the year there was a significant amount of financing activity, including: In February the Group established a new debt funding platform (“Secured Group Structure”) by contributing £2.3 billion of assets into a flexible, ring-fenced security pool and raising £1.15 billion of bond and bank debt secured on it. The inaugural bond issue was highly successful with strong demand resulting in two tranches of ‘A’ rated bonds totalling £800 million being issued with the balance of £350 million provided by a five year bank loan. The bond tranches of £450 million and £350 million mature in 2023 and 2028 respectively. The debt was raised at a blended cost of 4.4 per cent, in line with previous funding cost of debt secured on the four assets, whilst extending the weighted maturity on these assets from 2 years to 10 years. The structure has a tiered operating covenant regime giving the Group a significant degree of flexibility when the covenant measures are below certain levels. In higher tiers the level of flexibility is reduced. Further details are given in the Financial covenants section of this report. In July the Group arranged a £125 million facility secured on Midsummer Place. The facility is for a term of three years and three months with the possibility of being extended up to a further two years subject to both parties agreeing. In November the Group issued a £485 million bond secured on intu Metrocentre the proceeds being used to repay the existing facility secured on the centre. The bond was a single issue 10 year tranche at a rate of 4.125 per cent and represented a 55 per cent loan to value ratio. The cost of borrowing of the new bond represented a saving of 160 basis points compared to the previous facility. In connection with the repayment of the previous bonds £31 million of cash payments were required to terminate interest rate swaps and are included in the £158 million exceptional finance cost in the year.
31 December 31 December
2013 2012
Debt to assets 48.5% 49.5%
Interest cover 1.71x 1.69x
Weighted average debt maturity 8.0 years 6.1 years
Weighted average cost of gross debt 4.8% 5.2%
Proportion of gross debt with interest rate protection 92% 95%
The table above summarises the Group’s main debt measures, with the average maturity increasing and the average cost decreasing as a result of the refinancings in the year. The proportion of debt with interest rate protection has reduced due to drawings of £285 million of the unhedged revolving credit facility at 31 December 2013. This facility was not drawn at the end of 2012.

21
Interest rate swaps Just over 40 per cent of the Group’s debt is floating rate. The Group uses interest rate swaps to fix short- and medium-term interest obligations, reducing cash flow volatility caused by changes in interest rates. Combining the impact of this hedging and the fixed rate debt the Group’s debt is effectively 92 per cent fixed. The table below sets out the nominal amount and average rate of hedging, excluding lenders’ margins, in place under current and forward starting swap contracts.
Average
Nominal amount rate
In effect on or after: £m %
1 year 1,791 3.39
2 years 1,862 3.45
5 years 804 4.99
10 years 678 4.82
15 years 668 4.83
20 years 443 4.59
The nominal value of interest rate swap contracts has reduced by £1.1 billion to £2.1 billion at 31 December 2013 due to terminations associated with refinancings completed in the year. The majority of new debt raised in the year is fixed rate therefore terminated swaps have not been replaced. The fair value net liability of these interest rate swaps at 31 December 2013 is £206 million, a reduction of £287 million from the £493 million at 31 December 2012. This movement in the liability can be largely attributed to cash payments in respect of the reduction in the nominal value described above. Cash payments in the year in respect of interest rate swaps totalled £215 million of which £153 million has been classified as an exceptional finance cost as it relates to the termination of swaps (£128 million) or payments in respect of unallocated swaps (£25 million). The balance of the payments have been included as underlying finance costs as they relate to ongoing interest rate swaps used to hedge debt. The majority of the additional reduction in the fair value liability of £72 million is due to a movement in the interest rate yield curve reducing the required fair value provision for the ongoing interest rate swaps. As previously detailed, the Group has a number of interest rate swaps which are unallocated as, due to a change in lenders’ practice, they cannot be used for hedging the Group’s borrowings. Using the 31 December 2013 forward interest rate yields, these swaps have a market value liability of £143 million (2012 - £199 million). Based on these rates and values, it is estimated the Group will be required to make cash payments on these swaps of £25 million in 2014 in line with the level of payments made in 2013. Covenants Full details of the loan financial covenants are included in the Financial covenants section of this report. The Group is in compliance with all of its corporate and asset-specific loan covenants. As detailed in that analysis, the headroom over the minimum covenant levels has generally increased in the year. Matthew Roberts Finance Director 28 February 2014

22
KEY RISKS AND UNCERTAINTIES Intu’s Board has overall responsibility for managing risk across the Group and establishing the Group’s appetite to risk based on the balance of potential returns and negative impacts. Intu recognises that it faces a number of risks in achieving its strategic objectives. Effective identification and management of these risks is a major factor in Intu’s ability to deliver these objectives. Our risk management framework targets the early identification of key risks and the formation of plans to remove or mitigate them. We apply the methodology of identify, analyse, action and implement, together with our overall culture of risk management to ensure that everyday management decisions are taken in the context of sound risk management principles as well as achieving our strategic objectives. This involves all areas of the business in identifying and reviewing risk and creating appropriate action plans in line with the Group’s risk appetite. Identify and analyse: Operational reviews focus on the impact of changing risks on each function’s key objectives and, along with review of current controls, are subject to executive challenge. The executive team also conducts a strategic review of changes in the overall environment which may hinder the business. Action plans are subject to a detailed review and challenge process, including by the Audit Committee and Board. Implementation is regularly monitored and informs the next phase of identification and analysis. The risk management process continues to evolve to provide Intu with appropriate methodology as the operating environment changes. The key risks and uncertainties facing the Group are as set out in the table below:
Change in Risk and impact Mitigation level of risk 2013 commentary Property market Macro environment weakness could undermine rental income levels and property values, reducing return on investment and covenant headroom
• Focus on prime assets • Covenant headroom monitored and
stress tested • Regular monitoring of tenant
strength and diversity
- • Overall increase in valuation of assets, out-
performing IPD benchmark
• Reinforcing our prime centres with emerging brands and broader offer of leisure and catering, including reconfiguration of space to meet retailer demand
• Digital investment to improve relevance as shopping habits change
• Improvement in covenant headroom on individual properties during the year
Financing Reduced availability of funds could limit liquidity leading to restriction of investing and operating activities and/or increase in funding cost
• Regular reporting to Board of current and projected funding position
• Effective treasury management aimed at balancing long debt maturity profile and diversification of sources of finance
• Consideration of financing plans including potential for recycling of capital before commitment to transactions and developments
���� • Major refinancings significantly reduced risk of upcoming maturities – £1.8 billion of new facilities in the year:
• innovative new security platform • extension of maturity profile • diversification of sources • reduced cost of debt

23
KEY RISKS AND UNCERTAINTIES (continued)
Operations Accidents, system failure or external factors could threaten the safe and secure environment provided for shoppers and retailers, leading to financial and/or reputational loss
• Strong business process and procedures supported by regular training and exercises
• Annual audits of operational standards carried out by internal and external consultants
• Culture of visitor safety • Rigorous ICT security framework;
crisis management simulations include cyber security threats
• Retailer liaison and briefings • Appropriate levels of insurance
- • Significant operational change implemented, with smooth transition to in-sourced facilities management managed through a large scale mobilisation project. Risk of change mitigated by detail of contract, choice of culturally aligned and experienced partner and major training programme
• New structure better uses Intu’s scale and efficiently delivers better control, consistency and application of best practice, e.g. new Group-wide structure for quality, safety, health and environment management. Preparation is underway to achieve ISO accreditation in 2014/15
• Undertaking review of cyber risks in context of new digital services
• Review of insurance partners, with new appointment better aligned to business structure
• Robust crisis management and communication protocols tested and improved with major exercises
• Reduced exposure to future energy costs and taxes through award-winning energy reduction initiatives – 18 per cent reduction in carbon emissions since 2011
Strategy and execution Misjudged or poorly executed strategy fails to create shareholder value
• Annual strategic review by Board informed by external research and advice
• Board and management team experienced in shopping centre and broader retail industry
• Engagement with national and international retailers
• Specialist advice and extensive research supporting major initiatives
• Careful assessment of potential partners to complement Intu’s skills and resources
���� • Rigorous control and review procedures in place to ensure successful implementation of significant strategic initiatives executed in the year including:
• Regular reporting to and review by Board of progress on rebranding, in-sourcing of facilities management, investment in digital infrastructure and services and non-UK expansion
• Specialist advice on evolving digital strategy
• Development of KPIs for monitoring of key deliverables
Development and acquisition Misjudged or poorly executed project results in increased cost or income foregone, hence fails to create shareholder value
• Capital Projects Committee reviews detailed appraisals before and monitors progress during significant projects
• Research and third party due diligence undertaken for transactions
- • Property and market due diligence and detailed business plans developed before acquisition in Spain
• Significant detailed planning, appraisal and analytical exercises underway in advance of committing to major extension projects
• Continued focus on pre-letting space before committing capital to projects

24

25

26
Statement of Directors’ Responsibilities The Group’s Annual Report for the year ended 31 December 2013 contains the following statement of Directors’ responsibilities. Certain parts of the Annual Report are not included within this announcement. The Directors are responsible for preparing the Annual Report, the Directors’ remuneration report and the financial statements in accordance with applicable law and regulations. Company law requires the Directors to prepare financial statements for each financial year. Under that law the Directors have prepared the Group and Company financial statements in accordance with International Financial Reporting Standards (IFRSs) as adopted by the European Union. Under company law the Directors must not approve the financial statements unless they are satisfied that they give a true and fair view of the state of affairs of the Group and the Company and of the profit or loss of the Group and Company for that period. In preparing these financial statements, the Directors are required to: (a) select suitable accounting policies and then apply them consistently (b) make judgements and accounting estimates that are reasonable and prudent (c) state whether applicable IFRSs as adopted by the European Union have been followed, subject to any material
departures disclosed and explained in the financial statements (d) prepare the financial statements on the going concern basis, unless it is inappropriate to presume that the Company will
continue in business The Directors are responsible for keeping adequate accounting records that are sufficient to show and explain the Company’s transactions and disclose with reasonable accuracy at any time the financial position of the Company and the Group and enable them to ensure that the financial statements and the Directors’ Remuneration Report comply with the Companies Act 2006 and, as regards the Group financial statements, Article 4 of the IAS Regulation. They are also responsible for safeguarding the assets of the Company and the Group and hence for taking reasonable steps for the prevention and detection of fraud and other irregularities. The Directors are responsible for the maintenance and integrity of the financial and corporate governance information as provided on the Company’s website. Legislation in the United Kingdom governing the preparation and dissemination of financial statements may differ from legislation in other jurisdictions. The Directors consider that the Annual Report and Accounts, taken as a whole, is fair, balanced and understandable and provides the information necessary for shareholders to assess the Company’s and the Group’s performance, business model and strategy. Each of the Directors, whose names and functions are listed in the Governance section of the Annual Report confirm that, to the best of their knowledge: (a) the Group financial statements, which have been prepared in accordance with IFRSs as adopted by the EU, give a true
and fair view of the assets, liabilities, financial position and profit of the Group (b) the Directors’ report contained in the Governance section of the Annual Report includes a fair review of the
development and performance of the business and the position of the Group, together with a description of the principal risks and uncertainties that it faces
Signed on behalf of the Board on 28 February 2014 David Fischel Chief Executive Matthew Roberts Finance Director
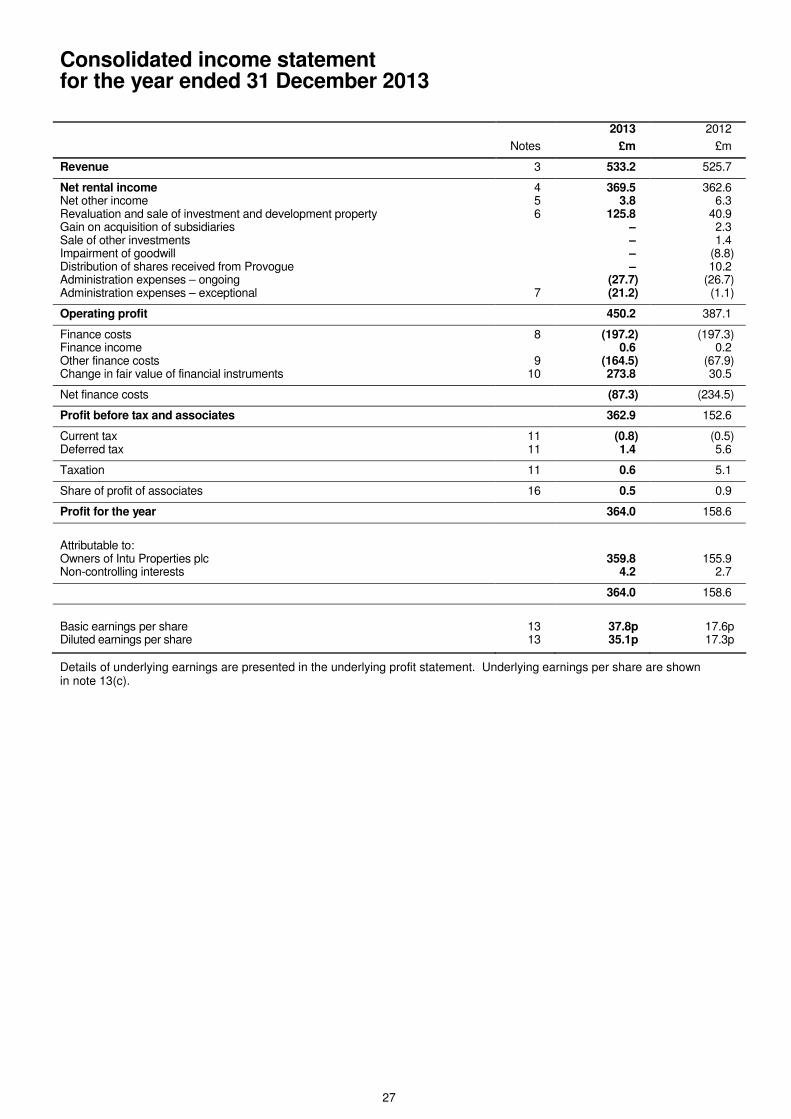
27
Consolidated income statement for the year ended 31 December 2013
2013 2012
Notes £m £m
Revenue 3 533.2 525.7 Net rental income 4 369.5 362.6 Net other income 5 3.8 6.3 Revaluation and sale of investment and development property 6 125.8 40.9 Gain on acquisition of subsidiaries – 2.3 Sale of other investments – 1.4 Impairment of goodwill – (8.8) Distribution of shares received from Provogue – 10.2 Administration expenses – ongoing (27.7) (26.7) Administration expenses – exceptional 7 (21.2) (1.1) Operating profit 450.2 387.1 Finance costs 8 (197.2) (197.3) Finance income 0.6 0.2 Other finance costs 9 (164.5) (67.9) Change in fair value of financial instruments 10 273.8 30.5 Net finance costs (87.3) (234.5) Profit before tax and associates 362.9 152.6 Current tax 11 (0.8) (0.5) Deferred tax 11 1.4 5.6 Taxation 11 0.6 5.1 Share of profit of associates 16 0.5 0.9 Profit for the year 364.0 158.6 Attributable to: Owners of Intu Properties plc 359.8 155.9 Non-controlling interests 4.2 2.7 364.0 158.6 Basic earnings per share 13 37.8p 17.6p Diluted earnings per share 13 35.1p 17.3p
Details of underlying earnings are presented in the underlying profit statement. Underlying earnings per share are shown in note 13(c).

28
Consolidated statement of comprehensive income for the year ended 31 December 2013 2013 2012
Notes £m £m
Profit for the year 364.0 158.6 Other comprehensive income Items that may be reclassified subsequently to profit or loss: Revaluation of other investments 17 8.1 28.7 Recognised in sale of other investments – 2.7 Exchange differences (8.1) (7.4) Tax relating to components of other comprehensive income 11 (1.6) (6.0) Total items that may be reclassified subsequently to profit or loss (1.6) 18.0 Other comprehensive income for the year (1.6) 18.0 Total comprehensive income for the year 362.4 176.6 Attributable to: Owners of Intu Properties plc 359.2 173.9 Non-controlling interests 3.2 2.7 362.4 176.6

29
Consolidated balance sheet as at 31 December 2013 2013 2012
Notes £m £m
Non–current assets
Investment and development property 15 7,551.4 7,009.7
Plant and equipment 5.5 5.6
Investment in associate companies 16 35.8 40.9
Other investments 17 154.9 148.8
Goodwill 8.2 4.0
Derivative financial instruments 25.1 21.2
Trade and other receivables 18 111.2 104.0
7,892.1 7,334.2 Current assets
Trading property 0.4 2.1
Derivative financial instruments 0.7 0.7
Trade and other receivables 18 81.6 66.6
Short-term investments 21 69.3 –
Cash and cash equivalents 19 165.5 188.1
317.5 257.5
Total assets 8,209.6 7,591.7
Current liabilities
Trade and other payables 20 (245.8) (220.9)
Current tax liabilities (1.2) (0.6)
Borrowings 21 (149.2) (94.2)
Derivative financial instruments (11.4) (19.1)
(407.6) (334.8) Non-current liabilities
Borrowings 21 (3,944.0) (3,751.6)
Derivative financial instruments (220.5) (495.8)
Other payables (4.4) (3.3)
Deferred tax (12.0) –
(4,180.9) (4,250.7)
Total liabilities (4,588.5) (4,585.5)
Net assets 3,621.1 3,006.2 Equity Share capital 24 486.9 434.2
Share premium 695.6 577.4
Treasury shares 25 (48.2) (43.9)
Convertible bonds 22 143.7 143.7
Other reserves 500.5 336.7
Retained earnings 1,740.3 1,528.9
Attributable to owners of Intu Properties plc 3,518.8 2,977.0
Non-controlling interests 102.3 29.2
Total equity 3,621.1 3,006.2

30
Consolidated statement of changes in equity for the year ended 31 December 2013
Attributable to owners of Intu Properties plc
Non-
Share Share Treasury Convertible Other Retained controlling Total
capital premium shares bonds reserves earnings Total interests equity
£m £m £m £m £m £m £m £m £m
At 1 January 2013 434.2 577.4 (43.9) 143.7 336.7 1,528.9 2,977.0 29.2 3,006.2
Profit for the year – – – – – 359.8 359.8 4.2 364.0
Other comprehensive income:
Revaluation of other
investments (note 17) – – – – 8.1 – 8.1 – 8.1
Exchange differences – – – – (7.1) – (7.1) (1.0) (8.1)
Tax relating to components
of other comprehensive
income (note 11) – – – – (1.6) – (1.6) – (1.6)
Total comprehensive
income for the year – – – – (0.6) 359.8 359.2 3.2 362.4
Ordinary shares issued 52.7 118.2 – – 164.4 – 335.3 – 335.3
Dividends (note 12) – – – – – (142.1) (142.1) – (142.1)
Interest on convertible
bonds (note 22) – – – – – (5.8) (5.8) – (5.8)
Share-based payments – – – – – 2.0 2.0 – 2.0
Acquisition of treasury shares – – (7.0) – – – (7.0) – (7.0)
Disposal of treasury shares – – 2.7 – – (2.5) 0.2 – 0.2
Non-controlling interest
additions (note 26) – – – – – – – 71.1 71.1
Distribution to non-controlling
interest – – – – – – – (1.2) (1.2)
52.7 118.2 (4.3) – 164.4 (148.4) 182.6 69.9 252.5
At 31 December 2013 486.9 695.6 (48.2) 143.7 500.5 1,740.3 3,518.8 102.3 3,621.1

31
Consolidated statement of changes in equity for the year ended 31 December 2012
Attributable to owners of Intu Properties plc
Non-
Share Share Treasury Convertible Other Retained controlling Total
capital premium shares bonds reserves earnings Total interest equity
£m £m £m £m £m £m £m £m £m
At 1 January 2012 430.2 564.1 (29.5) 143.7 318.7 1,494.9 2,922.1 23.5 2,945.6
Profit for the year – – – – – 155.9 155.9 2.7 158.6
Other comprehensive income:
Revaluation of other
investments (note 17) – – – – 28.7 – 28.7 – 28.7
Recognised in sale of other
investments – – – – 2.7 – 2.7 – 2.7
Exchange differences – – – – (7.4) – (7.4) – (7.4)
Tax relating to components
of other comprehensive
income (note 11) – – – – (6.0) – (6.0) – (6.0)
Total comprehensive
income for the year – – – – 18.0 155.9 173.9 2.7 176.6
Ordinary shares issued 4.0 22.3 – – – – 26.3 – 26.3
Dividends (note 12) – – – – – (127.8) (127.8) – (127.8)
Transfer relating to scrip
dividends – (9.0) – – – 9.0 – – –
Interest on convertible
bonds (note 22) – – – – – (5.8) (5.8) – (5.8)
Share-based payments – – – – – 3.8 3.8 – 3.8
Acquisition of treasury shares – – (15.6) – – – (15.6) – (15.6)
Disposal of treasury shares – – 1.2 – – (1.1) 0.1 – 0.1
Non-controlling interest
additions – – – – – – – 3.0 3.0
4.0 13.3 (14.4) – – (121.9) (119.0) 3.0 (116.0)
At 31 December 2012 434.2 577.4 (43.9) 143.7 336.7 1,528.9 2,977.0 29.2 3,006.2

32
Consolidated statement of cash flows for the year ended 31 December 2013 2013 2012
Notes £m £m
Cash generated from operations 29 317.6 339.2
Interest paid (339.3) (252.7)
Interest received 0.6 0.2
Taxation (0.7) 4.2
REIT entry charge – (15.2)
Cash flows from operating activities (21.8) 75.7
Cash flows from investing activities
Purchase and development of property, plant and equipment (44.6) (81.2)
Sale of property 15.6 1.2
Sale of other investments – 48.7
Acquisition of businesses net of cash acquired (382.1) (2.6)
Other investing activities – (17.2)
Cash flows from investing activities (411.1) (51.1)
Cash flows from financing activities
Issue of ordinary shares 273.0 0.1
Issue of convertible bonds – 300.0
Acquisition of treasury shares (0.9) (0.1)
Sale of treasury shares 0.2 0.1
Non-controlling interest funding received 71.1 –
Partnership equity introduced – 3.0
Cash transferred from restricted accounts – 0.5
Borrowings drawn 2,051.6 –
Borrowings repaid (1,891.9) (107.3)
Interest on convertible bonds (5.8) (5.8)
Equity dividends paid (90.9) (117.2)
Cash flows from financing activities 406.4 73.3
Effects of exchange rate changes on cash and cash equivalents (0.1) –
Net (decrease)/increase in cash and cash equivalents (26.6) 97.9
Cash and cash equivalents at 1 January 186.1 88.2
Cash and cash equivalents at 31 December
19 159.5 186.1

33
Notes
1 Accounting convention and basis of preparation
The financial information presented does not constitute the Group’s financial statements for either the year ended 31 December 2013 or the year ended 31 December 2012, but is derived from those financial statements. The Group’s statutory financial statements for 2012 have been delivered to the Registrar of Companies and those for 2013 will be delivered following the Company's annual general meeting. The auditors’ reports on both the 2012 and 2013 financial statements were not qualified or modified; did not draw attention to any matters by way of an emphasis of matter; and did not contain any statement under Section 498 of the Companies Act 2006.
The financial statements have been prepared in accordance with International Financial Reporting Standards, as adopted by the European Union ("IFRS"), IFRIC interpretations and with those parts of the Companies Act 2006 applicable to companies reporting under IFRS.
The financial statements have been prepared under the historical cost convention as modified by the revaluation of property, available-for-sale investments, and certain other financial assets and liabilities. A summary of the more important Group accounting policies is set out in note 2 to the Group’s financial statements.
The accounting policies used are consistent with those applied in the last annual financial statements, as amended to reflect the adoption of new standards, amendments, and interpretations which became effective in the year. During 2013, the following relevant standards, amendments and interpretations endorsed by the EU became effective for the first time for the Group’s 31 December 2013 financial statements:
• IFRS 7 Financial Instruments: Disclosures (amendment);
• IFRS 13 Fair Value Measurement;
• IAS 1 Presentation of Financial Statements (amendment);
• IAS 12 Income Taxes (amendment); and
• IAS 19 Employee Benefits (revised).
These have resulted in changes to presentation or disclosure only.
The following relevant standards have been issued and adopted by the EU but are not effective until 1 January 2014 and have
not been adopted early:
• IFRS 10 Consolidated Financial Statements;
• IFRS 11 Joint Arrangements;
• IFRS 12 Disclosure of Interests in Other Entities;
• IAS 27 Separate Financial Statements (revised);
• IAS 28 Investments in Associates and Joint Ventures (revised);
• IAS 32 Financial Instruments: Presentation (amendment);
• IAS 36 Impairment of Assets (amendment); and
• Amendments to IFRS 10, IFRS 11 and IFRS 12 (transition guidance).
IFRS 11 removes the choice of accounting treatments currently available under IAS 31 Interests in Joint Ventures. This will impact the Group’s existing accounting policy in respect of joint ventures but the accounting for joint operations will remain unchanged. The Group’s interest in joint ventures will be accounted for using the equity method rather than proportionally consolidating the Group’s share of assets, liabilities, income and expenses on a line-by-line basis. This change will reduce total assets and total liabilities as currently presented, with no change expected in net assets.
Other pronouncements are not expected to have a material impact on the financial statements, but may result in changes to presentation or disclosure.
Additionally a number of standards have been issued but are not yet adopted by the EU and so are not available for early adoption. The most significant of these is IFRS 9 Financial Instruments along with related amendments to other IFRSs and the impact on the Group of these standards is being reviewed.

34
Notes
1 Accounting convention and basis of preparation (continued)
The preparation of financial statements in conformity with generally accepted accounting principles requires the use of estimates and assumptions that affect the reported amounts of assets and liabilities at the date of the financial statements and the reported amounts of revenues and expenses during the reporting period. Although these estimates are based on management’s best knowledge of the amount, event or actions, actual results ultimately may differ from those estimates. In particular significant judgement is required in the use of estimates and assumptions in the valuation and accounting for investment and development property and derivative financial instruments. Additional detail on these two areas is provided in the relevant accounting policy in note 2 and in other notes to the Group’s financial statements.
The Group’s business activities, together with the factors likely to affect its future development, performance and position are set out in the Chairman’s Statement and the Chief Executive's Review. The financial position of the Group, its cash flows, liquidity position and borrowing facilities are described in the Financial Review. In addition note 35 to the Group’s financial statements includes the Group’s risk management objectives, details of its financial instruments and hedging activities, its exposures to liquidity risk and details of its capital structure.
The Group prepares regular forecasts and projections which include sensitivity analysis taking into account a number of downside risks to the forecast including reasonably possible changes in trading performance and asset values and assesses the potential impact of these on the Group’s liquidity position and available resources.
In preparing the most recent projections factors taken into account include the Group’s £166 million of cash, £69 million of short-term investments and £90 million of undrawn facilities at 31 December 2013. The significant refinancing of debt completed in the year, extending the Group’s debt maturity profile to eight years, along with the relatively long-term and stable nature of the cash flows receivable under tenant leases were also factored into the forecasts.
After reviewing the most recent projections and the sensitivity analysis, the Directors have concluded that there is a reasonable expectation that the Group has adequate resources to continue in operational existence for the foreseeable future. Thus they continue to adopt the going concern basis of accounting in preparing the Group’s financial statements.

35
Notes (continued)
2 Segmental reporting
Operating segments are determined based on the internal reporting and operational management of the Group. The Group is primarily a UK shopping centre focussed business and has one reportable operating segment.
The principal profit indicator used to measure performance is net rental income. An analysis of net rental income is given in note 4.
The Group’s geographical segments are set out below. This represents where the Group’s assets reside and where revenues are generated. In the case of investments this reflects where the investee is located.
Revenue Non-current assets1
2013 2012 2013 2012
£m £m £m £m
United Kingdom 529.8 525.7 7,528.4 7,123.3 Spain 3.4 – 147.9 – United States – – 153.9 146.9 India – – 36.8 42.8 533.2 525.7 7,867.0 7,313.0
1 Non-current assets excluding derivative financial instruments and deferred tax assets.
3 Revenue
2013 2012
£m £m
Rent receivable and service charge income 531.4 520.1
Sale of trading property 1.8 5.6
Revenue 533.2 525.7
4 Net rental income
2013 2012
£m £m
Rent receivable 447.6 441.4
Service charge income 83.8 78.7 531.4 520.1
Rent payable (23.5) (24.7)
Service charge costs (94.5) (87.0)
Other non-recoverable costs (43.9) (45.8)
Net rental income 369.5 362.6 5 Net other income
2013 2012
£m £m
Sale of trading property 1.8 5.6
Cost of sales (1.7) (5.5)
Profit on sale of trading property 0.1 0.1
Write down of trading property – (0.1)
Dividends received from other investments 6.3 6.3
intu Digital (2.6) –
Net other income 3.8 6.3

36
Notes (continued) 6 Revaluation and sale of investment and development property
2013 2012
£m £m
Revaluation of investment and development property (note 15) 125.8 40.8
Sale of investment property – 0.1 Revaluation and sale of investment and development property 125.8 40.9 7 Administration expenses – exceptional
Exceptional administration expenses in the year totalled £21.2 million (2012 – £1.1 million). This includes costs relating to the acquisition of Midsummer Place of £11.2 million, being predominantly stamp duty, £6.8 million of costs relating to the rebranding of the Group, and £2.0 million relating to the acquisition of Parque Principado with the remainder relating to other corporate finance activities of the Group. These administration expenses are considered to be exceptional items and have been disclosed separately from ongoing administration expenses as, due to the size or incidence of these items, separate disclosure is required to enable a full understanding of the Group’s financial performance.
8 Finance costs
2013 2012
£m £m
On bank loans and overdrafts 186.3 191.7
On convertible bonds (note 22) 7.5 1.8
On obligations under finance leases 3.4 3.8 Finance costs 197.2 197.3
9 Other finance costs
2013 2012
£m £m
Amortisation of Metrocentre compound financial instrument 6.5 6.9
Cost of termination of derivative financial instruments and other fees1 158.5 59.9
Foreign currency movements1 (0.5) 1.1
Other finance costs 164.5 67.9
1 Amounts totalling £158.0 million in the year ended 31 December 2013 were treated as exceptional and excluded from the calculation of underlying earnings (2012 – £61.0 million). These finance
costs include termination of interest rate swaps on repayment of debt, payments on unallocated swaps and other fees. They are considered to be exceptional items due to their size and incidence
and are identified separately in order to enable a full understanding of the Group’s financial performance.
10 Change in fair value of financial instruments
2013 2012
£m £m
On derivative financial instruments 275.6 41.5
On convertible bonds designated as at fair value through profit or loss (note 22) (1.8) (11.0)
Change in fair value of financial instruments 273.8 30.5
Included within the change in fair value of derivative financial instruments are amounts totalling £215.2 million resulting from the payment of obligations under derivative financial instruments during the year. Of these £127.5 million relate to the termination of swaps in the year and £25.0 million to payments on unallocated swaps (see note 9).

37
Notes (continued) 11 Taxation
Taxation for the year:
2013 2012
£m £m
Overseas taxation 0.8 0.5
Current tax 0.8 0.5
Deferred tax:
On investment and development property 0.2 –
On other investments (1.9) (1.9)
On derivative financial instruments 3.2 (3.2)
On other temporary differences (2.9) (0.5)
Deferred tax (1.4) (5.6) Total tax credit (0.6) (5.1)
The tax credits for 2013 and 2012 are lower than the standard rate of corporation tax in the UK. The differences are explained below:
2013 2012
£m £m
Profit before tax and associates 362.9 152.6
Profit before tax multiplied by the standard rate in the UK of 23.25% (2012 – 24.5%) 84.4 37.4
Additions and disposals of property and investments 4.0 (0.5)
REIT exemption – corporation tax (8.9) (29.7)
REIT exemption – deferred tax (83.4) (25.2)
Non-deductable and other items 0.8 (0.7)
Overseas taxation 0.7 0.2
Unprovided deferred tax 1.8 13.4
Total tax credit (0.6) (5.1) Tax relating to components of other comprehensive income is analysed as:
2013 2012
£m £m
Current tax:
On disposal of other investments – 0.4
Deferred tax:
On other investments 1.6 5.6
Tax relating to components of other comprehensive income 1.6 6.0

38
Notes (continued)
12 Dividends 2013 2012
£m £m
Ordinary shares
Prior year final dividend paid of 10.0 pence per share (2012 – 10.0 pence per share) 94.4 85.4
Interim dividend paid of 5.0 pence per share (2012 – 5.0 pence per share) 47.7 42.4
Dividends declared 142.1 127.8
Proposed final dividend of 10.0 pence per share 96.1
During 2013, the Company offered shareholders the option to receive ordinary shares in lieu of the cash 2012 final and 2013 interim dividends of 10 pence and 5 pence respectively under the Scrip Dividend Scheme. As a result of elections made by shareholders 10,693,407 new ordinary shares of 50 pence each were issued on 4 June 2013 and 6,837,832 new ordinary shares of 50 pence each were issued on 19 November 2013 in lieu of dividends otherwise payable. This resulted in £56.2 million of cash being retained in the business.
In 2012, the Company offered shareholders the option to receive ordinary shares in lieu of the cash 2012 interim dividend of 5 pence under the Scrip Dividend Scheme. As a result of elections made by shareholders 3,268,230 new ordinary shares of 50 pence each were issued on 20 November 2012 in lieu of dividends otherwise payable. This resulted in £10.6 million being retained in the business.
Details of the shares in issue and dividends waived are given in notes 24 and 25.
13 Earnings per share
(a) Earnings per share
Basic and diluted earnings per share as calculated in accordance with IAS 33 Earnings per Share:
2013 2012
Earnings Shares Pence per Earnings Shares Pence per
£m million share £m million share
Basic earnings per share1 354.0 935.3 37.8p 150.1 853.8 17.6p
Dilutive convertible bonds, share options and share awards 13.3 111.5 7.6 56.2
Diluted earnings per share 367.3 1,046.8 35.1p 157.7 910.0 17.3p
1 The weighted average number of shares used for the calculation of basic earnings per share has been adjusted to remove shares held in the ESOP. Basic earnings per share are stated after
deducting interest on convertible bonds recognised directly in equity of £5.8 million in the year ended 31 December 2013 (2012 – £5.8 million) in accordance with IAS 33 Earnings per Share.
(b) Headline earnings per share
Headline earnings per share has been calculated and presented as required by the Johannesburg Stock Exchange listing requirements.
2013 2012
Gross Net1 Gross Net
1
£m £m £m £m
Basic earnings 354.0 150.1
Remove:
Revaluation and sale of investment and development property (including associates) (126.3) (125.2) (41.5) (40.1)
Sale of other investments – – (1.4) (1.8)
Gain on acquisition of subsidiaries – – (2.3) (2.3)
Impairment of goodwill – – 8.8 8.8
Headline earnings 228.8 114.7
Dilution2 13.3 7.6
Diluted headline earnings 242.1 122.3
Weighted average number of shares 935.3 853.8
Dilution2 111.5 56.2
Diluted weighted average number of shares 1,046.8 910.0
Headline earnings per share (pence) 24.5p 13.4p
Diluted headline earnings per share (pence) 23.1p 13.4p
1 Net of tax and non-controlling interests.
2 The dilution impact is required to be included as calculated in note 13(a) even where this is not dilutive for headline earnings per share.

39
Notes (continued) 13 Earnings per share (continued)
(c) Underlying earnings per share
Underlying earnings per share is a non–GAAP measure but has been included as it is considered to be a key measure of the Group’s performance and an indication of the extent to which dividend payments are supported by underlying earnings (see underlying profit statement).
2013 2012
Earnings Shares Pence per Earnings Shares Pence per
£m million share £m million share
Basic earnings per share1 354.0 935.3 37.8p 150.1 853.8 17.6p
Remove:
Revaluation and sale of investment and development
Property (note 6) (125.8) (13.5)p (40.9) (4.8)p
Share of associates’ revaluation of investment and
development property (0.5) – (0.6) (0.1)p
Exceptional administration expenses (note 7) 21.2 2.3p 1.1 0.2p
Exceptional finance costs (note 9) 158.0 16.9p 61.0 7.2p
Change in fair value of financial instruments (note 10) (273.8) (29.3)p (30.5) (3.6)p
Gain on acquisition of subsidiaries – – (2.3) (0.3)p
Sale of other investments – – (1.4) (0.2)p
Impairment of goodwill – – 8.8 1.0p
Distribution of shares received from Provogue – – (10.2) (1.2)p
Tax on the above (1.5) (0.1)p (5.9) (0.7)p
Non-controlling interest in respect of the above 8.6 0.9p 8.5 1.0p
Underlying earnings per share 140.2 935.3 15.0p 137.7 853.8 16.1p
Dilutive convertible bonds, share options and share awards 13.3 111.5 7.6 56.2
Underlying, diluted earnings per share 153.5 1,046.8 14.7p 145.3 910.0 16.0p
1 The weighted average number of shares used for the calculation of basic earnings per share has been adjusted to remove shares held in the ESOP. Basic earnings per share are stated after deducting interest
on convertible bonds recognised directly in equity of £5.8 million in the year ended 31 December 2013 (2012 – £5.8 million) in accordance with IAS 33 Earnings per Share.
14 Net asset value per share
(a) NAV per share (diluted, adjusted)
NAV per share (diluted, adjusted) is a non-GAAP measure but has been included as it is considered to be a key measure of the Group’s performance.
2013 2012
Net NAV per Net NAV per
assets Shares share assets Shares share
£m million pence £m million pence
NAV per share attributable to owners of
Intu Properties plc 1 3,518.8 961.2 366p 2,977.0 857.1 347p
Dilutive convertible bonds, share options and awards 3.8 41.1 – 39.6
Diluted NAV per share 3,522.6 1,002.3 351p 2,977.0 896.7 332p
Remove:
Fair value of derivative financial instruments (net of tax) 198.1 20p 481.8 54p
Deferred tax on investment and development
property and other investments 20.4 2p 8.7 1p
Goodwill resulting from recognition of deferred tax liabilities (4.2) – – –
Non-controlling interests in respect of the above (3.8) – (23.4) (3)p
Add:
Non-controlling interest recoverable balance not
recognised 71.3 7p 71.3 8p
NAV per share (diluted, adjusted) 3,804.4 1,002.3 380p 3,515.4 896.7 392p
1 The number of shares used has been adjusted to remove shares held in the ESOP.

40
Notes (continued)
14 Net assets per share (continued)
(b) NNNAV per share (diluted, adjusted)
2013 2012
Net NAV per Net NAV per
assets Shares share assets Shares share
£m million pence £m million pence
NAV per share (diluted, adjusted) 3,804.4 1,002.3 380p 3,515.4 896.7 392p
Fair value of derivative financial instruments (net of tax) (198.1) (20)p (481.8) (54)p
Excess of fair value of debt over book value (56.9) (6)p (2.4) –
Deferred tax on investment and development
property and other investments (20.4) (2)p (8.7) (1)p
Non-controlling interests in respect of the above 6.3 1p (5.3) (1)p
NNNAV per share (diluted, adjusted) 3,535.3 1,002.3 353p 3,017.2 896.7 336p
15 Investment and development property Freehold Leasehold Total
£m £m £m
At 1 January 2012 4,395.2 2,501.0 6,896.2
Additions 62.0 11.8 73.8
Disposals (0.6) (0.5) (1.1)
Surplus on revaluation 63.7 (22.9) 40.8
At 31 December 2012 4,520.3 2,489.4 7,009.7
Midsummer Place acquisition (note 26) 250.5 – 250.5
Parque Principado acquisition (note 26) 144.7 – 144.7
Additions 24.1 14.6 38.7
Disposals – (15.6) (15.6)
Surplus on revaluation 113.4 12.4 125.8
Foreign exchange movements (2.4) – (2.4)
At 31 December 2013 5,050.6 2,500.8 7,551.4
2013 2012
£m £m
Balance sheet carrying value of investment and development property 7,551.4 7,009.7
Tenant incentives included within trade and other receivables (note 18) 108.4 100.4
Head leases included within finance leases in borrowings (note 21) (36.0) (37.0)
Market value of investment and development property 7,623.8 7,073.1
The fair value of the Group’s investment and development property as at 31 December 2013 was determined by independent external valuers at that date. The valuations are in accordance with the Royal Institution of Chartered Surveyors Valuation – Professional Standards 2012 and were arrived at by reference to market transactions for similar properties. Fair values for investment properties are calculated using the present value income approach. The main assumptions underlying the valuations are in relation to rent profile and yields.
The Group engages a number of independent valuation experts to undertake the Group’s property valuations. A summary of the valuers and the value of property assets they are responsible for valuing is given below:
2013 2012
£m £m
DTZ 4,364.0 4,056.2
Cushman & Wakefield 1,900.0 1,800.0
CBRE 937.6 936.1
Knight Frank 272.2 275.8
Jones Lang LaSalle 143.1 –
Others 6.9 5.0
7,623.8 7,073.1
Valuation fees are a fixed amount agreed between the Group and the valuers in advance of the valuation and are not linked to the valuation output.

41
Notes (continued)
16 Investment in associate companies
2013 2012
£m £m
At 1 January 40.9 32.5
Share of profit of associates 0.5 0.9
Distribution of shares received from Provogue – 10.2
Foreign exchange movements (5.6) (2.7)
At 31 December 35.8 40.9
17 Other investments
2013 2012
£m £m
At 1 January 148.8 171.2
Disposal of Equity One shares – (44.4)
Revaluation 8.1 28.7
Foreign exchange movements (2.0) (6.7)
At 31 December 154.9 148.8
18 Trade and other receivables
2013 2012
£m £m
Current
Trade receivables 17.3 16.8
Other receivables 20.3 18.3
Prepayments and accrued income 44.0 31.5
Trade and other receivables – current 81.6 66.6
Non-current
Other receivables 9.8 8.9
Prepayments and accrued income 101.4 95.1
Trade and other receivables – non-current 111.2 104.0
Included within prepayments and accrued income are tenant lease incentives of £108.4 million (2012 – £100.4 million).
19 Cash and cash equivalents
2013 2012
£m £m
Unrestricted cash 159.5 186.1
Restricted cash 6.0 2.0
Cash and cash equivalents 165.5 188.1
Restricted cash primarily reflects amounts held to match the 2014 loan notes shown within borrowings and cash deposited against a Spanish local property tax included within trade and other payables.

42
Notes (continued)
20 Trade and other payables
2013 2012
£m £m
Current
Rents received in advance 95.5 95.0
Trade payables 5.0 2.0
Accruals and deferred income 104.5 78.1
Other payables 17.8 17.6
Other taxes and social security 23.0 28.2
Trade and other payables 245.8 220.9
21 Borrowings
2013
Carrying Fixed Floating Fair
value Secured Unsecured rate rate value
£m £m £m £m £m £m
Current Bank loans and overdrafts 127.6 127.6 – – 127.6 127.6
Commercial mortgage backed securities (“CMBS”) notes 16.5 16.5 – 12.3 4.2 17.6
Loan notes 2014 1.6 – 1.6 1.6 – 1.6
Current borrowings, excluding finance leases 145.7 144.1 1.6 13.9 131.8 146.8
Finance lease obligations 3.5 3.5 – 3.5 – 3.5
149.2 147.6 1.6 17.4 131.8 150.3
Non-current
Revolving credit facility 2017 285.0 285.0 – – 285.0 285.0
CMBS notes 2015 3.1 3.1 – – 3.1 3.2
CMBS notes 2022 51.6 51.6 – 51.6 – 59.2
CMBS notes 2029 93.2 93.2 – 93.2 – 99.8
CMBS notes 2033 364.1 364.1 – 364.1 – 401.7
CMBS notes 2035 184.0 184.0 – – 184.0 189.7
Bank loans 2016 586.9 586.9 – – 586.9 586.9
Bank loan 2017 41.9 41.9 – – 41.9 41.9
Bank loan 2018 346.6 346.6 – – 346.6 346.6
3.875% bonds 2023 439.4 439.4 – 439.4 – 438.3
4.125% bonds 2023 475.2 475.2 – 475.2 – 476.2
4.625% bonds 2028 340.1 340.1 – 340.1 – 349.7
Debentures 2027 227.6 227.6 – 227.6 – 216.3
2.5% convertible bonds 2018 (note 22) 312.8 – 312.8 312.8 – 312.8
Non-current borrowings, excluding finance leases
and Metrocentre compound financial instrument 3,751.5 3,438.7 312.8 2,304.0 1,447.5 3,807.3
Metrocentre compound financial instrument 160.0 – 160.0 160.0 – 160.0
Finance lease obligations 32.5 32.5 – 32.5 – 32.5
3,944.0 3,471.2 472.8 2,496.5 1,447.5 3,999.8
Total borrowings 4,093.2 3,618.8 474.4 2,513.9 1,579.3 4,150.1
Cash and cash equivalents (165.5)
Net debt 3,927.7
Metrocentre compound financial instrument (160.0)
Short-term investments1 (69.3)
Net external debt 3,698.4
1 Short-term investments represent £69.3 million of CMBS notes issued in respect of intu Metrocentre and received as cash in February 2014 following the refinancing of this
borrowing.
The fair values have been established using the market value, where available. For those instruments without a market value, a discounted cash flow approach has been used.

43
Notes (continued) 21 Borrowings (continued)
2012
Carrying Fixed Floating Fair
value Secured Unsecured rate rate value
£m £m £m £m £m £m
Current Bank loans and overdrafts 21.2 21.2 – – 21.2 21.2
Commercial mortgage backed securities (“CMBS”) notes 40.8 40.8 – 6.6 34.2 41.3
Loan notes 2014 2.0 – 2.0 2.0 – 2.0
CSC bonds 2013 26.8 – 26.8 26.8 – 26.9
Current borrowings, excluding finance leases 90.8 62.0 28.8 35.4 55.4 91.4
Finance lease obligations 3.4 3.4 – 3.4 – 3.4
94.2 65.4 28.8 38.8 55.4 94.8
Non-current
CMBS notes 2015 960.6 960.6 – – 960.6 907.4
CMBS notes 2022 51.8 51.8 – 51.8 – 58.8
CMBS notes 2029 97.9 97.9 – 97.9 – 111.0
CMBS notes 2033 375.4 375.4 – 375.4 – 441.1
CMBS notes 2035 181.8 181.8 – – 181.8 172.0
Bank loan 2014 135.4 135.4 – – 135.4 135.4
Bank loans 2016 720.7 720.7 – – 720.7 720.7
Bank loan 2017 502.5 502.5 – – 502.5 502.5
Debentures 2027 227.4 227.4 – 227.4 – 206.5
2.5% convertible bonds 2018 (note 22) 311.0 – 311.0 311.0 – 311.0
Non-current borrowings, excluding finance leases
and Metrocentre compound financial instrument 3,564.5 3,253.5 311.0 1,063.5 2,501.0 3,566.4
Metrocentre compound financial instrument 153.5 – 153.5 153.5 – 153.5
Finance lease obligations 33.6 33.6 – 33.6 – 33.6
3,751.6 3,287.1 464.5 1,250.6 2,501.0 3,753.5
Total borrowings 3,845.8 3,352.5 493.3 1,289.4 2,556.4 3,848.3
Cash and cash equivalents (188.1)
Net debt 3,657.7
Metrocentre compound financial instrument (153.5)
Net external debt 3,504.2
The maturity profile of gross debt (excluding finance leases) is as follows:
2013 2012 £m £m
Repayable within one year 145.7
90.8
Repayable in more than one year but not more than two years 14.4 194.6
Repayable in more than two years but not more than five years 1,601.3 2,180.2
Repayable in more than five years 2,295.8 1,343.2
4,057.2 3,808.8
Certain borrowing agreements contain financial and other conditions that, if contravened, could alter the repayment profile. During the year there were no breaches of these conditions (see Financial covenants section).
As at 31 December 2013 the Group had committed borrowing facilities of £375.0 million, expiring in 2017, of which £90.0 million was undrawn (2012 – undrawn £375.0 million).

44
Notes (continued)
21 Borrowings (continued)
Finance lease disclosures:
2013 2012
£m £m
Minimum lease payments under finance leases fall due:
Not later than one year 4.7 4.8
Later than one year and not later than five years 17.0 17.4
Later than five years 66.2 68.1
87.9 90.3
Future finance charges on finance leases (51.9) (53.3)
Present value of finance lease liabilities 36.0 37.0
Present value of finance lease liabilities:
Not later than one year 3.5 3.4
Later than one year and not later than five years 13.0 13.2
Later than five years 19.5 20.4
36.0 37.0
Finance lease liabilities are in respect of head leases on investment property. A number of these leases provide for payment of contingent rent, usually a proportion of net rental income, in addition to the rents above.
22 Convertible bonds
2.5 per cent convertible bonds (“the 2.5 per cent bonds”)
On 4 October 2012 Intu (Jersey) Limited (the “Issuer”) issued £300.0 million 2.5 per cent Guaranteed Convertible Bonds due 2018 at par. The Company has unconditionally and irrevocably guaranteed the due and punctual performance by the Issuer of all of its obligations (including payments) in respect of the 2.5 per cent bonds and the obligations of the Company, as Guarantor, constitute direct, unsubordinated and unsecured obligations of the Company.
Subject to certain conditions, the 2.5 per cent bonds are convertible into preference shares of the Issuer which are automatically transferred to the Company in exchange for ordinary shares in the Company or (at the Company’s election) any combination of ordinary shares and cash. The 2.5 per cent bonds can be converted at any time from 14 November 2012 up to the 20th dealing day before the maturity date.
The initial exchange price was £4.3752 per ordinary share, a conversion rate of approximately 22,856 ordinary shares for every £100,000 nominal of the 2.5 per cent bonds. Under the terms of the 2.5 per cent bonds, the exchange price is adjusted on the happening of certain events including the payment of dividends by the Company. Accordingly, subsequent dividend adjustments resulted in an exchange price at 31 December 2013 of £4.1199 per ordinary share.
The 2.5 per cent bonds may be redeemed at par at the Company’s option subject to the Company’s ordinary share price having traded at 30 per cent above the conversion price for a specified period, or at any time once 85 per cent by nominal value of the 2.5 per cent bonds originally issued have been converted or cancelled. If not previously converted, redeemed or purchased and cancelled, the 2.5 per cent bonds will be redeemed at par on 4 October 2018.
A total of £300.0 million nominal of the 2.5 per cent bonds were issued and remain outstanding at 31 December 2013. The 2.5 per cent bonds are designated as at fair value through profit or loss and so are presented on the balance sheet at fair value with all gains and losses taken to the income statement through the changes in fair value of financial instruments line. At 31 December 2013, the fair value of the 2.5 per cent bonds was £312.8 million (2012 – £311.0 million), with the change in fair value presented in note 10. The 2.5 per cent bonds are listed on the Professional Securities Market of the London Stock Exchange.
During the year interest of £7.5 million (2012 – £1.8 million) in respect of these bonds has been recognised within finance costs.
3.75 per cent convertible bonds (“the 3.75 per cent bonds”)
On 28 January 2011 the Company issued £127.6 million, 3.75 per cent perpetual subordinated convertible bonds as part of the consideration for the acquisition of intu Trafford Centre. As a condition of the acquisition the Company also issued to the Peel Group £26.7 million of convertible bonds for a subscription amount of £23.7 million and an implied issue price of the underlying shares of £3.55 per share.
A total of £154.3 million of the 3.75 per cent bonds were issued and remain outstanding at 31 December 2013 (2012 – £154.3 million). These are accounted for as equity at their fair value on issue which totalled £143.7 million (2012 – £143.7 million).
The 3.75 per cent bonds can be converted at the option of the bondholder at any time from 28 January 2013 at £4.00 per ordinary share, a conversion rate of 250 ordinary shares for every £1,000 nominal. Full conversion would result in 38,579,250 ordinary shares being issued.
The 3.75 per cent bonds became redeemable at their principal amount at the Company’s option from 28 January 2014, on any subsequent interest payment date, or at any time once 85 per cent or more of the principal amount of the bonds originally issued have been converted or cancelled.
During the year interest of £5.8 million (2012 – £5.8 million) has been recognised on these bonds directly in equity. This is deducted in arriving at earnings per share (note 13).

45
Notes (continued)
23 Deferred tax provision
Under IAS 12 Income Taxes, provision is made for the deferred tax assets and liabilities associated with the revaluation of assets and liabilities at the corporate tax rate expected to apply to the Group at the time the temporary differences are expected to reverse. For those UK assets and liabilities benefitting from REIT exemption, the relevant tax rate will be 0 per cent (2012 – 0 per cent), for other UK assets and liabilities the relevant rate will be 20 per cent (2012 – 23 per cent) and for other assets and liabilities the relevant tax rate will be the prevailing corporate tax rate in the relevant country.
Movements in the provision for deferred tax:
Investment
and Derivative Other
development Other financial temporary
property investments instruments differences Total
£m £m £m £m £m
Provided deferred tax provision/(asset):
At 1 January 2012 – 5.0 (8.0) 3.0 –
Recognised in the income statement – (1.9) (3.2) (0.5) (5.6)
Recognised in other comprehensive income – 5.6 – – 5.6
At 31 December 2012 – 8.7 (11.2) 2.5 –
On acquisition of subsidiaries (note 26) 12.0 – – – 12.0
Recognised in the income statement 0.2 (1.9) 3.2 (2.9) (1.4)
Recognised in other comprehensive income – 1.6 – – 1.6
Foreign exchange movements (0.2) – – – (0.2)
At 31 December 2013 12.0 8.4 (8.0) (0.4) 12.0
Unrecognised deferred tax asset:
At 1 January 2013 (0.2) – (37.1) (36.4) (73.7)
Income statement items (0.1) – 14.0 (9.4) 4.5
At 31 December 2013 (0.3) – (23.1) (45.8) (69.2)
In accordance with the requirements of IAS 12 Income Taxes, the deferred tax asset has not been recognised in the Group financial statements due to uncertainty over the level of profits that will be available in the non-REIT elements of the Group in future periods.
24 Share capital
£m
Issued and fully paid
At 31 December 2012 – 868,473,001 ordinary shares of 50p each 434.2
Shares issued 52.7
At 31 December 2013 – 973,845,701 ordinary shares of 50p each 486.9
On 27 February 2013 the Company announced a placing of 86 million new ordinary shares at a price of 325 pence per share. The placing represented in aggregate approximately 9.9 per cent of the Company’s issued share capital immediately prior to the placing. 28 per cent of the placing shares were denominated in Rand. As a result, share capital increased by £43.0 million, share premium by £65.3 million and merger reserve by £164.4 million.
On 4 June 2013 and 19 November 2013 the Company issued 10,693,407 and 6,837,832 new ordinary shares respectively to shareholders who elected to receive their 2012 final and 2013 interim dividends in shares under the Scrip Dividend Scheme. The value of the Scrip Shares was calculated in accordance with the terms of the Scrip Dividend Scheme, being the average middle market quotations for each day between 5 April to 11 April 2013 inclusive and between 27 September to 3 October 2013 inclusive respectively less the gross amount of dividend payable.
At 28 February 2014, the Company had an unexpired authority to repurchase shares up to a maximum of 95,447,300 shares with a nominal value of £47.7 million, and the Directors have an unexpired authority to allot up to a maximum of 300,626,428 shares with a nominal value of £150.3 million.
Included within the issued share capital as at 31 December 2013 are 12,620,925 ordinary shares (2012 – 11,351,172) held by the Trustee of the ESOP which is operated by the Company (note 25). The nominal value of these shares at 31 December 2013 is £6.3 million (2012 – £5.7 million).

46
Notes (continued)
25 Employee Share Ownership Plan ("ESOP")
The cost of shares in Intu Properties plc held by the Trustee of the Employee Share Ownership Plan operated by the Company is accounted for as a deduction from equity.
The purpose of the ESOP is to acquire and hold shares which will be transferred to employees in the future under the Group’s employee incentive arrangements. Dividends of £1.8 million (2012 – £1.7 million) in respect of these shares have been waived by agreement.
2013 2012
Shares Shares
million £m million £m
At 1 January 11.4 43.9 6.8 29.5
Acquisitions 2.0 7.0 4.8 15.6
Disposals (0.8) (2.7) (0.2) (1.2)
At 31 December 12.6 48.2 11.4 43.9
26 Business combinations
Acquisitions during 2013
Acquisition of Midsummer Place
On 25 March 2013, the Group acquired 100 per cent of the Midsummer Place Shopping Centre with certain integrated activities, assets and liabilities for cash consideration of £248.6 million. Assets and liabilities acquired consisted of investment property with book and fair value of £250.5 million, along with other payables with book and fair value of £1.9 million. Consideration was equal to the fair value of assets and liabilities acquired and so no goodwill arose. Acquisition related costs of £11.2 million were incurred and recognised in the income statement in exceptional administration expenses.
During the year the acquired business contributed £11.4 million to the revenue and £9.3 million to the profit of the Group.
Acquisition of Parque Principado
In 2013, the Group and CPP Investment Board Real Estate Holdings Inc. (CPPIB) together established Parque Principado S.à r.l., set up for the purpose of acquiring Parque Principado. On 4 October 2013 a 100 per cent owned subsidiary of Parque Principado S.à r.l. acquired 100 per cent of the share capital of Parque Principado S.L. and other properties for total cash consideration of €168.6 million (£142.6 million). The businesses acquired form Parque Principado, a shopping centre in Oviedo, Spain. Acquisition related costs of £2.0 million were incurred and recognised in the income statement in exceptional administration expenses.
CPPIB hold a 49 per cent non-controlling interest in Parque Principado S.à r.l., the holding company for the Group's Parque Principado investment, and provided funding of £71.1 million. In 2014, following the successful completion of certain preconditions including regulatory approval, CPPIB exercised an option allowing them to acquire an additional one per cent of debt and equity, on terms in line with the original acquisition. At the date of signing these financial statements this transaction has not completed. The exercise of this option results in Parque Principado S.à r.l. becoming a joint venture.
The fair value of assets and liabilities acquired is set out in the table below:
Fair value
£m
Assets Investment property 144.7 Trade and other receivables 1.1 Cash and cash equivalents (including restricted cash of £4.1 million) 13.0 Total assets 158.8 Liabilities Trade and other payables (8.4) Deferred tax liabilities (12.0) Total liabilities (20.4)
Net assets 138.4
The fair value of the consideration of £142.6 million exceeded the fair value of the assets and liabilities acquired resulting in the recognition of goodwill of £4.2 million in the balance sheet on acquisition. The goodwill arose due to the recognition of a deferred tax liability. The deferred tax liability is calculated, as required under IFRS, on the basis of the tax gain that would arise in the acquired company were it to dispose of the asset.
During the year the acquired businesses contributed £3.4 million to the revenue and £2.8 million to the profit of the Group.

47
Notes (continued)
27 Capital commitments
At 31 December 2013, the Board had approved £86.1 million (2012 – £50.0 million) of future expenditure for the purchase, construction, development and enhancement of investment property. Of this, £54.3 million (2012 – £20.0 million) is contractually committed. The majority of this is expected to be spent in 2014.
None of these capital commitments relate to the Group’s interest in joint ventures.
28 Contingent liabilities
As at 31 December 2013, the Group has no material contingent liabilities other than those arising in the normal course of business.
29 Cash generated from operations
2013 2012
Notes £m £m
Profit before tax and associates 362.9 152.6
Remove:
Revaluation and sale of investment and development property 6 (125.8) (40.9)
Gain on acquisition of subsidiaries – (2.3)
Sale of other investments – (1.4)
Impairment of goodwill – 8.8
Distribution of shares received from Provogue – (10.2)
Depreciation 1.8 1.5
Share-based payments 2.0 3.8
Lease incentives and letting costs (11.4) (3.2)
Finance costs 8 197.2 197.3
Finance income (0.6) (0.2)
Other finance costs 9 164.5 67.9
Change in fair value of financial instruments 10 (273.8) (30.5)
Changes in working capital:
Change in trading property 1.7 5.4
Change in trade and other receivables (4.9) (0.7)
Change in trade and other payables 4.0 (8.7)
Cash generated from operations 317.6 339.2
30 Related party transactions
Key management1 compensation is analysed below:
2013 2012
£m £m
Salaries and short-term employee benefits 4.8 4.6
Pensions and other post-employment benefits 0.4 0.4
Share-based payments 1.3 2.2
6.5 7.2
1 Key management comprise the Directors of Intu Properties plc and employees who have been designated as persons discharging managerial responsibility.

48
Notes (continued) 30 Related party transactions (continued)
As John Whittaker, Deputy Chairman and Non-Executive Director of Intu, is the Chairman of the Peel Group, members of the Peel Group are considered to be related parties. Total transactions between the Group and members of the Peel Group are shown below:
2013 2012
£m £m
Income 2.7 2.4
Expenditure (1.0) (0.6)
Income predominantly relates to leases of office space and a contract to provide advertising services. Expenditure predominantly relates to costs incurred under a management services agreement and the supply of utilities. All contracts are on an arm’s length basis at commercial rates.
Balances outstanding between the Group and members of the Peel Group as at 31 December 2013 are shown below:
2013 2012
£m £m
Amounts owed by members of the Peel Group 0.1 –
Amounts owed to members of the Peel Group (0.1) (0.1)
Under the terms of the Group’s acquisition of intu Trafford Centre from the Peel Group, the Peel Group have provided a guarantee in respect of Section 106 planning obligation liabilities at Barton Square which as at 31 December 2013 totalled £11.3 million (2012 – £11.0 million).
In 2012, the Group acquired for €2.5 million, alongside a refundable deposit of €7.5 million, a three year option to purchase two parcels of land in the province of Malaga, Spain from Peel Holdings Limited. In 2013 this option was extended for a further year for no consideration as provided for in the original terms.
31 General information
The Company is a public limited company incorporated in England and Wales and domiciled in the UK. The address of its registered office is 40 Broadway, London SW1H 0BT.
The Company has its primary listing on the London Stock Exchange. The Company has a secondary listing on the Johannesburg Stock Exchange, South Africa.

49
INVESTMENT AND DEVELOPMENT PROPERTY (unaudited)
Property data
Net
Market initial “Topped Nominal
value Yield up” equivalent
£m Ownership Note
(EPRA) NIY (EPRA) yield Occupancy
As at 31 December 2013
intu Trafford Centre 1,900.0 100% 4.2% 4.6% 5.1% 97% intu Lakeside 1,124.5 100% 4.8% 4.9% 5.5% 95% intu Metrocentre 885.2 90%
A 5.0% 5.2% 5.8% 94%
intu Braehead 602.3 100%
4.4% 4.6% 5.9% 90%
Manchester Arndale 399.0 48% B
5.0% 5.1% 5.5% 97%
intu Watford 323.0 93%
4.7% 4.9% 6.5% 94%
intu Victoria Centre 306.0 100%
4.7% 4.8% 6.6% 98%
St David’s, Cardiff 272.2 50%
5.2% 5.6% 5.7% 94%
Midsummer Place 251.0 100%
5.1% 5.1% 5.5% 98%
intu Eldon Square 250.2 60%
4.8% 4.9% 6.6% 96%
intu Chapelfield 245.5 100%
5.7% 5.7% 6.4% 94%
Cribbs Causeway 241.5 33% C
4.2% 4.6% 5.8% 92%
intu Uxbridge 213.9 100%
5.4% 5.8% 6.4% 95%
intu Potteries 162.6 100%
6.1% 6.4% 7.6% 92%
intu Bromley 159.2 64%
5.5% 5.6% 7.5% 87%
Parque Principado 143.1 100% D
6.9% 7.1% 7.2% 98%
Other 144.6 E
Total investment and development
property 7,623.8
4.74% 4.97% 5.79% 95%
As at 31 December 2012 7,073.1
5.04% 5.24% 5.94% 96%
Notes A Interest shown is that of the Metrocentre Partnership in intu Metrocentre (90 per cent) and the Metro Retail Park (100 per cent). The Group has a 60 per cent interest in the Metrocentre Partnership which is consolidated as a subsidiary of the Group. B The Group's interest is through a joint venture ownership of a 95 per cent interest in Manchester Arndale, and a 90 per cent interest in New Cathedral Street, Manchester. C The Group's interest is through a joint venture ownership of a 66 per cent interest in The Mall at Cribbs Causeway and a 100 per cent interest in The Retail Park, Cribbs Causeway. D Interest shown is that of the wholly owned subsidiaries of Parque Principado S.à r.l. in which the Group has a 51 per cent economic interest and which is consolidated as a subsidiary of the Group. E Includes the Group’s 67 per cent economic interest in intu Broadmarsh and the Group's 100 per cent interest in Braehead Leisure.
31 December 31 December
2013 2012
£m £m
Passing rent
367.9 357.5
ERV
476.0 456.0
Weighted average unexpired lease term
7.5 years 7.8 years
Please refer to the Glossary for the definition of terms.
Analysis of capital return in the year Market value Revaluation surplus
2013 2012 2013
£m £m £m %
Like-for-like property 7,199.6 7,051.2 124.9 1.8
Acquisitions 394.9 – 1.3 0.3
Developments 29.3 21.9 (0.4) (1.5)
Total investment and development property 7,623.8 7,073.1 125.8 1.7

50
FINANCIAL COVENANTS (unaudited)
Intu (SGS) Finance plc and Intu (SGS) Finco Limited (“Secured Group Structure”) Interest Interest Loan LTV LTV cover cover £m Maturity covenant* actual covenant* actual
Term loan 351.8 2018 3.875 per cent bonds 450.0 2023 4.625 per cent bonds 350.0 2028 1,151.8 80% 48% 125% 231% * Tested on the Security Group, the principle assets of which are intu Lakeside, intu Braehead, intu Watford and intu Victoria Centre.
The structure has a tiered operating covenant regime giving the Group a significant degree of flexibility when the covenants are below certain levels. In higher tiers the level of flexibility is reduced. The Group retains operating control below loan to value of 72.5 per cent and interest cover above 1.4x. No financial covenant default occurs unless the loan to value exceeds 80 per cent or the interest cover falls below 1.25x.
The Trafford Centre Finance Limited
There are no financial covenants on the intu Trafford Centre debt of £719.7 million at 31 December 2013. However a debt service cover ratio is assessed quarterly and where this falls below specified levels restrictions come into force. The loan to 31 December 2013 market value ratio is 40 per cent.
Intu Metrocentre Finance plc Interest Interest Loan LTV LTV cover cover £m Maturity covenant actual covenant actual
*
4.125 per cent bonds 485.0 2023 100% 55% 125% 222% * Calculation presented based on a full 12 month period of income and finance costs, not just the period since the issue of the bond.
The structure’s covenant regime gives the Group a significant degree of flexibility when the covenants are below certain levels. The Group retains operating control below loan to value of 70 per cent and interest cover above 1.4x. No financial covenant default occurs unless loan to value exceeds 100 per cent or interest cover falls below 1.25x.
Intu Debenture plc
Capital Capital Interest Interest Loan cover cover cover cover £m Maturity covenant actual covenant actual
227.6 2027 150% 204% 100% 106%
The debenture is currently secured on a number of the Group’s properties including intu Potteries, intu Eldon Square and intu Broadmarsh.
Should the capital cover or interest cover test be breached, Intu Debenture plc (the "issuer") has three months from the date of delivery of the valuation or the latest certificate to the Trustees to make good any deficiencies. The issuer may withdraw property secured on the debenture by paying a sum of money or through the substitution of alternative property provided that the capital cover and interest cover tests are satisfied immediately following the substitution.

51
FINANCIAL COVENANTS (continued) (unaudited) Other asset–specific debt Loan outstanding at Loan to Interest Interest 31 January 2014
1 LTV 31 December 2013 cover cover
£m Maturity covenant market value2 covenant actual
3
intu Chapelfield 204.9 2016 n/a 83% 120% 160%
intu Uxbridge 147.0 2016 80% 69% 120% 181% Midsummer Place 125.3 2016 65% 50% 150% 329% intu Bromley 116.0 2016 80% 73% 120% 191% St David’s, Cardiff
4 78.6 2014 65% 29%
180% 341%
Braehead Leisure 42.9 2014 80% 75%
120% 260% Barton Square 42.5 2017 65% 54% 175% 202% 1 The loan values are the actual principal balances outstanding at 31 January 2014, which take into account any principal repayments made in January 2014. The balance sheet value of the loans includes any unamortised fees. 2 The loan to 31 December 2013 market value provides an indication of the impact the 31 December 2013 property valuations could have on the LTV covenants. The actual timing and manner of testing LTV covenants varies and is loan specific. 3 Based on latest certified figures, calculated in accordance with loan agreements, which have been submitted between 31 December 2013 and 31 January 2014. The calculations are loan specific and include a variety of historic, forecast and, in certain instances, a combined historic and forecast basis. 4 50 per cent of the debt is shown which is consistent with the accounting treatment and the Group’s economic interest. Financial covenants on corporate facilities at 31 December 2013
Interest Interest Borrowings/ Borrowings/ Net worth Net worth cover cover net worth net worth covenant actual covenant actual covenant actual
£375m facility, maturing in 2017* £750m £1,909m 120% 195% 110% 81%
£300m due 2018 2.5 per cent
convertible bonds** n/a n/a n/a n/a 175% 12%
* Tested on the Borrower Group which excludes, at the Group’s election, certain subsidiaries with asset–specific finance. The
facility is secured on the Group’s investments in Manchester Arndale and Cribbs Causeway.
** Tested on the Group excluding, at the Group’s election, the borrowings on certain subsidiaries with asset-specific finance.

52
UNDERLYING PROFIT STATEMENT (unaudited) For the year ended 31 December 2013
Six months Six months Six months Six months
Year ended Year ended ended ended ended ended
31 December 31 December 31 December 31 December 30 June 30 June
2013 2012 2013 2012 2013 2012
£m £m £m £m £m £m
Net rental income 369.5 362.6 188.5 180.8 181.0 181.8 Net other income 3.8 6.3 1.4 3.2 2.4 3.1 373.3 368.9 189.9 184.0 183.4 184.9 Administration expenses (27.7) (26.7) (13.8) (13.4) (13.9) (13.3) Underlying operating profit 345.6 342.2 176.1 170.6 169.5 171.6 Finance costs (197.2) (197.3) (98.7) (98.8) (98.5) (98.5) Finance income 0.6 0.2 – 0.1 0.6 0.1 Other finance costs (6.5) (6.9) (3.2) (3.4) (3.3) (3.5) Underlying net finance costs (203.1) (204.0) (101.9) (102.1) (101.2) (101.9) Underlying profit before tax and associates 142.5 138.2 74.2 68.5 68.3 69.7 Tax on underlying profit (0.9) (0.8) (0.6) (0.3) (0.3) (0.5) Remove amounts attributable to non-controlling interests 4.4 5.8 1.5 2.8 2.9 3.0 Share of underlying profit/(loss) of associates – 0.3 (0.1) 0.1 0.1 0.2 Interest on convertible bonds deducted directly in equity (5.8) (5.8) (2.9) (2.9) (2.9) (2.9) Underlying earnings 140.2 137.7 72.1 68.2 68.1 69.5 Underlying earnings per share (pence) 15.0p 16.1p 7.5p 8.0p 7.4p 8.1p Weighted average number of shares (million) 935.3 853.8 955.9 854.0 914.3 853.6 For the reconciliation from basic earnings per share, see note 13(c).
EPRA Cost Ratios
2013 2012
£m £m
Other non-recoverable costs
43.9 45.8
Administration expenses - ongoing
27.7 26.7
Net service charge costs
10.7 8.3
Remove:
Service charge costs recovered through rents
(2.5) (2.2)
EPRA costs - including direct vacancy costs
79.8 78.6
Direct vacancy costs
(13.5) (10.8)
EPRA costs - excluding direct vacancy costs
66.3 67.8
Rent receivable
447.6 441.4
Rent payable
(23.5) (24.7)
Gross rental income less ground rent payable
424.1 416.7
Remove:
Service charge costs recovered through rents
(2.5) (2.2)
Gross rental income
421.6 414.5
EPRA cost ratio (including direct vacancy costs)
18.9% 19.0%
EPRA cost ratio (excluding direct vacancy costs)
15.7% 16.4%

53
GLOSSARY
ABC1 customers
Proportion of customers within UK social groups A, B and C1, defined as members of households whose chief earner’s
occupation is professional, higher or intermediate management, or supervisory.
Annual property income
The Group’s share of passing rent plus the external valuers’ estimate of annual excess turnover rent and sundry income such
as that from car parks and mall commercialisation.
Debt to assets ratio
Net external debt divided by the market value of investment and development property.
Diluted figures
Reported amounts adjusted to include the effects of dilutive potential shares issuable under convertible bonds and
employee incentive arrangements.
Earnings per share
Profit for the period attributable to owners of Intu divided by the weighted average number of shares in issue during the period.
EPRA
European Public Real Estate Association, the publisher of Best Practice Recommendations intended to make financial
statements of public real estate companies in Europe clearer, more transparent and comparable.
ERV (estimated rental value)
The external valuers’ estimate of the Group’s share of the current annual market rent of all lettable space net of any
non–recoverable charges, before bad debt provision and adjustments required under IFRS regarding tenant lease incentives.
Exceptional items
Exceptional items are those items that in the Directors’ view are required to be separately disclosed by virtue of their size
or incidence to enable a full understanding of the Group’s financial performance.
Headline rent ITZA
Annual contracted rent per square foot after expiry of concessionary periods in terms of zone A.
Interest cover
Underlying operating profit excluding trading property related items divided by the net finance cost plus interest on
convertible bonds recognised in equity excluding the change in fair value of financial instruments, exceptional finance costs and
amortisation of compound financial instruments.
Interest rate swap
A derivative financial instrument enabling parties to exchange interest rate obligations for a predetermined period. These
are used by the Group to convert floating rate debt to fixed rates.
IPD
Investment Property Databank Ltd, producer of an independent benchmark of property returns.
Like–for–like property
Investment property which has been owned throughout both periods without significant capital expenditure in either period, so
that income can be compared on a like-for-like basis. For the purposes of comparison of capital values, this will also include
assets owned at the previous reporting period end but not throughout the prior period.
Long-term lease
A lease with a term certain of at least five years.
LTV (loan to value)
LTV is the ratio of attributable debt to the market value of an investment property.
NAV per share (diluted, adjusted)
NAV per share calculated on a diluted basis and adjusted to reflect any unrecognised surplus on trading properties (net of
tax), to remove the fair value of derivatives (net of tax), to remove goodwill resulting from the recognition of deferred tax liabilities,
and to remove deferred tax on investment and development property and other investments.
Net asset value (NAV) per share
Net assets attributable to owners of Intu Properties plc divided by the number of ordinary shares in issue at the
period end.

54
Net external debt
Net debt after removing the Metrocentre compound financial instrument and, for 31 December 2013, short-term investments
representing CMBS notes issued in respect of intu Metrocentre and received as cash in February 2014.
Net initial yield (EPRA)
Annualised net rent on investment property (after deduction of revenue costs such as head rent, running void, service
charge after shortfalls, empty rates and merchant association contribution) expressed as a percentage of the gross market
value before deduction of theoretical acquisition costs, consistent with EPRA’s net initial yield, and as provided by the Group’s
independent external valuers.
Net rental income
The Group’s share of net rents receivable as shown in the income statement, having taken due account of non-recoverable
costs, bad debt provisions and adjustments to comply with IFRS including those regarding tenant lease incentives.
NNNAV per share (diluted, adjusted)
NAV per share (diluted, adjusted) adjusted to include the fair values of derivatives, debt and deferred taxes.
Nominal equivalent yield
Effective annual yield to a purchaser from an asset at market value before taking account of notional acquisition costs assuming rent
is receivable annually in arrears, reflecting ERV but disregarding potential changes in market rents, as determined by the Group’s
independent external valuers.
Occupancy
The passing rent of let and under offer units expressed as a percentage of the passing rent of let and under offer units plus
ERV of un-let units, excluding development and recently completed properties. Units let to tenants in administration and still
trading are treated as let and those no longer trading are treated as un-let.
Passing rent
The Group’s share of contracted annual rents receivable at the balance sheet date. This takes no account of accounting
adjustments made in respect of rent free periods or tenant incentives, the reclassification of certain lease payments as
finance charges or any irrecoverable costs and expenses, and does not include excess turnover rent, additional rent in
respect of unsettled rent reviews or sundry income such as from car parks etc. Contracted annual rents in respect of
tenants in administration are excluded.
PMA
Property Market Analysis LLP, a producer of property market research and forecasting.
Property Income Distribution (PID)
A dividend, generally subject to UK withholding tax at the basic rate of income tax, that a UK REIT is required to pay to its
shareholders from its qualifying rental profits. Certain classes of shareholder may qualify to receive a PID gross,
shareholders should refer to intugroup.co.uk for further information. The Group can also pay non-PID dividends which are
not subject to UK withholding tax.
Real Estate Investment Trust (REIT)
A tax regime which exempts from corporation tax the rental profits and capital gains of the REIT’s qualifying investment
property activities. In the UK, the regime must be elected into and the REIT must meet certain ongoing qualifications,
including the requirement to distribute at least 90 per cent of qualifying rental profits to shareholders. The Group elected
for REIT status with effect from 1 January 2007.
Scrip dividend scheme
The Group offers shareholders the opportunity to participate in the Scrip Dividend Scheme. This enables participating shareholders
to receive shares instead of cash when a Scrip Alternative is offered for a particular dividend.
Short-term lease
A lease with a term certain of less than five years.
Tenant (or lease) incentives
Any incentives offered to occupiers to enter into a lease. Typically incentives are in the form of an initial rent free period
and/or a cash contribution to fit-out the premises. Under IFRS the value of incentives granted to tenants is amortised
through the income statement on a straight-line basis over the lease term.
Topped up NIY (EPRA)
Net initial yield adjusted for the expiration of rent free periods and other unexpired lease incentives.
Total financial return
The change in NAV per share (diluted, adjusted) plus dividends per share paid in the period expressed as a percentage of
opening NAV per share (diluted, adjusted).

55
Trading property
Property held for trading purposes rather than to earn rentals or for capital appreciation and shown as a current asset in the
balance sheet.
Underlying earnings per share (EPS)
Earnings per share adjusted to exclude valuation movements, exceptional items and related tax.
Underlying figures
Amounts described as underlying exclude valuation movements, exceptional items and related tax.
Vacancy rate (EPRA)
The ERV of vacant space divided by total ERV.
Yield shift
A movement (usually expressed in basis points) in the yield of a property asset.

56
DIVIDENDS
The Directors of Intu Properties plc have proposed a final dividend per ordinary share (ISIN GB0006834344) of 10 pence (2012 – 10 pence) to bring the total dividend per ordinary share for the year to 15 pence (2012 – 15 pence). A scrip dividend alternative will be offered.
The dividend may be partly paid as a Property Income Distribution (“PID”) and partly paid as a non-PID. The PID element will be subject to deduction of a 20 per cent withholding tax unless exemptions apply (please refer to the PID special note below). Any non-PID element will be treated as an ordinary UK company dividend. For South African shareholders, non-PID cash dividends may be subject to deduction of South African Dividends Tax at 15 per cent.
The precise timetable for the proposed dividend payment, and details of the apportionment between the PID and non-PID elements per share, will be confirmed in due course and made available on the Company’s website.
PID SPECIAL NOTE:
UK shareholders:
For those who are eligible for exemption from the 20 per cent withholding tax and have not previously registered for exemption, an HM Revenue & Customs (“HMRC”) Tax Exemption Declaration is available for download from the “Investors” section of the Intu Properties plc website (intugroup.co.uk), or on request to our UK registrars, Capita Asset Services. Validly completed forms must be received by Capita Asset Services no later than the dividend Record Date, to be advised; otherwise the dividend will be paid after deduction of tax.
South African and other non-UK shareholders:
South African shareholders may apply to HMRC after payment of the dividend for a refund of the difference between the 20 per cent withholding tax and the UK/South African double taxation treaty rate of 15 per cent. Other non-UK shareholders may be able to make similar claims for a refund of UK withholding tax deducted. Refund application forms for all non-UK shareholders are available for download from the “Investors” section of the Intu Properties plc website (intugroup.co.uk), or on request to our South African registrars, Computershare, or HMRC. UK withholding tax refunds are not claimable from Intu Properties plc, the South African Revenue Service (“SARS”) or other national authorities, only from the UK’s HMRC.
Additional information on PIDs can be found at intugroup.co.uk/investors/shareholders-bondholders/real-estate-investment-trust/.
The above does not constitute advice and shareholders should seek their own professional guidance. Intu Properties plc does not accept liability for any loss suffered arising from reliance on the above.
Sponsor: Merrill Lynch South Africa Proprietary Limited