Embed Size (px)
Citation preview
Ch. 30 - 166
The World of Energy
30.13. ConocoPhillips Optimized Cascade
Chapter 30 LNG Technology - Processes
Ch. 30 - 167
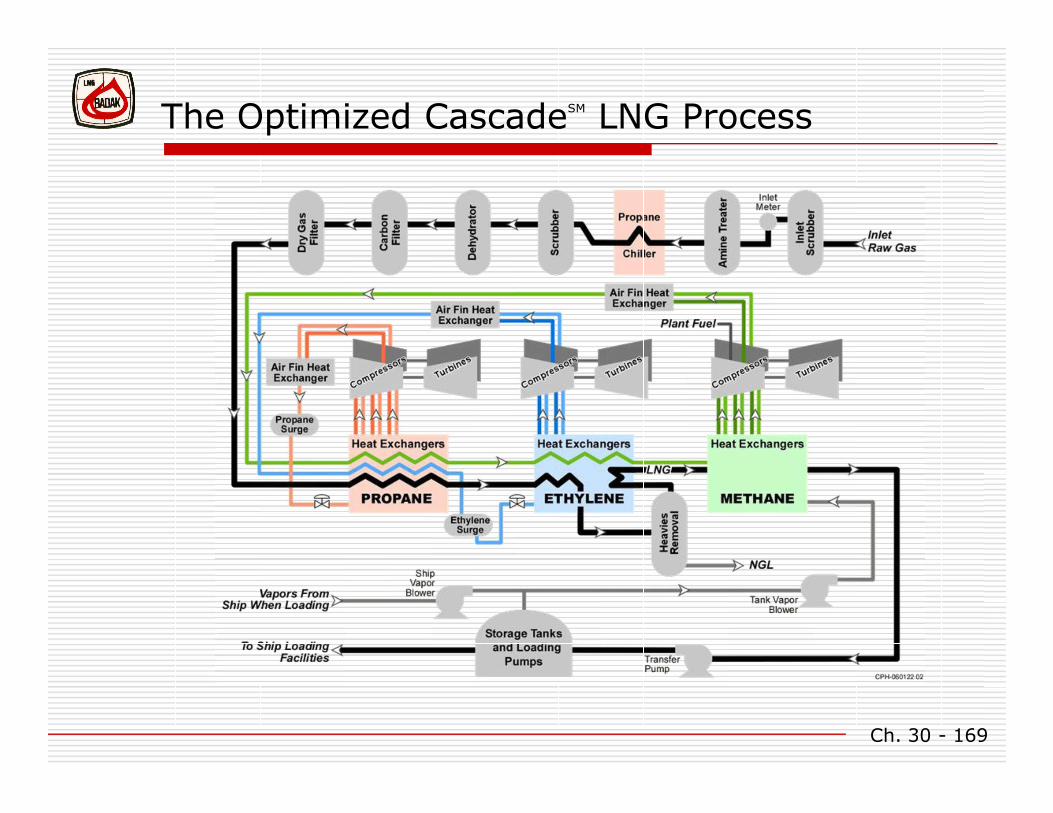
TreatedGas LNG
Propane
Ethane
Methane
Phillips Optimised Cascade Process
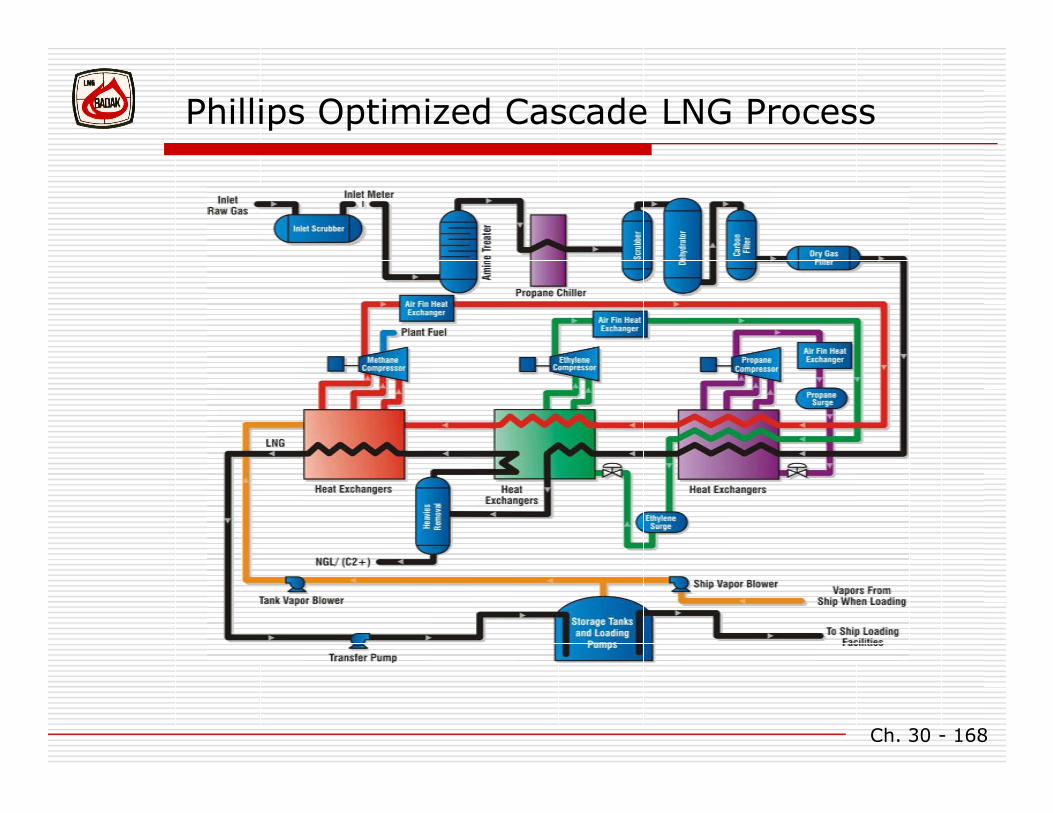
Ch. 30 - 168
Phillips Optimized Cascade LNG Process
Ch. 30 - 169
The Optimized CascadeSM LNG Process
Ch. 30 - 170
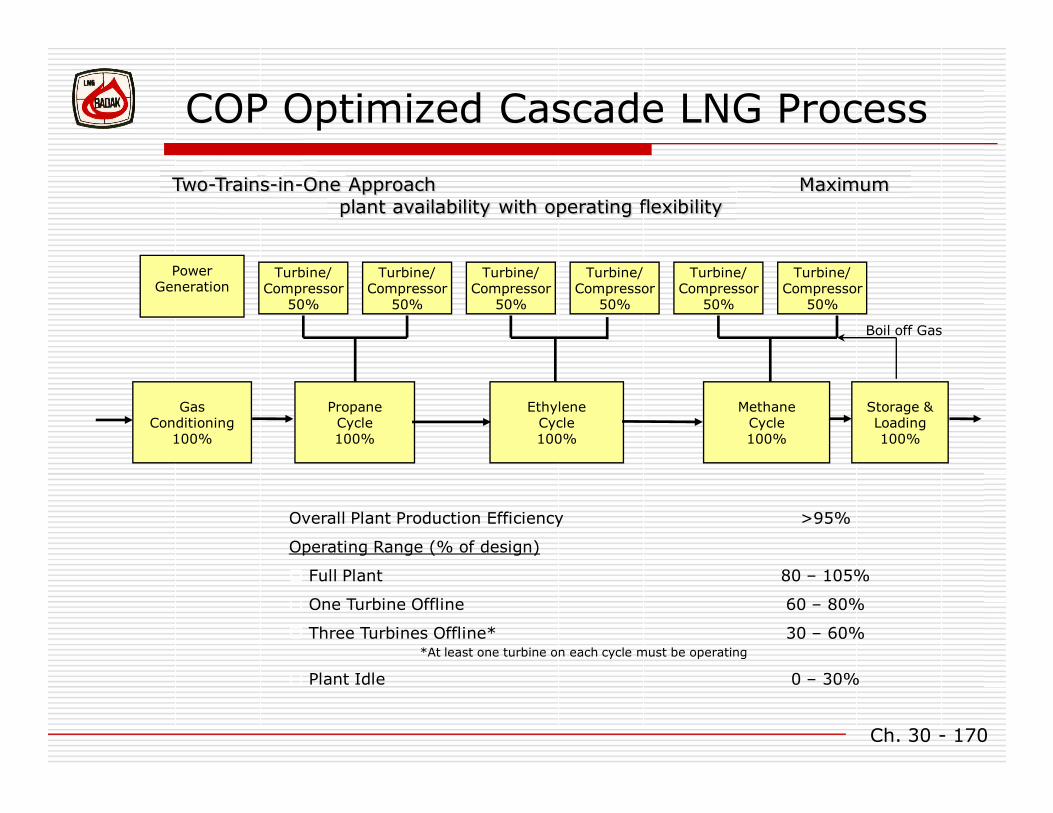
GasConditioning
100%
PropaneCycle100%
EthyleneCycle100%
MethaneCycle100%
Storage &Loading100%
Turbine/Compressor
50%
Turbine/Compressor
50%
Turbine/Compressor
50%
Turbine/Compressor
50%
Turbine/Compressor
50%
Turbine/Compressor
50%
Boil off Gas
Power Generation
Overall Plant Production Efficiency >95%
Operating Range (% of design)
Full Plant 80 105%
One Turbine Offline 60 80%
Three Turbines Offline**At least one turbine on each cycle must be operating
30 60%
Plant Idle 0 30%
COP Optimized Cascade LNG Process
Two-Trains-in-One Approach Maximum plant availability with operating flexibility
Ch. 30 - 171
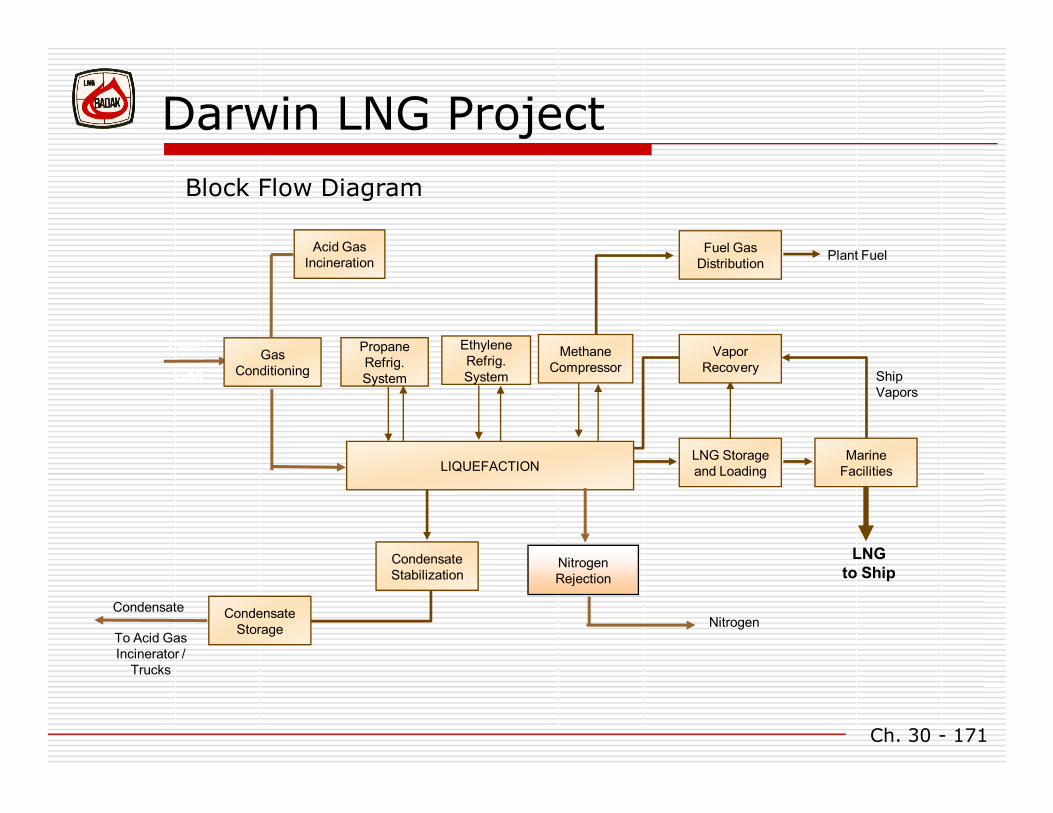
PropaneRefrig. System
EthyleneRefrig. System
MethaneCompressor
VaporRecovery
LNG Storageand LoadingLIQUEFACTION
MarineFacilities
CondensateStabilization
CondensateStorage
Fuel GasDistribution
Plant Fuel
ShipVapors
LNG
to ShipNitrogenRejection
NitrogenCondensate
To Acid Gas Incinerator /
Trucks
Acid Gas Incineration
Feed
Gas
GasConditioning
Block Flow Diagram
Darwin LNG Project
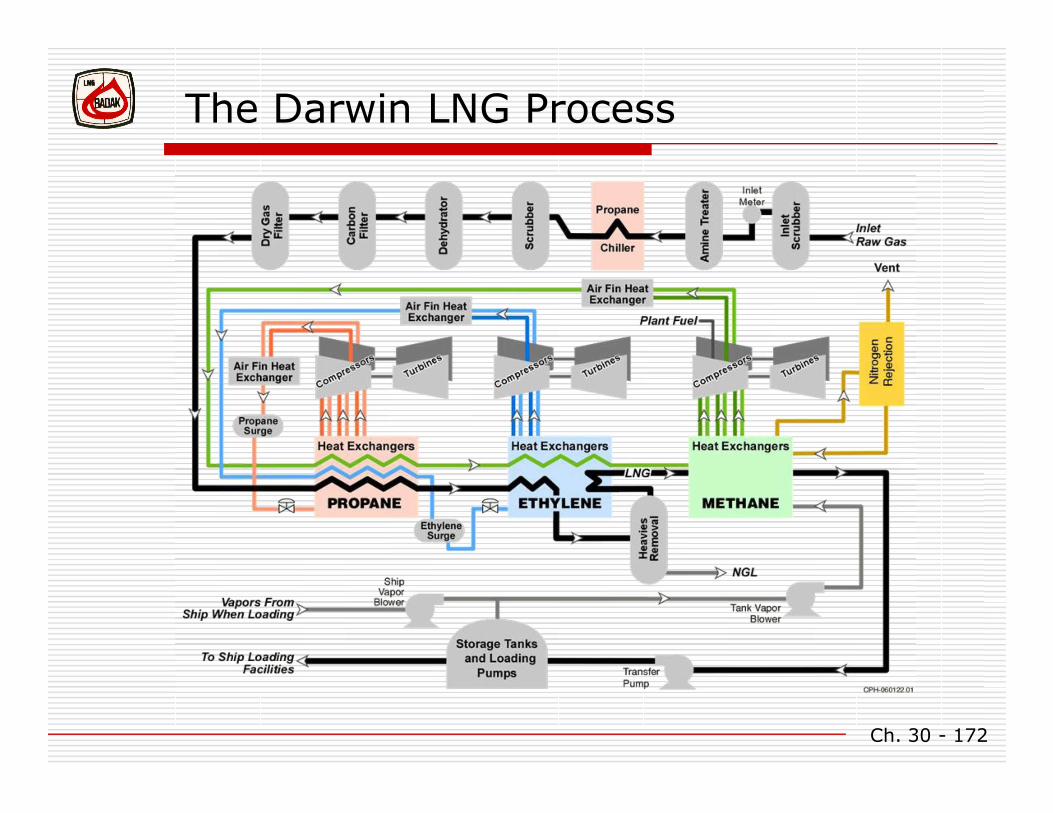
Ch. 30 - 172
The Darwin LNG Process
Ch. 30 - 173
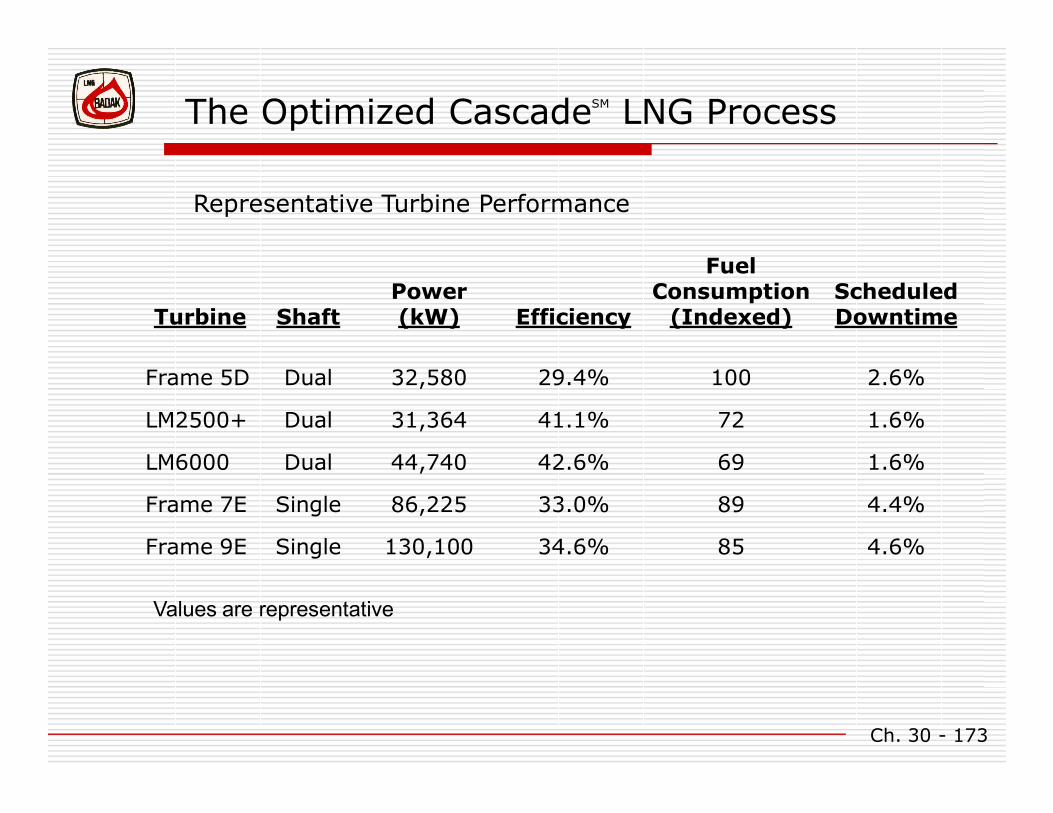
Values are representative
Turbine ShaftPower(kW) Efficiency
FuelConsumption
(Indexed)ScheduledDowntime
Frame 5D Dual 32,580 29.4% 100 2.6%
LM2500+ Dual 31,364 41.1% 72 1.6%
LM6000 Dual 44,740 42.6% 69 1.6%
Frame 7E Single 86,225 33.0% 89 4.4%
Frame 9E Single 130,100 34.6% 85 4.6%
The Optimized CascadeSM LNG Process
Representative Turbine Performance

Ch. 30 - 174
The Optimized CascadeSM LNG Process
Frame 7 Power
Frame 7 Heat
Rate
LM6000 Power
LM6000 Heat
Rate
50
60
70
80
90
100
110
120
0 10 20 30 40 50 60
Inlet Air Temperature (C)
Power and Heat Rate Index
(ISO=100)
Aeroderivatives are more sensitive to ambient conditions
Turbine Performance
Ch. 30 - 175
The Optimized CascadeSM LNG Process
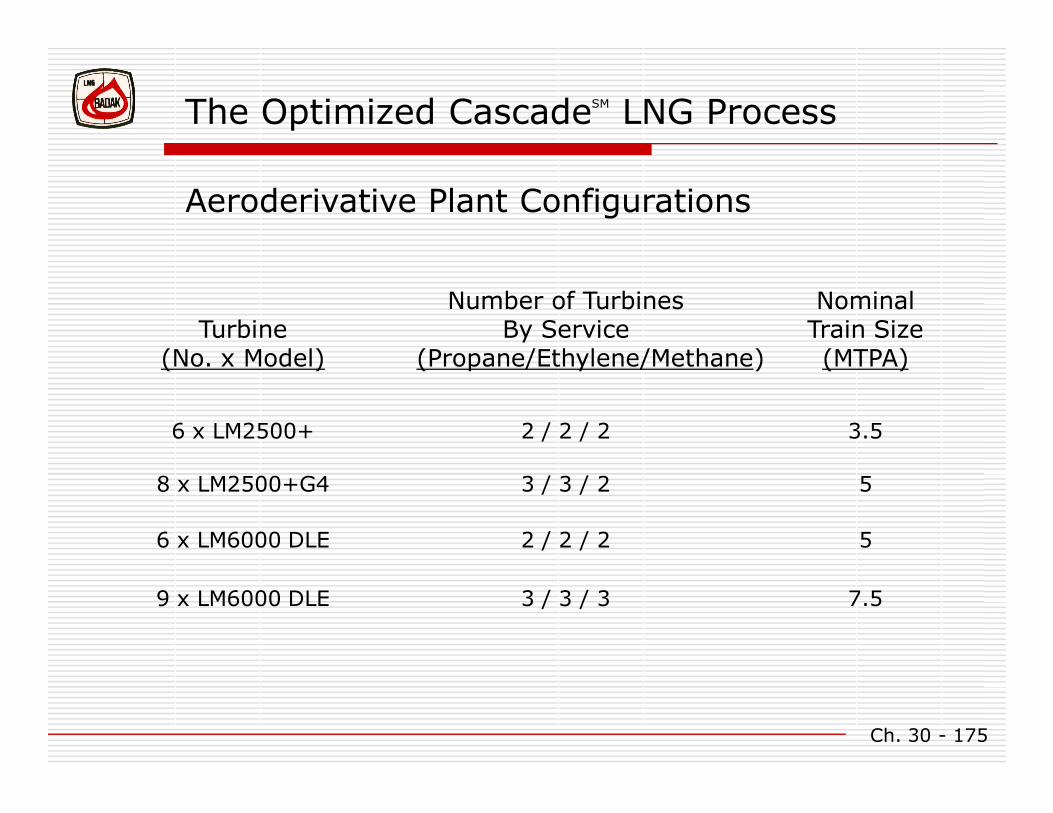
Turbine(No. x Model)
Number of TurbinesBy Service
(Propane/Ethylene/Methane)
NominalTrain Size(MTPA)
6 x LM2500+ 2 / 2 / 2 3.5
8 x LM2500+G4 3 / 3 / 2 5
6 x LM6000 DLE 2 / 2 / 2 5
9 x LM6000 DLE 3 / 3 / 3 7.5
Aeroderivative Plant Configurations
Ch. 30 - 176
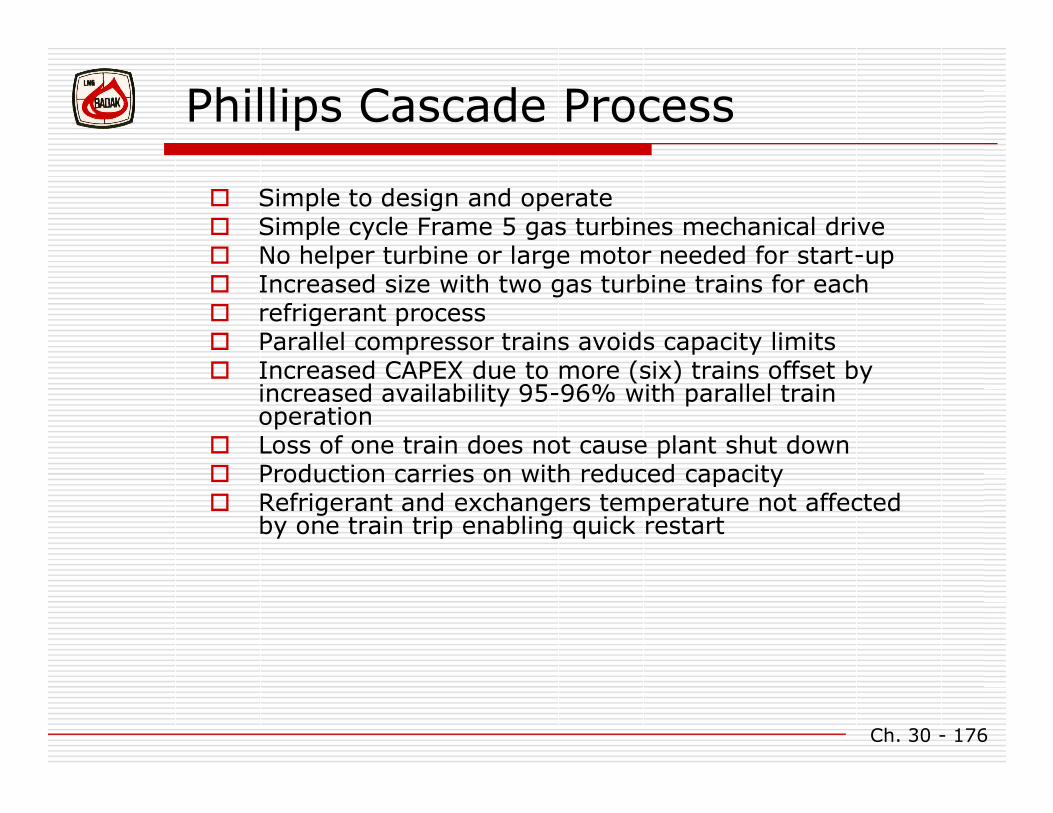
Phillips Cascade Process
Simple to design and operateSimple cycle Frame 5 gas turbines mechanical driveNo helper turbine or large motor needed for start-upIncreased size with two gas turbine trains for eachrefrigerant processParallel compressor trains avoids capacity limitsIncreased CAPEX due to more (six) trains offset by increased availability 95-96% with parallel train operationLoss of one train does not cause plant shut downProduction carries on with reduced capacityRefrigerant and exchangers temperature not affected by one train trip enabling quick restart