Embed Size (px)
Citation preview

INTRADEPARTMENTAL CORRESPONDENCE
June 7, 201316.2
TO: The Honorable Board of Police Commissioners
FROM: Chief of Police
SUBJECT: ANALYSIS OF TRAFFIC COLLISIONS OVER THE LAST FIVE YEARS
RECOMMENDED ACTIONS
1. That the Board of Police Commissioners (Board) REVIEW and APPROVE thisreport; and,
2. That the Board TRANSMIT this report to the Public Safety Committee.
BACKGROUND
On January 4, 2013, a motion was made at the Public Safety Committee byCouncilmember Joe Buscaino, City Council District 15, directing the Los Angeles PoliceDepartment (Department) to report on the efforts taken to curtail hit and run traffic collisions.It was further requested that the Department identify additional resources, if any, which wouldassist in reducing the number of these incidents occurring within the City of Los Angeles (City).The Board directed the Department to conduct a comprehensive review and submit a report.
Traffic Coordination Section, Emergency Operations Division (EOD), conducted a review of hitand run statistics, enforcement efforts, prosecutions, and compared the City's statistical data withfive other metropolitan cities. The analysis revealed that the hit and run comparison referencedin recent media reports was misleading due to differences in the reporting criteria for trafficcollisions in various cities across the country. The attached report provides information relativeto various hit and run statistics as well as the variations in reporting criteria used by othermunicipalities.
To assist in better understanding the incidence of hit and run in the City in comparison to othermunicipalities, the attached report provides comparison information based on factors such asinjury rates, vehicle miles traveled, and other considerations. Also included is informationrelative to the involvement of bicyclists and pedestrians in fatal or severe injury hit and runcollisions.
In summary, the more balanced comparison shows that the City's hit and run rate wascomparable to other metropolitan cities in the nation. When hit and run figures were consideredin light of vehicle miles traveled, City residents were less likely to be involved in an injury orfatal hit and run than those in New York, Houston, and Chicago.

The Honorable Board of Police Commissioners
Page 216.2
While over the last five years the vast majority of hit and run collisions involve property damageonly, more individuals were killed or severely injured as a result of a hit and run collision thanby driving under the influence collisions. Additionally, while pedestrian fatal and severe injuryhit and run collisions have decreased 33 percent over the past five years, bicycle fatal and severe
injury collisions have increased.
The attached report outlines current efforts being made to curtail hit and runs, includinginvestigative results and prosecutions, causes of hit and run collisions, impacts of current Statelaw, as well as policy recommendations to further address the issue.
If you have any questions or concerns regarding this correspondence, please contact CaptainPhilip S. Fontanetta, Commanding Officer, EOD, (213) 486-0680.
Respectfully,
CHARLIE BECKChief of Police
Attachment

FACT SHEET
FIVE YEAR ANALYSIS OF TRAFFIC COLLISIONS
2008-2012
May 17, 2013
BACKGROUND
An article recently published in the LA Weekly' claimed that the City of Los Angeles (City) had adisproportionately higher percentage of hit and runs compared to nationwide statistics. Insupport of this claim, the article cited that in the City of Los Angeles, "48 percent of crasheswere hit and runs in 2009." However, "in the United States, 11 percent of the collisions are hitand runs."
On January 4, 2013, a motion was made at the Public Safety Committee by CouncilmemberJoe Buscaino, City Council District 15, directing the Los Angeles Police Department(Department) to report on the efforts undertaken to curtail hit and run incidents and whatadditional resources, if any, would provide assistance to reduce the number of these incidentsoccurring within the City. The Board of Police Commissioners directed the Department tosubmit a report.
SUMMARY
Traffic Coordination Section, Emergency Operations Division conducted a comprehensivereview of hit and run statistics, enforcement efforts, and prosecution. The analysis examined hitand run rates and percentages, the causal factors of hit and runs, hit and run investigative resultsand associated penalties, and current Departmental resources that address hit and run collisions.
Hit and Run Rates:
The analysis revealed the hit and run rate in the City was not disproportionately high comparedwith other metropolitan cities. Although there were approximately 20,000 hit and run collisionsa year, the "48/11" statistic was misleading due to differences in the reporting criteria for trafficcollisions in various cities across the country. The 48 percent rate represented only the portionof reported collisions, and not the portion of all collisions that occurred in the City.Additionally, the LA Weekly analysis did not account for differences in the City's traffic volumein comparison with the national average or the inherent regional differences between urban andrural areas.
On the other hand, the Department does not consider 20,000 hit and runs a year to be anacceptable number, as it represents a serious detriment to the personal welfare and quality of lifefor all community members who reside, visit and work in the City. Thus, the Department iscommitted to the prevention of hit and run traffic collisions and the prosecution of hit and runsuspects.
1"Hit and Run Epidemic: Los Angeles Ignores a Crisis of Car-as-Weapon Crimes in its Streets," LA Weekly,
December 7-13 2012.
Page 1 of 15

FACT SHEET
FIVE YEAR ANALYSIS OF TRAFFIC COLLISIONS
2008-2012May 17, 2013
In an attempt to provide a realistic comparison, the Department compared the City's collisionstatistics with five years (2008-2012) of collision data from five large metropolitan cities: NewYork, Chicago, Houston, San Francisco and Seattle. The analysis adjusted for the differences inreporting criteria, reporting jurisdiction, and traffic volume in the following ways (SeeAttachment 1 for further details):
• Adjusting for Reporting Criteria: The differences in how each agency handledproperty damage collisions were accounted for by excluding property damage collisionsfrom the comparison. A more accurate baseline for comparison was achieved bycomparing only injury collisions (including fatal injury2) across multiple jurisdictions, asthere was much more national uniformity in the reporting and handling of injurycollisions.
• Adjusting for Reporting Jurisdiction: The five comparison cities all include freewaycollisions in their statistics, whereas the City of Los Angeles does not include freewaycollisions in its regularly reported statistics. This difference was accounted for by addingfreeway collisions that occurred within the City limits to the Department's data.
• Adjusting for Traffic Volume: The differences in population density and traffic volumewere accounted for by cross-referencing the number of collisions in each jurisdiction withthe average vehicle miles traveled (VMT) 3 to obtain a collision rate.
THIS PORTION INTENTIONALLY LEFT BLANK
2 Injury collisions included any collision that resulted in injury to any party.3 Vehicle miles traveled, as defined by the Federal Highway Administration (FHWA), was one of the most widelyused measures of travel intensity. For a given segment of roadway, the VMT was obtained by multiplying annualaverage daily traffic (AADT) by the length of the roadway segment. The FHWA used daily vehicle miles of travel(DVMT) as the primary measure of travel activity on the Nation's highway systems. The daily travel times 365 daysequals annual travel.
VMT was a calculated product of the AADT and the centerline length of the section for which the AADT wasreported. For example, on a five-mile highway segment traveled by 5,000 vehicles daily (an average obtained over ayear), the VMT would be 25,000. VMT was the measure of total vehicle activity.
http://www.fhwa.dot.gov/policyinformation/pubs/p10802 I /fig2 4 .cfm http://www.fhwa.dot.gov/policyinformation/statistics/2008/userguide.cfm
Page 2 of 15
25%
20%
15%
10%
5%
0%
20%
FACT SHEET
FIVE YEAR ANALYSIS OF TRAFFIC COLLISIONS
2008-2012
May 17, 2013
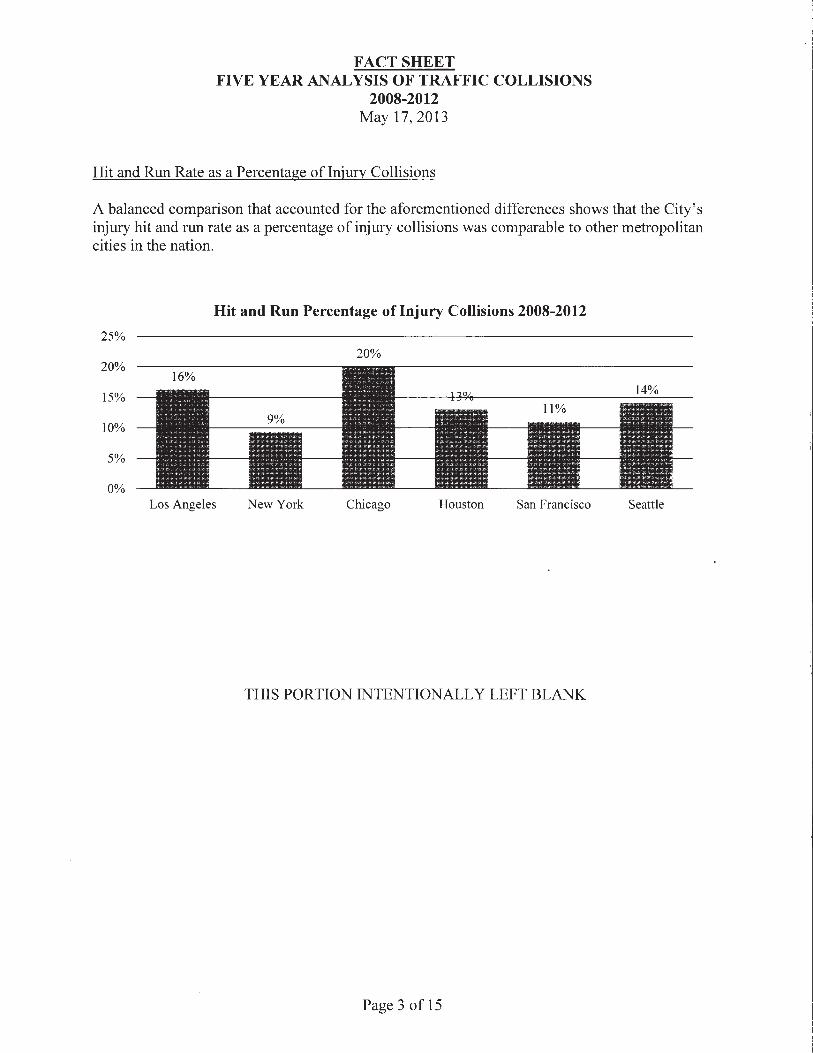
Hit and Run Rate as a Percentage of Injury Collisions
A balanced comparison that accounted for the aforementioned differences shows that the City'sinjury hit and run rate as a percentage of injury collisions was comparable to other metropolitancities in the nation.
Hit and Run Percentage of Injury Collisions 2008-2012
Los Angeles New York Chicago Houston San Francisco Seattle
THIS PORTION INTENTIONALLY LEFT BLANK
Page 3 of 15

FACT SHEET
FIVE YEAR ANALYSIS OF TRAFFIC COLLISIONS
2008-2012May 17, 2013
Hit and Run Rate per Million Vehicle Miles Traveled
When the hit and run figures were considered in light of VMT, City residents were less likely tobe involved in an injury or fatal hit and run than those in New York, Houston, and Chicago, andonly slightly more likely than those in Seattle, and San Francisco (See Attachment 2 for furtherdetails):
Hit and Run Rates
Injury Hit and Runs per Million VMT From 2008-2012
0.350
0.300 0.288
0.250
0.200
0.150
0.100
0.050
0.000Los Angeles New York Chicago Houston San Francisco Seattle
Page 4 of 15

HO Hifi-IRV FOR83%
"K" INJURY H&R
0.15%
"B" INJURY H&R
3.95%
"A" INJURY H&R
0.67%
"C INJURY tf&A
12.17%
FACT SHEET
FIVE YEAR ANALYSIS OF TRAFFIC COLLISIONS
2008-2012
May 17, 2013
Rate of Injury of Hit and Run Collisions
The analysis further revealed the vast majority of hit and runs in the City did not involve injury,and few involved a severe or fatal injury. From 2008 to 2012, approximately 83 percent of allreported hit and run collisions were property damage only (no injury), and most of theseinvolved parked cars. Less than eight percent of all reported collisions involved an injury hit andrun, and only 0.1 percent of all reported collisions involved a hit and run with a severe or fatal("A" or "K") injury. 4 However, as detailed later in this report, hit and runs were associated withmore severe/fatal collisions than were Driving Under the Influence (DUI) collisions (SeeAttachment 3 for further details):
Los Angeles Hit and Run Percentages 2008-2012
4 The Department traffic manual defines a severe injury as any serious, incapacitating injury which normallyrequires hospitalization, other than for observation, and prevents the victim from walking or driving ("A" Injury)."B" Injury is defined as a non-incapacitating injury; any visible injury other than fatal or major. "C" injury isdefined as a momentary unconsciousness or complained of pain without visible signs of injury.
Page 5 of 15

FACT SHEET
FIVE YEAR ANALYSIS OF TRAFFIC COLLISIONS
2008-2012
May 17, 2013
Hit and Run Collisions as a Percentage of Total Reported Collisions Declined 2008-2012
The City-wide hit and run percentage for all injury and fatal collisions combined decreased from19 percent in 2008 to 15 percent in 2012. The percentage of hit and runs for fatal collisions onlywas a steady 20 percent over the five year period, with the exception of 2012, in which fatal hitand runs decreased to 14 percent of all fatal collisions. Likewise, the percentage of severe hitand runs decreased from 18 percent to 16 percent.
Los Angeles Overall Hit and Run Percentage 2008-2012
All Injury & Fatal Combined
I ROA 1 80/0
5%
0%
2008 2009 2010 2011 2012
Los Angeles Hit and Run Percentages 2008-2012
Fatal and Severe Comparison
20%19% 20%
21%
owlois 011111111 16%
15% 15% 14%
2008 2009 2010 2011 2012
•Percent H&R of Fatal Collisions Percent H&R of Severe Collisions
30%
25%
20%
15%
10%
19%18%
11Moiemmaimmai 1ti5. %
30%
25%
20%
15%
10%
5%
0%
15%
Page 6 of 15

DUI
(Fatal & Severe)
355
FACT SHEET
FIVE YEAR ANALYSIS OF TRAFFIC COLLISIONS
2008-2012
May 17, 2013
Fatal and Severe Injury Hit and Run Collisions Versus DUI Collisions
Hit and run traffic collisions were associated with more fatal and severe collisions within theCity than were DUI. It should be noted that there is some crossover between these twocategories. The below diagram depicts fatal and severe injury hit and runs and DUI collisionsfrom 2007-2011.5
THIS PORTION INTENTIONALLY LEFT BLANK
An inquiry was made via the Statewide Integrated Traffic Records System (SWITRS) inquiry. The inquiry
included only the collisions in which a motor vehicle was involved with a pedestrian, bicycle or other motor vehicle(excludes collisions with parked cars and fixed objects). The crossover between DUI and hit and run was likelymuch higher, however, the diagram shows only known DUI drivers.
Page 7 of 15

0%
SEVERE & FATAL
FACT SHEET
FIVE YEAR ANALYSIS OF TRAFFIC COLLISIONS
2008-2012
May 17, 2013
Bicyclists and Pedestrians Involved in Hit and Run Collisions
The analysis identified that bicyclists and pedestrians involved in a reportable severe or fatalinjury traffic collision were more likely to experience a hit and run collision than a motorist. Forexample, "motor vehicle only" collisions with a severe or fatal injury result in a hit and run ninepercent of the time. By contrast, an average of 21 percent of severe or fatal bicycle collisionsand 24 percent of severe or fatal pedestrian collisions resulted in a hit and run.
Most significant was that the majority of fatal and severe hit and runs involved pedestrians. Asshown in the chart below, 6 pedestrian collisions represented only 14 percent of all injurycollisions, but they represented sixty percent of all severe and fatal hit and runs.
Auto, Pedestrian, and Bicycle CollisionsTotal Five-Y ear Hit and Run Injury Comparison
All TC's (91,366) H&R (18,106) All TC's (4,663) H&R (769)
Between 2007 and 2011, there was an average of 22 severe or fatal hit and run bicycle collisionsand 92 of severe or fatal hit and run pedestrian collisions per year. While pedestrian severe orfatal hit and run collisions increased slightly from 2010 to 2011, the overall trend was a decreaseof 33 percent over five years.
6SWITRS inquiry 2007-2011 for Pedestrian, Bicycle and Motor Vehicle collisions including the latest available
data.
Page 8 of 15

105120 114
80
40
0
75
0040 a
2007 2009
01-0
2008
• H&R Pedestrian
010
2010
0 H&R Bicycle
2011
93
FACT SHEET
FIVE YEAR ANALYSIS OF TRAFFIC COLLISIONS
2008-2012
May 17, 2013
Unfortunately, this same trend did not extend to bicyclists. Bicycle severe or fatal hit and runcollisions increased an average of less than three additional collisions per year (See Attachment 4for further details):
Number of Pedestrian and Bicycle Collisions
Severe/Fatal Pedestrian and Bicycle Hit and Runs 2007-2011
Causal Factors of Hit and Runs
The analysis examined the two major causal components of a hit and run collision: the cause ofthe collision itself and the cause of the failure to remain at scene. Concerning collision causes,the traffic divisions reported that there was little difference between the major moving violationsthat caused hit and runs compared with normal collisions.
Comparison of Primary Collision Factors7
1. Unsafe Speed (22350)a: .i.,
1. Unsafe Speed (22350)
2. Unsafe Left Turn (21801) 2. Unsafe Backing/Starting (22106)
3. DUI (23152) 3. Unsafe Lane Change (21658)
4. Following Too Close (21703) 4. DUI (23152)
5. Unsafe Backing/Starting (22106) 5. Unsafe Left Turn (21801)
Concerning the characteristics of hit and run drivers, the analysis did not indicate a commoncause for leaving the scene. Forming generalizations about hit and run drivers was challengingsince the majority of them are not apprehended. Neither the City Attorney's Office nor the
7Many hit and run collision reports showed a primary cause of "unknown" (in the case of counter reports) or
"private property" (where rules of the road do not apply). These causes were not shown here.Top primary collision factors for hit and runs obtained from a SWITRS inquiry for 2008-2011.
Page 9 of 15

FACT SHEET
FIVE YEAR ANALYSIS OF TRAFFIC COLLISIONS
2008-2012
May 17, 2013
traffic investigators maintained statistics on the license status or intoxication level of identifiedhit and run drivers. Investigators reported that the hit and run drivers who were later identifiedand interviewed provided a wide variety of poorly formed explanations why they did not stay atscene.
Hit and Run Penalties
Department investigators and prosecuting City Attorneys (CA) identify the civil, legal and driverlicense consequences for an individual involved in a hit and run traffic collision are notsignificant enough to be a deterrent. Although it was believed that there was a significant cross-over between those who were DUI and those who committed hit and runs, penalties in Californiawere much less significant for hit and run than they were for DUI penalties for the same collisioncircumstances.(refer to attachment chart) For example, a driver involved in a misdemeanor DUIcollision received a higher bail, higher fine and longer jail time than a misdemeanor hit and rundriver, as well as additional penalties such as a mandatory license suspension, mandatory alcoholprogram, cost recovery, and a mandatory ignition interlock device (See Attachment 5 for furtherdetails).
Civil Compromise in lieu of Penalty
The civil compromise was the other most significant impediments to ensuring real consequencesfor hit and run crimes. According to the City Attorney's Office, about half of the 20002 VC(misdemeanor hit and run) cases that they filed were subsequently resolved as a civilcompromise per Penal Code Section 1377. These "compromises" were solicited by the defenseand obtained against the objections of the prosecution. The resulting consequences were nodifferent than if the defendant had initially stayed at the scene.
Hit and Run Investigations
The analysis further revealed the investigation and filing of hit and runs posed severalchallenges. Successful apprehension of hit and run drivers was highly dependent on the presenceof witnesses. Detective/investigators and first responder personnel were trained to canvass thecrime scene for witnesses and/or video recordings, but these were seldom present. It was alsoimperative that investigators were able to connect an identified vehicle to a probable driver.Frequently, the best follow-up information available was a license plate number. Thus, theinvestigation was severely impaired if the vehicle was unregistered or if the driver's identifyinginformation was unreliable or not available in law enforcement databases.
Statute of Limitations Relative to Hit and Run Collisions
Department investigators also described the existing statute of limitation relative to fatal andsevere injury hit and run collisions as insufficient. The existing statute limits the ability toprosecute an individual involved in such a hit and run collision to three years from date ofoccurrence. The Department's analysis did not identify the number of instances in which the
Page 10 of 15

Dedicated traffic division(s) orbureau(s)9
Traffic division(s) responsible for allcollisions (not just severe & fatal)
Department has dedicated motorcycleofficers or motorcycle units19
Motor units exclusively dedicated totraffic enforcement
Number of officers in trafficassignment
Number of CIFU investigators
670 192 23 42 281 65
66 23 18 4 10 10
• • • • •
• N/A • •
• • •
• •
•
•
FACT SHEET
FIVE YEAR ANALYSIS OF TRAFFIC COLLISIONS
2008-2012
May 17, 2013
statute limited the Department's ability to seek prosecution. However, general sentiment wasthat the law should be strengthened. California Assembly Bill 184 proposes language thatpreserves the current statute of limitations while also allowing for charges for up to one yearafter the person is identified as a suspect in the commission of the offense.
Departmental Resources Addressing Hit and Runs
Currently, the Department deploys 670 officers to the four traffic divisions for trafficenforcement and collision investigations. Collision investigators are responsible for supportinguniformed patrol in the first response and at-scene investigation of traffic collisions. Follow-upinvestigations for hit and runs, assault with a deadly weapon (vehicle), fatal collisions, and otherfelony traffic crimes are exclusively handled by the Collision Investigation Follow-Up Unit(CIFU) at the four traffic divisions. These units are comprised of a combination of detectivesand police officer investigators, totaling 66 sworn personnel City-wide. In comparison to theother metropolitan cities in this analysis, the City has a very sizable complement of officersdedicated exclusively to traffic.
Personnel Deployed to Traffic Assignments - Comparison with Five Metropolitan Cities
9 In Chicago, traffic was the responsibility of geographic patrol divisions which each have one dedicated traffic car.10 New York and Chicago utilized officers who were motor qualified for occasional motor escorts as weatherpermits, but they were not ordinarily used for traffic enforcement.
Page 11 of 15

FACT SHEET
FIVE YEAR ANALYSIS OF TRAFFIC COLLISIONS
2008-2012
May 17, 2013
Clearance Rates involving Hit and Run Collisions
Clearance rates remained relatively constant over the last five years. On average, between 2008and 2012, CIFU investigators solved (cleared) approximately 20 percent of all the hit and runcases in the City, though many hit and runs had no witnesses or evidence. An average of 43percent of all hit and run cases had a potential for follow up and were assigned to investigators.Of this group, investigators solved approximately 47 percent (See Attachment 6 for further
details):
CIFU Case Clearance
Clearance Rates and Percentage of Assigned Cases (Category 1)
60%
48%50%
41%
0
39% 38%40%
30%
19%22% 22%
18% 180,OM OWN NMI NM sea20% 111•••
AIM MI NM MIMI
10%
0%
2008 2009 2010 2011 2012
•Percentage of All H&R Cases Assigned ■Clearance Rate
Page 12 of 15

FACT SHEET
FIVE YEAR ANALYSIS OF TRAFFIC COLLISIONS
2008-2012May 17, 2013
Department Resources Addressing Hit and Runs
In addition to the aforementioned deployment of Department personnel, below is a description ofadditional Department efforts to curtail hit and runs.
• Enforcement
• Daily Missions: Collision Investigating Officers are assigned a daily "Mission" inroll call giving them specific traffic enforcement goals for the day.
• Line Beats: Specific targeted areas unique to each division are assigned to motorofficers with the goal of increasing uniformed presence on the main thoroughfaresthat lead to the hot crime locations.
• Cross Reference Crime Mapping: Traffic problem areas are cross-referenced withhot crime Reporting Districts to achieve maximum synergy in crime and trafficenforcement.
• Enforcement Detail Task Forces: Regular task forces that focus on registration,insurance and licensing violations as delineated in Special Order No. 7, 2012.
)=. "Crunch Days": Traffic personnel are directed to target those areas that are knownfor high numbers of hit and run traffic collisions.
> School Monitoring: Regular uniformed presence and enforcement at school zones.
• Education and Community Awareness Campaigns
• Pedestrian and bicycle enforcement training: As of February 2013, the ComplaintTraffic Safety Unit supervisor has been also designated as the Traffic DivisionBicycle Liaison. This liaison position assists the Department and the bicyclecommunity with a wide spectrum of bicycle enforcement and investigation issues.Furthermore, the traffic divisions provide traffic enforcement training to patrolpersonnel.
)> Cadet Program: South Traffic Division is implementing a Cadet Post to enhanceyouth participation in the Department's traffic mission for both enforcement andeducation programs.
Page 13 of 15

FACT SHEET
FIVE YEAR ANALYSIS OF TRAFFIC COLLISIONS
2008-2012
May 17, 2013
)=. Press Conferences and Community Meetings: Traffic Divisions frequently providePress Releases to the media and give Press Conferences regarding hit and runsuspects and vehicles, alerting the public and soliciting help. When possible,composite sketches are provided to the media and posted and updated on social media
sites.
• Engineering
• The Department is continually working in partnership with the Los AngelesDepartment of Transportation (LADOT) to facilitate the City's commitment to trafficsafety, including a recent project to repaint the crosswalks at non-controlledintersections throughout the City to better safeguard pedestrians, who represent adisproportionate number of hit and run victims.
>. The Department is also an active member on the LADOT Pedestrian Advisory
Committee, which seeks to promote pedestrian safety.
• Investigative Training of First Responders
Detective personnel provide regular training to uniformed personnel in the preliminaryinvestigations of hit and run collisions and immediate follow-up investigations. This
includes an emphasis on:
> Complete documentation of witness statements who are able to identify hit and run
suspects; and,
• An exhaustive canvass of the crime scene to locate video and other items of
evidentiary value.
RECOMMENDATIONS
It is recommended that the Department continue to pursue the aforementioned measures tocurtail hit and run traffic collisions, as well as the following measures:
• Increase Hit and Run Penalties. It is recommended that the City support legislation thatwould address the hit and run issues by increasing the penalties for hit and run offenses.
Such legislation should include:
> Automatic license consequences (similar to an Department of Motor Vehicle Admin
Per Se);
• Possible hold or forfeiture of offending vehicle;
Page 14 of 16

FACT SHEET
FIVE YEAR ANALYSIS OF TRAFFIC COLLISIONS
2008-2012
May 17, 2013
> More significant consequences for hit and run prior convictions such as allowingprior hit and run convictions to count as prior DUI convictions for the purposes ofcalculating penalty enhancements and filing (and vice versa); or,
> Limit civil compromise for hit and runs.
> Extend the existing statute of limitation for all fatal and severe injury hit and runcollisions as defined in AB184.
• Continue Command Emphasis on Hit and Run Collisions via COMPSTAT. By
expanding the utilization of COMPSTAT in the evaluation of our traffic enforcement andinvestigative activities the Department can further improve upon its results.
>. Change the COMPSTAT profiles to include the following detective case tracking
categories for hit and run collisions:• Total Category 1 Cases Assigned• Total Cases Cleared• Total Cases Submitted for Filing to the District Attorney/City Attorney
Offices• Total Cases Filed with a Prosecuting Authority
> Separate hit and run collisions into injury and non-injury, and "property damageonly" (PDO) categories for better statistical proportionality;
• Increase Enforcement Task Forces Targeting Unregistered Vehicles. Consistent with the
Department's revised impound protocols, focus enforcement efforts toward the removal ofunregistered vehicles from public roadways;
• Increase Field Usage of "Live Scan" Technology and other Identity Verification Tools.
The positive identification of drivers during various enforcement activities improves thecriminal justice system's ability to hold offenders responsible for subsequent involvement inhit and run collisions and other illegal activity.
Page 15 of 16

FACT SHEET
FIVE YEAR ANALYSIS OF TRAFFIC COLLISIONS
2008-2012
May 17, 2013
CONCLUSION
The City experiences approximately 20,000 hit and run traffic collisions each year. The exactpercentage of total collisions that this number represents remains unknown since many collisionsgo unreported. However, when fatal and injury collisions are considered, the Department'spercentage of hit and runs is comparable to other metropolitan cities. The Departmentrecognizes that a hit and run traffic collision is a serious crime perpetrated by irresponsiblecommunity members with no regard for their civic responsibility. Although current efforts areaddressing the problem, the Department is committed to finding new and innovative ways toreduce the number of hit and runs and to aggressively apprehend and prosecute those who would
seek to evade responsibility for their actions.
Prepared by:Traffic Coordination SectionEmergency Operations Division
Page 16 of 16

Hit and Run Rates and Hit and Run Percentages: Methodology
The analysis required an extensive examination of five years (2008-2012) of the Department'straffic collision statistics, as well as data from the five metropolitan comparison cities. Thebelow discussion outlines the statistical methodology in more detail, including the considerationof the limitations of Department traffic collision data, the source of the LA Weekly "48/11"statistic, and how to best determine a common denominator of comparison.
• Limitations of Department Traffic Collision Data
Historically, traffic collision databases were kept at the traffic division level and usedprimarily for identifying problem areas and not for detailed statistical analysis. In 2012,the Department began to centralize and integrate statistical traffic information into theCrime Analysis and Mapping System (CAMS). However, the five-year analysis requiredthe compilation of data from CAMS and legacy access databases. Therefore, statisticsmay differ slightly from those reported on COMPSTAT and other historical reports.'The Department also considered using data from the LADOT; however LADOT does notcapture any data on hit and runs.
• Source of the LA Weekly "48/11" Statistic.
The Department contacted the author of the LA Weekly article, who indicated the sourceof the "11 percent" figure was from a report completed by the American AutomobileAssociation (AAA) Foundation for Traffic Safety 2 that analyzed nationwide data fromthe National Highway Traffic Safety Administration. The data was gleaned from theFatality Analysis Reporting System (FARS) and the General Estimates System (GES).The FARS is a nationwide comprehensive database of all fatal collisions. The GES datawere obtained from a nationally representative probability sample selected from all policereported crashes. Fifty thousand collision reports were chosen from 60 areas thatreflected the geography, roadway mileage, population, and traffic density of the UnitedStates.
• Determining the Common Denominator of Comparison
As previously indicated, there were major differences in the reporting criteria, reportingjurisdiction, and traffic volume from city to city. The analysis compensated for thesedifferences in the following ways:
' Data from COMPSTAT and Information Technology Division (ITD) databases were not used because they do notcapture the specific injury categories needed for the analysis. The SWITRS data were generally not preferredbecause, although it was highly detailed, it was only updated through 2011 and excluded, as a matter of policy, thosereports for which there was no at-scene investigation (per Section 20015 of the California Vehicle Code [CVC]).However, SWITRS results were generally very similar to Department statistics for injury collisions.2 "Hit And Run Drivers Kill Nearly 1500 People Annually With Pedestrians At Greatest Risk," AAA Foundation for
Traffic Safety, Fact Sheet based on a study conducted in 2003.
Attachment \

Adjusting for Differences in Reporting Criteria
The Department's reporting criteria was generally more restrictive compared withmost other cities and agencies. For example, under the Department's reportingcriteria, collisions for which there was no injury, no crime, or no City propertyinvolved was not documented on a traffic collision report. In most of these "PropertyDamage Only-Civil" (PDO-civil) traffic collisions, an officer facilitated an exchangeof information between the parties or was not dispatched to the scene at all.Therefore, this type of collision was not included in the Department's traffic collisionstatistics.
In contrast, the reporting criteria for all out-of-state (New York, Chicago, Houston,and Seattle) cities were much broader. In these cases, the reporting criteria includedmost of the PDO-civil incidents that were excluded in Los Angeles, though theircriteria differed significantly from each other as wel1. 3 The California HighwayPatrol (CHP) also had a similar policy of reporting most PDO-civil collisions.4Although the exact number of these incidents was not determined, it was likely thatthey represented a significant portion of the total collisions that occurred within theCity limits. The apparent high hit and run percentage was largely attributed to thedifference in reporting. Since the collision statistics maintained and reported by theDepartment do not include PDO-civil incidents, the percentage of hit and runs to totalreported collisions was higher than those agencies (or nationwide statistics) that doinclude this type of collision in their overall numbers. This, however, reflected only adifference in reporting, not necessarily a difference in the actual percentage of hit andruns.
The differences were further compounded when there was an attempt to compare hitand runs from city to city. In New York and Houston, for example, non-injury hitand runs were sometimes treated as infractions and not reported at all if they wereunder a certain damage threshold. Furthermore, not all jurisdictions classified hit andrun crimes into the felony/misdemeanor categories the same way as California.5
In order to compensate for these differences in reporting, the current analysis focusedmore narrowly on injury collisions only (including fatal injury) as a baseline commondenominator.
3The City of New York completed a written report on all reported collisions. However, the New York Department
of Transportation did not include in its statewide reporting those collisions that were below $1,000 in propertydamage. The city reported numbers differ from the state reported numbers. The City of Chicago reports PDOincidents over $1,500 when the parties are insured or $500 if they were not insured.
The CHP completed a written report on all reported incidents, but "counter reports" (those incidents for whichthere was no at-scene investigation per Section 20015 CVC) were not counted in their official statistics, nor werethey forwarded to SWITRS. By contrast, the Department did include these counter reports in its statistics.5 Houston had the following three categories for hit and run:
• Failure to Stop and Render Aid (FSRA) crashes (Felony 3rd degree hit and run) were those hit and runcrashes resulting in death or serious bodily injury.
• Failure to Stop and Give Information (FSGI) crashes (Misdemeanor Class B hit and run) were those hit andrun crashes where there were no injuries or minor injuries and property damage over $200.
• Hit and runs that did not meet the above criteria (under $200 in property damage) were not counted.
Attachment V)

Adjusting for Differences in Reporting Jurisdiction
The Department did not include freeway/interstate collisions in its reported statistics.These collisions were handled and reported by the CHP. San Francisco, being aCalifornia city, had a similar policy. 6 However, the four out-of-state cities allincluded freeway collisions, which typically had a lower hit and run percentage intheir reported statistics. When comparing Los Angeles statistics to out-of-state cities(or nationwide statistics) CHP collisions was added to obtain the full number.
Adjusting for Differences in Traffic Volume
Population density and traffic volume was highly variable from city to city. Forexample, New York City had over twice the population of Los Angeles(8.3 million versus 3.8 million) but had almost the exact same amount of centerlineroadway 7 (approximately 6,510 miles versus 6,681 miles, respectively). However,New York had considerably less daily VMT than Los Angeles (47 million milesversus 74 million miles) 8 most likely due to the extensive use of the subway systemand other forms of public transportation.
In order to achieve a fair comparison, this analysis cross-referenced collision datawith VMT to obtain a collision rate.
THIS PORTION INTENTIONALLY LEFT BLANK
6 The SWITRS inquiries used to obtain San Francisco statistics for this analysis included freeway statistics.7 Centerline roadway miles was used in transportation terminology to differentiate from lane miles.http://www.fhwa.dot.gov/policyinformation/pubs/hf/p1 1 0023/fig1_5.cfm
Average Daily VMT for each city, including freeways/expressways, was calculated from the Federal HighwayAdministration (FHWA) report "VMT in Urbanized Areas, 2008" and adjusted for each city according to total
roadway miles per city.
Attachment

Hit and Run er VMT: Corn s arative Anal sis of Five Metro lolitan U.S. cities, 2008-2012
6,510 85,501 11.845 2.524 ** 0.237
4,384 54,323 8.108 1.436 2.438 0.288
904 15,939 1.973 1.133 0.413 0.123
6,682 74,319 2.940 1.256 0.416 0.157
1,777 18,832 2.508 0.748 0.926 0.105
Los Ange es9
New York
Chicago
San Francisco
Houston
Hit and Run Rate per Vehicle Miles Traveled (VM)
When the baseline hit and run figures were considered in light VMT, the City had among thelowest hit and run rates. There were approximately 0.152 injury/fatal hit and runs for everymillion miles of vehicle roadway travel (including freeways/interstates). This concluded thatmile per mile City residents were less likely to be involved in an injury hit and run than those inNew York (0.237), Houston (0.157) and Chicago (0.288), and only slightly more likely thanthose in Seattle (0.105) and San Francisco (0.123).
*Five Y ear VMT obtained by multiplying the average daily VMT by 365 x 5 **New Y ork data not available
9 Los Angeles statistics were a compilation of freeway collisions occurring within the City limits (obtained from theCHP) and collisions occurring on City streets as reported in Department statistics.
Attachment 2.

Hit and Run Percentages
The Department statistics showed that in Los Angeles, approximately 16 percent of reportedinjury traffic collisions (including fatal injuries) involved hit and runs from 2008 to 2012. Bycomparison, Chicago showed 20 percent and Seattle, a much smaller population, indicated 14percent for data in the same category. Although New York had a much lower hit and runpercentage (nine percent), this number is questionable since New York's hit and run statisticsexclude collisions where the defendant was apprehended as a result of the initial fieldinvestigation.
Baseline Hit and Run Percenta
Population
• e: Corn
Total TC
i arison of
All Injury
& Fatal
TCs
Five Metro
H&R
Total
olitan U.S.
H&R
(Injury&
Fatals)
cities, 2008-2012—
H&R
% Of
Total
H&R %
(Injury &Fatals)
Los Angeles" 3,801,600 307,636 126,032 118,344 20,468 38% 16%
New York 8,346,800 1,012,774 215,763 ** 20,250 ** 9%
Chicago 2,830,000 440,473 78,000 132,451 15,621 30% 20%
San Francisco* 808,001 31,447 18,065 6,577 1,955 21% 11%
Houston** 2,238,200 218,513 93,353 30,953 11,705 14% 13%
Seattle 602,934 47,225 14,093 17,448 1,978 37% 14%
*San Francisco and CHP figures represent 2007-2011 data obtained through SWITRS. **New Y ork data not available.
1 ° San Francisco and CHP figures represented 2007-2011 data obtained through SWITRS.Some 2012 data for New York and Chicago was estimated by averaging the prior four years.Houston hit and run data for 2008-2009 was estimated using averages of year 2010-2012.11 Los Angeles statistics were a compilation of the freeway collisions occurring within the City limits (obtained fromthe CHP) and collisions occurring on City streets as reported in Department statistics.
Attachment 3
80
40
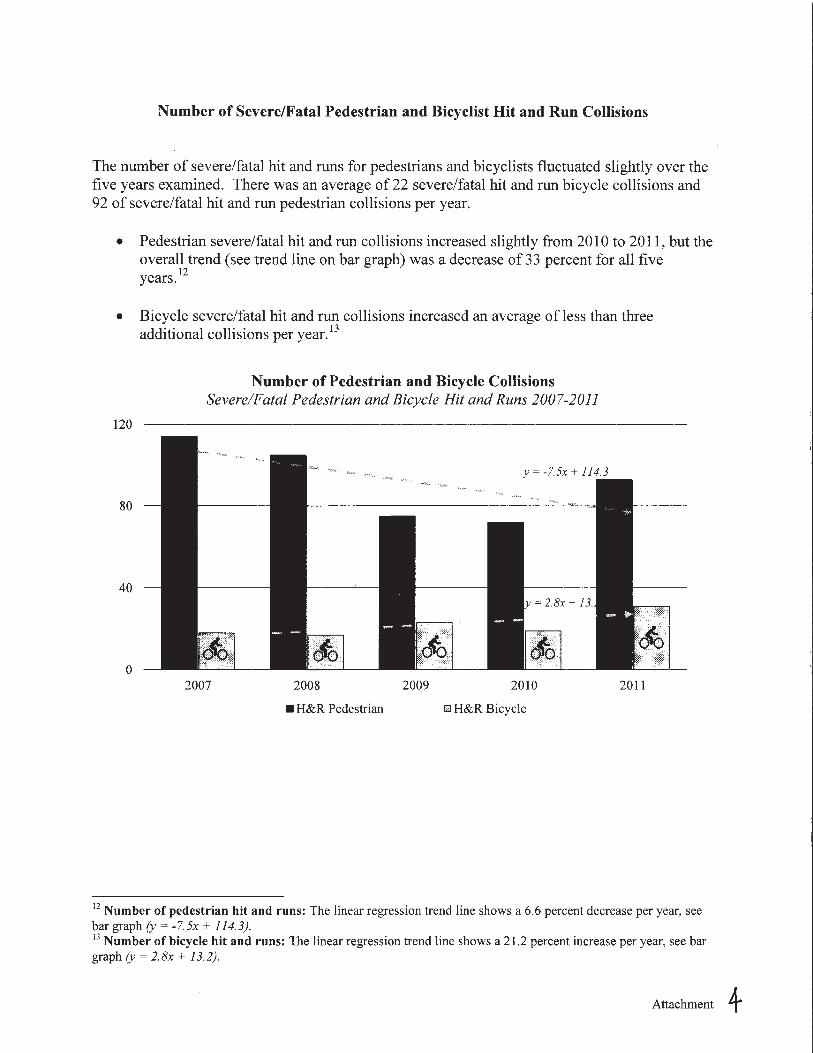
Number of Severe/Fatal Pedestrian and Bicyclist Hit and Run Collisions
The number of severe/fatal hit and runs for pedestrians and bicyclists fluctuated slightly over thefive years examined. There was an average of 22 severe/fatal hit and run bicycle collisions and92 of severe/fatal hit and run pedestrian collisions per year.
• Pedestrian severe/fatal hit and run collisions increased slightly from 2010 to 2011, but theoverall trend (see trend line on bar graph) was a decrease of 33 percent for all fiveyears.
12
• Bicycle severe/fatal hit and run collisions increased an average of less than threeadditional collisions per year.13
Number of Pedestrian and Bicycle Collisions
Severe/Fatal Pedestrian and Bicycle Hit and Runs 2007-2011
120
2007 2008 2009 2010 2011
• H&R Pedestrian H&R Bicycle
12Number of pedestrian hit and runs: The linear regression trend line shows a 6.6 percent decrease per year, see
bar graph (y = -7.5x + 114.3).13 Number of bicycle hit and runs: The linear regression trend line shows a 21.2 percent increase per year, see bargraph (y = 2.8x + 13.2).
Attachment 4

Comparison of Penalties for Misdemeanor DUI Collision vs. Misdemeanor Hit and Run
Rail: (Per LA
County Bail
Schedule)
(BAC
0.15%)
(BAC >0.15%)
,,, Livvamiassedi:
$15,000$30,000
V'
-41*
$10,000$10,000
Fine: $390 - $1000 (23536 VC) Not mandatory$0 - $1000 or Civil Compromise(1377 PC)
Jail time: 96 hours - 6 months (23536
VC)Or Probation (see below)
Not mandatory0 — 6 months or CivilCompromise
Driver License
Suspension:
Conviction: Not mandatory-Mandatory 6 months (13352
VC)Administrative:- Mandatory 4 months (13353.
3 VC)
- No conviction required(13353.2 VC)- Immediate suspension uponarrest- (Reinstated in case ofacquittal)
Probation: - $390 mandatory fine,- Optional jail time of 48 hours,- Mandatory 30+ hour alcoholprogram (23538 VC)
No mandatory actions
Cost Recovery: Average of $750 per incident(53150 GC)
None(No cost recovery program for hitand run)
Ignition Interlock
Device:Mandatory 5 months (23700 VC) None
Attachment

Hit and Run Investigations - Measuring Effectiveness
Results of Detective Investigations
Clearance rates remained relatively constant over the five year period. The tables on thefollowing pages provide the filing statistics for the CIFU units at the four traffic divisions. Onaverage, CIFU investigators solved (cleared) approximately 20 percent of all the hit and runcases in the City, though many hit and runs did not have witnesses or evidence. Of those casesthat had a potential for follow up and were assigned, investigators solve approximately 47percent.
• Category 1 cases were those that have a potential for follow-up and were assigned to aninvestigator.
• Category 2 cases were those that have no potential for follow-up and were not assignedto investigators. The number of total hit and run cases was the combination of Category1 and Category 2 cases.
• Assigned Cases Solved was the percentage of cases that were solved ("Cleared byArrest" or "Cleared Other") out of only those cases that have follow up and wereassigned to investigators (Category 1 cases).
(Cleared By Arrest cases + Cleared Other cases)
(Category 1 cases — Unfounded cases)
Clearance Rate was the percentage of cases that were solved out of all hit and run cases(Category 1 and Category 2). It was the Department's primary measure of detective activity.Clearance rate was calculated using the following formula:
(Cleared By Arrest cases + Cleared Other cases)
Clearance Rate =(All H&R cases — Unfounded cases)
• Cleared by Arrest were those cases in which the suspect had been identified andcharged had been filed by the CA or District Attorney (DA). It was the same as "CasesFiled."14
• Cleared Other were those cases in which the case was solved (the suspect wasidentified), but no charges were filed (usually because of a CA/DA reject or because thevictim refused to prosecute).
• Report Unfounded were those cases in which the crime did not occur or the case was aduplicate.
14Clearance category descriptions given here are generalizations only. A detailed description of clearance
categories and criteria are outlined in the Detective Operations Manual.
Assigned CasesSolved
Attachment

• Cases Submitted for Filing were those solved cases presented to the CA/DA for filing.
• Cases Filed were those cases in which the suspect had been identified and charges filedby the CA or DA. It was the same as "Cleared by Arrest."
Citywide CIFU Case Dispositions for 2008-201215
C
"TM'.
MOI
14
Cattig017
CasesCases
soh;ect
ClearanceRate
Cleared
bYCleared
Other
Total
Cleared
Report
Unfounded
Cases
Subm dfor Filing
Cases
Filed
2008 24,933 10,146 47% 19% 1,804 2,962 4,766 46 1,853 1,759
2009 22,159 10,695 45% 22% 1,923 2,835 4,858 41 1,129 1,926
2010 20,405 9,474 48% 22% 1,679 2,846 4,525 33 964 1,664
2011 19,746 7,742 47% 18% 1,359 2,237 3,596 56 996 1,316
2012 19,869 7,546 46% 18% 1,277 2,206 3,483 44 1,587 1,186
TOTAL 107,112 45,603 47% 20% 8,042 13,086 21,128 220 6,529 7,824
15For the sake of a complete five year analysis, the missing 2008 filing data for Valley Traffic Division was
estimated using an average of the four subsequent years.
Attachment