Embed Size (px)
Citation preview
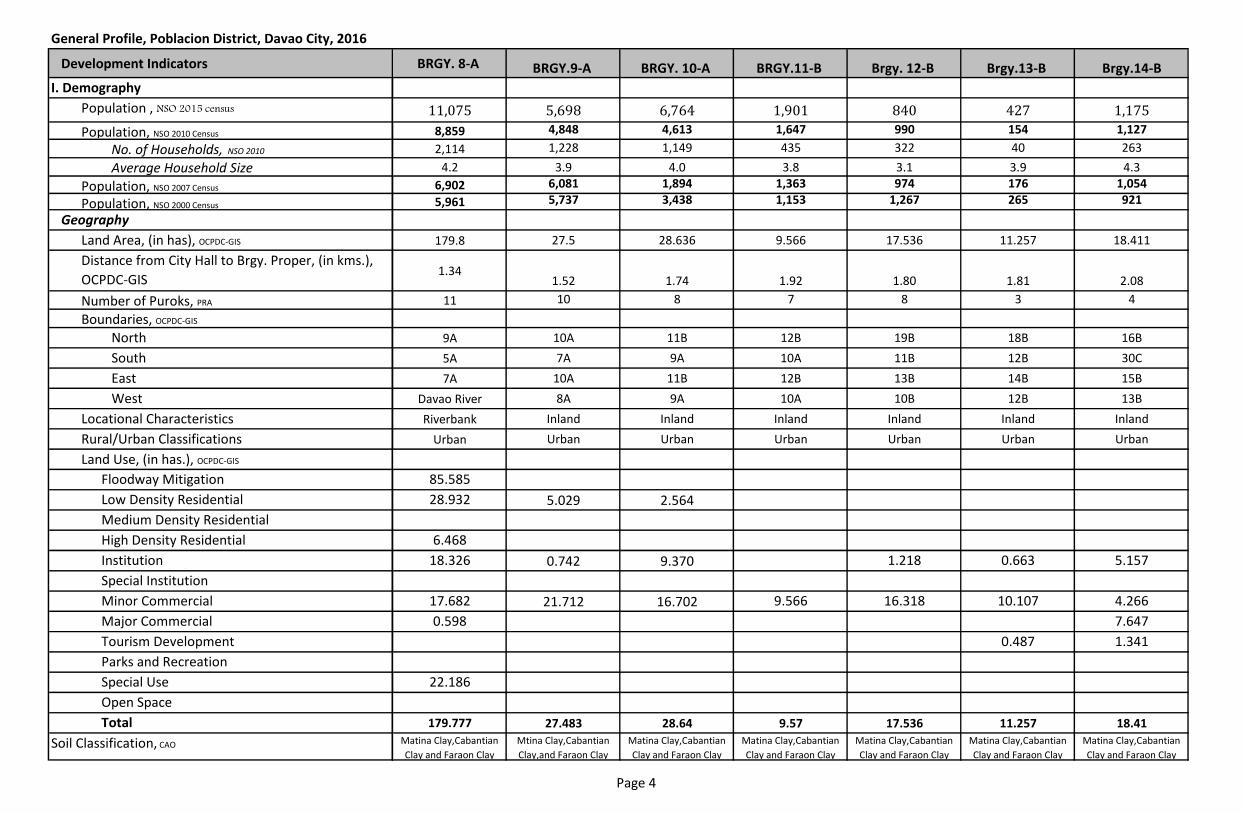
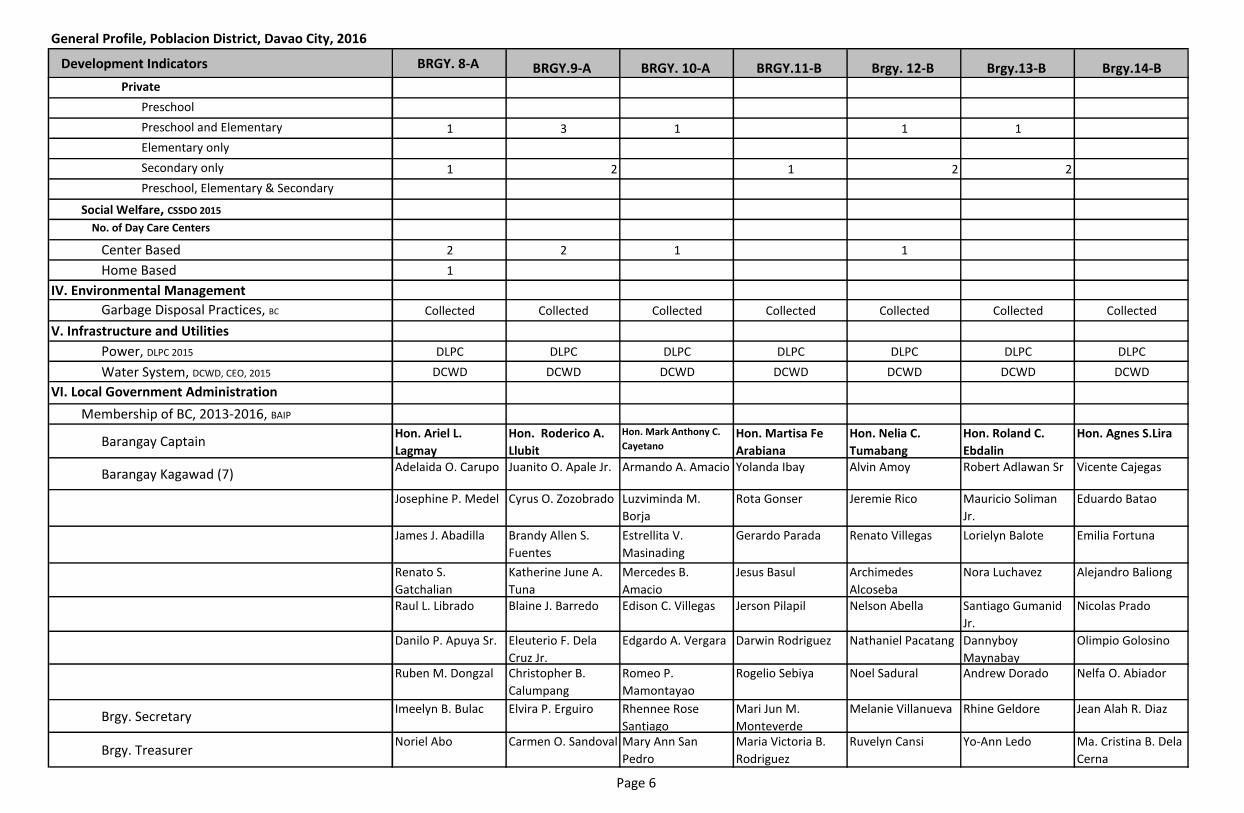
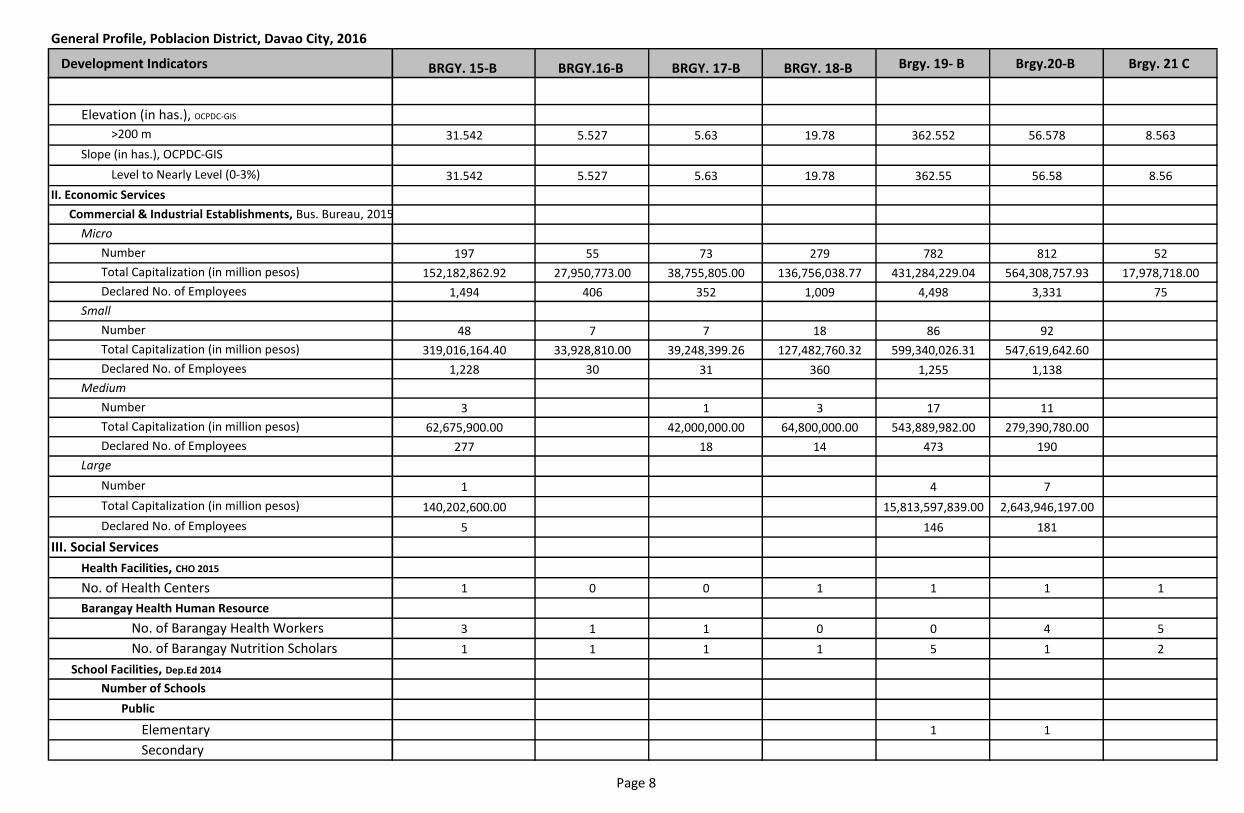
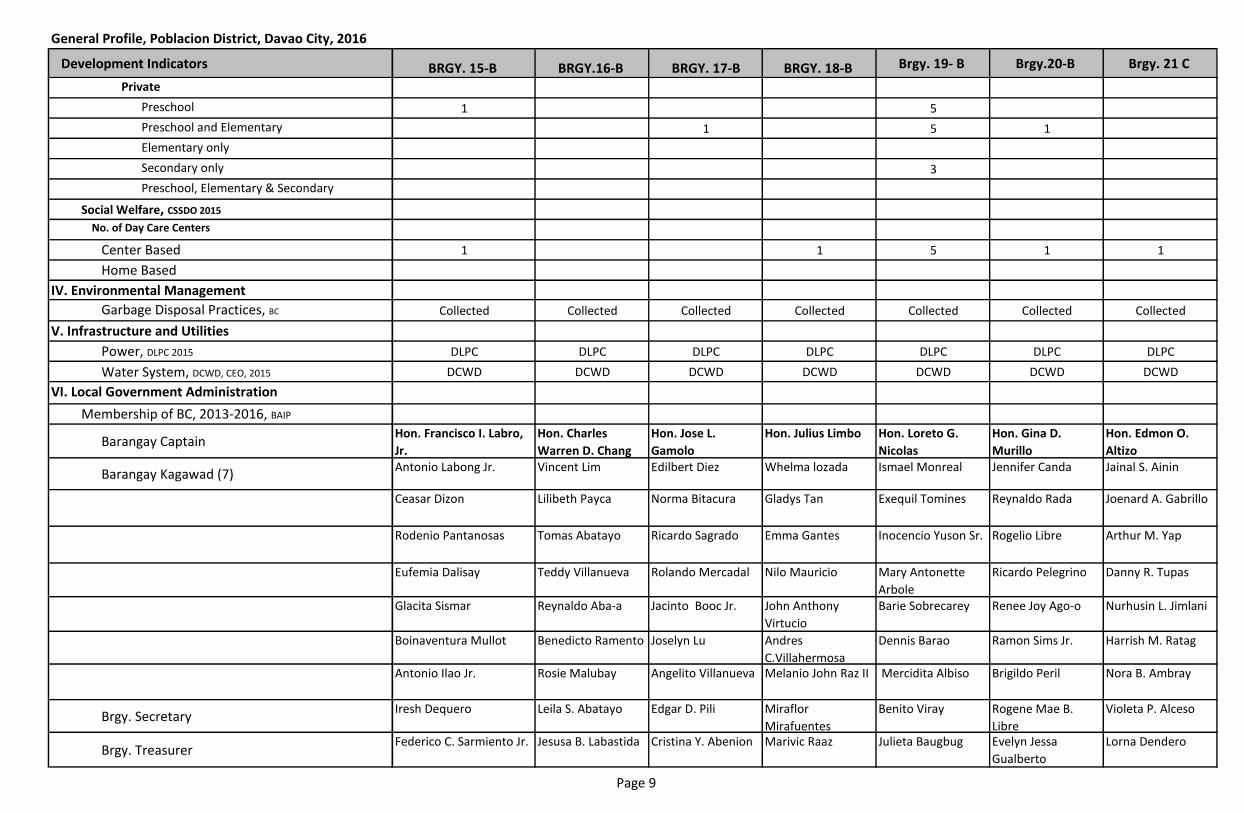
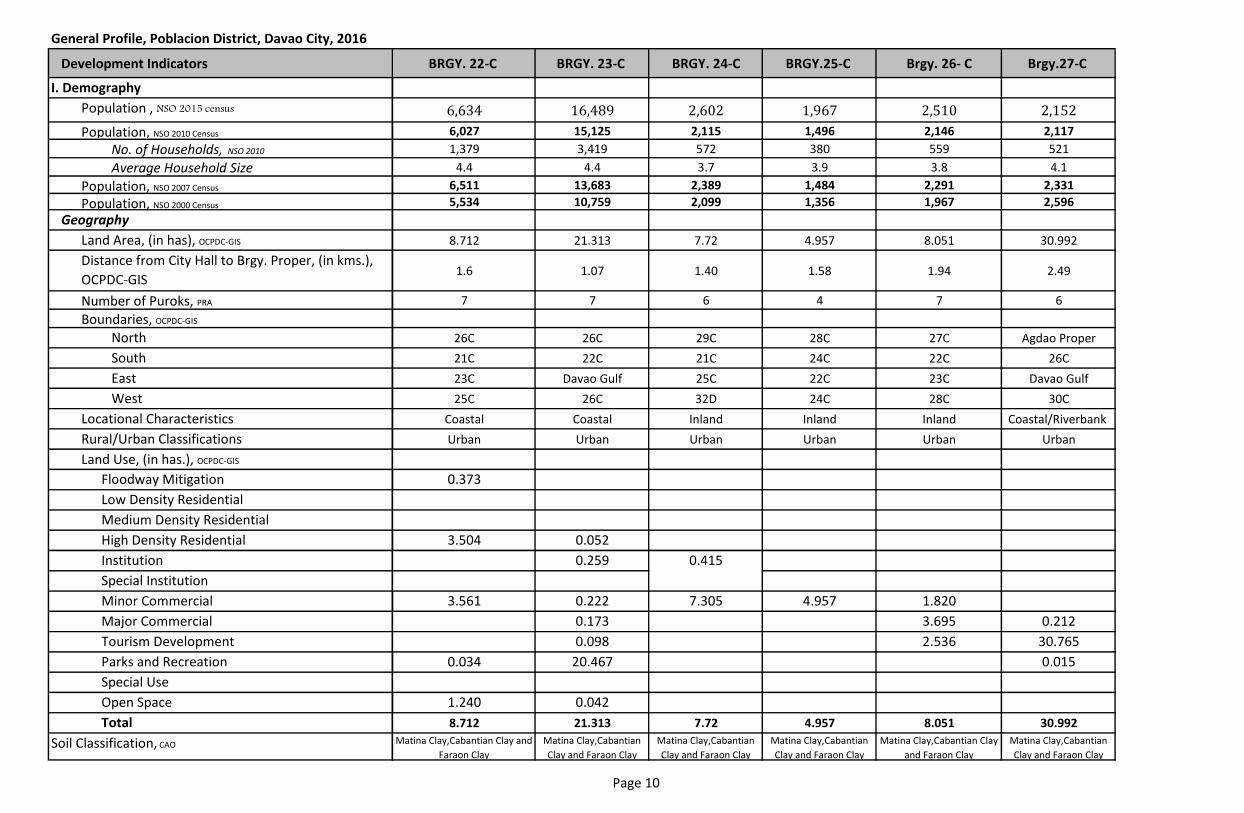
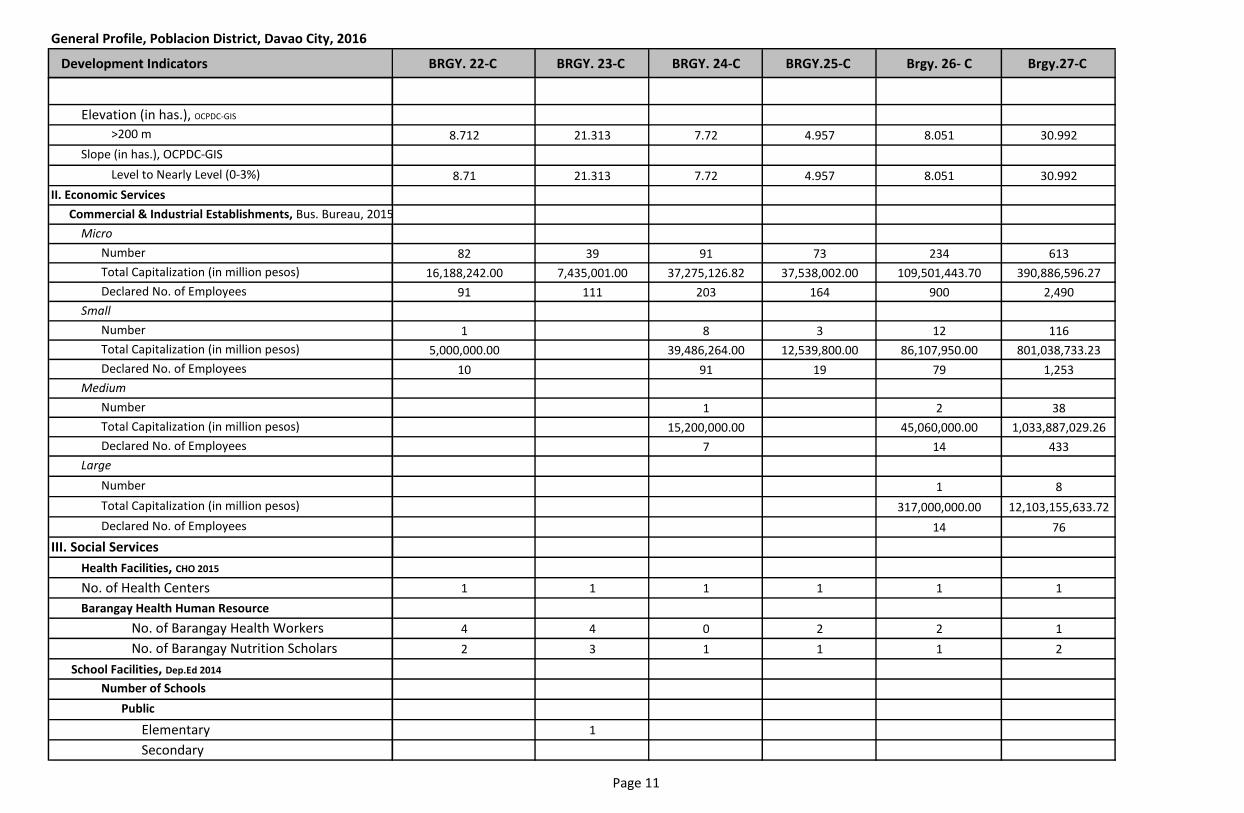
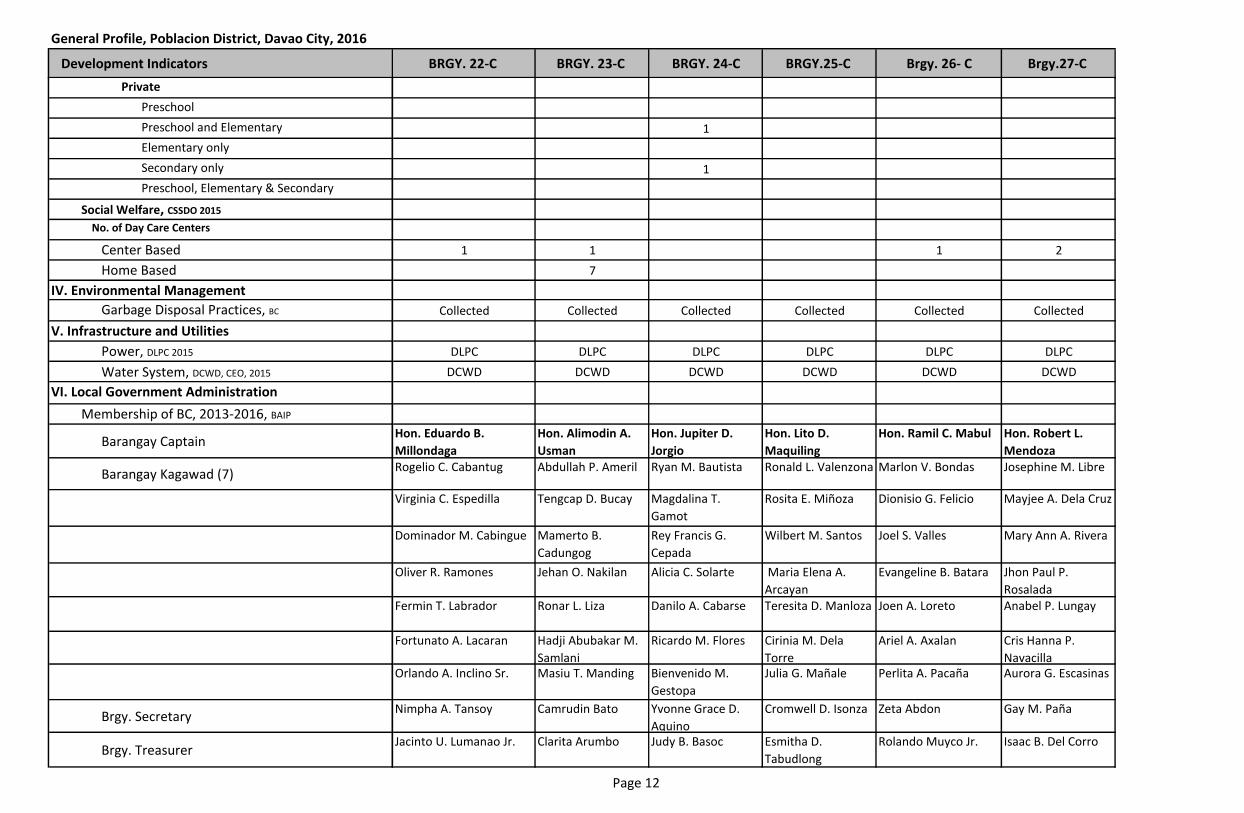
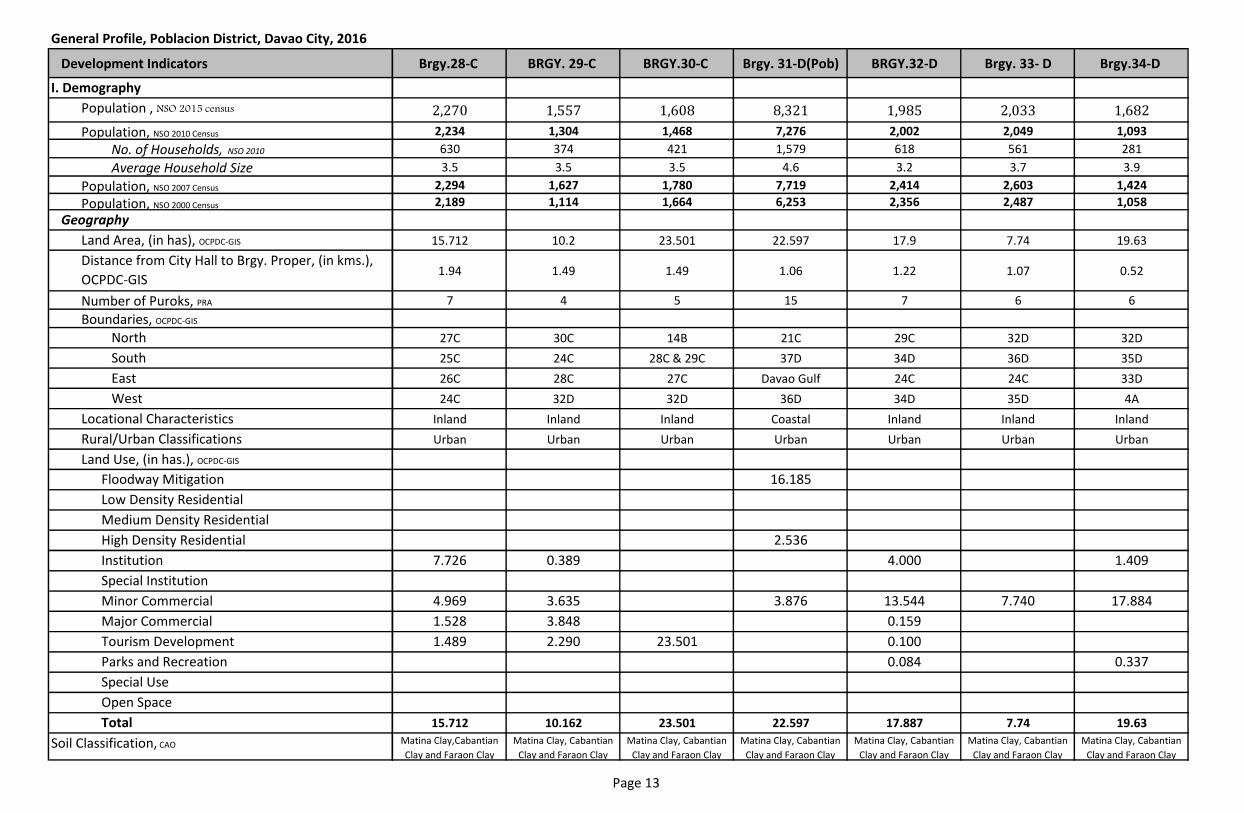
General Profile, Poblacion District, Davao City, 2016
Development Indicators BRGY. 1-A BRGY.2-A BRGY. 3-A BRGY.4-A Brgy. 5-A Brgy.6-A Brgy. 7 A
I. Demography
Population , NSO 2015 census 3,103 3,589 370 1,683 11,436 2,084 3,984
Population, NSO 2010 Census 3,038 2,953 399 1,706 11,232 2,046 4,334
No. of Households, NSO 2010 882 763 100 562 2,558 465 1,220
Average Household Size 3.4 3.9 4.0 3.0 4.4 4.4 3.6
Population, NSO 2007 Census 3,201 3,108 597 1,978 9,946 2,560 4,345
Population, NSO 2000 Census 3,000 3,312 488 1,619 9,530 1,923 4,184
Geography
Land Area, (in has), OCPDC-GIS 15.355 16.38 20.776 23.51 38.1 15.0 22.5
Distance from City Hall to Brgy. Proper, (in kms.),
OCPDC-GIS0.01 City Hall area 0.1 0.7 0.87 0.75 0.93
Number of Puroks, PRA 7 7 6 7 19 8 9
Boundaries, OCPDC-GIS
North 2A 3A 4A 10A 6A 7A 9A
South 40-D 1-A 38D 3A Davao River 5A 6A
East 40/39D 3A 34D 34D 6A 3A 4A
West Davao River Davao River 2A 7A Davao River 5A 8A
Locational Characteristics Riverbank Inland Inland Inland Riverbank Inland Inland
Rural/Urban Classifications Urban Urban Urban Urban Urban Urban Urban
Land Use, (in has.), OCPDC-GIS
Floodway Mitigation 14.574 4.422 29.610
Low Density Residential
Medium Density Residential
High Density Residential 2.882
Institution 0.667 1.743 1.488 3.891 0.832 1.954 1.277
Special Institution
Minor Commercial 0.114 10.215 19.288 16.150 4.814 13.014 21.187
Major Commercial
Tourism Development
Parks and Recreation 3.469
Special Use
Open Space
Total 15.355 16.380 20.776 23.51 38.138 14.968 22.464
Soil Classification, CAO Matina Clay,Cabantian
Clay & Faraon Clay
Matina Clay,Cabantian
Clay & Faraon Clay
Matina Clay,Cabantian
Clay & Faraon Clay
Matina Clay,Cabantian
Clay & Faraon Clay
Matina Clay,Cabantian
Clay & Faraon Clay
Matina Clay,Cabantian
Clay & Faraon Clay
Matina Clay,Cabantian
Clay & Faraon Clay
Page 1
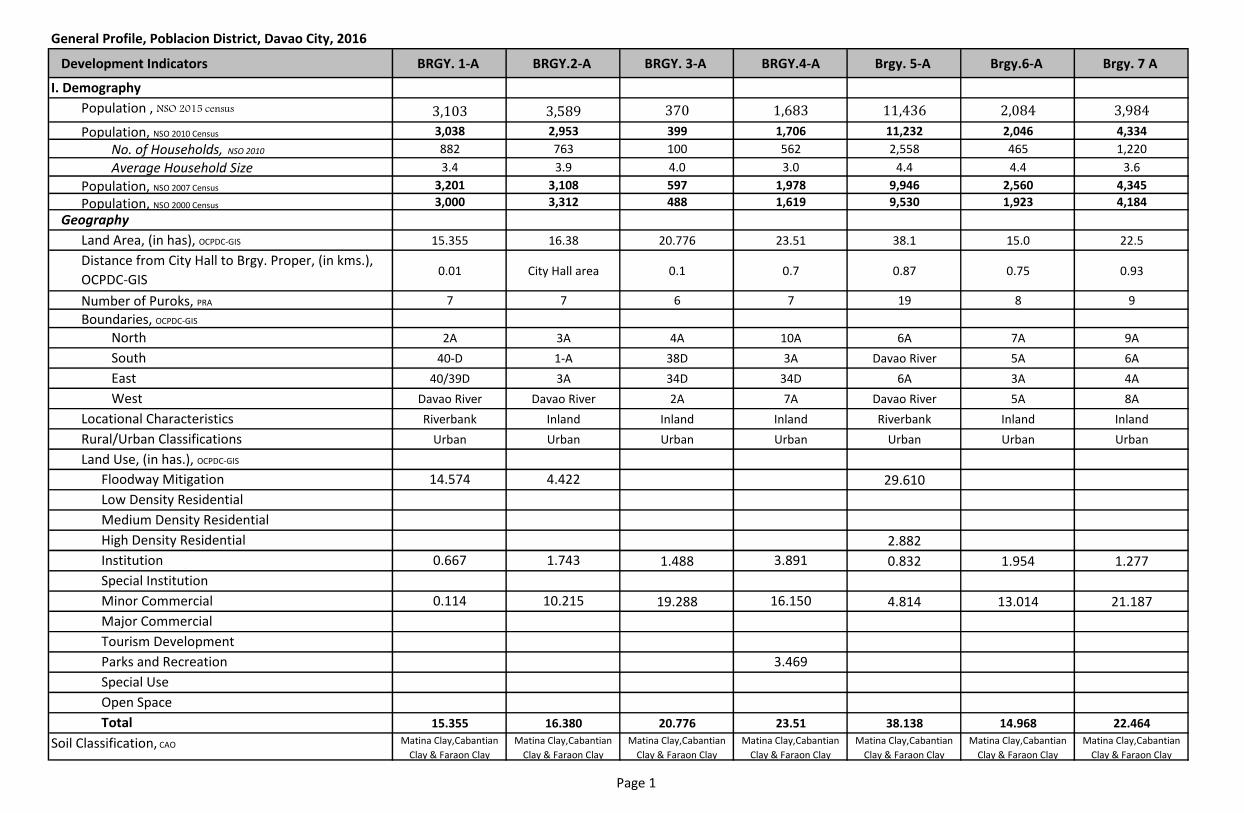
General Profile, Poblacion District, Davao City, 2016
Development Indicators BRGY. 1-A BRGY.2-A BRGY. 3-A BRGY.4-A Brgy. 5-A Brgy.6-A Brgy. 7 A
Elevation (in has.), OCPDC-GIS
>200 m 15.355 16.38 20.776 23.51 38.138 14.968 22.464
Slope (in has.), OCPDC-GIS
Level to Nearly Level (0-3%) 15.355 16.38 20.776 23.51 38.138 14.968 22.464
II. Economic Services
Micro
Number 124 450 842 238 672 167 236
Total Capitalization (in million pesos) 51,202,484.68 204,841,925.56 385,195,648.62 128,298,700.32 87,664,978.63 75,000,736.90 136,271,381.20
Declared No. of Employees 791 1,698 4,976 1,559 964 594 910
Small
Number 12 58 80 24 8 17 22
Total Capitalization (in million pesos) 86,952,796.60 399,567,738.85 585,458,083.45 136,884,022.00 71,208,832.20 118,691,752.00 143,845,271.80
Declared No. of Employees 80 406 989 286 209 76 579
Medium
Number 2 18 22 5 1 2 7
Total Capitalization (in million pesos) 54,721,630.81 462,183,869.39 633,014,414.92 155,084,466.15 31,672,500.00 46,867,774.01 175,530,350.00
Declared No. of Employees 52 136 339 17 3 25 247
Large
Number 4 5 4 2
Total Capitalization (in million pesos) 647,114,776.59 1,841,193,898.41 25,444,750,000.00 289,256,839.17
Declared No. of Employees 27 511 451 18
III. Social Services
Health Facilities, CHO 2015
No. of Health Centers 1 1 0 1 1 1 0
Barangay Health Human Resource
No. of Barangay Health Workers 1 3 0 0 3 3 1
No. of Barangay Nutrition Scholars 1 1 0 1 4 1 2
School Facilities, Dep.Ed 2014
Number of Schools
Public
Elementary 1 1 1 1 1
Secondary
Commercial & Industrial Establishments, Bus. Bureau, 2015
Page 2
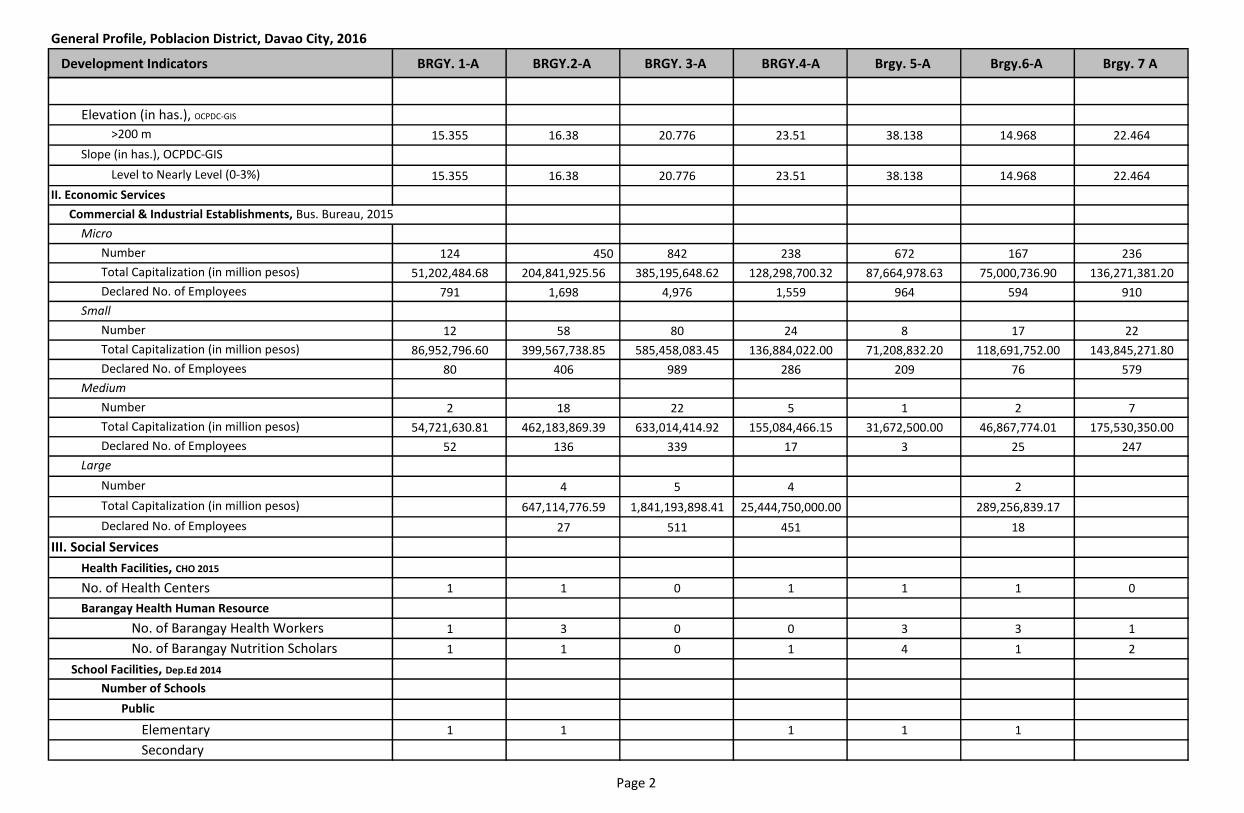
General Profile, Poblacion District, Davao City, 2016
Development Indicators BRGY. 1-A BRGY.2-A BRGY. 3-A BRGY.4-A Brgy. 5-A Brgy.6-A Brgy. 7 A
Private
Preschool
Preschool and Elementary 1 1 1 1
Elementary only
Secondary only 1 1 1
Preschool, Elementary & Secondary
Social Welfare, CSSDO 2015
No. of Day Care Centers
Center Based 1 1 1 5 1 2
Home Based
IV. Environmental Management
Garbage Disposal Practices, BC Collected Collected Collected Collected Collected Collected Collected
V. Infrastructure and Utilities
Power, DLPC 2015 DLPC DLPC DLPC DLPC DLPC DLPC DLPC
Water System, DCWD, CEO, 2015 DCWD DCWD DCWD DCWD DCWD DCWD DCWD
VI. Local Government Administration
Membership of BC, 2013-2016, BAIP
Barangay CaptainHon. Elpidio J.
Alicaway
Hon. Marius S.
Garcia
Hon. Teofilo Y.
Guino-o
Hon. Rogelio A.
Nocom
Hon. Romeo T.
Pantonial
Hon. Franklin V.
Librado
Hon. Joseph H.
Orilla
Barangay Kagawad (7)Roy D. Tecson Carlos S. Garcia Gabriel F. Guino-o Romaranje T.
Nocom
Hector Emmanuel
T. Delos Reyes
Reolsyl E. Caingles
Alexis Emmerson C.
Sayson
Nilda N. Naraval Jose T. Baer Froilan M.
Fernandez
Gilbert P. Mata
Sr. Natividad I. Soliva Alexander P.
Manaopanao
Alma D. Gallegos Carlofer L. Batilo Edward II T. Tombo Reynaldo P. Letran Miguel B. Tahura Romina C. Canonigo Manuel S. Ortega
Willy E. Bajao Kharla Phaula U.
Garcia
Edwin S. Calustre Romeo L. Asares Jr. Edwin I. Ociones Sr. Allan A. Olaer Alexander S. Tapic
Sr.Richard A. Magpuyo Emilee A. Suplido Victoria O.
Macasaet
Crismon C. Obregon Rosario Cherrilyn E.
Tee
Hernani O.
Castañares
Albert G. Musico
Ernie D. Dela Salde Jobert J.Dela Cruz Katrina Kim T.
Tombo
Marites A. Bierneza Osop G. Barani Solaiman D. Diamla Helen M. Octavia
Gina P. Canoy Marcelino C.
Garado Jr.
Ernesto II N.
Macasaet
Exuperio P. Bariqut Jose R. Gecole Jr. Zacaria C. Mala Alex N. Abines
Brgy. SecretarySheryle Dela Salde Jorge C. Sedoña Sylvena Castaña Connie Donato Rachel Vilma
Endraca
Brgy. TreasurerJacqueline Milan Mely Arias Josefina C. De Vera Loreta Mahinay Hilda G. Rosal
Page 3
General Profile, Poblacion District, Davao City, 2016
Development Indicators
I. Demography
Population , NSO 2015 census
Population, NSO 2010 Census
No. of Households, NSO 2010
Average Household Size
Population, NSO 2007 Census
Population, NSO 2000 Census
Geography
Land Area, (in has), OCPDC-GIS
Distance from City Hall to Brgy. Proper, (in kms.),
OCPDC-GIS
Number of Puroks, PRA
Boundaries, OCPDC-GIS
North
South
East
West
Locational Characteristics
Rural/Urban Classifications
Land Use, (in has.), OCPDC-GIS
Floodway Mitigation
Low Density Residential
Medium Density Residential
High Density Residential
Institution
Special Institution
Minor Commercial
Major Commercial
Tourism Development
Parks and Recreation
Special Use
Open Space
Total
Soil Classification, CAO
BRGY. 8-A BRGY.9-A BRGY. 10-A BRGY.11-B Brgy. 12-B Brgy.13-B Brgy.14-B
11,075 5,698 6,764 1,901 840 427 1,175
8,859 4,848 4,613 1,647 990 154 1,127
2,114 1,228 1,149 435 322 40 263
4.2 3.9 4.0 3.8 3.1 3.9 4.3
6,902 6,081 1,894 1,363 974 176 1,054
5,961 5,737 3,438 1,153 1,267 265 921
179.8 27.5 28.636 9.566 17.536 11.257 18.411
1.341.52 1.74 1.92 1.80 1.81 2.08
11 10 8 7 8 3 4
9A 10A 11B 12B 19B 18B 16B
5A 7A 9A 10A 11B 12B 30C
7A 10A 11B 12B 13B 14B 15B
Davao River 8A 9A 10A 10B 12B 13B
Riverbank Inland Inland Inland Inland Inland Inland
Urban Urban Urban Urban Urban Urban Urban
85.585
28.932 5.029 2.564
6.468
18.326 0.742 9.370 1.218 0.663 5.157
17.682 21.712 16.702 9.566 16.318 10.107 4.266
0.598 7.647
0.487 1.341
22.186
179.777 27.483 28.64 9.57 17.536 11.257 18.41Matina Clay,Cabantian
Clay and Faraon Clay
Mtina Clay,Cabantian
Clay,and Faraon Clay
Matina Clay,Cabantian
Clay and Faraon Clay
Matina Clay,Cabantian
Clay and Faraon Clay
Matina Clay,Cabantian
Clay and Faraon Clay
Matina Clay,Cabantian
Clay and Faraon Clay
Matina Clay,Cabantian
Clay and Faraon Clay
Page 4

General Profile, Poblacion District, Davao City, 2016
Development Indicators
Elevation (in has.), OCPDC-GIS
>200 m
Slope (in has.), OCPDC-GIS
Level to Nearly Level (0-3%)
II. Economic Services
Micro
Number
Total Capitalization (in million pesos)
Declared No. of Employees
Small
Number
Total Capitalization (in million pesos)
Declared No. of Employees
Medium
Number
Total Capitalization (in million pesos)
Declared No. of Employees
Large
Number
Total Capitalization (in million pesos)
Declared No. of Employees
III. Social Services
Health Facilities, CHO 2015
No. of Health Centers
Barangay Health Human Resource
No. of Barangay Health Workers
No. of Barangay Nutrition Scholars
School Facilities, Dep.Ed 2014
Number of Schools
Public
Elementary
Secondary
Commercial & Industrial Establishments, Bus. Bureau, 2015
BRGY. 8-A BRGY.9-A BRGY. 10-A BRGY.11-B Brgy. 12-B Brgy.13-B Brgy.14-B
179.777 27.483 28.636 9.566 17.536 11.257 18.411
179.777 27.483 28.636 9.566 17.536 11.257 18.411
78 265 333 221 116 548 129
16,829,101.50 152,730,203.67 186,014,219.12 125,391,828.45 72,907,976.74 323,515,251.69 74,550,599.00
104 1,105 1,401 1,191 638 2,771 357
7 26 31 22 12 45 20
53,606,744.00 146,407,606.00 223,066,651.45 167,729,195.10 88,012,940.00 261,788,413.26 117,596,540.10
46 146 193 2,445 153 247 980
3 5 1 5 4 4 4
122,000,000.00 157,060,829.00 28,606,420.00 130,775,000.00 128,169,867.66 100,275,000.00 151,471,839.00
291 135 3 34 53 43 16
1 1
4,200,000,000.00 1,501,005,000.00
34 199
1 0 0 1 1 1 1
3 3 6 0 2 1 1
1 4 2 1 1 1 1
1 1
1
Page 5
General Profile, Poblacion District, Davao City, 2016
Development Indicators
Private
Preschool
Preschool and Elementary
Elementary only
Secondary only
Preschool, Elementary & Secondary
Social Welfare, CSSDO 2015
No. of Day Care Centers
Center Based
Home Based
IV. Environmental Management
Garbage Disposal Practices, BC
V. Infrastructure and Utilities
Power, DLPC 2015
Water System, DCWD, CEO, 2015
VI. Local Government Administration
Membership of BC, 2013-2016, BAIP
Barangay Captain
Barangay Kagawad (7)
Brgy. Secretary
Brgy. Treasurer
BRGY. 8-A BRGY.9-A BRGY. 10-A BRGY.11-B Brgy. 12-B Brgy.13-B Brgy.14-B
1 3 1 1 1
1 2 1 2 2
2 2 1 1
1
Collected Collected Collected Collected Collected Collected Collected
DLPC DLPC DLPC DLPC DLPC DLPC DLPC
DCWD DCWD DCWD DCWD DCWD DCWD DCWD
Hon. Ariel L.
Lagmay
Hon. Roderico A.
Llubit
Hon. Mark Anthony C.
CayetanoHon. Martisa Fe
Arabiana
Hon. Nelia C.
Tumabang
Hon. Roland C.
Ebdalin
Hon. Agnes S.Lira
Adelaida O. Carupo Juanito O. Apale Jr. Armando A. Amacio Yolanda Ibay Alvin Amoy Robert Adlawan Sr Vicente Cajegas
Josephine P. Medel Cyrus O. Zozobrado Luzviminda M.
Borja
Rota Gonser Jeremie Rico Mauricio Soliman
Jr.
Eduardo Batao
James J. Abadilla Brandy Allen S.
Fuentes
Estrellita V.
Masinading
Gerardo Parada Renato Villegas Lorielyn Balote Emilia Fortuna
Renato S.
Gatchalian
Katherine June A.
Tuna
Mercedes B.
Amacio
Jesus Basul Archimedes
Alcoseba
Nora Luchavez Alejandro Baliong
Raul L. Librado Blaine J. Barredo Edison C. Villegas Jerson Pilapil Nelson Abella Santiago Gumanid
Jr.
Nicolas Prado
Danilo P. Apuya Sr. Eleuterio F. Dela
Cruz Jr.
Edgardo A. Vergara Darwin Rodriguez Nathaniel Pacatang Dannyboy
Maynabay
Olimpio Golosino
Ruben M. Dongzal Christopher B.
Calumpang
Romeo P.
Mamontayao
Rogelio Sebiya Noel Sadural Andrew Dorado Nelfa O. Abiador
Imeelyn B. Bulac Elvira P. Erguiro Rhennee Rose
Santiago
Mari Jun M.
Monteverde
Melanie Villanueva Rhine Geldore Jean Alah R. Diaz
Noriel Abo Carmen O. Sandoval Mary Ann San
Pedro
Maria Victoria B.
Rodriguez
Ruvelyn Cansi Yo-Ann Ledo Ma. Cristina B. Dela
Cerna
Page 6

General Profile, Poblacion District, Davao City, 2016
Development Indicators
I. Demography
Population , NSO 2015 census
Population, NSO 2010 Census
No. of Households, NSO 2010
Average Household Size
Population, NSO 2007 Census
Population, NSO 2000 Census
Geography
Land Area, (in has), OCPDC-GIS
Distance from City Hall to Brgy. Proper, (in kms.),
OCPDC-GIS
Number of Puroks, PRA
Boundaries, OCPDC-GIS
North
South
East
West
Locational Characteristics
Rural/Urban Classifications
Land Use, (in has.), OCPDC-GIS
Floodway Mitigation
Low Density Residential
Medium Density Residential
High Density Residential
Institution
Special Institution
Minor Commercial
Major Commercial
Tourism Development
Parks and Recreation
Special Use
Open Space
Total
Soil Classification, CAO
BRGY. 15-B BRGY.16-B BRGY. 17-B BRGY. 18-B Brgy. 19- B Brgy.20-B Brgy. 21 C
2,891 840 810 1,832 31,766 4,581 7,4782,700 560 774 1,561 29,247 4,499 7,097
664 147 204 403 6,853 1,451 1,527
4.1 3.8 3.8 3.9 4.3 3.1 4.62,784 868 1,044 1,694 28,088 4,087 6,5462,534 724 875 1,605 19,875 4,124 6,295
31.542 5.527 5.627 19.8 362.552 56.578 8.563
2.54 2.62 2.61 2.492.45 3.49 1.40
8 6 6 6 21 6 8
16B Agdao Proper 18B 20B Maa Agdao Proper 22C
27C 14B 16B 17B 12B 18B 31D
Agdao Proper 15B 16B/Agdao Agdao Proper 18B Agdao Proper 22C
14B 17B 18B 19B 10-A 19B 33D
Inland Inland Inland Inland Riverbank Inland Coastal
Urban Urban Urban Urban Urban Urban Urban
88.06 5.304
105.20
8.43
0.732
6.598 7.10 1.242
5.269 5.627 10.876 42.49 22.509
31.542 0.258 2.309 105.20 32.827 2.527
5.98
0.10
31.542 5.527 5.627 19.783 362.55 56.578 8.563
Matina Clay,Cabantian Clay and
Faraon Clay
Matina Clay,Cabantian
Clay and Faraon Clay
Matina Clay,Cabantian
Clay and Faraon Clay
Matina Clay,Cabantian
Clay and Faraon Clay
Matina Clay,Cabantian
Clay and Faraon Clay
Matina Clay,Cabantian
Clay and Faraon Clay
Matina Clay,Cabantian
Clay and Faraon Clay
Page 7
General Profile, Poblacion District, Davao City, 2016
Development Indicators
Elevation (in has.), OCPDC-GIS
>200 m
Slope (in has.), OCPDC-GIS
Level to Nearly Level (0-3%)
II. Economic Services
Micro
Number
Total Capitalization (in million pesos)
Declared No. of Employees
Small
Number
Total Capitalization (in million pesos)
Declared No. of Employees
Medium
Number
Total Capitalization (in million pesos)
Declared No. of Employees
Large
Number
Total Capitalization (in million pesos)
Declared No. of Employees
III. Social Services
Health Facilities, CHO 2015
No. of Health Centers
Barangay Health Human Resource
No. of Barangay Health Workers
No. of Barangay Nutrition Scholars
School Facilities, Dep.Ed 2014
Number of Schools
Public
Elementary
Secondary
Commercial & Industrial Establishments, Bus. Bureau, 2015
BRGY. 15-B BRGY.16-B BRGY. 17-B BRGY. 18-B Brgy. 19- B Brgy.20-B Brgy. 21 C
31.542 5.527 5.63 19.78 362.552 56.578 8.563
31.542 5.527 5.63 19.78 362.55 56.58 8.56
197 55 73 279 782 812 52
152,182,862.92 27,950,773.00 38,755,805.00 136,756,038.77 431,284,229.04 564,308,757.93 17,978,718.00
1,494 406 352 1,009 4,498 3,331 75
48 7 7 18 86 92
319,016,164.40 33,928,810.00 39,248,399.26 127,482,760.32 599,340,026.31 547,619,642.60
1,228 30 31 360 1,255 1,138
3 1 3 17 11
62,675,900.00 42,000,000.00 64,800,000.00 543,889,982.00 279,390,780.00
277 18 14 473 190
1 4 7
140,202,600.00 15,813,597,839.00 2,643,946,197.00
5 146 181
1 0 0 1 1 1 1
3 1 1 0 0 4 5
1 1 1 1 5 1 2
1 1
Page 8
General Profile, Poblacion District, Davao City, 2016
Development Indicators
Private
Preschool
Preschool and Elementary
Elementary only
Secondary only
Preschool, Elementary & Secondary
Social Welfare, CSSDO 2015
No. of Day Care Centers
Center Based
Home Based
IV. Environmental Management
Garbage Disposal Practices, BC
V. Infrastructure and Utilities
Power, DLPC 2015
Water System, DCWD, CEO, 2015
VI. Local Government Administration
Membership of BC, 2013-2016, BAIP
Barangay Captain
Barangay Kagawad (7)
Brgy. Secretary
Brgy. Treasurer
BRGY. 15-B BRGY.16-B BRGY. 17-B BRGY. 18-B Brgy. 19- B Brgy.20-B Brgy. 21 C
1 5
1 5 1
3
1 1 5 1 1
Collected Collected Collected Collected Collected Collected Collected
DLPC DLPC DLPC DLPC DLPC DLPC DLPC
DCWD DCWD DCWD DCWD DCWD DCWD DCWD
Hon. Francisco I. Labro,
Jr.
Hon. Charles
Warren D. Chang
Hon. Jose L.
Gamolo
Hon. Julius Limbo Hon. Loreto G.
Nicolas
Hon. Gina D.
Murillo
Hon. Edmon O.
Altizo Antonio Labong Jr. Vincent Lim Edilbert Diez Whelma lozada Ismael Monreal Jennifer Canda Jainal S. Ainin
Ceasar Dizon Lilibeth Payca Norma Bitacura Gladys Tan Exequil Tomines Reynaldo Rada Joenard A. Gabrillo
Rodenio Pantanosas Tomas Abatayo Ricardo Sagrado Emma Gantes Inocencio Yuson Sr. Rogelio Libre Arthur M. Yap
Eufemia Dalisay Teddy Villanueva Rolando Mercadal Nilo Mauricio Mary Antonette
Arbole
Ricardo Pelegrino Danny R. Tupas
Glacita Sismar Reynaldo Aba-a Jacinto Booc Jr. John Anthony
Virtucio
Barie Sobrecarey Renee Joy Ago-o Nurhusin L. Jimlani
Boinaventura Mullot Benedicto Ramento Joselyn Lu Andres
C.Villahermosa
Dennis Barao Ramon Sims Jr. Harrish M. Ratag
Antonio Ilao Jr. Rosie Malubay Angelito Villanueva Melanio John Raz II Mercidita Albiso Brigildo Peril Nora B. Ambray
Iresh Dequero Leila S. Abatayo Edgar D. Pili Miraflor
Mirafuentes
Benito Viray Rogene Mae B.
Libre
Violeta P. Alceso
Federico C. Sarmiento Jr. Jesusa B. Labastida Cristina Y. Abenion Marivic Raaz Julieta Baugbug Evelyn Jessa
Gualberto
Lorna Dendero
Page 9
General Profile, Poblacion District, Davao City, 2016
Development Indicators
I. Demography
Population , NSO 2015 census
Population, NSO 2010 Census
No. of Households, NSO 2010
Average Household Size
Population, NSO 2007 Census
Population, NSO 2000 Census
Geography
Land Area, (in has), OCPDC-GIS
Distance from City Hall to Brgy. Proper, (in kms.),
OCPDC-GIS
Number of Puroks, PRA
Boundaries, OCPDC-GIS
North
South
East
West
Locational Characteristics
Rural/Urban Classifications
Land Use, (in has.), OCPDC-GIS
Floodway Mitigation
Low Density Residential
Medium Density Residential
High Density Residential
Institution
Special Institution
Minor Commercial
Major Commercial
Tourism Development
Parks and Recreation
Special Use
Open Space
Total
Soil Classification, CAO
BRGY. 22-C BRGY. 23-C BRGY. 24-C BRGY.25-C Brgy. 26- C Brgy.27-C
6,634 16,489 2,602 1,967 2,510 2,152
6,027 15,125 2,115 1,496 2,146 2,117
1,379 3,419 572 380 559 521
4.4 4.4 3.7 3.9 3.8 4.1
6,511 13,683 2,389 1,484 2,291 2,331
5,534 10,759 2,099 1,356 1,967 2,596
8.712 21.313 7.72 4.957 8.051 30.992
1.6 1.07 1.40 1.58 1.94 2.49
7 7 6 4 7 6
26C 26C 29C 28C 27C Agdao Proper
21C 22C 21C 24C 22C 26C
23C Davao Gulf 25C 22C 23C Davao Gulf
25C 26C 32D 24C 28C 30C
Coastal Coastal Inland Inland Inland Coastal/Riverbank
Urban Urban Urban Urban Urban Urban
0.373
3.504 0.052
0.259 0.415
3.561 0.222 7.305 4.957 1.820
0.173 3.695 0.212
0.098 2.536 30.765
0.034 20.467 0.015
1.240 0.042
8.712 21.313 7.72 4.957 8.051 30.992
Matina Clay,Cabantian Clay and
Faraon Clay
Matina Clay,Cabantian
Clay and Faraon Clay
Matina Clay,Cabantian
Clay and Faraon Clay
Matina Clay,Cabantian
Clay and Faraon Clay
Matina Clay,Cabantian Clay
and Faraon Clay
Matina Clay,Cabantian
Clay and Faraon Clay
Page 10
General Profile, Poblacion District, Davao City, 2016
Development Indicators
Elevation (in has.), OCPDC-GIS
>200 m
Slope (in has.), OCPDC-GIS
Level to Nearly Level (0-3%)
II. Economic Services
Micro
Number
Total Capitalization (in million pesos)
Declared No. of Employees
Small
Number
Total Capitalization (in million pesos)
Declared No. of Employees
Medium
Number
Total Capitalization (in million pesos)
Declared No. of Employees
Large
Number
Total Capitalization (in million pesos)
Declared No. of Employees
III. Social Services
Health Facilities, CHO 2015
No. of Health Centers
Barangay Health Human Resource
No. of Barangay Health Workers
No. of Barangay Nutrition Scholars
School Facilities, Dep.Ed 2014
Number of Schools
Public
Elementary
Secondary
Commercial & Industrial Establishments, Bus. Bureau, 2015
BRGY. 22-C BRGY. 23-C BRGY. 24-C BRGY.25-C Brgy. 26- C Brgy.27-C
8.712 21.313 7.72 4.957 8.051 30.992
8.71 21.313 7.72 4.957 8.051 30.992
82 39 91 73 234 613
16,188,242.00 7,435,001.00 37,275,126.82 37,538,002.00 109,501,443.70 390,886,596.27
91 111 203 164 900 2,490
1 8 3 12 116
5,000,000.00 39,486,264.00 12,539,800.00 86,107,950.00 801,038,733.23
10 91 19 79 1,253
1 2 38
15,200,000.00 45,060,000.00 1,033,887,029.26
7 14 433
1 8
317,000,000.00 12,103,155,633.72
14 76
1 1 1 1 1 1
4 4 0 2 2 1
2 3 1 1 1 2
1
Page 11
General Profile, Poblacion District, Davao City, 2016
Development Indicators
Private
Preschool
Preschool and Elementary
Elementary only
Secondary only
Preschool, Elementary & Secondary
Social Welfare, CSSDO 2015
No. of Day Care Centers
Center Based
Home Based
IV. Environmental Management
Garbage Disposal Practices, BC
V. Infrastructure and Utilities
Power, DLPC 2015
Water System, DCWD, CEO, 2015
VI. Local Government Administration
Membership of BC, 2013-2016, BAIP
Barangay Captain
Barangay Kagawad (7)
Brgy. Secretary
Brgy. Treasurer
BRGY. 22-C BRGY. 23-C BRGY. 24-C BRGY.25-C Brgy. 26- C Brgy.27-C
1
1
1 1 1 2
7
Collected Collected Collected Collected Collected Collected
DLPC DLPC DLPC DLPC DLPC DLPC
DCWD DCWD DCWD DCWD DCWD DCWD
Hon. Eduardo B.
Millondaga
Hon. Alimodin A.
Usman
Hon. Jupiter D.
Jorgio
Hon. Lito D.
Maquiling
Hon. Ramil C. Mabul Hon. Robert L.
MendozaRogelio C. Cabantug Abdullah P. Ameril Ryan M. Bautista Ronald L. Valenzona Marlon V. Bondas Josephine M. Libre
Virginia C. Espedilla Tengcap D. Bucay Magdalina T.
Gamot
Rosita E. Miñoza Dionisio G. Felicio Mayjee A. Dela Cruz
Dominador M. Cabingue Mamerto B.
Cadungog
Rey Francis G.
Cepada
Wilbert M. Santos Joel S. Valles Mary Ann A. Rivera
Oliver R. Ramones Jehan O. Nakilan Alicia C. Solarte Maria Elena A.
Arcayan
Evangeline B. Batara Jhon Paul P.
RosaladaFermin T. Labrador Ronar L. Liza Danilo A. Cabarse Teresita D. Manloza Joen A. Loreto Anabel P. Lungay
Fortunato A. Lacaran Hadji Abubakar M.
Samlani
Ricardo M. Flores Cirinia M. Dela
Torre
Ariel A. Axalan Cris Hanna P.
NavacillaOrlando A. Inclino Sr. Masiu T. Manding Bienvenido M.
Gestopa
Julia G. Mañale Perlita A. Pacaña Aurora G. Escasinas
Nimpha A. Tansoy Camrudin Bato Yvonne Grace D.
Aquino
Cromwell D. Isonza Zeta Abdon Gay M. Paña
Jacinto U. Lumanao Jr. Clarita Arumbo Judy B. Basoc Esmitha D.
Tabudlong
Rolando Muyco Jr. Isaac B. Del Corro
Page 12
General Profile, Poblacion District, Davao City, 2016
Development Indicators
I. Demography
Population , NSO 2015 census
Population, NSO 2010 Census
No. of Households, NSO 2010
Average Household Size
Population, NSO 2007 Census
Population, NSO 2000 Census
Geography
Land Area, (in has), OCPDC-GIS
Distance from City Hall to Brgy. Proper, (in kms.),
OCPDC-GIS
Number of Puroks, PRA
Boundaries, OCPDC-GIS
North
South
East
West
Locational Characteristics
Rural/Urban Classifications
Land Use, (in has.), OCPDC-GIS
Floodway Mitigation
Low Density Residential
Medium Density Residential
High Density Residential
Institution
Special Institution
Minor Commercial
Major Commercial
Tourism Development
Parks and Recreation
Special Use
Open Space
Total
Soil Classification, CAO
Brgy.28-C BRGY. 29-C BRGY.30-C Brgy. 31-D(Pob) BRGY.32-D Brgy. 33- D Brgy.34-D
2,270 1,557 1,608 8,321 1,985 2,033 1,682
2,234 1,304 1,468 7,276 2,002 2,049 1,093
630 374 421 1,579 618 561 281
3.5 3.5 3.5 4.6 3.2 3.7 3.9
2,294 1,627 1,780 7,719 2,414 2,603 1,424
2,189 1,114 1,664 6,253 2,356 2,487 1,058
15.712 10.2 23.501 22.597 17.9 7.74 19.63
1.94 1.49 1.49 1.06 1.22 1.07 0.52
7 4 5 15 7 6 6
27C 30C 14B 21C 29C 32D 32D
25C 24C 28C & 29C 37D 34D 36D 35D
26C 28C 27C Davao Gulf 24C 24C 33D
24C 32D 32D 36D 34D 35D 4A
Inland Inland Inland Coastal Inland Inland Inland
Urban Urban Urban Urban Urban Urban Urban
16.185
2.536
7.726 0.389 4.000 1.409
4.969 3.635 3.876 13.544 7.740 17.884
1.528 3.848 0.159
1.489 2.290 23.501 0.100
0.084 0.337
15.712 10.162 23.501 22.597 17.887 7.74 19.63
Matina Clay,Cabantian
Clay and Faraon Clay
Matina Clay, Cabantian
Clay and Faraon Clay
Matina Clay, Cabantian
Clay and Faraon Clay
Matina Clay, Cabantian
Clay and Faraon Clay
Matina Clay, Cabantian
Clay and Faraon Clay
Matina Clay, Cabantian
Clay and Faraon Clay
Matina Clay, Cabantian
Clay and Faraon Clay
Page 13
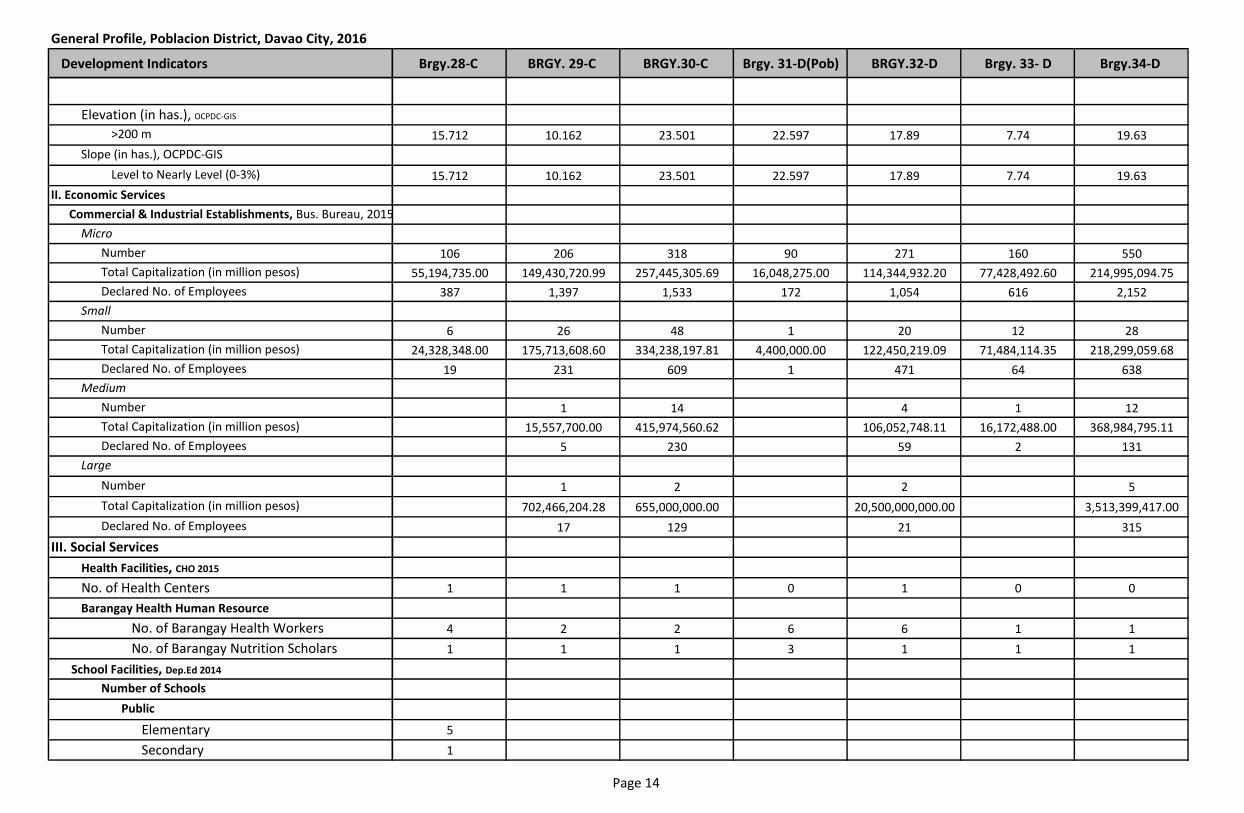
General Profile, Poblacion District, Davao City, 2016
Development Indicators
Elevation (in has.), OCPDC-GIS
>200 m
Slope (in has.), OCPDC-GIS
Level to Nearly Level (0-3%)
II. Economic Services
Micro
Number
Total Capitalization (in million pesos)
Declared No. of Employees
Small
Number
Total Capitalization (in million pesos)
Declared No. of Employees
Medium
Number
Total Capitalization (in million pesos)
Declared No. of Employees
Large
Number
Total Capitalization (in million pesos)
Declared No. of Employees
III. Social Services
Health Facilities, CHO 2015
No. of Health Centers
Barangay Health Human Resource
No. of Barangay Health Workers
No. of Barangay Nutrition Scholars
School Facilities, Dep.Ed 2014
Number of Schools
Public
Elementary
Secondary
Commercial & Industrial Establishments, Bus. Bureau, 2015
Brgy.28-C BRGY. 29-C BRGY.30-C Brgy. 31-D(Pob) BRGY.32-D Brgy. 33- D Brgy.34-D
15.712 10.162 23.501 22.597 17.89 7.74 19.63
15.712 10.162 23.501 22.597 17.89 7.74 19.63
106 206 318 90 271 160 550
55,194,735.00 149,430,720.99 257,445,305.69 16,048,275.00 114,344,932.20 77,428,492.60 214,995,094.75
387 1,397 1,533 172 1,054 616 2,152
6 26 48 1 20 12 28
24,328,348.00 175,713,608.60 334,238,197.81 4,400,000.00 122,450,219.09 71,484,114.35 218,299,059.68
19 231 609 1 471 64 638
1 14 4 1 12
15,557,700.00 415,974,560.62 106,052,748.11 16,172,488.00 368,984,795.11
5 230 59 2 131
1 2 2 5
702,466,204.28 655,000,000.00 20,500,000,000.00 3,513,399,417.00
17 129 21 315
1 1 1 0 1 0 0
4 2 2 6 6 1 1
1 1 1 3 1 1 1
5
1
Page 14
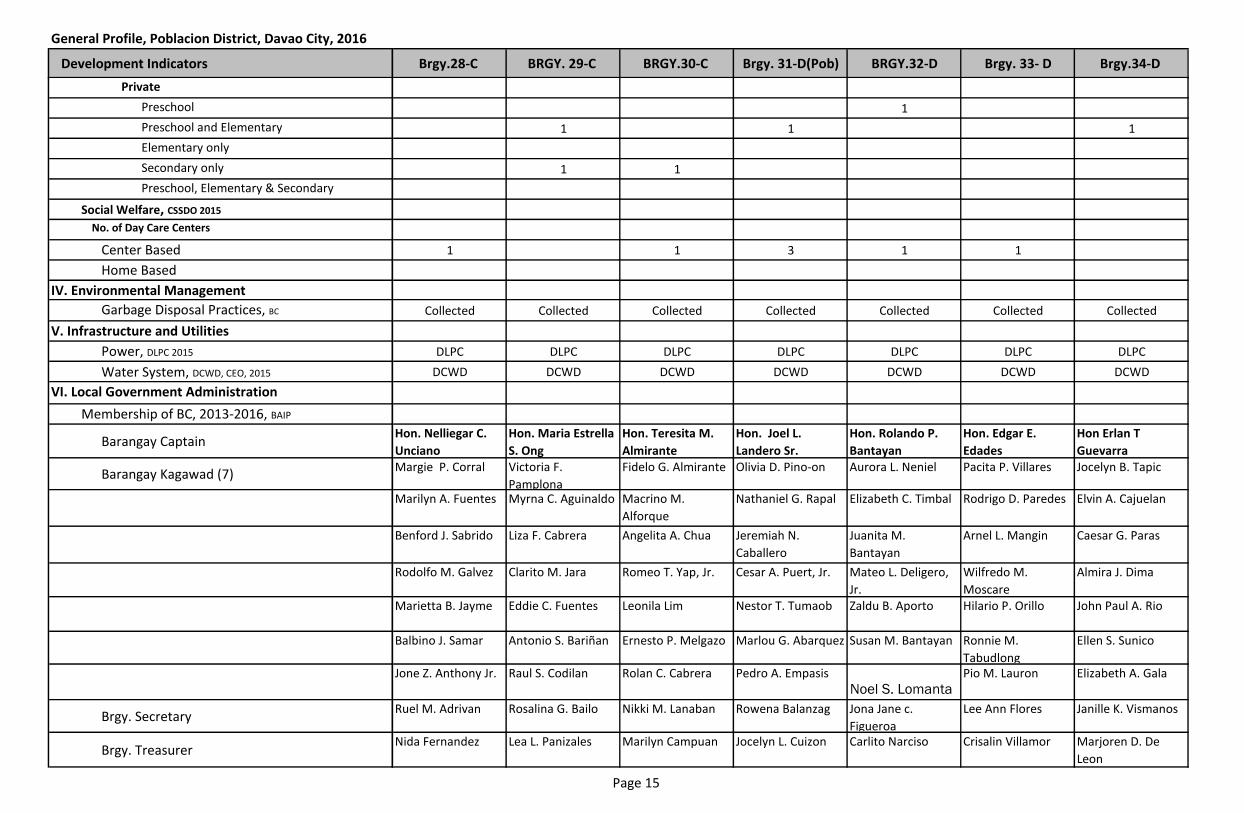
General Profile, Poblacion District, Davao City, 2016
Development Indicators
Private
Preschool
Preschool and Elementary
Elementary only
Secondary only
Preschool, Elementary & Secondary
Social Welfare, CSSDO 2015
No. of Day Care Centers
Center Based
Home Based
IV. Environmental Management
Garbage Disposal Practices, BC
V. Infrastructure and Utilities
Power, DLPC 2015
Water System, DCWD, CEO, 2015
VI. Local Government Administration
Membership of BC, 2013-2016, BAIP
Barangay Captain
Barangay Kagawad (7)
Brgy. Secretary
Brgy. Treasurer
Brgy.28-C BRGY. 29-C BRGY.30-C Brgy. 31-D(Pob) BRGY.32-D Brgy. 33- D Brgy.34-D
1
1 1 1
1 1
1 1 3 1 1
Collected Collected Collected Collected Collected Collected Collected
DLPC DLPC DLPC DLPC DLPC DLPC DLPC
DCWD DCWD DCWD DCWD DCWD DCWD DCWD
Hon. Nelliegar C.
Unciano
Hon. Maria Estrella
S. Ong
Hon. Teresita M.
Almirante
Hon. Joel L.
Landero Sr.
Hon. Rolando P.
Bantayan
Hon. Edgar E.
Edades
Hon Erlan T
Guevarra Margie P. Corral Victoria F.
Pamplona
Fidelo G. Almirante Olivia D. Pino-on Aurora L. Neniel Pacita P. Villares Jocelyn B. Tapic
Marilyn A. Fuentes Myrna C. Aguinaldo Macrino M.
Alforque
Nathaniel G. Rapal Elizabeth C. Timbal Rodrigo D. Paredes Elvin A. Cajuelan
Benford J. Sabrido Liza F. Cabrera Angelita A. Chua Jeremiah N.
Caballero
Juanita M.
Bantayan
Arnel L. Mangin Caesar G. Paras
Rodolfo M. Galvez Clarito M. Jara Romeo T. Yap, Jr. Cesar A. Puert, Jr. Mateo L. Deligero,
Jr.
Wilfredo M.
Moscare
Almira J. Dima
Marietta B. Jayme Eddie C. Fuentes Leonila Lim Nestor T. Tumaob Zaldu B. Aporto Hilario P. Orillo John Paul A. Rio
Balbino J. Samar Antonio S. Bariñan Ernesto P. Melgazo Marlou G. Abarquez Susan M. Bantayan Ronnie M.
Tabudlong
Ellen S. Sunico
Jone Z. Anthony Jr. Raul S. Codilan Rolan C. Cabrera Pedro A. EmpasisNoel S. Lomanta
Pio M. Lauron Elizabeth A. Gala
Ruel M. Adrivan Rosalina G. Bailo Nikki M. Lanaban Rowena Balanzag Jona Jane c.
Figueroa
Lee Ann Flores Janille K. Vismanos
Nida Fernandez Lea L. Panizales Marilyn Campuan Jocelyn L. Cuizon Carlito Narciso Crisalin Villamor Marjoren D. De
Leon
Page 15
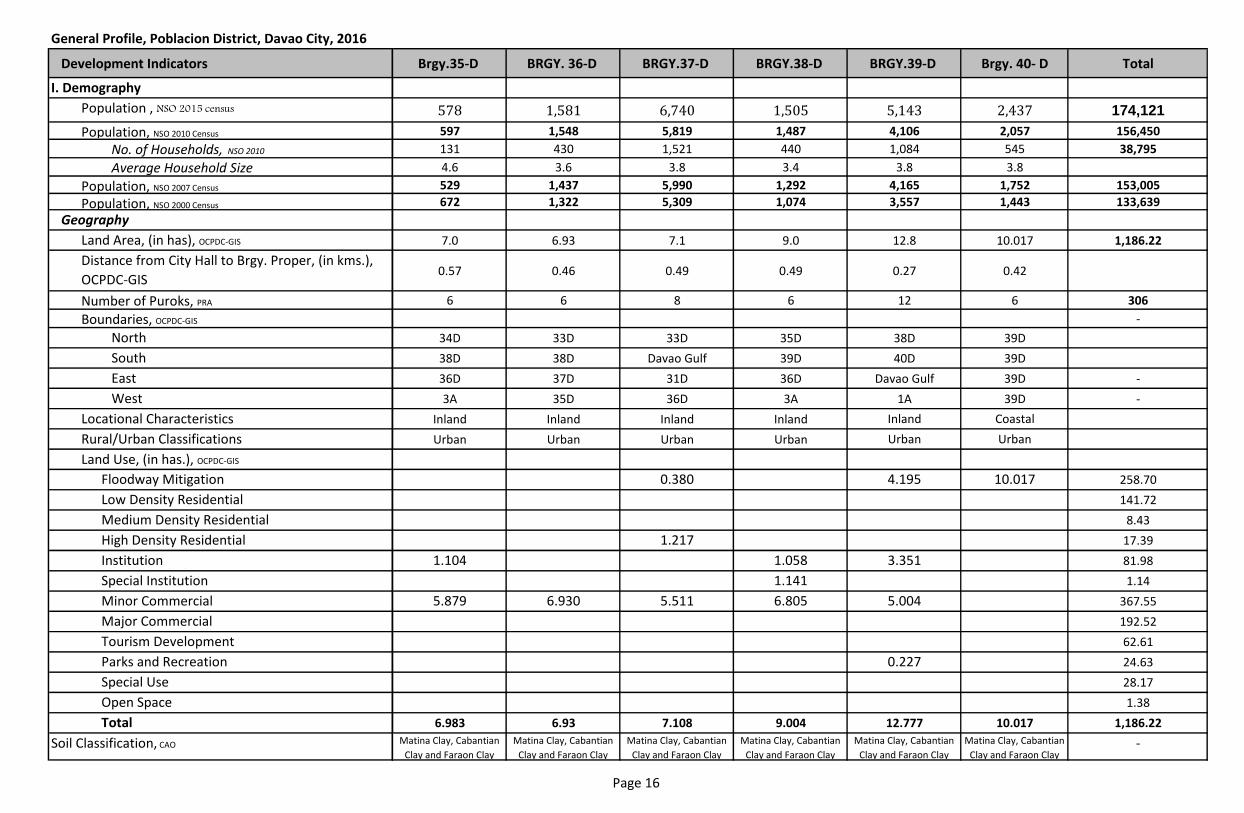
General Profile, Poblacion District, Davao City, 2016
Development Indicators
I. Demography
Population , NSO 2015 census
Population, NSO 2010 Census
No. of Households, NSO 2010
Average Household Size
Population, NSO 2007 Census
Population, NSO 2000 Census
Geography
Land Area, (in has), OCPDC-GIS
Distance from City Hall to Brgy. Proper, (in kms.),
OCPDC-GIS
Number of Puroks, PRA
Boundaries, OCPDC-GIS
North
South
East
West
Locational Characteristics
Rural/Urban Classifications
Land Use, (in has.), OCPDC-GIS
Floodway Mitigation
Low Density Residential
Medium Density Residential
High Density Residential
Institution
Special Institution
Minor Commercial
Major Commercial
Tourism Development
Parks and Recreation
Special Use
Open Space
Total
Soil Classification, CAO
Brgy.35-D BRGY. 36-D BRGY.37-D BRGY.38-D BRGY.39-D Brgy. 40- D Total
578 1,581 6,740 1,505 5,143 2,437 174,121
597 1,548 5,819 1,487 4,106 2,057 156,450
131 430 1,521 440 1,084 545 38,795
4.6 3.6 3.8 3.4 3.8 3.8
529 1,437 5,990 1,292 4,165 1,752 153,005
672 1,322 5,309 1,074 3,557 1,443 133,639
7.0 6.93 7.1 9.0 12.8 10.017 1,186.22
0.57 0.46 0.49 0.49 0.27 0.42
6 6 8 6 12 6 306
-
34D 33D 33D 35D 38D 39D
38D 38D Davao Gulf 39D 40D 39D
36D 37D 31D 36D Davao Gulf 39D -
3A 35D 36D 3A 1A 39D -
Inland Inland Inland Inland Inland Coastal
Urban Urban Urban Urban Urban Urban
0.380 4.195 10.017 258.70
141.72
8.43
1.217 17.39
1.104 1.058 3.351 81.98
1.141 1.14
5.879 6.930 5.511 6.805 5.004 367.55
192.52
62.61
0.227 24.63
28.17
1.38
6.983 6.93 7.108 9.004 12.777 10.017 1,186.22
Matina Clay, Cabantian
Clay and Faraon Clay
Matina Clay, Cabantian
Clay and Faraon Clay
Matina Clay, Cabantian
Clay and Faraon Clay
Matina Clay, Cabantian
Clay and Faraon Clay
Matina Clay, Cabantian
Clay and Faraon Clay
Matina Clay, Cabantian
Clay and Faraon Clay-
Page 16
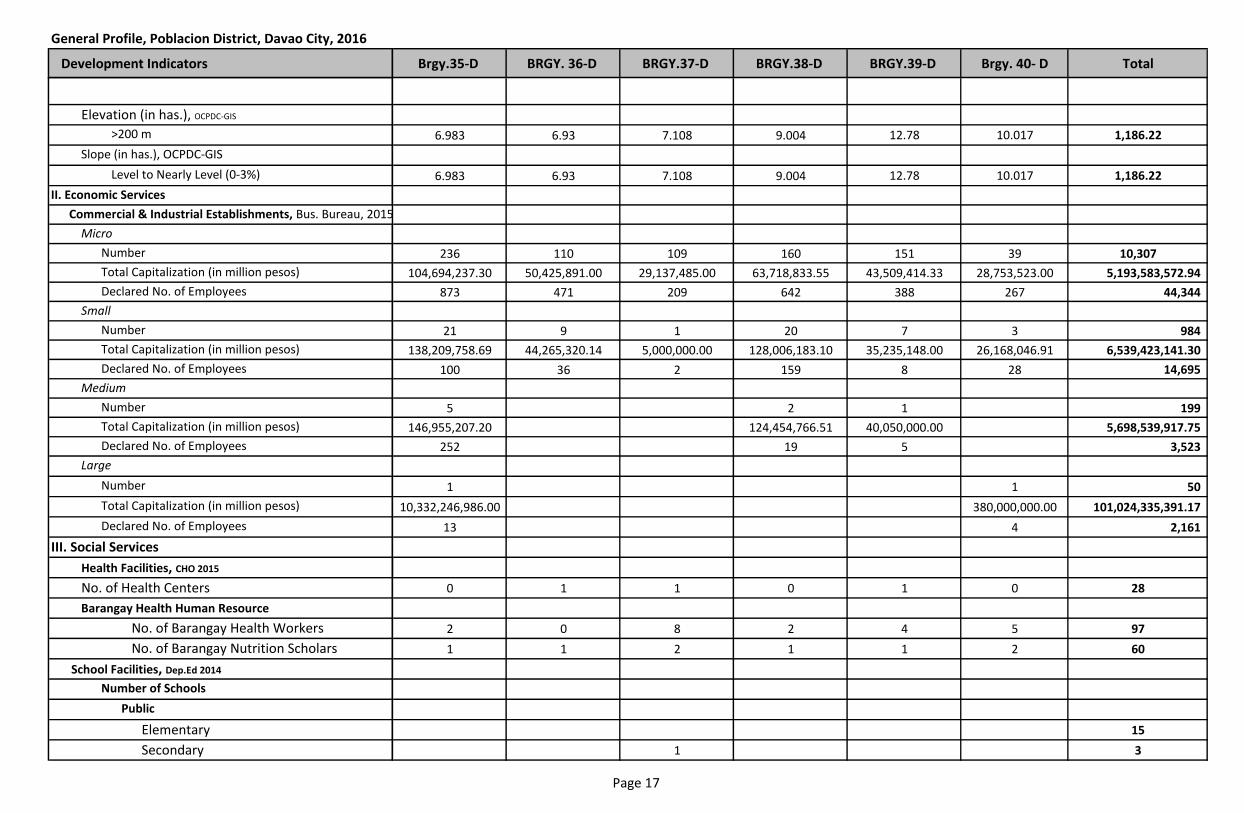
General Profile, Poblacion District, Davao City, 2016
Development Indicators
Elevation (in has.), OCPDC-GIS
>200 m
Slope (in has.), OCPDC-GIS
Level to Nearly Level (0-3%)
II. Economic Services
Micro
Number
Total Capitalization (in million pesos)
Declared No. of Employees
Small
Number
Total Capitalization (in million pesos)
Declared No. of Employees
Medium
Number
Total Capitalization (in million pesos)
Declared No. of Employees
Large
Number
Total Capitalization (in million pesos)
Declared No. of Employees
III. Social Services
Health Facilities, CHO 2015
No. of Health Centers
Barangay Health Human Resource
No. of Barangay Health Workers
No. of Barangay Nutrition Scholars
School Facilities, Dep.Ed 2014
Number of Schools
Public
Elementary
Secondary
Commercial & Industrial Establishments, Bus. Bureau, 2015
Brgy.35-D BRGY. 36-D BRGY.37-D BRGY.38-D BRGY.39-D Brgy. 40- D Total
6.983 6.93 7.108 9.004 12.78 10.017 1,186.22
6.983 6.93 7.108 9.004 12.78 10.017 1,186.22
236 110 109 160 151 39 10,307
104,694,237.30 50,425,891.00 29,137,485.00 63,718,833.55 43,509,414.33 28,753,523.00 5,193,583,572.94
873 471 209 642 388 267 44,344
21 9 1 20 7 3 984
138,209,758.69 44,265,320.14 5,000,000.00 128,006,183.10 35,235,148.00 26,168,046.91 6,539,423,141.30
100 36 2 159 8 28 14,695
5 2 1 199
146,955,207.20 124,454,766.51 40,050,000.00 5,698,539,917.75
252 19 5 3,523
1 1 50
10,332,246,986.00 380,000,000.00 101,024,335,391.17
13 4 2,161
0 1 1 0 1 0 28
2 0 8 2 4 5 97
1 1 2 1 1 2 60
15
1 3
Page 17
General Profile, Poblacion District, Davao City, 2016
Development Indicators
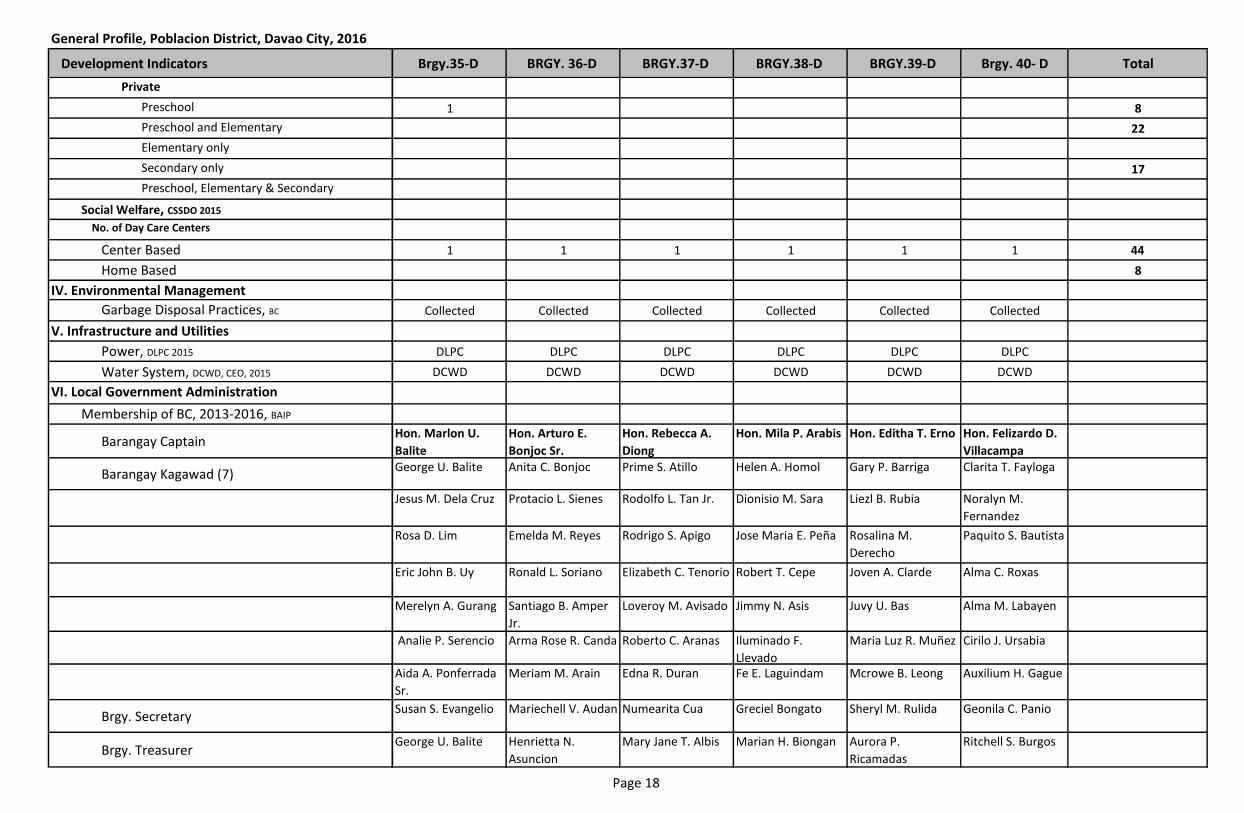
Private
Preschool
Preschool and Elementary
Elementary only
Secondary only
Preschool, Elementary & Secondary
Social Welfare, CSSDO 2015
No. of Day Care Centers
Center Based
Home Based
IV. Environmental Management
Garbage Disposal Practices, BC
V. Infrastructure and Utilities
Power, DLPC 2015
Water System, DCWD, CEO, 2015
VI. Local Government Administration
Membership of BC, 2013-2016, BAIP
Barangay Captain
Barangay Kagawad (7)
Brgy. Secretary
Brgy. Treasurer
Brgy.35-D BRGY. 36-D BRGY.37-D BRGY.38-D BRGY.39-D Brgy. 40- D Total
1 8
22
17
1 1 1 1 1 1 44
8
Collected Collected Collected Collected Collected Collected Collected
DLPC DLPC DLPC DLPC DLPC DLPC
DCWD DCWD DCWD DCWD DCWD DCWD
Josephine R.
CandaPrime S. Atillo Dionisio M. Sara Cercio Bajao Ronald Bautista
Hon. Marlon U.
Balite
Hon. Arturo E.
Bonjoc Sr.
Hon. Rebecca A.
Diong
Hon. Mila P. Arabis Hon. Editha T. Erno Hon. Felizardo D.
VillacampaGeorge U. Balite Anita C. Bonjoc Prime S. Atillo Helen A. Homol Gary P. Barriga Clarita T. Fayloga
Jesus M. Dela Cruz Protacio L. Sienes Rodolfo L. Tan Jr. Dionisio M. Sara Liezl B. Rubia Noralyn M.
Fernandez
Rosa D. Lim Emelda M. Reyes Rodrigo S. Apigo Jose Maria E. Peña Rosalina M.
Derecho
Paquito S. Bautista
Eric John B. Uy Ronald L. Soriano Elizabeth C. Tenorio Robert T. Cepe Joven A. Clarde Alma C. Roxas
Merelyn A. Gurang Santiago B. Amper
Jr.
Loveroy M. Avisado Jimmy N. Asis Juvy U. Bas Alma M. Labayen
Analie P. Serencio Arma Rose R. Canda Roberto C. Aranas Iluminado F.
Llevado
Maria Luz R. Muñez Cirilo J. Ursabia
Aida A. Ponferrada
Sr.
Meriam M. Arain Edna R. Duran Fe E. Laguindam Mcrowe B. Leong Auxilium H. Gague
Susan S. Evangelio Mariechell V. Audan Numearita Cua Greciel Bongato Sheryl M. Rulida Geonila C. PanioTotal
George U. Balite Henrietta N.
Asuncion
Mary Jane T. Albis Marian H. Biongan Aurora P.
Ricamadas
Ritchell S. Burgos
Page 18
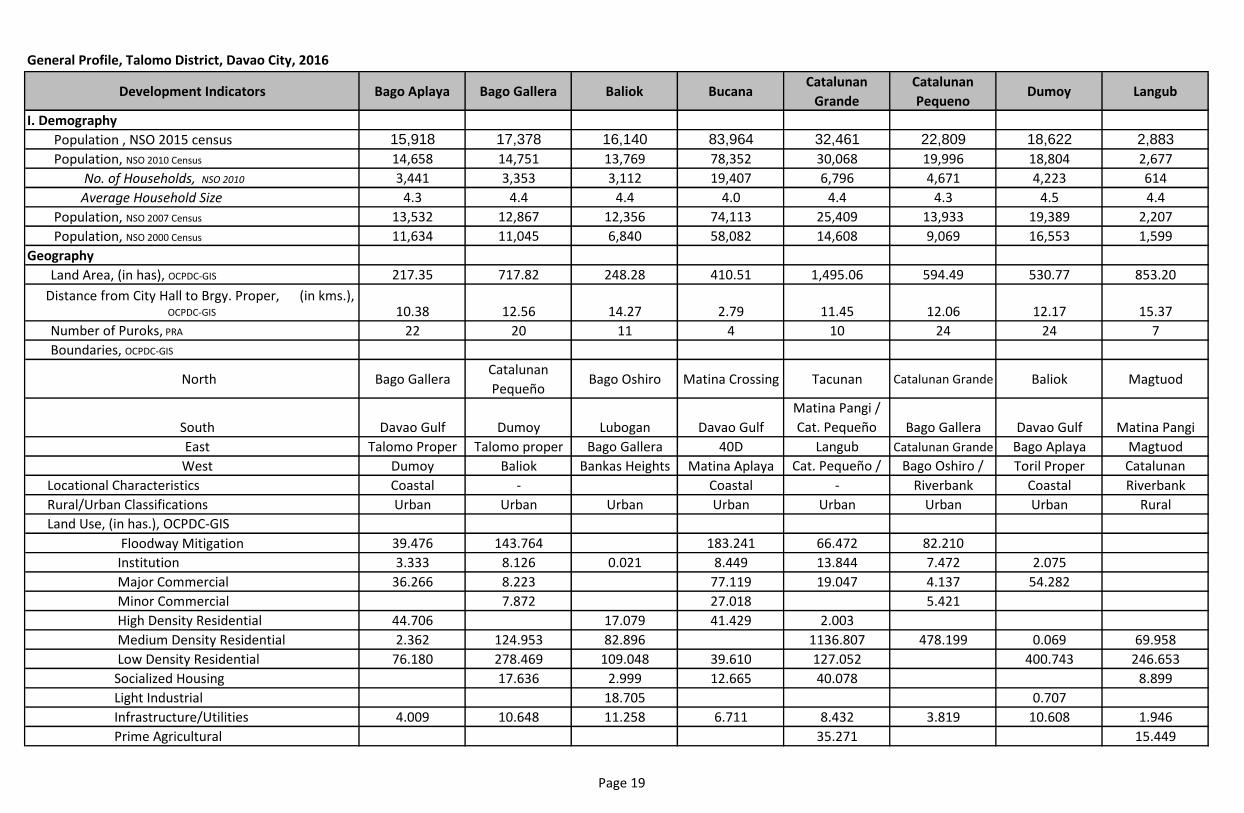
General Profile, Talomo District, Davao City, 2016
Development Indicators Bago Aplaya Bago Gallera Baliok BucanaCatalunan
Grande
Catalunan
PequenoDumoy Langub
I. Demography
Population , NSO 2015 census 15,918 17,378 16,140 83,964 32,461 22,809 18,622 2,883
Population, NSO 2010 Census 14,658 14,751 13,769 78,352 30,068 19,996 18,804 2,677
No. of Households, NSO 2010 3,441 3,353 3,112 19,407 6,796 4,671 4,223 614
Average Household Size 4.3 4.4 4.4 4.0 4.4 4.3 4.5 4.4
Population, NSO 2007 Census 13,532 12,867 12,356 74,113 25,409 13,933 19,389 2,207
Population, NSO 2000 Census 11,634 11,045 6,840 58,082 14,608 9,069 16,553 1,599
Geography
Land Area, (in has), OCPDC-GIS 217.35 717.82 248.28 410.51 1,495.06 594.49 530.77 853.20
Distance from City Hall to Brgy. Proper, (in kms.), OCPDC-GIS 10.38 12.56 14.27 2.79 11.45 12.06 12.17 15.37
Number of Puroks, PRA 22 20 11 4 10 24 24 7
Boundaries, OCPDC-GIS
North Bago GalleraCatalunan
PequeñoBago Oshiro Matina Crossing Tacunan Catalunan Grande Baliok Magtuod
South Davao Gulf Dumoy Lubogan Davao Gulf
Matina Pangi /
Cat. Pequeño Bago Gallera Davao Gulf Matina Pangi
East Talomo Proper Talomo proper Bago Gallera 40D Langub Catalunan Grande Bago Aplaya Magtuod
West Dumoy Baliok Bankas Heights Matina Aplaya Cat. Pequeño / Bago Oshiro / Toril Proper Catalunan
Locational Characteristics Coastal - Coastal - Riverbank Coastal Riverbank
Rural/Urban Classifications Urban Urban Urban Urban Urban Urban Urban Rural
Land Use, (in has.), OCPDC-GIS
Floodway Mitigation 39.476 143.764 183.241 66.472 82.210
Institution 3.333 8.126 0.021 8.449 13.844 7.472 2.075
Major Commercial 36.266 8.223 77.119 19.047 4.137 54.282
Minor Commercial 7.872 27.018 5.421
High Density Residential 44.706 17.079 41.429 2.003
Medium Density Residential 2.362 124.953 82.896 1136.807 478.199 0.069 69.958
Low Density Residential 76.180 278.469 109.048 39.610 127.052 400.743 246.653
Socialized Housing 17.636 2.999 12.665 40.078 8.899
Light Industrial 18.705 0.707
Infrastructure/Utilities 4.009 10.648 11.258 6.711 8.432 3.819 10.608 1.946
Prime Agricultural 35.271 15.449
Page 19
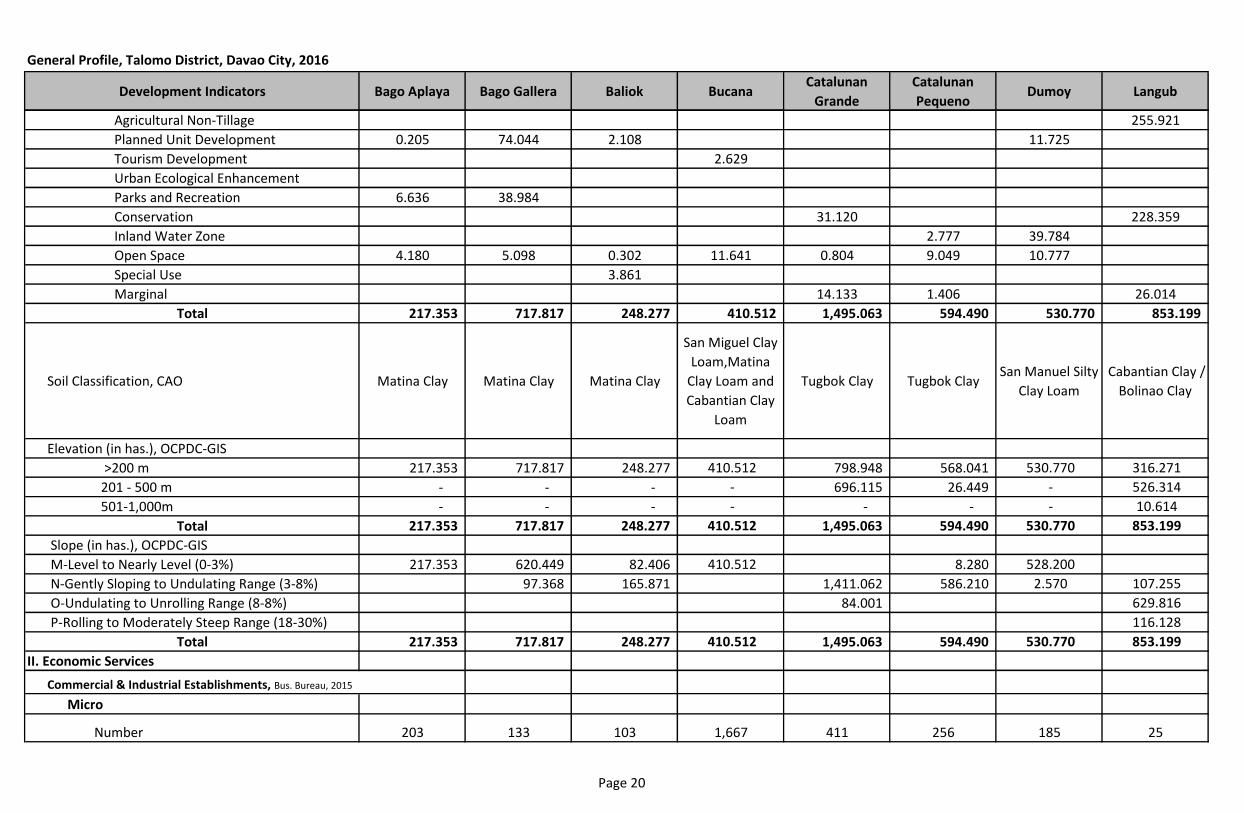
General Profile, Talomo District, Davao City, 2016
Development Indicators Bago Aplaya Bago Gallera Baliok BucanaCatalunan
Grande
Catalunan
PequenoDumoy Langub
Agricultural Non-Tillage 255.921
Planned Unit Development 0.205 74.044 2.108 11.725
Tourism Development 2.629
Urban Ecological Enhancement
Parks and Recreation 6.636 38.984
Conservation 31.120 228.359
Inland Water Zone 2.777 39.784
Open Space 4.180 5.098 0.302 11.641 0.804 9.049 10.777
Special Use 3.861
Marginal 14.133 1.406 26.014
Total 217.353 717.817 248.277 410.512 1,495.063 594.490 530.770 853.199
Soil Classification, CAO Matina Clay Matina Clay Matina Clay
San Miguel Clay
Loam,Matina
Clay Loam and
Cabantian Clay
Loam
Tugbok Clay Tugbok ClaySan Manuel Silty
Clay Loam
Cabantian Clay /
Bolinao Clay
Elevation (in has.), OCPDC-GIS
>200 m 217.353 717.817 248.277 410.512 798.948 568.041 530.770 316.271
201 - 500 m - - - - 696.115 26.449 - 526.314
501-1,000m - - - - - - - 10.614
Total 217.353 717.817 248.277 410.512 1,495.063 594.490 530.770 853.199
Slope (in has.), OCPDC-GIS
M-Level to Nearly Level (0-3%) 217.353 620.449 82.406 410.512 8.280 528.200
N-Gently Sloping to Undulating Range (3-8%) 97.368 165.871 1,411.062 586.210 2.570 107.255
O-Undulating to Unrolling Range (8-8%) 84.001 629.816
P-Rolling to Moderately Steep Range (18-30%) 116.128
Total 217.353 717.817 248.277 410.512 1,495.063 594.490 530.770 853.199
II. Economic Services
Micro
Number 203 133 103 1,667 411 256 185 25
Commercial & Industrial Establishments, Bus. Bureau, 2015
Page 20
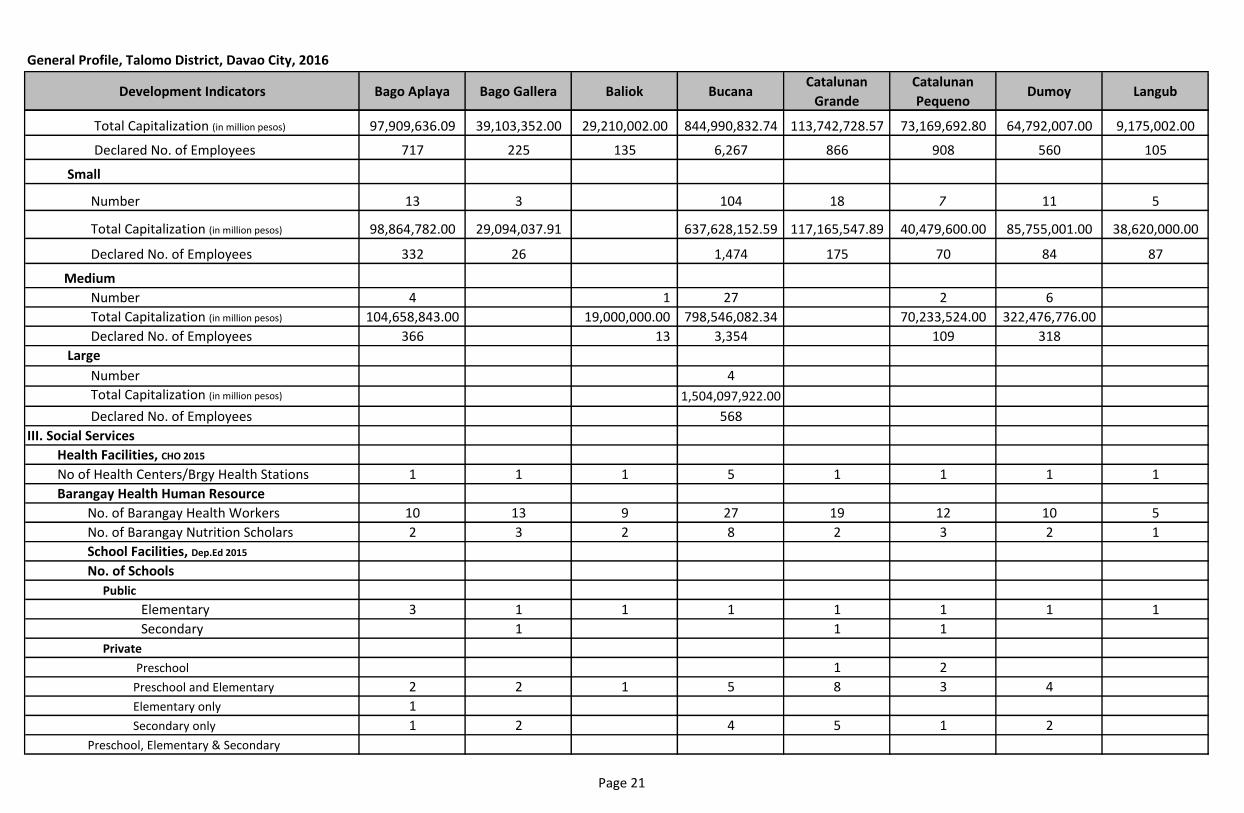
General Profile, Talomo District, Davao City, 2016
Development Indicators Bago Aplaya Bago Gallera Baliok BucanaCatalunan
Grande
Catalunan
PequenoDumoy Langub
Total Capitalization (in million pesos) 97,909,636.09 39,103,352.00 29,210,002.00 844,990,832.74 113,742,728.57 73,169,692.80 64,792,007.00 9,175,002.00
Declared No. of Employees 717 225 135 6,267 866 908 560 105
Small
Number 13 3 104 18 7 11 5
Total Capitalization (in million pesos) 98,864,782.00 29,094,037.91 637,628,152.59 117,165,547.89 40,479,600.00 85,755,001.00 38,620,000.00
Declared No. of Employees 332 26 1,474 175 70 84 87
Medium
Number 4 1 27 2 6
Total Capitalization (in million pesos) 104,658,843.00 19,000,000.00 798,546,082.34 70,233,524.00 322,476,776.00
Declared No. of Employees 366 13 3,354 109 318
Large
Number 4
Total Capitalization (in million pesos) 1,504,097,922.00
Declared No. of Employees 568
III. Social Services
Health Facilities, CHO 2015
No of Health Centers/Brgy Health Stations 1 1 1 5 1 1 1 1
Barangay Health Human Resource
No. of Barangay Health Workers 10 13 9 27 19 12 10 5
No. of Barangay Nutrition Scholars 2 3 2 8 2 3 2 1
School Facilities, Dep.Ed 2015
No. of Schools
Public
Elementary 3 1 1 1 1 1 1 1
Secondary 1 1 1
Private
Preschool 1 2
Preschool and Elementary 2 2 1 5 8 3 4
Elementary only 1
Secondary only 1 2 4 5 1 2
Preschool, Elementary & Secondary
Page 21
General Profile, Talomo District, Davao City, 2016
Development Indicators Bago Aplaya Bago Gallera Baliok BucanaCatalunan
Grande
Catalunan
PequenoDumoy Langub
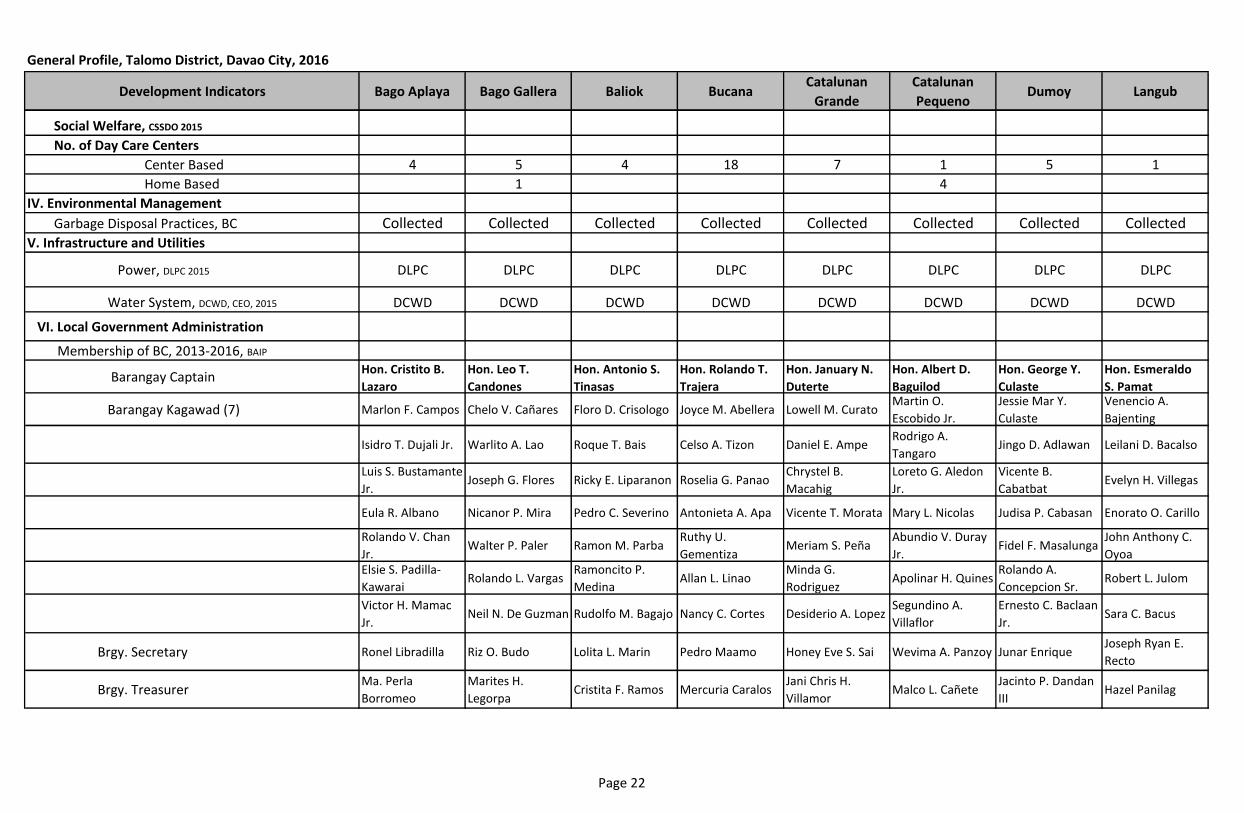
Social Welfare, CSSDO 2015
No. of Day Care Centers
Center Based 4 5 4 18 7 1 5 1
Home Based 1 4
IV. Environmental Management
Garbage Disposal Practices, BC Collected Collected Collected Collected Collected Collected Collected CollectedV. Infrastructure and Utilities
Power, DLPC 2015 DLPC DLPC DLPC DLPC DLPC DLPC DLPC DLPC
Water System, DCWD, CEO, 2015 DCWD DCWD DCWD DCWD DCWD DCWD DCWD DCWD
VI. Local Government Administration
Membership of BC, 2013-2016, BAIP
Barangay CaptainHon. Cristito B.
Lazaro
Hon. Leo T.
Candones
Hon. Antonio S.
Tinasas
Hon. Rolando T.
Trajera
Hon. January N.
Duterte
Hon. Albert D.
Baguilod
Hon. George Y.
Culaste
Hon. Esmeraldo
S. Pamat
Barangay Kagawad (7) Marlon F. Campos Chelo V. Cañares Floro D. Crisologo Joyce M. Abellera Lowell M. CuratoMartin O.
Escobido Jr.
Jessie Mar Y.
Culaste
Venencio A.
Bajenting
Isidro T. Dujali Jr. Warlito A. Lao Roque T. Bais Celso A. Tizon Daniel E. AmpeRodrigo A.
TangaroJingo D. Adlawan Leilani D. Bacalso
Luis S. Bustamante
Jr.Joseph G. Flores Ricky E. Liparanon Roselia G. Panao
Chrystel B.
Macahig
Loreto G. Aledon
Jr.
Vicente B.
CabatbatEvelyn H. Villegas
Eula R. Albano Nicanor P. Mira Pedro C. Severino Antonieta A. Apa Vicente T. Morata Mary L. Nicolas Judisa P. Cabasan Enorato O. Carillo
Rolando V. Chan
Jr.Walter P. Paler Ramon M. Parba
Ruthy U.
GementizaMeriam S. Peña
Abundio V. Duray
Jr.Fidel F. Masalunga
John Anthony C.
OyoaElsie S. Padilla-
KawaraiRolando L. Vargas
Ramoncito P.
MedinaAllan L. Linao
Minda G.
RodriguezApolinar H. Quines
Rolando A.
Concepcion Sr.Robert L. Julom
Victor H. Mamac
Jr.Neil N. De Guzman Rudolfo M. Bagajo Nancy C. Cortes Desiderio A. Lopez
Segundino A.
Villaflor
Ernesto C. Baclaan
Jr.Sara C. Bacus
Brgy. Secretary Ronel Libradilla Riz O. Budo Lolita L. Marin Pedro Maamo Honey Eve S. Sai Wevima A. Panzoy Junar EnriqueJoseph Ryan E.
Recto
Brgy. TreasurerMa. Perla
Borromeo
Marites H.
LegorpaCristita F. Ramos Mercuria Caralos
Jani Chris H.
VillamorMalco L. Cañete
Jacinto P. Dandan
IIIHazel Panilag
Page 22
General Profile, Talomo District, Davao City, 2016
Development Indicators
I. Demography
Population , NSO 2015 census
Population, NSO 2010 Census
No. of Households, NSO 2010
Average Household Size
Population, NSO 2007 Census
Population, NSO 2000 Census
Geography
Land Area, (in has), OCPDC-GIS
Distance from City Hall to Brgy. Proper, (in kms.), OCPDC-GIS
Number of Puroks, PRA
Boundaries, OCPDC-GIS
North
South
East
West
Locational Characteristics
Rural/Urban Classifications
Land Use, (in has.), OCPDC-GIS
Floodway Mitigation
Institution
Major Commercial
Minor Commercial
High Density Residential
Medium Density Residential
Low Density Residential
Socialized Housing
Light Industrial
Infrastructure/Utilities
Prime Agricultural
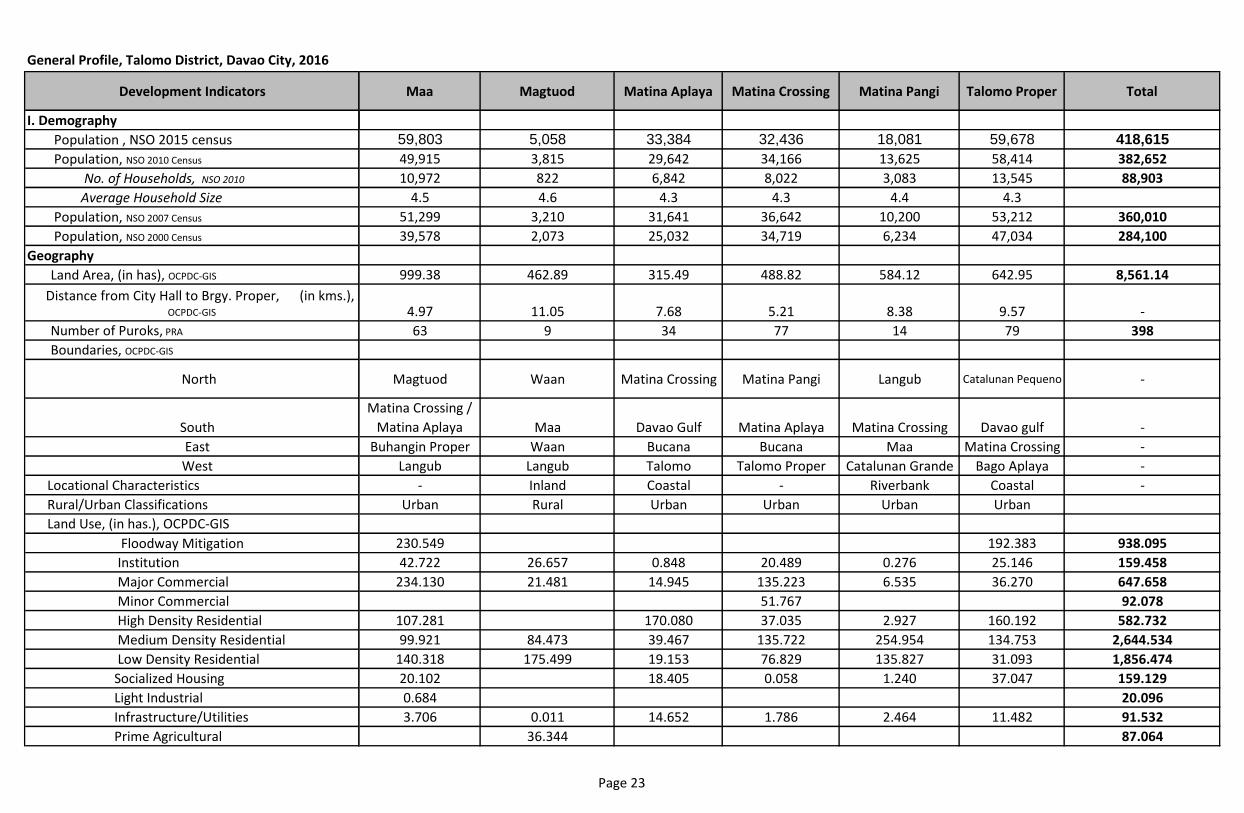
Maa Magtuod Matina Aplaya Matina Crossing Matina Pangi Talomo Proper Total
59,803 5,058 33,384 32,436 18,081 59,678 418,615
49,915 3,815 29,642 34,166 13,625 58,414 382,652
10,972 822 6,842 8,022 3,083 13,545 88,903
4.5 4.6 4.3 4.3 4.4 4.3
51,299 3,210 31,641 36,642 10,200 53,212 360,010
39,578 2,073 25,032 34,719 6,234 47,034 284,100
999.38 462.89 315.49 488.82 584.12 642.95 8,561.14
4.97 11.05 7.68 5.21 8.38 9.57 -
63 9 34 77 14 79 398
Magtuod Waan Matina Crossing Matina Pangi Langub Catalunan Pequeno -
Matina Crossing /
Matina Aplaya Maa Davao Gulf Matina Aplaya Matina Crossing Davao gulf -
Buhangin Proper Waan Bucana Bucana Maa Matina Crossing -
Langub Langub Talomo Talomo Proper Catalunan Grande Bago Aplaya -
- Inland Coastal - Riverbank Coastal -
Urban Rural Urban Urban Urban Urban
230.549 192.383 938.095
42.722 26.657 0.848 20.489 0.276 25.146 159.458
234.130 21.481 14.945 135.223 6.535 36.270 647.658
51.767 92.078
107.281 170.080 37.035 2.927 160.192 582.732
99.921 84.473 39.467 135.722 254.954 134.753 2,644.534
140.318 175.499 19.153 76.829 135.827 31.093 1,856.474
20.102 18.405 0.058 1.240 37.047 159.129
0.684 20.096
3.706 0.011 14.652 1.786 2.464 11.482 91.532
36.344 87.064
Page 23
General Profile, Talomo District, Davao City, 2016
Development Indicators
Agricultural Non-Tillage
Planned Unit Development
Tourism Development
Urban Ecological Enhancement
Parks and Recreation
Conservation
Inland Water Zone
Open Space
Special Use
Marginal
Total
Soil Classification, CAO
Elevation (in has.), OCPDC-GIS
>200 m
201 - 500 m
501-1,000m
Total
Slope (in has.), OCPDC-GIS
M-Level to Nearly Level (0-3%)
N-Gently Sloping to Undulating Range (3-8%)
O-Undulating to Unrolling Range (8-8%)
P-Rolling to Moderately Steep Range (18-30%)
Total
II. Economic Services
Micro
Number
Commercial & Industrial Establishments, Bus. Bureau, 2015
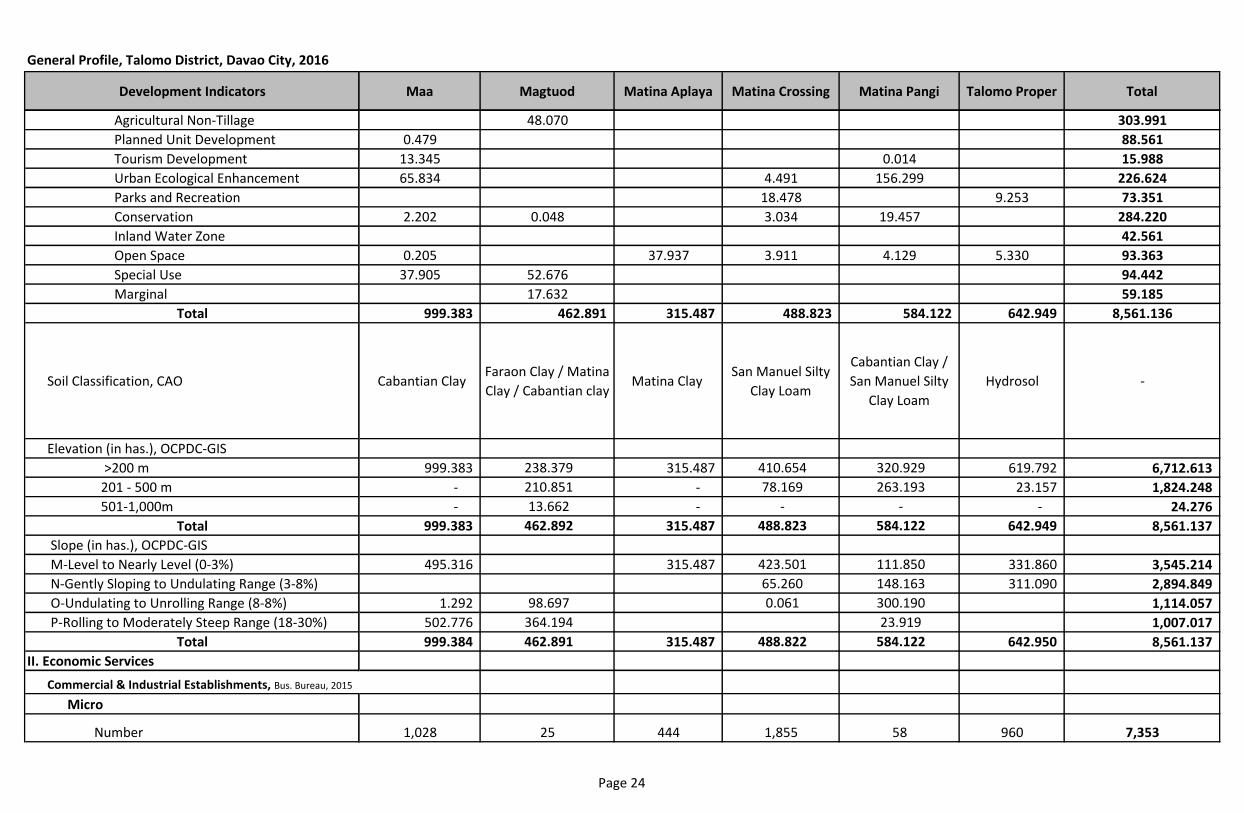
Maa Magtuod Matina Aplaya Matina Crossing Matina Pangi Talomo Proper Total
48.070 303.991
0.479 88.561
13.345 0.014 15.988
65.834 4.491 156.299 226.624
18.478 9.253 73.351
2.202 0.048 3.034 19.457 284.220
42.561
0.205 37.937 3.911 4.129 5.330 93.363
37.905 52.676 94.442
17.632 59.185
999.383 462.891 315.487 488.823 584.122 642.949 8,561.136
Cabantian ClayFaraon Clay / Matina
Clay / Cabantian clay Matina Clay
San Manuel Silty
Clay Loam
Cabantian Clay /
San Manuel Silty
Clay Loam
Hydrosol -
999.383 238.379 315.487 410.654 320.929 619.792 6,712.613
- 210.851 - 78.169 263.193 23.157 1,824.248
- 13.662 - - - - 24.276
999.383 462.892 315.487 488.823 584.122 642.949 8,561.137
495.316 315.487 423.501 111.850 331.860 3,545.214
65.260 148.163 311.090 2,894.849
1.292 98.697 0.061 300.190 1,114.057
502.776 364.194 23.919 1,007.017
999.384 462.891 315.487 488.822 584.122 642.950 8,561.137
1,028 25 444 1,855 58 960 7,353
Page 24
General Profile, Talomo District, Davao City, 2016
Development Indicators
Total Capitalization (in million pesos)
Declared No. of Employees
Small
Number
Total Capitalization (in million pesos)
Declared No. of Employees
Medium
Number
Total Capitalization (in million pesos)
Declared No. of Employees
Large
Number
Total Capitalization (in million pesos)
Declared No. of Employees
III. Social Services
Health Facilities, CHO 2015
No of Health Centers/Brgy Health Stations
Barangay Health Human Resource
No. of Barangay Health Workers
No. of Barangay Nutrition Scholars
School Facilities, Dep.Ed 2015
No. of Schools
Public
Elementary
Secondary
Private
Preschool
Preschool and Elementary
Elementary only
Secondary only
Preschool, Elementary & Secondary
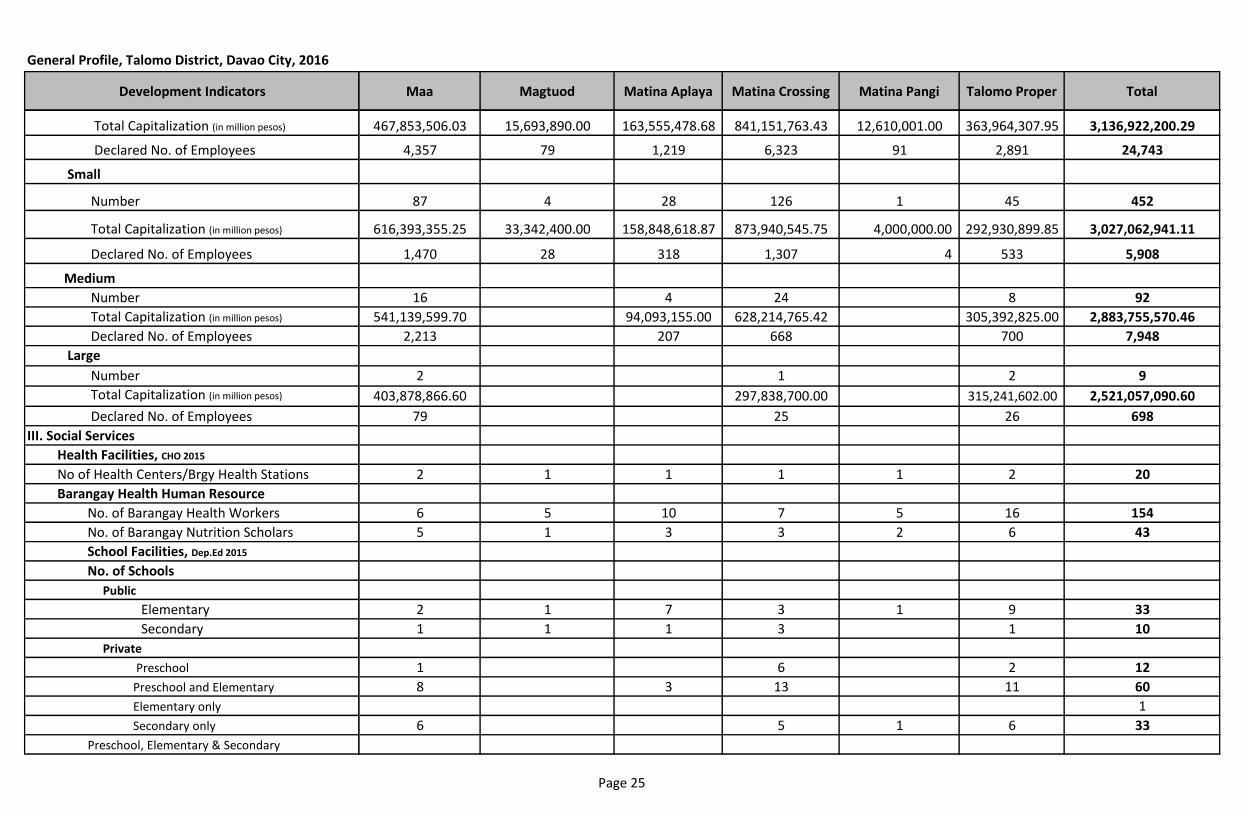
Maa Magtuod Matina Aplaya Matina Crossing Matina Pangi Talomo Proper Total
467,853,506.03 15,693,890.00 163,555,478.68 841,151,763.43 12,610,001.00 363,964,307.95 3,136,922,200.29
4,357 79 1,219 6,323 91 2,891 24,743
87 4 28 126 1 45 452
616,393,355.25 33,342,400.00 158,848,618.87 873,940,545.75 4,000,000.00 292,930,899.85 3,027,062,941.11
1,470 28 318 1,307 4 533 5,908
16 4 24 8 92
541,139,599.70 94,093,155.00 628,214,765.42 305,392,825.00 2,883,755,570.46
2,213 207 668 700 7,948
2 1 2 9
403,878,866.60 297,838,700.00 315,241,602.00 2,521,057,090.60
79 25 26 698
2 1 1 1 1 2 20
6 5 10 7 5 16 154
5 1 3 3 2 6 43
2 1 7 3 1 9 33
1 1 1 3 1 10
1 6 2 12
8 3 13 11 60
1
6 5 1 6 33
Page 25
General Profile, Talomo District, Davao City, 2016
Development Indicators
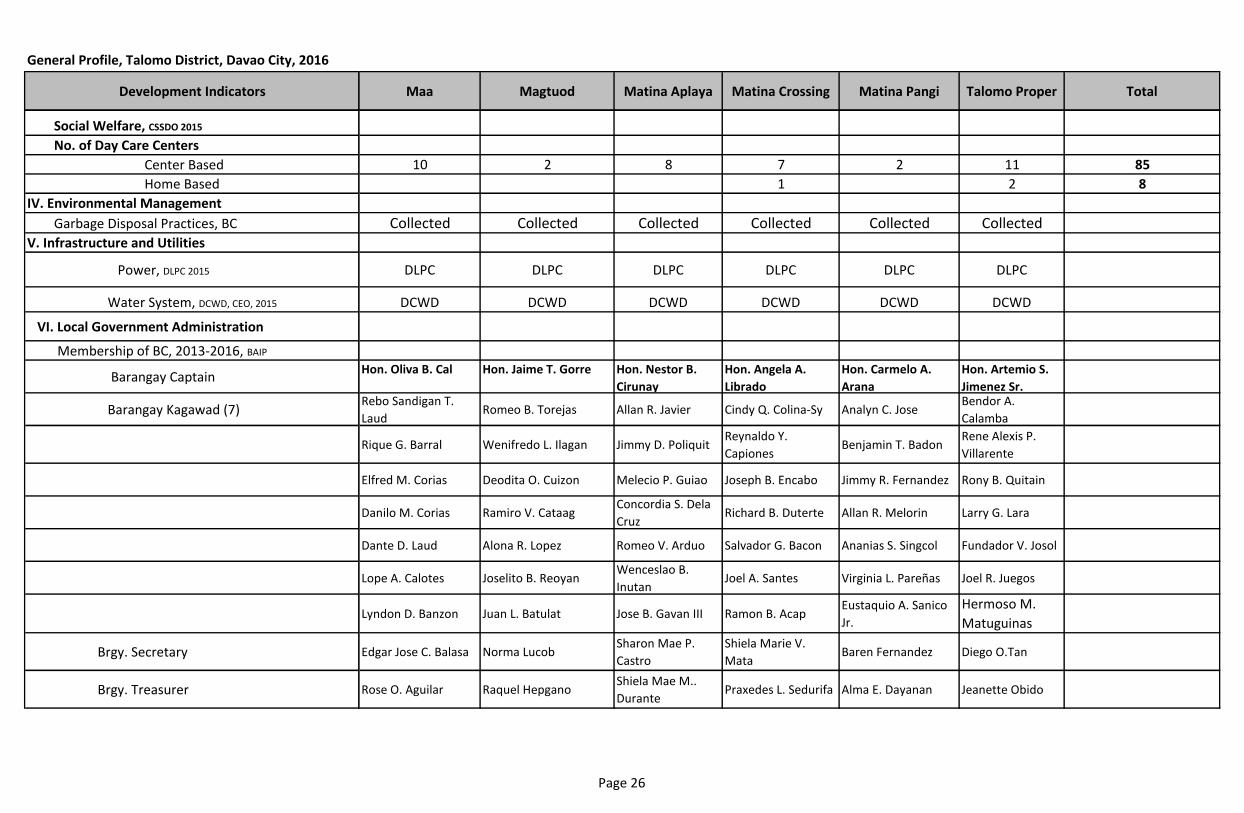
Social Welfare, CSSDO 2015
No. of Day Care Centers
Center Based
Home Based
IV. Environmental Management
Garbage Disposal Practices, BC
V. Infrastructure and Utilities
Power, DLPC 2015
Water System, DCWD, CEO, 2015
VI. Local Government Administration
Membership of BC, 2013-2016, BAIP
Barangay Captain
Barangay Kagawad (7)
Brgy. Secretary
Brgy. Treasurer
Maa Magtuod Matina Aplaya Matina Crossing Matina Pangi Talomo Proper Total
10 2 8 7 2 11 85
1 2 8
Collected Collected Collected Collected Collected Collected
DLPC DLPC DLPC DLPC DLPC DLPC
DCWD DCWD DCWD DCWD DCWD DCWD
Hon. Oliva B. Cal Hon. Jaime T. Gorre Hon. Nestor B.
Cirunay
Hon. Angela A.
Librado
Hon. Carmelo A.
Arana
Hon. Artemio S.
Jimenez Sr.Rebo Sandigan T.
LaudRomeo B. Torejas Allan R. Javier Cindy Q. Colina-Sy Analyn C. Jose
Bendor A.
Calamba
Rique G. Barral Wenifredo L. Ilagan Jimmy D. PoliquitReynaldo Y.
CapionesBenjamin T. Badon
Rene Alexis P.
Villarente
Elfred M. Corias Deodita O. Cuizon Melecio P. Guiao Joseph B. Encabo Jimmy R. Fernandez Rony B. Quitain
Danilo M. Corias Ramiro V. CataagConcordia S. Dela
CruzRichard B. Duterte Allan R. Melorin Larry G. Lara
Dante D. Laud Alona R. Lopez Romeo V. Arduo Salvador G. Bacon Ananias S. Singcol Fundador V. Josol
Lope A. Calotes Joselito B. ReoyanWenceslao B.
InutanJoel A. Santes Virginia L. Pareñas Joel R. Juegos
Lyndon D. Banzon Juan L. Batulat Jose B. Gavan III Ramon B. AcapEustaquio A. Sanico
Jr.
Hermoso M.
Matuguinas
Edgar Jose C. Balasa Norma LucobSharon Mae P.
Castro
Shiela Marie V.
MataBaren Fernandez Diego O.Tan
Rose O. Aguilar Raquel HepganoShiela Mae M..
DurantePraxedes L. Sedurifa Alma E. Dayanan Jeanette Obido
Page 26
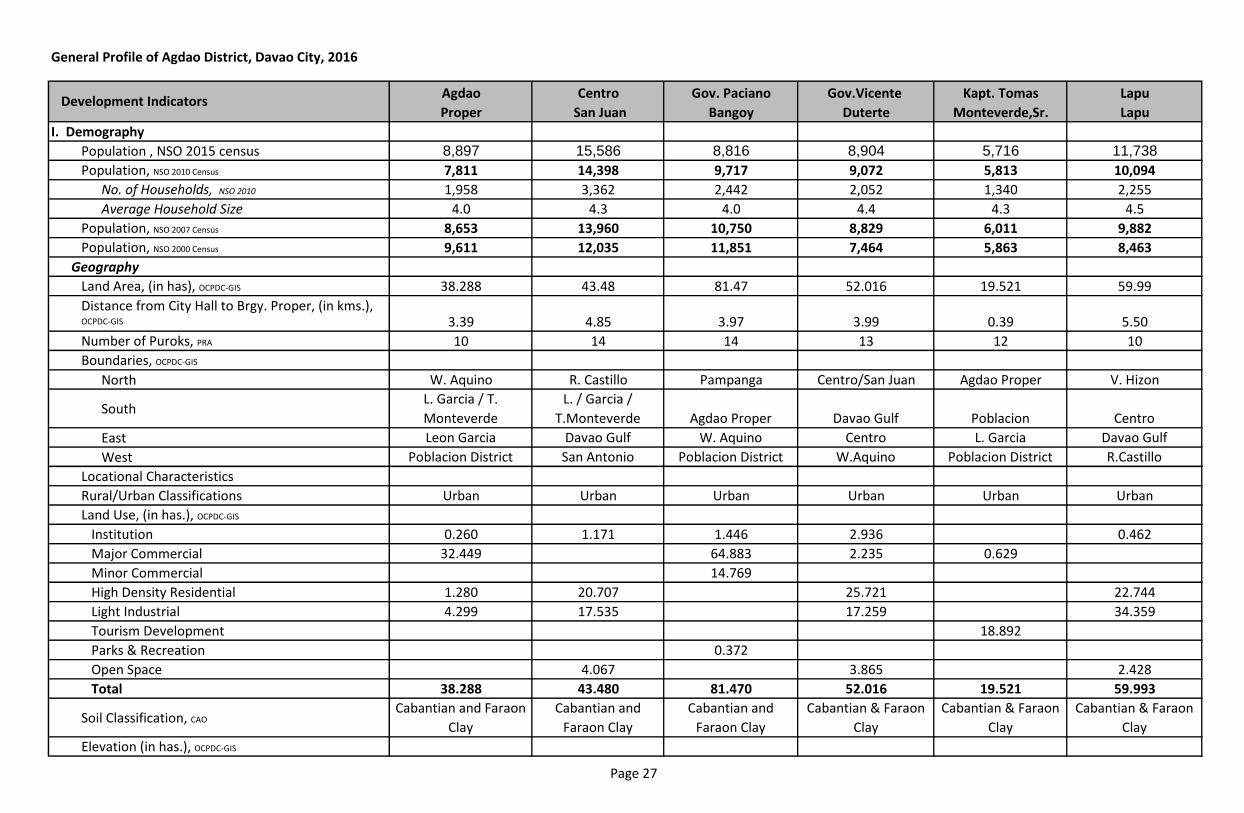
Agdao Centro Gov. Paciano Gov.Vicente Kapt. Tomas Lapu
Proper San Juan Bangoy Duterte Monteverde,Sr. Lapu
I. Demography
Population , NSO 2015 census 8,897 15,586 8,816 8,904 5,716 11,738
Population, NSO 2010 Census 7,811 14,398 9,717 9,072 5,813 10,094
No. of Households, NSO 2010 1,958 3,362 2,442 2,052 1,340 2,255
Average Household Size 4.0 4.3 4.0 4.4 4.3 4.5
Population, NSO 2007 Census 8,653 13,960 10,750 8,829 6,011 9,882
Population, NSO 2000 Census 9,611 12,035 11,851 7,464 5,863 8,463
Geography
Land Area, (in has), OCPDC-GIS 38.288 43.48 81.47 52.016 19.521 59.99
Distance from City Hall to Brgy. Proper, (in kms.), OCPDC-GIS 3.39 4.85 3.97 3.99 0.39 5.50
Number of Puroks, PRA 10 14 14 13 12 10
Boundaries, OCPDC-GIS
North W. Aquino R. Castillo Pampanga Centro/San Juan Agdao Proper V. Hizon
SouthL. Garcia / T.
Monteverde
L. / Garcia /
T.Monteverde Agdao Proper Davao Gulf Poblacion Centro
East Leon Garcia Davao Gulf W. Aquino Centro L. Garcia Davao Gulf
West Poblacion District San Antonio Poblacion District W.Aquino Poblacion District R.Castillo
Locational Characteristics
Rural/Urban Classifications Urban Urban Urban Urban Urban Urban
Land Use, (in has.), OCPDC-GIS
Institution 0.260 1.171 1.446 2.936 0.462
Major Commercial 32.449 64.883 2.235 0.629
Minor Commercial 14.769
High Density Residential 1.280 20.707 25.721 22.744
Light Industrial 4.299 17.535 17.259 34.359
Tourism Development 18.892
Parks & Recreation 0.372
Open Space 4.067 3.865 2.428
Total 38.288 43.480 81.470 52.016 19.521 59.993
Soil Classification, CAOCabantian and Faraon
Clay
Cabantian and
Faraon Clay
Cabantian and
Faraon Clay
Cabantian & Faraon
Clay
Cabantian & Faraon
Clay
Cabantian & Faraon
Clay
Elevation (in has.), OCPDC-GIS
General Profile of Agdao District, Davao City, 2016
Development Indicators
Page 27
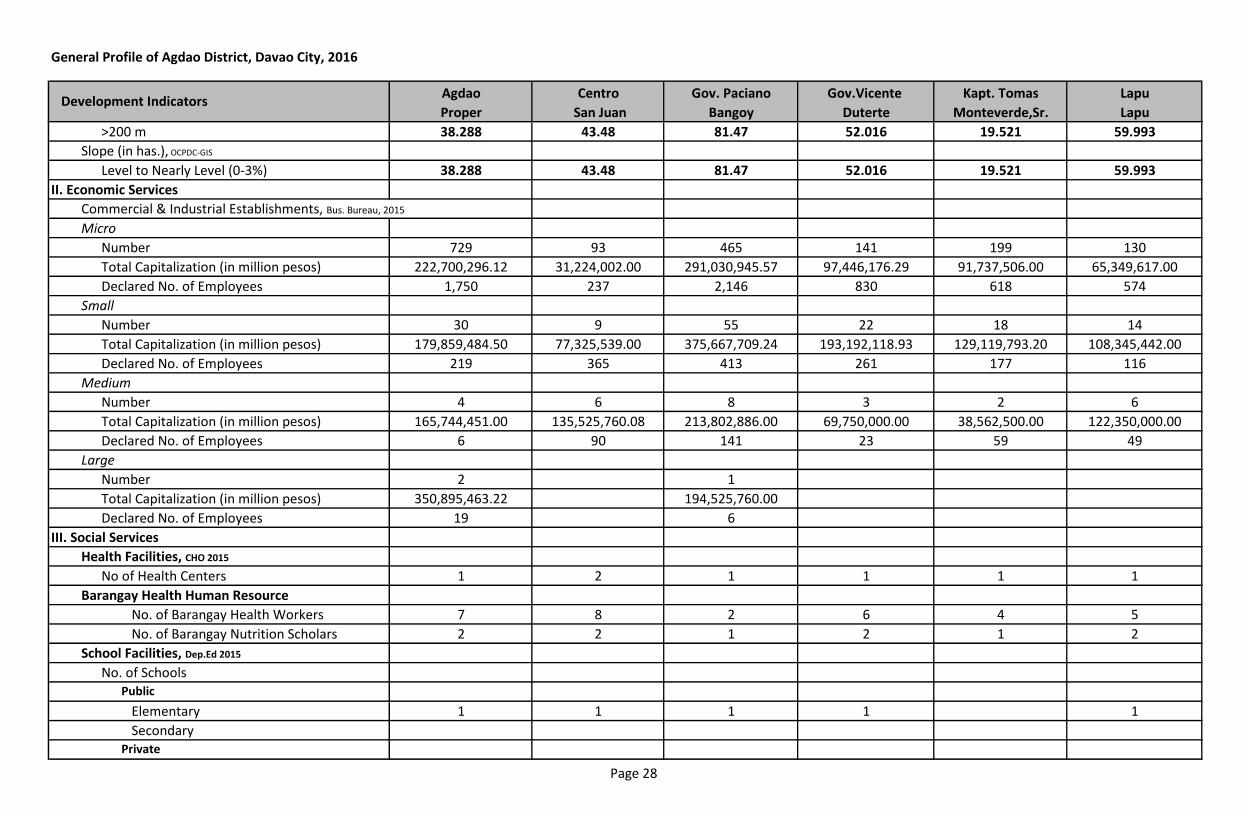
Agdao Centro Gov. Paciano Gov.Vicente Kapt. Tomas Lapu
Proper San Juan Bangoy Duterte Monteverde,Sr. Lapu
General Profile of Agdao District, Davao City, 2016
Development Indicators
>200 m 38.288 43.48 81.47 52.016 19.521 59.993
Slope (in has.), OCPDC-GIS
Level to Nearly Level (0-3%) 38.288 43.48 81.47 52.016 19.521 59.993
II. Economic Services
Commercial & Industrial Establishments, Bus. Bureau, 2015
Micro
Number 729 93 465 141 199 130
Total Capitalization (in million pesos) 222,700,296.12 31,224,002.00 291,030,945.57 97,446,176.29 91,737,506.00 65,349,617.00
Declared No. of Employees 1,750 237 2,146 830 618 574
Small
Number 30 9 55 22 18 14
Total Capitalization (in million pesos) 179,859,484.50 77,325,539.00 375,667,709.24 193,192,118.93 129,119,793.20 108,345,442.00
Declared No. of Employees 219 365 413 261 177 116
Medium
Number 4 6 8 3 2 6
Total Capitalization (in million pesos) 165,744,451.00 135,525,760.08 213,802,886.00 69,750,000.00 38,562,500.00 122,350,000.00
Declared No. of Employees 6 90 141 23 59 49
Large
Number 2 1
Total Capitalization (in million pesos) 350,895,463.22 194,525,760.00
Declared No. of Employees 19 6
III. Social Services
Health Facilities, CHO 2015
No of Health Centers 1 2 1 1 1 1
Barangay Health Human Resource
No. of Barangay Health Workers 7 8 2 6 4 5
No. of Barangay Nutrition Scholars 2 2 1 2 1 2
School Facilities, Dep.Ed 2015
No. of SchoolsPublic
Elementary 1 1 1 1 1
SecondaryPrivate
Page 28
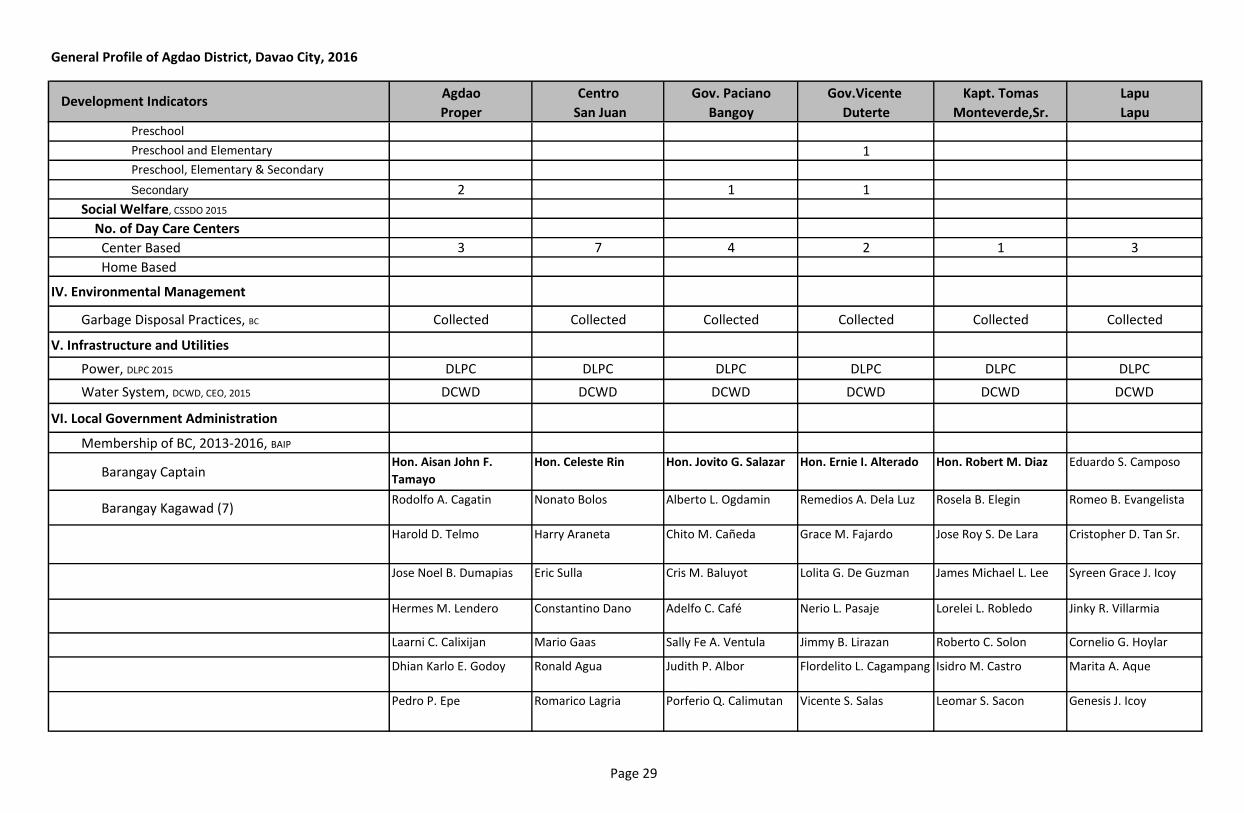
Agdao Centro Gov. Paciano Gov.Vicente Kapt. Tomas Lapu
Proper San Juan Bangoy Duterte Monteverde,Sr. Lapu
General Profile of Agdao District, Davao City, 2016
Development Indicators
Preschool
Preschool and Elementary 1Preschool, Elementary & Secondary
Secondary 2 1 1
Social Welfare, CSSDO 2015
No. of Day Care Centers
Center Based 3 7 4 2 1 3
Home Based
IV. Environmental Management
Garbage Disposal Practices, BC Collected Collected Collected Collected Collected Collected
V. Infrastructure and Utilities
Power, DLPC 2015 DLPC DLPC DLPC DLPC DLPC DLPC
Water System, DCWD, CEO, 2015 DCWD DCWD DCWD DCWD DCWD DCWD
VI. Local Government Administration
Membership of BC, 2013-2016, BAIP
Barangay CaptainHon. Aisan John F.
Tamayo
Hon. Celeste Rin Hon. Jovito G. Salazar Hon. Ernie I. Alterado Hon. Robert M. Diaz Eduardo S. Camposo
Barangay Kagawad (7)Rodolfo A. Cagatin Nonato Bolos Alberto L. Ogdamin Remedios A. Dela Luz Rosela B. Elegin Romeo B. Evangelista
Harold D. Telmo Harry Araneta Chito M. Cañeda Grace M. Fajardo Jose Roy S. De Lara Cristopher D. Tan Sr.
Jose Noel B. Dumapias Eric Sulla Cris M. Baluyot Lolita G. De Guzman James Michael L. Lee Syreen Grace J. Icoy
Hermes M. Lendero Constantino Dano Adelfo C. Café Nerio L. Pasaje Lorelei L. Robledo Jinky R. Villarmia
Laarni C. Calixijan Mario Gaas Sally Fe A. Ventula Jimmy B. Lirazan Roberto C. Solon Cornelio G. Hoylar
Dhian Karlo E. Godoy Ronald Agua Judith P. Albor Flordelito L. Cagampang Isidro M. Castro Marita A. Aque
Pedro P. Epe Romarico Lagria Porferio Q. Calimutan Vicente S. Salas Leomar S. Sacon Genesis J. Icoy
Page 29
Agdao Centro Gov. Paciano Gov.Vicente Kapt. Tomas Lapu
Proper San Juan Bangoy Duterte Monteverde,Sr. Lapu
General Profile of Agdao District, Davao City, 2016
Development Indicators
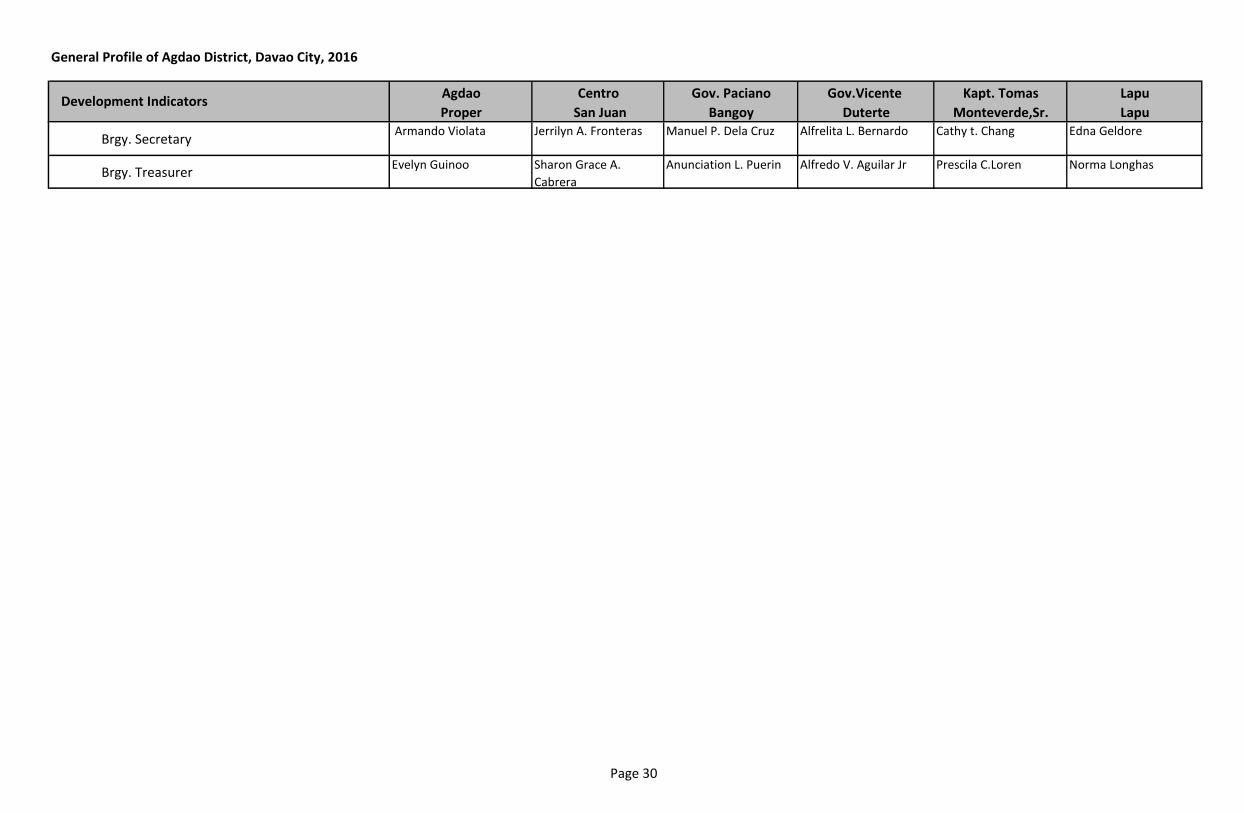
Brgy. Secretary Armando Violata Jerrilyn A. Fronteras Manuel P. Dela Cruz Alfrelita L. Bernardo Cathy t. Chang Edna Geldore
Brgy. TreasurerEvelyn Guinoo Sharon Grace A.
Cabrera
Anunciation L. Puerin Alfredo V. Aguilar Jr Prescila C.Loren Norma Longhas
Page 30
I. Demography
Population , NSO 2015 census
Population, NSO 2010 Census
No. of Households, NSO 2010
Average Household Size
Population, NSO 2007 Census
Population, NSO 2000 Census
Geography
Land Area, (in has), OCPDC-GIS
Distance from City Hall to Brgy. Proper, (in kms.), OCPDC-GIS
Number of Puroks, PRA
Boundaries, OCPDC-GIS
North
South
East
West
Locational Characteristics
Rural/Urban Classifications
Land Use, (in has.), OCPDC-GIS
Institution
Major Commercial
Minor Commercial
High Density Residential
Light Industrial
Tourism Development
Parks & Recreation
Open Space
Total
Soil Classification, CAO
Elevation (in has.), OCPDC-GIS
General Profile of Agdao District, Davao City, 2016
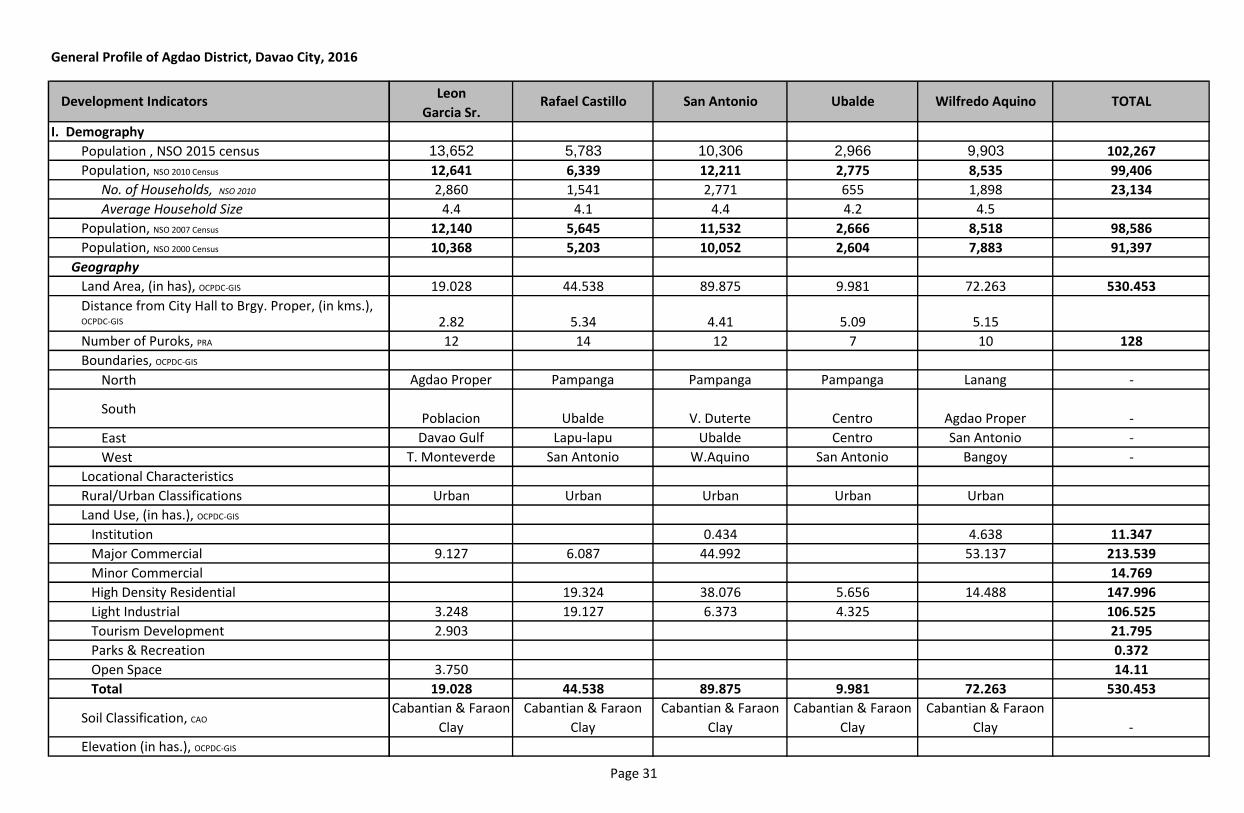
Development IndicatorsLeon
Garcia Sr.
13,652 5,783 10,306 2,966 9,903 102,267
12,641 6,339 12,211 2,775 8,535 99,406
2,860 1,541 2,771 655 1,898 23,134
4.4 4.1 4.4 4.2 4.5
12,140 5,645 11,532 2,666 8,518 98,586
10,368 5,203 10,052 2,604 7,883 91,397
19.028 44.538 89.875 9.981 72.263 530.453
2.82 5.34 4.41 5.09 5.15
12 14 12 7 10 128
Agdao Proper Pampanga Pampanga Pampanga Lanang -
Poblacion Ubalde V. Duterte Centro Agdao Proper -
Davao Gulf Lapu-lapu Ubalde Centro San Antonio -
T. Monteverde San Antonio W.Aquino San Antonio Bangoy -
Urban Urban Urban Urban Urban
0.434 4.638 11.347
9.127 6.087 44.992 53.137 213.539
14.769
19.324 38.076 5.656 14.488 147.996
3.248 19.127 6.373 4.325 106.525
2.903 21.795
0.372
3.750 14.11
19.028 44.538 89.875 9.981 72.263 530.453
Cabantian & Faraon
Clay
Cabantian & Faraon
Clay
Cabantian & Faraon
Clay
Cabantian & Faraon
Clay
Cabantian & Faraon
Clay -
Rafael Castillo San Antonio Ubalde Wilfredo Aquino TOTAL
Page 31
General Profile of Agdao District, Davao City, 2016
Development Indicators
>200 m
Slope (in has.), OCPDC-GIS
Level to Nearly Level (0-3%)
II. Economic Services
Commercial & Industrial Establishments, Bus. Bureau, 2015
Micro
Number
Total Capitalization (in million pesos)
Declared No. of Employees
Small
Number
Total Capitalization (in million pesos)
Declared No. of Employees
Medium
Number
Total Capitalization (in million pesos)
Declared No. of Employees
Large
Number
Total Capitalization (in million pesos)
Declared No. of Employees
III. Social Services
Health Facilities, CHO 2015
No of Health Centers
Barangay Health Human Resource
No. of Barangay Health Workers
No. of Barangay Nutrition Scholars
School Facilities, Dep.Ed 2015
No. of SchoolsPublic
Elementary
SecondaryPrivate
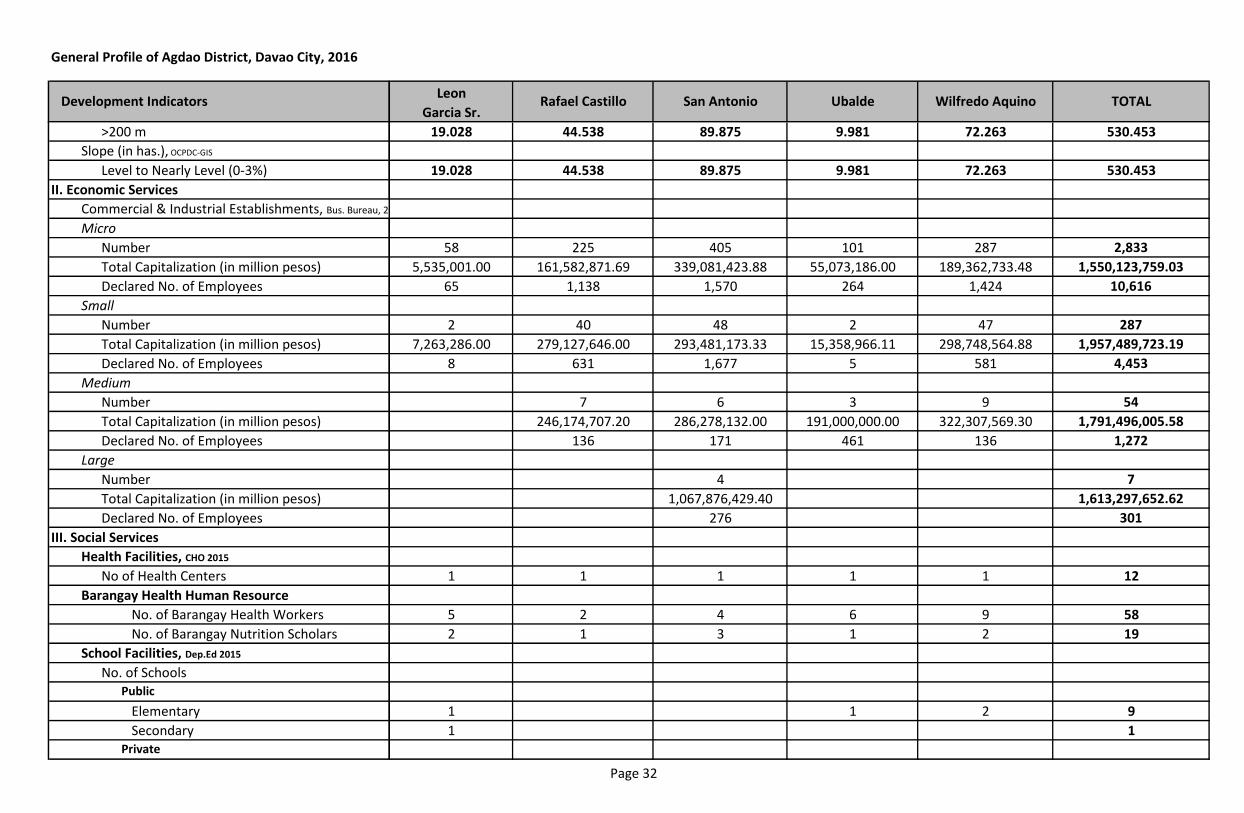
Leon
Garcia Sr.Rafael Castillo San Antonio Ubalde Wilfredo Aquino TOTAL
19.028 44.538 89.875 9.981 72.263 530.453
19.028 44.538 89.875 9.981 72.263 530.453
58 225 405 101 287 2,833
5,535,001.00 161,582,871.69 339,081,423.88 55,073,186.00 189,362,733.48 1,550,123,759.03
65 1,138 1,570 264 1,424 10,616
2 40 48 2 47 287
7,263,286.00 279,127,646.00 293,481,173.33 15,358,966.11 298,748,564.88 1,957,489,723.19
8 631 1,677 5 581 4,453
7 6 3 9 54
246,174,707.20 286,278,132.00 191,000,000.00 322,307,569.30 1,791,496,005.58
136 171 461 136 1,272
4 7
1,067,876,429.40 1,613,297,652.62
276 301
1 1 1 1 1 12
5 2 4 6 9 58
2 1 3 1 2 19
1 1 2 9
1 1
Page 32
General Profile of Agdao District, Davao City, 2016
Development Indicators
Preschool
Preschool and Elementary
Preschool, Elementary & Secondary
Secondary
Social Welfare, CSSDO 2015
No. of Day Care Centers
Center Based
Home Based
IV. Environmental Management
Garbage Disposal Practices, BC
V. Infrastructure and Utilities
Power, DLPC 2015
Water System, DCWD, CEO, 2015
VI. Local Government Administration
Membership of BC, 2013-2016, BAIP
Barangay Captain
Barangay Kagawad (7)
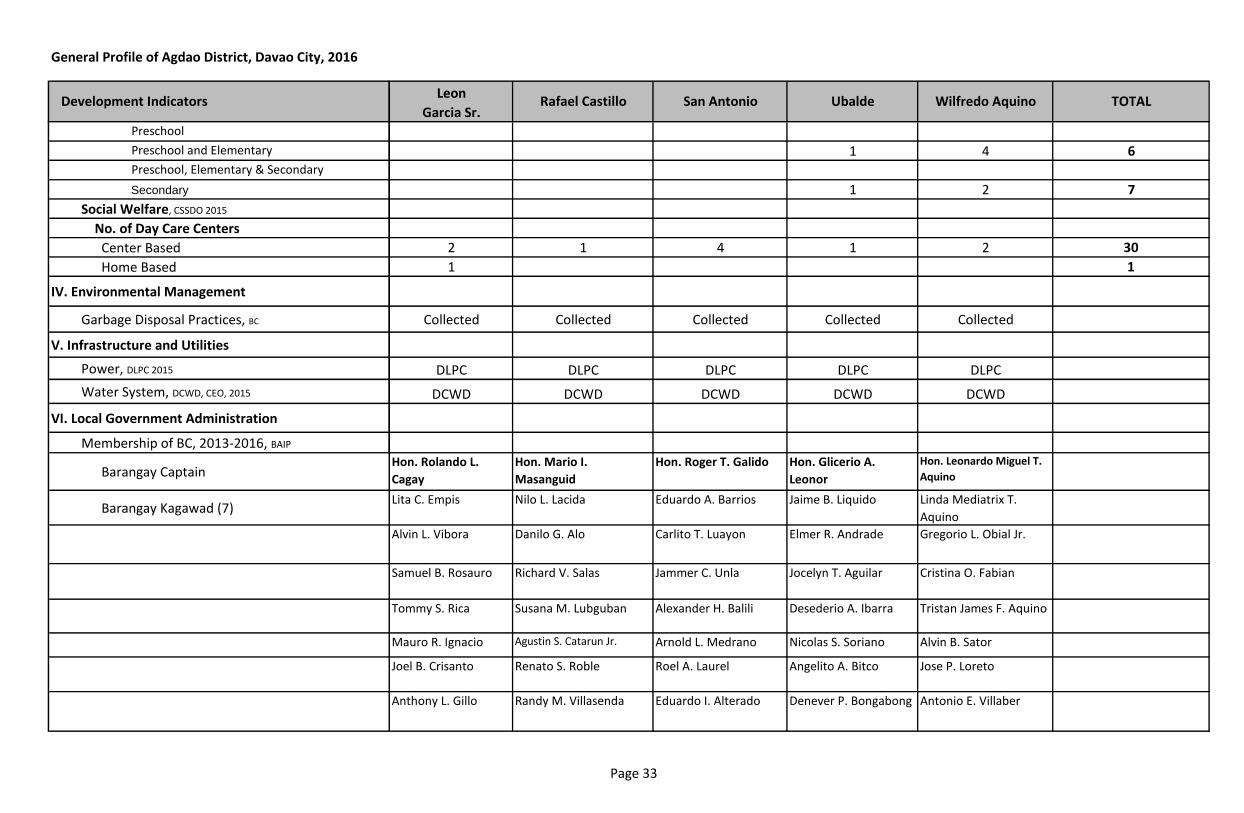
Leon
Garcia Sr.Rafael Castillo San Antonio Ubalde Wilfredo Aquino TOTAL
1 4 6
1 2 7
2 1 4 1 2 30
1 1
Collected Collected Collected Collected Collected
DLPC DLPC DLPC DLPC DLPC
DCWD DCWD DCWD DCWD DCWD
Hon. Rolando L.
Cagay
Hon. Mario I.
Masanguid
Hon. Roger T. Galido Hon. Glicerio A.
Leonor
Hon. Leonardo Miguel T.
Aquino
Lita C. Empis Nilo L. Lacida Eduardo A. Barrios Jaime B. Liquido Linda Mediatrix T.
Aquino
Alvin L. Vibora Danilo G. Alo Carlito T. Luayon Elmer R. Andrade Gregorio L. Obial Jr.
Samuel B. Rosauro Richard V. Salas Jammer C. Unla Jocelyn T. Aguilar Cristina O. Fabian
Tommy S. Rica Susana M. Lubguban Alexander H. Balili Desederio A. Ibarra Tristan James F. Aquino
Mauro R. Ignacio Agustin S. Catarun Jr. Arnold L. Medrano Nicolas S. Soriano Alvin B. Sator
Joel B. Crisanto Renato S. Roble Roel A. Laurel Angelito A. Bitco Jose P. Loreto
Anthony L. Gillo Randy M. Villasenda Eduardo I. Alterado Denever P. Bongabong Antonio E. Villaber
Page 33
General Profile of Agdao District, Davao City, 2016
Development Indicators
Brgy. Secretary
Brgy. Treasurer
Leon
Garcia Sr.Rafael Castillo San Antonio Ubalde Wilfredo Aquino TOTAL
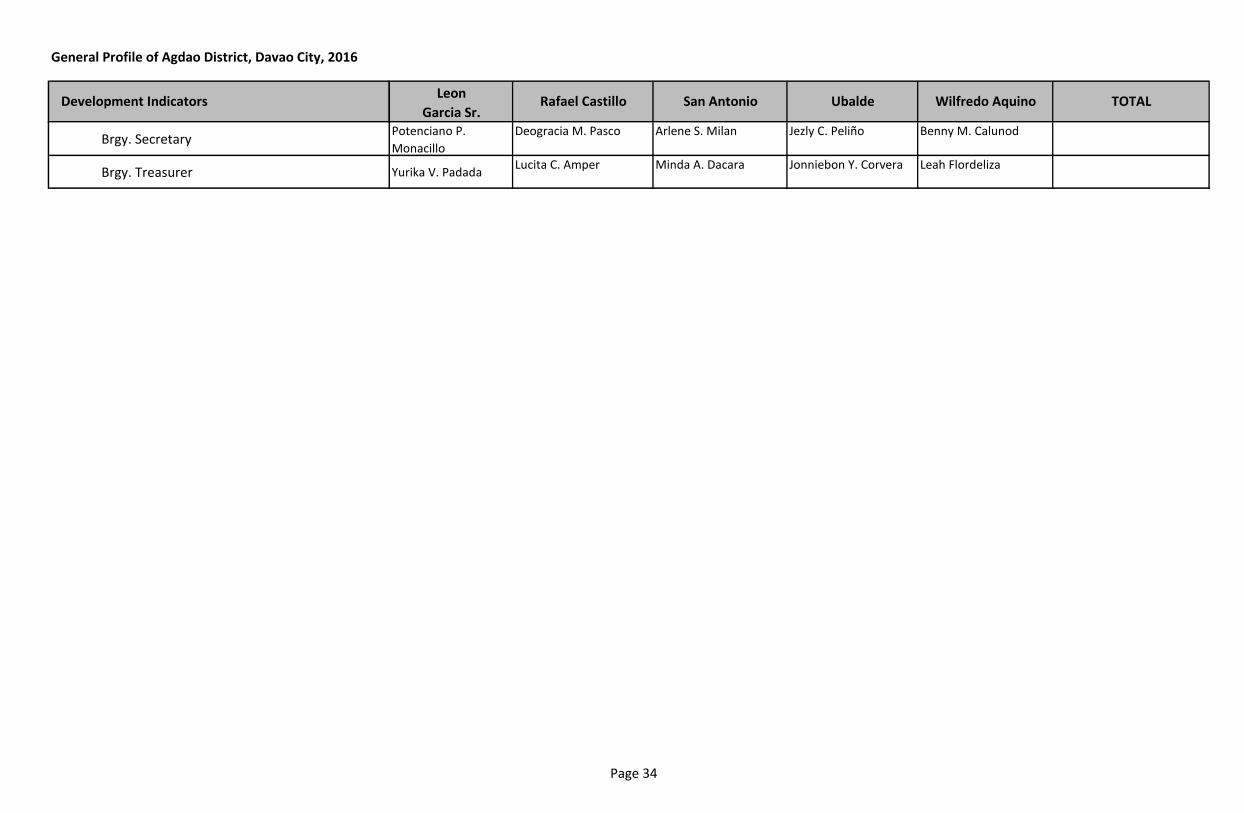
Potenciano P.
Monacillo
Deogracia M. Pasco Arlene S. Milan Jezly C. Peliño Benny M. Calunod
Yurika V. PadadaLucita C. Amper Minda A. Dacara Jonniebon Y. Corvera Leah Flordeliza
Page 34
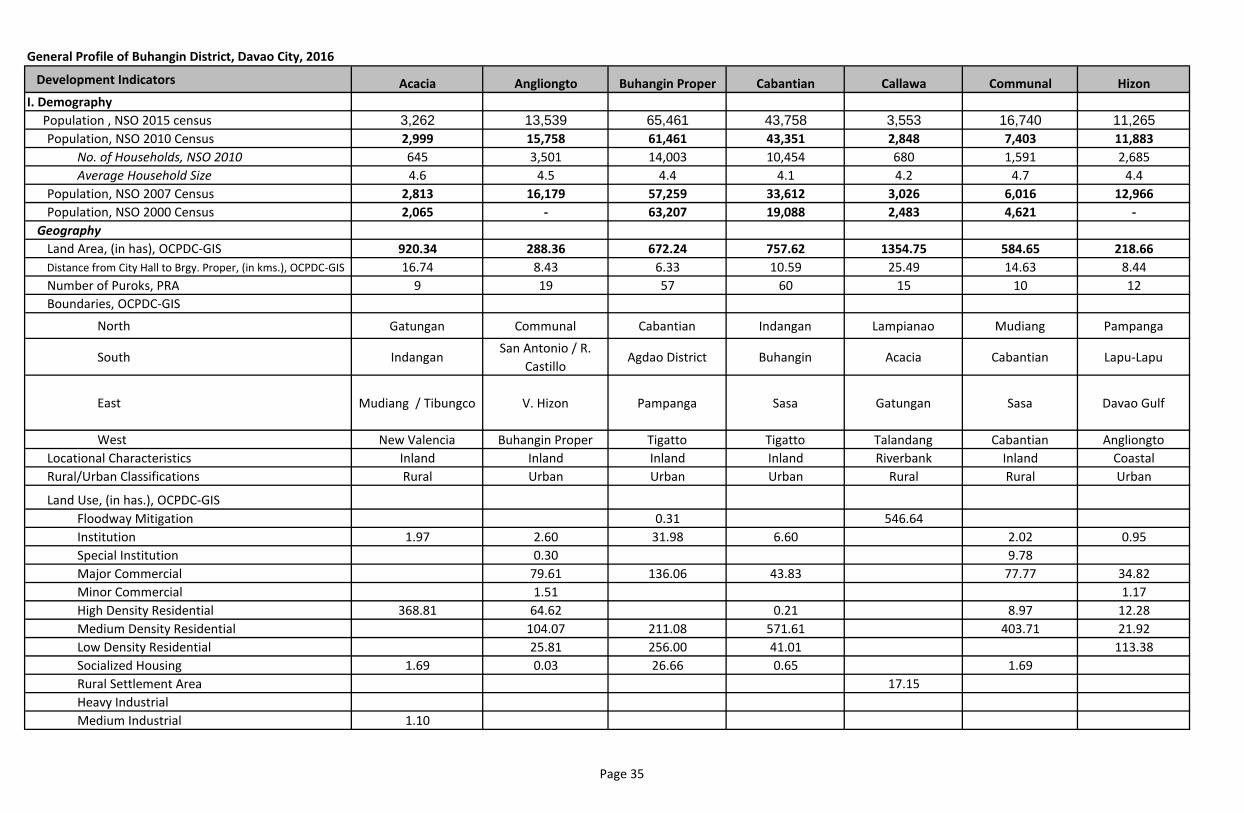
Development Indicators Acacia Angliongto Buhangin Proper Cabantian Callawa Communal Hizon
I. Demography
Population , NSO 2015 census 3,262 13,539 65,461 43,758 3,553 16,740 11,265
Population, NSO 2010 Census 2,999 15,758 61,461 43,351 2,848 7,403 11,883
No. of Households, NSO 2010 645 3,501 14,003 10,454 680 1,591 2,685
Average Household Size 4.6 4.5 4.4 4.1 4.2 4.7 4.4
Population, NSO 2007 Census 2,813 16,179 57,259 33,612 3,026 6,016 12,966
Population, NSO 2000 Census 2,065 - 63,207 19,088 2,483 4,621 -
Geography
Land Area, (in has), OCPDC-GIS 920.34 288.36 672.24 757.62 1354.75 584.65 218.66
Distance from City Hall to Brgy. Proper, (in kms.), OCPDC-GIS 16.74 8.43 6.33 10.59 25.49 14.63 8.44
Number of Puroks, PRA 9 19 57 60 15 10 12
Boundaries, OCPDC-GIS
North Gatungan Communal Cabantian Indangan Lampianao Mudiang Pampanga
South IndanganSan Antonio / R.
CastilloAgdao District Buhangin Acacia Cabantian Lapu-Lapu
East Mudiang / Tibungco V. Hizon Pampanga Sasa Gatungan Sasa Davao Gulf
West New Valencia Buhangin Proper Tigatto Tigatto Talandang Cabantian Angliongto
Locational Characteristics Inland Inland Inland Inland Riverbank Inland Coastal
Rural/Urban Classifications Rural Urban Urban Urban Rural Rural Urban
Land Use, (in has.), OCPDC-GIS
Floodway Mitigation 0.31 546.64
Institution 1.97 2.60 31.98 6.60 2.02 0.95
Special Institution 0.30 9.78
Major Commercial 79.61 136.06 43.83 77.77 34.82
Minor Commercial 1.51 1.17
High Density Residential 368.81 64.62 0.21 8.97 12.28
Medium Density Residential 104.07 211.08 571.61 403.71 21.92
Low Density Residential 25.81 256.00 41.01 113.38
Socialized Housing 1.69 0.03 26.66 0.65 1.69
Rural Settlement Area 17.15
Heavy Industrial
Medium Industrial 1.10
General Profile of Buhangin District, Davao City, 2016
Page 35
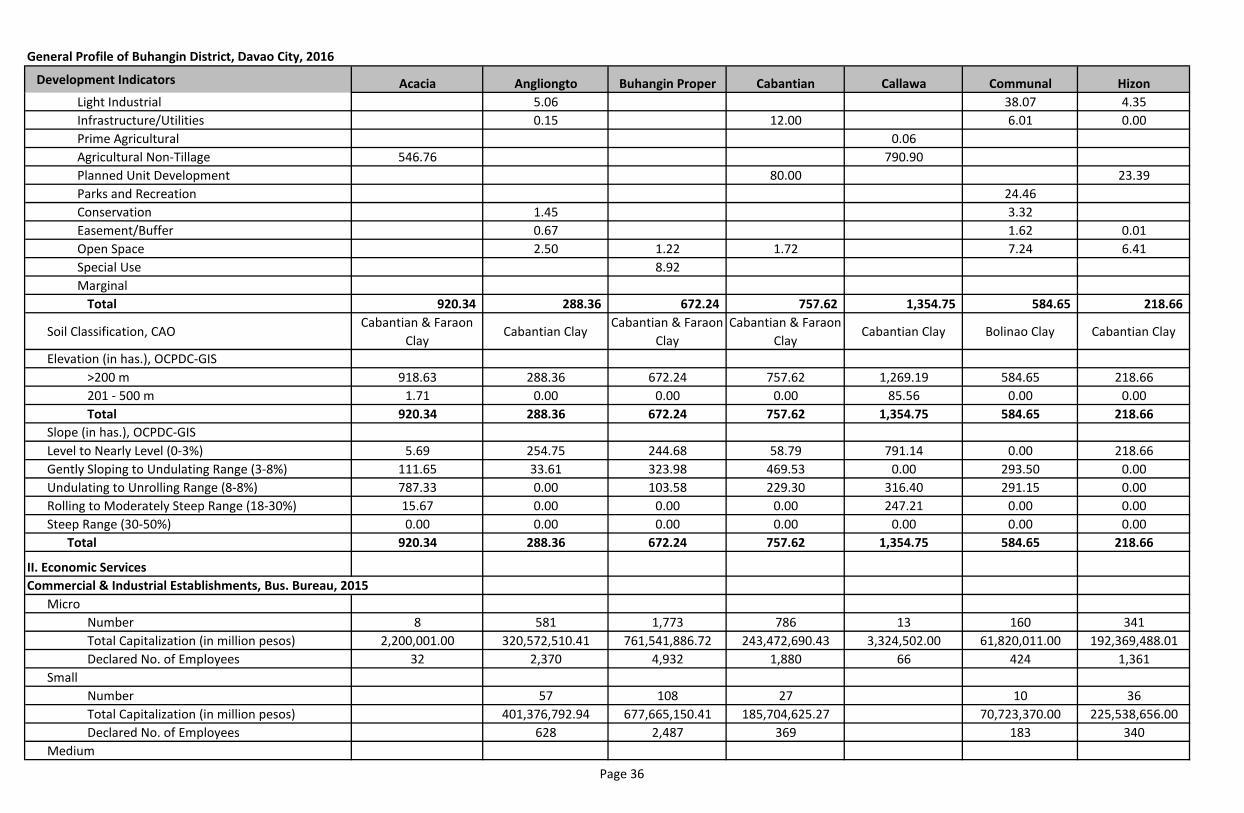
Development Indicators Acacia Angliongto Buhangin Proper Cabantian Callawa Communal Hizon
General Profile of Buhangin District, Davao City, 2016
Light Industrial 5.06 38.07 4.35
Infrastructure/Utilities 0.15 12.00 6.01 0.00
Prime Agricultural 0.06
Agricultural Non-Tillage 546.76 790.90
Planned Unit Development 80.00 23.39
Parks and Recreation 24.46
Conservation 1.45 3.32
Easement/Buffer 0.67 1.62 0.01
Open Space 2.50 1.22 1.72 7.24 6.41
Special Use 8.92
Marginal
Total 920.34 288.36 672.24 757.62 1,354.75 584.65 218.66
Soil Classification, CAOCabantian & Faraon
ClayCabantian Clay
Cabantian & Faraon
Clay
Cabantian & Faraon
ClayCabantian Clay Bolinao Clay Cabantian Clay
Elevation (in has.), OCPDC-GIS
>200 m 918.63 288.36 672.24 757.62 1,269.19 584.65 218.66
201 - 500 m 1.71 0.00 0.00 0.00 85.56 0.00 0.00
Total 920.34 288.36 672.24 757.62 1,354.75 584.65 218.66
Slope (in has.), OCPDC-GIS
Level to Nearly Level (0-3%) 5.69 254.75 244.68 58.79 791.14 0.00 218.66
Gently Sloping to Undulating Range (3-8%) 111.65 33.61 323.98 469.53 0.00 293.50 0.00
Undulating to Unrolling Range (8-8%) 787.33 0.00 103.58 229.30 316.40 291.15 0.00
Rolling to Moderately Steep Range (18-30%) 15.67 0.00 0.00 0.00 247.21 0.00 0.00
Steep Range (30-50%) 0.00 0.00 0.00 0.00 0.00 0.00 0.00
Total 920.34 288.36 672.24 757.62 1,354.75 584.65 218.66
II. Economic Services
Commercial & Industrial Establishments, Bus. Bureau, 2015
Micro
Number 8 581 1,773 786 13 160 341
Total Capitalization (in million pesos) 2,200,001.00 320,572,510.41 761,541,886.72 243,472,690.43 3,324,502.00 61,820,011.00 192,369,488.01
Declared No. of Employees 32 2,370 4,932 1,880 66 424 1,361
Small
Number 57 108 27 10 36
Total Capitalization (in million pesos) 401,376,792.94 677,665,150.41 185,704,625.27 70,723,370.00 225,538,656.00
Declared No. of Employees 628 2,487 369 183 340
Medium
Page 36
Development Indicators Acacia Angliongto Buhangin Proper Cabantian Callawa Communal Hizon
General Profile of Buhangin District, Davao City, 2016
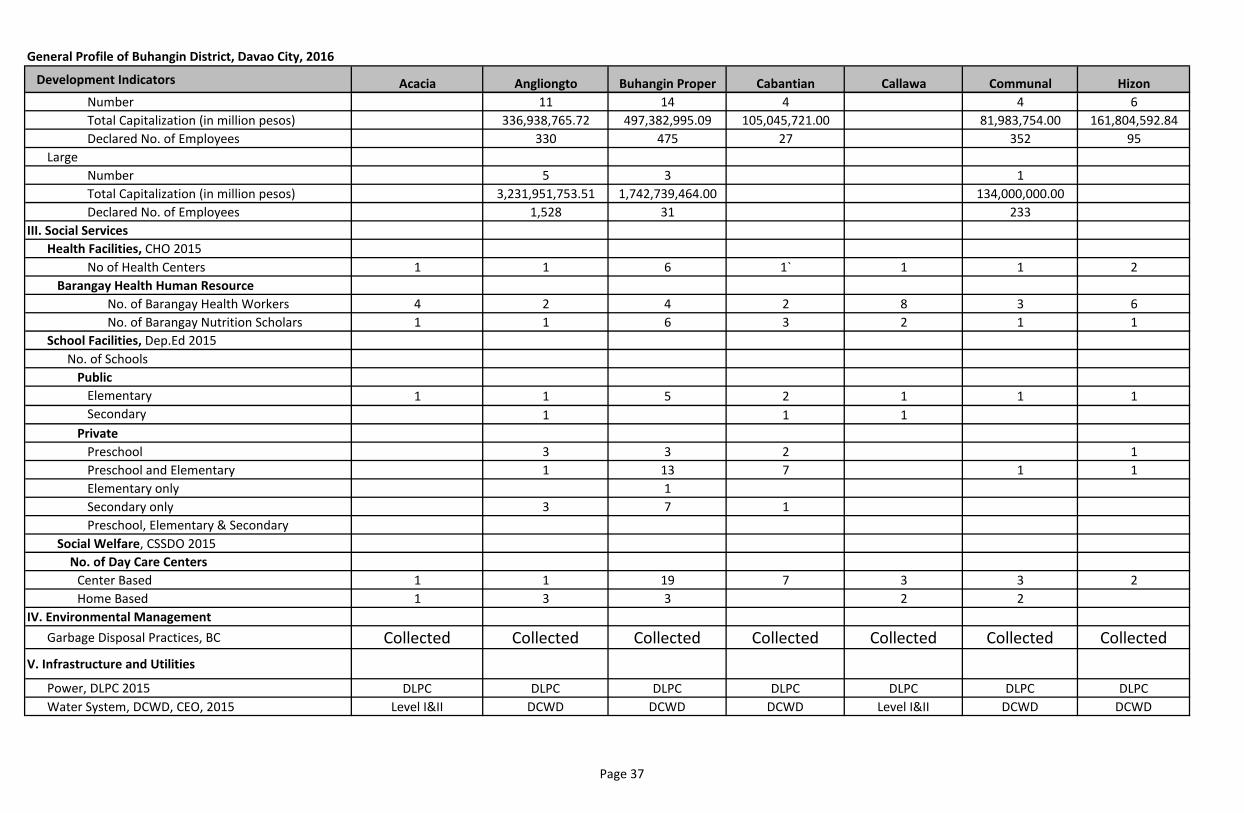
Number 11 14 4 4 6
Total Capitalization (in million pesos) 336,938,765.72 497,382,995.09 105,045,721.00 81,983,754.00 161,804,592.84
Declared No. of Employees 330 475 27 352 95
Large
Number 5 3 1
Total Capitalization (in million pesos) 3,231,951,753.51 1,742,739,464.00 134,000,000.00
Declared No. of Employees 1,528 31 233
III. Social Services
Health Facilities, CHO 2015
No of Health Centers 1 1 6 1` 1 1 2
Barangay Health Human Resource
No. of Barangay Health Workers 4 2 4 2 8 3 6
No. of Barangay Nutrition Scholars 1 1 6 3 2 1 1
School Facilities, Dep.Ed 2015
No. of Schools
Public
Elementary 1 1 5 2 1 1 1
Secondary 1 1 1
Private
Preschool 3 3 2 1
Preschool and Elementary 1 13 7 1 1
Elementary only 1
Secondary only 3 7 1
Preschool, Elementary & Secondary
Social Welfare, CSSDO 2015
No. of Day Care Centers
Center Based 1 1 19 7 3 3 2
Home Based 1 3 3 2 2
IV. Environmental Management
Garbage Disposal Practices, BC Collected Collected Collected Collected Collected Collected Collected
V. Infrastructure and Utilities
Power, DLPC 2015 DLPC DLPC DLPC DLPC DLPC DLPC DLPC
Water System, DCWD, CEO, 2015 Level I&II DCWD DCWD DCWD Level I&II DCWD DCWD
Page 37
Development Indicators Acacia Angliongto Buhangin Proper Cabantian Callawa Communal Hizon
General Profile of Buhangin District, Davao City, 2016
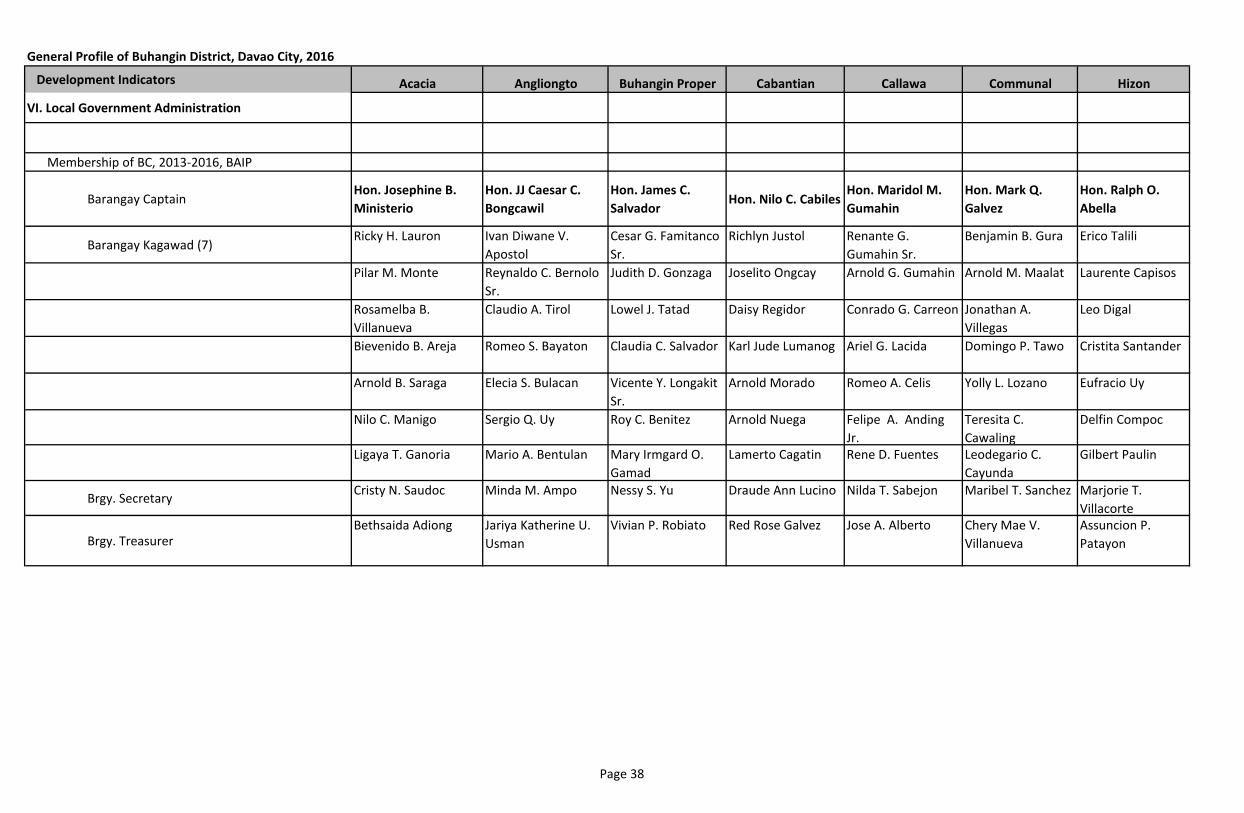
VI. Local Government Administration
Membership of BC, 2013-2016, BAIP
Barangay CaptainHon. Josephine B.
Ministerio
Hon. JJ Caesar C.
Bongcawil
Hon. James C.
SalvadorHon. Nilo C. Cabiles
Hon. Maridol M.
Gumahin
Hon. Mark Q.
Galvez
Hon. Ralph O.
Abella
Barangay Kagawad (7)Ricky H. Lauron Ivan Diwane V.
Apostol
Cesar G. Famitanco
Sr.
Richlyn Justol Renante G.
Gumahin Sr.
Benjamin B. Gura Erico Talili
Pilar M. Monte Reynaldo C. Bernolo
Sr.
Judith D. Gonzaga Joselito Ongcay Arnold G. Gumahin Arnold M. Maalat Laurente Capisos
Rosamelba B.
Villanueva
Claudio A. Tirol Lowel J. Tatad Daisy Regidor Conrado G. Carreon Jonathan A.
Villegas
Leo Digal
Bievenido B. Areja Romeo S. Bayaton Claudia C. Salvador Karl Jude Lumanog Ariel G. Lacida Domingo P. Tawo Cristita Santander
Arnold B. Saraga Elecia S. Bulacan Vicente Y. Longakit
Sr.
Arnold Morado Romeo A. Celis Yolly L. Lozano Eufracio Uy
Nilo C. Manigo Sergio Q. Uy Roy C. Benitez Arnold Nuega Felipe A. Anding
Jr.
Teresita C.
Cawaling
Delfin Compoc
Ligaya T. Ganoria Mario A. Bentulan Mary Irmgard O.
Gamad
Lamerto Cagatin Rene D. Fuentes Leodegario C.
Cayunda
Gilbert Paulin
Brgy. SecretaryCristy N. Saudoc Minda M. Ampo Nessy S. Yu Draude Ann Lucino Nilda T. Sabejon Maribel T. Sanchez Marjorie T.
Villacorte
Brgy. TreasurerBethsaida Adiong Jariya Katherine U.
Usman
Vivian P. Robiato Red Rose Galvez Jose A. Alberto Chery Mae V.
Villanueva
Assuncion P.
Patayon
Page 38
Development Indicators
I. Demography
Population , NSO 2015 census
Population, NSO 2010 Census
No. of Households, NSO 2010
Average Household Size
Population, NSO 2007 Census
Population, NSO 2000 Census
Geography
Land Area, (in has), OCPDC-GIS
Distance from City Hall to Brgy. Proper, (in kms.), OCPDC-GIS
Number of Puroks, PRA
Boundaries, OCPDC-GIS
North
South
East
West
Locational Characteristics
Rural/Urban Classifications
Land Use, (in has.), OCPDC-GIS
Floodway Mitigation
Institution
Special Institution
Major Commercial
Minor Commercial
High Density Residential
Medium Density Residential
Low Density Residential
Socialized Housing
Rural Settlement Area
Heavy Industrial
Medium Industrial
General Profile of Buhangin District, Davao City, 2016
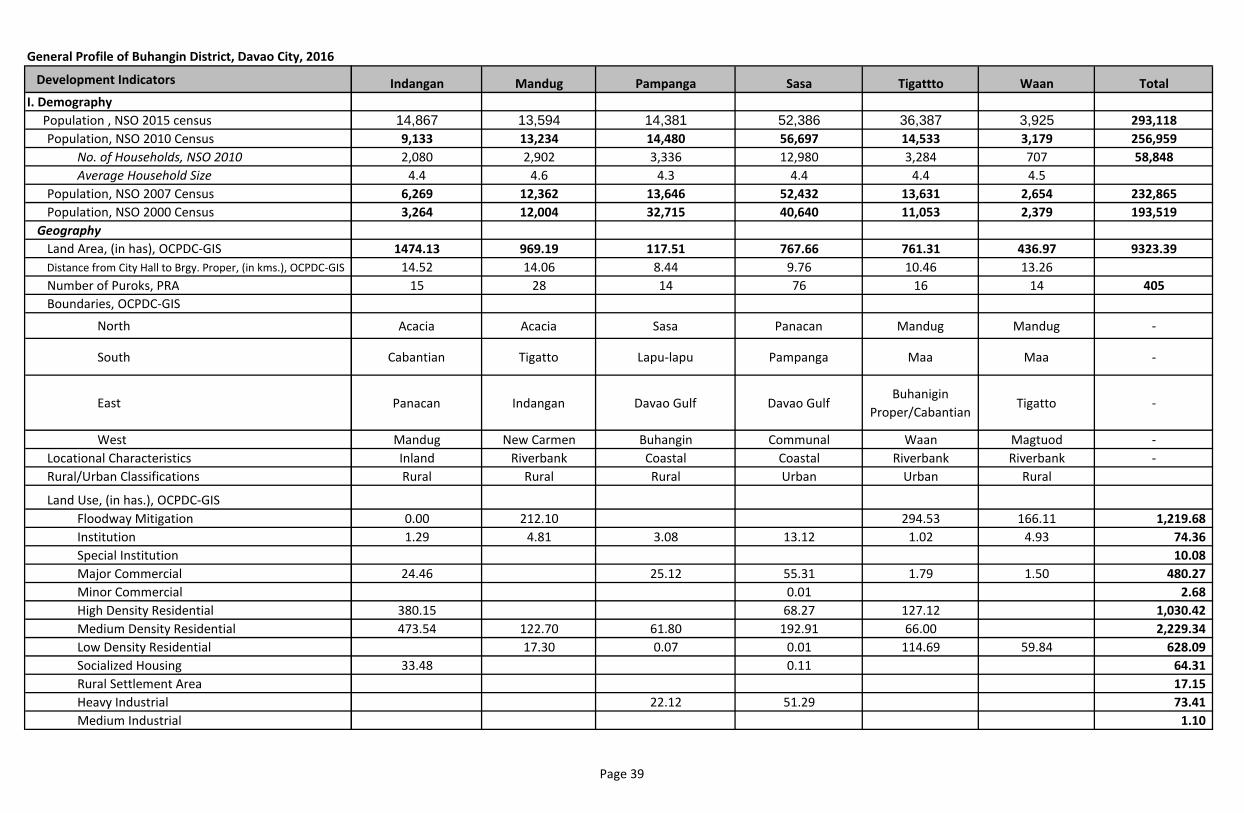
Indangan Mandug Pampanga Sasa Tigattto Waan Total
14,867 13,594 14,381 52,386 36,387 3,925 293,118
9,133 13,234 14,480 56,697 14,533 3,179 256,959
2,080 2,902 3,336 12,980 3,284 707 58,848
4.4 4.6 4.3 4.4 4.4 4.5
6,269 12,362 13,646 52,432 13,631 2,654 232,865
3,264 12,004 32,715 40,640 11,053 2,379 193,519
1474.13 969.19 117.51 767.66 761.31 436.97 9323.39
14.52 14.06 8.44 9.76 10.46 13.26
15 28 14 76 16 14 405
Acacia Acacia Sasa Panacan Mandug Mandug -
Cabantian Tigatto Lapu-lapu Pampanga Maa Maa -
Panacan Indangan Davao Gulf Davao GulfBuhanigin
Proper/CabantianTigatto -
Mandug New Carmen Buhangin Communal Waan Magtuod -
Inland Riverbank Coastal Coastal Riverbank Riverbank -
Rural Rural Rural Urban Urban Rural
0.00 212.10 294.53 166.11 1,219.68
1.29 4.81 3.08 13.12 1.02 4.93 74.36
10.08
24.46 25.12 55.31 1.79 1.50 480.27
0.01 2.68
380.15 68.27 127.12 1,030.42
473.54 122.70 61.80 192.91 66.00 2,229.34
17.30 0.07 0.01 114.69 59.84 628.09
33.48 0.11 64.31
17.15
22.12 51.29 73.41
1.10
Page 39
Development Indicators
General Profile of Buhangin District, Davao City, 2016
Light Industrial
Infrastructure/Utilities
Prime Agricultural
Agricultural Non-Tillage
Planned Unit Development
Parks and Recreation
Conservation
Easement/Buffer
Open Space
Special Use
Marginal
Total
Soil Classification, CAO
Elevation (in has.), OCPDC-GIS
>200 m
201 - 500 m
Total
Slope (in has.), OCPDC-GIS
Level to Nearly Level (0-3%)
Gently Sloping to Undulating Range (3-8%)
Undulating to Unrolling Range (8-8%)
Rolling to Moderately Steep Range (18-30%)
Steep Range (30-50%)
Total
II. Economic Services
Commercial & Industrial Establishments, Bus. Bureau, 2015
Micro
Number
Total Capitalization (in million pesos)
Declared No. of Employees
Small
Number
Total Capitalization (in million pesos)
Declared No. of Employees
Medium
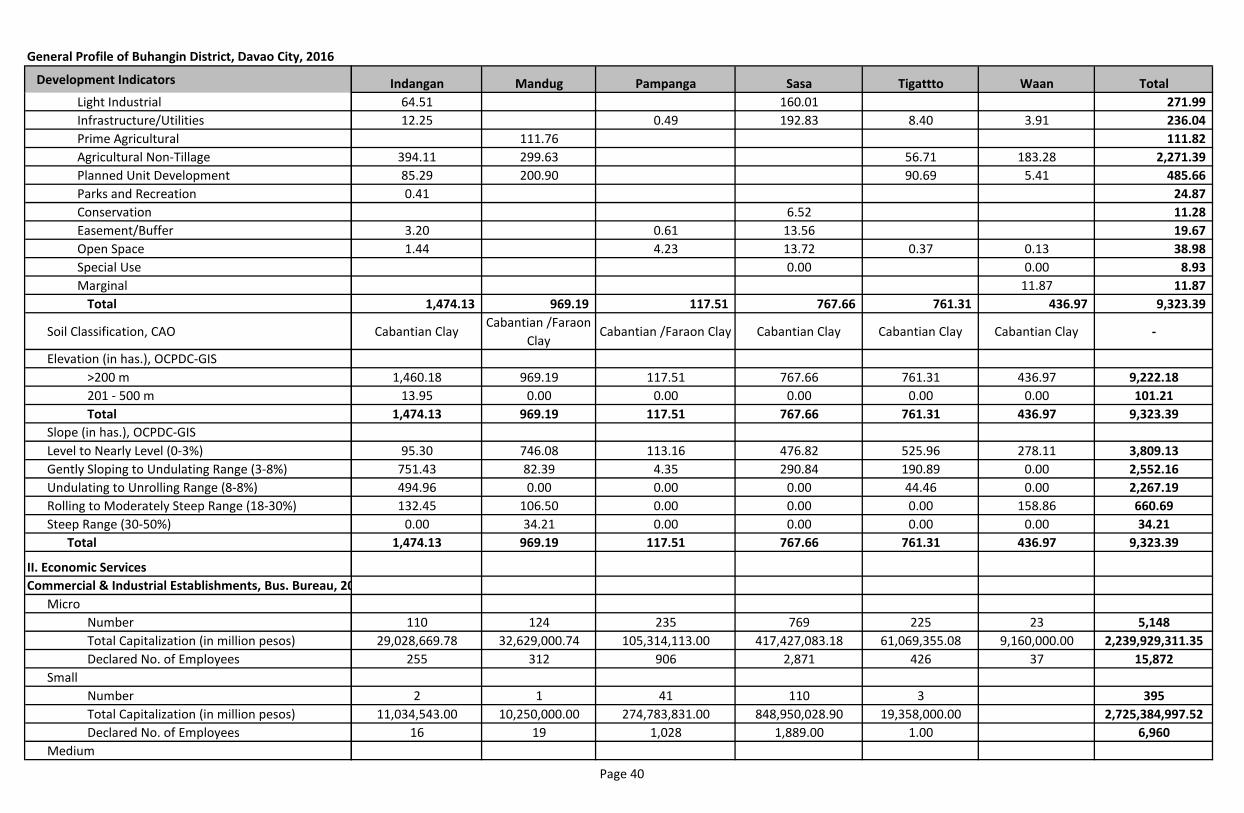
Indangan Mandug Pampanga Sasa Tigattto Waan Total
64.51 160.01 271.99
12.25 0.49 192.83 8.40 3.91 236.04
111.76 111.82
394.11 299.63 56.71 183.28 2,271.39
85.29 200.90 90.69 5.41 485.66
0.41 24.87
6.52 11.28
3.20 0.61 13.56 19.67
1.44 4.23 13.72 0.37 0.13 38.98
0.00 0.00 8.93
11.87 11.87
1,474.13 969.19 117.51 767.66 761.31 436.97 9,323.39
Cabantian ClayCabantian /Faraon
ClayCabantian /Faraon Clay Cabantian Clay Cabantian Clay Cabantian Clay -
1,460.18 969.19 117.51 767.66 761.31 436.97 9,222.18
13.95 0.00 0.00 0.00 0.00 0.00 101.21
1,474.13 969.19 117.51 767.66 761.31 436.97 9,323.39
95.30 746.08 113.16 476.82 525.96 278.11 3,809.13
751.43 82.39 4.35 290.84 190.89 0.00 2,552.16
494.96 0.00 0.00 0.00 44.46 0.00 2,267.19
132.45 106.50 0.00 0.00 0.00 158.86 660.69
0.00 34.21 0.00 0.00 0.00 0.00 34.21
1,474.13 969.19 117.51 767.66 761.31 436.97 9,323.39
110 124 235 769 225 23 5,148
29,028,669.78 32,629,000.74 105,314,113.00 417,427,083.18 61,069,355.08 9,160,000.00 2,239,929,311.35
255 312 906 2,871 426 37 15,872
2 1 41 110 3 395
11,034,543.00 10,250,000.00 274,783,831.00 848,950,028.90 19,358,000.00 2,725,384,997.52
16 19 1,028 1,889.00 1.00 6,960
Page 40
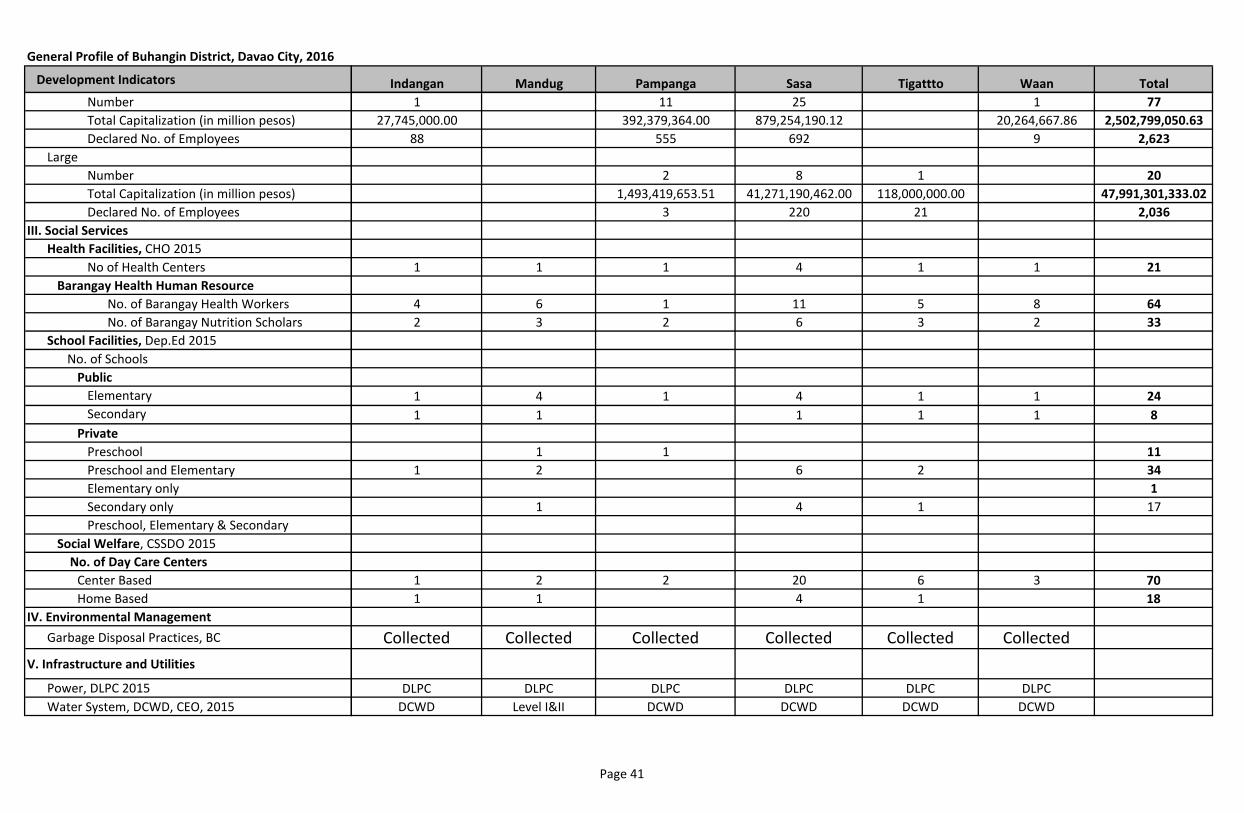
Development Indicators
General Profile of Buhangin District, Davao City, 2016
Number
Total Capitalization (in million pesos)
Declared No. of Employees
Large
Number
Total Capitalization (in million pesos)
Declared No. of Employees
III. Social Services
Health Facilities, CHO 2015
No of Health Centers
Barangay Health Human Resource
No. of Barangay Health Workers
No. of Barangay Nutrition Scholars
School Facilities, Dep.Ed 2015
No. of Schools
Public
Elementary
Secondary
Private
Preschool
Preschool and Elementary
Elementary only
Secondary only
Preschool, Elementary & Secondary
Social Welfare, CSSDO 2015
No. of Day Care Centers
Center Based
Home Based
IV. Environmental Management
Garbage Disposal Practices, BC
V. Infrastructure and Utilities
Power, DLPC 2015
Water System, DCWD, CEO, 2015
Indangan Mandug Pampanga Sasa Tigattto Waan Total
1 11 25 1 77
27,745,000.00 392,379,364.00 879,254,190.12 20,264,667.86 2,502,799,050.63
88 555 692 9 2,623
2 8 1 20
1,493,419,653.51 41,271,190,462.00 118,000,000.00 47,991,301,333.02
3 220 21 2,036
1 1 1 4 1 1 21
4 6 1 11 5 8 64
2 3 2 6 3 2 33
1 4 1 4 1 1 24
1 1 1 1 1 8
1 1 11
1 2 6 2 34
1
1 4 1 17
1 2 2 20 6 3 70
1 1 4 1 18
Collected Collected Collected Collected Collected Collected
DLPC DLPC DLPC DLPC DLPC DLPC
DCWD Level I&II DCWD DCWD DCWD DCWD
Page 41
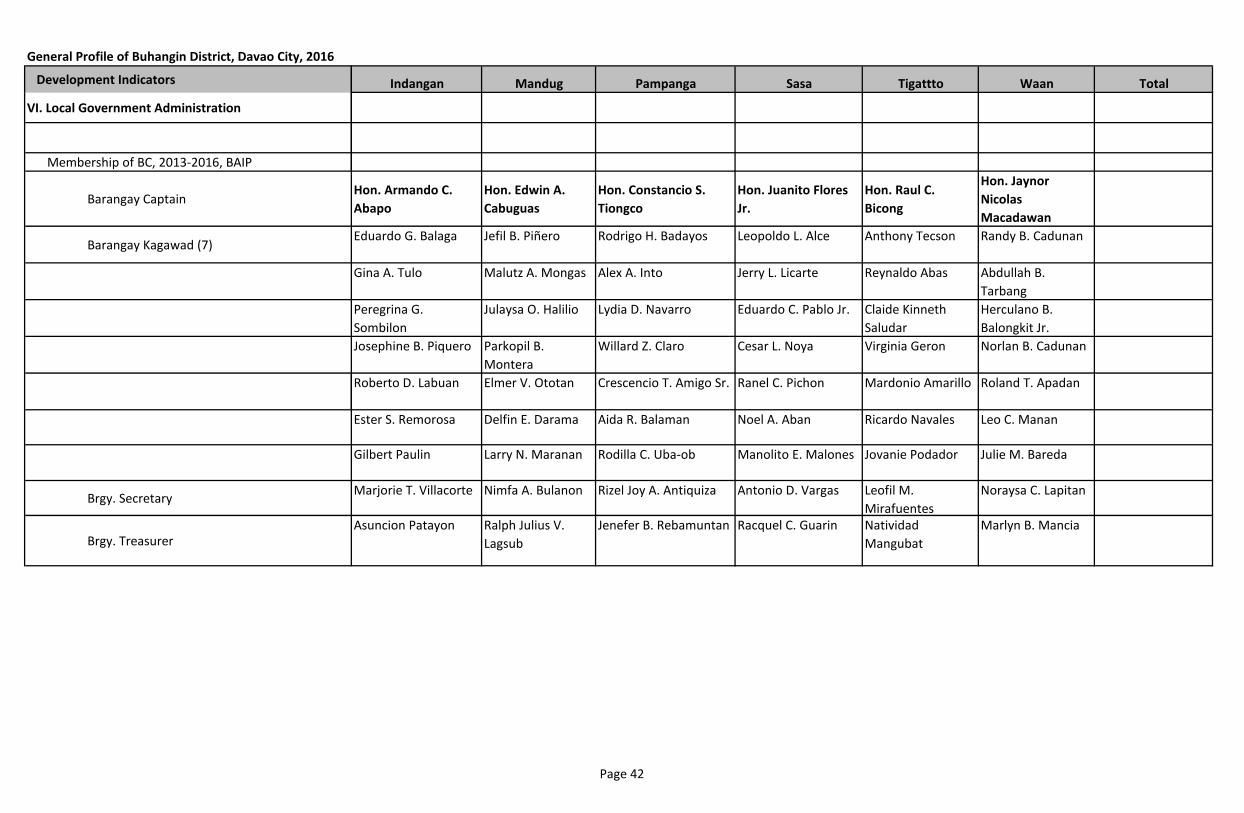
Development Indicators
General Profile of Buhangin District, Davao City, 2016
VI. Local Government Administration
Membership of BC, 2013-2016, BAIP
Barangay Captain
Barangay Kagawad (7)
Brgy. Secretary
Brgy. Treasurer
Indangan Mandug Pampanga Sasa Tigattto Waan Total
Hon. Armando C.
Abapo
Hon. Edwin A.
Cabuguas
Hon. Constancio S.
Tiongco
Hon. Juanito Flores
Jr.
Hon. Raul C.
Bicong
Hon. Jaynor
Nicolas
Macadawan
Eduardo G. Balaga Jefil B. Piñero Rodrigo H. Badayos Leopoldo L. Alce Anthony Tecson Randy B. Cadunan
Gina A. Tulo Malutz A. Mongas Alex A. Into Jerry L. Licarte Reynaldo Abas Abdullah B.
Tarbang
Peregrina G.
Sombilon
Julaysa O. Halilio Lydia D. Navarro Eduardo C. Pablo Jr. Claide Kinneth
Saludar
Herculano B.
Balongkit Jr.
Josephine B. Piquero Parkopil B.
Montera
Willard Z. Claro Cesar L. Noya Virginia Geron Norlan B. Cadunan
Roberto D. Labuan Elmer V. Ototan Crescencio T. Amigo Sr. Ranel C. Pichon Mardonio Amarillo Roland T. Apadan
Ester S. Remorosa Delfin E. Darama Aida R. Balaman Noel A. Aban Ricardo Navales Leo C. Manan
Gilbert Paulin Larry N. Maranan Rodilla C. Uba-ob Manolito E. Malones Jovanie Podador Julie M. Bareda
Marjorie T. Villacorte Nimfa A. Bulanon Rizel Joy A. Antiquiza Antonio D. Vargas Leofil M.
Mirafuentes
Noraysa C. Lapitan
Asuncion Patayon Ralph Julius V.
Lagsub
Jenefer B. Rebamuntan Racquel C. Guarin Natividad
Mangubat
Marlyn B. Mancia
Page 42
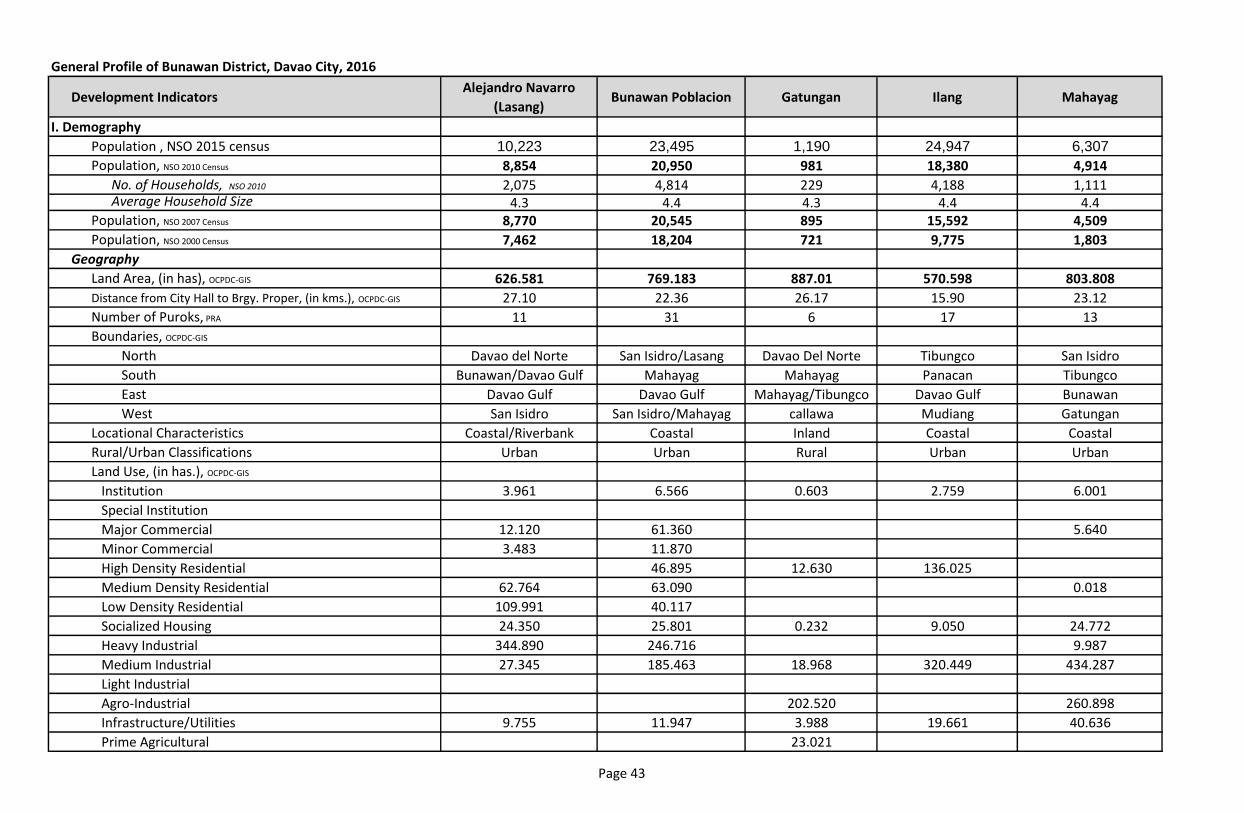
Development IndicatorsAlejandro Navarro
(Lasang)Bunawan Poblacion Gatungan Ilang Mahayag
I. Demography
Population , NSO 2015 census 10,223 23,495 1,190 24,947 6,307
Population, NSO 2010 Census 8,854 20,950 981 18,380 4,914
No. of Households, NSO 2010 2,075 4,814 229 4,188 1,111Average Household Size 4.3 4.4 4.3 4.4 4.4
Population, NSO 2007 Census 8,770 20,545 895 15,592 4,509
Population, NSO 2000 Census 7,462 18,204 721 9,775 1,803
Geography
Land Area, (in has), OCPDC-GIS 626.581 769.183 887.01 570.598 803.808
Distance from City Hall to Brgy. Proper, (in kms.), OCPDC-GIS 27.10 22.36 26.17 15.90 23.12
Number of Puroks, PRA 11 31 6 17 13
Boundaries, OCPDC-GIS
North Davao del Norte San Isidro/Lasang Davao Del Norte Tibungco San Isidro
South Bunawan/Davao Gulf Mahayag Mahayag Panacan Tibungco
East Davao Gulf Davao Gulf Mahayag/Tibungco Davao Gulf Bunawan
West San Isidro San Isidro/Mahayag callawa Mudiang Gatungan
Locational Characteristics Coastal/Riverbank Coastal Inland Coastal Coastal
Rural/Urban Classifications Urban Urban Rural Urban Urban
Land Use, (in has.), OCPDC-GIS
Institution 3.961 6.566 0.603 2.759 6.001
Special Institution
Major Commercial 12.120 61.360 5.640
Minor Commercial 3.483 11.870
High Density Residential 46.895 12.630 136.025
Medium Density Residential 62.764 63.090 0.018
Low Density Residential 109.991 40.117
Socialized Housing 24.350 25.801 0.232 9.050 24.772
Heavy Industrial 344.890 246.716 9.987
Medium Industrial 27.345 185.463 18.968 320.449 434.287
Light Industrial
Agro-Industrial 202.520 260.898
Infrastructure/Utilities 9.755 11.947 3.988 19.661 40.636
Prime Agricultural 23.021
General Profile of Bunawan District, Davao City, 2016
Page 43
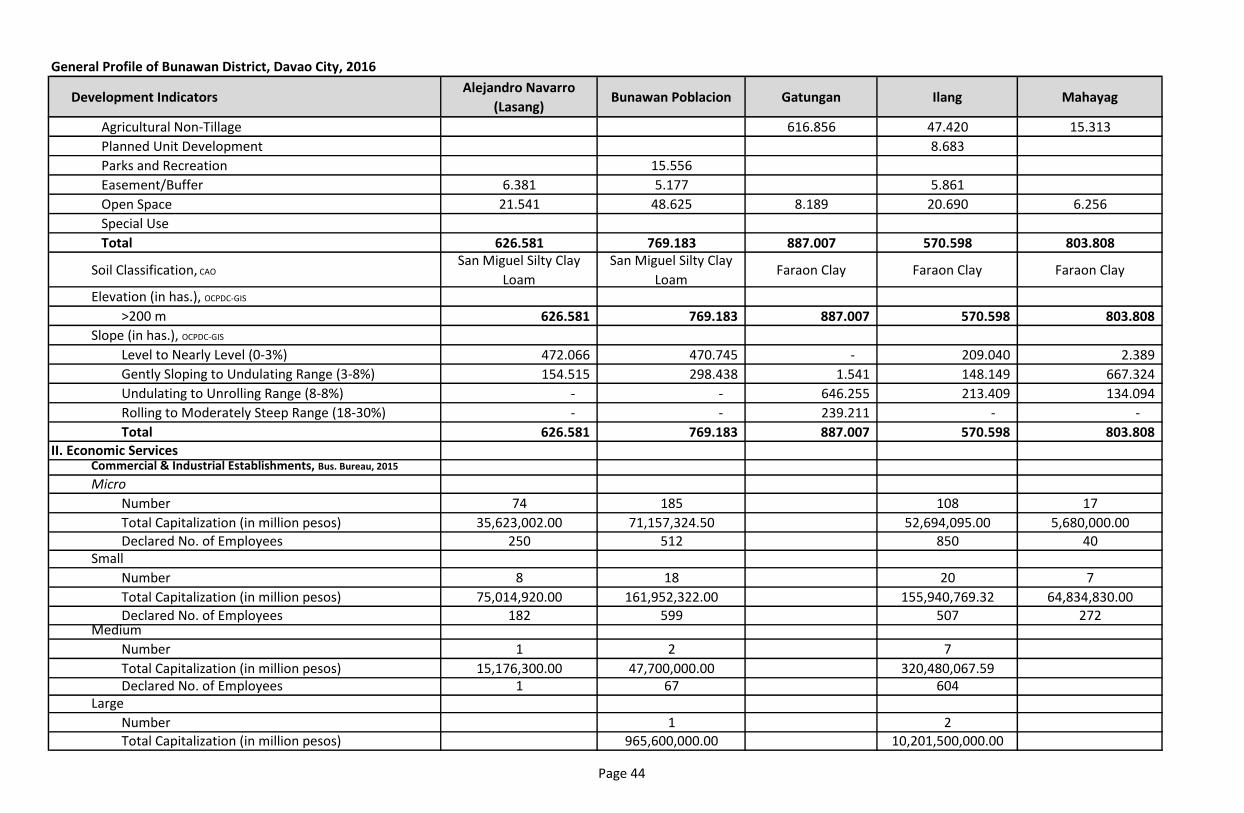
Development IndicatorsAlejandro Navarro
(Lasang)Bunawan Poblacion Gatungan Ilang Mahayag
General Profile of Bunawan District, Davao City, 2016
Agricultural Non-Tillage 616.856 47.420 15.313
Planned Unit Development 8.683
Parks and Recreation 15.556
Easement/Buffer 6.381 5.177 5.861
Open Space 21.541 48.625 8.189 20.690 6.256
Special Use
Total 626.581 769.183 887.007 570.598 803.808
Soil Classification, CAOSan Miguel Silty Clay
Loam
San Miguel Silty Clay
LoamFaraon Clay Faraon Clay Faraon Clay
Elevation (in has.), OCPDC-GIS
>200 m 626.581 769.183 887.007 570.598 803.808
Slope (in has.), OCPDC-GIS
Level to Nearly Level (0-3%) 472.066 470.745 - 209.040 2.389
Gently Sloping to Undulating Range (3-8%) 154.515 298.438 1.541 148.149 667.324
Undulating to Unrolling Range (8-8%) - - 646.255 213.409 134.094
Rolling to Moderately Steep Range (18-30%) - - 239.211 - -
Total 626.581 769.183 887.007 570.598 803.808 II. Economic Services
Commercial & Industrial Establishments, Bus. Bureau, 2015
Micro
Number 74 185 108 17
Total Capitalization (in million pesos) 35,623,002.00 71,157,324.50 52,694,095.00 5,680,000.00
Declared No. of Employees 250 512 850 40Small
Number 8 18 20 7
Total Capitalization (in million pesos) 75,014,920.00 161,952,322.00 155,940,769.32 64,834,830.00Declared No. of Employees 182 599 507 272
Medium
Number 1 2 7
Total Capitalization (in million pesos) 15,176,300.00 47,700,000.00 320,480,067.59Declared No. of Employees 1 67 604
Large
Number 1 2Total Capitalization (in million pesos) 965,600,000.00 10,201,500,000.00
Page 44
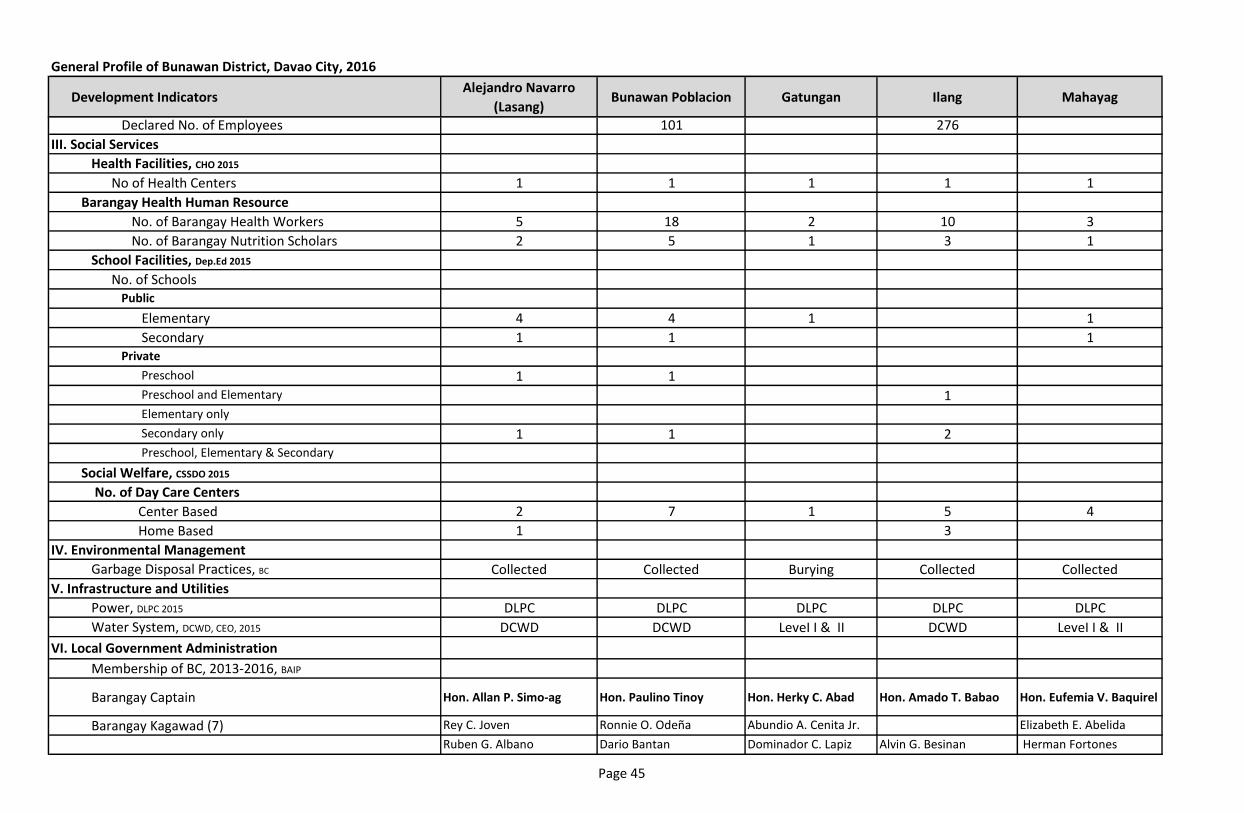
Development IndicatorsAlejandro Navarro
(Lasang)Bunawan Poblacion Gatungan Ilang Mahayag
General Profile of Bunawan District, Davao City, 2016
Declared No. of Employees 101 276
III. Social Services
Health Facilities, CHO 2015
No of Health Centers 1 1 1 1 1
Barangay Health Human Resource
No. of Barangay Health Workers 5 18 2 10 3
No. of Barangay Nutrition Scholars 2 5 1 3 1
School Facilities, Dep.Ed 2015
No. of SchoolsPublic
Elementary 4 4 1 1
Secondary 1 1 1Private
Preschool 1 1Preschool and Elementary 1Elementary only
Secondary only 1 1 2Preschool, Elementary & Secondary
Social Welfare, CSSDO 2015
No. of Day Care Centers
Center Based 2 7 1 5 4
Home Based 1 3
IV. Environmental Management
Garbage Disposal Practices, BC Collected Collected Burying Collected Collected
V. Infrastructure and Utilities
Power, DLPC 2015 DLPC DLPC DLPC DLPC DLPC
Water System, DCWD, CEO, 2015 DCWD DCWD LeveI I & II DCWD LeveI I & II
VI. Local Government Administration
Membership of BC, 2013-2016, BAIP
Barangay Captain Hon. Allan P. Simo-ag Hon. Paulino Tinoy Hon. Herky C. Abad Hon. Amado T. Babao Hon. Eufemia V. Baquirel
Barangay Kagawad (7) Rey C. Joven Ronnie O. Odeña Abundio A. Cenita Jr. Elizabeth E. Abelida
Ruben G. Albano Dario Bantan Dominador C. Lapiz Alvin G. Besinan Herman Fortones
Page 45
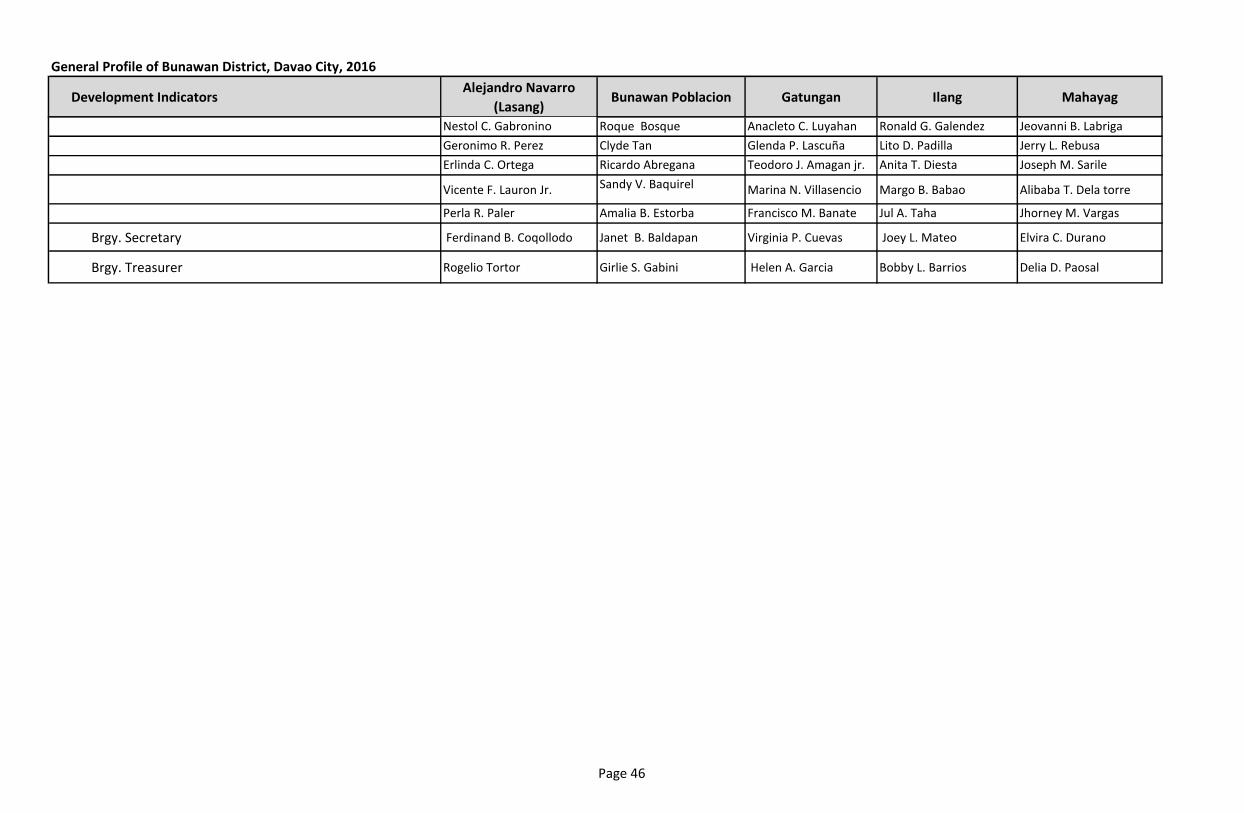
Development IndicatorsAlejandro Navarro
(Lasang)Bunawan Poblacion Gatungan Ilang Mahayag
General Profile of Bunawan District, Davao City, 2016
Nestol C. Gabronino Roque Bosque Anacleto C. Luyahan Ronald G. Galendez Jeovanni B. Labriga
Geronimo R. Perez Clyde Tan Glenda P. Lascuña Lito D. Padilla Jerry L. Rebusa
Erlinda C. Ortega Ricardo Abregana Teodoro J. Amagan jr. Anita T. Diesta Joseph M. Sarile
Vicente F. Lauron Jr. Sandy V. Baquirel Marina N. Villasencio Margo B. Babao Alibaba T. Dela torre
Perla R. Paler Amalia B. Estorba Francisco M. Banate Jul A. Taha Jhorney M. Vargas
Brgy. Secretary Ferdinand B. Coqollodo Janet B. Baldapan Virginia P. Cuevas Joey L. Mateo Elvira C. Durano
Brgy. Treasurer Rogelio Tortor Girlie S. Gabini Helen A. Garcia Bobby L. Barrios Delia D. Paosal
Page 46
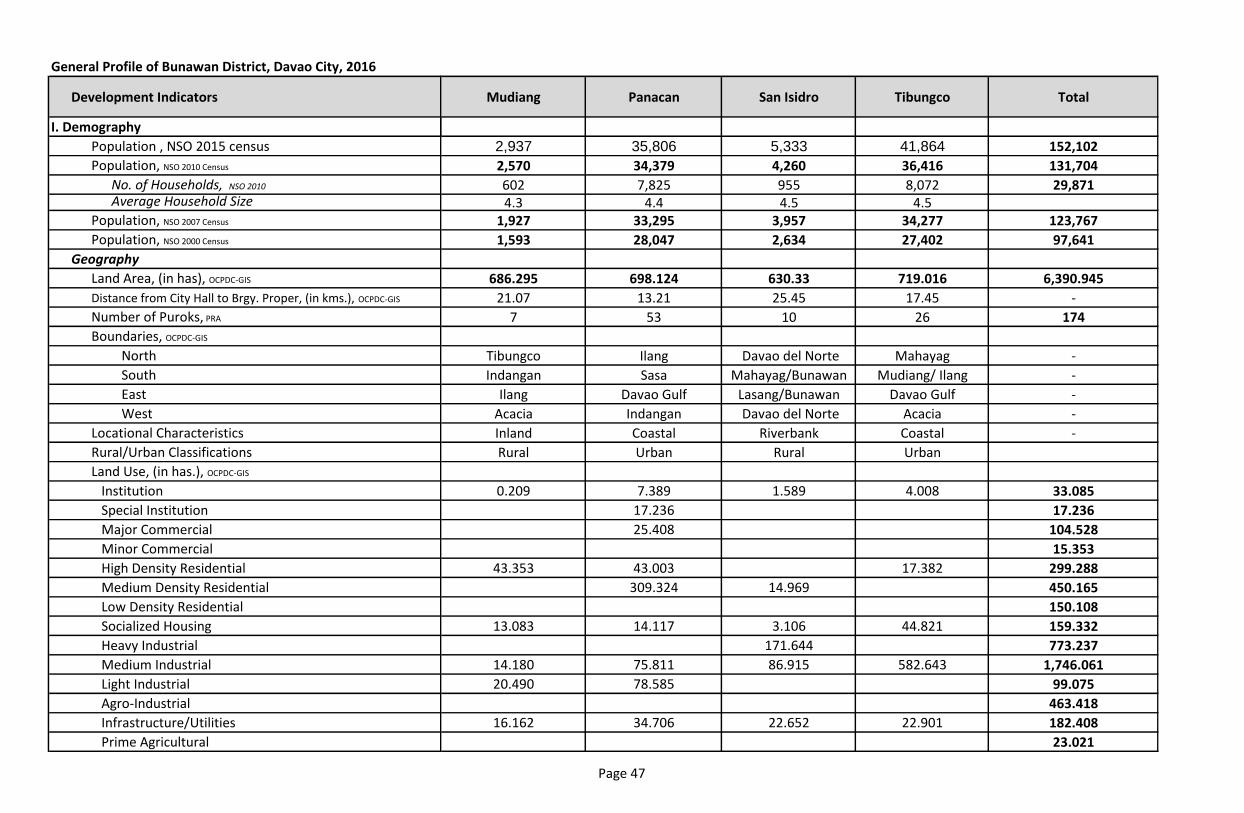
Development Indicators
I. Demography
Population , NSO 2015 census
Population, NSO 2010 Census
No. of Households, NSO 2010
Average Household Size
Population, NSO 2007 Census
Population, NSO 2000 Census
Geography
Land Area, (in has), OCPDC-GIS
Distance from City Hall to Brgy. Proper, (in kms.), OCPDC-GIS
Number of Puroks, PRA
Boundaries, OCPDC-GIS
North
South
East
West
Locational Characteristics
Rural/Urban Classifications
Land Use, (in has.), OCPDC-GIS
Institution
Special Institution
Major Commercial
Minor Commercial
High Density Residential
Medium Density Residential
Low Density Residential
Socialized Housing
Heavy Industrial
Medium Industrial
Light Industrial
Agro-Industrial
Infrastructure/Utilities
Prime Agricultural
General Profile of Bunawan District, Davao City, 2016
Mudiang Panacan San Isidro Tibungco Total
2,937 35,806 5,333 41,864 152,102
2,570 34,379 4,260 36,416 131,704
602 7,825 955 8,072 29,8714.3 4.4 4.5 4.5
1,927 33,295 3,957 34,277 123,767
1,593 28,047 2,634 27,402 97,641
686.295 698.124 630.33 719.016 6,390.945
21.07 13.21 25.45 17.45 -
7 53 10 26 174
Tibungco Ilang Davao del Norte Mahayag -
Indangan Sasa Mahayag/Bunawan Mudiang/ Ilang -
Ilang Davao Gulf Lasang/Bunawan Davao Gulf -
Acacia Indangan Davao del Norte Acacia -
Inland Coastal Riverbank Coastal -
Rural Urban Rural Urban
0.209 7.389 1.589 4.008 33.085
17.236 17.236
25.408 104.528
15.353
43.353 43.003 17.382 299.288
309.324 14.969 450.165
150.108
13.083 14.117 3.106 44.821 159.332
171.644 773.237
14.180 75.811 86.915 582.643 1,746.061
20.490 78.585 99.075
463.418
16.162 34.706 22.652 22.901 182.408
23.021
Page 47
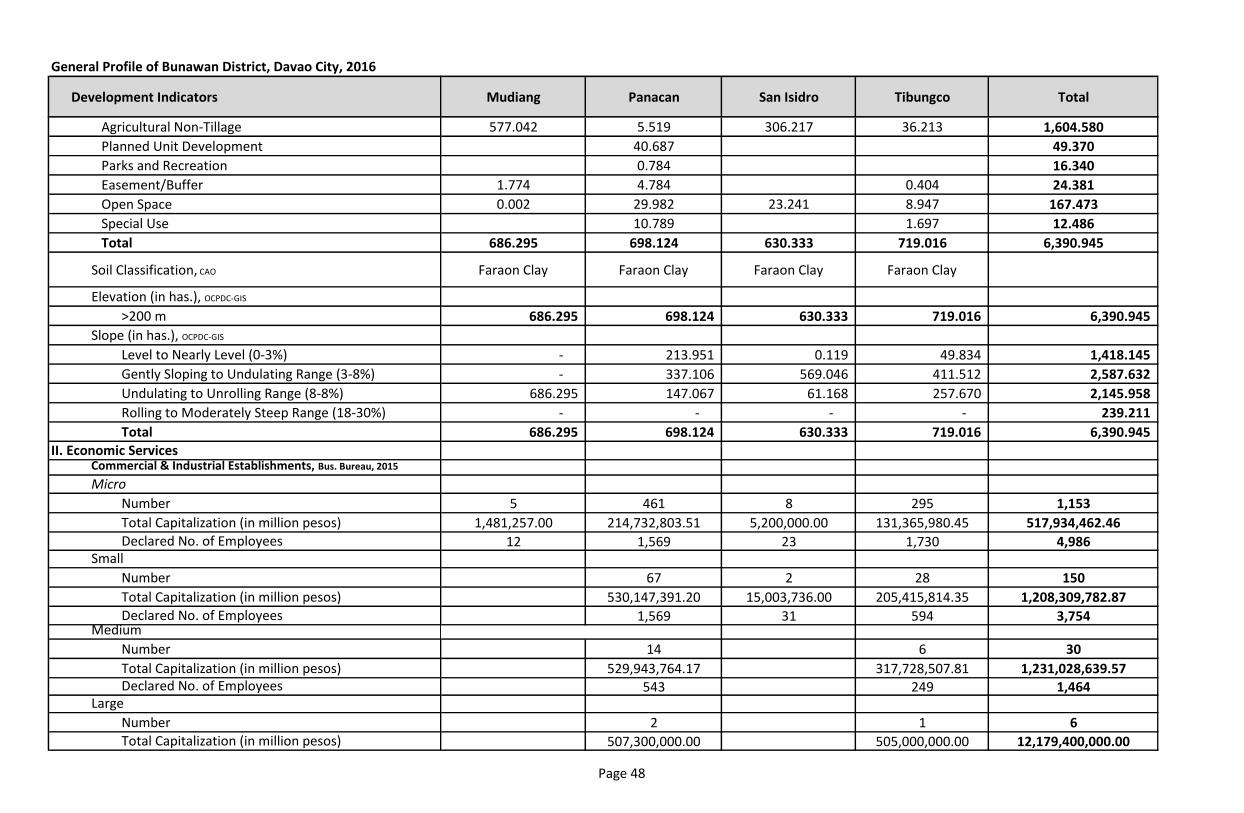
Development Indicators
General Profile of Bunawan District, Davao City, 2016
Agricultural Non-Tillage
Planned Unit Development
Parks and Recreation
Easement/Buffer
Open Space
Special Use
Total
Soil Classification, CAO
Elevation (in has.), OCPDC-GIS
>200 m
Slope (in has.), OCPDC-GIS
Level to Nearly Level (0-3%)
Gently Sloping to Undulating Range (3-8%)
Undulating to Unrolling Range (8-8%)
Rolling to Moderately Steep Range (18-30%)
Total
II. Economic ServicesCommercial & Industrial Establishments, Bus. Bureau, 2015
Micro
Number
Total Capitalization (in million pesos)
Declared No. of EmployeesSmall
Number
Total Capitalization (in million pesos)Declared No. of Employees
Medium
Number
Total Capitalization (in million pesos)Declared No. of Employees
Large
NumberTotal Capitalization (in million pesos)
Mudiang Panacan San Isidro Tibungco Total
577.042 5.519 306.217 36.213 1,604.580
40.687 49.370
0.784 16.340
1.774 4.784 0.404 24.381
0.002 29.982 23.241 8.947 167.473
10.789 1.697 12.486
686.295 698.124 630.333 719.016 6,390.945
Faraon Clay Faraon Clay Faraon Clay Faraon Clay
686.295 698.124 630.333 719.016 6,390.945
- 213.951 0.119 49.834 1,418.145
- 337.106 569.046 411.512 2,587.632
686.295 147.067 61.168 257.670 2,145.958
- - - - 239.211
686.295 698.124 630.333 719.016 6,390.945
5 461 8 295 1,153
1,481,257.00 214,732,803.51 5,200,000.00 131,365,980.45 517,934,462.46
12 1,569 23 1,730 4,986
67 2 28 150
530,147,391.20 15,003,736.00 205,415,814.35 1,208,309,782.87
1,569 31 594 3,754
14 6 30
529,943,764.17 317,728,507.81 1,231,028,639.57543 249 1,464
2 1 6
507,300,000.00 505,000,000.00 12,179,400,000.00
Page 48
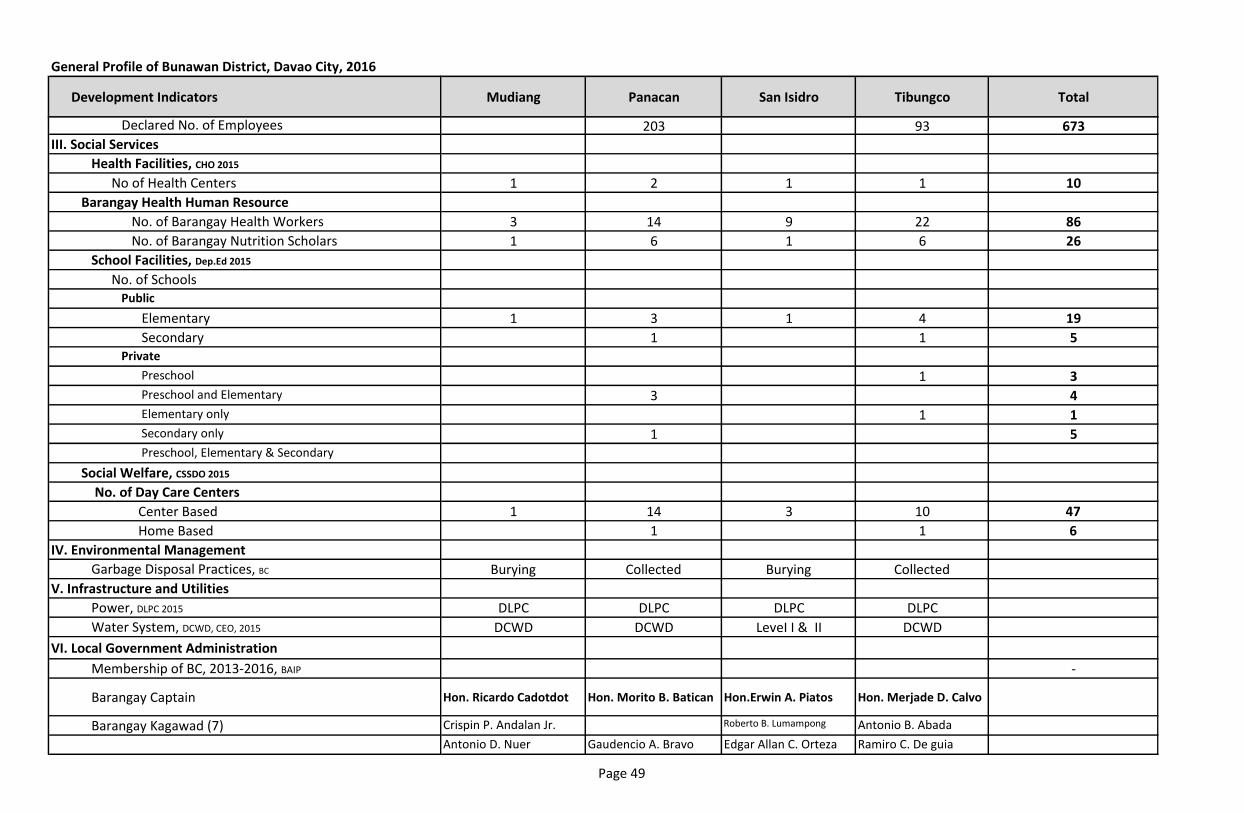
Development Indicators
General Profile of Bunawan District, Davao City, 2016
Declared No. of Employees
III. Social Services
Health Facilities, CHO 2015
No of Health Centers
Barangay Health Human Resource
No. of Barangay Health Workers
No. of Barangay Nutrition Scholars
School Facilities, Dep.Ed 2015
No. of SchoolsPublic
Elementary
SecondaryPrivate
Preschool
Preschool and Elementary
Elementary only
Secondary only
Preschool, Elementary & Secondary
Social Welfare, CSSDO 2015
No. of Day Care Centers
Center Based
Home Based
IV. Environmental Management
Garbage Disposal Practices, BC
V. Infrastructure and Utilities
Power, DLPC 2015
Water System, DCWD, CEO, 2015
VI. Local Government Administration
Membership of BC, 2013-2016, BAIP
Barangay Captain
Barangay Kagawad (7)
Mudiang Panacan San Isidro Tibungco Total
203 93 673
1 2 1 1 10
3 14 9 22 86
1 6 1 6 26
1 3 1 4 19
1 1 5
1 3
3 4
1 1
1 5
1 14 3 10 47
1 1 6
Burying Collected Burying Collected
DLPC DLPC DLPC DLPC
DCWD DCWD LeveI I & II DCWD
-
Hon. Ricardo Cadotdot Hon. Morito B. Batican Hon.Erwin A. Piatos Hon. Merjade D. Calvo
Crispin P. Andalan Jr. Roberto B. Lumampong Antonio B. Abada
Antonio D. Nuer Gaudencio A. Bravo Edgar Allan C. Orteza Ramiro C. De guia
Page 49
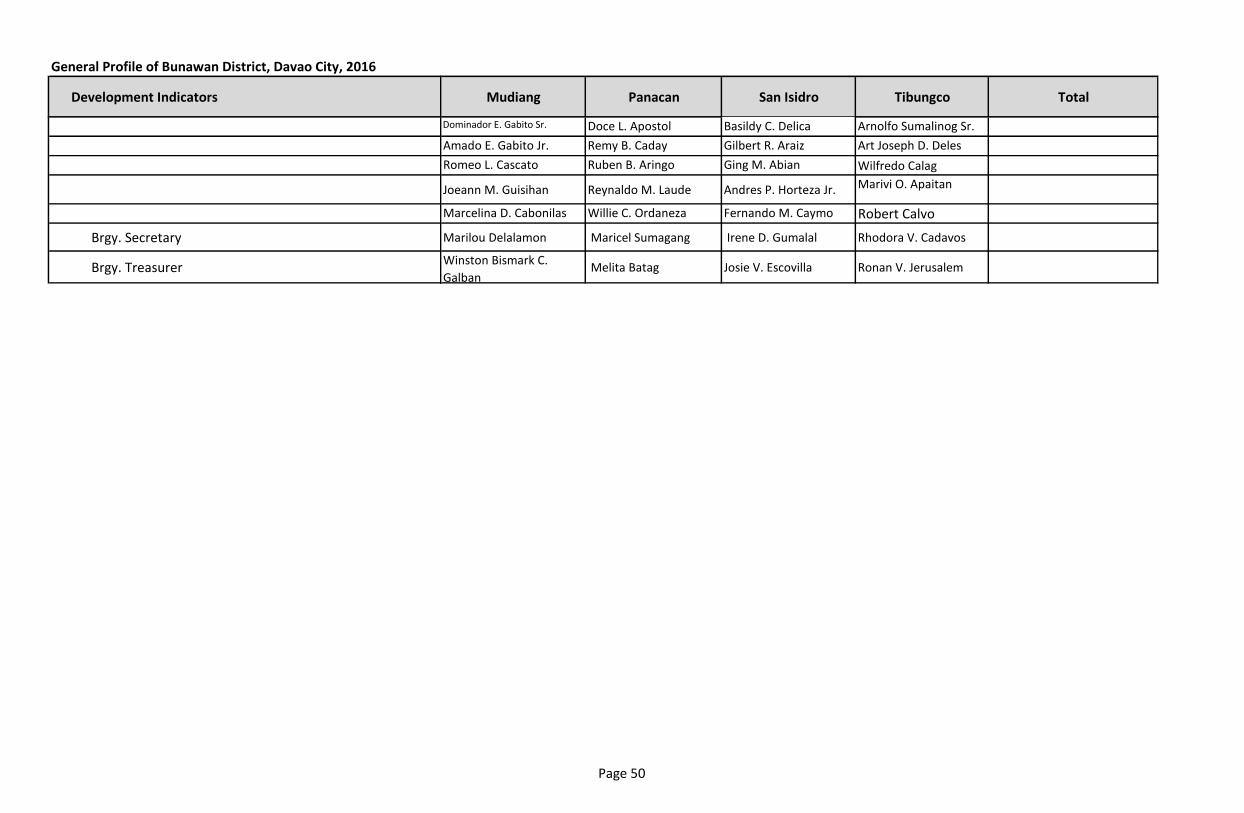
Development Indicators
General Profile of Bunawan District, Davao City, 2016
Brgy. Secretary
Brgy. Treasurer
Mudiang Panacan San Isidro Tibungco Total
Dominador E. Gabito Sr. Doce L. Apostol Basildy C. Delica Arnolfo Sumalinog Sr.
Amado E. Gabito Jr. Remy B. Caday Gilbert R. Araiz Art Joseph D. Deles
Romeo L. Cascato Ruben B. Aringo Ging M. Abian Wilfredo Calag
Joeann M. Guisihan Reynaldo M. Laude Andres P. Horteza Jr. Marivi O. Apaitan
Marcelina D. Cabonilas Willie C. Ordaneza Fernando M. Caymo Robert Calvo
Marilou Delalamon Maricel Sumagang Irene D. Gumalal Rhodora V. Cadavos
Winston Bismark C.
Galban Melita Batag Josie V. Escovilla Ronan V. Jerusalem
Page 50
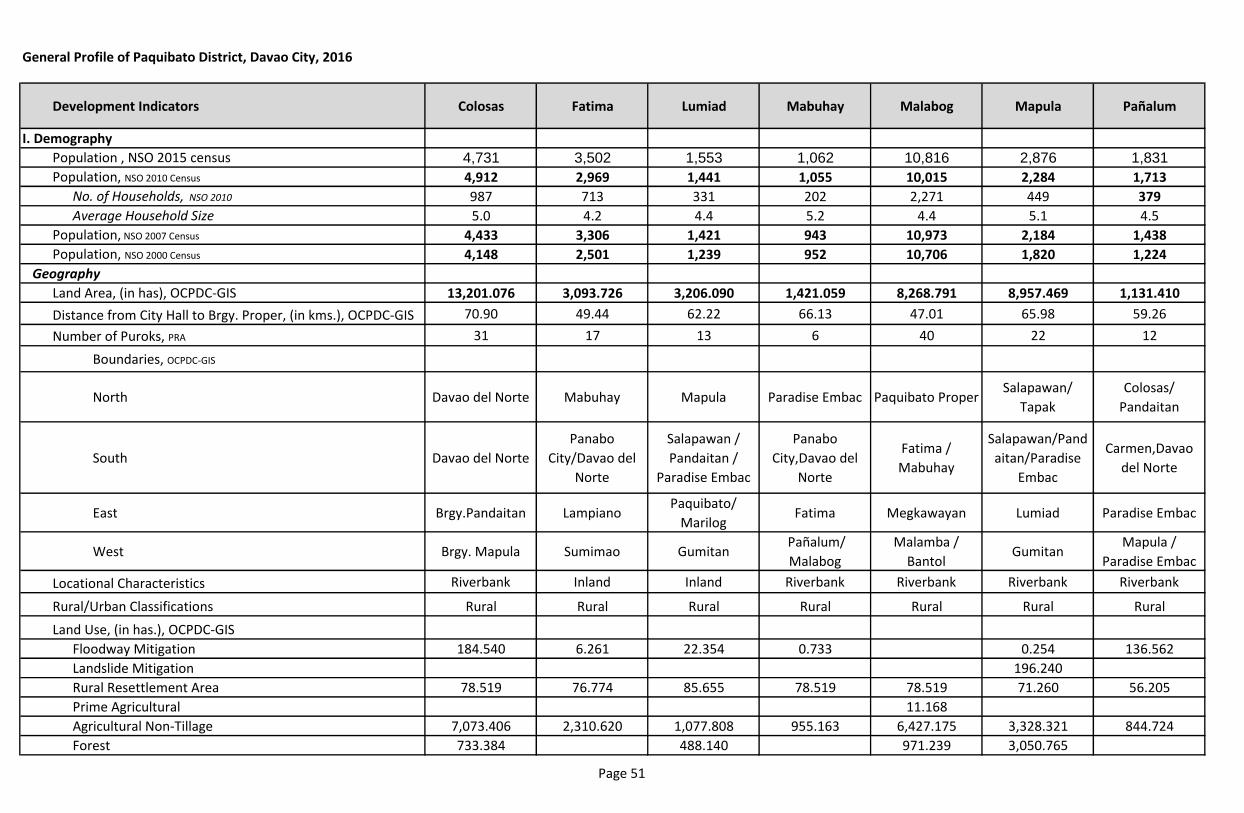
Development Indicators Colosas Fatima Lumiad Mabuhay Malabog Mapula Pañalum
I. Demography
Population , NSO 2015 census 4,731 3,502 1,553 1,062 10,816 2,876 1,831
Population, NSO 2010 Census 4,912 2,969 1,441 1,055 10,015 2,284 1,713
No. of Households, NSO 2010 987 713 331 202 2,271 449 379
Average Household Size 5.0 4.2 4.4 5.2 4.4 5.1 4.5
Population, NSO 2007 Census 4,433 3,306 1,421 943 10,973 2,184 1,438
Population, NSO 2000 Census 4,148 2,501 1,239 952 10,706 1,820 1,224
Geography
Land Area, (in has), OCPDC-GIS 13,201.076 3,093.726 3,206.090 1,421.059 8,268.791 8,957.469 1,131.410
Distance from City Hall to Brgy. Proper, (in kms.), OCPDC-GIS 70.90 49.44 62.22 66.13 47.01 65.98 59.26
Number of Puroks, PRA 31 17 13 6 40 22 12
Boundaries, OCPDC-GIS
North Davao del Norte Mabuhay Mapula Paradise Embac Paquibato ProperSalapawan/
Tapak
Colosas/
Pandaitan
South Davao del Norte
Panabo
City/Davao del
Norte
Salapawan /
Pandaitan /
Paradise Embac
Panabo
City,Davao del
Norte
Fatima /
Mabuhay
Salapawan/Pand
aitan/Paradise
Embac
Carmen,Davao
del Norte
East Brgy.Pandaitan LampianoPaquibato/
MarilogFatima Megkawayan Lumiad Paradise Embac
West Brgy. Mapula Sumimao Gumitan Pañalum/
Malabog
Malamba /
BantolGumitan
Mapula /
Paradise Embac
Locational Characteristics Riverbank Inland Inland Riverbank Riverbank Riverbank Riverbank
Rural/Urban Classifications Rural Rural Rural Rural Rural Rural Rural
Land Use, (in has.), OCPDC-GIS
Floodway Mitigation 184.540 6.261 22.354 0.733 0.254 136.562
Landslide Mitigation 196.240
Rural Resettlement Area 78.519 76.774 85.655 78.519 78.519 71.260 56.205
Prime Agricultural 11.168
Agricultural Non-Tillage 7,073.406 2,310.620 1,077.808 955.163 6,427.175 3,328.321 844.724
Forest 733.384 488.140 971.239 3,050.765
General Profile of Paquibato District, Davao City, 2016
Page 51
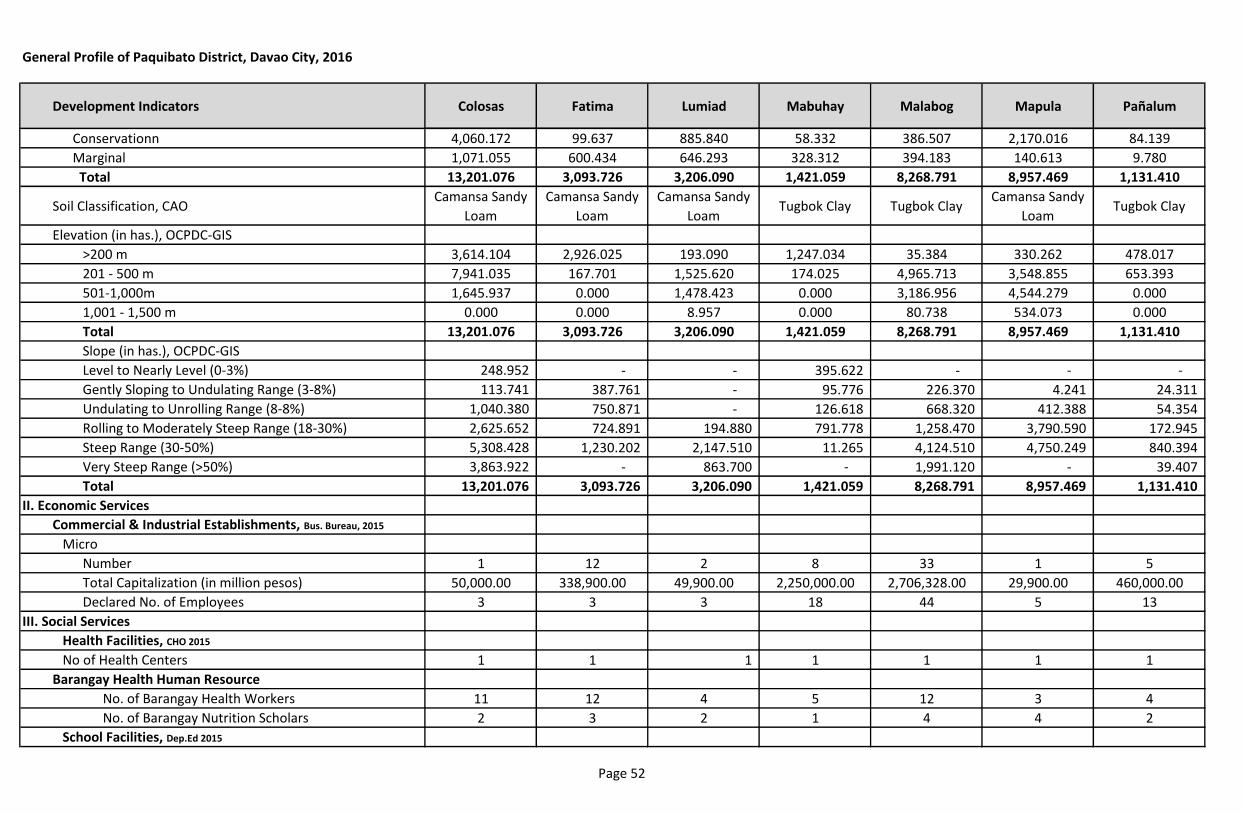
Development Indicators Colosas Fatima Lumiad Mabuhay Malabog Mapula Pañalum
General Profile of Paquibato District, Davao City, 2016
Conservationn 4,060.172 99.637 885.840 58.332 386.507 2,170.016 84.139
Marginal 1,071.055 600.434 646.293 328.312 394.183 140.613 9.780
Total 13,201.076 3,093.726 3,206.090 1,421.059 8,268.791 8,957.469 1,131.410
Soil Classification, CAOCamansa Sandy
Loam
Camansa Sandy
Loam
Camansa Sandy
LoamTugbok Clay Tugbok Clay
Camansa Sandy
LoamTugbok Clay
Elevation (in has.), OCPDC-GIS
>200 m 3,614.104 2,926.025 193.090 1,247.034 35.384 330.262 478.017
201 - 500 m 7,941.035 167.701 1,525.620 174.025 4,965.713 3,548.855 653.393
501-1,000m 1,645.937 0.000 1,478.423 0.000 3,186.956 4,544.279 0.000
1,001 - 1,500 m 0.000 0.000 8.957 0.000 80.738 534.073 0.000
Total 13,201.076 3,093.726 3,206.090 1,421.059 8,268.791 8,957.469 1,131.410
Slope (in has.), OCPDC-GIS
Level to Nearly Level (0-3%) 248.952 - - 395.622 - - -
Gently Sloping to Undulating Range (3-8%) 113.741 387.761 - 95.776 226.370 4.241 24.311
Undulating to Unrolling Range (8-8%) 1,040.380 750.871 - 126.618 668.320 412.388 54.354
Rolling to Moderately Steep Range (18-30%) 2,625.652 724.891 194.880 791.778 1,258.470 3,790.590 172.945
Steep Range (30-50%) 5,308.428 1,230.202 2,147.510 11.265 4,124.510 4,750.249 840.394
Very Steep Range (>50%) 3,863.922 - 863.700 - 1,991.120 - 39.407
Total 13,201.076 3,093.726 3,206.090 1,421.059 8,268.791 8,957.469 1,131.410
II. Economic Services
Commercial & Industrial Establishments, Bus. Bureau, 2015
Micro
Number 1 12 2 8 33 1 5
Total Capitalization (in million pesos) 50,000.00 338,900.00 49,900.00 2,250,000.00 2,706,328.00 29,900.00 460,000.00
Declared No. of Employees 3 3 3 18 44 5 13
III. Social Services
Health Facilities, CHO 2015
No of Health Centers 1 1 1 1 1 1 1
Barangay Health Human Resource
No. of Barangay Health Workers 11 12 4 5 12 3 4
No. of Barangay Nutrition Scholars 2 3 2 1 4 4 2
School Facilities, Dep.Ed 2015
Page 52
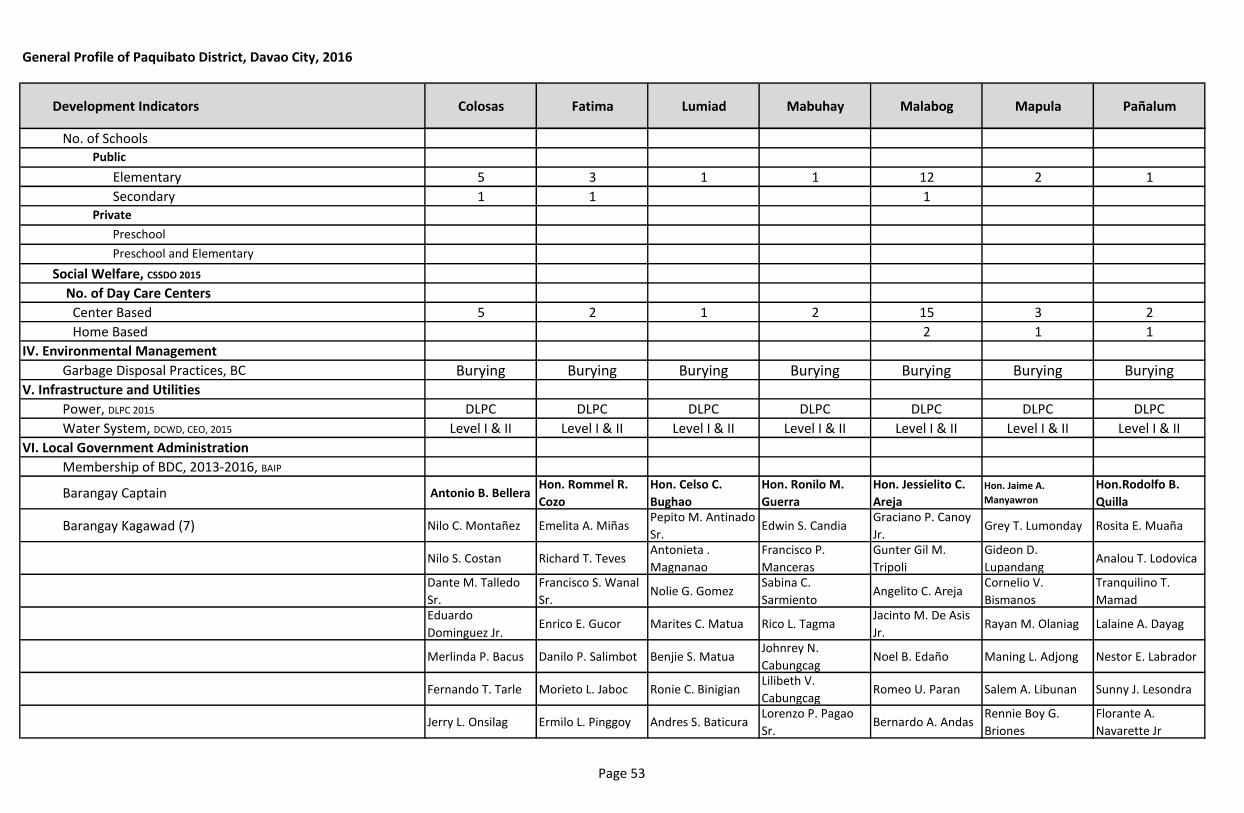
Development Indicators Colosas Fatima Lumiad Mabuhay Malabog Mapula Pañalum
General Profile of Paquibato District, Davao City, 2016
No. of SchoolsPublic
Elementary 5 3 1 1 12 2 1
Secondary 1 1 1Private
Preschool
Preschool and Elementary
Social Welfare, CSSDO 2015
No. of Day Care Centers
Center Based 5 2 1 2 15 3 2
Home Based 2 1 1
IV. Environmental Management
Garbage Disposal Practices, BC Burying Burying Burying Burying Burying Burying BuryingV. Infrastructure and Utilities
Power, DLPC 2015 DLPC DLPC DLPC DLPC DLPC DLPC DLPC
Water System, DCWD, CEO, 2015 Level I & II Level I & II Level I & II Level I & II Level I & II Level I & II Level I & II
VI. Local Government Administration
Membership of BDC, 2013-2016, BAIP
Barangay Captain Antonio B. Bellera Hon. Rommel R.
Cozo
Hon. Celso C.
Bughao
Hon. Ronilo M.
Guerra
Hon. Jessielito C.
Areja
Hon. Jaime A.
Manyawron
Hon.Rodolfo B.
Quilla
Barangay Kagawad (7) Nilo C. Montañez Emelita A. MiñasPepito M. Antinado
Sr.Edwin S. Candia
Graciano P. Canoy
Jr.Grey T. Lumonday Rosita E. Muaña
Nilo S. Costan Richard T. TevesAntonieta .
Magnanao
Francisco P.
Manceras
Gunter Gil M.
Tripoli
Gideon D.
LupandangAnalou T. Lodovica
Dante M. Talledo
Sr.
Francisco S. Wanal
Sr.Nolie G. Gomez
Sabina C.
SarmientoAngelito C. Areja
Cornelio V.
Bismanos
Tranquilino T.
MamadEduardo
Dominguez Jr.Enrico E. Gucor Marites C. Matua Rico L. Tagma
Jacinto M. De Asis
Jr.Rayan M. Olaniag Lalaine A. Dayag
Merlinda P. Bacus Danilo P. Salimbot Benjie S. MatuaJohnrey N.
CabungcagNoel B. Edaño Maning L. Adjong Nestor E. Labrador
Fernando T. Tarle Morieto L. Jaboc Ronie C. BinigianLilibeth V.
CabungcagRomeo U. Paran Salem A. Libunan Sunny J. Lesondra
Jerry L. Onsilag Ermilo L. Pinggoy Andres S. BaticuraLorenzo P. Pagao
Sr.Bernardo A. Andas
Rennie Boy G.
Briones
Florante A.
Navarette Jr
Page 53
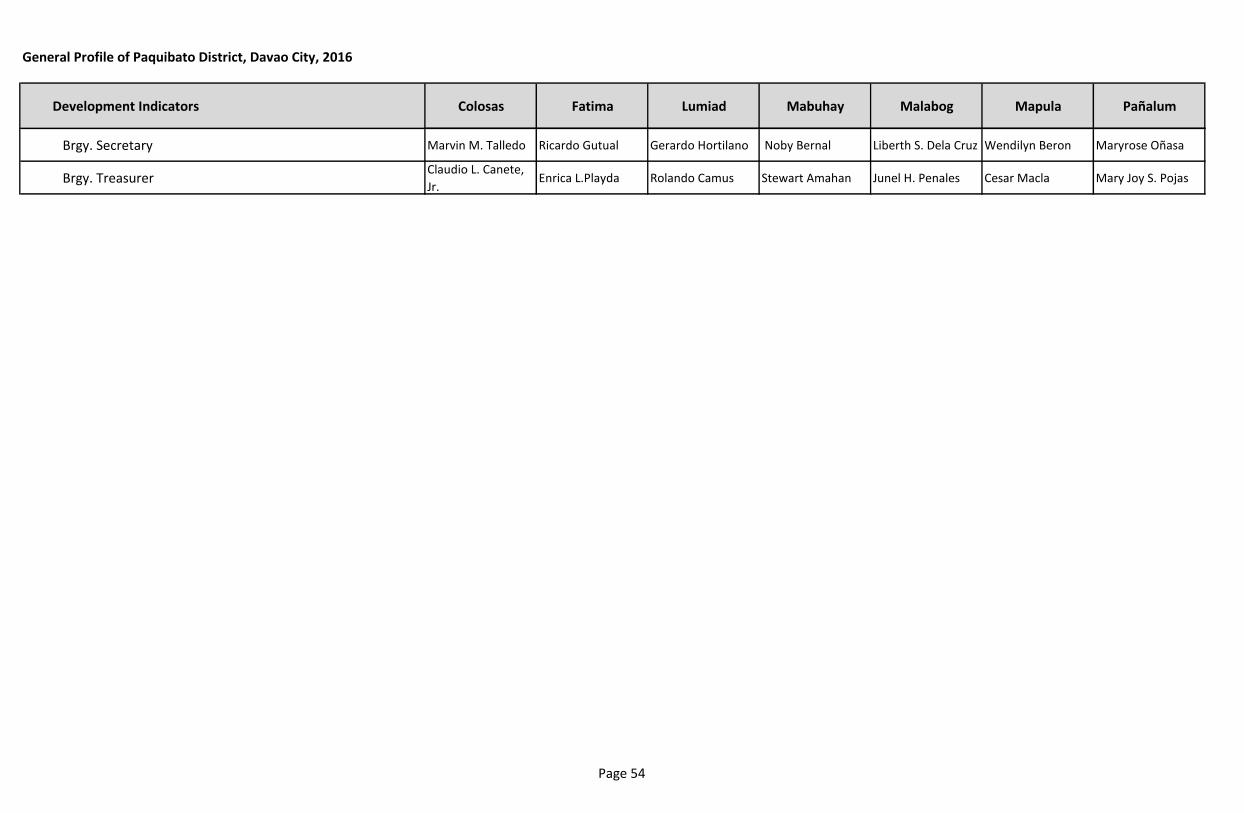
Development Indicators Colosas Fatima Lumiad Mabuhay Malabog Mapula Pañalum
General Profile of Paquibato District, Davao City, 2016
Brgy. Secretary Marvin M. Talledo Ricardo Gutual Gerardo Hortilano Noby Bernal Liberth S. Dela Cruz Wendilyn Beron Maryrose Oñasa
Brgy. TreasurerClaudio L. Canete,
Jr.Enrica L.Playda Rolando Camus Stewart Amahan Junel H. Penales Cesar Macla Mary Joy S. Pojas
Page 54
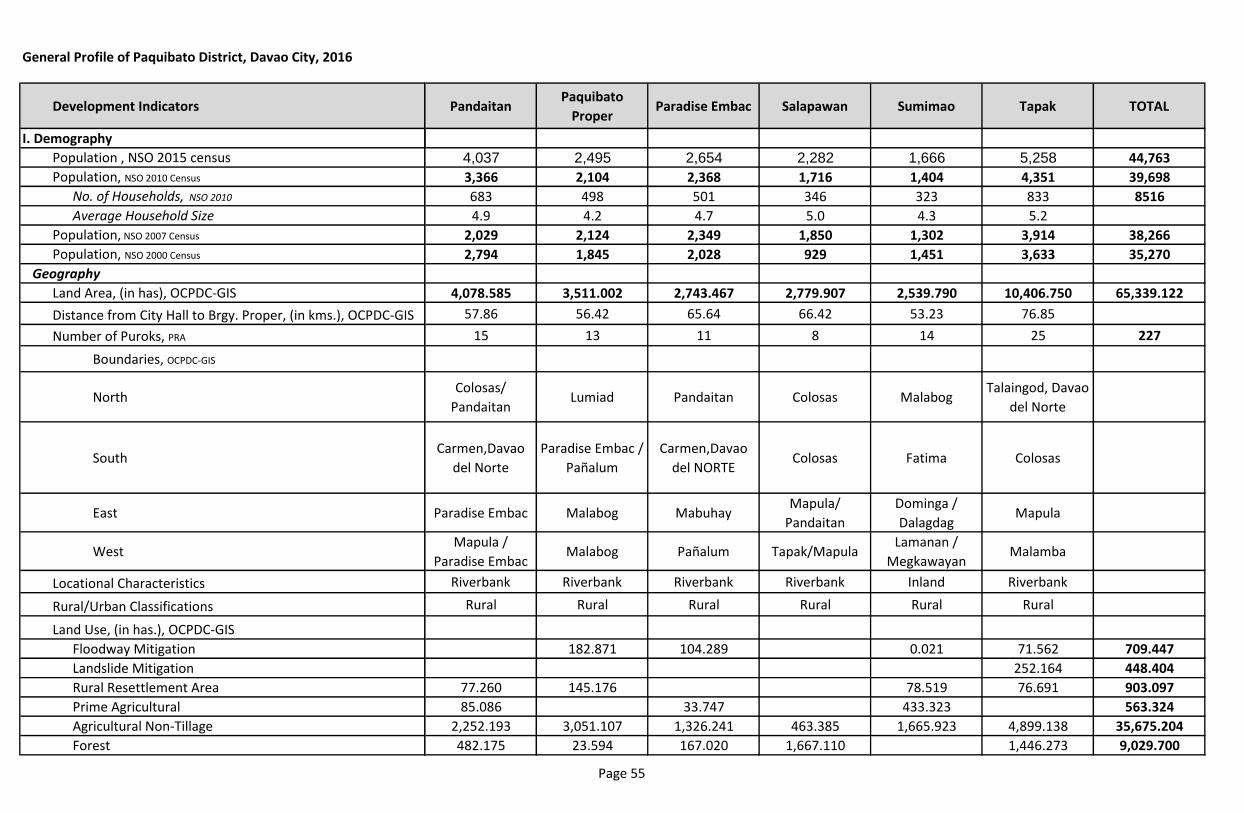
Development Indicators
I. Demography
Population , NSO 2015 census
Population, NSO 2010 Census
No. of Households, NSO 2010
Average Household Size
Population, NSO 2007 Census
Population, NSO 2000 Census
Geography
Land Area, (in has), OCPDC-GIS
Distance from City Hall to Brgy. Proper, (in kms.), OCPDC-GIS
Number of Puroks, PRA
Boundaries, OCPDC-GIS
North
South
East
West
Locational Characteristics
Rural/Urban Classifications
Land Use, (in has.), OCPDC-GIS
Floodway Mitigation
Landslide Mitigation
Rural Resettlement Area
Prime Agricultural
Agricultural Non-Tillage
Forest
General Profile of Paquibato District, Davao City, 2016
PandaitanPaquibato
ProperParadise Embac Salapawan Sumimao Tapak TOTAL
4,037 2,495 2,654 2,282 1,666 5,258 44,763
3,366 2,104 2,368 1,716 1,404 4,351 39,698
683 498 501 346 323 833 8516
4.9 4.2 4.7 5.0 4.3 5.2
2,029 2,124 2,349 1,850 1,302 3,914 38,266
2,794 1,845 2,028 929 1,451 3,633 35,270
4,078.585 3,511.002 2,743.467 2,779.907 2,539.790 10,406.750 65,339.122
57.86 56.42 65.64 66.42 53.23 76.85
15 13 11 8 14 25 227
Colosas/
PandaitanLumiad Pandaitan Colosas Malabog
Talaingod, Davao
del Norte
Carmen,Davao
del Norte
Paradise Embac /
Pañalum
Carmen,Davao
del NORTEColosas Fatima Colosas
Paradise Embac Malabog MabuhayMapula/
Pandaitan
Dominga /
DalagdagMapula
Mapula /
Paradise EmbacMalabog Pañalum Tapak/Mapula
Lamanan /
MegkawayanMalamba
Riverbank Riverbank Riverbank Riverbank Inland Riverbank
Rural Rural Rural Rural Rural Rural
182.871 104.289 0.021 71.562 709.447
252.164 448.404
77.260 145.176 78.519 76.691 903.097
85.086 33.747 433.323 563.324
2,252.193 3,051.107 1,326.241 463.385 1,665.923 4,899.138 35,675.204
482.175 23.594 167.020 1,667.110 1,446.273 9,029.700
Page 55
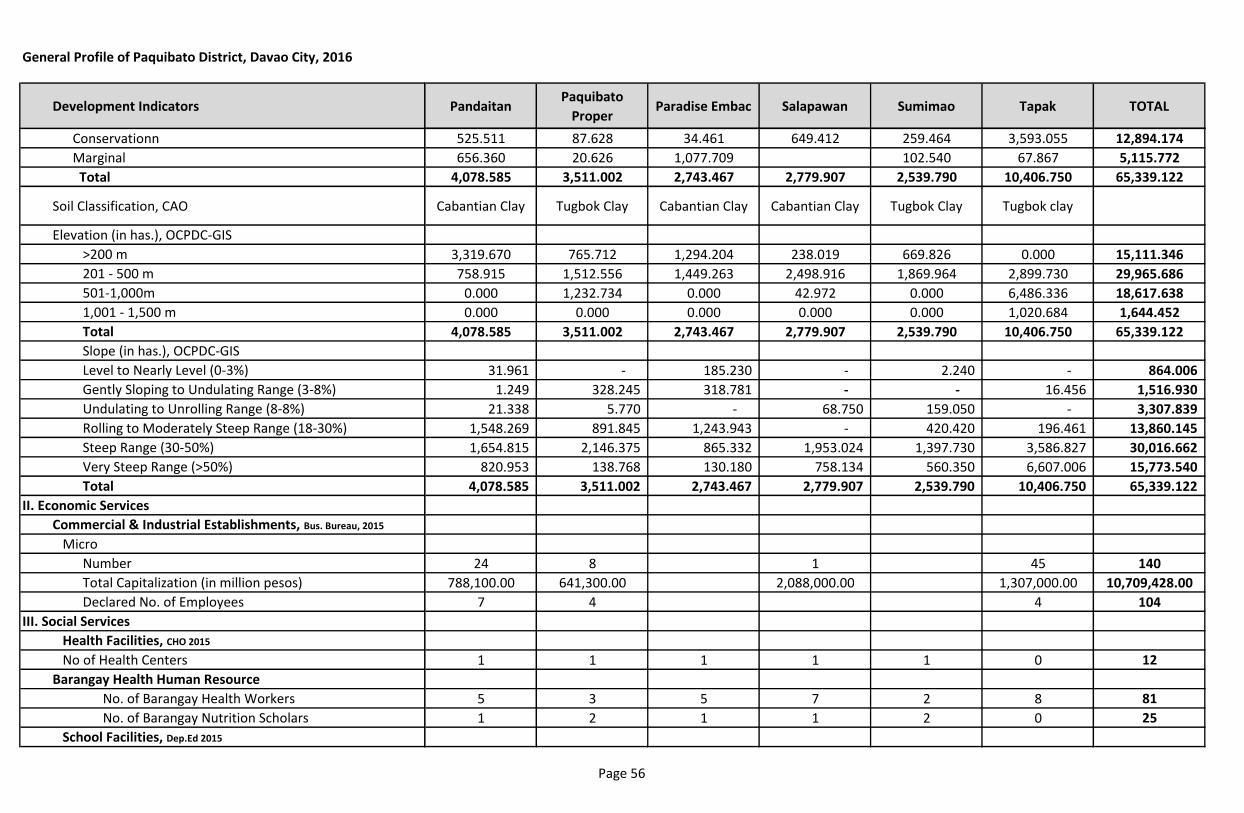
Development Indicators
General Profile of Paquibato District, Davao City, 2016
Conservationn
Marginal
Total
Soil Classification, CAO
Elevation (in has.), OCPDC-GIS
>200 m
201 - 500 m
501-1,000m
1,001 - 1,500 m
Total
Slope (in has.), OCPDC-GIS
Level to Nearly Level (0-3%)
Gently Sloping to Undulating Range (3-8%)
Undulating to Unrolling Range (8-8%)
Rolling to Moderately Steep Range (18-30%)
Steep Range (30-50%)
Very Steep Range (>50%)
Total
II. Economic Services
Commercial & Industrial Establishments, Bus. Bureau, 2015
Micro
Number
Total Capitalization (in million pesos)
Declared No. of Employees
III. Social Services
Health Facilities, CHO 2015
No of Health Centers
Barangay Health Human Resource
No. of Barangay Health Workers
No. of Barangay Nutrition Scholars
School Facilities, Dep.Ed 2015
PandaitanPaquibato
ProperParadise Embac Salapawan Sumimao Tapak TOTAL
525.511 87.628 34.461 649.412 259.464 3,593.055 12,894.174
656.360 20.626 1,077.709 102.540 67.867 5,115.772
4,078.585 3,511.002 2,743.467 2,779.907 2,539.790 10,406.750 65,339.122
Cabantian Clay Tugbok Clay Cabantian Clay Cabantian Clay Tugbok Clay Tugbok clay
3,319.670 765.712 1,294.204 238.019 669.826 0.000 15,111.346
758.915 1,512.556 1,449.263 2,498.916 1,869.964 2,899.730 29,965.686
0.000 1,232.734 0.000 42.972 0.000 6,486.336 18,617.638
0.000 0.000 0.000 0.000 0.000 1,020.684 1,644.452
4,078.585 3,511.002 2,743.467 2,779.907 2,539.790 10,406.750 65,339.122
31.961 - 185.230 - 2.240 - 864.006
1.249 328.245 318.781 - - 16.456 1,516.930
21.338 5.770 - 68.750 159.050 - 3,307.839
1,548.269 891.845 1,243.943 - 420.420 196.461 13,860.145
1,654.815 2,146.375 865.332 1,953.024 1,397.730 3,586.827 30,016.662
820.953 138.768 130.180 758.134 560.350 6,607.006 15,773.540
4,078.585 3,511.002 2,743.467 2,779.907 2,539.790 10,406.750 65,339.122
24 8 1 45 140
788,100.00 641,300.00 2,088,000.00 1,307,000.00 10,709,428.00
7 4 4 104
1 1 1 1 1 0 12
5 3 5 7 2 8 81
1 2 1 1 2 0 25
Page 56
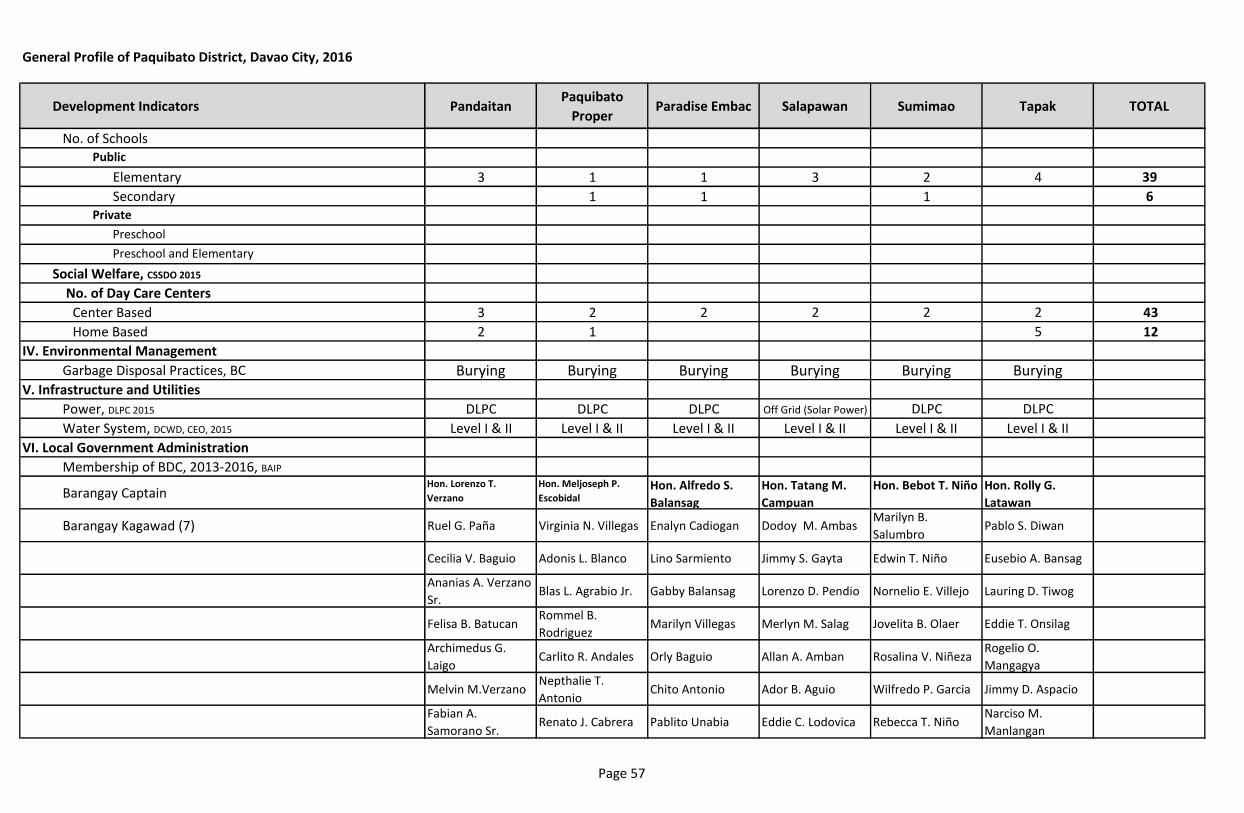
Development Indicators
General Profile of Paquibato District, Davao City, 2016
No. of SchoolsPublic
Elementary
SecondaryPrivate
Preschool
Preschool and Elementary
Social Welfare, CSSDO 2015
No. of Day Care Centers
Center Based
Home Based
IV. Environmental Management
Garbage Disposal Practices, BC
V. Infrastructure and Utilities
Power, DLPC 2015
Water System, DCWD, CEO, 2015
VI. Local Government Administration
Membership of BDC, 2013-2016, BAIP
Barangay Captain
Barangay Kagawad (7)
PandaitanPaquibato
ProperParadise Embac Salapawan Sumimao Tapak TOTAL
3 1 1 3 2 4 39
1 1 1 6
3 2 2 2 2 2 43
2 1 5 12
Burying Burying Burying Burying Burying Burying
DLPC DLPC DLPC Off Grid (Solar Power) DLPC DLPC
Level I & II Level I & II Level I & II Level I & II Level I & II Level I & II
Hon. Lorenzo T.
Verzano
Hon. Meljoseph P.
EscobidalHon. Alfredo S.
Balansag
Hon. Tatang M.
Campuan
Hon. Bebot T. Niño Hon. Rolly G.
Latawan
Ruel G. Paña Virginia N. Villegas Enalyn Cadiogan Dodoy M. AmbasMarilyn B.
SalumbroPablo S. Diwan
Cecilia V. Baguio Adonis L. Blanco Lino Sarmiento Jimmy S. Gayta Edwin T. Niño Eusebio A. Bansag
Ananias A. Verzano
Sr.Blas L. Agrabio Jr. Gabby Balansag Lorenzo D. Pendio Nornelio E. Villejo Lauring D. Tiwog
Felisa B. BatucanRommel B.
RodriguezMarilyn Villegas Merlyn M. Salag Jovelita B. Olaer Eddie T. Onsilag
Archimedus G.
LaigoCarlito R. Andales Orly Baguio Allan A. Amban Rosalina V. Niñeza
Rogelio O.
Mangagya
Melvin M.VerzanoNepthalie T.
AntonioChito Antonio Ador B. Aguio Wilfredo P. Garcia Jimmy D. Aspacio
Fabian A.
Samorano Sr.Renato J. Cabrera Pablito Unabia Eddie C. Lodovica Rebecca T. Niño
Narciso M.
Manlangan
Page 57
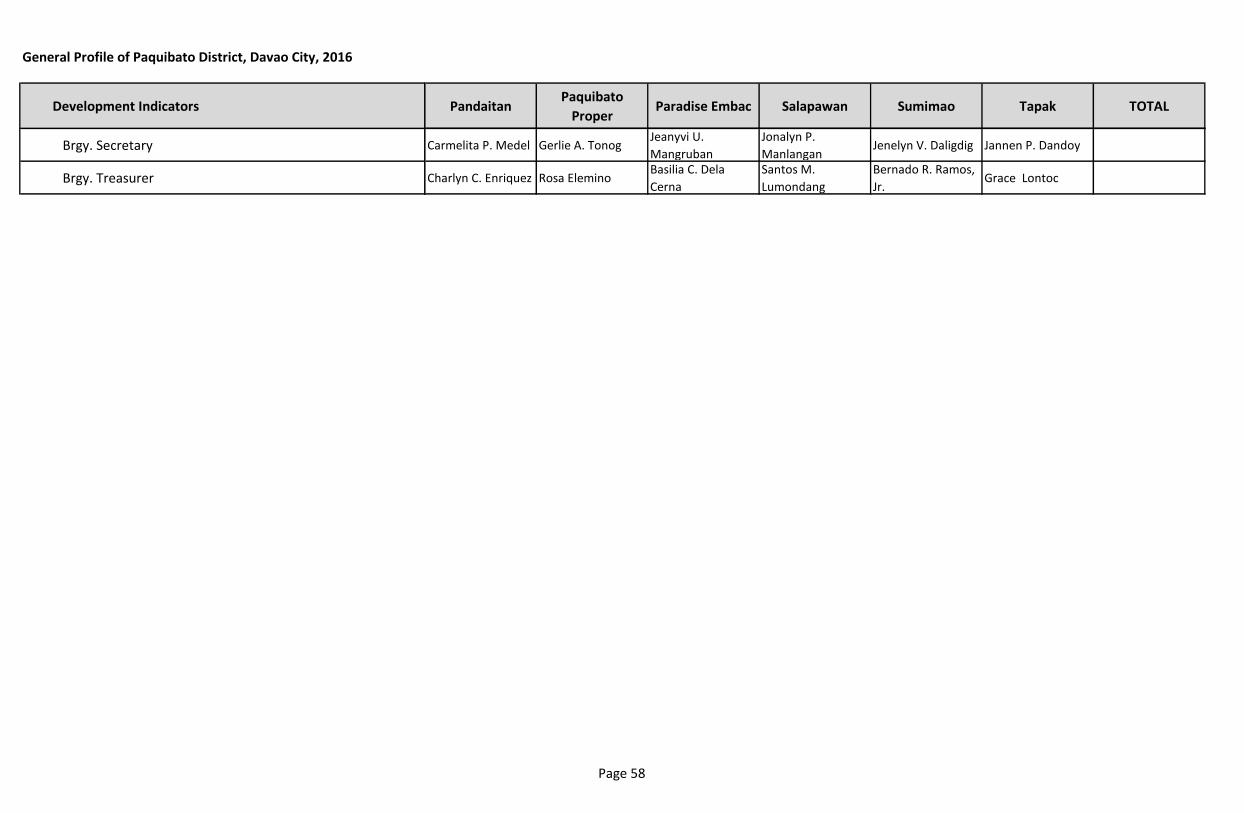
Development Indicators
General Profile of Paquibato District, Davao City, 2016
Brgy. Secretary
Brgy. Treasurer
PandaitanPaquibato
ProperParadise Embac Salapawan Sumimao Tapak TOTAL
Carmelita P. Medel Gerlie A. TonogJeanyvi U.
Mangruban
Jonalyn P.
ManlanganJenelyn V. Daligdig Jannen P. Dandoy
Charlyn C. Enriquez Rosa EleminoBasilia C. Dela
Cerna
Santos M.
Lumondang
Bernado R. Ramos,
Jr.Grace Lontoc
Page 58
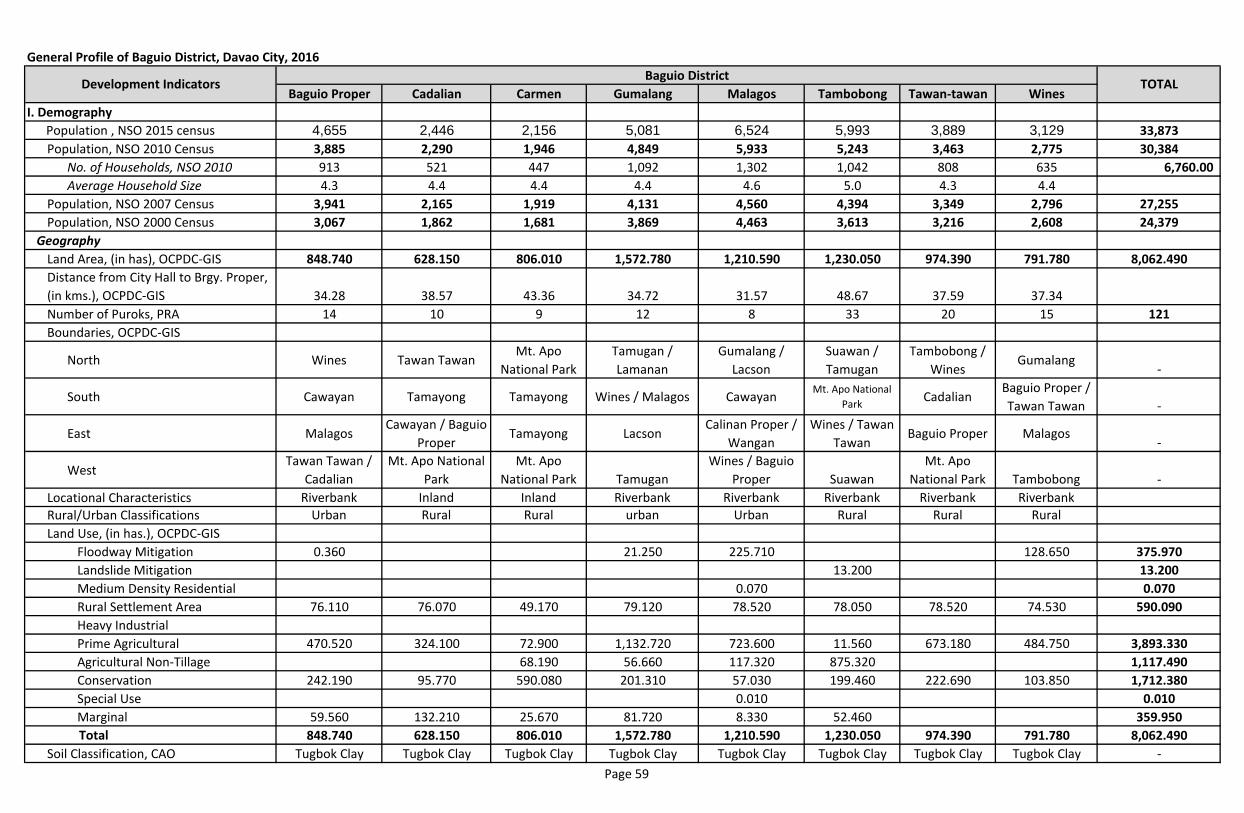
General Profile of Baguio District, Davao City, 2016
Baguio Proper Cadalian Carmen Gumalang Malagos Tambobong Tawan-tawan Wines
I. Demography
Population , NSO 2015 census 4,655 2,446 2,156 5,081 6,524 5,993 3,889 3,129 33,873
Population, NSO 2010 Census 3,885 2,290 1,946 4,849 5,933 5,243 3,463 2,775 30,384
No. of Households, NSO 2010 913 521 447 1,092 1,302 1,042 808 635 6,760.00
Average Household Size 4.3 4.4 4.4 4.4 4.6 5.0 4.3 4.4
Population, NSO 2007 Census 3,941 2,165 1,919 4,131 4,560 4,394 3,349 2,796 27,255
Population, NSO 2000 Census 3,067 1,862 1,681 3,869 4,463 3,613 3,216 2,608 24,379
Geography
Land Area, (in has), OCPDC-GIS 848.740 628.150 806.010 1,572.780 1,210.590 1,230.050 974.390 791.780 8,062.490
Distance from City Hall to Brgy. Proper,
(in kms.), OCPDC-GIS 34.28 38.57 43.36 34.72 31.57 48.67 37.59 37.34
Number of Puroks, PRA 14 10 9 12 8 33 20 15 121
Boundaries, OCPDC-GIS
North Wines Tawan TawanMt. Apo
National Park
Tamugan /
Lamanan
Gumalang /
Lacson
Suawan /
Tamugan
Tambobong /
WinesGumalang
-
South Cawayan Tamayong Tamayong Wines / Malagos CawayanMt. Apo National
ParkCadalian
Baguio Proper /
Tawan Tawan -
East MalagosCawayan / Baguio
ProperTamayong Lacson
Calinan Proper /
Wangan
Wines / Tawan
TawanBaguio Proper Malagos
-
WestTawan Tawan /
Cadalian
Mt. Apo National
Park
Mt. Apo
National Park Tamugan
Wines / Baguio
Proper Suawan
Mt. Apo
National Park Tambobong -
Locational Characteristics Riverbank Inland Inland Riverbank Riverbank Riverbank Riverbank Riverbank
Rural/Urban Classifications Urban Rural Rural urban Urban Rural Rural Rural
Land Use, (in has.), OCPDC-GIS
Floodway Mitigation 0.360 21.250 225.710 128.650 375.970
Landslide Mitigation 13.200 13.200
Medium Density Residential 0.070 0.070
Rural Settlement Area 76.110 76.070 49.170 79.120 78.520 78.050 78.520 74.530 590.090
Heavy Industrial
Prime Agricultural 470.520 324.100 72.900 1,132.720 723.600 11.560 673.180 484.750 3,893.330
Agricultural Non-Tillage 68.190 56.660 117.320 875.320 1,117.490
Conservation 242.190 95.770 590.080 201.310 57.030 199.460 222.690 103.850 1,712.380
Special Use 0.010 0.010
Marginal 59.560 132.210 25.670 81.720 8.330 52.460 359.950
Total 848.740 628.150 806.010 1,572.780 1,210.590 1,230.050 974.390 791.780 8,062.490
Soil Classification, CAO Tugbok Clay Tugbok Clay Tugbok Clay Tugbok Clay Tugbok Clay Tugbok Clay Tugbok Clay Tugbok Clay -
Development IndicatorsBaguio District
TOTAL
Page 59
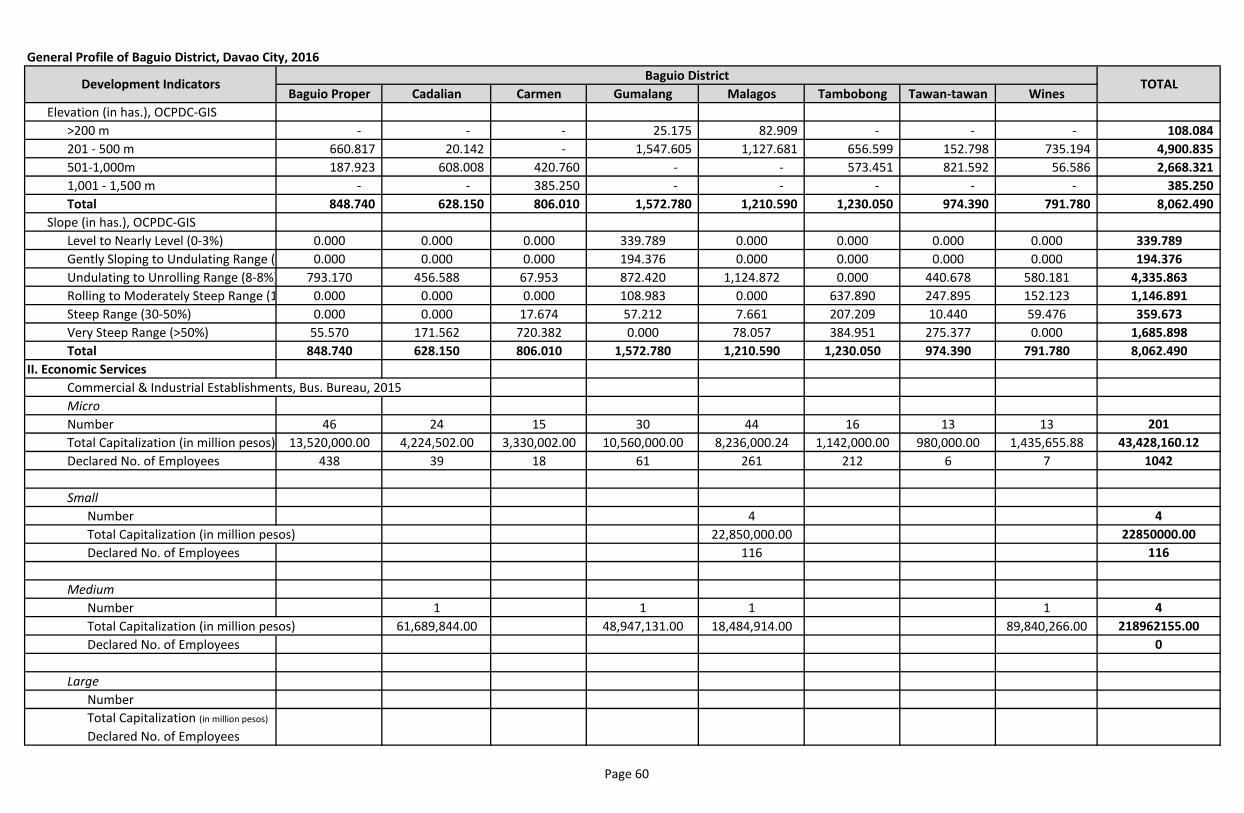
General Profile of Baguio District, Davao City, 2016
Baguio Proper Cadalian Carmen Gumalang Malagos Tambobong Tawan-tawan WinesDevelopment Indicators
Baguio DistrictTOTAL
Elevation (in has.), OCPDC-GIS
>200 m - - - 25.175 82.909 - - - 108.084
201 - 500 m 660.817 20.142 - 1,547.605 1,127.681 656.599 152.798 735.194 4,900.835
501-1,000m 187.923 608.008 420.760 - - 573.451 821.592 56.586 2,668.321
1,001 - 1,500 m - - 385.250 - - - - - 385.250
Total 848.740 628.150 806.010 1,572.780 1,210.590 1,230.050 974.390 791.780 8,062.490
Slope (in has.), OCPDC-GIS
Level to Nearly Level (0-3%) 0.000 0.000 0.000 339.789 0.000 0.000 0.000 0.000 339.789
Gently Sloping to Undulating Range (3-8%) 0.000 0.000 0.000 194.376 0.000 0.000 0.000 0.000 194.376
Undulating to Unrolling Range (8-8%) 793.170 456.588 67.953 872.420 1,124.872 0.000 440.678 580.181 4,335.863
Rolling to Moderately Steep Range (18-30%)0.000 0.000 0.000 108.983 0.000 637.890 247.895 152.123 1,146.891
Steep Range (30-50%) 0.000 0.000 17.674 57.212 7.661 207.209 10.440 59.476 359.673
Very Steep Range (>50%) 55.570 171.562 720.382 0.000 78.057 384.951 275.377 0.000 1,685.898
Total 848.740 628.150 806.010 1,572.780 1,210.590 1,230.050 974.390 791.780 8,062.490
II. Economic Services
Commercial & Industrial Establishments, Bus. Bureau, 2015
Micro
Number 46 24 15 30 44 16 13 13 201
Total Capitalization (in million pesos) 13,520,000.00 4,224,502.00 3,330,002.00 10,560,000.00 8,236,000.24 1,142,000.00 980,000.00 1,435,655.88 43,428,160.12
Declared No. of Employees 438 39 18 61 261 212 6 7 1042
Small
Number 4 4
Total Capitalization (in million pesos) 22,850,000.00 22850000.00
Declared No. of Employees 116 116
Medium
Number 1 1 1 1 4
Total Capitalization (in million pesos) 61,689,844.00 48,947,131.00 18,484,914.00 89,840,266.00 218962155.00
Declared No. of Employees 0
Large
Number
Total Capitalization (in million pesos)
Declared No. of Employees
Page 60
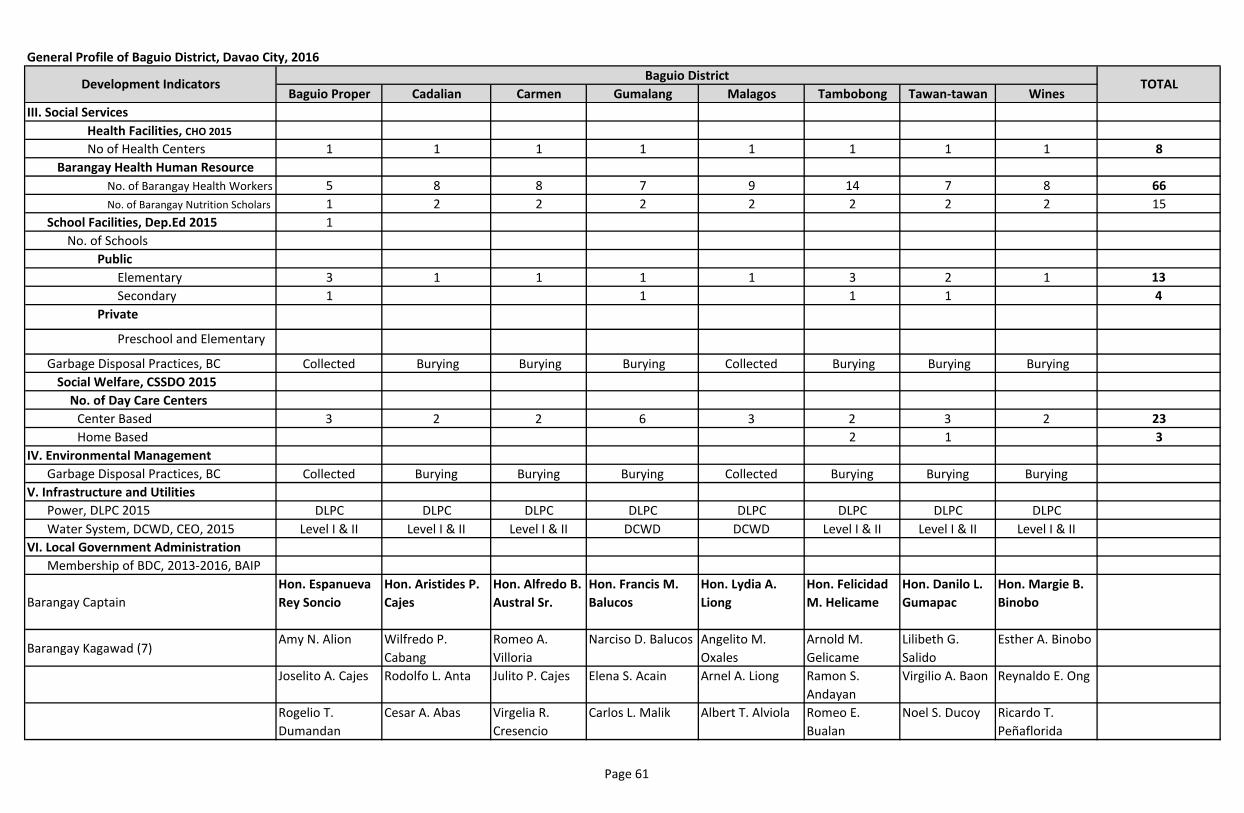
General Profile of Baguio District, Davao City, 2016
Baguio Proper Cadalian Carmen Gumalang Malagos Tambobong Tawan-tawan WinesDevelopment Indicators
Baguio DistrictTOTAL
III. Social Services
Health Facilities, CHO 2015
No of Health Centers 1 1 1 1 1 1 1 1 8
Barangay Health Human Resource
No. of Barangay Health Workers 5 8 8 7 9 14 7 8 66
No. of Barangay Nutrition Scholars 1 2 2 2 2 2 2 2 15
School Facilities, Dep.Ed 2015 1
No. of Schools
Public
Elementary 3 1 1 1 1 3 2 1 13
Secondary 1 1 1 1 4
Private
Preschool and Elementary
Garbage Disposal Practices, BC Collected Burying Burying Burying Collected Burying Burying Burying
Social Welfare, CSSDO 2015
No. of Day Care Centers
Center Based 3 2 2 6 3 2 3 2 23
Home Based 2 1 3
IV. Environmental Management
Garbage Disposal Practices, BC Collected Burying Burying Burying Collected Burying Burying Burying
V. Infrastructure and Utilities
Power, DLPC 2015 DLPC DLPC DLPC DLPC DLPC DLPC DLPC DLPC
Water System, DCWD, CEO, 2015 Level I & II Level I & II Level I & II DCWD DCWD Level I & II Level I & II Level I & II
VI. Local Government Administration
Membership of BDC, 2013-2016, BAIP
Barangay Captain
Hon. Espanueva
Rey Soncio
Hon. Aristides P.
Cajes
Hon. Alfredo B.
Austral Sr.
Hon. Francis M.
Balucos
Hon. Lydia A.
Liong
Hon. Felicidad
M. Helicame
Hon. Danilo L.
Gumapac
Hon. Margie B.
Binobo
Barangay Kagawad (7)Amy N. Alion Wilfredo P.
Cabang
Romeo A.
Villoria
Narciso D. Balucos Angelito M.
Oxales
Arnold M.
Gelicame
Lilibeth G.
Salido
Esther A. Binobo
Joselito A. Cajes Rodolfo L. Anta Julito P. Cajes Elena S. Acain Arnel A. Liong Ramon S.
Andayan
Virgilio A. Baon Reynaldo E. Ong
Rogelio T.
Dumandan
Cesar A. Abas Virgelia R.
Cresencio
Carlos L. Malik Albert T. Alviola Romeo E.
Bualan
Noel S. Ducoy Ricardo T.
Peñaflorida
Page 61
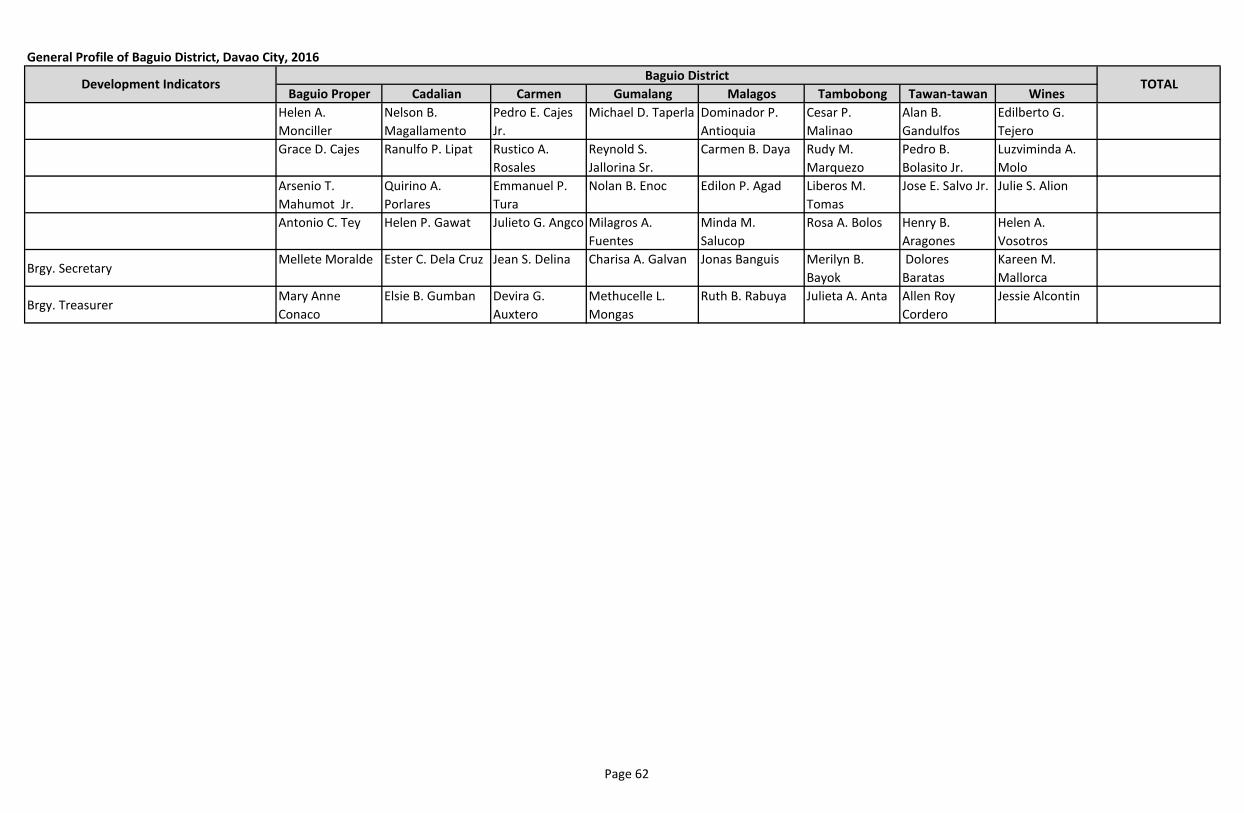
General Profile of Baguio District, Davao City, 2016
Baguio Proper Cadalian Carmen Gumalang Malagos Tambobong Tawan-tawan WinesDevelopment Indicators
Baguio DistrictTOTAL
Helen A.
Monciller
Nelson B.
Magallamento
Pedro E. Cajes
Jr.
Michael D. Taperla Dominador P.
Antioquia
Cesar P.
Malinao
Alan B.
Gandulfos
Edilberto G.
Tejero
Grace D. Cajes Ranulfo P. Lipat Rustico A.
Rosales
Reynold S.
Jallorina Sr.
Carmen B. Daya Rudy M.
Marquezo
Pedro B.
Bolasito Jr.
Luzviminda A.
Molo
Arsenio T.
Mahumot Jr.
Quirino A.
Porlares
Emmanuel P.
Tura
Nolan B. Enoc Edilon P. Agad Liberos M.
Tomas
Jose E. Salvo Jr. Julie S. Alion
Antonio C. Tey Helen P. Gawat Julieto G. Angco Milagros A.
Fuentes
Minda M.
Salucop
Rosa A. Bolos Henry B.
Aragones
Helen A.
Vosotros
Brgy. SecretaryMellete Moralde Ester C. Dela Cruz Jean S. Delina Charisa A. Galvan Jonas Banguis Merilyn B.
Bayok
Dolores
Baratas
Kareen M.
Mallorca
Brgy. TreasurerMary Anne
Conaco
Elsie B. Gumban Devira G.
Auxtero
Methucelle L.
Mongas
Ruth B. Rabuya Julieta A. Anta Allen Roy
Cordero
Jessie Alcontin
Page 62
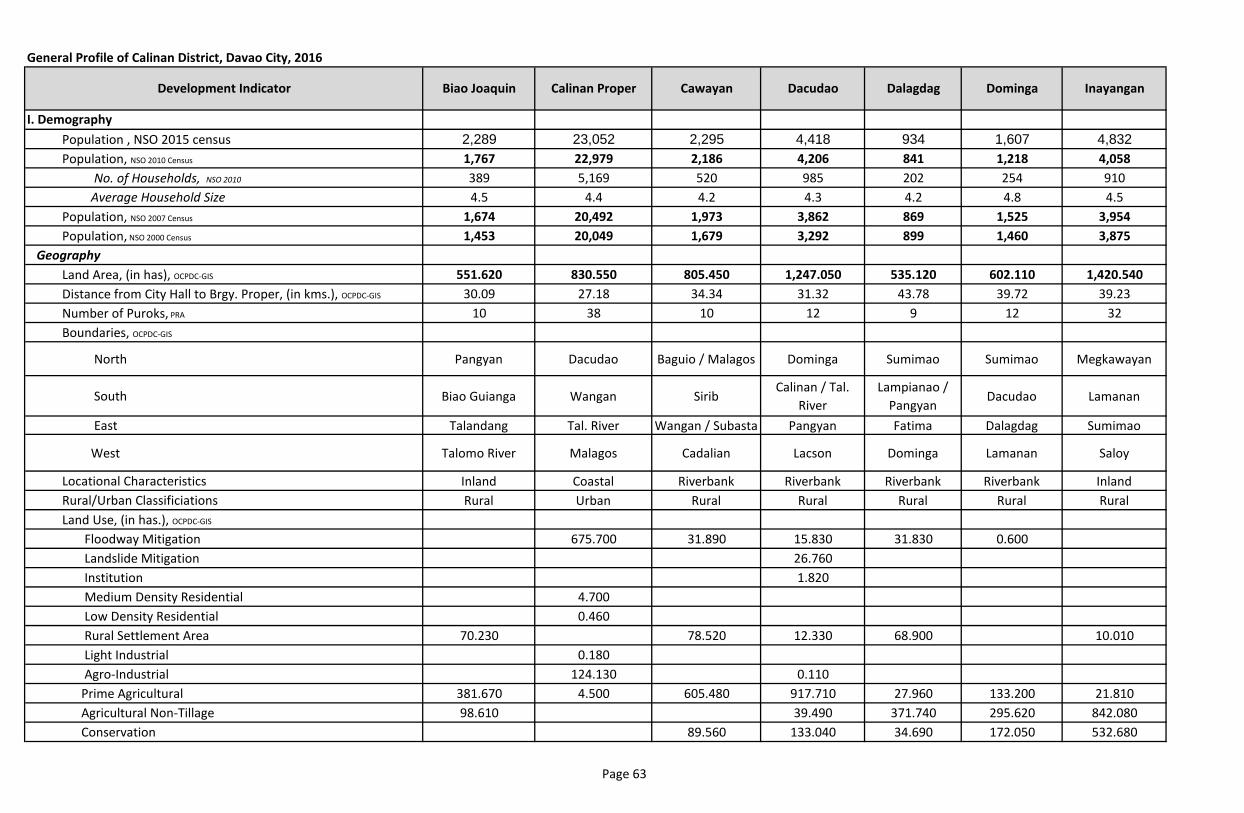
General Profile of Calinan District, Davao City, 2016
I. Demography
Population , NSO 2015 census 2,289 23,052 2,295 4,418 934 1,607 4,832
Population, NSO 2010 Census 1,767 22,979 2,186 4,206 841 1,218 4,058
No. of Households, NSO 2010 389 5,169 520 985 202 254 910
Average Household Size 4.5 4.4 4.2 4.3 4.2 4.8 4.5
Population, NSO 2007 Census 1,674 20,492 1,973 3,862 869 1,525 3,954
Population, NSO 2000 Census 1,453 20,049 1,679 3,292 899 1,460 3,875
Geography
Land Area, (in has), OCPDC-GIS 551.620 830.550 805.450 1,247.050 535.120 602.110 1,420.540
Distance from City Hall to Brgy. Proper, (in kms.), OCPDC-GIS 30.09 27.18 34.34 31.32 43.78 39.72 39.23
Number of Puroks, PRA 10 38 10 12 9 12 32
Boundaries, OCPDC-GIS
North Pangyan Dacudao Baguio / Malagos Dominga Sumimao Sumimao Megkawayan
South Biao Guianga Wangan SiribCalinan / Tal.
River
Lampianao /
PangyanDacudao Lamanan
East Talandang Tal. River Wangan / Subasta Pangyan Fatima Dalagdag Sumimao
West Talomo River Malagos Cadalian Lacson Dominga Lamanan Saloy
Locational Characteristics Inland Coastal Riverbank Riverbank Riverbank Riverbank Inland
Rural/Urban Classificiations Rural Urban Rural Rural Rural Rural Rural
Land Use, (in has.), OCPDC-GIS
Floodway Mitigation 675.700 31.890 15.830 31.830 0.600
Landslide Mitigation 26.760
Institution 1.820
Medium Density Residential 4.700
Low Density Residential 0.460
Rural Settlement Area 70.230 78.520 12.330 68.900 10.010
Light Industrial 0.180
Agro-Industrial 124.130 0.110
Prime Agricultural 381.670 4.500 605.480 917.710 27.960 133.200 21.810
Agricultural Non-Tillage 98.610 39.490 371.740 295.620 842.080
Conservation 89.560 133.040 34.690 172.050 532.680
Dominga InayanganDevelopment Indicator Biao Joaquin Calinan Proper Cawayan Dacudao Dalagdag
Page 63
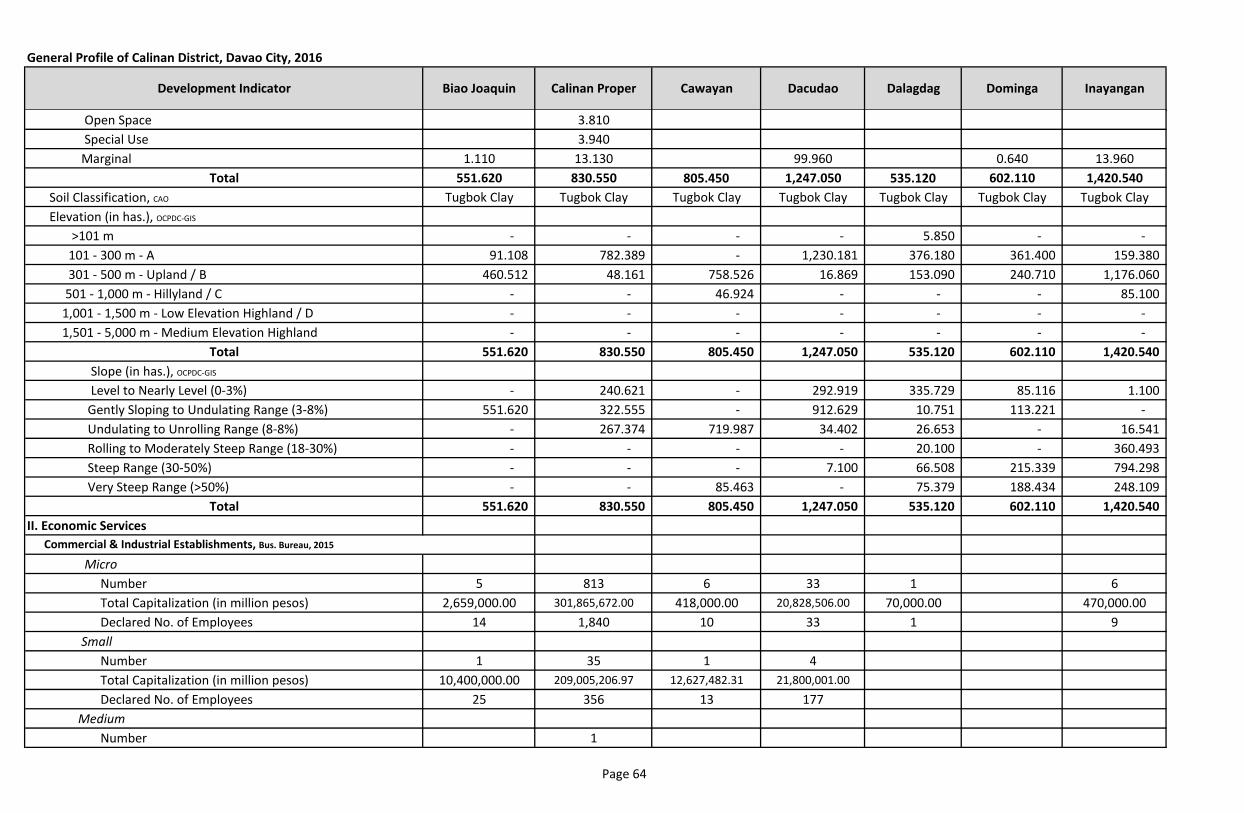
General Profile of Calinan District, Davao City, 2016
Dominga InayanganDevelopment Indicator Biao Joaquin Calinan Proper Cawayan Dacudao Dalagdag
Open Space 3.810
Special Use 3.940
Marginal 1.110 13.130 99.960 0.640 13.960
Total 551.620 830.550 805.450 1,247.050 535.120 602.110 1,420.540
Soil Classification, CAO Tugbok Clay Tugbok Clay Tugbok Clay Tugbok Clay Tugbok Clay Tugbok Clay Tugbok Clay
Elevation (in has.), OCPDC-GIS
>101 m - - - - 5.850 - -
101 - 300 m - A 91.108 782.389 - 1,230.181 376.180 361.400 159.380
301 - 500 m - Upland / B 460.512 48.161 758.526 16.869 153.090 240.710 1,176.060
501 - 1,000 m - Hillyland / C - - 46.924 - - - 85.100
1,001 - 1,500 m - Low Elevation Highland / D - - - - - - -
1,501 - 5,000 m - Medium Elevation Highland - - - - - - -
Total 551.620 830.550 805.450 1,247.050 535.120 602.110 1,420.540
Slope (in has.), OCPDC-GIS
Level to Nearly Level (0-3%) - 240.621 - 292.919 335.729 85.116 1.100
Gently Sloping to Undulating Range (3-8%) 551.620 322.555 - 912.629 10.751 113.221 -
Undulating to Unrolling Range (8-8%) - 267.374 719.987 34.402 26.653 - 16.541
Rolling to Moderately Steep Range (18-30%) - - - - 20.100 - 360.493
Steep Range (30-50%) - - - 7.100 66.508 215.339 794.298
Very Steep Range (>50%) - - 85.463 - 75.379 188.434 248.109
Total 551.620 830.550 805.450 1,247.050 535.120 602.110 1,420.540
II. Economic Services
Micro
Number 5 813 6 33 1 6
Total Capitalization (in million pesos) 2,659,000.00 301,865,672.00 418,000.00 20,828,506.00 70,000.00 470,000.00
Declared No. of Employees 14 1,840 10 33 1 9
Small
Number 1 35 1 4
Total Capitalization (in million pesos) 10,400,000.00 209,005,206.97 12,627,482.31 21,800,001.00
Declared No. of Employees 25 356 13 177
Medium
Number 1
Commercial & Industrial Establishments, Bus. Bureau, 2015
Page 64
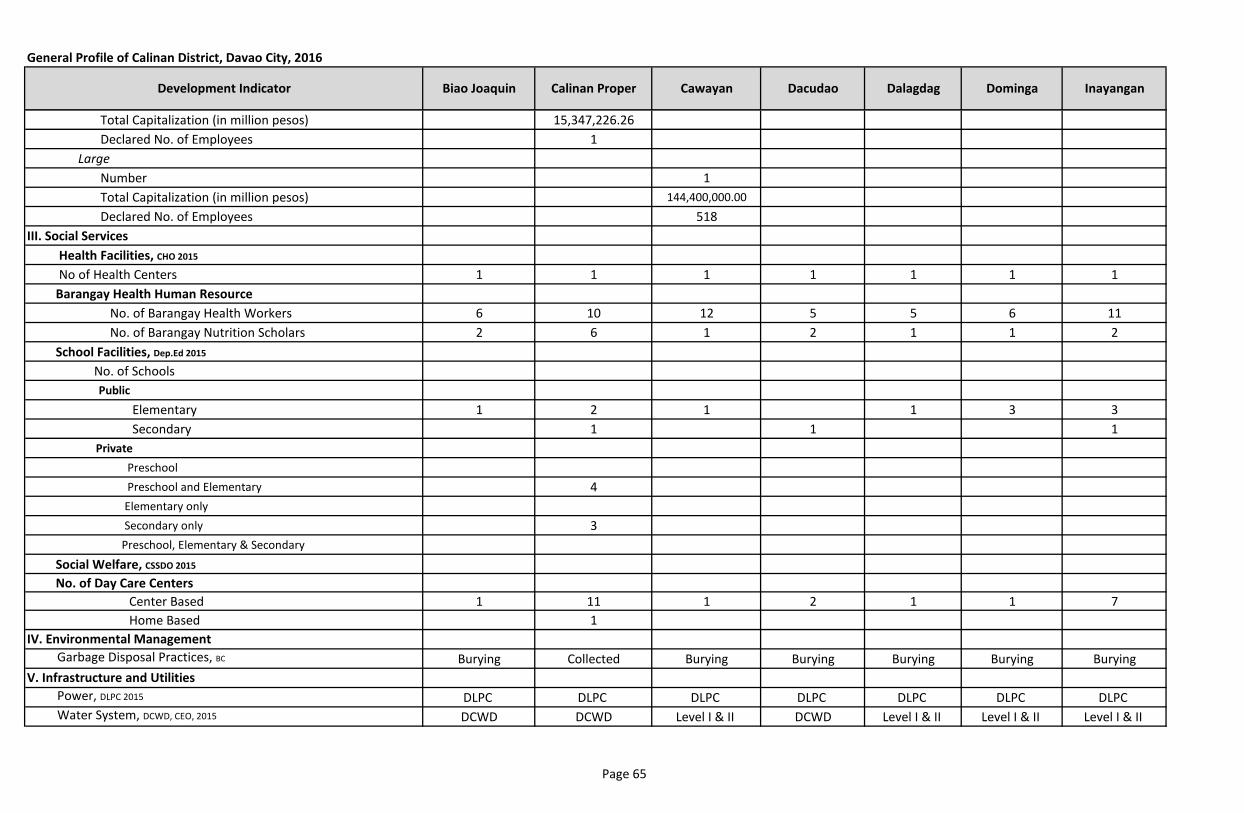
General Profile of Calinan District, Davao City, 2016
Dominga InayanganDevelopment Indicator Biao Joaquin Calinan Proper Cawayan Dacudao Dalagdag
Total Capitalization (in million pesos) 15,347,226.26
Declared No. of Employees 1
Large
Number 1
Total Capitalization (in million pesos) 144,400,000.00
Declared No. of Employees 518
III. Social Services
Health Facilities, CHO 2015
No of Health Centers 1 1 1 1 1 1 1
Barangay Health Human Resource
No. of Barangay Health Workers 6 10 12 5 5 6 11
No. of Barangay Nutrition Scholars 2 6 1 2 1 1 2
School Facilities, Dep.Ed 2015
No. of Schools
Public
Elementary 1 2 1 1 3 3
Secondary 1 1 1
Private
Preschool
Preschool and Elementary 4
Elementary only
Secondary only 3
Preschool, Elementary & Secondary
Social Welfare, CSSDO 2015
No. of Day Care Centers
Center Based 1 11 1 2 1 1 7
Home Based 1
IV. Environmental Management
Garbage Disposal Practices, BC Burying Collected Burying Burying Burying Burying Burying
V. Infrastructure and Utilities
Power, DLPC 2015 DLPC DLPC DLPC DLPC DLPC DLPC DLPC
Water System, DCWD, CEO, 2015 DCWD DCWD Level I & II DCWD Level I & II Level I & II Level I & II
Page 65
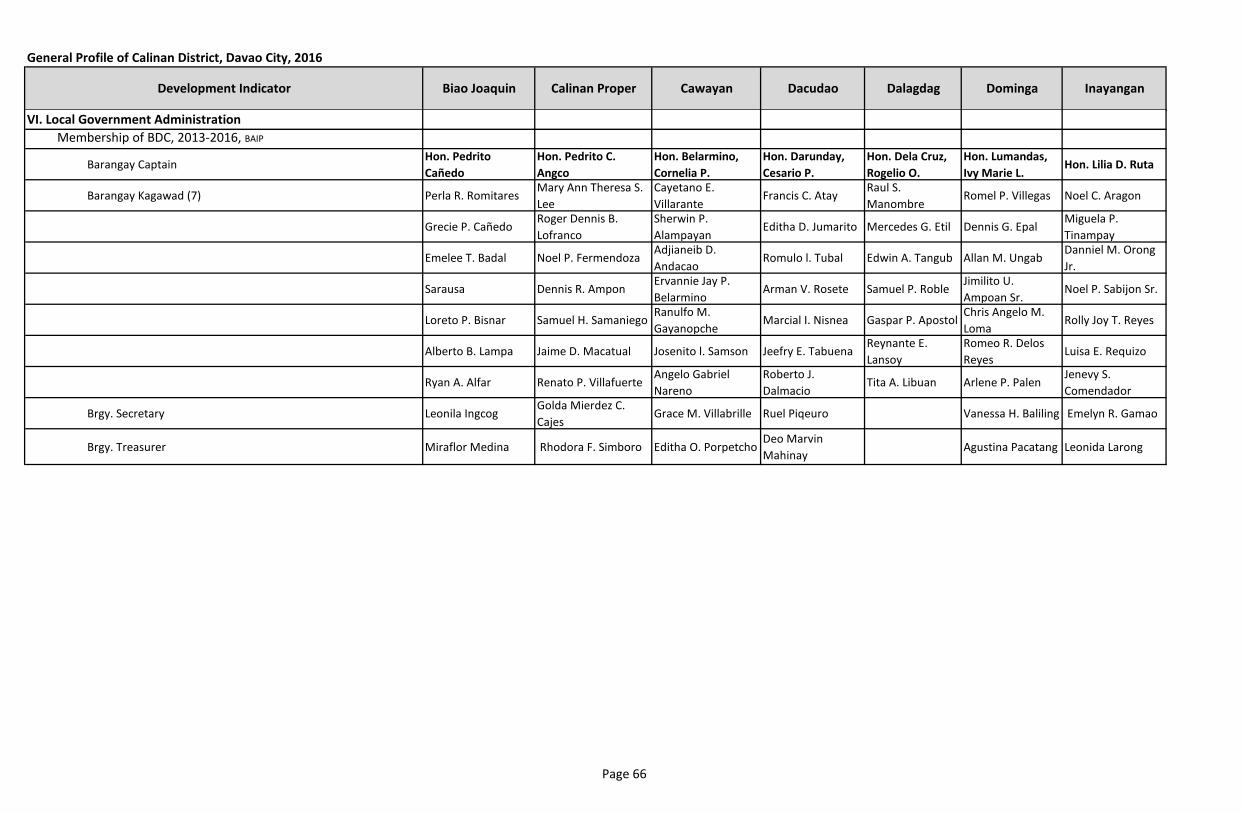
General Profile of Calinan District, Davao City, 2016
Dominga InayanganDevelopment Indicator Biao Joaquin Calinan Proper Cawayan Dacudao Dalagdag
VI. Local Government Administration
Membership of BDC, 2013-2016, BAIP
Barangay CaptainHon. Pedrito
Cañedo
Hon. Pedrito C.
Angco
Hon. Belarmino,
Cornelia P.
Hon. Darunday,
Cesario P.
Hon. Dela Cruz,
Rogelio O.
Hon. Lumandas,
Ivy Marie L. Hon. Lilia D. Ruta
Barangay Kagawad (7) Perla R. RomitaresMary Ann Theresa S.
Lee
Cayetano E.
VillaranteFrancis C. Atay
Raul S.
ManombreRomel P. Villegas Noel C. Aragon
Grecie P. CañedoRoger Dennis B.
Lofranco
Sherwin P.
AlampayanEditha D. Jumarito Mercedes G. Etil Dennis G. Epal
Miguela P.
Tinampay
Emelee T. Badal Noel P. FermendozaAdjianeib D.
AndacaoRomulo l. Tubal Edwin A. Tangub Allan M. Ungab
Danniel M. Orong
Jr.
Sarausa Dennis R. AmponErvannie Jay P.
BelarminoArman V. Rosete Samuel P. Roble
Jimilito U.
Ampoan Sr.Noel P. Sabijon Sr.
Loreto P. Bisnar Samuel H. SamaniegoRanulfo M.
GayanopcheMarcial I. Nisnea Gaspar P. Apostol
Chris Angelo M.
LomaRolly Joy T. Reyes
Alberto B. Lampa Jaime D. Macatual Josenito l. Samson Jeefry E. TabuenaReynante E.
Lansoy
Romeo R. Delos
ReyesLuisa E. Requizo
Ryan A. Alfar Renato P. VillafuerteAngelo Gabriel
Nareno
Roberto J.
DalmacioTita A. Libuan Arlene P. Palen
Jenevy S.
Comendador
Brgy. Secretary Leonila IngcogGolda Mierdez C.
CajesGrace M. Villabrille Ruel Piqeuro Vanessa H. Baliling Emelyn R. Gamao
Brgy. Treasurer Miraflor Medina Rhodora F. Simboro Editha O. PorpetchoDeo Marvin
MahinayAgustina Pacatang Leonida Larong
Page 66
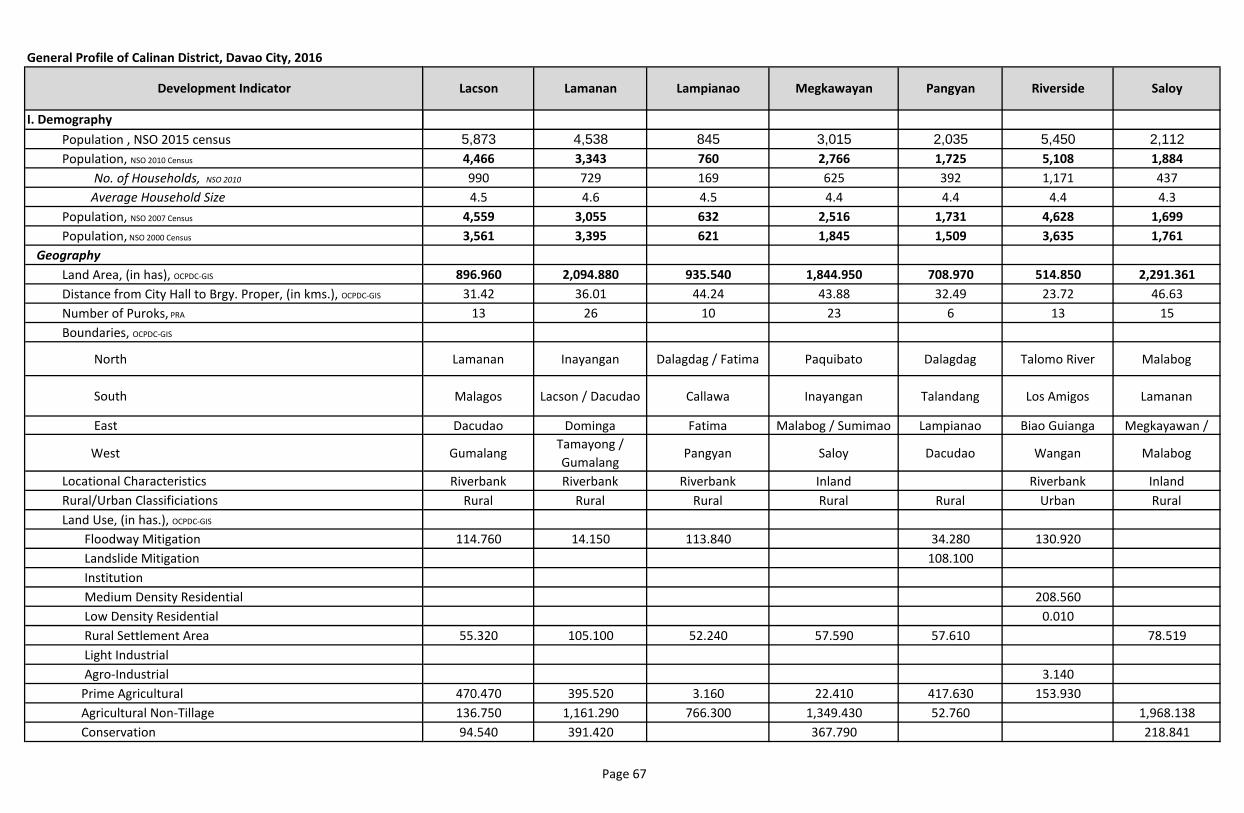
General Profile of Calinan District, Davao City, 2016
I. Demography
Population , NSO 2015 census
Population, NSO 2010 Census
No. of Households, NSO 2010
Average Household Size
Population, NSO 2007 Census
Population, NSO 2000 Census
Geography
Land Area, (in has), OCPDC-GIS
Distance from City Hall to Brgy. Proper, (in kms.), OCPDC-GIS
Number of Puroks, PRA
Boundaries, OCPDC-GIS
North
South
East
West
Locational Characteristics
Rural/Urban Classificiations
Land Use, (in has.), OCPDC-GIS
Floodway Mitigation
Landslide Mitigation
Institution
Medium Density Residential
Low Density Residential
Rural Settlement Area
Light Industrial
Agro-Industrial
Prime Agricultural
Agricultural Non-Tillage
Conservation
Development Indicator
5,873 4,538 845 3,015 2,035 5,450 2,112
4,466 3,343 760 2,766 1,725 5,108 1,884
990 729 169 625 392 1,171 437
4.5 4.6 4.5 4.4 4.4 4.4 4.3
4,559 3,055 632 2,516 1,731 4,628 1,699
3,561 3,395 621 1,845 1,509 3,635 1,761
896.960 2,094.880 935.540 1,844.950 708.970 514.850 2,291.361
31.42 36.01 44.24 43.88 32.49 23.72 46.63
13 26 10 23 6 13 15
Lamanan Inayangan Dalagdag / Fatima Paquibato Dalagdag Talomo River Malabog
Malagos Lacson / Dacudao Callawa Inayangan Talandang Los Amigos Lamanan
Dacudao Dominga Fatima Malabog / Sumimao Lampianao Biao Guianga Megkayawan /
GumalangTamayong /
GumalangPangyan Saloy Dacudao Wangan Malabog
Riverbank Riverbank Riverbank Inland Riverbank Inland
Rural Rural Rural Rural Rural Urban Rural
114.760 14.150 113.840 34.280 130.920
108.100
208.560
0.010
55.320 105.100 52.240 57.590 57.610 78.519
3.140
470.470 395.520 3.160 22.410 417.630 153.930
136.750 1,161.290 766.300 1,349.430 52.760 1,968.138
94.540 391.420 367.790 218.841
Pangyan Riverside SaloyLacson Lamanan Lampianao Megkawayan
Page 67
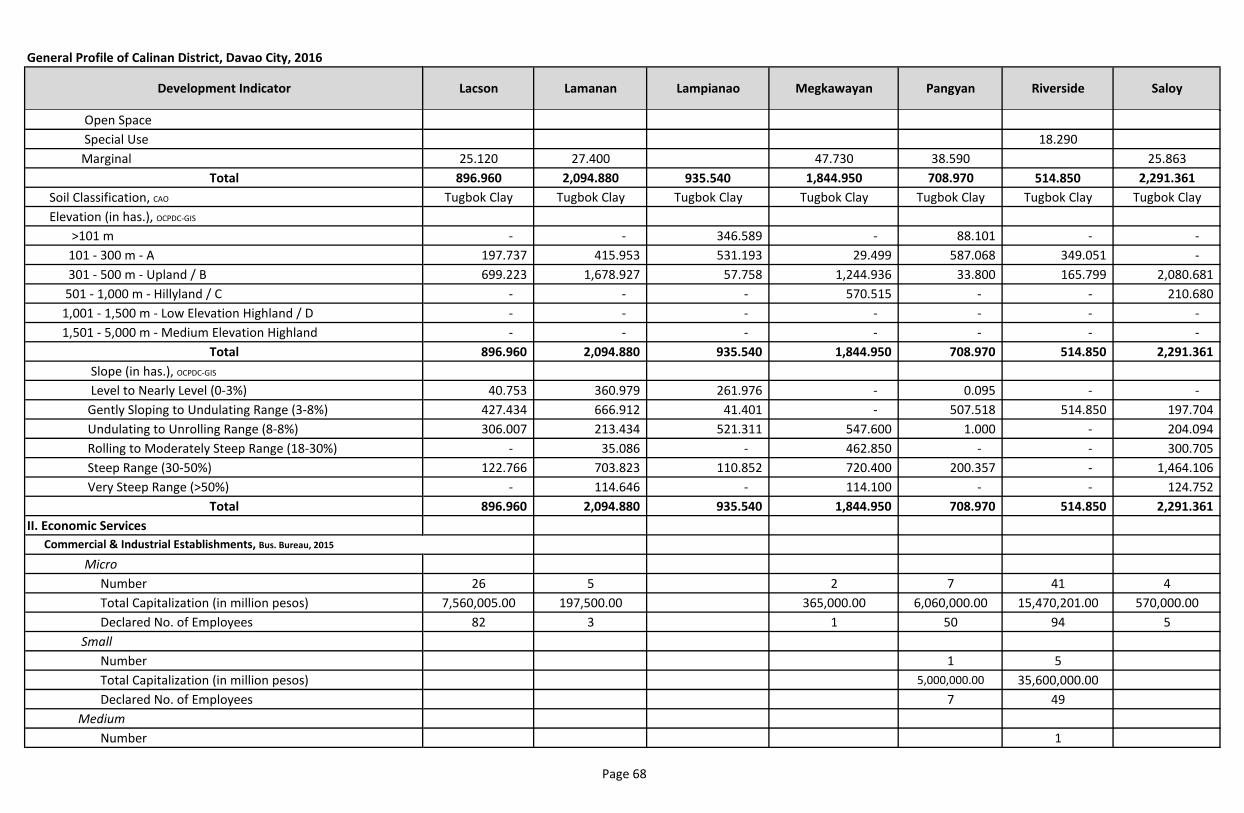
General Profile of Calinan District, Davao City, 2016
Development Indicator
Open Space
Special Use
Marginal
Total
Soil Classification, CAO
Elevation (in has.), OCPDC-GIS
>101 m
101 - 300 m - A
301 - 500 m - Upland / B
501 - 1,000 m - Hillyland / C
1,001 - 1,500 m - Low Elevation Highland / D
1,501 - 5,000 m - Medium Elevation Highland
Total
Slope (in has.), OCPDC-GIS
Level to Nearly Level (0-3%)
Gently Sloping to Undulating Range (3-8%)
Undulating to Unrolling Range (8-8%)
Rolling to Moderately Steep Range (18-30%)
Steep Range (30-50%)
Very Steep Range (>50%)
Total
II. Economic Services
Micro
Number
Total Capitalization (in million pesos)
Declared No. of Employees
Small
Number
Total Capitalization (in million pesos)
Declared No. of Employees
Medium
Number
Commercial & Industrial Establishments, Bus. Bureau, 2015
Pangyan Riverside SaloyLacson Lamanan Lampianao Megkawayan
18.290
25.120 27.400 47.730 38.590 25.863
896.960 2,094.880 935.540 1,844.950 708.970 514.850 2,291.361
Tugbok Clay Tugbok Clay Tugbok Clay Tugbok Clay Tugbok Clay Tugbok Clay Tugbok Clay
- - 346.589 - 88.101 - -
197.737 415.953 531.193 29.499 587.068 349.051 -
699.223 1,678.927 57.758 1,244.936 33.800 165.799 2,080.681
- - - 570.515 - - 210.680
- - - - - - -
- - - - - - -
896.960 2,094.880 935.540 1,844.950 708.970 514.850 2,291.361
40.753 360.979 261.976 - 0.095 - -
427.434 666.912 41.401 - 507.518 514.850 197.704
306.007 213.434 521.311 547.600 1.000 - 204.094
- 35.086 - 462.850 - - 300.705
122.766 703.823 110.852 720.400 200.357 - 1,464.106
- 114.646 - 114.100 - - 124.752
896.960 2,094.880 935.540 1,844.950 708.970 514.850 2,291.361
26 5 2 7 41 4
7,560,005.00 197,500.00 365,000.00 6,060,000.00 15,470,201.00 570,000.00
82 3 1 50 94 5
1 5
5,000,000.00 35,600,000.00
7 49
1
Page 68
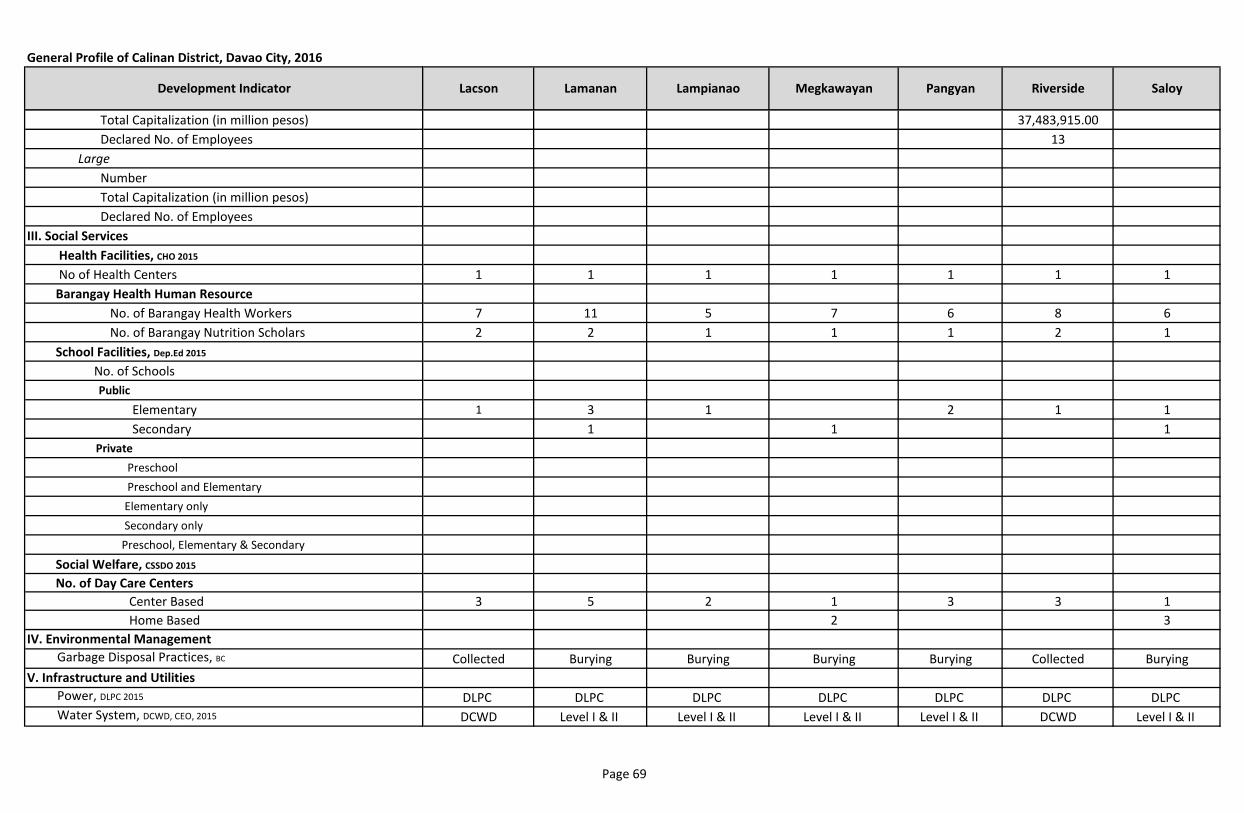
General Profile of Calinan District, Davao City, 2016
Development Indicator
Total Capitalization (in million pesos)
Declared No. of Employees
Large
Number
Total Capitalization (in million pesos)
Declared No. of Employees
III. Social Services
Health Facilities, CHO 2015
No of Health Centers
Barangay Health Human Resource
No. of Barangay Health Workers
No. of Barangay Nutrition Scholars
School Facilities, Dep.Ed 2015
No. of Schools
Public
Elementary
Secondary
Private
Preschool
Preschool and Elementary
Elementary only
Secondary only
Preschool, Elementary & Secondary
Social Welfare, CSSDO 2015
No. of Day Care Centers
Center Based
Home Based
IV. Environmental Management
Garbage Disposal Practices, BC
V. Infrastructure and Utilities
Power, DLPC 2015
Water System, DCWD, CEO, 2015
Pangyan Riverside SaloyLacson Lamanan Lampianao Megkawayan
37,483,915.00
13
1 1 1 1 1 1 1
7 11 5 7 6 8 6
2 2 1 1 1 2 1
1 3 1 2 1 1
1 1 1
3 5 2 1 3 3 1
2 3
Collected Burying Burying Burying Burying Collected Burying
DLPC DLPC DLPC DLPC DLPC DLPC DLPC
DCWD Level I & II Level I & II Level I & II Level I & II DCWD Level I & II
Page 69
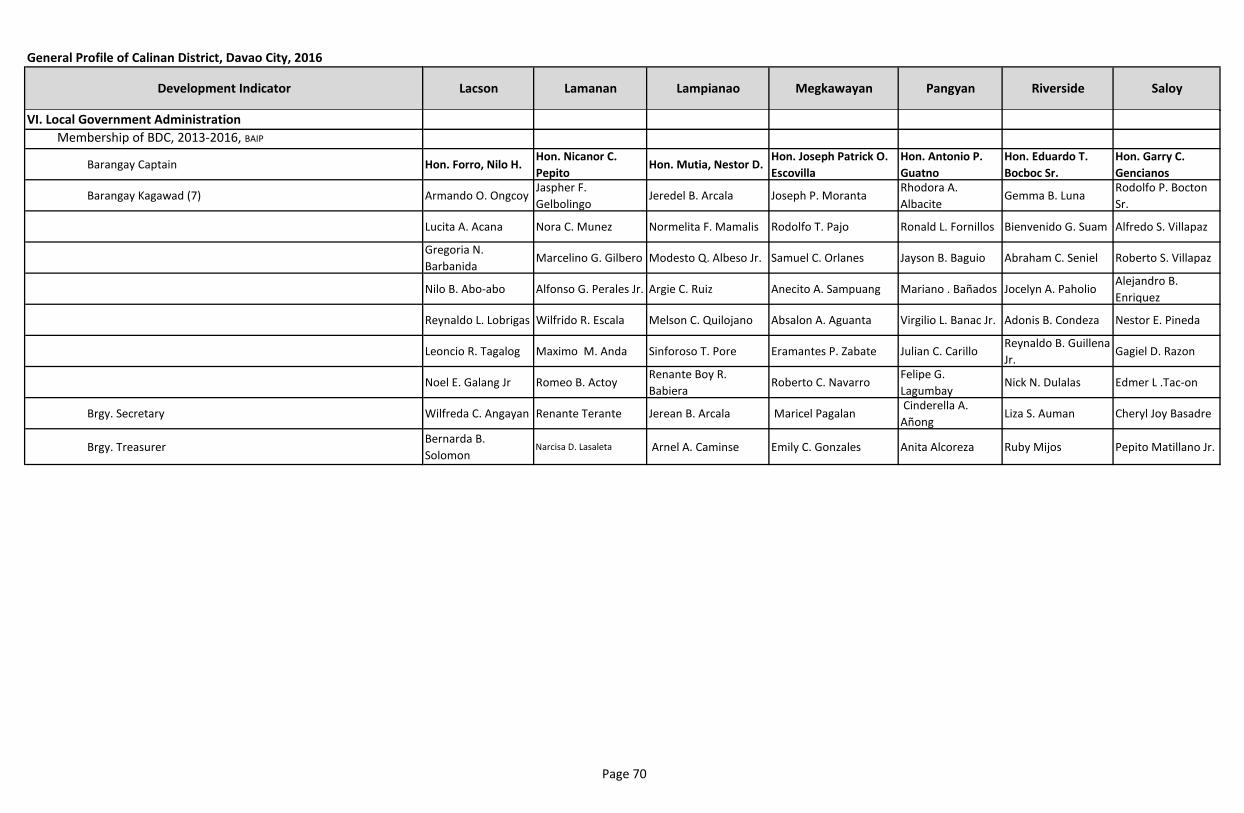
General Profile of Calinan District, Davao City, 2016
Development Indicator
VI. Local Government Administration
Membership of BDC, 2013-2016, BAIP
Barangay Captain
Barangay Kagawad (7)
Brgy. Secretary
Brgy. Treasurer
Pangyan Riverside SaloyLacson Lamanan Lampianao Megkawayan
Hon. Forro, Nilo H.Hon. Nicanor C.
PepitoHon. Mutia, Nestor D.
Hon. Joseph Patrick O.
Escovilla
Hon. Antonio P.
Guatno
Hon. Eduardo T.
Bocboc Sr.
Hon. Garry C.
Gencianos
Armando O. OngcoyJaspher F.
GelbolingoJeredel B. Arcala Joseph P. Moranta
Rhodora A.
AlbaciteGemma B. Luna
Rodolfo P. Bocton
Sr.
Lucita A. Acana Nora C. Munez Normelita F. Mamalis Rodolfo T. Pajo Ronald L. Fornillos Bienvenido G. Suam Alfredo S. Villapaz
Gregoria N.
BarbanidaMarcelino G. Gilbero Modesto Q. Albeso Jr. Samuel C. Orlanes Jayson B. Baguio Abraham C. Seniel Roberto S. Villapaz
Nilo B. Abo-abo Alfonso G. Perales Jr. Argie C. Ruiz Anecito A. Sampuang Mariano . Bañados Jocelyn A. PaholioAlejandro B.
Enriquez
Reynaldo L. Lobrigas Wilfrido R. Escala Melson C. Quilojano Absalon A. Aguanta Virgilio L. Banac Jr. Adonis B. Condeza Nestor E. Pineda
Leoncio R. Tagalog Maximo M. Anda Sinforoso T. Pore Eramantes P. Zabate Julian C. CarilloReynaldo B. Guillena
Jr.Gagiel D. Razon
Noel E. Galang Jr Romeo B. ActoyRenante Boy R.
BabieraRoberto C. Navarro
Felipe G.
LagumbayNick N. Dulalas Edmer L .Tac-on
Wilfreda C. Angayan Renante Terante Jerean B. Arcala Maricel Pagalan Cinderella A.
AñongLiza S. Auman Cheryl Joy Basadre
Bernarda B.
SolomonNarcisa D. Lasaleta Arnel A. Caminse Emily C. Gonzales Anita Alcoreza Ruby Mijos Pepito Matillano Jr.
Page 70
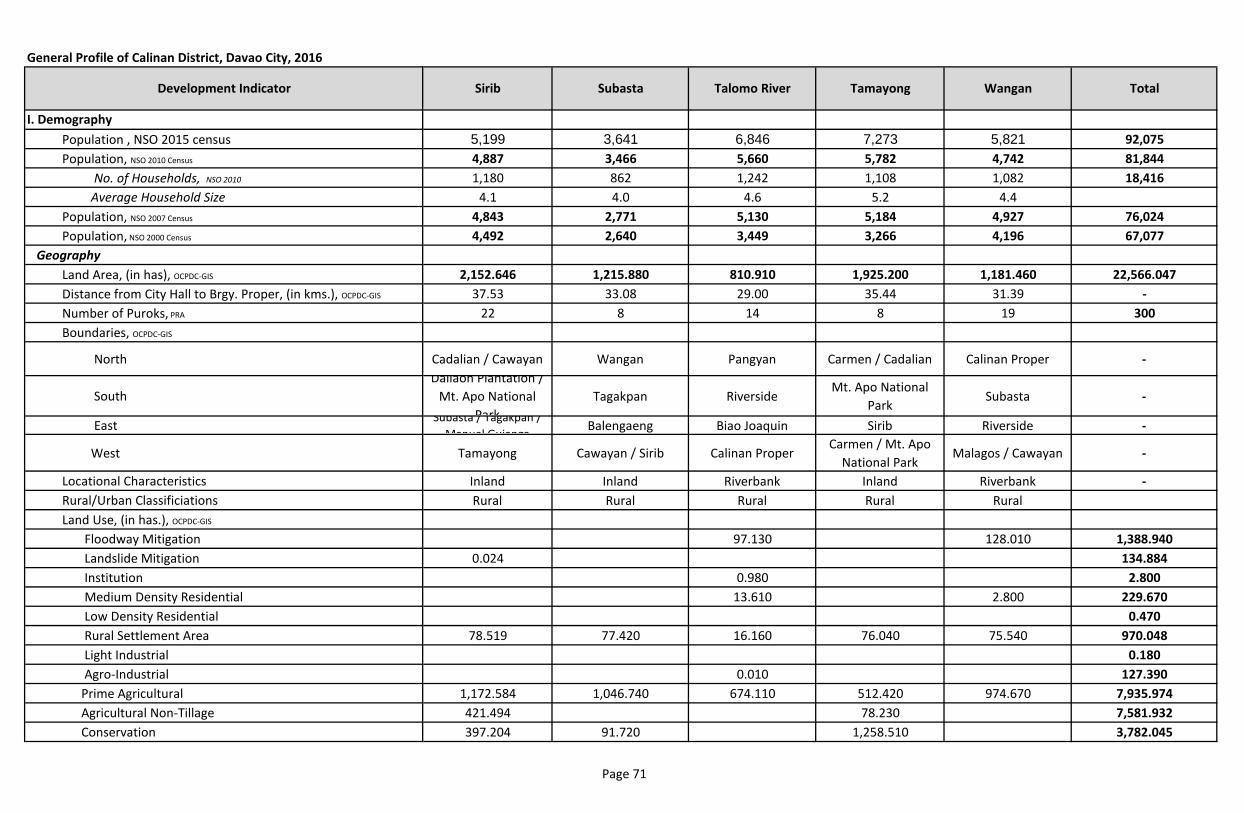
General Profile of Calinan District, Davao City, 2016
I. Demography
Population , NSO 2015 census
Population, NSO 2010 Census
No. of Households, NSO 2010
Average Household Size
Population, NSO 2007 Census
Population, NSO 2000 Census
Geography
Land Area, (in has), OCPDC-GIS
Distance from City Hall to Brgy. Proper, (in kms.), OCPDC-GIS
Number of Puroks, PRA
Boundaries, OCPDC-GIS
North
South
East
West
Locational Characteristics
Rural/Urban Classificiations
Land Use, (in has.), OCPDC-GIS
Floodway Mitigation
Landslide Mitigation
Institution
Medium Density Residential
Low Density Residential
Rural Settlement Area
Light Industrial
Agro-Industrial
Prime Agricultural
Agricultural Non-Tillage
Conservation
Development Indicator
5,199 3,641 6,846 7,273 5,821 92,075
4,887 3,466 5,660 5,782 4,742 81,844
1,180 862 1,242 1,108 1,082 18,416
4.1 4.0 4.6 5.2 4.4
4,843 2,771 5,130 5,184 4,927 76,024
4,492 2,640 3,449 3,266 4,196 67,077
2,152.646 1,215.880 810.910 1,925.200 1,181.460 22,566.047
37.53 33.08 29.00 35.44 31.39 -
22 8 14 8 19 300
Cadalian / Cawayan Wangan Pangyan Carmen / Cadalian Calinan Proper -
Daliaon Plantation /
Mt. Apo National
Park
Tagakpan RiversideMt. Apo National
ParkSubasta -
Subasta / Tagakpan /
Manuel GuiangaBalengaeng Biao Joaquin Sirib Riverside -
Tamayong Cawayan / Sirib Calinan ProperCarmen / Mt. Apo
National ParkMalagos / Cawayan -
Inland Inland Riverbank Inland Riverbank -
Rural Rural Rural Rural Rural
97.130 128.010 1,388.940
0.024 134.884
0.980 2.800
13.610 2.800 229.670
0.470
78.519 77.420 16.160 76.040 75.540 970.048
0.180
0.010 127.390
1,172.584 1,046.740 674.110 512.420 974.670 7,935.974
421.494 78.230 7,581.932
397.204 91.720 1,258.510 3,782.045
Tamayong Wangan TotalSirib Subasta Talomo River
Page 71
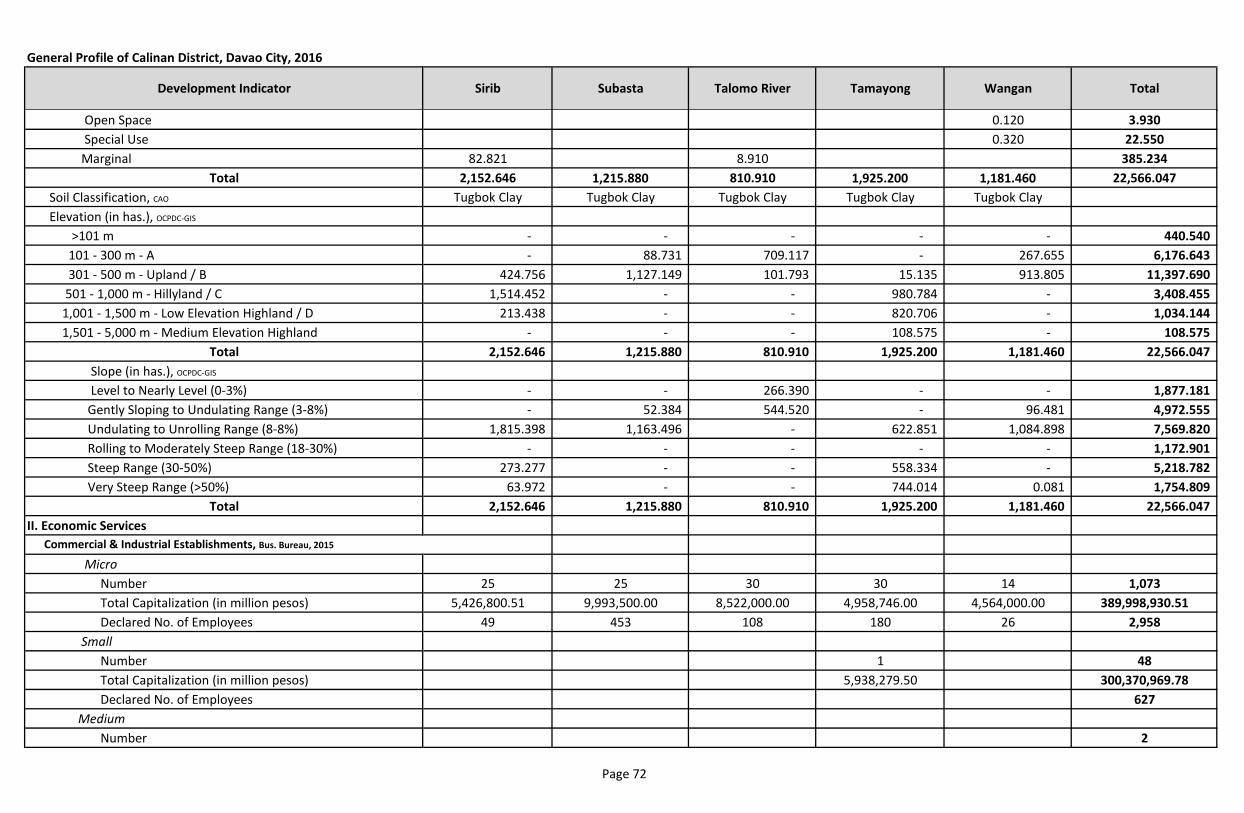
General Profile of Calinan District, Davao City, 2016
Development Indicator
Open Space
Special Use
Marginal
Total
Soil Classification, CAO
Elevation (in has.), OCPDC-GIS
>101 m
101 - 300 m - A
301 - 500 m - Upland / B
501 - 1,000 m - Hillyland / C
1,001 - 1,500 m - Low Elevation Highland / D
1,501 - 5,000 m - Medium Elevation Highland
Total
Slope (in has.), OCPDC-GIS
Level to Nearly Level (0-3%)
Gently Sloping to Undulating Range (3-8%)
Undulating to Unrolling Range (8-8%)
Rolling to Moderately Steep Range (18-30%)
Steep Range (30-50%)
Very Steep Range (>50%)
Total
II. Economic Services
Micro
Number
Total Capitalization (in million pesos)
Declared No. of Employees
Small
Number
Total Capitalization (in million pesos)
Declared No. of Employees
Medium
Number
Commercial & Industrial Establishments, Bus. Bureau, 2015
Tamayong Wangan TotalSirib Subasta Talomo River
0.120 3.930
0.320 22.550
82.821 8.910 385.234
2,152.646 1,215.880 810.910 1,925.200 1,181.460 22,566.047
Tugbok Clay Tugbok Clay Tugbok Clay Tugbok Clay Tugbok Clay
- - - - - 440.540
- 88.731 709.117 - 267.655 6,176.643
424.756 1,127.149 101.793 15.135 913.805 11,397.690
1,514.452 - - 980.784 - 3,408.455
213.438 - - 820.706 - 1,034.144
- - - 108.575 - 108.575
2,152.646 1,215.880 810.910 1,925.200 1,181.460 22,566.047
- - 266.390 - - 1,877.181
- 52.384 544.520 - 96.481 4,972.555
1,815.398 1,163.496 - 622.851 1,084.898 7,569.820
- - - - - 1,172.901
273.277 - - 558.334 - 5,218.782
63.972 - - 744.014 0.081 1,754.809
2,152.646 1,215.880 810.910 1,925.200 1,181.460 22,566.047
25 25 30 30 14 1,073
5,426,800.51 9,993,500.00 8,522,000.00 4,958,746.00 4,564,000.00 389,998,930.51
49 453 108 180 26 2,958
1 48
5,938,279.50 300,370,969.78
627
2
Page 72
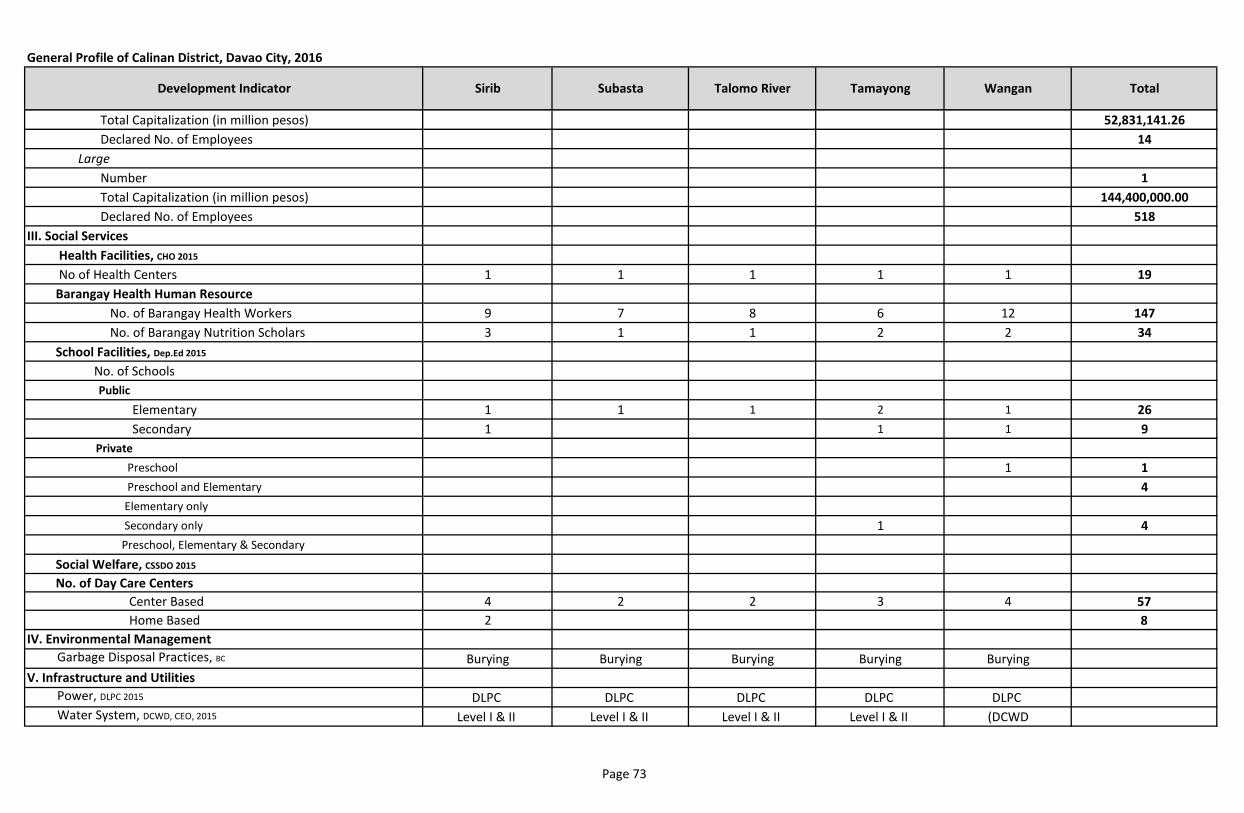
General Profile of Calinan District, Davao City, 2016
Development Indicator
Total Capitalization (in million pesos)
Declared No. of Employees
Large
Number
Total Capitalization (in million pesos)
Declared No. of Employees
III. Social Services
Health Facilities, CHO 2015
No of Health Centers
Barangay Health Human Resource
No. of Barangay Health Workers
No. of Barangay Nutrition Scholars
School Facilities, Dep.Ed 2015
No. of Schools
Public
Elementary
Secondary
Private
Preschool
Preschool and Elementary
Elementary only
Secondary only
Preschool, Elementary & Secondary
Social Welfare, CSSDO 2015
No. of Day Care Centers
Center Based
Home Based
IV. Environmental Management
Garbage Disposal Practices, BC
V. Infrastructure and Utilities
Power, DLPC 2015
Water System, DCWD, CEO, 2015
Tamayong Wangan TotalSirib Subasta Talomo River
52,831,141.26
14
1
144,400,000.00
518
1 1 1 1 1 19
9 7 8 6 12 147
3 1 1 2 2 34
1 1 1 2 1 26
1 1 1 9
1 1
4
1 4
4 2 2 3 4 57
2 8
Burying Burying Burying Burying Burying
DLPC DLPC DLPC DLPC DLPC
Level I & II Level I & II Level I & II Level I & II (DCWD
Page 73
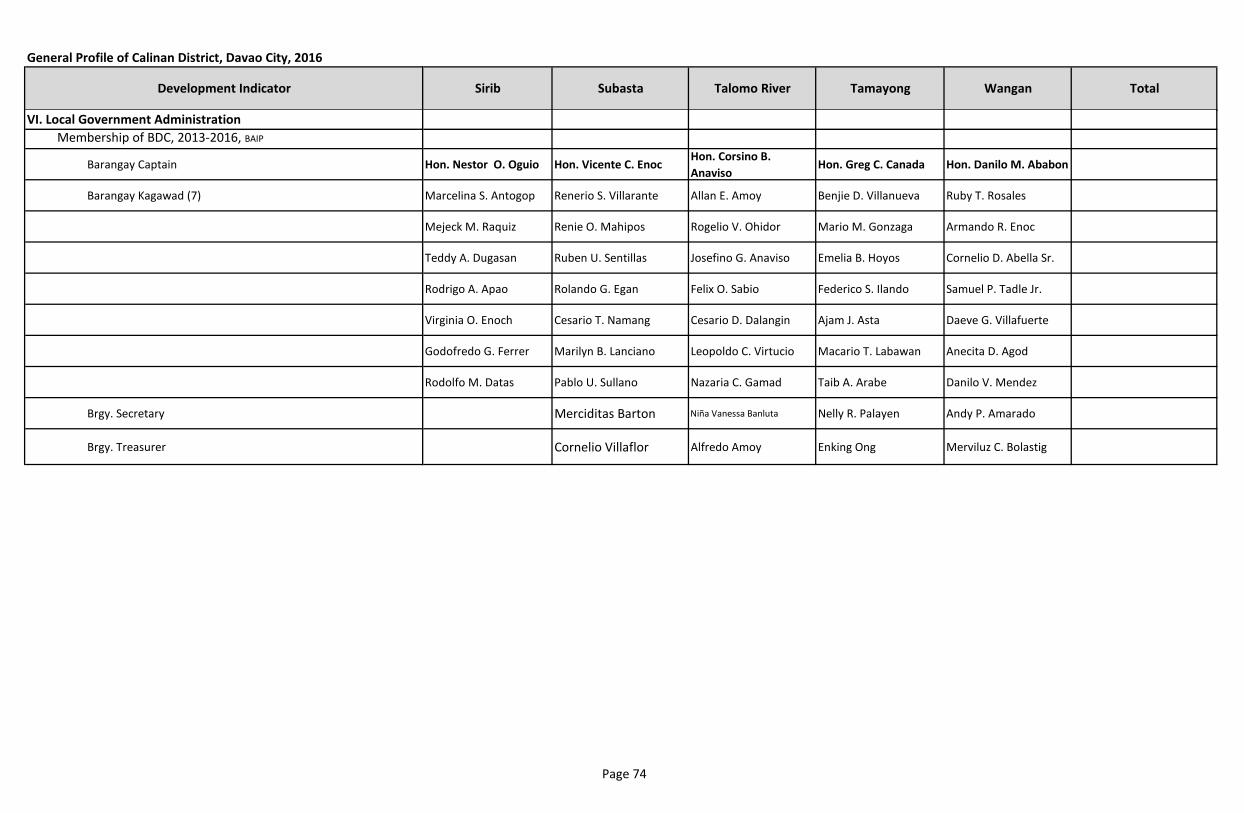
General Profile of Calinan District, Davao City, 2016
Development Indicator
VI. Local Government Administration
Membership of BDC, 2013-2016, BAIP
Barangay Captain
Barangay Kagawad (7)
Brgy. Secretary
Brgy. Treasurer
Tamayong Wangan TotalSirib Subasta Talomo River
Hon. Nestor O. Oguio Hon. Vicente C. EnocHon. Corsino B.
Anaviso Hon. Greg C. Canada Hon. Danilo M. Ababon
Marcelina S. Antogop Renerio S. Villarante Allan E. Amoy Benjie D. Villanueva Ruby T. Rosales
Mejeck M. Raquiz Renie O. Mahipos Rogelio V. Ohidor Mario M. Gonzaga Armando R. Enoc
Teddy A. Dugasan Ruben U. Sentillas Josefino G. Anaviso Emelia B. Hoyos Cornelio D. Abella Sr.
Rodrigo A. Apao Rolando G. Egan Felix O. Sabio Federico S. Ilando Samuel P. Tadle Jr.
Virginia O. Enoch Cesario T. Namang Cesario D. Dalangin Ajam J. Asta Daeve G. Villafuerte
Godofredo G. Ferrer Marilyn B. Lanciano Leopoldo C. Virtucio Macario T. Labawan Anecita D. Agod
Rodolfo M. Datas Pablo U. Sullano Nazaria C. Gamad Taib A. Arabe Danilo V. Mendez
Merciditas Barton Niña Vanessa Banluta Nelly R. Palayen Andy P. Amarado
Cornelio Villaflor Alfredo Amoy Enking Ong Merviluz C. Bolastig
Page 74
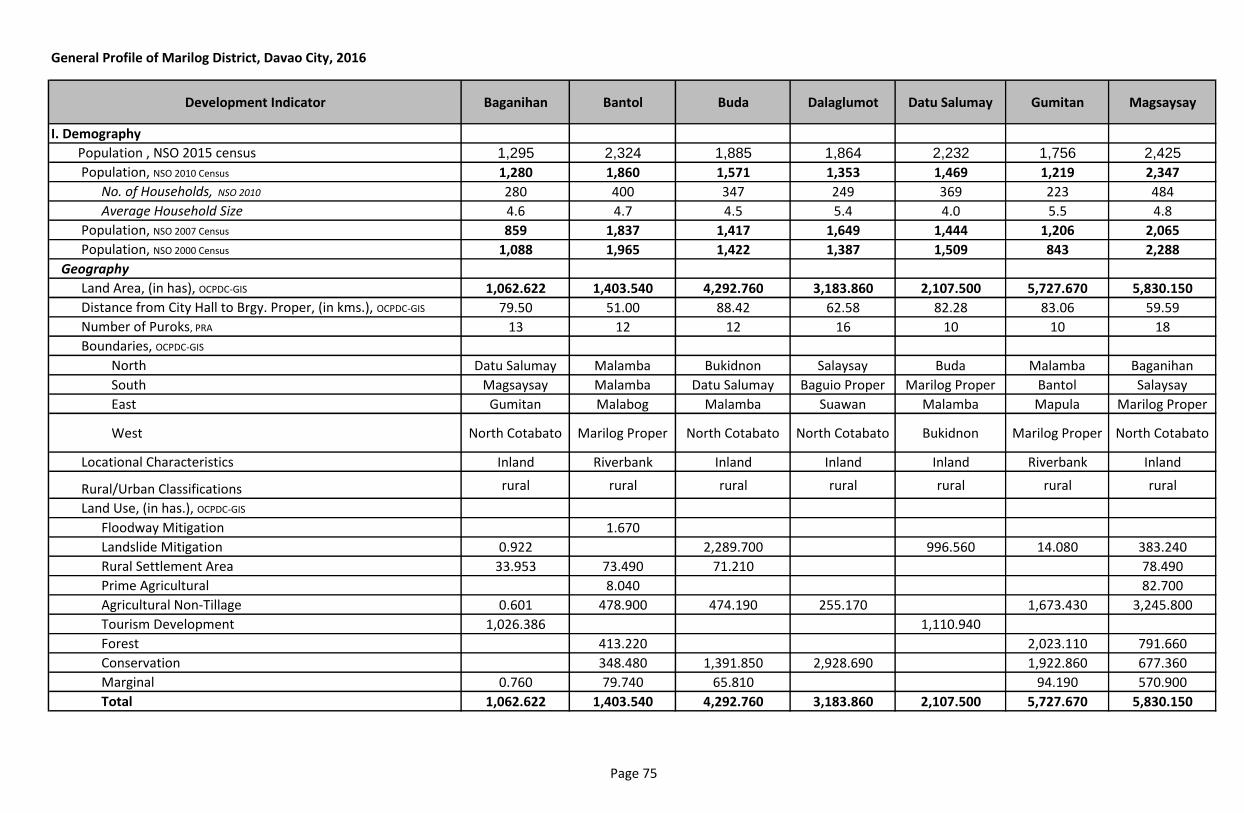
General Profile of Marilog District, Davao City, 2016
Development Indicator Baganihan Bantol Buda Dalaglumot Datu Salumay Gumitan Magsaysay
I. Demography
Population , NSO 2015 census 1,295 2,324 1,885 1,864 2,232 1,756 2,425
Population, NSO 2010 Census 1,280 1,860 1,571 1,353 1,469 1,219 2,347
No. of Households, NSO 2010 280 400 347 249 369 223 484
Average Household Size 4.6 4.7 4.5 5.4 4.0 5.5 4.8
Population, NSO 2007 Census 859 1,837 1,417 1,649 1,444 1,206 2,065
Population, NSO 2000 Census 1,088 1,965 1,422 1,387 1,509 843 2,288
Geography
Land Area, (in has), OCPDC-GIS 1,062.622 1,403.540 4,292.760 3,183.860 2,107.500 5,727.670 5,830.150
Distance from City Hall to Brgy. Proper, (in kms.), OCPDC-GIS 79.50 51.00 88.42 62.58 82.28 83.06 59.59
Number of Puroks, PRA 13 12 12 16 10 10 18
Boundaries, OCPDC-GIS
North Datu Salumay Malamba Bukidnon Salaysay Buda Malamba Baganihan
South Magsaysay Malamba Datu Salumay Baguio Proper Marilog Proper Bantol Salaysay
East Gumitan Malabog Malamba Suawan Malamba Mapula Marilog Proper
West North Cotabato Marilog Proper North Cotabato North Cotabato Bukidnon Marilog Proper North Cotabato
Locational Characteristics Inland Riverbank Inland Inland Inland Riverbank Inland
Rural/Urban Classifications rural rural rural rural rural rural rural
Land Use, (in has.), OCPDC-GIS
Floodway Mitigation 1.670
Landslide Mitigation 0.922 2,289.700 996.560 14.080 383.240
Rural Settlement Area 33.953 73.490 71.210 78.490
Prime Agricultural 8.040 82.700
Agricultural Non-Tillage 0.601 478.900 474.190 255.170 1,673.430 3,245.800
Tourism Development 1,026.386 1,110.940
Forest 413.220 2,023.110 791.660
Conservation 348.480 1,391.850 2,928.690 1,922.860 677.360
Marginal 0.760 79.740 65.810 94.190 570.900
Total 1,062.622 1,403.540 4,292.760 3,183.860 2,107.500 5,727.670 5,830.150
Page 75
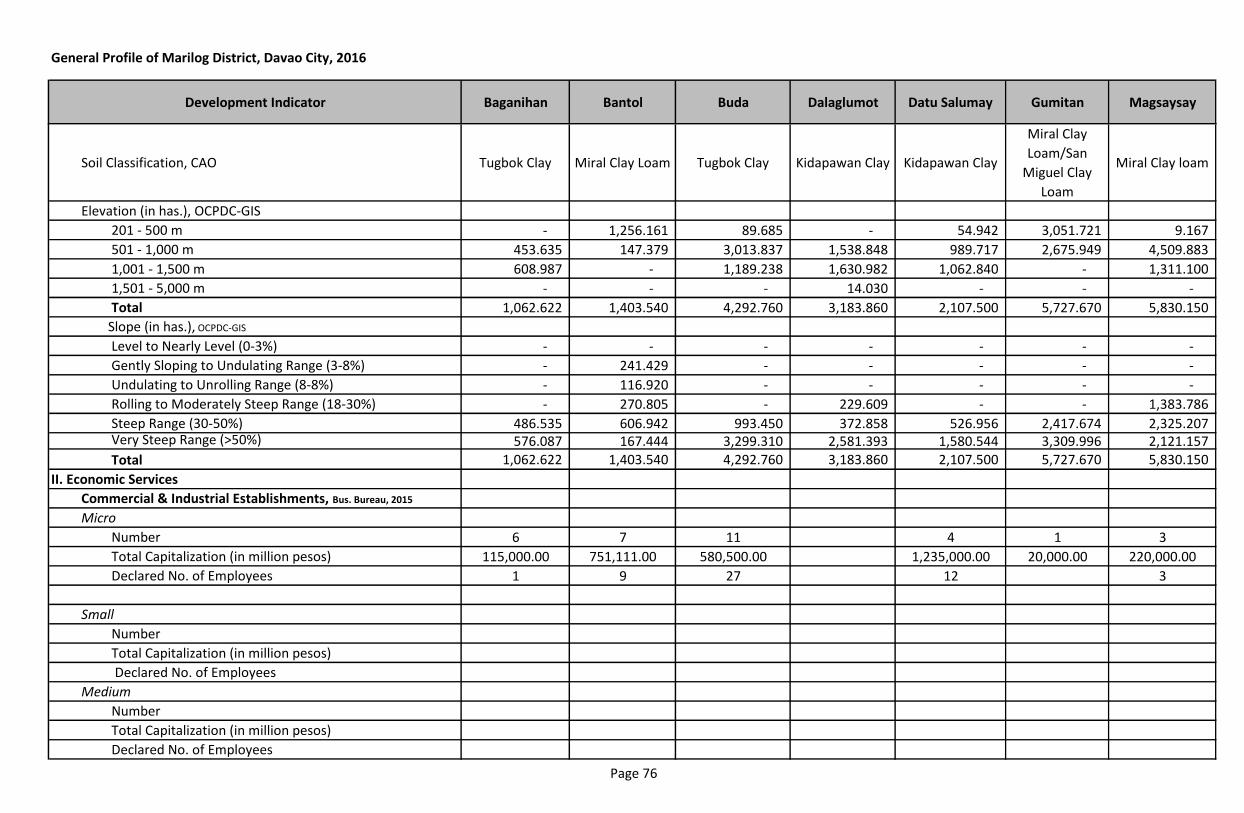
General Profile of Marilog District, Davao City, 2016
Development Indicator Baganihan Bantol Buda Dalaglumot Datu Salumay Gumitan Magsaysay
Soil Classification, CAO Tugbok Clay Miral Clay Loam Tugbok Clay Kidapawan Clay Kidapawan Clay
Miral Clay
Loam/San
Miguel Clay
Loam
Miral Clay loam
Elevation (in has.), OCPDC-GIS
201 - 500 m - 1,256.161 89.685 - 54.942 3,051.721 9.167
501 - 1,000 m 453.635 147.379 3,013.837 1,538.848 989.717 2,675.949 4,509.883
1,001 - 1,500 m 608.987 - 1,189.238 1,630.982 1,062.840 - 1,311.100
1,501 - 5,000 m - - - 14.030 - - -
Total 1,062.622 1,403.540 4,292.760 3,183.860 2,107.500 5,727.670 5,830.150
Slope (in has.), OCPDC-GIS
Level to Nearly Level (0-3%) - - - - - - -
Gently Sloping to Undulating Range (3-8%) - 241.429 - - - - -
Undulating to Unrolling Range (8-8%) - 116.920 - - - - -
Rolling to Moderately Steep Range (18-30%) - 270.805 - 229.609 - - 1,383.786
Steep Range (30-50%) 486.535 606.942 993.450 372.858 526.956 2,417.674 2,325.207 Very Steep Range (>50%) 576.087 167.444 3,299.310 2,581.393 1,580.544 3,309.996 2,121.157
Total 1,062.622 1,403.540 4,292.760 3,183.860 2,107.500 5,727.670 5,830.150
II. Economic Services
Commercial & Industrial Establishments, Bus. Bureau, 2015
Micro
Number 6 7 11 4 1 3
Total Capitalization (in million pesos) 115,000.00 751,111.00 580,500.00 1,235,000.00 20,000.00 220,000.00
Declared No. of Employees 1 9 27 12 3
Small
Number
Total Capitalization (in million pesos)
Declared No. of Employees
Medium
Number
Total Capitalization (in million pesos)
Declared No. of Employees
Page 76
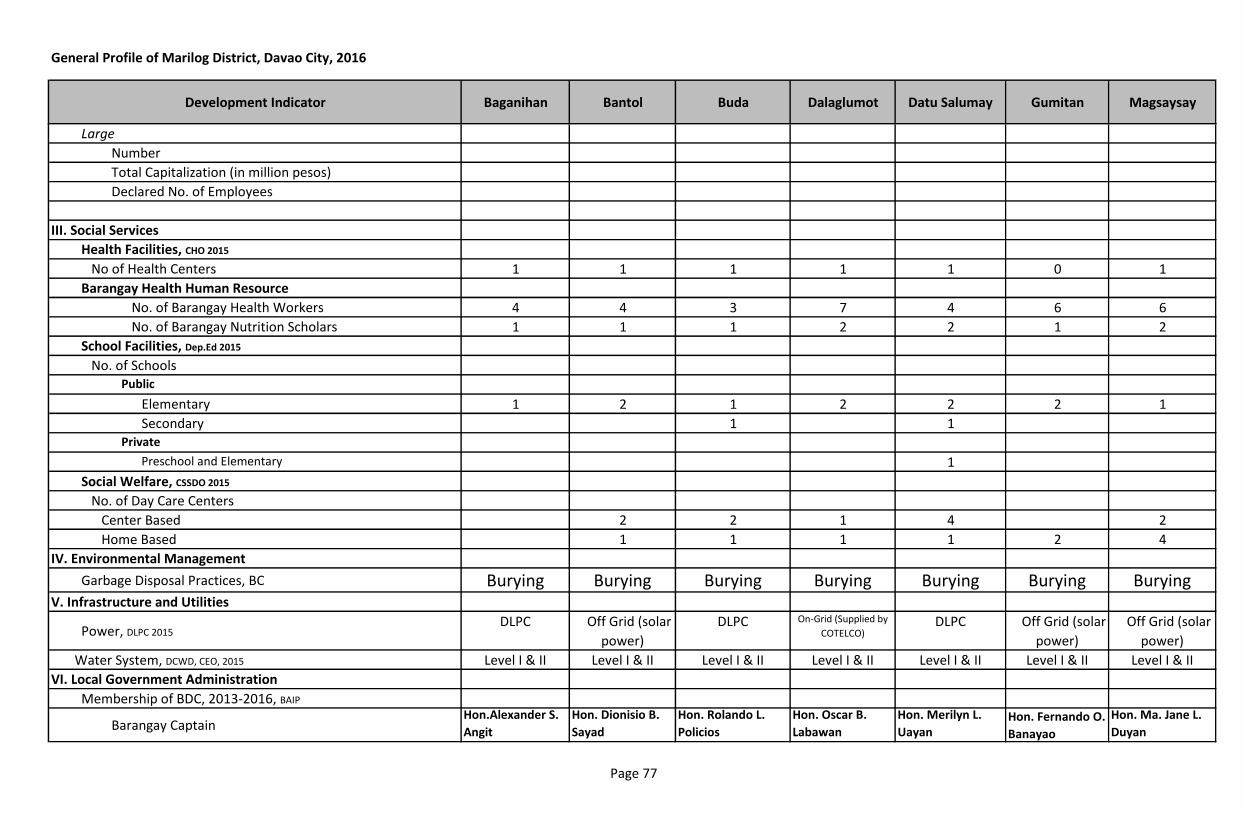
General Profile of Marilog District, Davao City, 2016
Development Indicator Baganihan Bantol Buda Dalaglumot Datu Salumay Gumitan Magsaysay
Large
Number
Total Capitalization (in million pesos)
Declared No. of Employees
III. Social Services
Health Facilities, CHO 2015
No of Health Centers 1 1 1 1 1 0 1
Barangay Health Human Resource
No. of Barangay Health Workers 4 4 3 7 4 6 6
No. of Barangay Nutrition Scholars 1 1 1 2 2 1 2
School Facilities, Dep.Ed 2015
No. of SchoolsPublic
Elementary 1 2 1 2 2 2 1
Secondary 1 1Private
Preschool and Elementary 1
Social Welfare, CSSDO 2015
No. of Day Care Centers
Center Based 2 2 1 4 2
Home Based 1 1 1 1 2 4
IV. Environmental Management
Garbage Disposal Practices, BC Burying Burying Burying Burying Burying Burying BuryingV. Infrastructure and Utilities
Power, DLPC 2015DLPC Off Grid (solar
power)
DLPC On-Grid (Supplied by
COTELCO)DLPC Off Grid (solar
power)
Off Grid (solar
power)
Water System, DCWD, CEO, 2015 Level I & II Level I & II Level I & II Level I & II Level I & II Level I & II Level I & II
VI. Local Government Administration
Membership of BDC, 2013-2016, BAIP
Barangay CaptainHon.Alexander S.
Angit
Hon. Dionisio B.
Sayad
Hon. Rolando L.
Policios
Hon. Oscar B.
Labawan
Hon. Merilyn L.
Uayan Hon. Fernando O.
Banayao
Hon. Ma. Jane L.
Duyan
Page 77
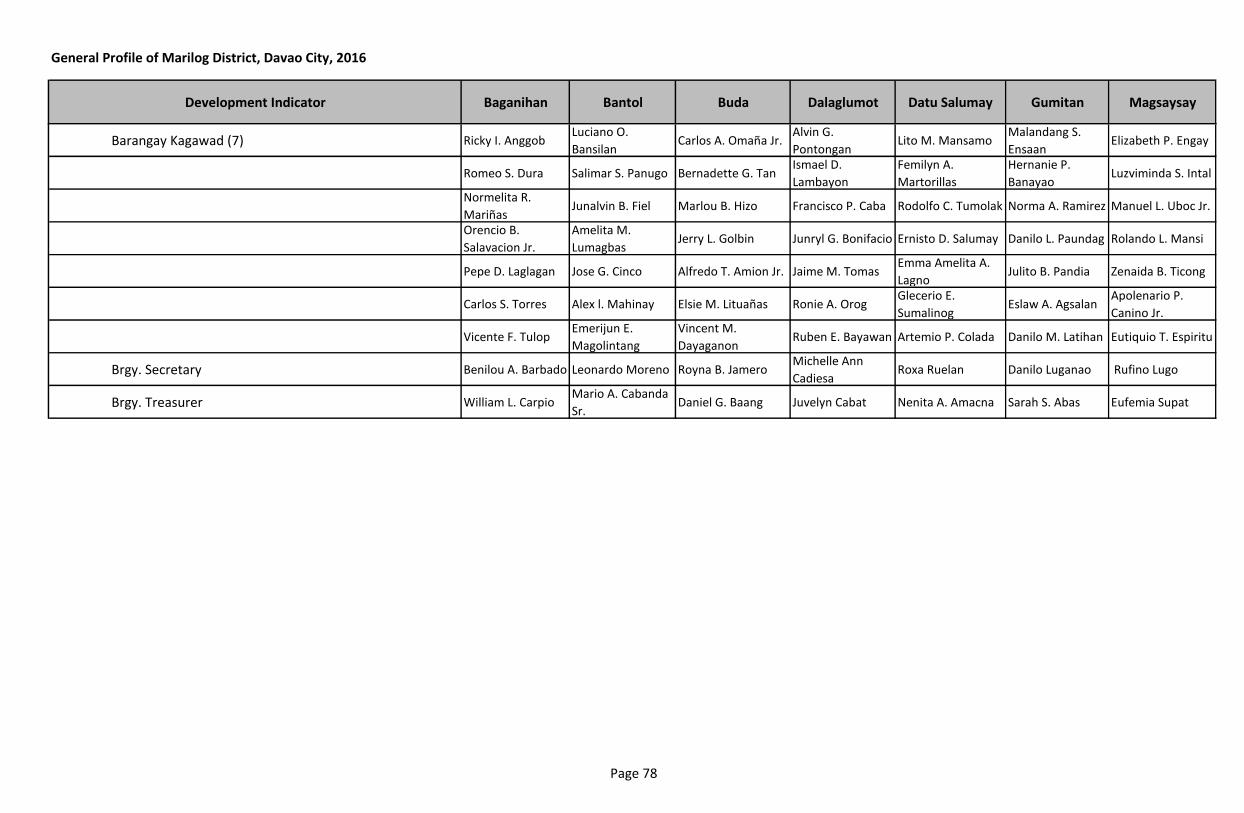
General Profile of Marilog District, Davao City, 2016
Development Indicator Baganihan Bantol Buda Dalaglumot Datu Salumay Gumitan Magsaysay
Barangay Kagawad (7) Ricky I. AnggobLuciano O.
BansilanCarlos A. Omaña Jr.
Alvin G.
PontonganLito M. Mansamo
Malandang S.
EnsaanElizabeth P. Engay
Romeo S. Dura Salimar S. Panugo Bernadette G. TanIsmael D.
Lambayon
Femilyn A.
Martorillas
Hernanie P.
BanayaoLuzviminda S. Intal
Normelita R.
MariñasJunalvin B. Fiel Marlou B. Hizo Francisco P. Caba Rodolfo C. Tumolak Norma A. Ramirez Manuel L. Uboc Jr.
Orencio B.
Salavacion Jr.
Amelita M.
LumagbasJerry L. Golbin Junryl G. Bonifacio Ernisto D. Salumay Danilo L. Paundag Rolando L. Mansi
Pepe D. Laglagan Jose G. Cinco Alfredo T. Amion Jr. Jaime M. TomasEmma Amelita A.
LagnoJulito B. Pandia Zenaida B. Ticong
Carlos S. Torres Alex l. Mahinay Elsie M. Lituañas Ronie A. OrogGlecerio E.
SumalinogEslaw A. Agsalan
Apolenario P.
Canino Jr.
Vicente F. TulopEmerijun E.
Magolintang
Vincent M.
DayaganonRuben E. Bayawan Artemio P. Colada Danilo M. Latihan Eutiquio T. Espiritu
Brgy. Secretary Benilou A. Barbado Leonardo Moreno Royna B. JameroMichelle Ann
CadiesaRoxa Ruelan Danilo Luganao Rufino Lugo
Brgy. Treasurer William L. CarpioMario A. Cabanda
Sr. Daniel G. Baang Juvelyn Cabat Nenita A. Amacna Sarah S. Abas Eufemia Supat
Page 78
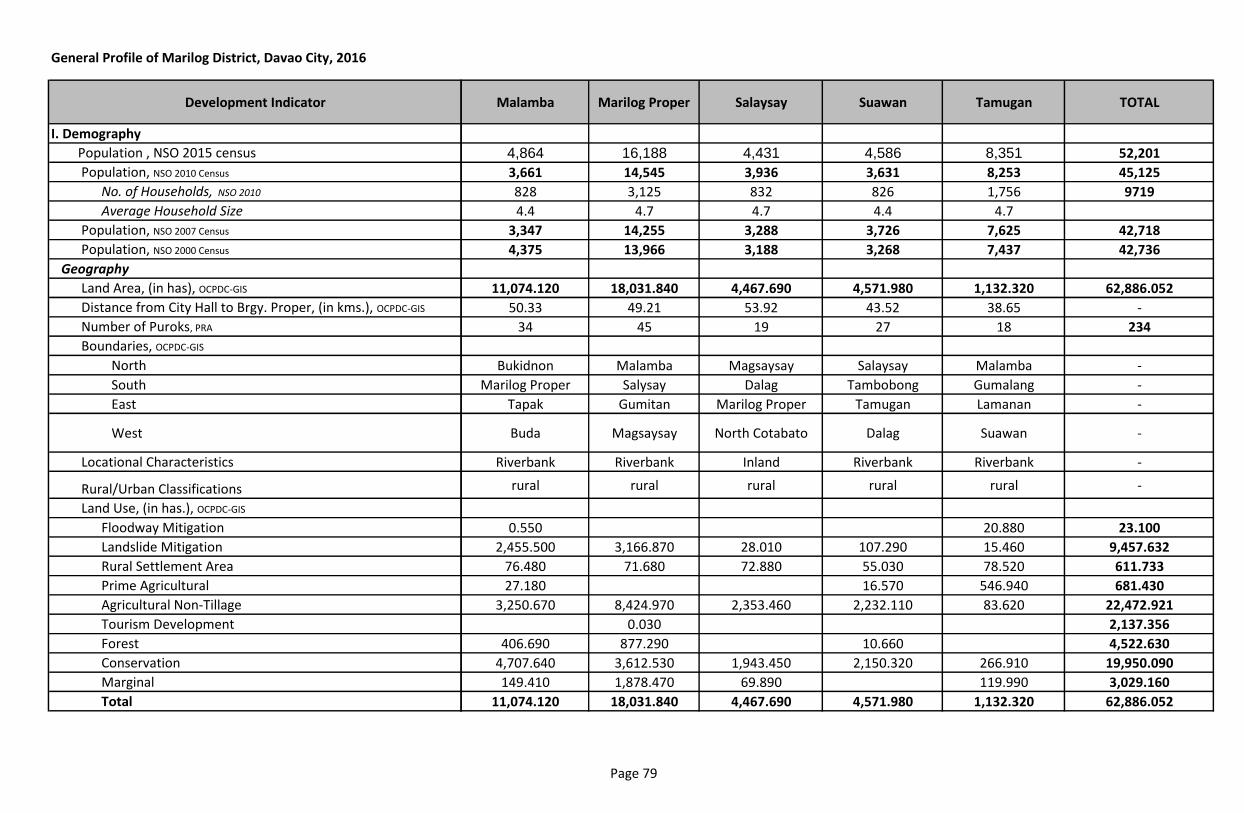
General Profile of Marilog District, Davao City, 2016
Development Indicator
I. Demography
Population , NSO 2015 census
Population, NSO 2010 Census
No. of Households, NSO 2010
Average Household Size
Population, NSO 2007 Census
Population, NSO 2000 Census
Geography
Land Area, (in has), OCPDC-GIS
Distance from City Hall to Brgy. Proper, (in kms.), OCPDC-GIS
Number of Puroks, PRA
Boundaries, OCPDC-GIS
North
South
East
West
Locational Characteristics
Rural/Urban Classifications
Land Use, (in has.), OCPDC-GIS
Floodway Mitigation
Landslide Mitigation
Rural Settlement Area
Prime Agricultural
Agricultural Non-Tillage
Tourism Development
Forest
Conservation
Marginal
Total
Malamba Marilog Proper Salaysay Suawan Tamugan TOTAL
4,864 16,188 4,431 4,586 8,351 52,201
3,661 14,545 3,936 3,631 8,253 45,125
828 3,125 832 826 1,756 9719
4.4 4.7 4.7 4.4 4.7
3,347 14,255 3,288 3,726 7,625 42,718
4,375 13,966 3,188 3,268 7,437 42,736
11,074.120 18,031.840 4,467.690 4,571.980 1,132.320 62,886.052
50.33 49.21 53.92 43.52 38.65 -
34 45 19 27 18 234
Bukidnon Malamba Magsaysay Salaysay Malamba -
Marilog Proper Salysay Dalag Tambobong Gumalang -
Tapak Gumitan Marilog Proper Tamugan Lamanan -
Buda Magsaysay North Cotabato Dalag Suawan -
Riverbank Riverbank Inland Riverbank Riverbank -
rural rural rural rural rural -
0.550 20.880 23.100
2,455.500 3,166.870 28.010 107.290 15.460 9,457.632
76.480 71.680 72.880 55.030 78.520 611.733
27.180 16.570 546.940 681.430
3,250.670 8,424.970 2,353.460 2,232.110 83.620 22,472.921
0.030 2,137.356
406.690 877.290 10.660 4,522.630
4,707.640 3,612.530 1,943.450 2,150.320 266.910 19,950.090
149.410 1,878.470 69.890 119.990 3,029.160
11,074.120 18,031.840 4,467.690 4,571.980 1,132.320 62,886.052
Page 79
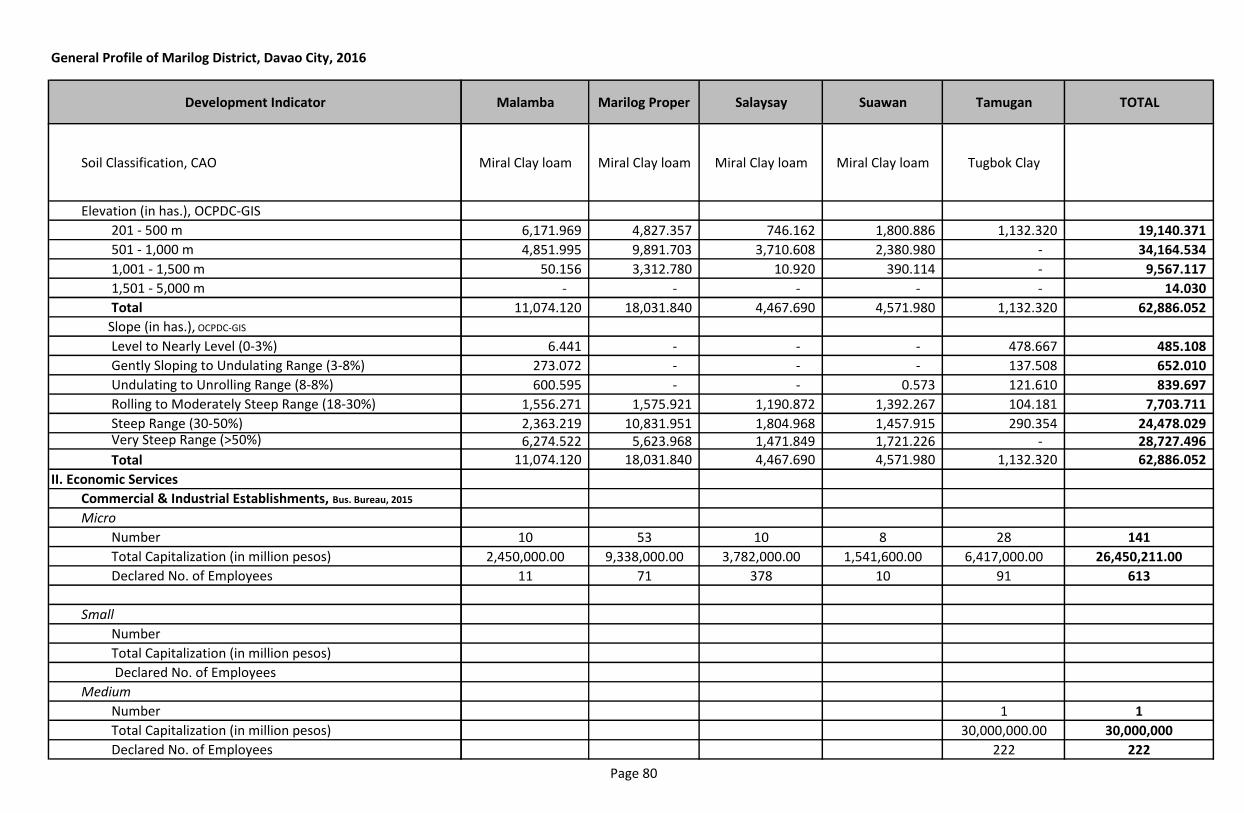
General Profile of Marilog District, Davao City, 2016
Development Indicator
Soil Classification, CAO
Elevation (in has.), OCPDC-GIS
201 - 500 m
501 - 1,000 m
1,001 - 1,500 m
1,501 - 5,000 m
Total
Slope (in has.), OCPDC-GIS
Level to Nearly Level (0-3%)
Gently Sloping to Undulating Range (3-8%)
Undulating to Unrolling Range (8-8%)
Rolling to Moderately Steep Range (18-30%)
Steep Range (30-50%)Very Steep Range (>50%)
Total
II. Economic Services
Commercial & Industrial Establishments, Bus. Bureau, 2015
Micro
Number
Total Capitalization (in million pesos)
Declared No. of Employees
Small
Number
Total Capitalization (in million pesos)
Declared No. of Employees
Medium
Number
Total Capitalization (in million pesos)
Declared No. of Employees
Malamba Marilog Proper Salaysay Suawan Tamugan TOTAL
Miral Clay loam Miral Clay loam Miral Clay loam Miral Clay loam Tugbok Clay
6,171.969 4,827.357 746.162 1,800.886 1,132.320 19,140.371
4,851.995 9,891.703 3,710.608 2,380.980 - 34,164.534
50.156 3,312.780 10.920 390.114 - 9,567.117
- - - - - 14.030
11,074.120 18,031.840 4,467.690 4,571.980 1,132.320 62,886.052
6.441 - - - 478.667 485.108
273.072 - - - 137.508 652.010
600.595 - - 0.573 121.610 839.697
1,556.271 1,575.921 1,190.872 1,392.267 104.181 7,703.711
2,363.219 10,831.951 1,804.968 1,457.915 290.354 24,478.029 6,274.522 5,623.968 1,471.849 1,721.226 - 28,727.496
11,074.120 18,031.840 4,467.690 4,571.980 1,132.320 62,886.052
10 53 10 8 28 141
2,450,000.00 9,338,000.00 3,782,000.00 1,541,600.00 6,417,000.00 26,450,211.00
11 71 378 10 91 613
1 1
30,000,000.00 30,000,000
222 222
Page 80
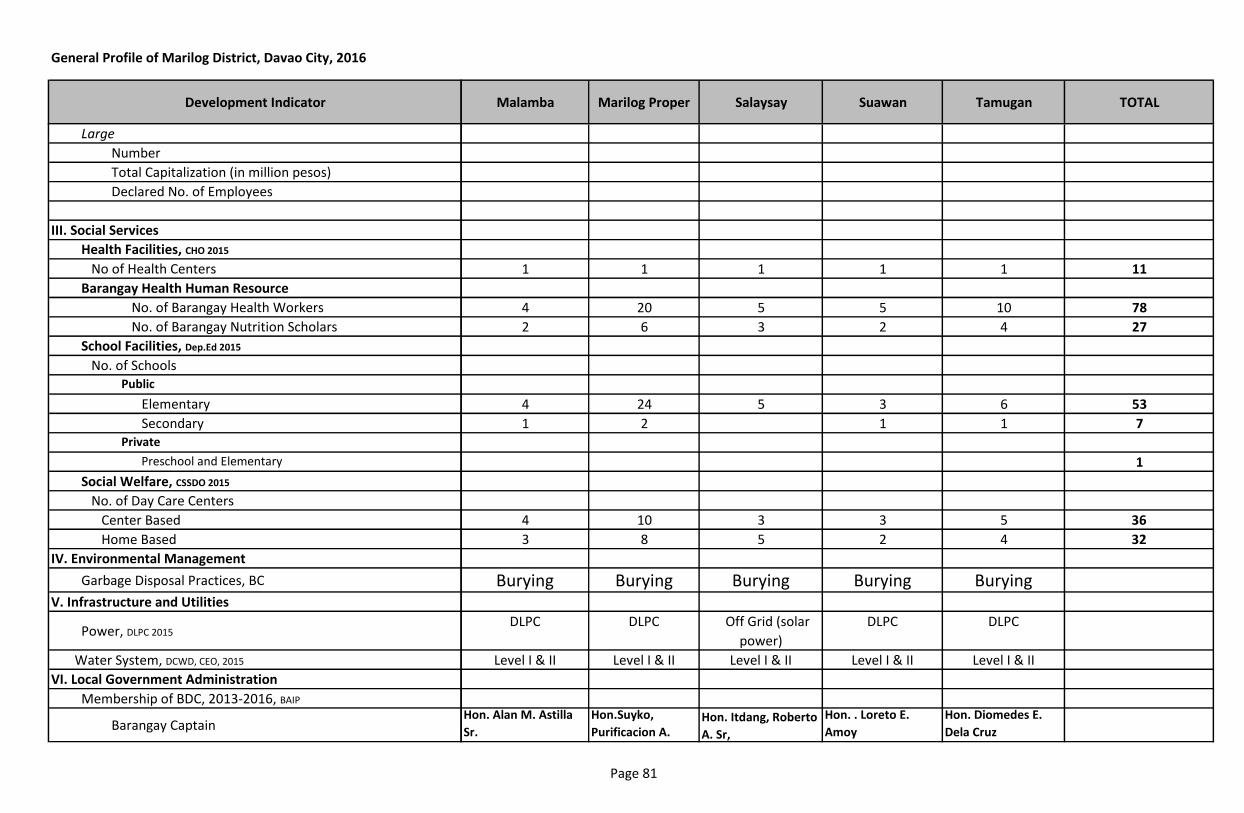
General Profile of Marilog District, Davao City, 2016
Development Indicator
Large
Number
Total Capitalization (in million pesos)
Declared No. of Employees
III. Social Services
Health Facilities, CHO 2015
No of Health Centers
Barangay Health Human Resource
No. of Barangay Health Workers
No. of Barangay Nutrition Scholars
School Facilities, Dep.Ed 2015
No. of SchoolsPublic
Elementary
SecondaryPrivate
Preschool and Elementary
Social Welfare, CSSDO 2015
No. of Day Care Centers
Center Based
Home Based
IV. Environmental Management
Garbage Disposal Practices, BC
V. Infrastructure and Utilities
Power, DLPC 2015
Water System, DCWD, CEO, 2015
VI. Local Government Administration
Membership of BDC, 2013-2016, BAIP
Barangay Captain
Malamba Marilog Proper Salaysay Suawan Tamugan TOTAL
1 1 1 1 1 11
4 20 5 5 10 78
2 6 3 2 4 27
4 24 5 3 6 53
1 2 1 1 7
1
4 10 3 3 5 36
3 8 5 2 4 32
Burying Burying Burying Burying Burying
DLPC DLPC Off Grid (solar
power)
DLPC DLPC
Level I & II Level I & II Level I & II Level I & II Level I & II
Hon. Alan M. Astilla
Sr.
Hon.Suyko,
Purificacion A.Hon. Itdang, Roberto
A. Sr,
Hon. . Loreto E.
Amoy
Hon. Diomedes E.
Dela Cruz
Page 81
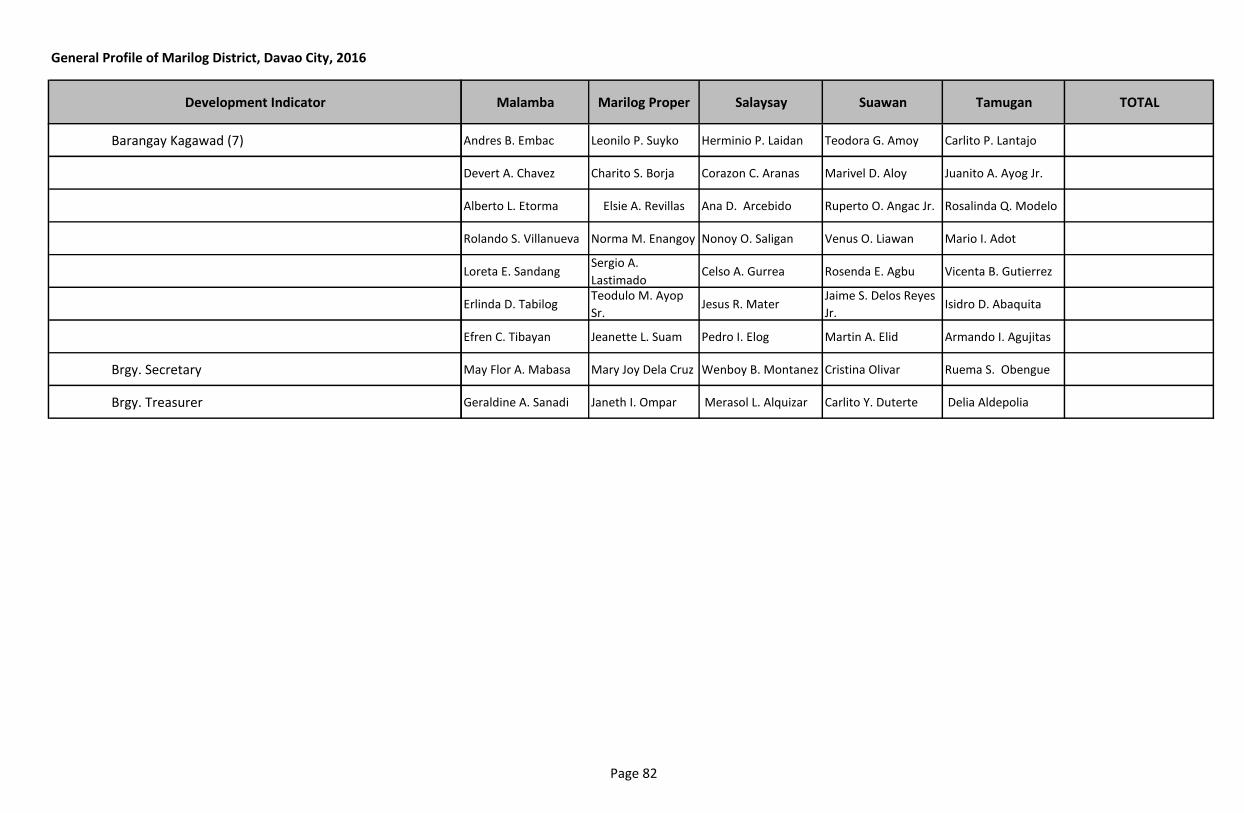
General Profile of Marilog District, Davao City, 2016
Development Indicator
Barangay Kagawad (7)
Brgy. Secretary
Brgy. Treasurer
Malamba Marilog Proper Salaysay Suawan Tamugan TOTAL
Andres B. Embac Leonilo P. Suyko Herminio P. Laidan Teodora G. Amoy Carlito P. Lantajo
Devert A. Chavez Charito S. Borja Corazon C. Aranas Marivel D. Aloy Juanito A. Ayog Jr.
Alberto L. Etorma Elsie A. Revillas Ana D. Arcebido Ruperto O. Angac Jr. Rosalinda Q. Modelo
Rolando S. Villanueva Norma M. Enangoy Nonoy O. Saligan Venus O. Liawan Mario I. Adot
Loreta E. SandangSergio A.
LastimadoCelso A. Gurrea Rosenda E. Agbu Vicenta B. Gutierrez
Erlinda D. TabilogTeodulo M. Ayop
Sr.Jesus R. Mater
Jaime S. Delos Reyes
Jr.Isidro D. Abaquita
Efren C. Tibayan Jeanette L. Suam Pedro I. Elog Martin A. Elid Armando I. Agujitas
May Flor A. Mabasa Mary Joy Dela Cruz Wenboy B. Montanez Cristina Olivar Ruema S. Obengue
Geraldine A. Sanadi Janeth I. Ompar Merasol L. Alquizar Carlito Y. Duterte Delia Aldepolia
Page 82
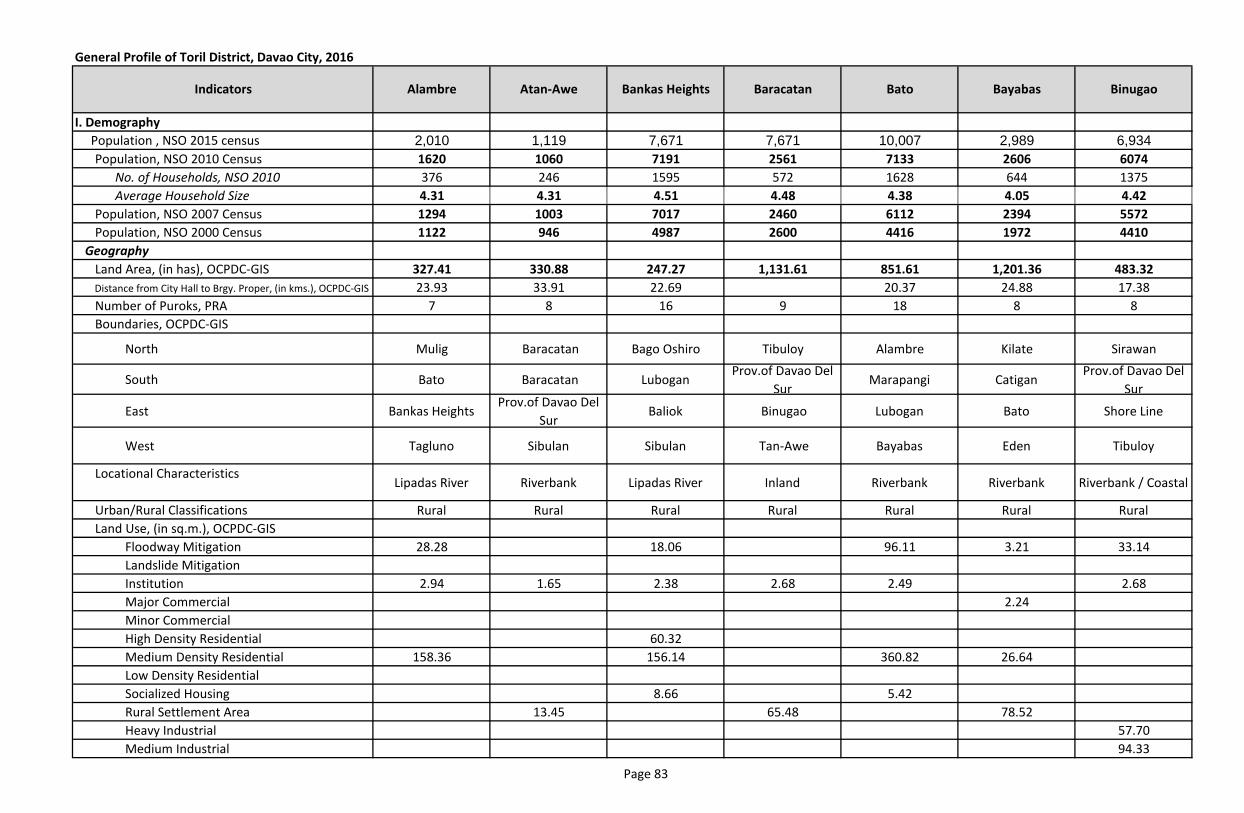
General Profile of Toril District, Davao City, 2016
I. Demography
Population , NSO 2015 census 2,010 1,119 7,671 7,671 10,007 2,989 6,934
Population, NSO 2010 Census 1620 1060 7191 2561 7133 2606 6074
No. of Households, NSO 2010 376 246 1595 572 1628 644 1375
Average Household Size 4.31 4.31 4.51 4.48 4.38 4.05 4.42
Population, NSO 2007 Census 1294 1003 7017 2460 6112 2394 5572
Population, NSO 2000 Census 1122 946 4987 2600 4416 1972 4410
Geography
Land Area, (in has), OCPDC-GIS 327.41 330.88 247.27 1,131.61 851.61 1,201.36 483.32
Distance from City Hall to Brgy. Proper, (in kms.), OCPDC-GIS 23.93 33.91 22.69 20.37 24.88 17.38
Number of Puroks, PRA 7 8 16 9 18 8 8
Boundaries, OCPDC-GIS
North Mulig Baracatan Bago Oshiro Tibuloy Alambre Kilate Sirawan
South Bato Baracatan LuboganProv.of Davao Del
SurMarapangi Catigan
Prov.of Davao Del
Sur
East Bankas HeightsProv.of Davao Del
SurBaliok Binugao Lubogan Bato Shore Line
West Tagluno Sibulan Sibulan Tan-Awe Bayabas Eden Tibuloy
Locational CharacteristicsLipadas River Riverbank Lipadas River Inland Riverbank Riverbank Riverbank / Coastal
Urban/Rural Classifications Rural Rural Rural Rural Rural Rural Rural
Land Use, (in sq.m.), OCPDC-GIS
Floodway Mitigation 28.28 18.06 96.11 3.21 33.14
Landslide Mitigation
Institution 2.94 1.65 2.38 2.68 2.49 2.68
Major Commercial 2.24
Minor Commercial
High Density Residential 60.32
Medium Density Residential 158.36 156.14 360.82 26.64
Low Density Residential
Socialized Housing 8.66 5.42
Rural Settlement Area 13.45 65.48 78.52
Heavy Industrial 57.70
Medium Industrial 94.33
Indicators Alambre Atan-Awe Bankas Heights Baracatan Bato Bayabas Binugao
Page 83
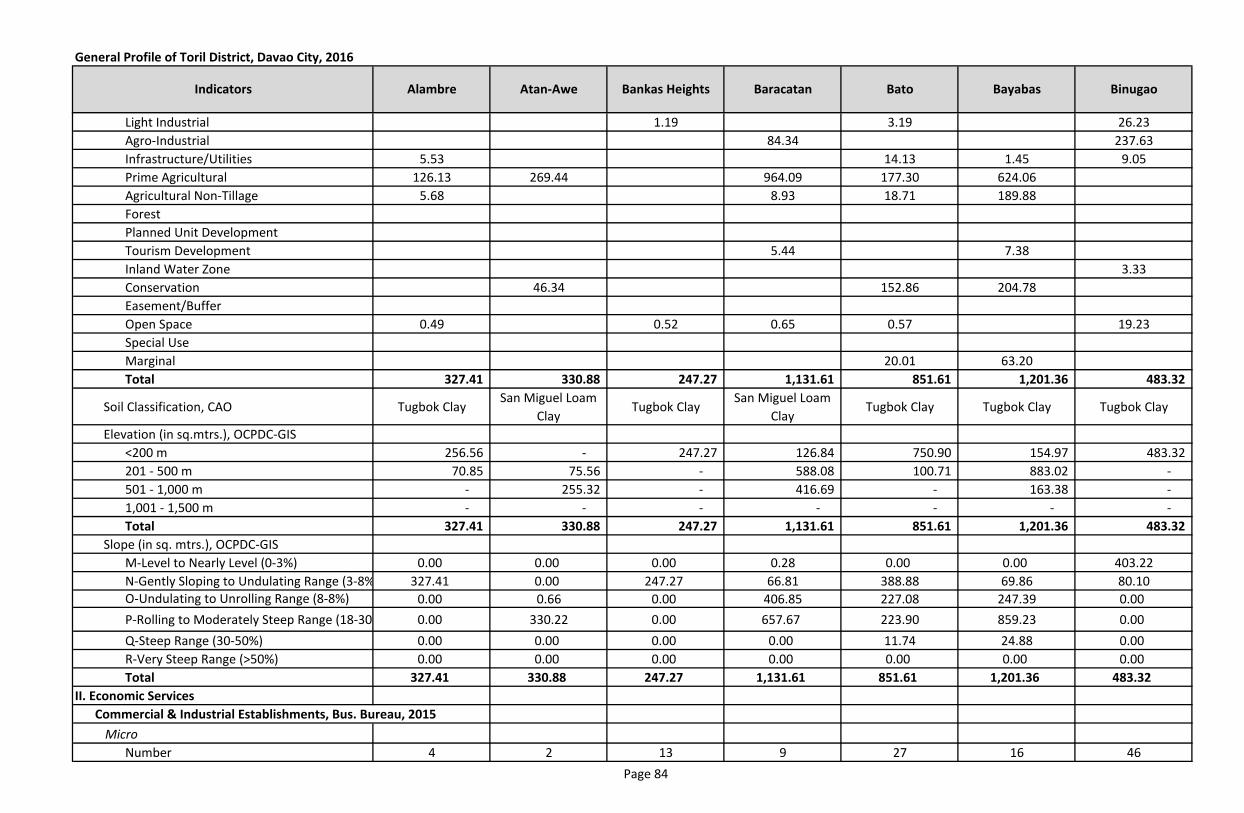
General Profile of Toril District, Davao City, 2016
Indicators Alambre Atan-Awe Bankas Heights Baracatan Bato Bayabas Binugao
Light Industrial 1.19 3.19 26.23
Agro-Industrial 84.34 237.63
Infrastructure/Utilities 5.53 14.13 1.45 9.05
Prime Agricultural 126.13 269.44 964.09 177.30 624.06
Agricultural Non-Tillage 5.68 8.93 18.71 189.88
Forest
Planned Unit Development
Tourism Development 5.44 7.38
Inland Water Zone 3.33
Conservation 46.34 152.86 204.78
Easement/Buffer
Open Space 0.49 0.52 0.65 0.57 19.23
Special Use
Marginal 20.01 63.20
Total 327.41 330.88 247.27 1,131.61 851.61 1,201.36 483.32
Soil Classification, CAO Tugbok ClaySan Miguel Loam
ClayTugbok Clay
San Miguel Loam
ClayTugbok Clay Tugbok Clay Tugbok Clay
Elevation (in sq.mtrs.), OCPDC-GIS
<200 m 256.56 - 247.27 126.84 750.90 154.97 483.32
201 - 500 m 70.85 75.56 - 588.08 100.71 883.02 -
501 - 1,000 m - 255.32 - 416.69 - 163.38 -
1,001 - 1,500 m - - - - - - -
Total 327.41 330.88 247.27 1,131.61 851.61 1,201.36 483.32
Slope (in sq. mtrs.), OCPDC-GIS
M-Level to Nearly Level (0-3%) 0.00 0.00 0.00 0.28 0.00 0.00 403.22
N-Gently Sloping to Undulating Range (3-8%) 327.41 0.00 247.27 66.81 388.88 69.86 80.10
O-Undulating to Unrolling Range (8-8%) 0.00 0.66 0.00 406.85 227.08 247.39 0.00
P-Rolling to Moderately Steep Range (18-30%) 0.00 330.22 0.00 657.67 223.90 859.23 0.00
Q-Steep Range (30-50%) 0.00 0.00 0.00 0.00 11.74 24.88 0.00
R-Very Steep Range (>50%) 0.00 0.00 0.00 0.00 0.00 0.00 0.00
Total 327.41 330.88 247.27 1,131.61 851.61 1,201.36 483.32
II. Economic Services
Commercial & Industrial Establishments, Bus. Bureau, 2015
Micro
Number 4 2 13 9 27 16 46
Page 84
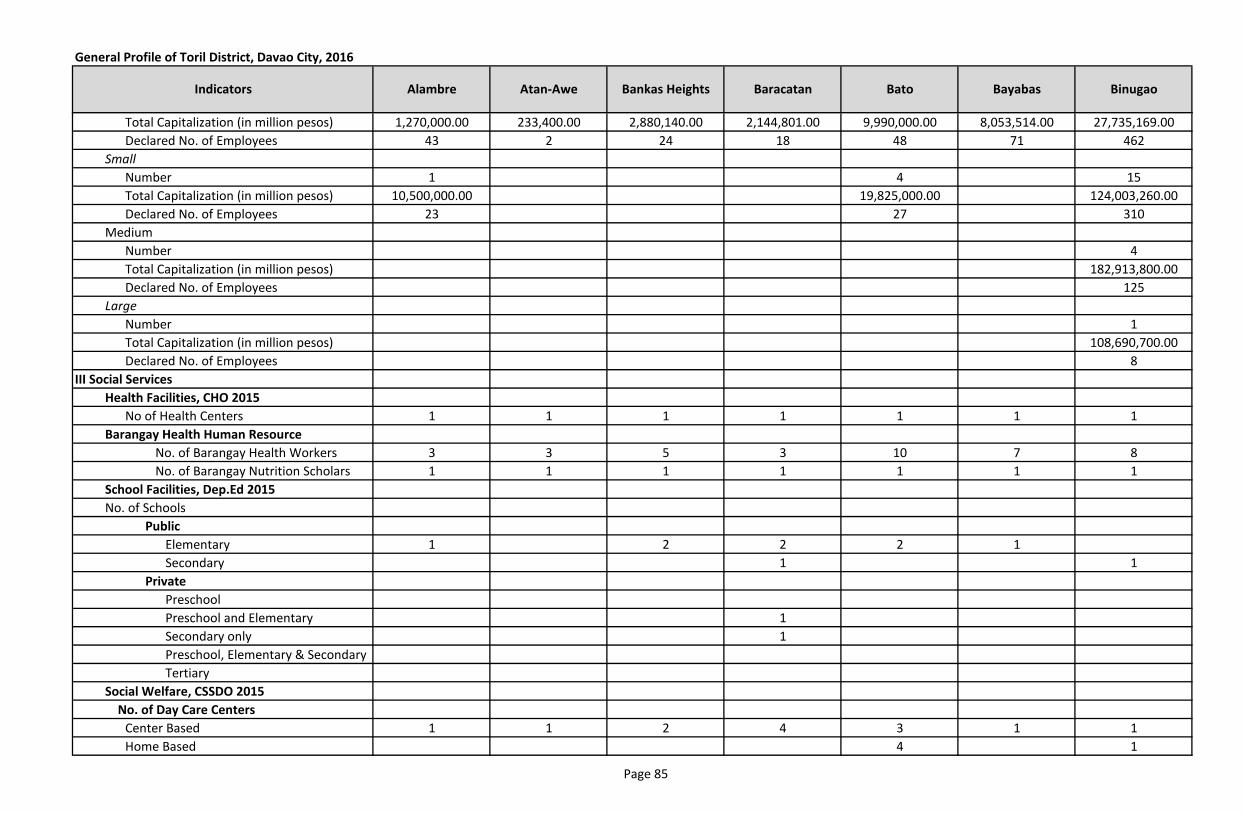
General Profile of Toril District, Davao City, 2016
Indicators Alambre Atan-Awe Bankas Heights Baracatan Bato Bayabas Binugao
Total Capitalization (in million pesos) 1,270,000.00 233,400.00 2,880,140.00 2,144,801.00 9,990,000.00 8,053,514.00 27,735,169.00
Declared No. of Employees 43 2 24 18 48 71 462
Small
Number 1 4 15
Total Capitalization (in million pesos) 10,500,000.00 19,825,000.00 124,003,260.00
Declared No. of Employees 23 27 310
Medium
Number 4
Total Capitalization (in million pesos) 182,913,800.00
Declared No. of Employees 125
Large
Number 1
Total Capitalization (in million pesos) 108,690,700.00
Declared No. of Employees 8
III Social Services
Health Facilities, CHO 2015
No of Health Centers 1 1 1 1 1 1 1
Barangay Health Human Resource
No. of Barangay Health Workers 3 3 5 3 10 7 8
No. of Barangay Nutrition Scholars 1 1 1 1 1 1 1
School Facilities, Dep.Ed 2015
No. of Schools
Public
Elementary 1 2 2 2 1
Secondary 1 1
Private
Preschool
Preschool and Elementary 1
Secondary only 1
Preschool, Elementary & Secondary
Tertiary
Social Welfare, CSSDO 2015
No. of Day Care Centers
Center Based 1 1 2 4 3 1 1
Home Based 4 1
Page 85
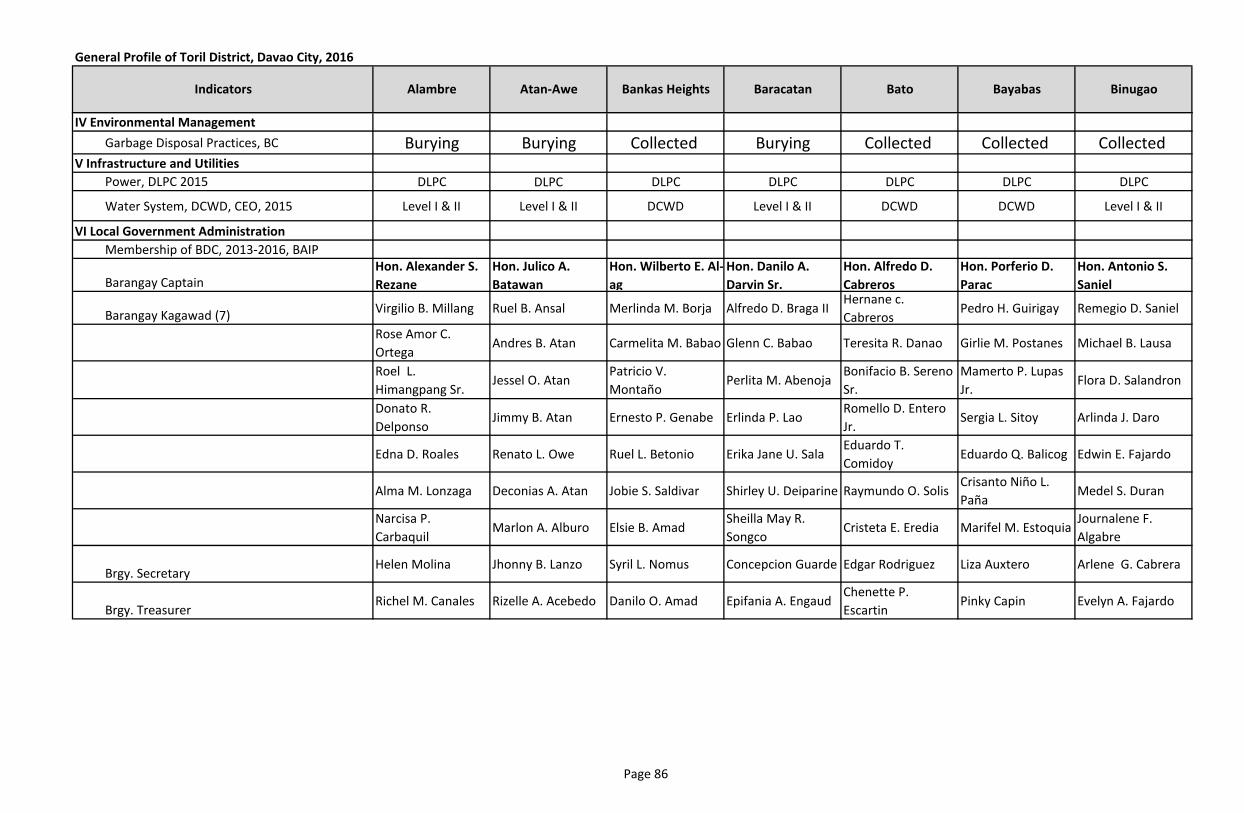
General Profile of Toril District, Davao City, 2016
Indicators Alambre Atan-Awe Bankas Heights Baracatan Bato Bayabas Binugao
IV Environmental Management
Garbage Disposal Practices, BC Burying Burying Collected Burying Collected Collected Collected V Infrastructure and Utilities
Power, DLPC 2015 DLPC DLPC DLPC DLPC DLPC DLPC DLPC
Water System, DCWD, CEO, 2015 Level I & II Level I & II DCWD Level I & II DCWD DCWD Level I & II
VI Local Government Administration
Membership of BDC, 2013-2016, BAIP
Barangay CaptainHon. Alexander S.
Rezane
Hon. Julico A.
Batawan
Hon. Wilberto E. Al-
ag
Hon. Danilo A.
Darvin Sr.
Hon. Alfredo D.
Cabreros
Hon. Porferio D.
Parac
Hon. Antonio S.
Saniel
Barangay Kagawad (7)Virgilio B. Millang Ruel B. Ansal Merlinda M. Borja Alfredo D. Braga II
Hernane c.
CabrerosPedro H. Guirigay Remegio D. Saniel
Rose Amor C.
OrtegaAndres B. Atan Carmelita M. Babao Glenn C. Babao Teresita R. Danao Girlie M. Postanes Michael B. Lausa
Roel L.
Himangpang Sr.Jessel O. Atan
Patricio V.
MontañoPerlita M. Abenoja
Bonifacio B. Sereno
Sr.
Mamerto P. Lupas
Jr.Flora D. Salandron
Donato R.
DelponsoJimmy B. Atan Ernesto P. Genabe Erlinda P. Lao
Romello D. Entero
Jr.Sergia L. Sitoy Arlinda J. Daro
Edna D. Roales Renato L. Owe Ruel L. Betonio Erika Jane U. SalaEduardo T.
ComidoyEduardo Q. Balicog Edwin E. Fajardo
Alma M. Lonzaga Deconias A. Atan Jobie S. Saldivar Shirley U. Deiparine Raymundo O. SolisCrisanto Niño L.
PañaMedel S. Duran
Narcisa P.
CarbaquilMarlon A. Alburo Elsie B. Amad
Sheilla May R.
SongcoCristeta E. Eredia Marifel M. Estoquia
Journalene F.
Algabre
Brgy. SecretaryHelen Molina Jhonny B. Lanzo Syril L. Nomus Concepcion Guarde Edgar Rodriguez Liza Auxtero Arlene G. Cabrera
Brgy. TreasurerRichel M. Canales Rizelle A. Acebedo Danilo O. Amad Epifania A. Engaud
Chenette P.
EscartinPinky Capin Evelyn A. Fajardo
Page 86
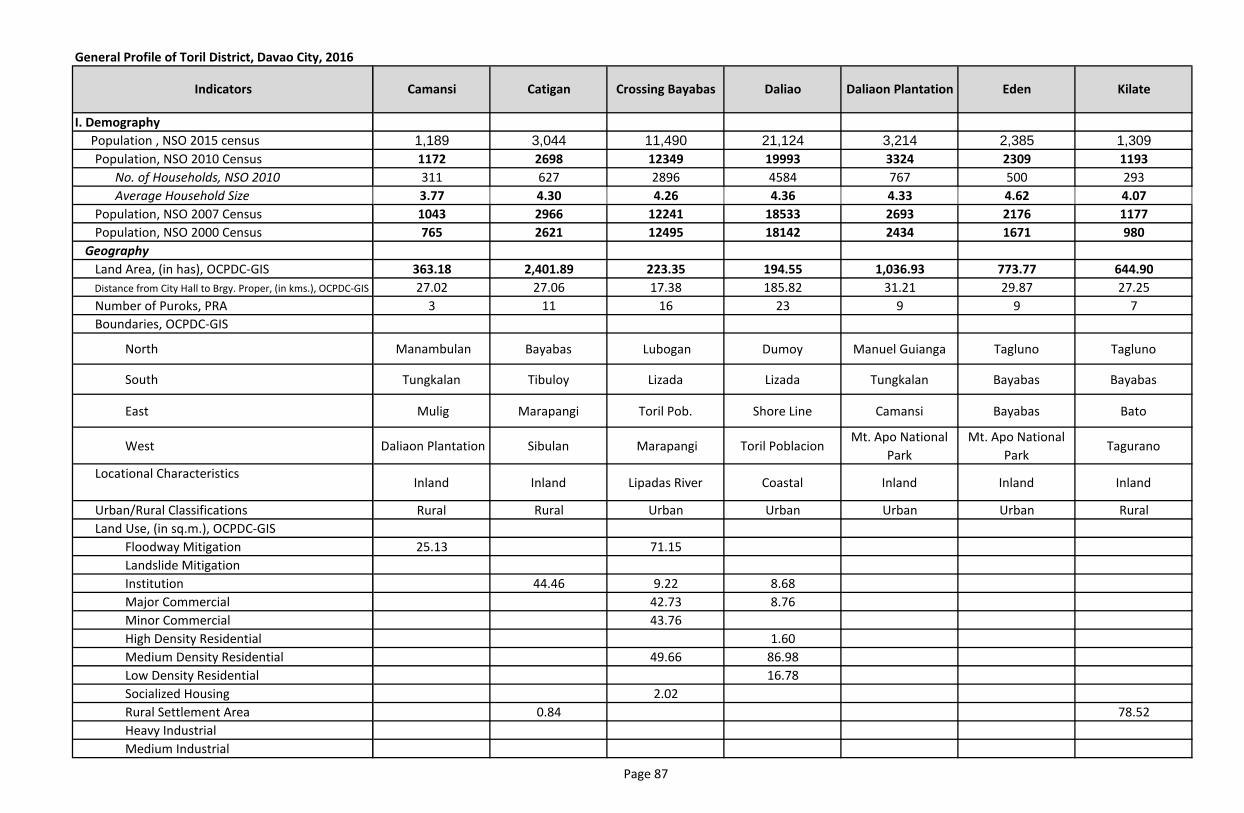
General Profile of Toril District, Davao City, 2016
I. Demography
Population , NSO 2015 census
Population, NSO 2010 Census
No. of Households, NSO 2010
Average Household Size
Population, NSO 2007 Census
Population, NSO 2000 Census
Geography
Land Area, (in has), OCPDC-GIS
Distance from City Hall to Brgy. Proper, (in kms.), OCPDC-GIS
Number of Puroks, PRA
Boundaries, OCPDC-GIS
North
South
East
West
Locational Characteristics
Urban/Rural Classifications
Land Use, (in sq.m.), OCPDC-GIS
Floodway Mitigation
Landslide Mitigation
Institution
Major Commercial
Minor Commercial
High Density Residential
Medium Density Residential
Low Density Residential
Socialized Housing
Rural Settlement Area
Heavy Industrial
Medium Industrial
Indicators
1,189 3,044 11,490 21,124 3,214 2,385 1,309
1172 2698 12349 19993 3324 2309 1193
311 627 2896 4584 767 500 293
3.77 4.30 4.26 4.36 4.33 4.62 4.07
1043 2966 12241 18533 2693 2176 1177
765 2621 12495 18142 2434 1671 980
363.18 2,401.89 223.35 194.55 1,036.93 773.77 644.90
27.02 27.06 17.38 185.82 31.21 29.87 27.25
3 11 16 23 9 9 7
Manambulan Bayabas Lubogan Dumoy Manuel Guianga Tagluno Tagluno
Tungkalan Tibuloy Lizada Lizada Tungkalan Bayabas Bayabas
Mulig Marapangi Toril Pob. Shore Line Camansi Bayabas Bato
Daliaon Plantation Sibulan Marapangi Toril PoblacionMt. Apo National
Park
Mt. Apo National
ParkTagurano
Inland Inland Lipadas River Coastal Inland Inland Inland
Rural Rural Urban Urban Urban Urban Rural
25.13 71.15
44.46 9.22 8.68
42.73 8.76
43.76
1.60
49.66 86.98
16.78
2.02
0.84 78.52
Camansi Catigan Crossing Bayabas Daliao Daliaon Plantation Eden Kilate
Page 87
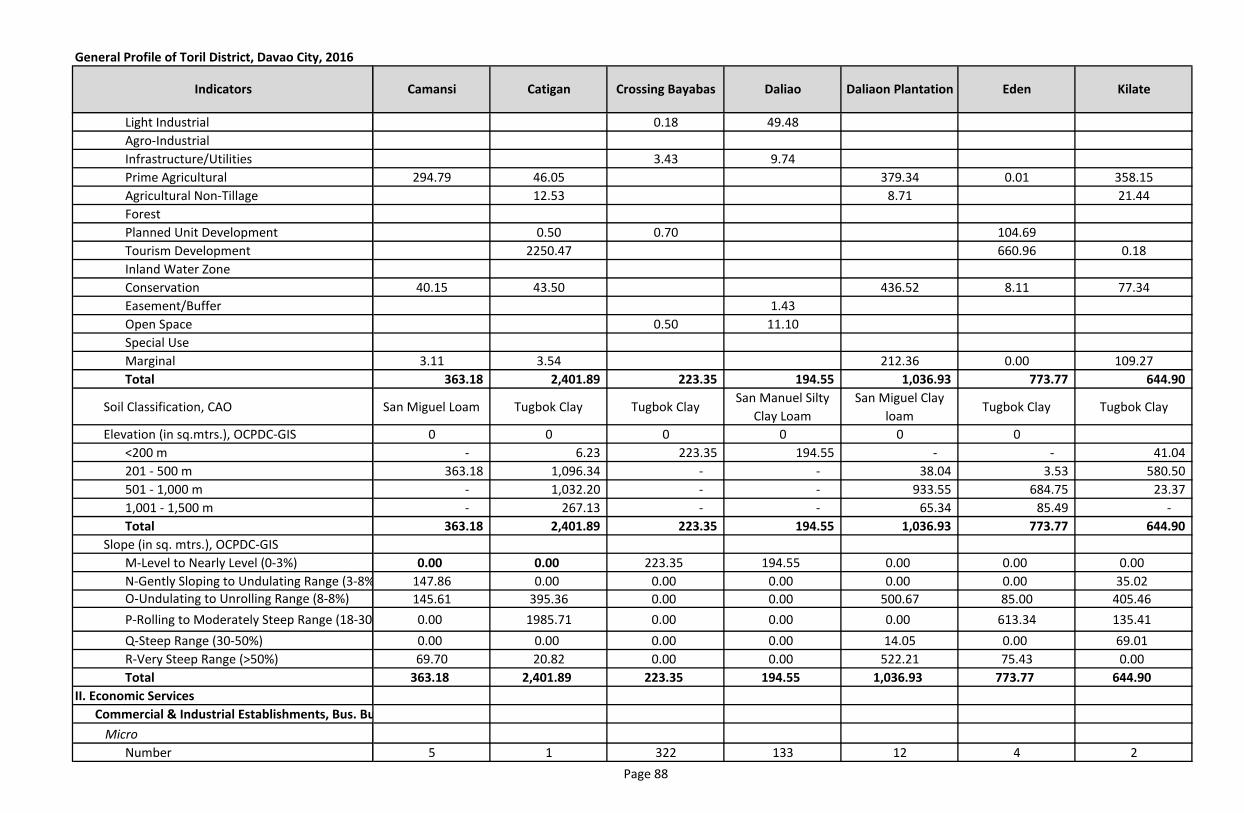
General Profile of Toril District, Davao City, 2016
Indicators
Light Industrial
Agro-Industrial
Infrastructure/Utilities
Prime Agricultural
Agricultural Non-Tillage
Forest
Planned Unit Development
Tourism Development
Inland Water Zone
Conservation
Easement/Buffer
Open Space
Special Use
Marginal
Total
Soil Classification, CAO
Elevation (in sq.mtrs.), OCPDC-GIS
<200 m
201 - 500 m
501 - 1,000 m
1,001 - 1,500 m
Total
Slope (in sq. mtrs.), OCPDC-GIS
M-Level to Nearly Level (0-3%)
N-Gently Sloping to Undulating Range (3-8%)
O-Undulating to Unrolling Range (8-8%)
P-Rolling to Moderately Steep Range (18-30%)
Q-Steep Range (30-50%)
R-Very Steep Range (>50%)
Total
II. Economic Services
Commercial & Industrial Establishments, Bus. Bureau, 2015
Micro
Number
Camansi Catigan Crossing Bayabas Daliao Daliaon Plantation Eden Kilate
0.18 49.48
3.43 9.74
294.79 46.05 379.34 0.01 358.15
12.53 8.71 21.44
0.50 0.70 104.69
2250.47 660.96 0.18
40.15 43.50 436.52 8.11 77.34
1.43
0.50 11.10
3.11 3.54 212.36 0.00 109.27
363.18 2,401.89 223.35 194.55 1,036.93 773.77 644.90
San Miguel Loam Tugbok Clay Tugbok ClaySan Manuel Silty
Clay Loam
San Miguel Clay
loamTugbok Clay Tugbok Clay
0 0 0 0 0 0
- 6.23 223.35 194.55 - - 41.04
363.18 1,096.34 - - 38.04 3.53 580.50
- 1,032.20 - - 933.55 684.75 23.37
- 267.13 - - 65.34 85.49 -
363.18 2,401.89 223.35 194.55 1,036.93 773.77 644.90
0.00 0.00 223.35 194.55 0.00 0.00 0.00
147.86 0.00 0.00 0.00 0.00 0.00 35.02
145.61 395.36 0.00 0.00 500.67 85.00 405.46
0.00 1985.71 0.00 0.00 0.00 613.34 135.41
0.00 0.00 0.00 0.00 14.05 0.00 69.01
69.70 20.82 0.00 0.00 522.21 75.43 0.00
363.18 2,401.89 223.35 194.55 1,036.93 773.77 644.90
5 1 322 133 12 4 2
Page 88
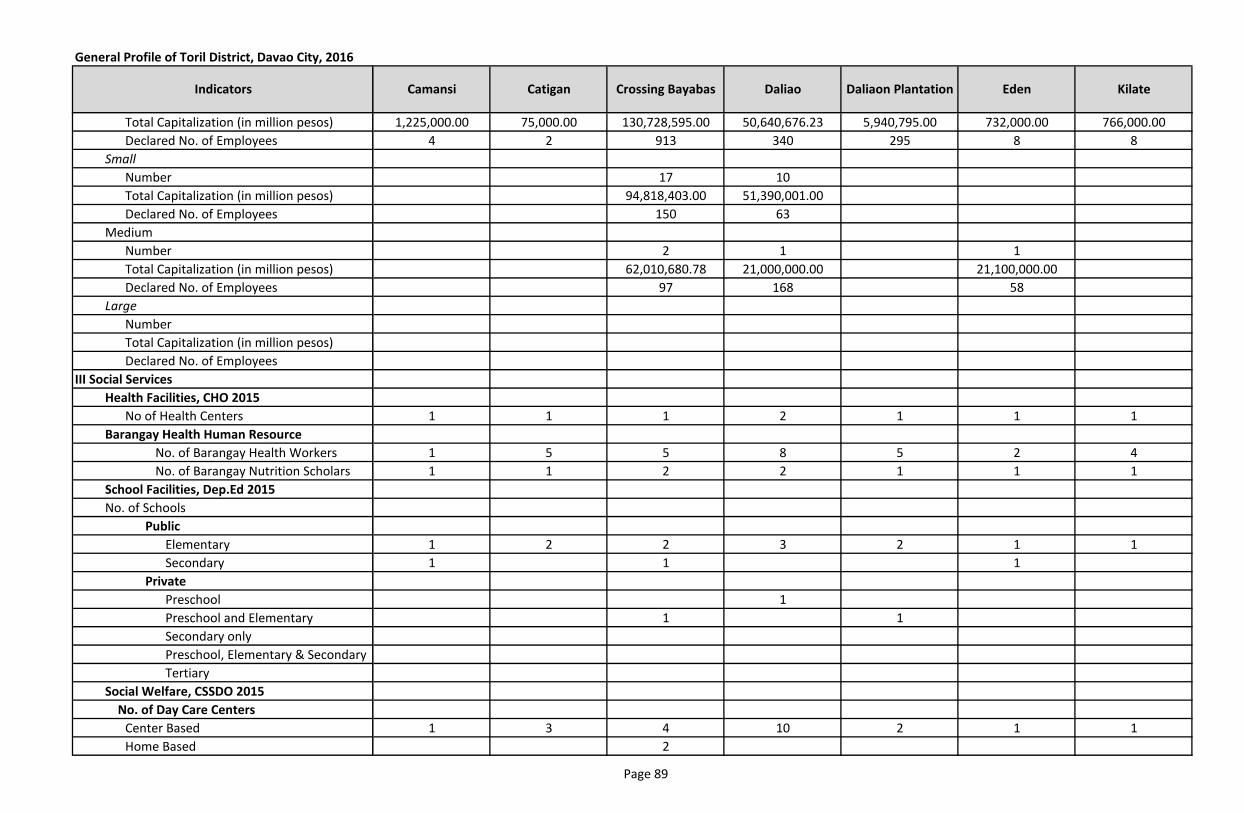
General Profile of Toril District, Davao City, 2016
Indicators
Total Capitalization (in million pesos)
Declared No. of Employees
Small
Number
Total Capitalization (in million pesos)
Declared No. of Employees
Medium
Number
Total Capitalization (in million pesos)
Declared No. of Employees
Large
Number
Total Capitalization (in million pesos)
Declared No. of Employees
III Social Services
Health Facilities, CHO 2015
No of Health Centers
Barangay Health Human Resource
No. of Barangay Health Workers
No. of Barangay Nutrition Scholars
School Facilities, Dep.Ed 2015
No. of Schools
Public
Elementary
Secondary
Private
Preschool
Preschool and Elementary
Secondary only
Preschool, Elementary & Secondary
Tertiary
Social Welfare, CSSDO 2015
No. of Day Care Centers
Center Based
Home Based
Camansi Catigan Crossing Bayabas Daliao Daliaon Plantation Eden Kilate
1,225,000.00 75,000.00 130,728,595.00 50,640,676.23 5,940,795.00 732,000.00 766,000.00
4 2 913 340 295 8 8
17 10
94,818,403.00 51,390,001.00
150 63
2 1 1
62,010,680.78 21,000,000.00 21,100,000.00
97 168 58
1 1 1 2 1 1 1
1 5 5 8 5 2 4
1 1 2 2 1 1 1
1 2 2 3 2 1 1
1 1 1
1
1 1
1 3 4 10 2 1 1
2
Page 89
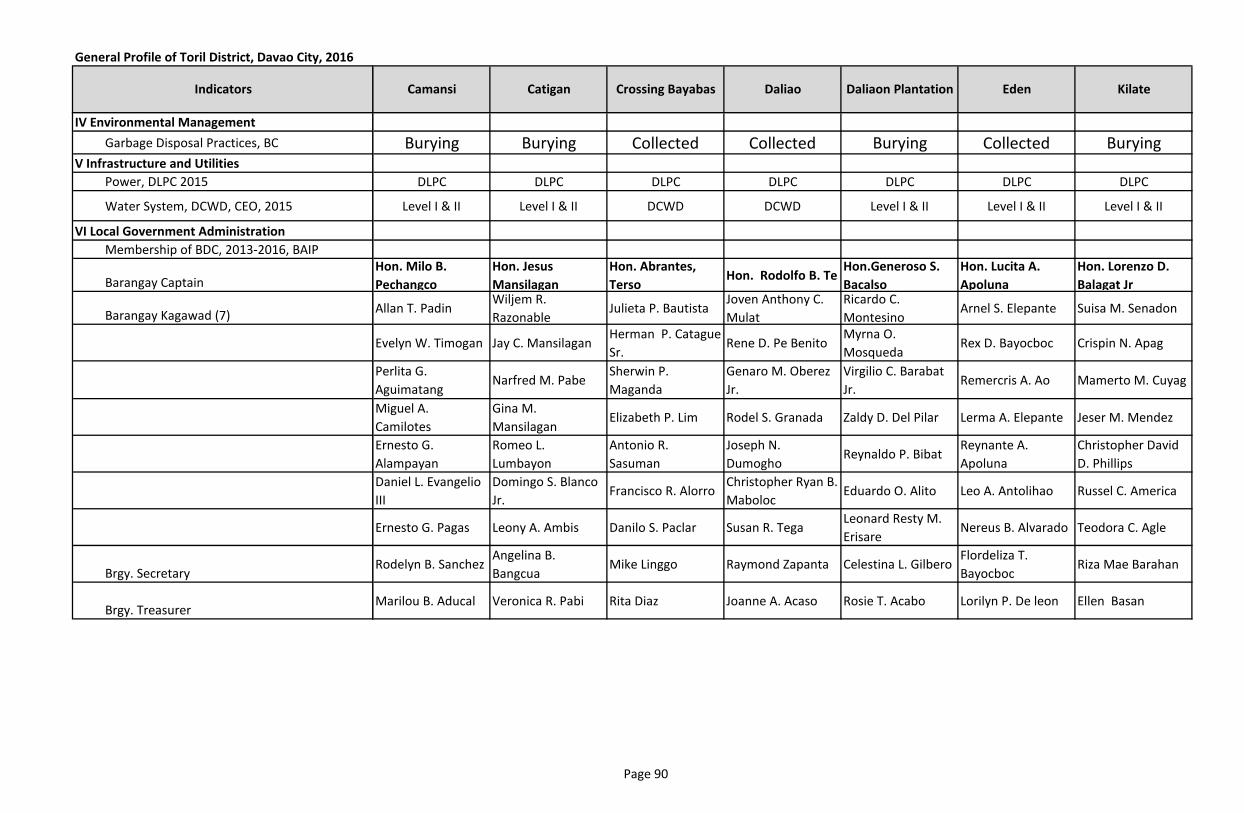
General Profile of Toril District, Davao City, 2016
Indicators
IV Environmental Management
Garbage Disposal Practices, BC
V Infrastructure and Utilities
Power, DLPC 2015
Water System, DCWD, CEO, 2015
VI Local Government Administration
Membership of BDC, 2013-2016, BAIP
Barangay Captain
Barangay Kagawad (7)
Brgy. Secretary
Brgy. Treasurer
Camansi Catigan Crossing Bayabas Daliao Daliaon Plantation Eden Kilate
Burying Burying Collected Collected Burying Collected Burying
DLPC DLPC DLPC DLPC DLPC DLPC DLPC
Level I & II Level I & II DCWD DCWD Level I & II Level I & II Level I & II
Hon. Milo B.
Pechangco
Hon. Jesus
Mansilagan
Hon. Abrantes,
Terso Hon. Rodolfo B. Te
Hon.Generoso S.
Bacalso
Hon. Lucita A.
Apoluna
Hon. Lorenzo D.
Balagat Jr
Allan T. PadinWiljem R.
RazonableJulieta P. Bautista
Joven Anthony C.
Mulat
Ricardo C.
MontesinoArnel S. Elepante Suisa M. Senadon
Evelyn W. Timogan Jay C. MansilaganHerman P. Catague
Sr.Rene D. Pe Benito
Myrna O.
MosquedaRex D. Bayocboc Crispin N. Apag
Perlita G.
AguimatangNarfred M. Pabe
Sherwin P.
Maganda
Genaro M. Oberez
Jr.
Virgilio C. Barabat
Jr.Remercris A. Ao Mamerto M. Cuyag
Miguel A.
Camilotes
Gina M.
MansilaganElizabeth P. Lim Rodel S. Granada Zaldy D. Del Pilar Lerma A. Elepante Jeser M. Mendez
Ernesto G.
Alampayan
Romeo L.
Lumbayon
Antonio R.
Sasuman
Joseph N.
DumoghoReynaldo P. Bibat
Reynante A.
Apoluna
Christopher David
D. Phillips
Daniel L. Evangelio
III
Domingo S. Blanco
Jr.Francisco R. Alorro
Christopher Ryan B.
MabolocEduardo O. Alito Leo A. Antolihao Russel C. America
Ernesto G. Pagas Leony A. Ambis Danilo S. Paclar Susan R. TegaLeonard Resty M.
ErisareNereus B. Alvarado Teodora C. Agle
Rodelyn B. SanchezAngelina B.
BangcuaMike Linggo Raymond Zapanta Celestina L. Gilbero
Flordeliza T.
BayocbocRiza Mae Barahan
Marilou B. Aducal Veronica R. Pabi Rita Diaz Joanne A. Acaso Rosie T. Acabo Lorilyn P. De leon Ellen Basan
Page 90

General Profile of Toril District, Davao City, 2016
I. Demography
Population , NSO 2015 census
Population, NSO 2010 Census
No. of Households, NSO 2010
Average Household Size
Population, NSO 2007 Census
Population, NSO 2000 Census
Geography
Land Area, (in has), OCPDC-GIS
Distance from City Hall to Brgy. Proper, (in kms.), OCPDC-GIS
Number of Puroks, PRA
Boundaries, OCPDC-GIS
North
South
East
West
Locational Characteristics
Urban/Rural Classifications
Land Use, (in sq.m.), OCPDC-GIS
Floodway Mitigation
Landslide Mitigation
Institution
Major Commercial
Minor Commercial
High Density Residential
Medium Density Residential
Low Density Residential
Socialized Housing
Rural Settlement Area
Heavy Industrial
Medium Industrial
Indicators
20,112 12,156 6,889 2,477 2,479 7,140 1,391
16725 9719 6128 2101 2365 5792 1323
3813 2193 1344 514 536 1264 293
4.39 4.43 4.56 4.09 4.41 4.58 4.52
16006 8744 5534 2693 1865 6021 1256
11604 7200 3289 2450 2463 5010 1162
436.16 208.96 703.76 998.88 1,699.90 963.70 564.16
20.15 19.79 20.14 23.98 38.34 22.23 27.31
23 18 11 8 15 16 7
Crossing Bayabas Bankas Heights Bato ManambulanMt. Apo Nat.
Park/CatiganMarapangi Tungkalan
Sirawan Crossing Bayabas Sirawan AlambreProvince of Davao
del SurBinugao Kilate
Daliao Baliok Crossing Bayabas Bago OshiroCatigan / Baracatan
/ Atan aweLizada Alambre
Marapangi Bato Bayabas / Catigan Camansi Mt. Apo Nat. Park Catigan Tungkalan
Coastal Lipadas River Lipadas River Inland InlandRiverbank /
CoastalInland
Urban Urban Rural Rural Rural Rural Rural
74.32 64.17 121.12 84.38 11.88 12.27
131.17
2.51 0.02 2.51 17.15
37.35 16.44 0.65
16.66
261.05 10.18 22.93 9.27
104.71 167.17 475.43 175.96 3.11
5.29
59.91
29.54 54.28
Lizada Lubogan Marapangi Mulig Sibulan Sirawan Tagluno
Page 91
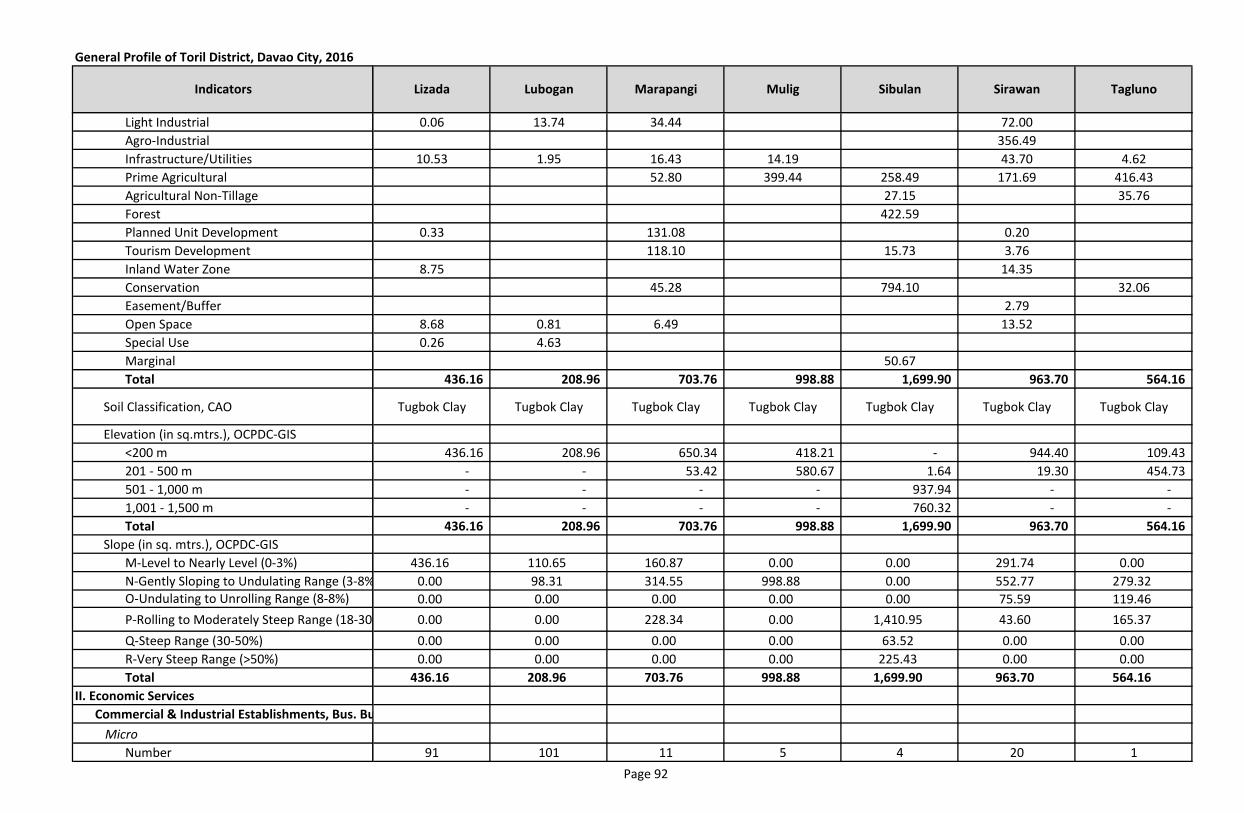
General Profile of Toril District, Davao City, 2016
Indicators
Light Industrial
Agro-Industrial
Infrastructure/Utilities
Prime Agricultural
Agricultural Non-Tillage
Forest
Planned Unit Development
Tourism Development
Inland Water Zone
Conservation
Easement/Buffer
Open Space
Special Use
Marginal
Total
Soil Classification, CAO
Elevation (in sq.mtrs.), OCPDC-GIS
<200 m
201 - 500 m
501 - 1,000 m
1,001 - 1,500 m
Total
Slope (in sq. mtrs.), OCPDC-GIS
M-Level to Nearly Level (0-3%)
N-Gently Sloping to Undulating Range (3-8%)
O-Undulating to Unrolling Range (8-8%)
P-Rolling to Moderately Steep Range (18-30%)
Q-Steep Range (30-50%)
R-Very Steep Range (>50%)
Total
II. Economic Services
Commercial & Industrial Establishments, Bus. Bureau, 2015
Micro
Number
Lizada Lubogan Marapangi Mulig Sibulan Sirawan Tagluno
0.06 13.74 34.44 72.00
356.49
10.53 1.95 16.43 14.19 43.70 4.62
52.80 399.44 258.49 171.69 416.43
27.15 35.76
422.59
0.33 131.08 0.20
118.10 15.73 3.76
8.75 14.35
45.28 794.10 32.06
2.79
8.68 0.81 6.49 13.52
0.26 4.63
50.67
436.16 208.96 703.76 998.88 1,699.90 963.70 564.16
Tugbok Clay Tugbok Clay Tugbok Clay Tugbok Clay Tugbok Clay Tugbok Clay Tugbok Clay
436.16 208.96 650.34 418.21 - 944.40 109.43
- - 53.42 580.67 1.64 19.30 454.73
- - - - 937.94 - -
- - - - 760.32 - -
436.16 208.96 703.76 998.88 1,699.90 963.70 564.16
436.16 110.65 160.87 0.00 0.00 291.74 0.00
0.00 98.31 314.55 998.88 0.00 552.77 279.32
0.00 0.00 0.00 0.00 0.00 75.59 119.46
0.00 0.00 228.34 0.00 1,410.95 43.60 165.37
0.00 0.00 0.00 0.00 63.52 0.00 0.00
0.00 0.00 0.00 0.00 225.43 0.00 0.00
436.16 208.96 703.76 998.88 1,699.90 963.70 564.16
91 101 11 5 4 20 1
Page 92
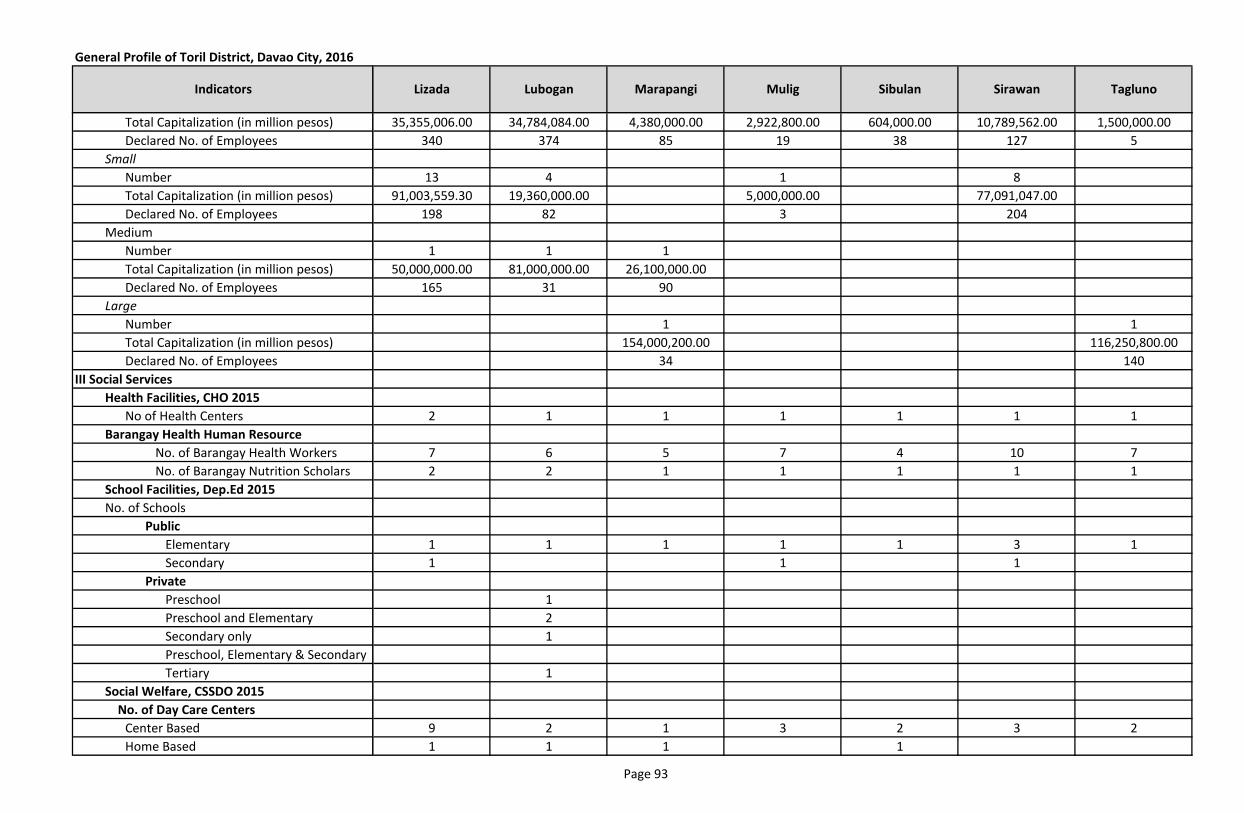
General Profile of Toril District, Davao City, 2016
Indicators
Total Capitalization (in million pesos)
Declared No. of Employees
Small
Number
Total Capitalization (in million pesos)
Declared No. of Employees
Medium
Number
Total Capitalization (in million pesos)
Declared No. of Employees
Large
Number
Total Capitalization (in million pesos)
Declared No. of Employees
III Social Services
Health Facilities, CHO 2015
No of Health Centers
Barangay Health Human Resource
No. of Barangay Health Workers
No. of Barangay Nutrition Scholars
School Facilities, Dep.Ed 2015
No. of Schools
Public
Elementary
Secondary
Private
Preschool
Preschool and Elementary
Secondary only
Preschool, Elementary & Secondary
Tertiary
Social Welfare, CSSDO 2015
No. of Day Care Centers
Center Based
Home Based
Lizada Lubogan Marapangi Mulig Sibulan Sirawan Tagluno
35,355,006.00 34,784,084.00 4,380,000.00 2,922,800.00 604,000.00 10,789,562.00 1,500,000.00
340 374 85 19 38 127 5
13 4 1 8
91,003,559.30 19,360,000.00 5,000,000.00 77,091,047.00
198 82 3 204
1 1 1
50,000,000.00 81,000,000.00 26,100,000.00
165 31 90
1 1
154,000,200.00 116,250,800.00
34 140
2 1 1 1 1 1 1
7 6 5 7 4 10 7
2 2 1 1 1 1 1
1 1 1 1 1 3 1
1 1 1
1
2
1
1
9 2 1 3 2 3 2
1 1 1 1
Page 93
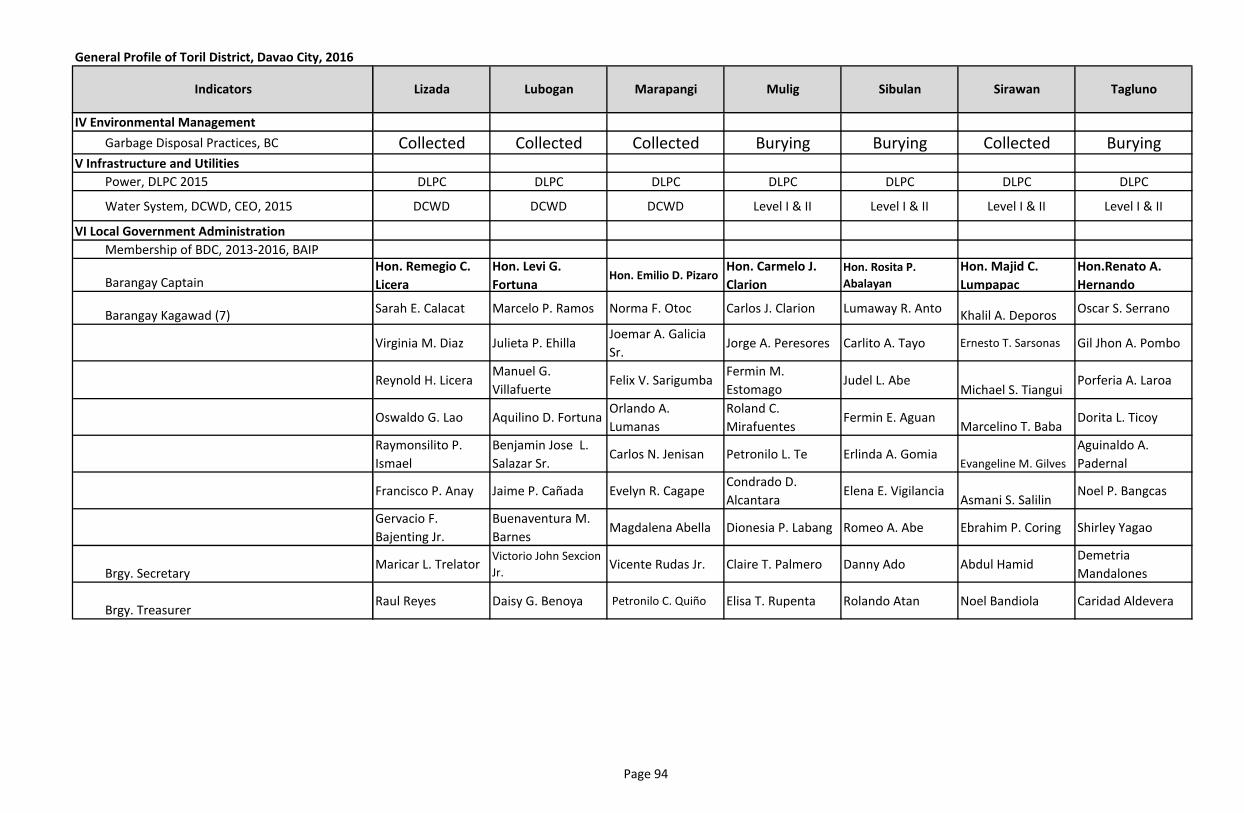
General Profile of Toril District, Davao City, 2016
Indicators
IV Environmental Management
Garbage Disposal Practices, BC
V Infrastructure and Utilities
Power, DLPC 2015
Water System, DCWD, CEO, 2015
VI Local Government Administration
Membership of BDC, 2013-2016, BAIP
Barangay Captain
Barangay Kagawad (7)
Brgy. Secretary
Brgy. Treasurer
Lizada Lubogan Marapangi Mulig Sibulan Sirawan Tagluno
Collected Collected Collected Burying Burying Collected Burying
DLPC DLPC DLPC DLPC DLPC DLPC DLPC
DCWD DCWD DCWD Level I & II Level I & II Level I & II Level I & II
Hon. Remegio C.
Licera
Hon. Levi G.
FortunaHon. Emilio D. Pizaro
Hon. Carmelo J.
Clarion
Hon. Rosita P.
Abalayan
Hon. Majid C.
Lumpapac
Hon.Renato A.
Hernando
Sarah E. Calacat Marcelo P. Ramos Norma F. Otoc Carlos J. Clarion Lumaway R. AntoKhalil A. Deporos
Oscar S. Serrano
Virginia M. Diaz Julieta P. EhillaJoemar A. Galicia
Sr.Jorge A. Peresores Carlito A. Tayo Ernesto T. Sarsonas Gil Jhon A. Pombo
Reynold H. LiceraManuel G.
VillafuerteFelix V. Sarigumba
Fermin M.
EstomagoJudel L. Abe
Michael S. TianguiPorferia A. Laroa
Oswaldo G. Lao Aquilino D. FortunaOrlando A.
Lumanas
Roland C.
MirafuentesFermin E. Aguan
Marcelino T. BabaDorita L. Ticoy
Raymonsilito P.
Ismael
Benjamin Jose L.
Salazar Sr.Carlos N. Jenisan Petronilo L. Te Erlinda A. Gomia
Evangeline M. Gilves
Aguinaldo A.
Padernal
Francisco P. Anay Jaime P. Cañada Evelyn R. CagapeCondrado D.
AlcantaraElena E. Vigilancia
Asmani S. SalilinNoel P. Bangcas
Gervacio F.
Bajenting Jr.
Buenaventura M.
BarnesMagdalena Abella Dionesia P. Labang Romeo A. Abe Ebrahim P. Coring Shirley Yagao
Maricar L. TrelatorVictorio John Sexcion
Jr.Vicente Rudas Jr. Claire T. Palmero Danny Ado Abdul Hamid
Demetria
Mandalones
Raul Reyes Daisy G. Benoya Petronilo C. Quiño Elisa T. Rupenta Rolando Atan Noel Bandiola Caridad Aldevera
Page 94
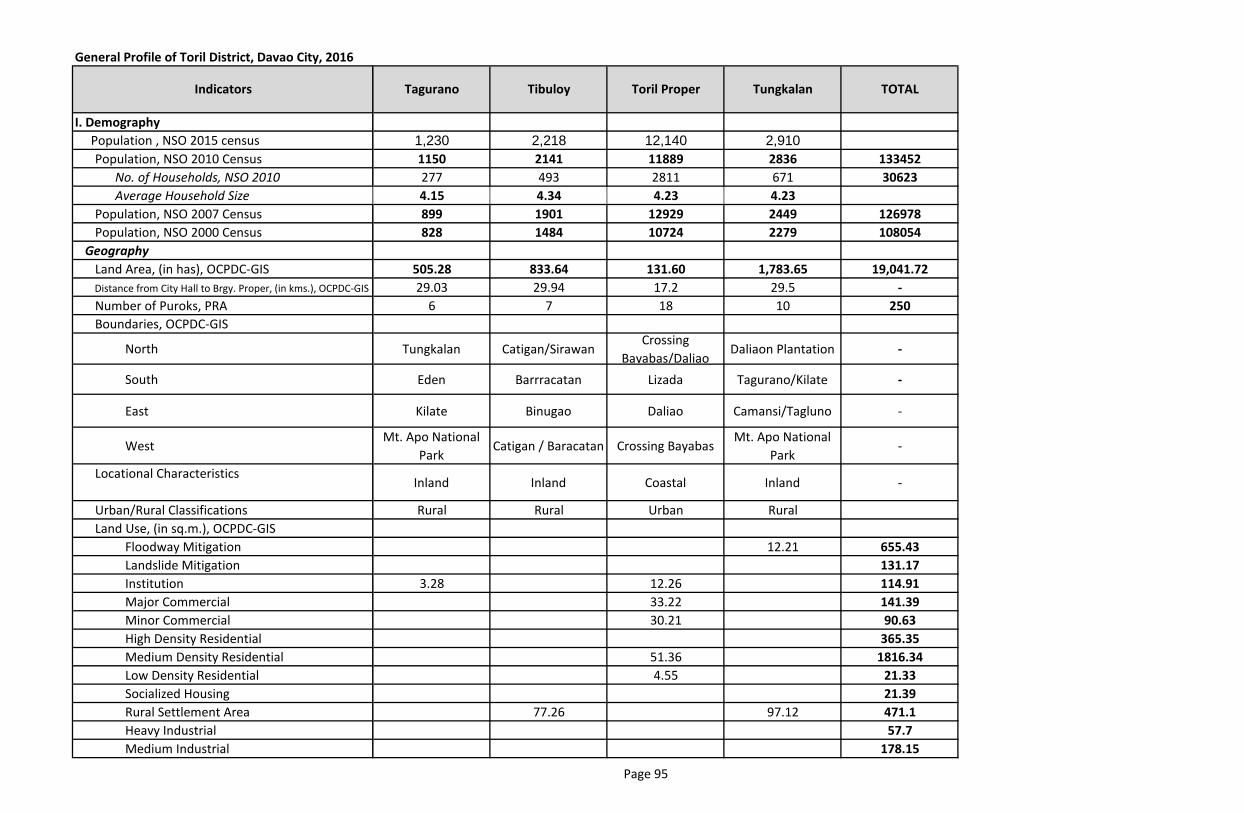
General Profile of Toril District, Davao City, 2016
I. Demography
Population , NSO 2015 census
Population, NSO 2010 Census
No. of Households, NSO 2010
Average Household Size
Population, NSO 2007 Census
Population, NSO 2000 Census
Geography
Land Area, (in has), OCPDC-GIS
Distance from City Hall to Brgy. Proper, (in kms.), OCPDC-GIS
Number of Puroks, PRA
Boundaries, OCPDC-GIS
North
South
East
West
Locational Characteristics
Urban/Rural Classifications
Land Use, (in sq.m.), OCPDC-GIS
Floodway Mitigation
Landslide Mitigation
Institution
Major Commercial
Minor Commercial
High Density Residential
Medium Density Residential
Low Density Residential
Socialized Housing
Rural Settlement Area
Heavy Industrial
Medium Industrial
Indicators
1,230 2,218 12,140 2,910
1150 2141 11889 2836 133452
277 493 2811 671 30623
4.15 4.34 4.23 4.23
899 1901 12929 2449 126978
828 1484 10724 2279 108054
505.28 833.64 131.60 1,783.65 19,041.72
29.03 29.94 17.2 29.5 -
6 7 18 10 250
Tungkalan Catigan/SirawanCrossing
Bayabas/DaliaoDaliaon Plantation -
Eden Barrracatan Lizada Tagurano/Kilate -
Kilate Binugao Daliao Camansi/Tagluno -
Mt. Apo National
ParkCatigan / Baracatan Crossing Bayabas
Mt. Apo National
Park-
Inland Inland Coastal Inland -
Rural Rural Urban Rural
12.21 655.43
131.17
3.28 12.26 114.91
33.22 141.39
30.21 90.63
365.35
51.36 1816.34
4.55 21.33
21.39
77.26 97.12 471.1
57.7
178.15
Toril Proper Tungkalan TOTALTagurano Tibuloy
Page 95
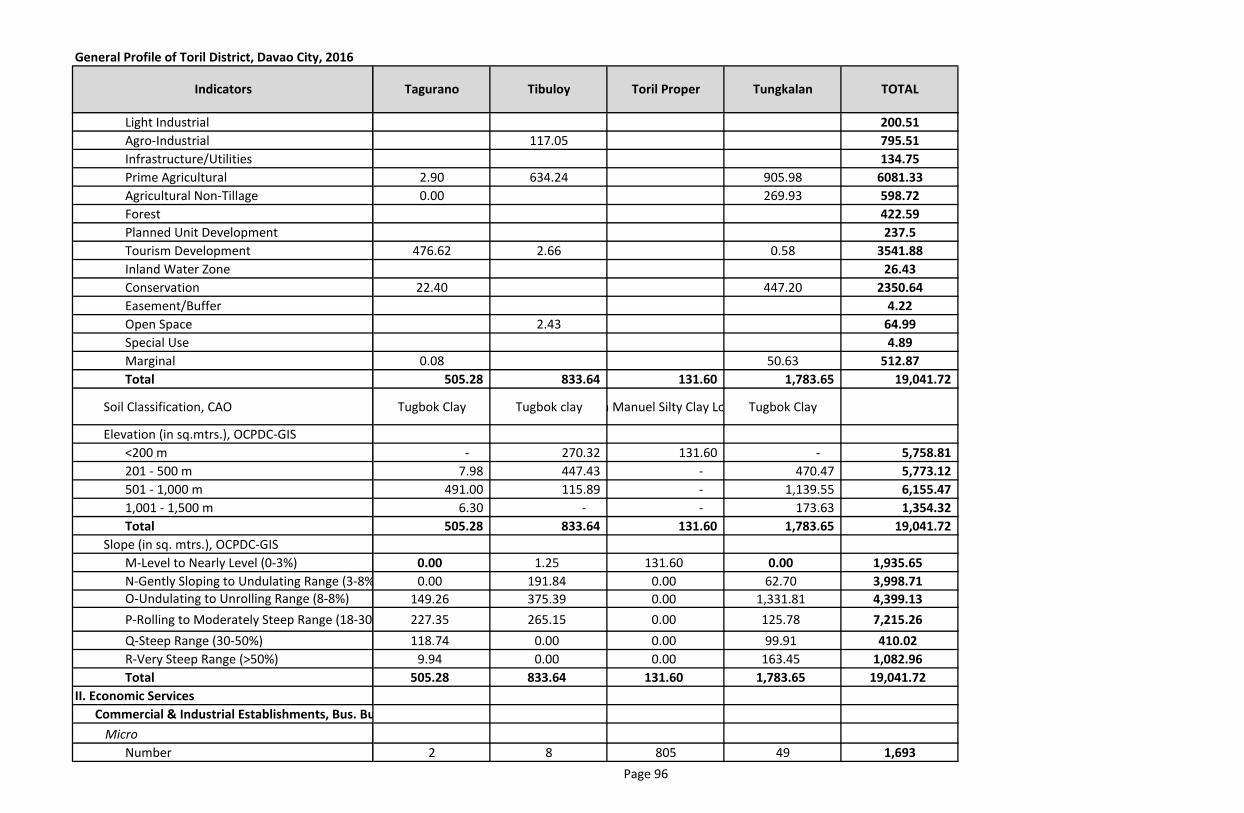
General Profile of Toril District, Davao City, 2016
Indicators
Light Industrial
Agro-Industrial
Infrastructure/Utilities
Prime Agricultural
Agricultural Non-Tillage
Forest
Planned Unit Development
Tourism Development
Inland Water Zone
Conservation
Easement/Buffer
Open Space
Special Use
Marginal
Total
Soil Classification, CAO
Elevation (in sq.mtrs.), OCPDC-GIS
<200 m
201 - 500 m
501 - 1,000 m
1,001 - 1,500 m
Total
Slope (in sq. mtrs.), OCPDC-GIS
M-Level to Nearly Level (0-3%)
N-Gently Sloping to Undulating Range (3-8%)
O-Undulating to Unrolling Range (8-8%)
P-Rolling to Moderately Steep Range (18-30%)
Q-Steep Range (30-50%)
R-Very Steep Range (>50%)
Total
II. Economic Services
Commercial & Industrial Establishments, Bus. Bureau, 2015
Micro
Number
Toril Proper Tungkalan TOTALTagurano Tibuloy
200.51
117.05 795.51
134.75
2.90 634.24 905.98 6081.33
0.00 269.93 598.72
422.59
237.5
476.62 2.66 0.58 3541.88
26.43
22.40 447.20 2350.64
4.22
2.43 64.99
4.89
0.08 50.63 512.87
505.28 833.64 131.60 1,783.65 19,041.72
Tugbok Clay Tugbok clay San Manuel Silty Clay Loam Tugbok Clay
- 270.32 131.60 - 5,758.81
7.98 447.43 - 470.47 5,773.12
491.00 115.89 - 1,139.55 6,155.47
6.30 - - 173.63 1,354.32
505.28 833.64 131.60 1,783.65 19,041.72
0.00 1.25 131.60 0.00 1,935.65
0.00 191.84 0.00 62.70 3,998.71
149.26 375.39 0.00 1,331.81 4,399.13
227.35 265.15 0.00 125.78 7,215.26
118.74 0.00 0.00 99.91 410.02
9.94 0.00 0.00 163.45 1,082.96
505.28 833.64 131.60 1,783.65 19,041.72
2 8 805 49 1,693
Page 96
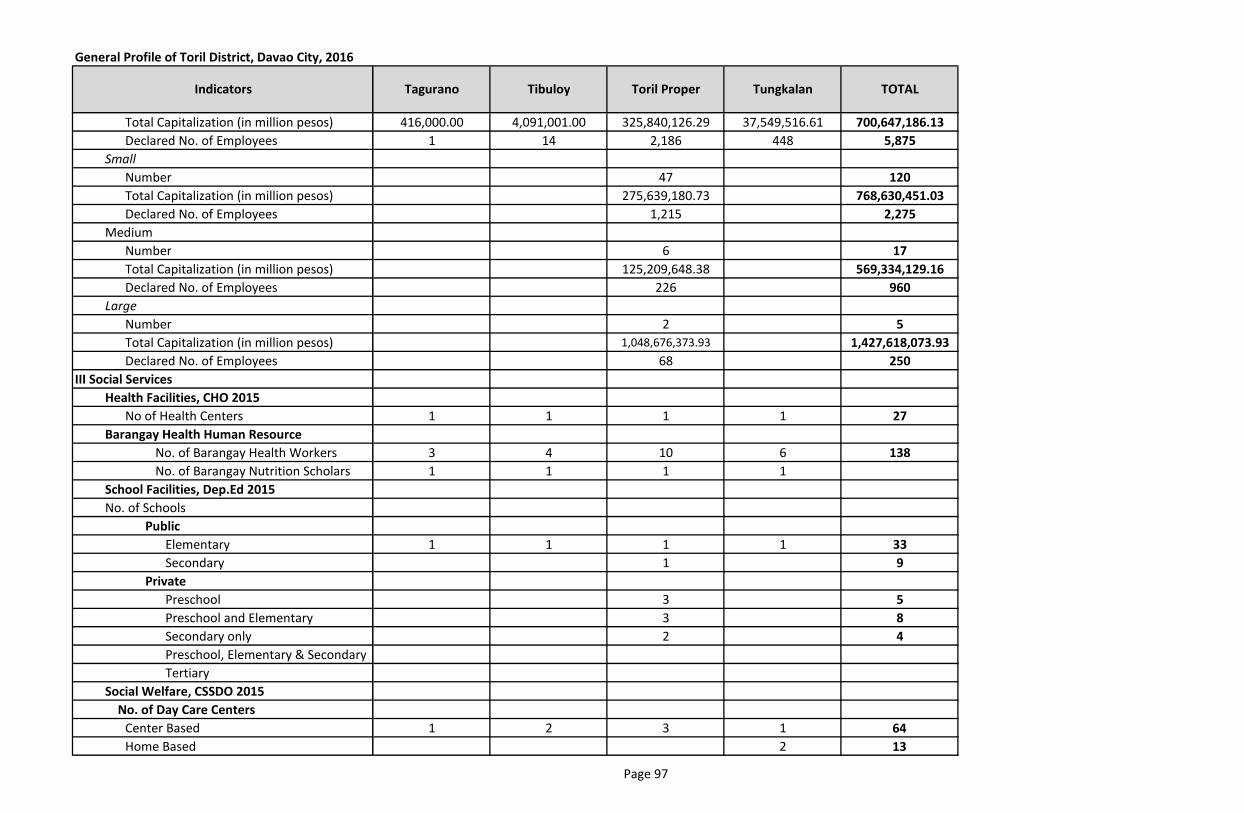
General Profile of Toril District, Davao City, 2016
Indicators
Total Capitalization (in million pesos)
Declared No. of Employees
Small
Number
Total Capitalization (in million pesos)
Declared No. of Employees
Medium
Number
Total Capitalization (in million pesos)
Declared No. of Employees
Large
Number
Total Capitalization (in million pesos)
Declared No. of Employees
III Social Services
Health Facilities, CHO 2015
No of Health Centers
Barangay Health Human Resource
No. of Barangay Health Workers
No. of Barangay Nutrition Scholars
School Facilities, Dep.Ed 2015
No. of Schools
Public
Elementary
Secondary
Private
Preschool
Preschool and Elementary
Secondary only
Preschool, Elementary & Secondary
Tertiary
Social Welfare, CSSDO 2015
No. of Day Care Centers
Center Based
Home Based
Toril Proper Tungkalan TOTALTagurano Tibuloy
416,000.00 4,091,001.00 325,840,126.29 37,549,516.61 700,647,186.13
1 14 2,186 448 5,875
47 120
275,639,180.73 768,630,451.03
1,215 2,275
6 17
125,209,648.38 569,334,129.16
226 960
2 5
1,048,676,373.93 1,427,618,073.93
68 250
1 1 1 1 27
3 4 10 6 138
1 1 1 1
1 1 1 1 33
1 9
3 5
3 8
2 4
1 2 3 1 64
2 13
Page 97
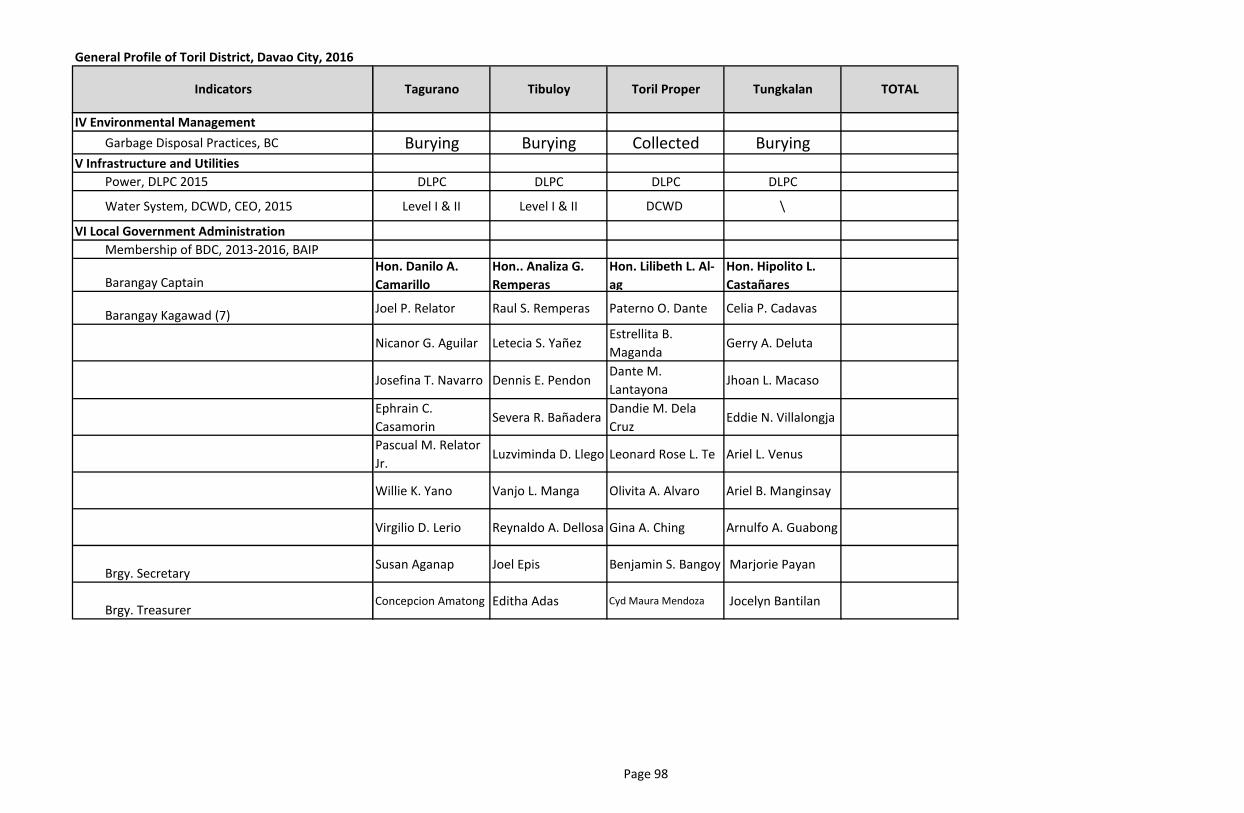
General Profile of Toril District, Davao City, 2016
Indicators
IV Environmental Management
Garbage Disposal Practices, BC
V Infrastructure and Utilities
Power, DLPC 2015
Water System, DCWD, CEO, 2015
VI Local Government Administration
Membership of BDC, 2013-2016, BAIP
Barangay Captain
Barangay Kagawad (7)
Brgy. Secretary
Brgy. Treasurer
Toril Proper Tungkalan TOTALTagurano Tibuloy
Burying Burying Collected Burying
DLPC DLPC DLPC DLPC
Level I & II Level I & II DCWD \
Hon. Danilo A.
Camarillo
Hon.. Analiza G.
Remperas
Hon. Lilibeth L. Al-
ag
Hon. Hipolito L.
Castañares
Joel P. Relator Raul S. Remperas Paterno O. Dante Celia P. Cadavas
Nicanor G. Aguilar Letecia S. YañezEstrellita B.
MagandaGerry A. Deluta
Josefina T. Navarro Dennis E. PendonDante M.
LantayonaJhoan L. Macaso
Ephrain C.
CasamorinSevera R. Bañadera
Dandie M. Dela
CruzEddie N. Villalongja
Pascual M. Relator
Jr.Luzviminda D. Llego Leonard Rose L. Te Ariel L. Venus
Willie K. Yano Vanjo L. Manga Olivita A. Alvaro Ariel B. Manginsay
Virgilio D. Lerio Reynaldo A. Dellosa Gina A. Ching Arnulfo A. Guabong
Susan Aganap Joel Epis Benjamin S. Bangoy Marjorie Payan
Concepcion Amatong Editha Adas Cyd Maura Mendoza Jocelyn Bantilan
Page 98
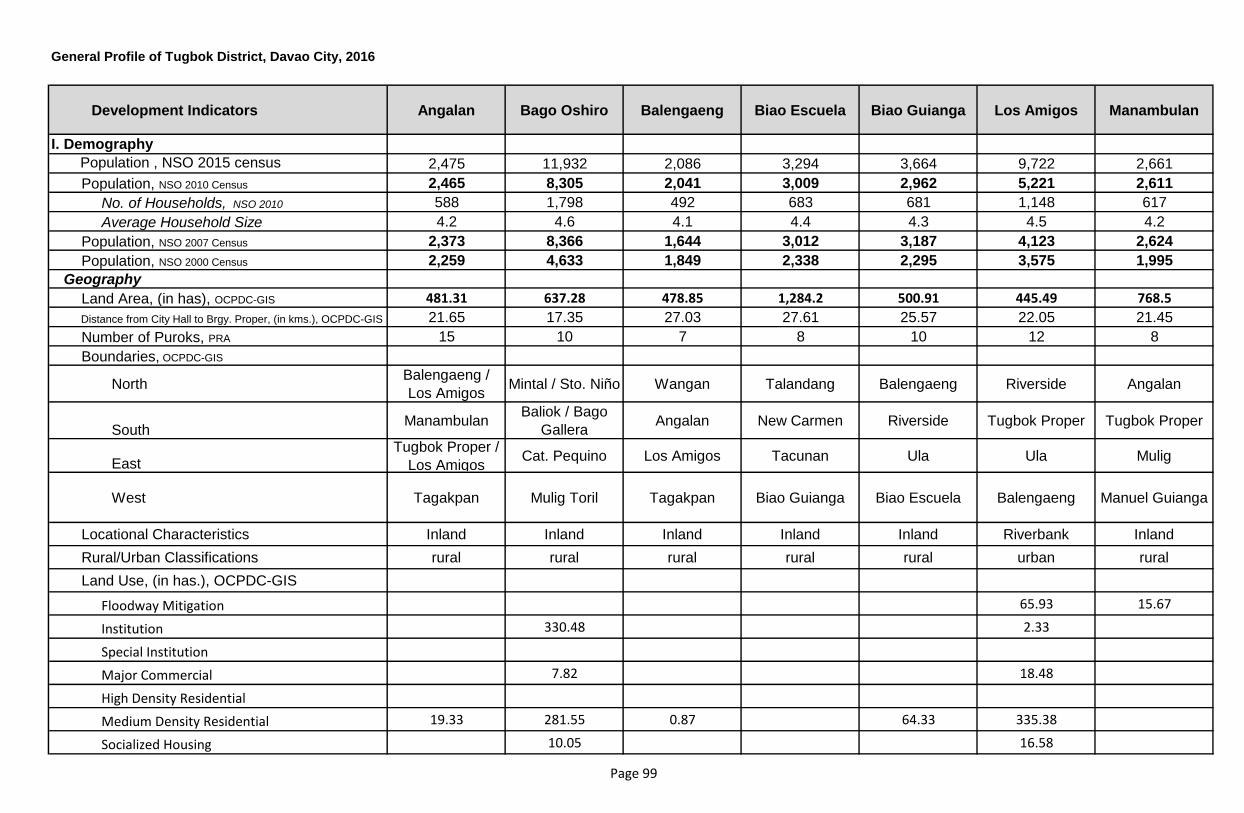
Development Indicators Angalan Bago Oshiro Balengaeng Biao Escuela Biao Guianga Los Amigos Manambulan
I. Demography
Population , NSO 2015 census 2,475 11,932 2,086 3,294 3,664 9,722 2,661
Population, NSO 2010 Census 2,465 8,305 2,041 3,009 2,962 5,221 2,611
No. of Households, NSO 2010 588 1,798 492 683 681 1,148 617
Average Household Size 4.2 4.6 4.1 4.4 4.3 4.5 4.2
Population, NSO 2007 Census 2,373 8,366 1,644 3,012 3,187 4,123 2,624
Population, NSO 2000 Census 2,259 4,633 1,849 2,338 2,295 3,575 1,995
Geography
Land Area, (in has), OCPDC-GIS 481.31 637.28 478.85 1,284.2 500.91 445.49 768.5
Distance from City Hall to Brgy. Proper, (in kms.), OCPDC-GIS 21.65 17.35 27.03 27.61 25.57 22.05 21.45
Number of Puroks, PRA 15 10 7 8 10 12 8
Boundaries, OCPDC-GIS
NorthBalengaeng /
Los AmigosMintal / Sto. Niño Wangan Talandang Balengaeng Riverside Angalan
SouthManambulan
Baliok / Bago
GalleraAngalan New Carmen Riverside Tugbok Proper Tugbok Proper
EastTugbok Proper /
Los AmigosCat. Pequino Los Amigos Tacunan Ula Ula Mulig
West Tagakpan Mulig Toril Tagakpan Biao Guianga Biao Escuela Balengaeng Manuel Guianga
Locational Characteristics Inland Inland Inland Inland Inland Riverbank Inland
Rural/Urban Classifications rural rural rural rural rural urban rural
Land Use, (in has.), OCPDC-GIS
Floodway Mitigation 65.93 15.67
Institution 330.48 2.33
Special Institution
Major Commercial 7.82 18.48
High Density Residential
Medium Density Residential 19.33 281.55 0.87 64.33 335.38
Socialized Housing 10.05 16.58
General Profile of Tugbok District, Davao City, 2016
Page 99
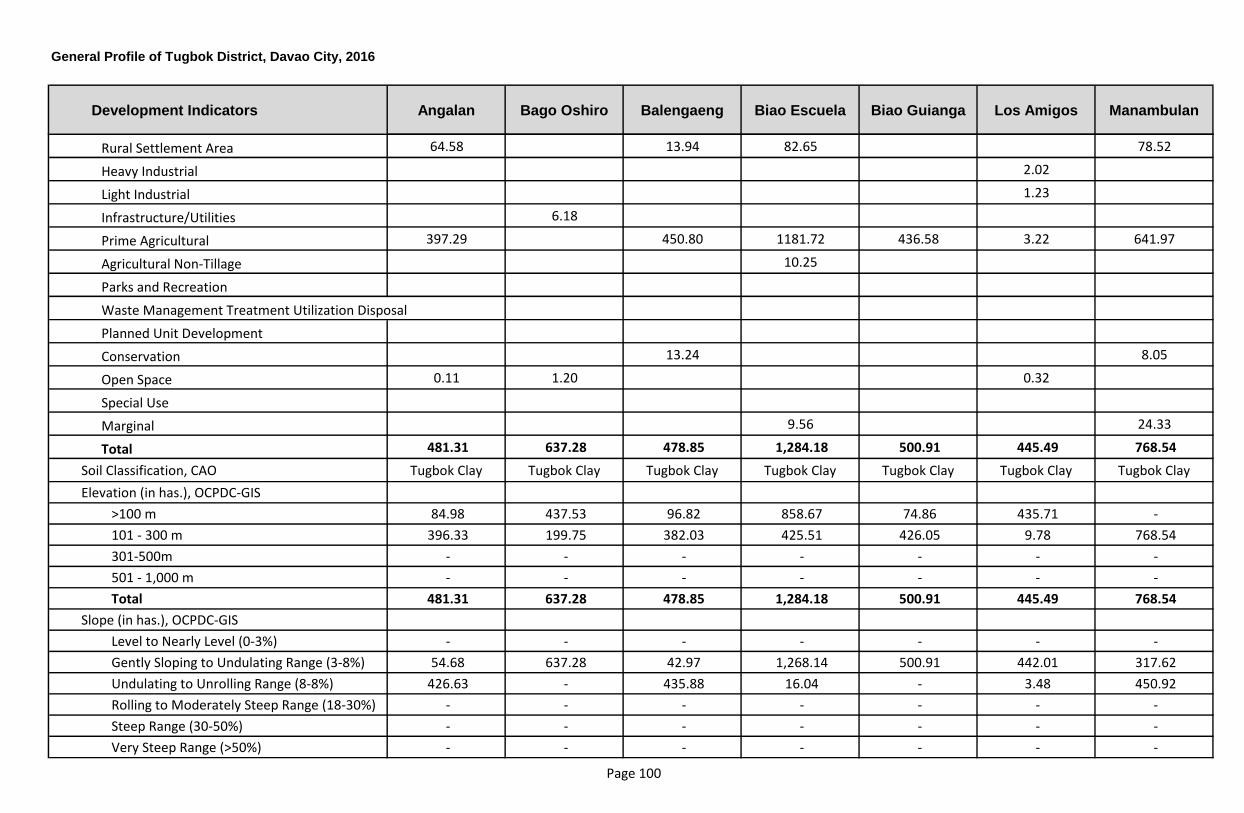
Development Indicators Angalan Bago Oshiro Balengaeng Biao Escuela Biao Guianga Los Amigos Manambulan
General Profile of Tugbok District, Davao City, 2016
Rural Settlement Area 64.58 13.94 82.65 78.52
Heavy Industrial 2.02
Light Industrial 1.23
Infrastructure/Utilities 6.18
Prime Agricultural 397.29 450.80 1181.72 436.58 3.22 641.97
Agricultural Non-Tillage 10.25
Parks and Recreation
Waste Management Treatment Utilization Disposal
Planned Unit Development
Conservation 13.24 8.05
Open Space 0.11 1.20 0.32
Special Use
Marginal 9.56 24.33
Total 481.31 637.28 478.85 1,284.18 500.91 445.49 768.54
Soil Classification, CAO Tugbok Clay Tugbok Clay Tugbok Clay Tugbok Clay Tugbok Clay Tugbok Clay Tugbok Clay
Elevation (in has.), OCPDC-GIS
>100 m 84.98 437.53 96.82 858.67 74.86 435.71 -
101 - 300 m 396.33 199.75 382.03 425.51 426.05 9.78 768.54
301-500m - - - - - - -
501 - 1,000 m - - - - - - -
Total 481.31 637.28 478.85 1,284.18 500.91 445.49 768.54
Slope (in has.), OCPDC-GIS
Level to Nearly Level (0-3%) - - - - - - -
Gently Sloping to Undulating Range (3-8%) 54.68 637.28 42.97 1,268.14 500.91 442.01 317.62
Undulating to Unrolling Range (8-8%) 426.63 - 435.88 16.04 - 3.48 450.92
Rolling to Moderately Steep Range (18-30%) - - - - - - -
Steep Range (30-50%) - - - - - - -
Very Steep Range (>50%) - - - - - - -
Page 100
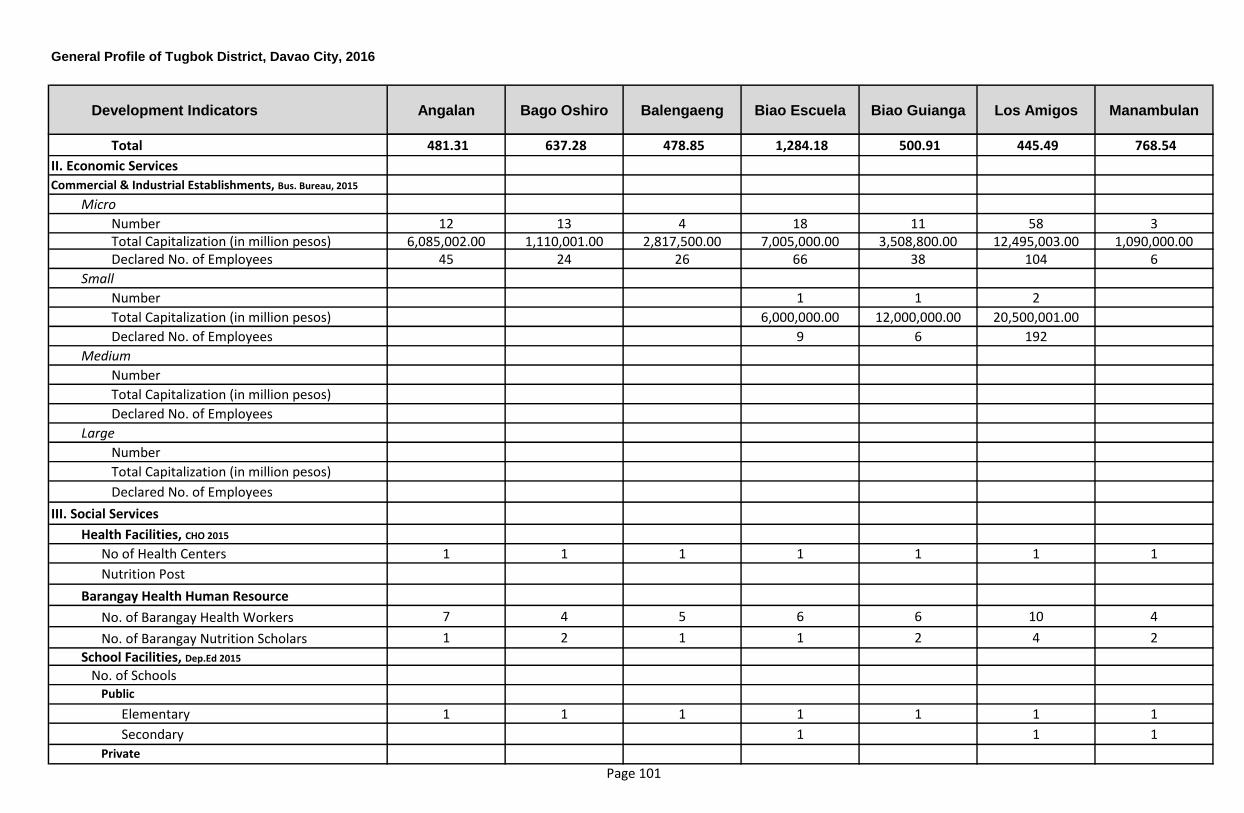
Development Indicators Angalan Bago Oshiro Balengaeng Biao Escuela Biao Guianga Los Amigos Manambulan
General Profile of Tugbok District, Davao City, 2016
Total 481.31 637.28 478.85 1,284.18 500.91 445.49 768.54
II. Economic Services
Commercial & Industrial Establishments, Bus. Bureau, 2015
Micro
Number 12 13 4 18 11 58 3Total Capitalization (in million pesos) 6,085,002.00 1,110,001.00 2,817,500.00 7,005,000.00 3,508,800.00 12,495,003.00 1,090,000.00Declared No. of Employees 45 24 26 66 38 104 6
Small
Number 1 1 2
Total Capitalization (in million pesos) 6,000,000.00 12,000,000.00 20,500,001.00
Declared No. of Employees 9 6 192
Medium
Number
Total Capitalization (in million pesos)
Declared No. of Employees
Large
Number
Total Capitalization (in million pesos)
Declared No. of Employees
III. Social Services
Health Facilities, CHO 2015
No of Health Centers 1 1 1 1 1 1 1
Nutrition Post
Barangay Health Human Resource
No. of Barangay Health Workers 7 4 5 6 6 10 4
No. of Barangay Nutrition Scholars 1 2 1 1 2 4 2
School Facilities, Dep.Ed 2015
No. of SchoolsPublic
Elementary 1 1 1 1 1 1 1
Secondary 1 1 1
Private
Page 101
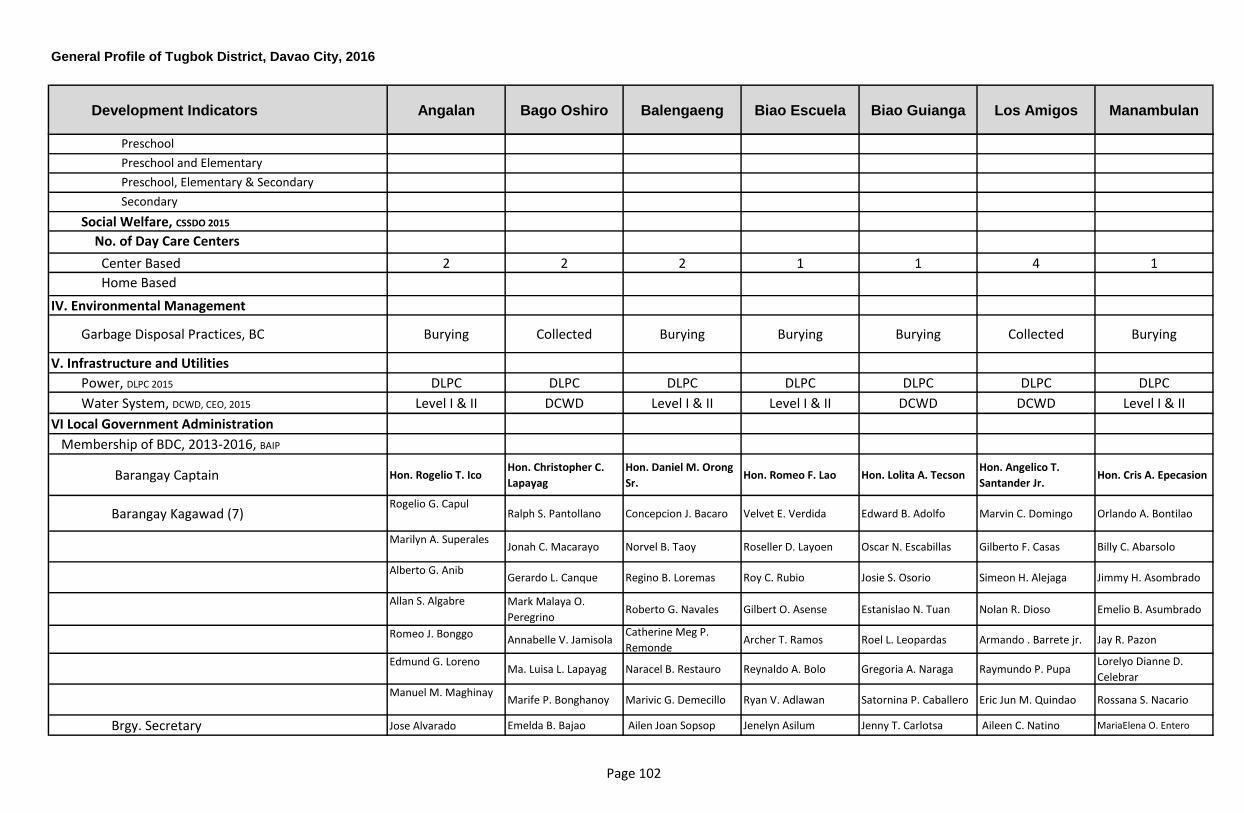
Development Indicators Angalan Bago Oshiro Balengaeng Biao Escuela Biao Guianga Los Amigos Manambulan
General Profile of Tugbok District, Davao City, 2016
Preschool
Preschool and Elementary
Preschool, Elementary & Secondary
Secondary
Social Welfare, CSSDO 2015
No. of Day Care Centers
Center Based 2 2 2 1 1 4 1
Home Based
IV. Environmental Management
Garbage Disposal Practices, BC Burying Collected Burying Burying Burying Collected Burying
V. Infrastructure and Utilities
Power, DLPC 2015 DLPC DLPC DLPC DLPC DLPC DLPC DLPC
Water System, DCWD, CEO, 2015 Level I & II DCWD Level I & II Level I & II DCWD DCWD Level I & II
VI Local Government Administration
Membership of BDC, 2013-2016, BAIP
Barangay Captain Hon. Rogelio T. IcoHon. Christopher C.
Lapayag
Hon. Daniel M. Orong
Sr.Hon. Romeo F. Lao Hon. Lolita A. Tecson
Hon. Angelico T.
Santander Jr.Hon. Cris A. Epecasion
Barangay Kagawad (7)Rogelio G. Capul
Ralph S. Pantollano Concepcion J. Bacaro Velvet E. Verdida Edward B. Adolfo Marvin C. Domingo Orlando A. Bontilao
Marilyn A. SuperalesJonah C. Macarayo Norvel B. Taoy Roseller D. Layoen Oscar N. Escabillas Gilberto F. Casas Billy C. Abarsolo
Alberto G. AnibGerardo L. Canque Regino B. Loremas Roy C. Rubio Josie S. Osorio Simeon H. Alejaga Jimmy H. Asombrado
Allan S. Algabre Mark Malaya O.
PeregrinoRoberto G. Navales Gilbert O. Asense Estanislao N. Tuan Nolan R. Dioso Emelio B. Asumbrado
Romeo J. BonggoAnnabelle V. Jamisola
Catherine Meg P.
RemondeArcher T. Ramos Roel L. Leopardas Armando . Barrete jr. Jay R. Pazon
Edmund G. LorenoMa. Luisa L. Lapayag Naracel B. Restauro Reynaldo A. Bolo Gregoria A. Naraga Raymundo P. Pupa
Lorelyo Dianne D.
Celebrar
Manuel M. MaghinayMarife P. Bonghanoy Marivic G. Demecillo Ryan V. Adlawan Satornina P. Caballero Eric Jun M. Quindao Rossana S. Nacario
Brgy. Secretary Jose Alvarado Emelda B. Bajao Ailen Joan Sopsop Jenelyn Asilum Jenny T. Carlotsa Aileen C. Natino MariaElena O. Entero
Page 102
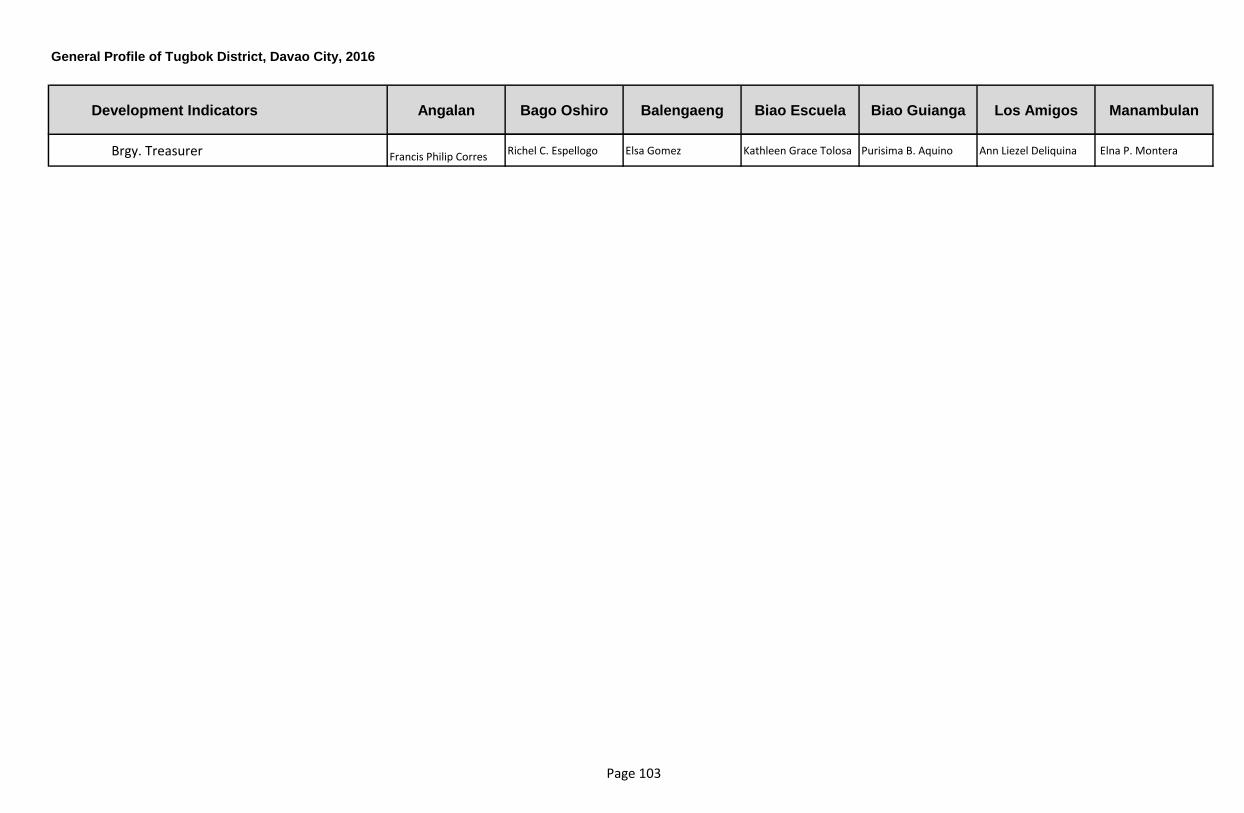
Development Indicators Angalan Bago Oshiro Balengaeng Biao Escuela Biao Guianga Los Amigos Manambulan
General Profile of Tugbok District, Davao City, 2016
Brgy. Treasurer Francis Philip CorresRichel C. Espellogo Elsa Gomez Kathleen Grace Tolosa Purisima B. Aquino Ann Liezel Deliquina Elna P. Montera
Page 103
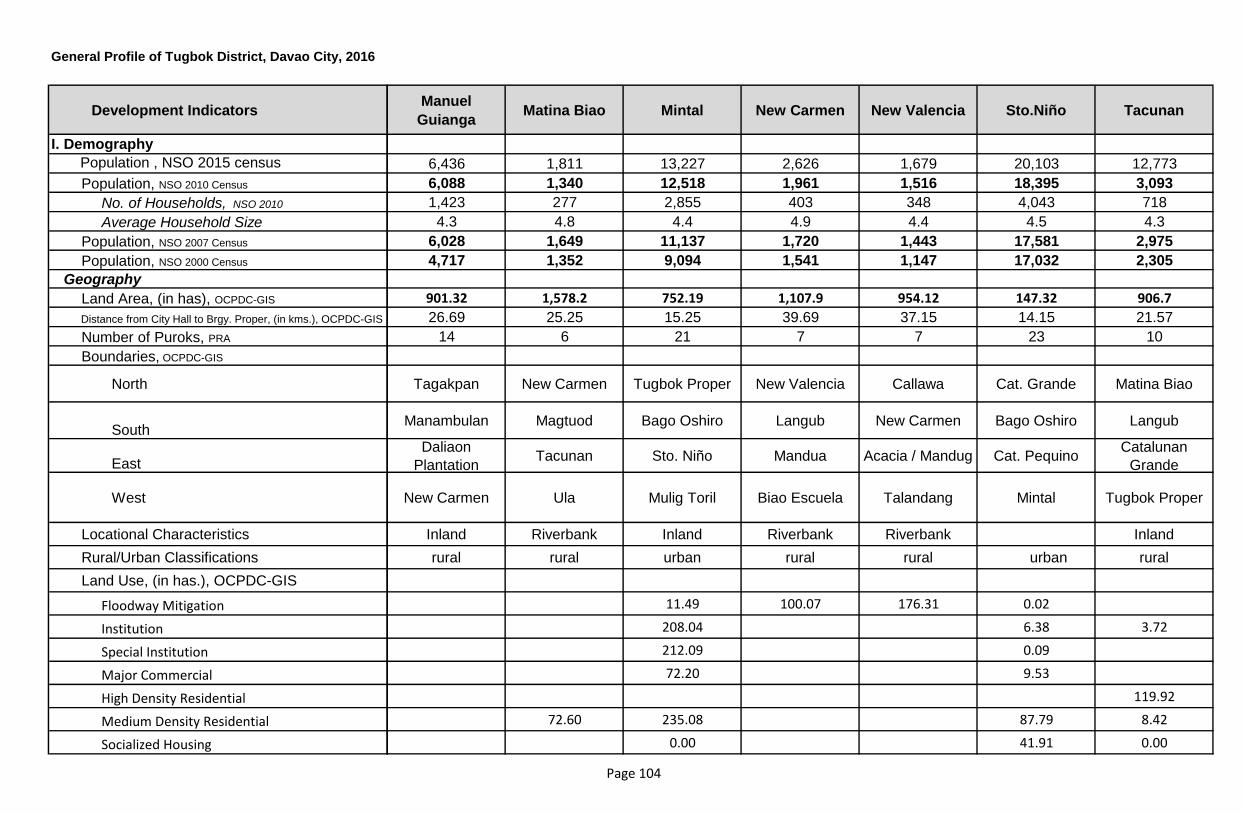
Development Indicators
I. Demography
Population , NSO 2015 census
Population, NSO 2010 Census
No. of Households, NSO 2010
Average Household Size
Population, NSO 2007 Census
Population, NSO 2000 Census
Geography
Land Area, (in has), OCPDC-GIS
Distance from City Hall to Brgy. Proper, (in kms.), OCPDC-GIS
Number of Puroks, PRA
Boundaries, OCPDC-GIS
North
South
East
West
Locational Characteristics
Rural/Urban Classifications
Land Use, (in has.), OCPDC-GIS
Floodway Mitigation
Institution
Special Institution
Major Commercial
High Density Residential
Medium Density Residential
Socialized Housing
General Profile of Tugbok District, Davao City, 2016
Manuel
GuiangaMatina Biao Mintal New Carmen New Valencia Sto.Niño Tacunan
6,436 1,811 13,227 2,626 1,679 20,103 12,773
6,088 1,340 12,518 1,961 1,516 18,395 3,093
1,423 277 2,855 403 348 4,043 718
4.3 4.8 4.4 4.9 4.4 4.5 4.3
6,028 1,649 11,137 1,720 1,443 17,581 2,975
4,717 1,352 9,094 1,541 1,147 17,032 2,305
901.32 1,578.2 752.19 1,107.9 954.12 147.32 906.7
26.69 25.25 15.25 39.69 37.15 14.15 21.57
14 6 21 7 7 23 10
Tagakpan New Carmen Tugbok Proper New Valencia Callawa Cat. Grande Matina Biao
Manambulan Magtuod Bago Oshiro Langub New Carmen Bago Oshiro Langub
Daliaon
PlantationTacunan Sto. Niño Mandua Acacia / Mandug Cat. Pequino
Catalunan
Grande
New Carmen Ula Mulig Toril Biao Escuela Talandang Mintal Tugbok Proper
Inland Riverbank Inland Riverbank Riverbank Inland
rural rural urban rural rural urban rural
11.49 100.07 176.31 0.02
208.04 6.38 3.72
212.09 0.09
72.20 9.53
119.92
72.60 235.08 87.79 8.42
0.00 41.91 0.00
Page 104
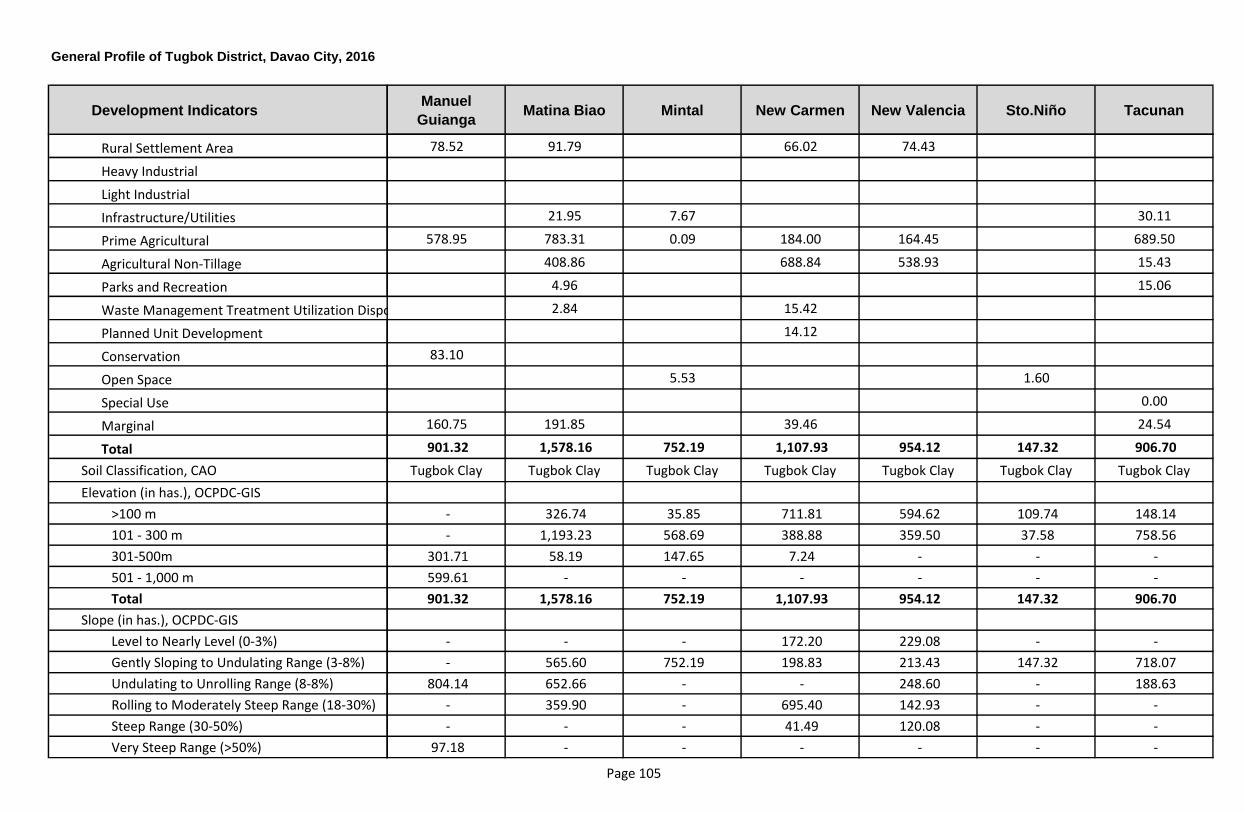
Development Indicators
General Profile of Tugbok District, Davao City, 2016
Rural Settlement Area
Heavy Industrial
Light Industrial
Infrastructure/Utilities
Prime Agricultural
Agricultural Non-Tillage
Parks and Recreation
Waste Management Treatment Utilization Disposal
Planned Unit Development
Conservation
Open Space
Special Use
Marginal
Total
Soil Classification, CAO
Elevation (in has.), OCPDC-GIS
>100 m
101 - 300 m
301-500m
501 - 1,000 m
Total
Slope (in has.), OCPDC-GIS
Level to Nearly Level (0-3%)
Gently Sloping to Undulating Range (3-8%)
Undulating to Unrolling Range (8-8%)
Rolling to Moderately Steep Range (18-30%)
Steep Range (30-50%)
Very Steep Range (>50%)
Manuel
GuiangaMatina Biao Mintal New Carmen New Valencia Sto.Niño Tacunan
78.52 91.79 66.02 74.43
21.95 7.67 30.11
578.95 783.31 0.09 184.00 164.45 689.50
408.86 688.84 538.93 15.43
4.96 15.06
2.84 15.42
14.12
83.10
5.53 1.60
0.00
160.75 191.85 39.46 24.54
901.32 1,578.16 752.19 1,107.93 954.12 147.32 906.70
Tugbok Clay Tugbok Clay Tugbok Clay Tugbok Clay Tugbok Clay Tugbok Clay Tugbok Clay
- 326.74 35.85 711.81 594.62 109.74 148.14
- 1,193.23 568.69 388.88 359.50 37.58 758.56
301.71 58.19 147.65 7.24 - - -
599.61 - - - - - -
901.32 1,578.16 752.19 1,107.93 954.12 147.32 906.70
- - - 172.20 229.08 - -
- 565.60 752.19 198.83 213.43 147.32 718.07
804.14 652.66 - - 248.60 - 188.63
- 359.90 - 695.40 142.93 - -
- - - 41.49 120.08 - -
97.18 - - - - - -
Page 105
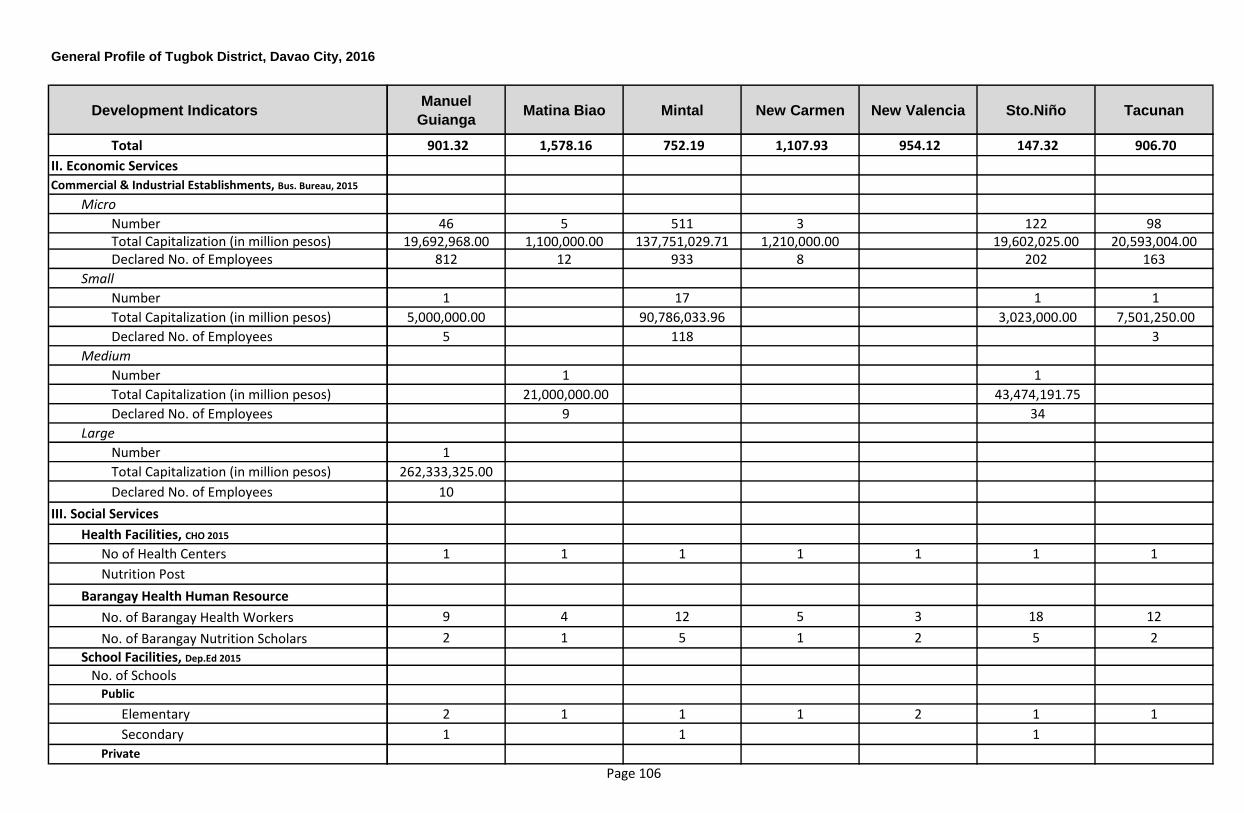
Development Indicators
General Profile of Tugbok District, Davao City, 2016
Total
II. Economic Services
Commercial & Industrial Establishments, Bus. Bureau, 2015
Micro
NumberTotal Capitalization (in million pesos)Declared No. of Employees
Small
Number
Total Capitalization (in million pesos)
Declared No. of Employees
Medium
Number
Total Capitalization (in million pesos)
Declared No. of Employees
Large
Number
Total Capitalization (in million pesos)
Declared No. of Employees
III. Social Services
Health Facilities, CHO 2015
No of Health Centers
Nutrition Post
Barangay Health Human Resource
No. of Barangay Health Workers
No. of Barangay Nutrition Scholars
School Facilities, Dep.Ed 2015
No. of SchoolsPublic
Elementary
Secondary
Private
Manuel
GuiangaMatina Biao Mintal New Carmen New Valencia Sto.Niño Tacunan
901.32 1,578.16 752.19 1,107.93 954.12 147.32 906.70
46 5 511 3 122 9819,692,968.00 1,100,000.00 137,751,029.71 1,210,000.00 19,602,025.00 20,593,004.00
812 12 933 8 202 163
1 17 1 1
5,000,000.00 90,786,033.96 3,023,000.00 7,501,250.00
5 118 3
1 1
21,000,000.00 43,474,191.75
9 34
1
262,333,325.00
10
1 1 1 1 1 1 1
9 4 12 5 3 18 12
2 1 5 1 2 5 2
2 1 1 1 2 1 1
1 1 1
Page 106
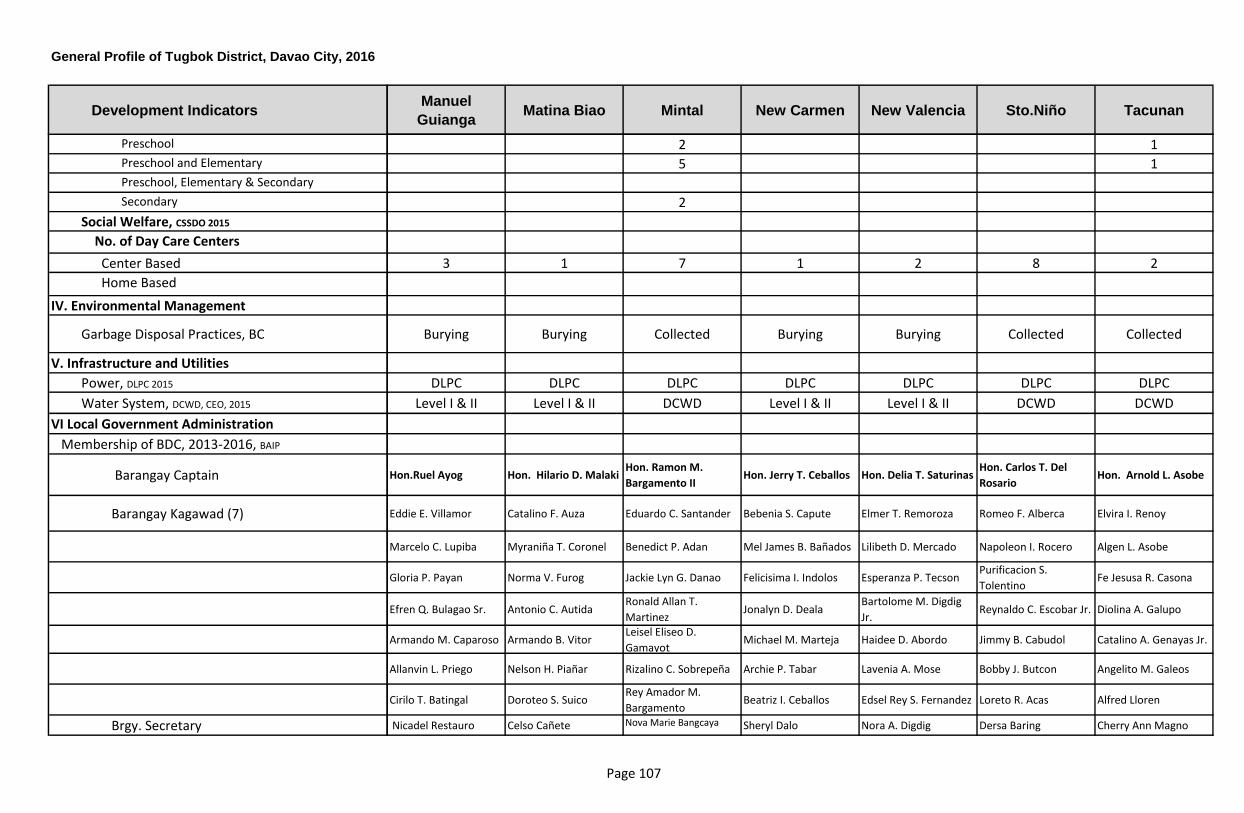
Development Indicators
General Profile of Tugbok District, Davao City, 2016
Preschool
Preschool and Elementary
Preschool, Elementary & Secondary
Secondary
Social Welfare, CSSDO 2015
No. of Day Care Centers
Center Based
Home Based
IV. Environmental Management
Garbage Disposal Practices, BC
V. Infrastructure and Utilities
Power, DLPC 2015
Water System, DCWD, CEO, 2015
VI Local Government Administration
Membership of BDC, 2013-2016, BAIP
Barangay Captain
Barangay Kagawad (7)
Brgy. Secretary
Manuel
GuiangaMatina Biao Mintal New Carmen New Valencia Sto.Niño Tacunan
2 1
5 1
2
3 1 7 1 2 8 2
Burying Burying Collected Burying Burying Collected Collected
DLPC DLPC DLPC DLPC DLPC DLPC DLPC
Level I & II Level I & II DCWD Level I & II Level I & II DCWD DCWD
Hon.Ruel Ayog Hon. Hilario D. MalakiHon. Ramon M.
Bargamento IIHon. Jerry T. Ceballos Hon. Delia T. Saturinas
Hon. Carlos T. Del
RosarioHon. Arnold L. Asobe
Eddie E. Villamor Catalino F. Auza Eduardo C. Santander Bebenia S. Capute Elmer T. Remoroza Romeo F. Alberca Elvira I. Renoy
Marcelo C. Lupiba Myraniña T. Coronel Benedict P. Adan Mel James B. Bañados Lilibeth D. Mercado Napoleon I. Rocero Algen L. Asobe
Gloria P. Payan Norma V. Furog Jackie Lyn G. Danao Felicisima I. Indolos Esperanza P. TecsonPurificacion S.
TolentinoFe Jesusa R. Casona
Efren Q. Bulagao Sr. Antonio C. AutidaRonald Allan T.
MartinezJonalyn D. Deala
Bartolome M. Digdig
Jr.Reynaldo C. Escobar Jr. Diolina A. Galupo
Armando M. Caparoso Armando B. VitorLeisel Eliseo D.
GamayotMichael M. Marteja Haidee D. Abordo Jimmy B. Cabudol Catalino A. Genayas Jr.
Allanvin L. Priego Nelson H. Piañar Rizalino C. Sobrepeña Archie P. Tabar Lavenia A. Mose Bobby J. Butcon Angelito M. Galeos
Cirilo T. Batingal Doroteo S. SuicoRey Amador M.
BargamentoBeatriz I. Ceballos Edsel Rey S. Fernandez Loreto R. Acas Alfred Lloren
Nicadel Restauro Celso Cañete Nova Marie Bangcaya Sheryl Dalo Nora A. Digdig Dersa Baring Cherry Ann Magno
Page 107
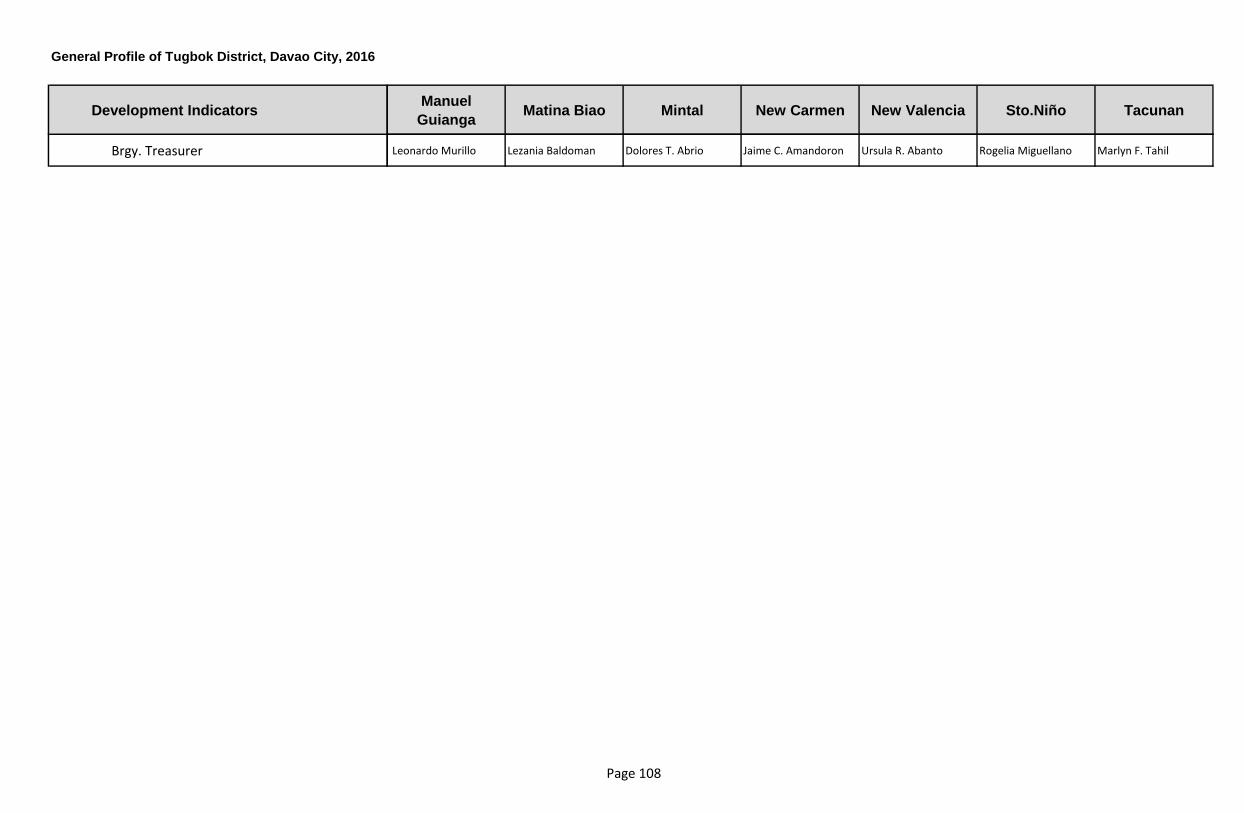
Development Indicators
General Profile of Tugbok District, Davao City, 2016
Brgy. Treasurer
Manuel
GuiangaMatina Biao Mintal New Carmen New Valencia Sto.Niño Tacunan
Leonardo Murillo Lezania Baldoman Dolores T. Abrio Jaime C. Amandoron Ursula R. Abanto Rogelia Miguellano Marlyn F. Tahil
Page 108
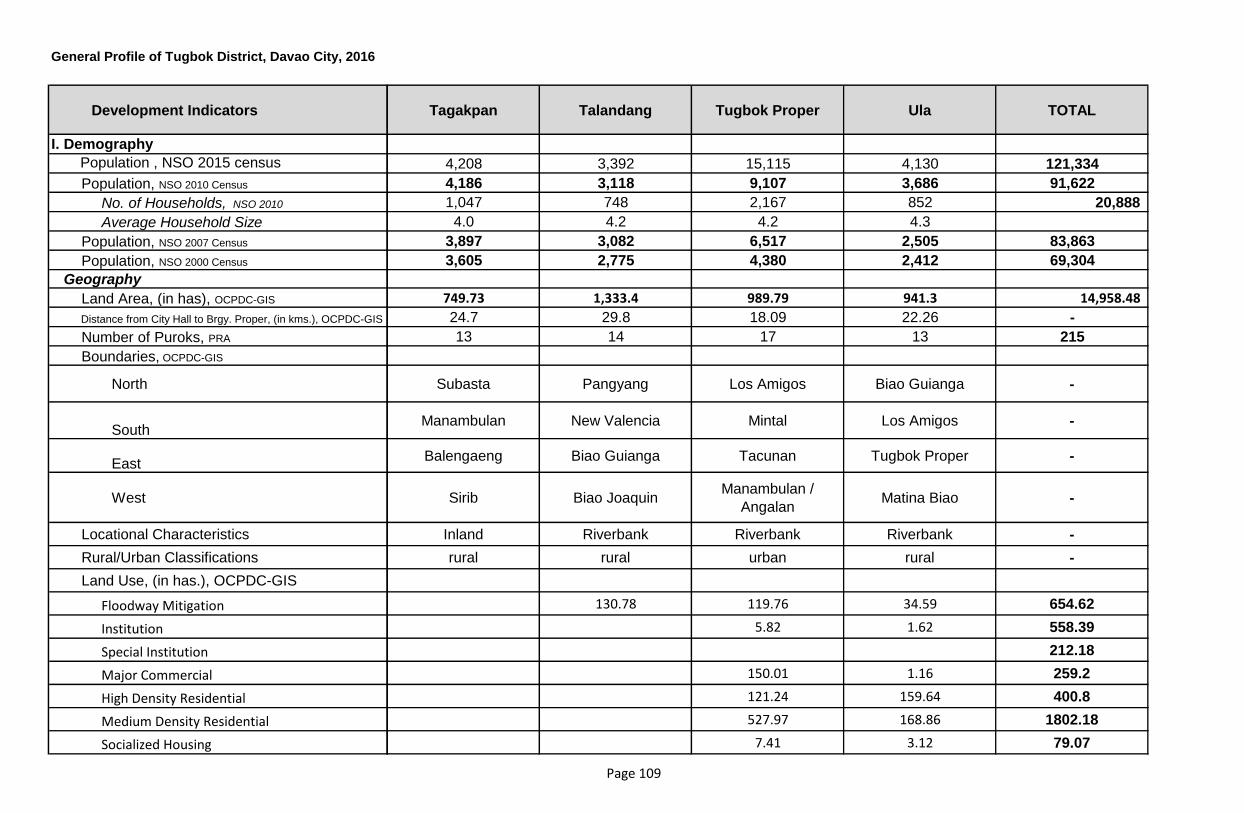
Development Indicators
I. Demography
Population , NSO 2015 census
Population, NSO 2010 Census
No. of Households, NSO 2010
Average Household Size
Population, NSO 2007 Census
Population, NSO 2000 Census
Geography
Land Area, (in has), OCPDC-GIS
Distance from City Hall to Brgy. Proper, (in kms.), OCPDC-GIS
Number of Puroks, PRA
Boundaries, OCPDC-GIS
North
South
East
West
Locational Characteristics
Rural/Urban Classifications
Land Use, (in has.), OCPDC-GIS
Floodway Mitigation
Institution
Special Institution
Major Commercial
High Density Residential
Medium Density Residential
Socialized Housing
General Profile of Tugbok District, Davao City, 2016
Tagakpan Talandang Tugbok Proper Ula TOTAL
4,208 3,392 15,115 4,130 121,334
4,186 3,118 9,107 3,686 91,622
1,047 748 2,167 852 20,888
4.0 4.2 4.2 4.3
3,897 3,082 6,517 2,505 83,863
3,605 2,775 4,380 2,412 69,304
749.73 1,333.4 989.79 941.3 14,958.48
24.7 29.8 18.09 22.26 -
13 14 17 13 215
Subasta Pangyang Los Amigos Biao Guianga -
Manambulan New Valencia Mintal Los Amigos -
Balengaeng Biao Guianga Tacunan Tugbok Proper -
Sirib Biao JoaquinManambulan /
AngalanMatina Biao -
Inland Riverbank Riverbank Riverbank -
rural rural urban rural -
130.78 119.76 34.59 654.62
5.82 1.62 558.39
212.18
150.01 1.16 259.2
121.24 159.64 400.8
527.97 168.86 1802.18
7.41 3.12 79.07
Page 109
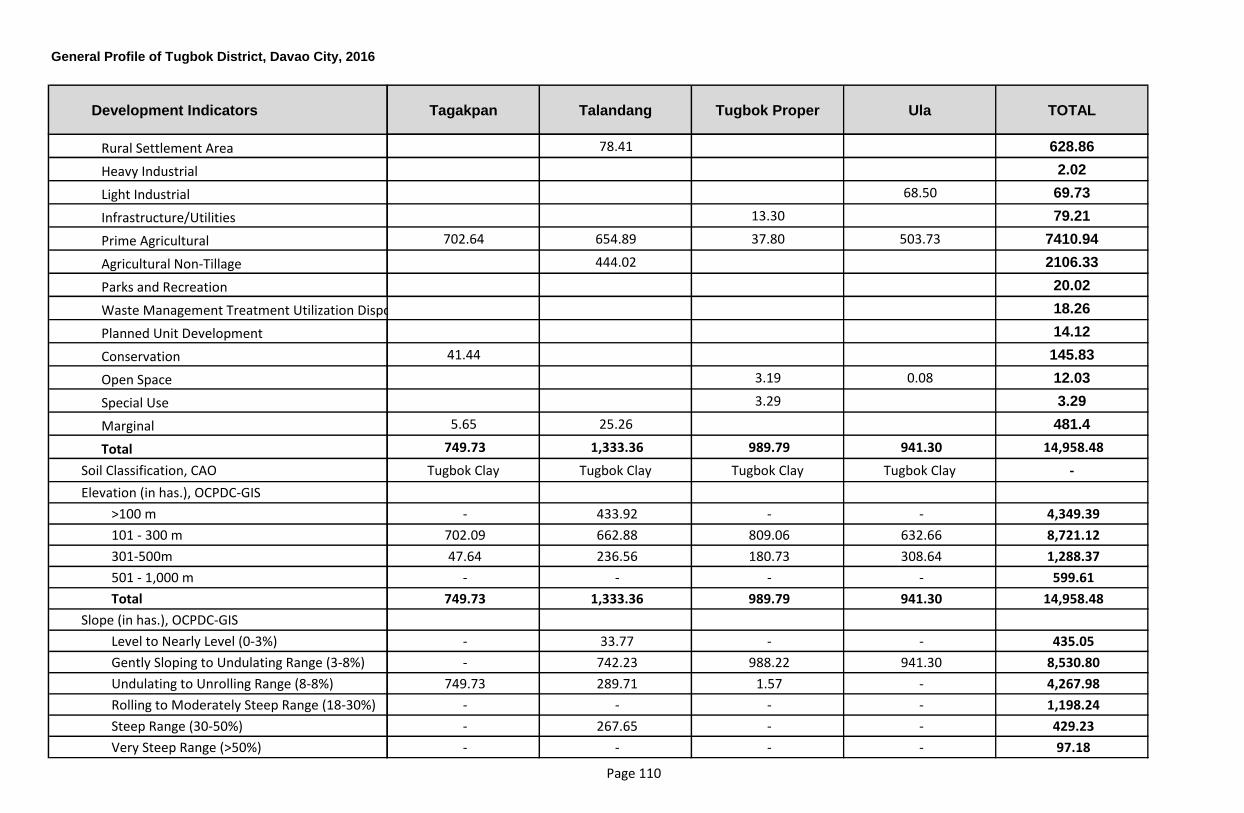
Development Indicators
General Profile of Tugbok District, Davao City, 2016
Rural Settlement Area
Heavy Industrial
Light Industrial
Infrastructure/Utilities
Prime Agricultural
Agricultural Non-Tillage
Parks and Recreation
Waste Management Treatment Utilization Disposal
Planned Unit Development
Conservation
Open Space
Special Use
Marginal
Total
Soil Classification, CAO
Elevation (in has.), OCPDC-GIS
>100 m
101 - 300 m
301-500m
501 - 1,000 m
Total
Slope (in has.), OCPDC-GIS
Level to Nearly Level (0-3%)
Gently Sloping to Undulating Range (3-8%)
Undulating to Unrolling Range (8-8%)
Rolling to Moderately Steep Range (18-30%)
Steep Range (30-50%)
Very Steep Range (>50%)
Tagakpan Talandang Tugbok Proper Ula TOTAL
78.41 628.86
2.02
68.50 69.73
13.30 79.21
702.64 654.89 37.80 503.73 7410.94
444.02 2106.33
20.02
18.26
14.12
41.44 145.83
3.19 0.08 12.03
3.29 3.29
5.65 25.26 481.4
749.73 1,333.36 989.79 941.30 14,958.48
Tugbok Clay Tugbok Clay Tugbok Clay Tugbok Clay -
- 433.92 - - 4,349.39
702.09 662.88 809.06 632.66 8,721.12
47.64 236.56 180.73 308.64 1,288.37
- - - - 599.61
749.73 1,333.36 989.79 941.30 14,958.48
- 33.77 - - 435.05
- 742.23 988.22 941.30 8,530.80
749.73 289.71 1.57 - 4,267.98
- - - - 1,198.24
- 267.65 - - 429.23
- - - - 97.18
Page 110
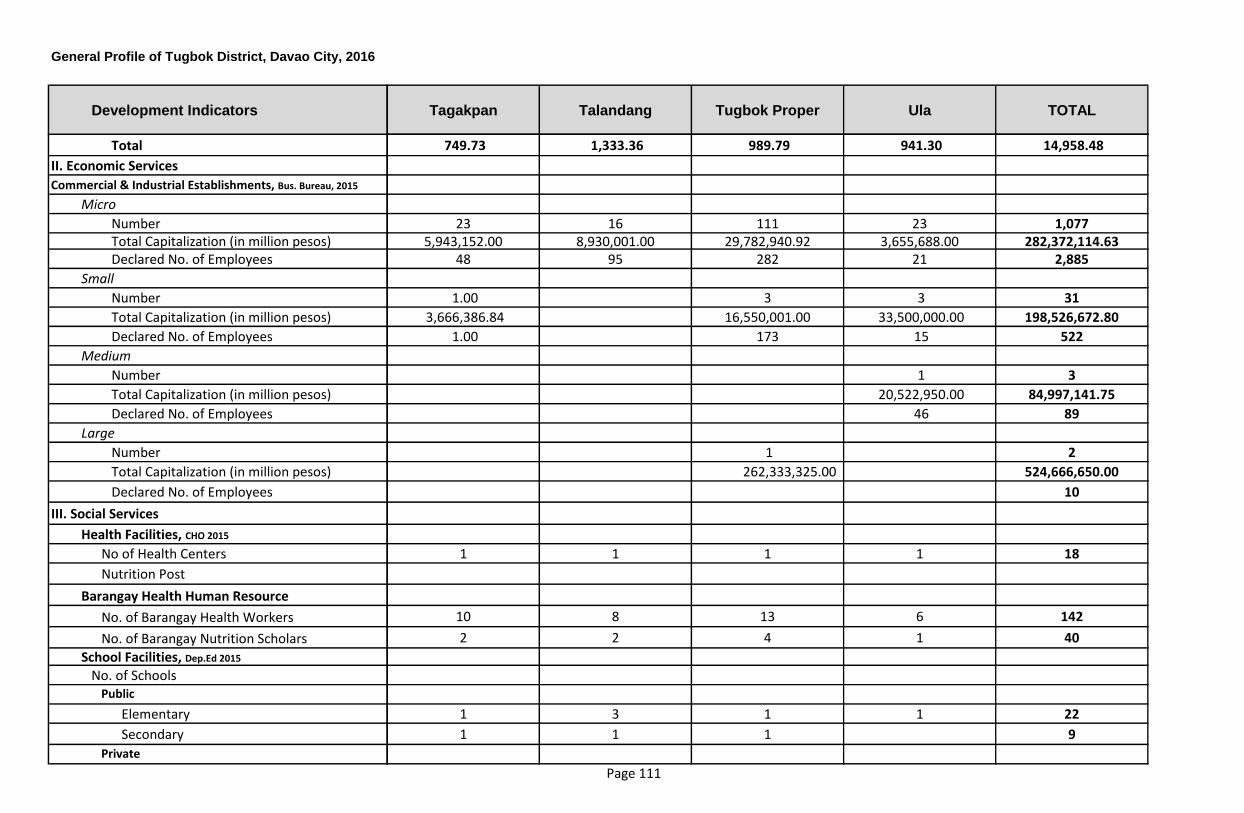
Development Indicators
General Profile of Tugbok District, Davao City, 2016
Total
II. Economic Services
Commercial & Industrial Establishments, Bus. Bureau, 2015
Micro
NumberTotal Capitalization (in million pesos)Declared No. of Employees
Small
Number
Total Capitalization (in million pesos)
Declared No. of Employees
Medium
Number
Total Capitalization (in million pesos)
Declared No. of Employees
Large
Number
Total Capitalization (in million pesos)
Declared No. of Employees
III. Social Services
Health Facilities, CHO 2015
No of Health Centers
Nutrition Post
Barangay Health Human Resource
No. of Barangay Health Workers
No. of Barangay Nutrition Scholars
School Facilities, Dep.Ed 2015
No. of SchoolsPublic
Elementary
Secondary
Private
Tagakpan Talandang Tugbok Proper Ula TOTAL
749.73 1,333.36 989.79 941.30 14,958.48
23 16 111 23 1,0775,943,152.00 8,930,001.00 29,782,940.92 3,655,688.00 282,372,114.63
48 95 282 21 2,885
1.00 3 3 31
3,666,386.84 16,550,001.00 33,500,000.00 198,526,672.80
1.00 173 15 522
1 3
20,522,950.00 84,997,141.75
46 89
1 2
262,333,325.00 524,666,650.00
10
1 1 1 1 18
10 8 13 6 142
2 2 4 1 40
1 3 1 1 22
1 1 1 9
Page 111
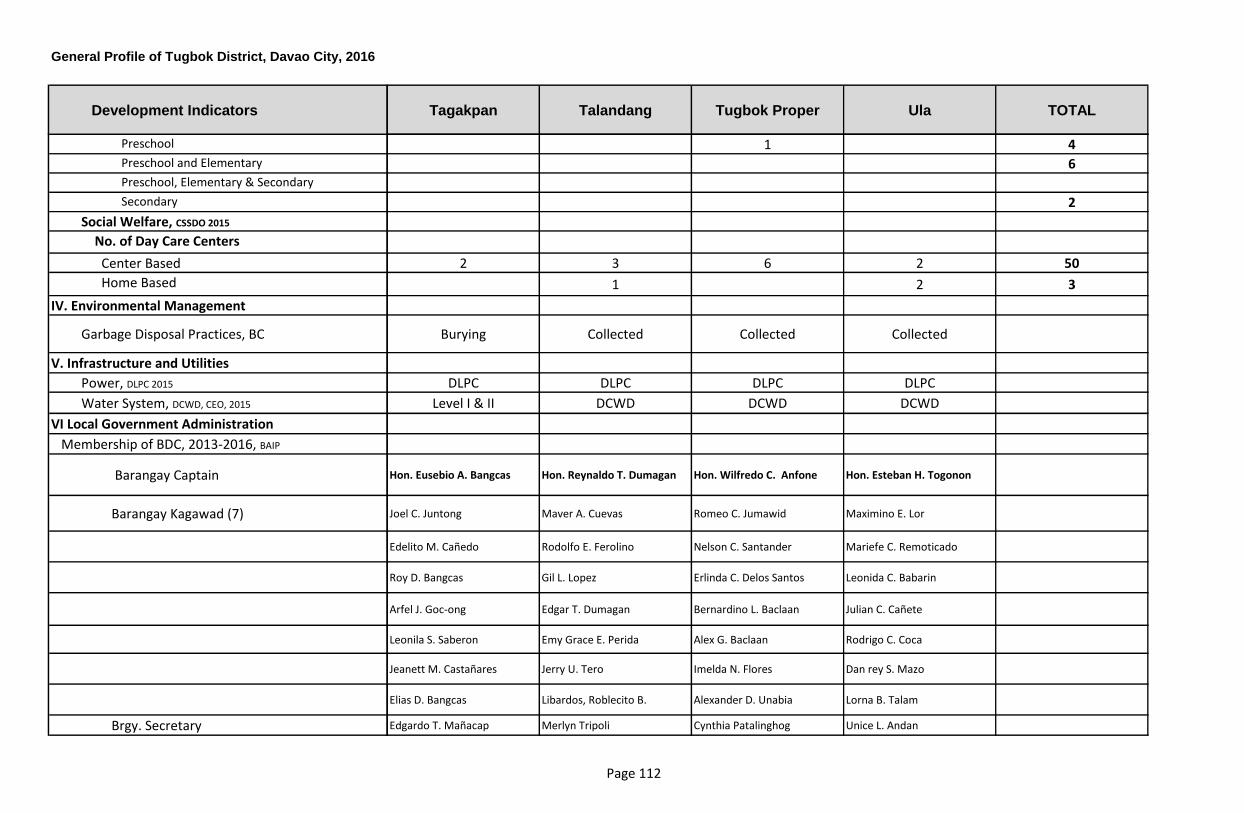
Development Indicators
General Profile of Tugbok District, Davao City, 2016
Preschool
Preschool and Elementary
Preschool, Elementary & Secondary
Secondary
Social Welfare, CSSDO 2015
No. of Day Care Centers
Center Based
Home Based
IV. Environmental Management
Garbage Disposal Practices, BC
V. Infrastructure and Utilities
Power, DLPC 2015
Water System, DCWD, CEO, 2015
VI Local Government Administration
Membership of BDC, 2013-2016, BAIP
Barangay Captain
Barangay Kagawad (7)
Brgy. Secretary
Tagakpan Talandang Tugbok Proper Ula TOTAL
1 4
6
2
2 3 6 2 50
1 2 3
Burying Collected Collected Collected
DLPC DLPC DLPC DLPC
Level I & II DCWD DCWD DCWD
Hon. Eusebio A. Bangcas Hon. Reynaldo T. Dumagan Hon. Wilfredo C. Anfone Hon. Esteban H. Togonon
Joel C. Juntong Maver A. Cuevas Romeo C. Jumawid Maximino E. Lor
Edelito M. Cañedo Rodolfo E. Ferolino Nelson C. Santander Mariefe C. Remoticado
Roy D. Bangcas Gil L. Lopez Erlinda C. Delos Santos Leonida C. Babarin
Arfel J. Goc-ong Edgar T. Dumagan Bernardino L. Baclaan Julian C. Cañete
Leonila S. Saberon Emy Grace E. Perida Alex G. Baclaan Rodrigo C. Coca
Jeanett M. Castañares Jerry U. Tero Imelda N. Flores Dan rey S. Mazo
Elias D. Bangcas Libardos, Roblecito B. Alexander D. Unabia Lorna B. Talam
Edgardo T. Mañacap Merlyn Tripoli Cynthia Patalinghog Unice L. Andan
Page 112
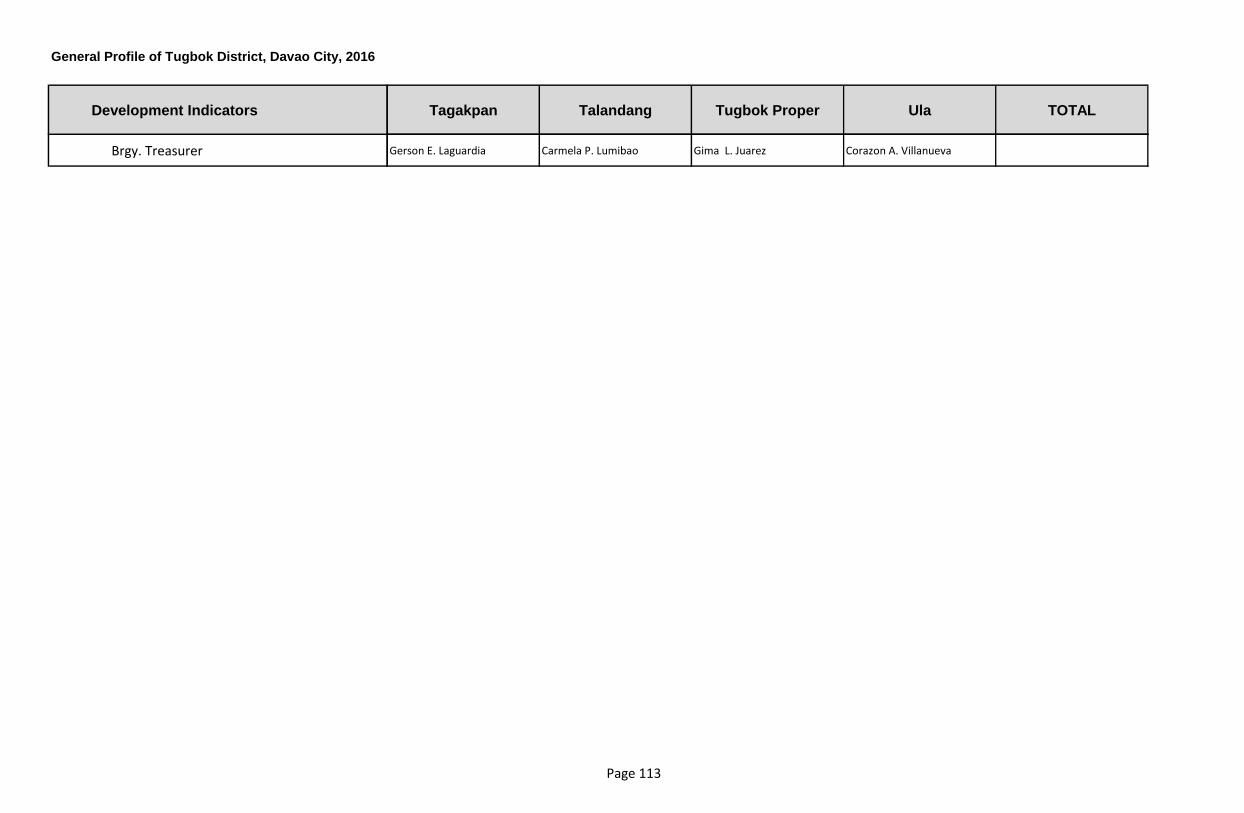
Development Indicators
General Profile of Tugbok District, Davao City, 2016
Brgy. Treasurer
Tagakpan Talandang Tugbok Proper Ula TOTAL
Gerson E. Laguardia Carmela P. Lumibao Gima L. Juarez Corazon A. Villanueva
Page 113