Embed Size (px)
Citation preview
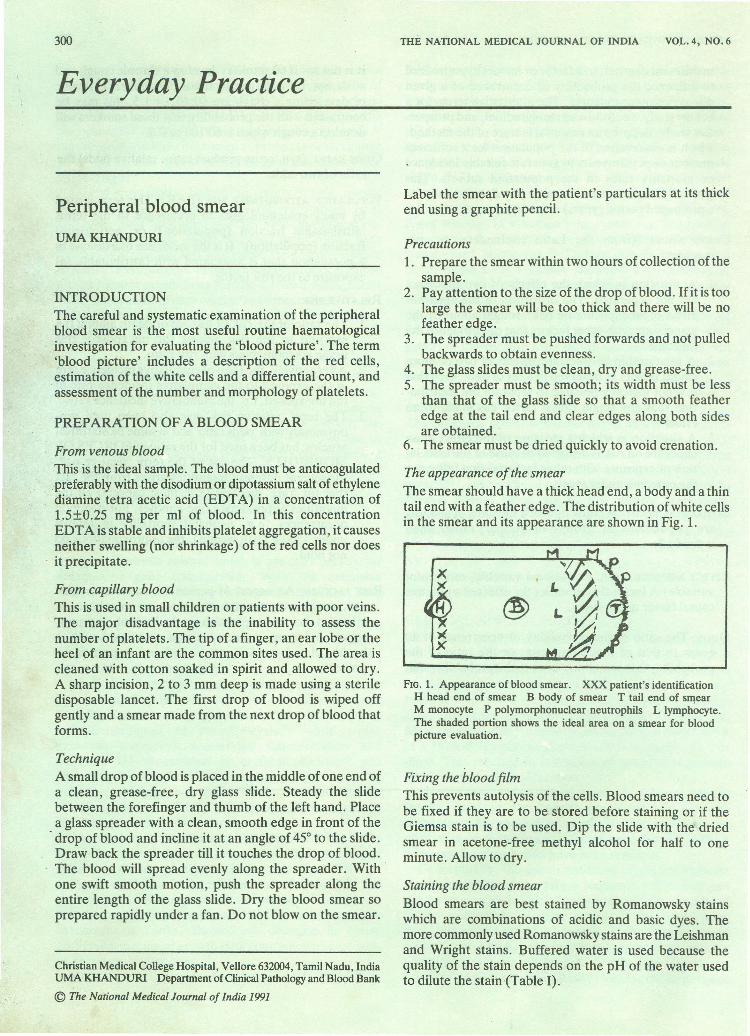
300
Everyday PracticeTHE NATIONAL MEDICAL JOURNAL OF INDIA VO.L.4, NO.6
Peripheral blood smearUMA KHANDURI
INTRODUCfIONThe careful and systematic examination of the peripheralblood smear is the most useful routine haematologicalinvestigation for evaluating the 'blood picture'. The term'blood picture' includes a description of the red cells,estimation of the white cells and a differential count, andassessment of the number and morphology of platelets.
PREPARATION OF A BLOOD SMEAR
From venous bloodThis is the ideal sample. The blood must be anticoagulatedpreferably with the disodium or dipotassium salt of ethylenediamine tetra acetic acid (EDTA) in a concentration of1.5±O.25 mg per ml of blood. In this concentrationEDT A is stable and inhibits platelet aggregation, it causesneither swelling (nor shrinkage) of the red cells nor does. it precipitate.
From capillary bloodThis is used in small children or patients with poor veins.The major disadvantage is the inability to assess thenumber of platelets. The tip of a finger, an ear lobe or theheel of an infant are the common sites used. The area iscleaned with cotton soaked inspirit and allowed to dry.A sharp incision, 2 to 3 mm deep is made using a steriledisposable lancet. The first drop of blood is wiped offgently and a smear made from the next drop of blood thatforms.
TechniqueA small drop of blood is placed in the middle of one end ofa clean, grease-free, dry glass slide. Steady the slidebetween the forefinger and thumb of the left hand. Placea glass spreader with a clean, smooth edge in front of the. drop of blood and incline it at an angle of 45° to the slide.Draw back the spreader till it touches the drop of blood.The blood will spread evenly along the spreader. Withone swift smooth motion, push the spreader along theentire length of the glass slide. Dry the blood smear soprepared rapidly under a fan. Do not blow on the smear.
Christian Medical College Hospital, Vellore 632004, Tamil Nadu, IndiaUMA KHANDURI Department of Clinical Pathology and Blood Bank
© The National Medical Journal of India 1991
Label the smear with the patient's particulars at its thickend using a graphite pencil.
Precautions1. Prepare the smear within two hours of collection of thesample.
2. Pay attention to the size of the drop of blood. If it is toolarge the smear will be too thick and there will be nofeather edge.
3. The spreader must be pushed forwards and not pulledbackwards to obtain evenness.
4. The glass slides must be clean, dry and grease-free.5. The spreader must be smooth; its width must be lessthan that of the glass slide so that a smooth featheredge at the tail end and clear edges along both sidesare obtained.
6. The smear must be dried quickly to avoid crenation.
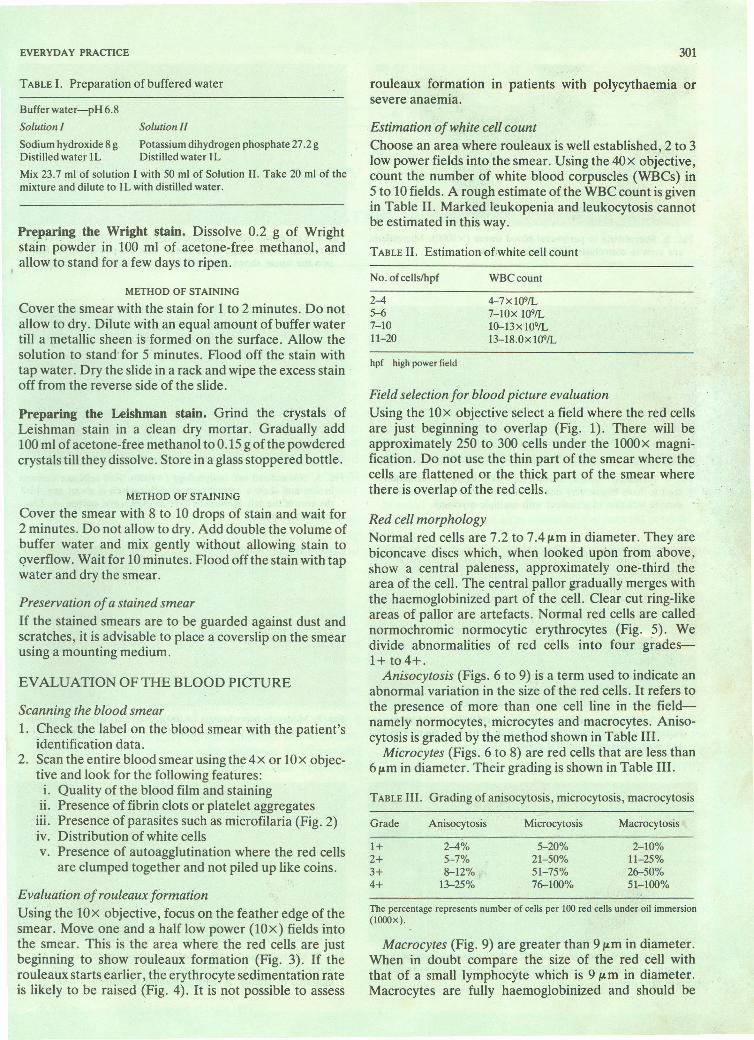
The appearance of the smearThe smear should have a thick head end, a body and a thintail end with a feather edge. The distribution of white cellsin the smear and its appearance are shown in Fig. 1.
x')(
xX
FIG. 1. Appearance of blood smear. XXX patient's identificationH head end of smear B body of smear T tail end of smearM monocyte P polymorphonuclear neutrophils L lymphocyte.The shaded portion shows the ideal area on a smear for bloodpicture evaluation.
Fixing the blood filmThis prevents autolysis of the cells. Blood smears need tobe fixed if they are to be stored before staining or if theGiemsa stain is to be used. Dip the slide with the driedsmear in acetone-free methyl alcohol for half to oneminute. Allow to dry.
Staining the blood smearBlood smears are best stained by Romanowsky stainswhich are combinations of acidic and basic dyes. Themore commonly used Romanowsky stains are the Leishmanand Wright stains. Buffered water is used because thequality of the stain depends on the pH of the water usedto dilute the stain (Table I).
EVERYDAY PRACfICE
TABLE I. Preparation of buffered water
Buffer water-pH 6.8Solution I Solution IISodium hydroxide 8 g Potassium dihydrogen phosphate 27.2 gDistilled water 1L Distilled water 1LMix 23.7 ml of solution I with 50 ml of Solution II. Take 20 ml of themixture and dilute to lL with distilled water.
Preparing the Wright stain. Dissolve 0.2 g of Wrightstain' powder in 100 ml of acetone-free methanol, andallow to stand for a few days to ripen.
METHOD OF STAINING
Cover the smear with the stain for 1 to 2 minutes. Do notallow to dry. Dilute with an equal amount of buffer watertill a metallic sheen is formed on the surface. Allow thesolution to stand' for 5 minutes. Flood off the stain withtap water. Dry the slide in a rack and wipe the excess stainoff from the reverse side of the slide.
Preparing the Leishman stain. Grind the crystals ofLeishman stain in a clean dry mortar. Gradually add100ml of acetone- free methanol to 0.15 g of the powderedcrystals till they dissolve. Store in a glass stoppered bottle.
METHOD OF STAINING
Cover the smear with 8 to 10 drops of stain and wait for2 minutes. Do not allow to dry. Add double the volume ofbuffer water and mix gently without allowing stain tooverflow. Wait for 10minutes. Flood off the stain with tapwater and dry the smear.
Preservation of a stained smearIf the stained smears are to be guarded against dust andscratches, it is advisable to place a coverslip on the smearusing a mounting medium.
EVALUATION OF THE BLOOD PICTURE
Scanning the blood smear1. Check the label on the blood smear with the patient'sidentification data.
2. Scan the entire blood smear using the 4x or LOx objec-tive and look for the following features:i. Quality of the blood film and stainingii. Presence of fibrin clots or platelet aggregatesiii. Presence of parasites such as microfilaria (Fig. 2)iv. Distribution of white cellsv. Presence of autoagglutination where the red cellsare clumped together and not piled up like coins.
Evaluation of rouleaux formationUsing the lOx objective, focus on the feather edge of thesmear. Move one and a half low power (lOX) fields intothe smear. This is the area where the red cells are justbeginning to show rouleaux formation (Fig. 3). If therouleaux starts, earlier, the erythrocyte sedimentation rateis likely to be raised (Fig. 4). It is not possible to assess
301
rouleaux formation in patients with polycythaemia orsevere anaemia.
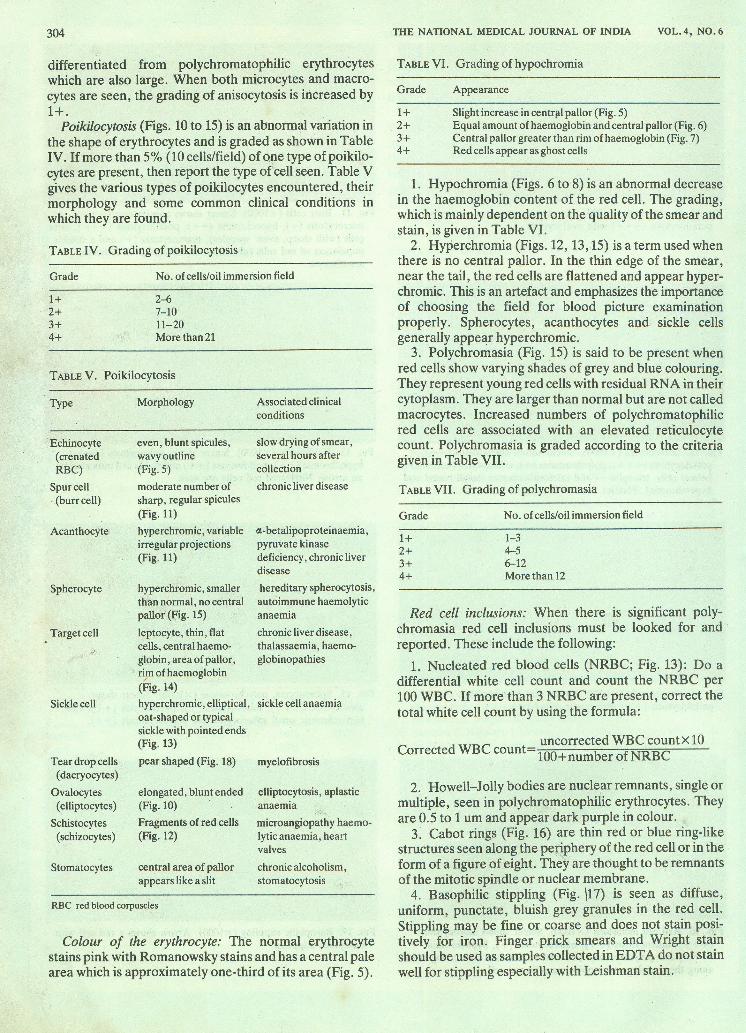
Estimation of white cell countChoose an area where rouleaux is well established, 2 to 3low power fields into the smear. Using the 40x objective,count the number of white blood corpuscles (WBCs) in5 to 10 fields. A rough estimate ofthe WBC count is givenin Table II. Marked leukopenia and leukocytosis cannotbe estimated in this way.
TABLE II. Estimation of-white cell count
No.ofcells/hpf WBCcount
2-4~7-1011-20
4-7xl09/L7-lOx 109/L10-13x109/L13-18.0x 109/L
hpf high power field
Field selection for blood picture evaluationUsing the lOx objective select a field where the red cellsare just beginning to overlap (Fig. 1). There will beapproximately 250 to 300 cells under the lOoox magni-fication. Do not use the thin part of the smear where the,cells are flattened or the thick part of the smear wherethere is overlap of the red cells.
Red cell morphologyNormal red cells are 7.2 to 7.4 /Jomin diameter. They arebiconcave discs which, when looked upon from above,show a central paleness, approximately one-third thearea of the cell. The central pallor gradually merges withthe haemoglobinized part of the cell. Clear cut ring-likeareas of pallor are artefacts. Normal red cells are callednormochromic normocytic erythrocytes (Fig. 5). Wedivide abnormalities of red cells into four grades-1+ t04+. .Anisocytosis (Figs. 6 to 9) is a term used to indicate an
abnormal variation in the size of the red cells. It refers tothe presence of more than one cell line in the field-namely normocytes, microcytes and macrocytes. Aniso-cytosis is graded by the method shown in Table III.Microcytes (Figs. 6 to 8) are red cells that are less than
6 /Jomin diameter. Their grading is shown in Table III.
TABLE III. Grading of anisocytosis, microcytosis, macrocytosis
Grade Anisocytosis Microcytosis Macrocytosis
1+ 2-4% 5-20% 2-10%2+ 5-7% 21-50% 11-25%3+ 8-12% 51-75% 26-50%4+ 13-25% 76-100% 51-100%
The percentage represents number of cells per 100 red cells under oil immersion(l000x),
Macrocytes (Fig. 9) are greater than 9 /Jomin diameter.When in doubt compare the size of the red cell withthat of a small lymphocyte which is 9 /Jomin diameter.Macrocytes are fully haemoglobinized and should be

FIG. 2. Microfilaria in peripheral blood smear (x 1(00). Microfilariaare seen as convoluted dark pink structures.
FIG. 4. Increased rouleaux formation (x 1(0). Rouleaux formation isseen to have begun very near the feather edge of the smear. Thesample was that of a patient with multiple myeloma.
FIG. 6. Anisocytosis and hypochromia (x 1(00). Red cells showvariation in size (anisocytosis + +) with upto 20% microcytes (+)and slight increase in central pallor (+).
FIG. 8. Marked hypochromia (X1000). Red cells show anisocytosis(+ + ), microcytosis (+ +) and hypochromia (+ + + ). --+ indicatestear drop cell.
..
..FIG. 3. Low power examination of blood smear (x 1(0). On the rightis seen the feather edge of the smear. One low power (x 1(0) fieldinto the smear shows that rouleaux formation is yet to begin.
FIG. 5. Normal red cell morphology (x 1(00). Red cells are uniformin size and show a central area of pallor which is about one-thirdthe area of the cell. Some cells have an even wavy, outline --+. Thisis called crenation.
FIG. 7. Moderate hypochromia (x 1(00). Red cells show anisocytosis(+ + ), microcytosis (+ + ), hypochromia (+ + ) and po~ocytosis (+ )
FIG. 9. Macrocytosis (X1000). Red cells show anisocytosis (++),macrocytosis (+ +) and poikilocytosis (+). Normocytes areindicated by arrows. A hyperpigmented neutrophil is seen.

FIG. 10. Ovalocytosis (x 1000). Blood smear shows anisocytosis (+),poikilocytosis (+ + +) with ovalocytosis.
FIG. 12. Schistocytes (x 1000). Smear shows anisocytosis (++),poikilocytosis (+ + + ), polychromasia (+ ), schistocytes (half moon,helmet cells, triangles --+ and microspherocytes (small round andhyperchromic). Platelet number is reduced.
FIG. 14. Target cells (x 1000). Smear shows anisocytosis (++),poikilocytosis (+ +) with target cells (+ + ).
FIG. 16. Red cell inclusions (xiOOO). Smear shows anisocytosis(+ + + ), microcytosis (+ + ), macrocytosis (+), hypochromia(+ + +) and polychromasia (+). Arrow shows a Cabot ring seenalong the periphery of a polychromatic red cell.
FIG. 11. Burr cells (x 1000). Smear shows anisocytosis (+++),microcytosis (+), hypochromia (+ + ), poikilocytosis (+ + + ), burrcells (with sharp, even spicules), macrocytosis (+) and a doublepopulation of red cells (abnormal and normal). --+ indicatesacanthocyte .
"
FIG. 13. Sickle cells (x 1000). Smear shows anisocytosis (++),hypochromia (+ +), poikilocytes (+ +) and sickle cell indicated by
, an arrow. Nucleated red cells are seen.
FIG. 15. Spherocytes, polychromasia (x 1000). Smear showsanisocytosis (+ + + ), microcytosis (+), poikilocytes (+ +) withhyperchromic small spherocytes and polychromasia (+ + ).
FIG. 17. Basophilic stippling (XlOOO). Arrow shows a red CC;II withbasophilic stippling.
304
differentiated from polychromatophilic erythrocyteswhich are also large. When both microcytes and macro-cytes are seen, the grading of anisocytosis is increased by1+.Poikilocytosis (Figs. 10 to 15) is an abnormal variation in
the shape of erythrocytes and is graded as shown in TableIV. If more than 5% (10 cells/field) of one type of poikilo-cytes are present, then report the type of cell seen. Table Vgives the various types of poikilocytes encountered, theirmorphology and some common clinical conditions inwhich they are found.
Grade
TABLE IV. Grading of poikilocytosis
No. of cells/oil immersion field
1+2+3+4+
2-67-1011-20More than 21
Type
TABLE V. Poikilocytosis
Morphology Associated clinicalconditions
Echinocyte(crenatedRBC)Spur cell(burr cell)
Acanthocyte
Spherocyte
Target cell
Sickle cell
Tear drop cells(dacryocytes)
Ovalocytes(elliptocytes)Schistocytes(schizocytes)
Stomatocytes
even, blunt spicules,wavy outline(Fig. 5)moderate number ofsharp, regular spicules(Fig. 11)hyperchromic, variableirregular projections(Fig. 11)
hyperchromic, smallerthan normal, no centralpallor (Fig. 15)
leptocyte, thin, flatcells, central haemo-globin, area of pallor,r~mof haemoglobin(Fig. 14)hyperchromic, elliptical,oat-shaped or typicalsickle with pointed ends(Fig. 13)
pear shaped (Fig. 18)
elongated, blunt ended(Fig. 10)Fragments of red cells(Fig. 12)
central area of pallorappears like a slit
slow drying of smear,several hours aftercollectionchronic liver disease
e-betalipoproteinaemia,pyruvate kinasedeficiency, chronic liverdiseasehereditary spherocytosis,autoimmune haemolyticanaemiachronic liver disease,thalassaemia, haerno-globinopathies
sickle cell anaemia
myelofibrosis
elliptocytosis, aplasticanaemiamicroangiopathy haemo-lytic anaemia, heartvalves
chronic alcoholism,stomatocytosis
RBC red blood corpuscles
Colour of the erythrocyte: The normal erythrocytestains pink with Romanowsky stains and has a central palearea which is approximately one-third of its area (Fig. 5).
THE NATIONAL MEDICAL JOURNAL OF INDIA VOL.4, NO.6
TABLE VI. Grading of hypochromia
Grade Appearance
1+ Slight increase in central pallor (Fig. 5)2+ Equal amount of haemoglobin and central pallor (Fig. 6)3+ Central pallor greater than rim of haemoglobin (Fig. 7)4+ Red cells appear as ghost cells
1. Hypochromia (Figs. 6 to 8) is an abnormal decreasein the haemoglobin content of the red cell. The grading,which ismainly dependent on the quality of the smear andstain, is given in Table VI.2. Hyperchromia (Figs. 12, 13,15) is a term used when
there is no central pallor. In the thin edge of the smear,near the tail, the red cells are flattened and appear hyper-chromic. This is an artefact and emphasizes the importanceof choosing the field for blood picture examinationproperly. Spherocytes, acanthocytes and sickle cellsgenerally appear hyperchromic. .3. Polychromasia (Fig. 15) is said to be present when
red cells show varying shades of grey and blue colouring.They represent young red cells with residual RNA in theircytoplasm. They are larger than normal but are not calledmacrocytes. Increased numbers of polychromatophilicred cells are associated with an elevated reticulocytecount. Polychromasia is graded according to the criteriagiven in Table VII.
TABLE VII. Grading of polychromasia
Grade No. of cellS/oil immersion field
1+2+3+4+
1-34-56-12More than 12
Red cell inclusions: When there is significant poly-chromasia red cell inclusions must be looked for andreported. These include the following:1. Nucleated red blood cells (NRBC; Fig. 13): Do a
differential white cell count and count the NRBC per100WBC. If more than 3 NRBC are present, correct thetotal white cell count by using the formula:
C dWBC t uncorrected WBCcountxl0orrecte coun 100+number ofNRBC
2. Howell-Jolly bodies are nuclear remnants, single ormultiple, seen in polychromatophilic erythrocytes. Theyare 0.5 to 1 urn and appear dark purple in colour.3. Cabot rings (Fig. 16) are thin red or blue ring-like
structures seen along the periphery of the red cell or in theform of a figure of eight. They are thought to be remnantsof the mitotic spindle or nuclear membrane.4. Basophilic stippling (Fig. \17) is seen as diffuse,
uniform, punctate, bluish grey granules in the red cell.Stippling may be fine or coarse and does not stain posi-tively for iron. Finger prick smears and Wright stainshould be used as samples collected in EDT A do not stainwell for stippling especially with Leishman stain.

EVERYDAY PRACllCE
-..-..FIG. 18. Toxic granulation (X1000). Smear shows anisocytosis (+),hypochromia (+ +), poikilocytosis (+), leukocytosis with shift tothe left and toxic change (++; heavy granulation).
5. Malarial parasites are red cell inclusions and shouldbe looked for routinely.
Platelet number and morphologyPlatelet number is assessed from smears made from
blood (Fig. 18), anticoagulated with EDTA. In an areaon the smear where the red cells are just beginning tooverlap, using a 1000x magnification, each platelet seenis equivalent to 15 000 on the total platelet count. There-fore, in an average field one should see 10 to 20 platelets(equivalent to a platelet count of 1.5-3.0 X 10⁹/L). However,it is not possible to estimate their number if they are inaggregates.Platelet morphology: Platelets are 2 to 3/Lm in diameter,
have no nuclei and their cytoplasm is filled with purplepink granules. Platelet anisocytosis and the presence ofgiant platelets (up to 7 to 9 /Lm) must be reported.Platelets swell and stain poorly if there is excess EDT A orif they are allowed to stand in EDT A blood at 20 0(; formore than two hours. Rarely EDT A induced plateletagglutination is seen due to crypt antigens. Plateletsatellitism (adhesion of platelets to neutrophils) isanother rare unexplained phenomenon.
Leukocyte number and morphology1. The white cell number must be assessed (as givenabove) and the presence of a normal number, leuko-
305
penia or leukocytosis reported. A full differentialcount must be carried out.
2. The differential count is done in the area where thetotal number is assessed under 1000x magnificationgoing up and down the smear to include both edges.This is to ensure that the larger cells especially themonocytes lying along the edges of the smear areincluded in the differential count. In case of increasedrouleaux formation the battlement technique may beused.
3. Abnormal numbers of any of the cell types(eosinophilia, basophilia), the presence of a shift to theleft, blasts or inclusions must be reported.
TABLE VIII. Grading of toxic changes in neutrophils
Grade Appearance
1+ Increased dark granulation in neutrophils2+ Heavy granulation and Dohle bodies3+ Heavy granulation, Dohle bodies and vacuolation
4. Toxic changes (Fig. 18) when present are graded asshown in Table VIII.
5. Hypersegmentation refers to the appearance ofincreased lobulation of the nuclei of neutrophils. Nor-mally 2% of the neutrophils have 5 lobes, 17% have4 lobes, 76% have 2 to 3 lobes and 5% have no lobes.Hypersegmentation is graded as shown in Table IX.
TABLE IX. Grading of hypersegmentation
Grade Appearance
1+ 20-25% have 4 lobes, 2% have 5 or more lobes2+ 26-30% have 4 lobes, 4% have 5 or more lobes3+ 30% or more have 5 or more lobes
6. Presence of dysmyelopoiesis, abnormal nuclear lobula-tion, Pelger-Huet forms hereditary, occurs in 1:3000persons, not associated with any clinical conditionsand hypogranulation must be reported.
7. Lymphocyte morphology should be described. Nor-mally the lymphocyte population shows small andlarge lymphocytes. Reactive lymphocytes (in responseto viral infections) may appear 'plasmacytoid' withmoderate amounts of blue cytoplasm or 'blast' like.The presence of atypical lymphoid cells, Iymphoblastsand smear cells must be reported.
To correctly evaluate a blood picture it is of utmostimportance to properly prepare and stain the smear.