Embed Size (px)
Citation preview
30th April 2014
“This third annual event will demonstrate, by way of case examples, how developments in Analytics are leading to increased competitive advantage”
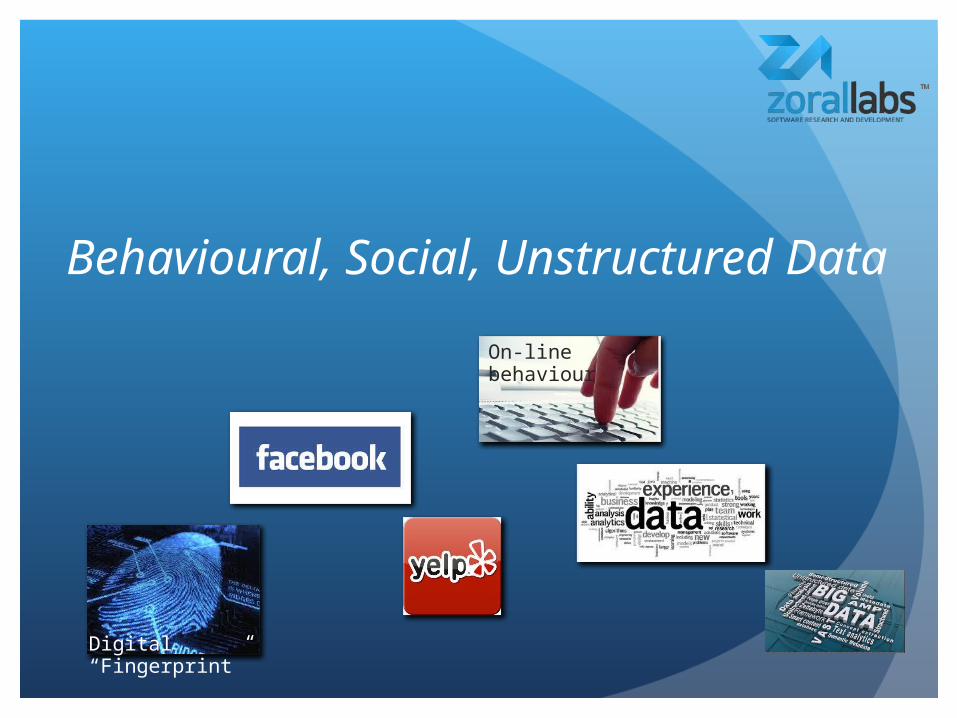
Behavioural, Social, Unstructured Data
Digital “Fingerprint”
On-line behaviour
• Zoral AI/ML software research and development
• 150 staff, established 2004
• Advanced predictive analytics
• Unstructured/behavioural/social data
• Finance sector
• Risk
• Clients - Consumer/SME, Insurance/Credit Products
• STP, e-commerce
• High level of automation
• High volume
• Pioneer
• North America, Europe, Australasia, Africa
Context – what we do
• Lending/insuring online
• Unknown customers (Consumer/SME)
• Challenging markets
• Small to large
• Existing platforms
• Sales/marketing
• Underwriting
• Collections
• Compliance
Context – what our clients do
• Which leads?
• Which channels?
• Customer/Product routing/conversion
• Acceptance/Default
• Fraud
• Collections
• “Their” behaviour/Client behaviour
• Renewals
• Affordability
• Marketing
Context – what our clients need to know
STP
Automated
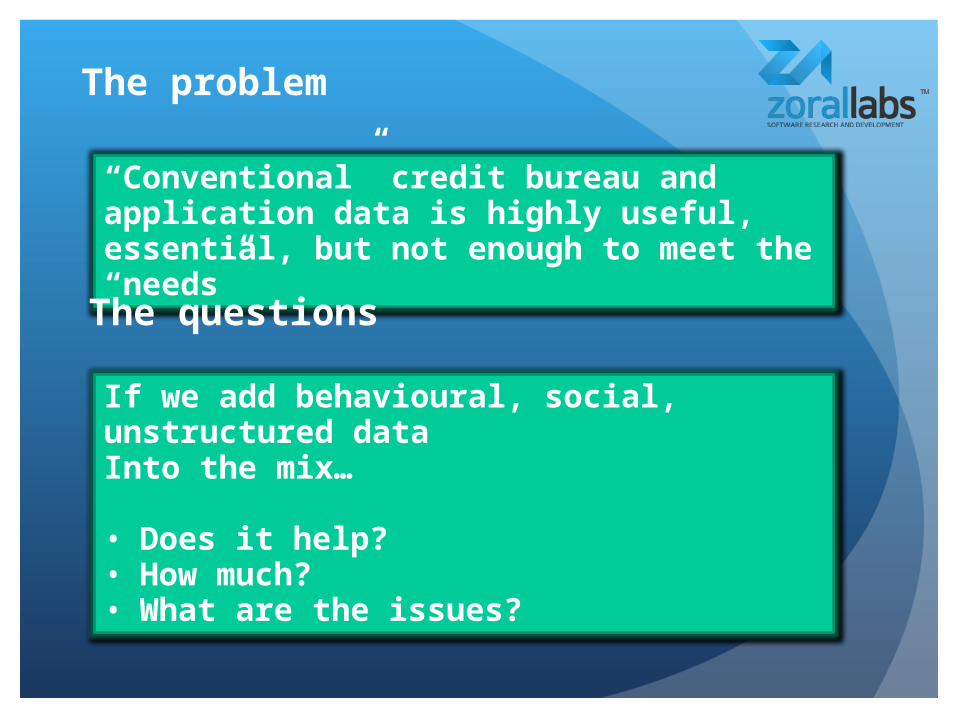
The problem
“Conventional” credit bureau and application data is highly useful, essential, but not enough to meet the “needs”
The questions
If we add behavioural, social, unstructured dataInto the mix…
• Does it help?• How much?• What are the issues?
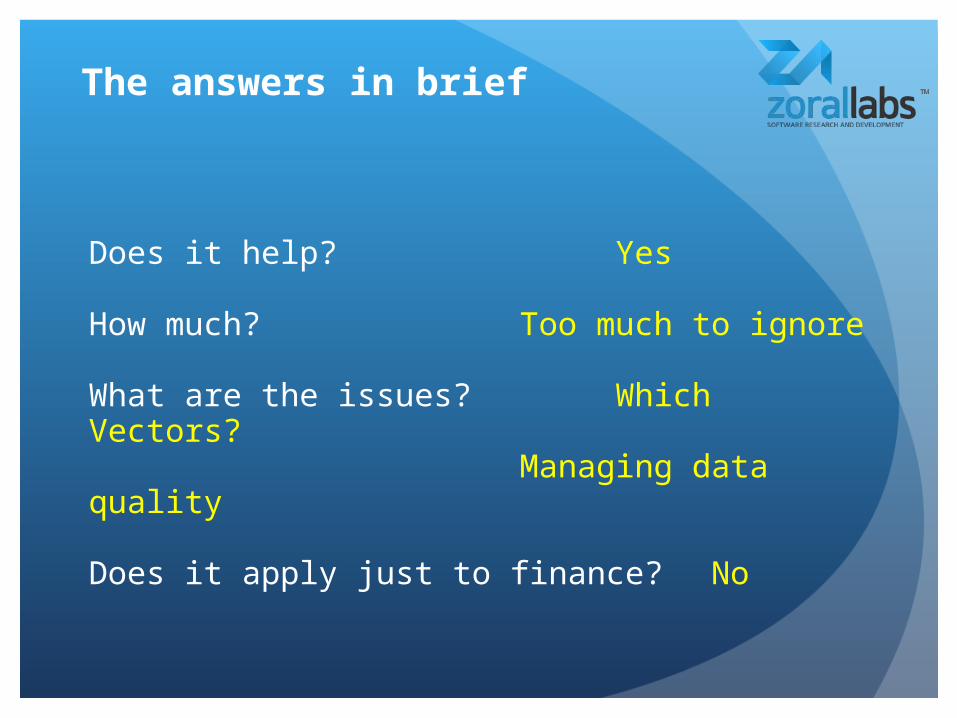
The answers in brief
Does it help? Yes
How much? Too much to ignore
What are the issues? Which Vectors?
Managing data quality
Does it apply just to finance? No
What do we mean by behavioural and social data?
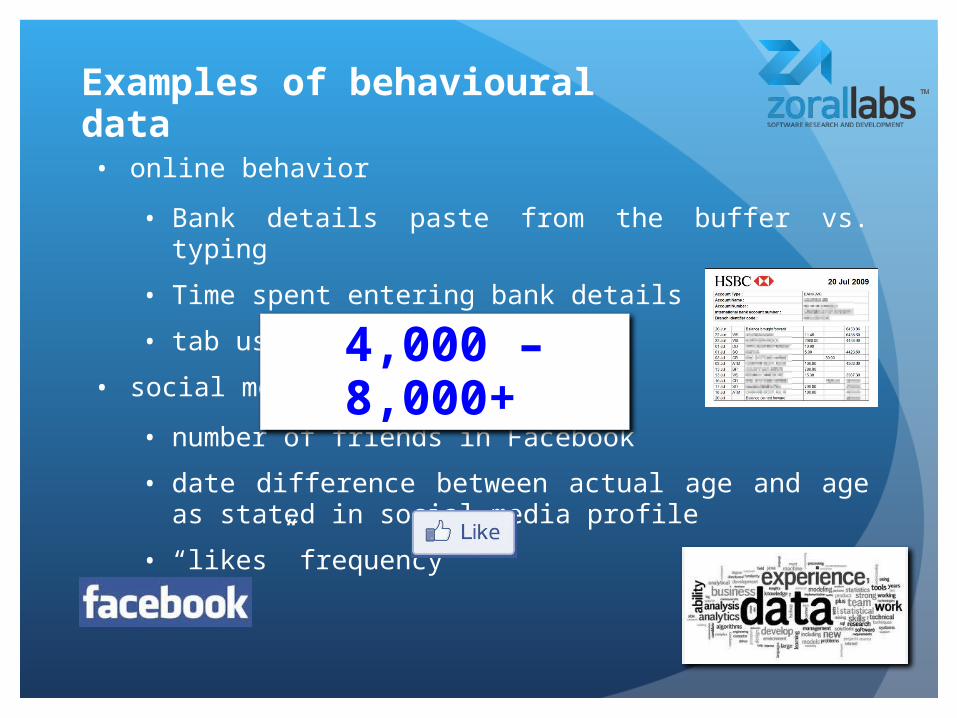
• online behavior
• Bank details paste from the buffer vs. typing
• Time spent entering bank details
• tab usage vs. mouse usage
• social media
• number of friends in Facebook
• date difference between actual age and age as stated in social media profile
• “likes” frequency
Examples of behavioural data
4,000 – 8,000+
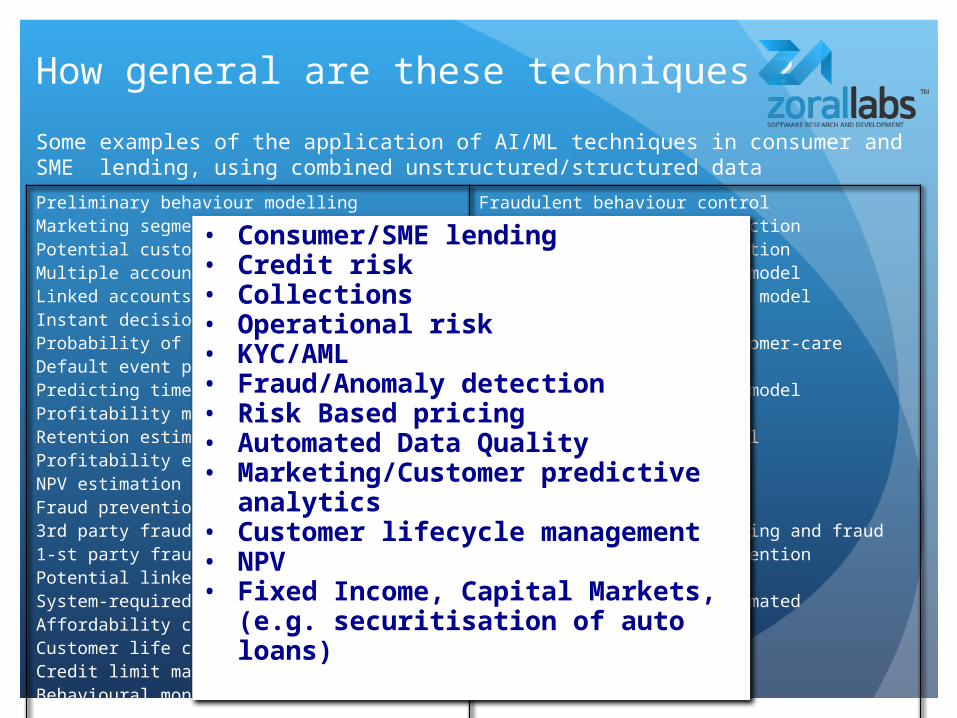
How general are these techniques ?
Preliminary behaviour modellingMarketing segmentationPotential customer-value modelMultiple accounts discovery modelLinked accounts discovery modelInstant decision customer-based modelsProbability of defaultDefault event predictionPredicting time of defaultProfitability modelRetention estimationProfitability estimationNPV estimationFraud prevention3rd party fraud detection1-st party fraud detectionPotential linked fraud estimationSystem-required verificationAffordability control modelCustomer life cycle management systemCredit limit managementBehavioural monitoringFraudulence monitoringCollateral Valuation
Fraudulent behaviour controlCollectability event predictionCollectability time predictionContactability estimation modelMethods for contactability modelCollection schedule modelRetention control and customer-care modelsIndividual retention plan modelIndividual pricing modelAffordability control modelSystem health monitoringData quality controlData quality monitoringOperational errors monitoring and fraudAnomaly detection and preventionModel quality monitoringModel quality control/automated retrainingMarketing modelsCost optimisation moduleBudgeting moduleProvisioning module Using Neural Nets, SVM, Bayes, decision trees, Markov Chains, random forest, genetic algorithms, survival analysis, anomaly detection, etc.
Some examples of the application of AI/ML techniques in consumer and SME lending, using combined unstructured/structured data
• Consumer/SME lending• Credit risk• Collections• Operational risk• KYC/AML• Fraud/Anomaly detection• Risk Based pricing• Automated Data Quality• Marketing/Customer predictive
analytics• Customer lifecycle management• NPV• Fixed Income, Capital Markets, (e.g.
securitisation of auto loans)
An example of how this is used
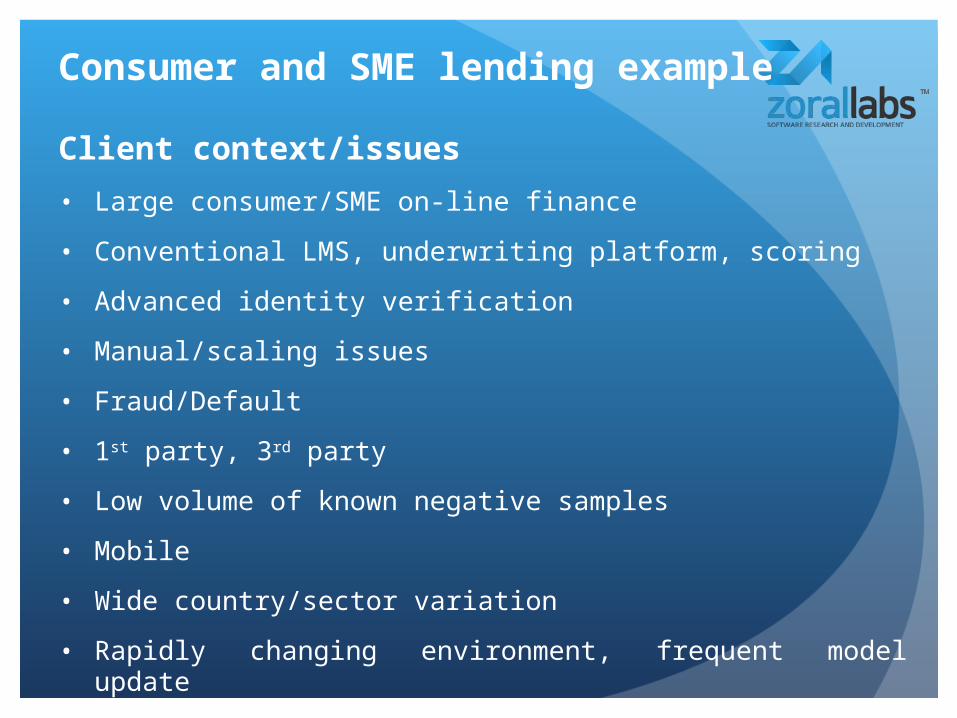
Client context/issues
• Large consumer/SME on-line finance
• Conventional LMS, underwriting platform, scoring
• Advanced identity verification
• Manual/scaling issues
• Fraud/Default
• 1st party, 3rd party
• Low volume of known negative samples
• Mobile
• Wide country/sector variation
• Rapidly changing environment, frequent model update
Consumer and SME lending example
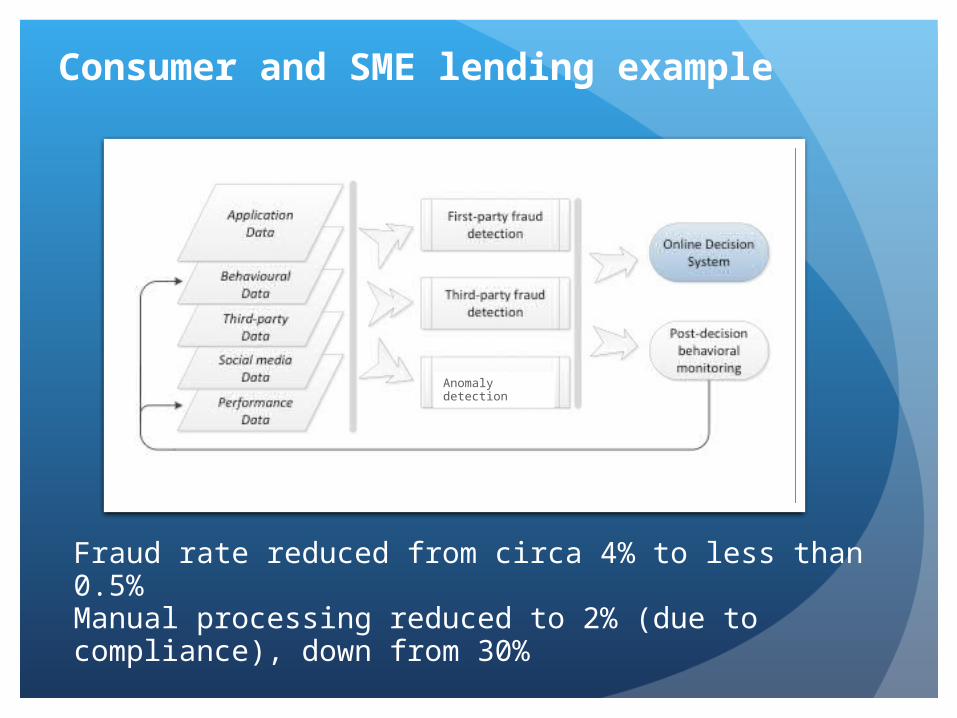
Fraud rate reduced from circa 4% to less than 0.5%Manual processing reduced to 2% (due to compliance), down from 30%
Anomaly detection
Consumer and SME lending example
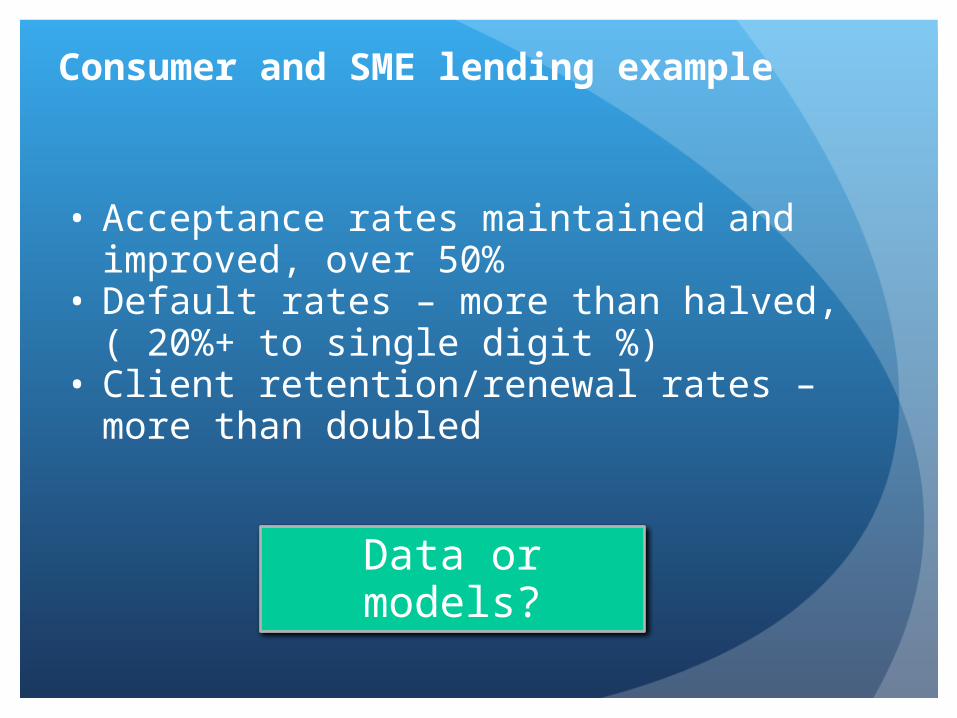
• Acceptance rates maintained and improved, over 50%
• Default rates – more than halved, ( 20%+ to single digit %)
• Client retention/renewal rates – more than doubled
Consumer and SME lending example
Data or models?
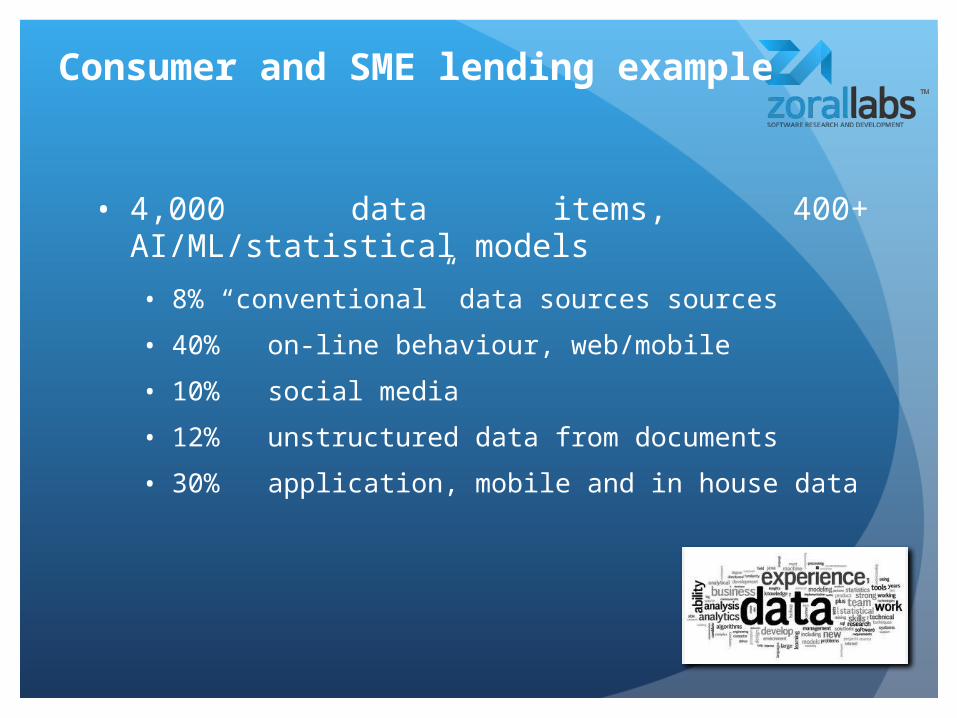
• 4,000 data items, 400+ AI/ML/statistical models
• 8% “conventional” data sources sources
• 40% on-line behaviour, web/mobile
• 10% social media
• 12% unstructured data from documents
• 30% application, mobile and in house data
Consumer and SME lending example
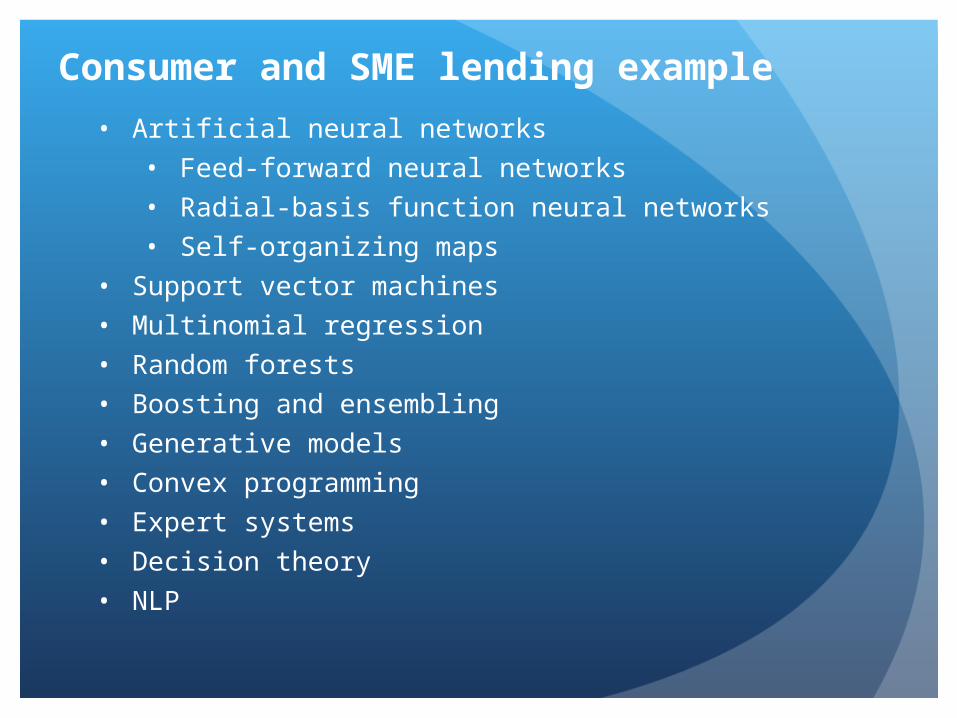
• Artificial neural networks• Feed-forward neural networks• Radial-basis function neural networks• Self-organizing maps
• Support vector machines• Multinomial regression• Random forests• Boosting and ensembling• Generative models• Convex programming• Expert systems• Decision theory• NLP
Consumer and SME lending example
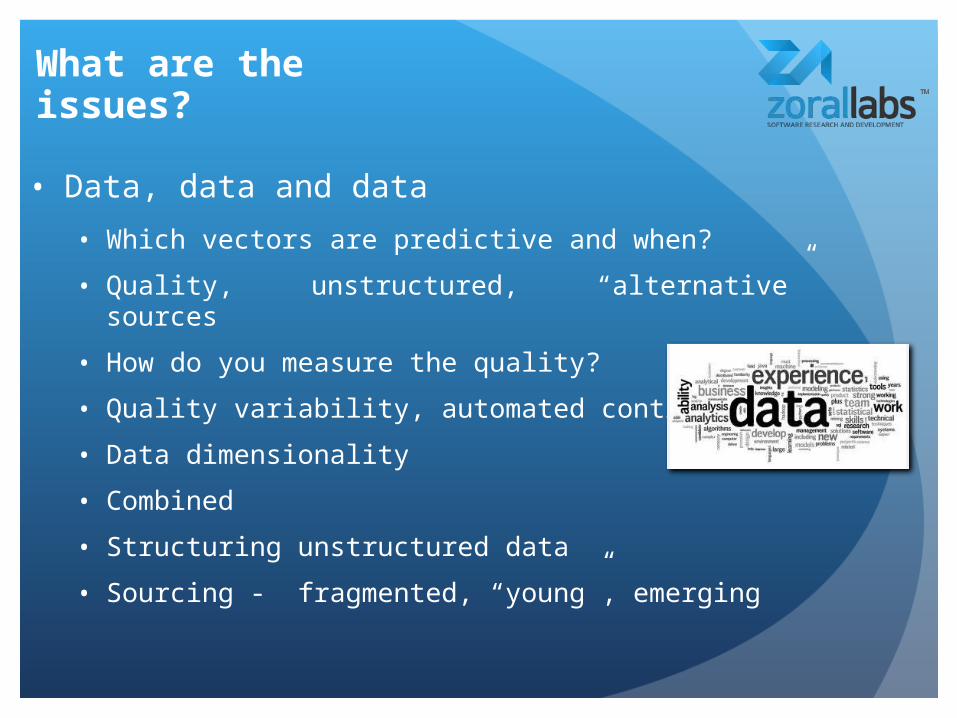
• Data, data and data
• Which vectors are predictive and when?
• Quality, unstructured, “alternative” sources
• How do you measure the quality?
• Quality variability, automated control
• Data dimensionality
• Combined
• Structuring unstructured data
• Sourcing - fragmented, “young”, emerging
What are the issues?
More examples
Client context/issues
• Large consumer on-line and off-line finance
• Conventional LMS
• Credit bureau and application scoring
• Large in house data pool
• Default rate too high
• Acceptances too low
Consumer and SME lending example
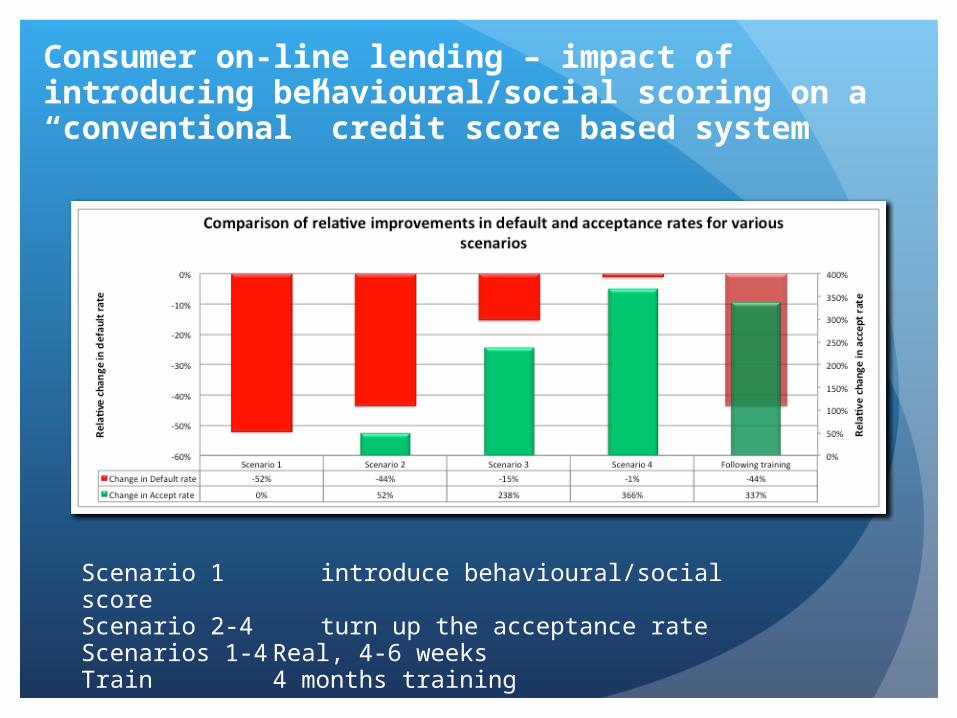
Consumer on-line lending – impact of introducing behavioural/social scoring on a “conventional” credit score based system
Scenario 1 introduce behavioural/social scoreScenario 2-4 turn up the acceptance rateScenarios 1-4 Real, 4-6 weeksTrain 4 months training
1-100 100-200 200-300 300-400 400-500 500-600 600-700 700-800 800-900 900-10000.00%
10.00%
20.00%
30.00%
40.00%
50.00%
60.00%
70.00%
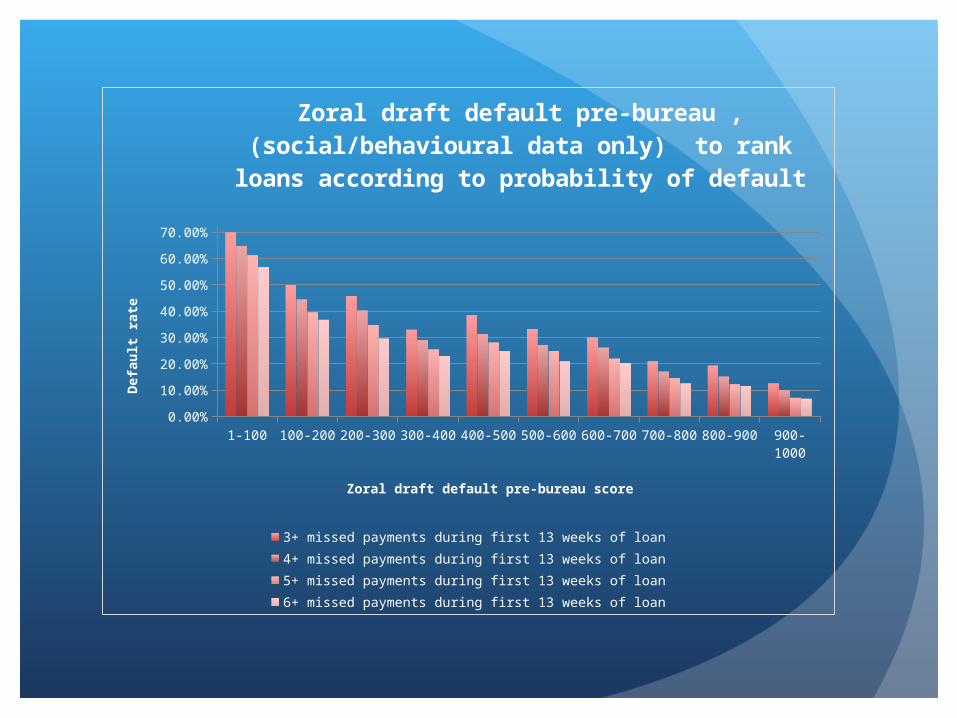
Zoral draft default pre-bureau , (social/behavioural data only) to rank loans according to probability of default
3+ missed payments during first 13 weeks of loan 4+ missed payments during first 13 weeks of loan5+ missed payments during first 13 weeks of loan 6+ missed payments during first 13 weeks of loan
Zoral draft default pre-bureau score
Defa
ult r
ate
8.11.10
1-100 100-200 200-300 300-400 400-500 500-600 600-700 700-800 800-900 900-10000.00%
10.00%
20.00%
30.00%
40.00%
50.00%
60.00%
70.00%
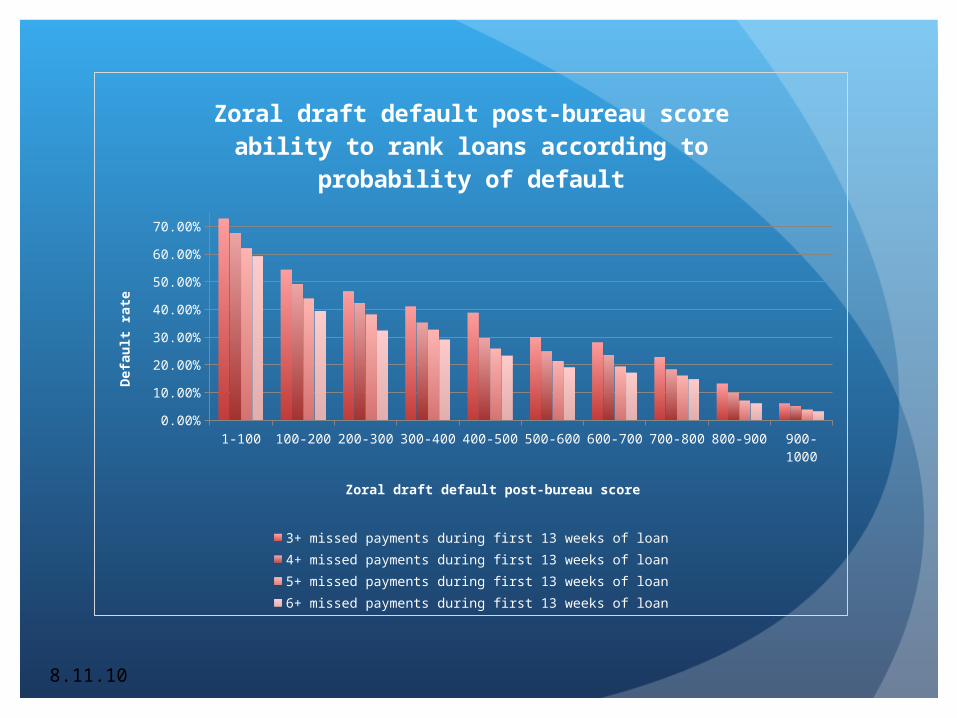
Zoral draft default post-bureau score ability to rank loans according to probability of default
3+ missed payments during first 13 weeks of loan 4+ missed payments during first 13 weeks of loan5+ missed payments during first 13 weeks of loan 6+ missed payments during first 13 weeks of loan
Zoral draft default post-bureau score
Defa
ult r
ate
This is OK for consumers, but what about companies?
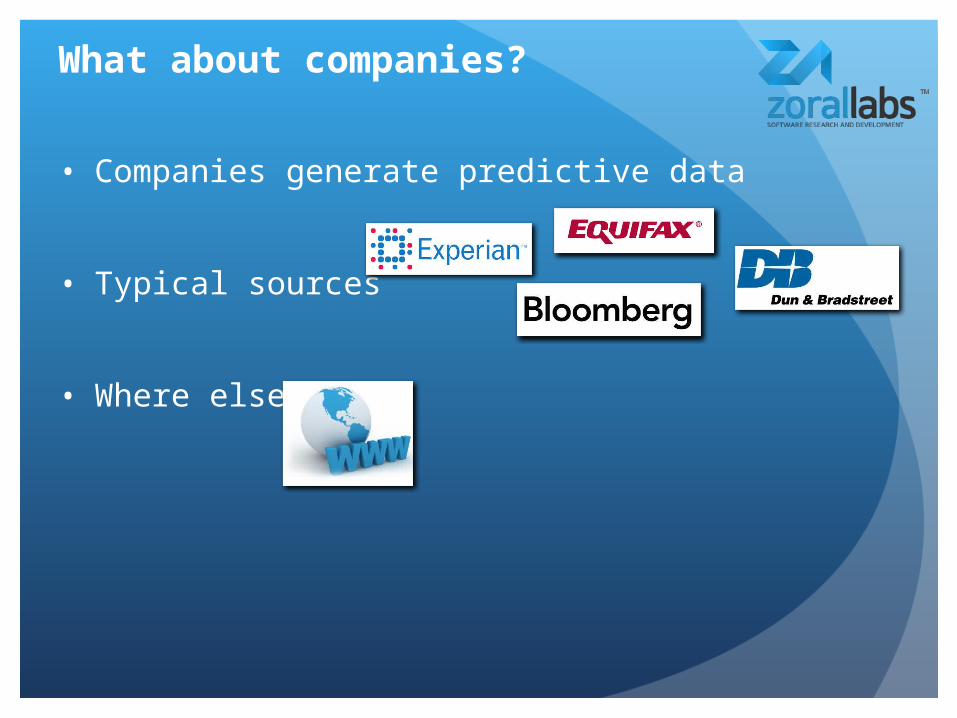
• Companies generate predictive data
• Typical sources
• Where else?
What about companies?
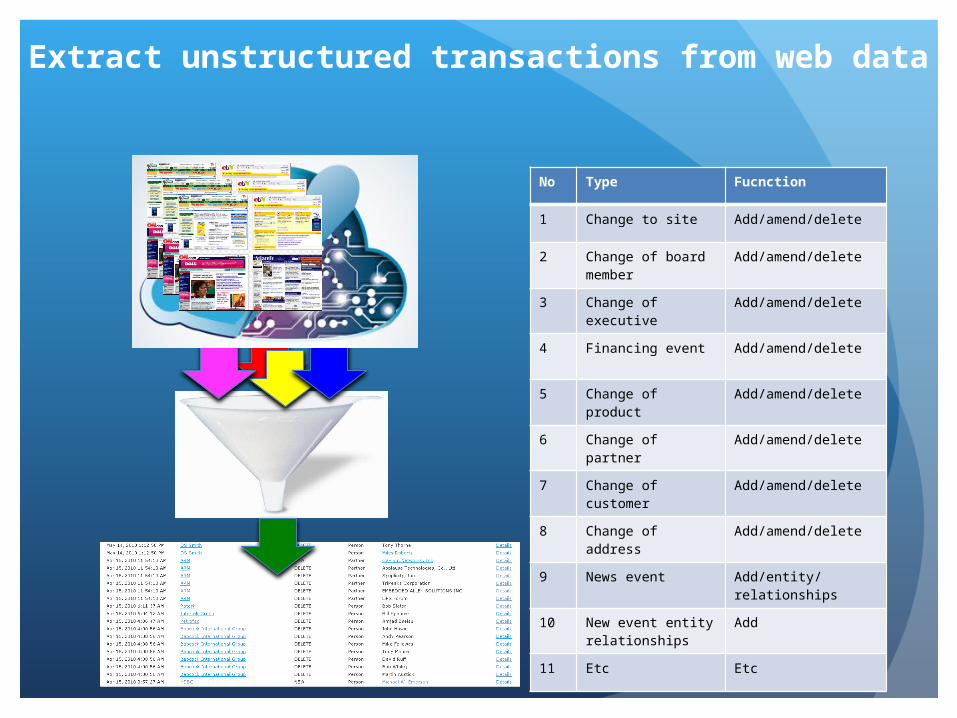
No Type Fucnction
1 Change to site Add/amend/delete
2 Change of board member
Add/amend/delete
3 Change of executive
Add/amend/delete
4 Financing event Add/amend/delete
5 Change of product Add/amend/delete
6 Change of partner Add/amend/delete
7 Change of customer
Add/amend/delete
8 Change of address Add/amend/delete
9 News event Add/entity/relationships
10 New event entity relationships
Add
11 Etc Etc
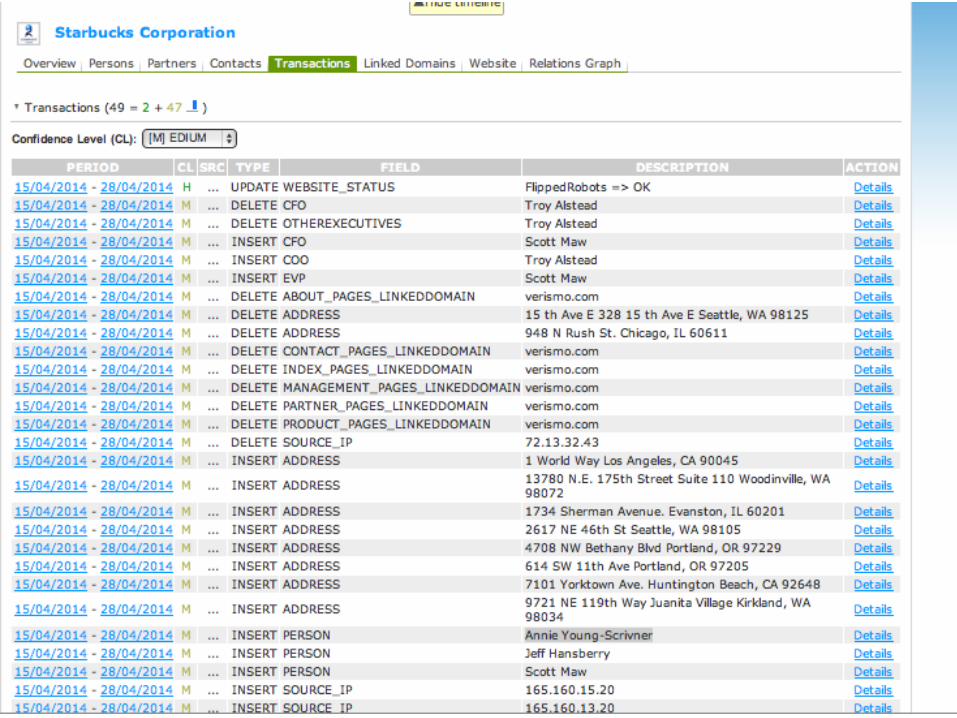
Extract unstructured transactions from web data
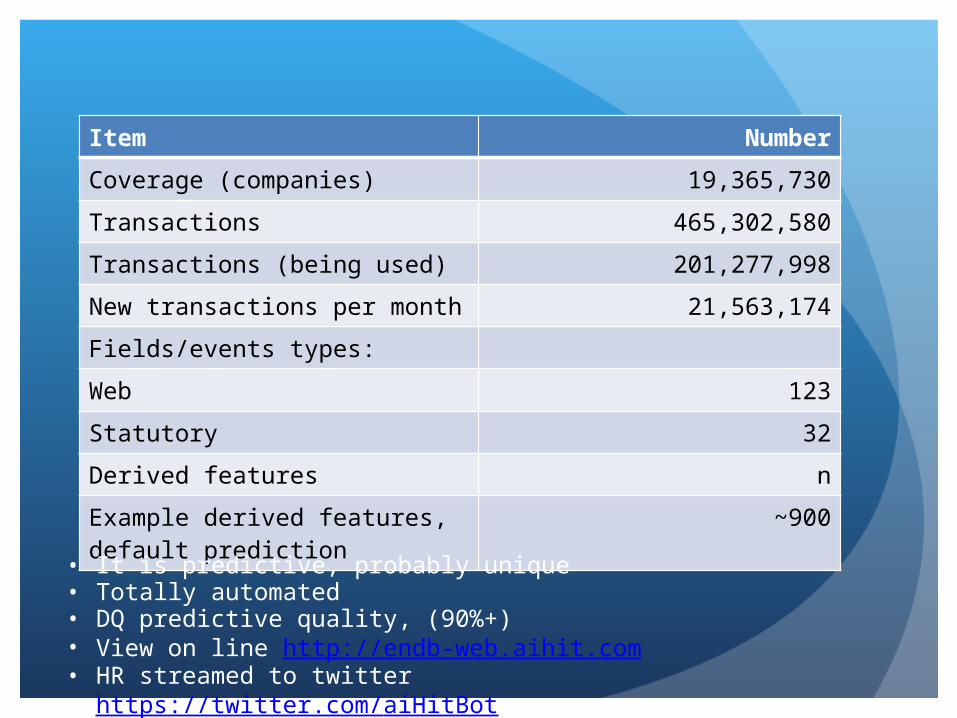
Item Number
Coverage (companies) 19,365,730
Transactions 465,302,580
Transactions (being used) 201,277,998
New transactions per month 21,563,174
Fields/events types:
Web 123
Statutory 32
Derived features n
Example derived features, default prediction
~900
• It is predictive, probably unique• Totally automated• DQ predictive quality, (90%+)• View on line http://endb-web.aihit.com• HR streamed to twitter https://twitter.com/aiHitBot
8.11.10
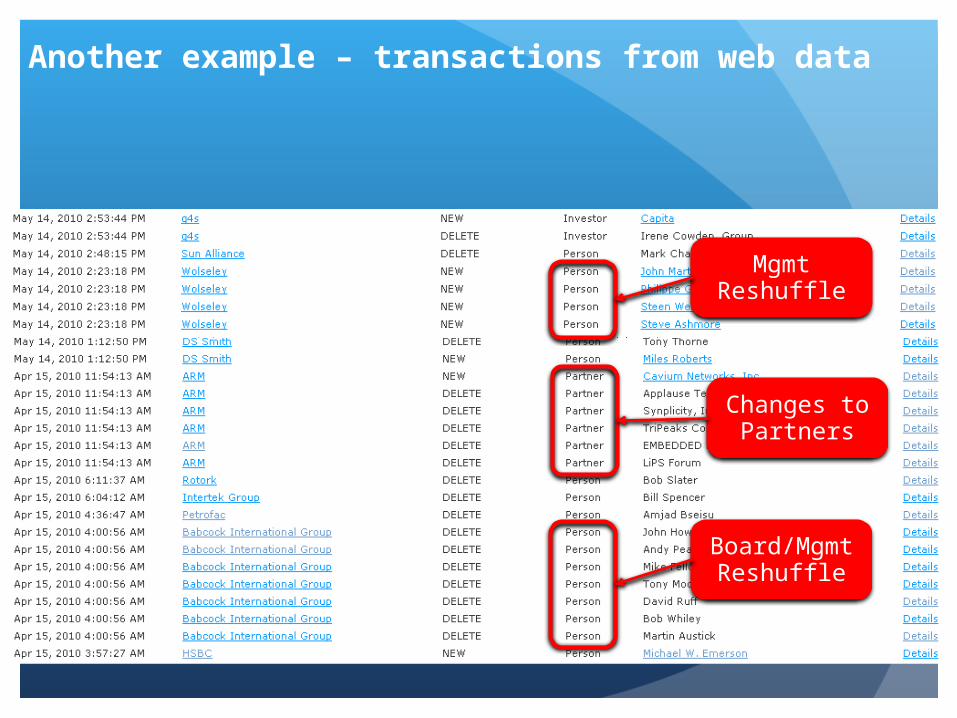
Mgmt Reshuffle
Changes to Partners
Board/Mgmt Reshuffle
Another example – transactions from web data
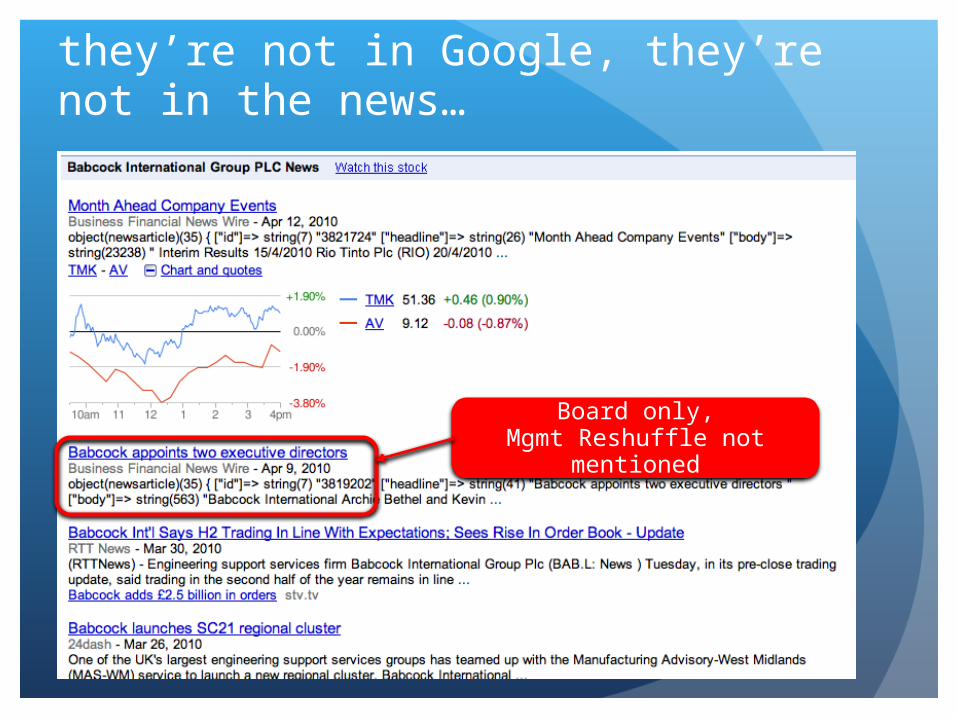
they’re not in Google, they’re not in the news…
Board only,Mgmt Reshuffle not
mentioned
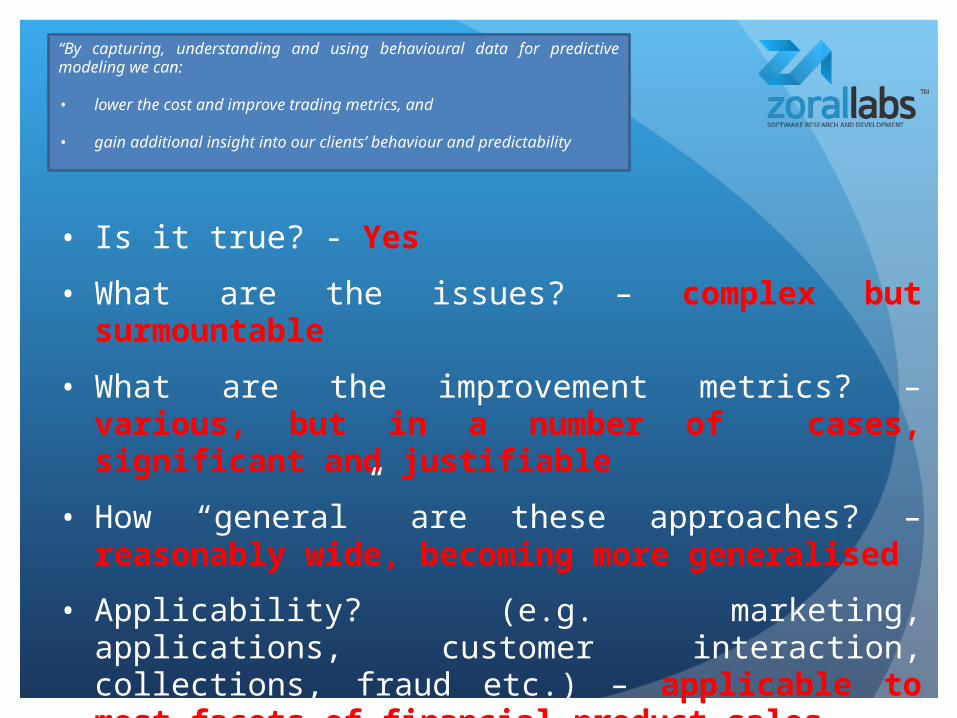
• Is it true? - Yes
• What are the issues? – complex but surmountable
• What are the improvement metrics? – various, but in a number of cases, significant and justifiable
• How “general” are these approaches? – reasonably wide, becoming more generalised
• Applicability? (e.g. marketing, applications, customer interaction, collections, fraud etc.) – applicable to most facets of financial product sales
“By capturing, understanding and using behavioural data for predictive modeling we can:
• lower the cost and improve trading metrics, and
• gain additional insight into our clients’ behaviour and predictability
1. Are you using behavioural data to model, predict, optimise each step of the marketing/sales/customer lifecycle?
2. How much?
3. Could you use more?
4. What is the quality? How is measured?
5. How much better could your results be if 1-4 are optimised?
6. How much more could you automate operations using the techniques discussed today?
7. How does your organisation compare to market norms and best practice in this area?
8. What would it add to the “bottom line” if behavioural data modeling were applied to each, applicable area of your business?
9. Where to start?
Now what?
Good news