Embed Size (px)
Citation preview

Annual Report
30 April
2018 SESA SpA , Registered office: Via Piovola no. 138 – 50053 Empoli (Province of Florence) - Share Capital: Euro 37,126,927; Fiscal Code, Florence Register of Companies and VAT no. 07116910964

2
Contents
Report on operations .............................................................................................................................................................................................................................. 3
Governing and supervisory bodies of Sesa SpA ....................................................................................................................................................................... 4
Highlights of Group results ............................................................................................................................................................................................................. 5
Main Financial Indicators ................................................................................................................................................................................................................. 6
Letter to the Shareholders ............................................................................................................................................................................................................... 7
Company Headquarters and Group’s facilities ....................................................................................................................................................................... 10
Corporate site .................................................................................................................................................................................................................................... 10
Structure of the Sesa Group at 30 April 2018 ......................................................................................................................................................................... 11
Performance of operations ............................................................................................................................................................................................................ 17
Corporate Governance .................................................................................................................................................................................................................... 32
Treasury shares .................................................................................................................................................................................................................................. 32
Research and development activity ............................................................................................................................................................................................ 32
Relations with subsidiaries, associates, controlling companies and related concerns ............................................................................................... 33
Social responsibility of the Sesa Group (declaration of non-financial data) ................................................................................................................. 33
Evolution of human capital............................................................................................................................................................................................................ 33
Main risks and uncertainties to which the Group and Sesa SpA are exposed .............................................................................................................. 35
Significant events occurring after the end of the year ......................................................................................................................................................... 38
Outlook ................................................................................................................................................................................................................................................ 38
Allocation of the profit for the year of the parent Sesa SpA .............................................................................................................................................. 38
Consolidated Financial Statements at 30 April 2018................................................................................................................................................................... 39
Consolidated Income Statement ................................................................................................................................................................................................. 40
Consolidated Statement of Comprehensive Income ............................................................................................................................................................ 40
Consolidated Statement of Financial Position ........................................................................................................................................................................ 41
Consolidated Statement of Cash Flows ..................................................................................................................................................................................... 42
Consolidated Statement of Changes in Equity ....................................................................................................................................................................... 43
Explanatory Notes to the Consolidated Financial Statements ........................................................................................................................................... 44
Attestation of the Consolidated Financial Statements pursuant to art. 154-bis of Italian Legislative Decree no. 58/98 ............................... 92
Independent Auditor’s Report on the Consolidated Financial Statements of the Sesa Group ............................................................................... 93
Annex 1 ................................................................................................................................................................................................................................................ 99
Separate Income Statement ....................................................................................................................................................................................................... 103
Separate Statement of Comprehensive Income .................................................................................................................................................................. 103
Separate Statement of Financial Position .............................................................................................................................................................................. 104
Separate Statement of Cash Flows .......................................................................................................................................................................................... 105
Explanatory Notes to the Separate Financial Statements ................................................................................................................................................ 107
Attestation of the Separate Financial Statements pursuant to art. 154-bis of Italian Legislative Decree no. 58/98 ..................................... 140
Independent Auditor’s Report on the Separate Financial Statements of Sesa SpA ................................................................................................ 141
Report of the Board of Satatutory Auditors to the Shareholders’ Meeting ............................................................................................................... 146
3
Report on operations

4
Governing and supervisory bodies of Sesa SpA
Board of Directors Holding office until
Paolo Castellacci Chairman approval of the FS at 30.04.2018 Giovanni Moriani Executive Vice - Chairman approval of the FS at 30.04.2018 Moreno Gaini Executive Vice - Chairman approval of the FS at 30.04.2018 Alessandro Fabbroni CEO approval of the FS at 30.04.2018 Luigi Gola Independent Director approval of the FS at 30.04.2018 Giovanna Zanotti Independent Director approval of the FS at 30.04.2018 Angela Oggionni Independent Director approval of the FS at 30.04.2018 Angelica Pelizzari Non- Executive Director approval of the FS at 30.04.2018 The Chairman, Paolo Castellacci, was granted all powers of ord. management for the strategic management of relations with vendors and suppliers, power to represent the company legally and
institutional relations.
The Executive Vice-Chairman, Moreno Gaini, was granted all the powers of ordinary administration with regard to the management of equity investments in the IT distribution Sector (VAD).
The Executive Vice-Chairman, Giovanni Moriani, was granted all the powers of ordinary administration for the management of equity investments in the Software and System Integration Segment (VAR).
The CEO, Alessandro Fabbroni, was granted all the powers of ordinary management related to the management of the corporate functions of administration, finance, control, investor relations, legal,
corporate duties, extraordinary finance, organisation, IT, management of human resources, carrying out banking transactions and the management of equity investments in the Corporate & Services
Segment.
Corporate Governance Committees Holding office until
Strategic Committee
Luigi Gola (Chairman), members Paolo Castellacci, Alessandro Fabbroni, Giovanni Moriani, Angelica Pelizzari approval of the FS at 30.04.2018
Control and Risk Commitee and Related Parties Committee
Giovanna Zanotti (Chairman), members Luigi Gola, Angelica Pelizzari approval of the FS at 30.04.2018
Director in charge Alessandro Fabbroni approval of the FS at 30.04.2018
Remuneration Committee
Luigi Gola (Chairman), members Angelica Pelizzari and Giovanna Zanotti approval of the FS at 30.04.2018
Board of Statutory Auditors Holding office until
Sergio Menchini Chairman approval of the FS at 30.04.2018 Luca Parenti Standing auditor approval of the FS at 30.04.2018 Chiara Pieragnoli Standing auditor approval of the FS at 30.04.2018 Fabrizio Berti Alternate auditor approval of the FS at 30.04.2018 Daria Dalle Luche Alternate auditor approval of the FS at 30.04.2018
Supervisory Board pursuant to Law 231/2011 Holding office until
Luca Parenti Chairman approval of the FS at 30.04.2018 Massimo Innocenti Member approval of the FS at 30.04.2018 Ilaria Nocentini Member approval of the FS at 30.04.2018 Michele Ferri, Internal Audit Manager
Independent Auditors Holding office until
Independent Auditors in charge of statutory audit of accounts PricewaterhouseCoopers SpA approval of the FS at 30.04.2022
Francesco Billi, Controller and Manager of administrative processes
Listing Market
Electronic stock market (MTA), Milan (Italy) STAR segment
Share Capital 37,126,927.50
Outstanding shares 15,494,590
Stake held by the controlling company ITH S.p.A. 52.81%
Specialist operator Intermonte Sim SpA
Financial coverage Intermonte Sim SpA, Banca IMI SpA
Conxi Palmero, Investor Relation Manager

5
Highlights of Group results
Consolidated income statement data at 30 April of each year
(in thousands of euros) 2018 2017 2016 2015 2014*
Revenues 1,350,900 1,260,275 1,223,485 1,054,038 941,023
Total Revenues and Other Income 1,363,035 1,271,469 1,229,602 1,060,160 947,556
EBITDA (Earnings before D&A, other provisions,
financial charges and taxes) 63,121 57,885 54,009 51,583 49,718
EBIT 46,290 44,786 43,684 41,361 39,988
EBT 43,031 40,337 37,703 35,611 34,449
Profit for the year 30,183 27,098 25,055 22,605 21,670
Profit for the year attributable to the owners of the
Parent 26,861 25,043 23,964 21,803 20,672
Adjusted EBIT 50,121 47,049 45,200 42,407 40,592
Adjusted EBT 46,862 42,600 39,219 36,657 35,053
Adjusted Net Profit 32,910 28,637 26,081 23,313 22,079
(*) Consolidated EBITDA, EBIT, EBT and Profit for the year at 30 April 2014 are presented net of non-recurring costs of listing on the MTA market, equal to
Euro 746 thousand before tax effect.
Consolidated balance-sheet data at 30 April of each year
(in thousands of euros) 2018 2017 2016 2015 2014
Total Net Invested Capital 161,339 147,078 137,603 126,527 117,802
Total Equity 216,001 199,028 179,414 160,432 143,983
- attributable to the owners of the Parent 204,955 191,285 172,152 156,028 140,567
- attributable to the non-controlling interests 11,046 7,743 7,262 4,404 3,416
Net Financial Position (Net Liquidity) (54,662) (51,950) (41,811) (33,905) (26,181)
Total Equity and Net Financial Position 161,339 147,078 137,603 126,527 117,802
Consolidated profitability ratios at 30 April of each year
2018 2017 2016 2015 2014
EBITDA / Total Revenues and Other Income 4.63% 4.55% 4.39% 4.87% 5.28%
EBIT / Total Revenues and Other Income (ROS) 3.40% 3.52% 3.55% 3.90% 4.25%
Profit attributable to owners of the Parent/ Total
Revenues and Other Income 1.97% 1.97% 1.95% 2.06% 2.20%
Net Financial Position / EBITDA (1) (0.87) (0.90) (0.77) (0.66) (0.53)
(1) negative sign due to a positive Net Financial Position at 30 April of each year
Human Resources, amount at period-end (1)
(units or in thousands of euros) 2018 2017 2016 2015 2014
Number of employees at period-end 1,646 1,427 1,215 959 974
Average number of employees 1,537 1,321 1,150 1,025 935
Personnel costs 79,053 70,107 59,004 50,322 47,866
Average cost per unit 51.5 53.1 51.3 49.1 51.2
Percentage of resources with an open ended contract 97% 97% 97% 96% 95%
(1) Including fixed-term contracts, excluding internships

6
Main Financial Indicators
Financial indicators
Sesa Group 2018 2017 2016 2015 2014
(Euro)
Trading stock Market (1) MTA - Star MTA - Star MTA - Star MTA - Star MTA
Stock price (30 April of each year) 26.30 23.60 15.40 16.34 13.2
Dividend per share (2) (*) 0.60 0.56 0.48 0.45 0.45
Dividend paid (in millions of euros) (3) 9.297 8.677 7.513 7.043 6.984
Pay Out Ratio (4) 31% 32% 30% 31% 32%
Outstanding shares (in millions) 15.49 15.49 15.65 15.65 14.85
Market capitalisation (in millions of euros at 30 April
of each year) 407.5
365.7
241.0
255.7
196.0
Market to Book Value (**) 1.9 1.8 1.3 1.6 1.4
Dividend Yield (on Stock price at 30 April) (***) 2.3% 2.4% 3.1% 2.8% 3.4%
Sesa Group 2018 2017 2016 2015 2014
(Euro)
Earnings per share (basic) (****) 1.74 1.62 1.55 1.40 1.48
Earnings per share (diluted) (*****) 1.73 1.62 1.54 1.39 1.40
(1) Sesa entered into AIM following the merger with Made In Italy 1 SpA, a SPAC (special purpose acquisition company) established
under Italian law, listed on the AIM market. The merger between Sesa SpA and Made In Italy 1 SpA (SeSa SpA) was completed on 1
February 2013. Listing on MTA market realized in October 2013. Transition on STAR segment carried out in February 2015
(2) For the FY ended 30 April 2017 calculated according to the proposed resolution on dividends submitted to the Shareholders’ Meetings
of 24 and 27 August 2018
(3) Dividend gross of treasury shares
(4) Dividend gross of treasury shares/Consolidated Net Profit
(*) Dividend paid in the following year counting on the current year
(**) Market Capitalisation as of April 30 of every Fiscal Year/Consolidated Group equity
(***) Dividend per share/market value per share as of April 30 of every Fiscal Year
(****) Consolidated net profit/average number of ordinary shares net of treasury shares in portfolio
(*****)Consolidated net profit/average number of ordinary shares net of treasury shares in portfolio and inclusive of impact resulting
from Stock Options/Grants Plans, warrants and/or convertible bonds. At the time of writing there are no warrants nor any kind of
convertible bonds outstanding

7
Letter to the Shareholders
In the year ending 30 April 2018, the Sesa Group
recorded Revenues and Other Income for Euro 1.36
billion, with a percentage growth of 7.2%
compared to the previous year and a consolidated
net profit of Euro 30.1 million, up 11.4% compared
to the year ended 30 April 2017. Adjusted net profit
amounted to Euro 32.9 million, an increase of
15.0%.
These results confirm the Sesa Group's ability to
grow in a continuous and sustainable manner,
outperforming the reference market in a phase of
profound evolution. The year just ended marks the
definitive consolidation of the digital
transformation, with the affirmation of new needs
by companies and partners (digital solutions,
managed and security services, cloud computing,
collaboration, A.I., IoT) that represent new
development opportunities for our sector.
Today the Sesa Group is a reference operator in
Italy recognised in the IT solutions sector for the
business segment with a complete range, both in
terms of technology and integration services.
In this context, the Sesa Group continued to invest
in human resources with more than 150 hires
during the year, mainly young graduates from
Italian universities, with training and specialization
courses in order to strengthen the offer of
innovative solutions and services for customers.
With the new hires, the Group had more than 1,724
employees (including trainees) at the end of the
year, compared to 1,451 at 30 April 2017. We will
continue to invest in human capital, hired almost
entirely with permanent contracts (more than 97%
of the total at 30 April 2018), as this is the main
asset and driver of the Group's capacity for
sustainable development.
In the year ended 30 April 2018, both business
sectors of the Sesa Group (VAD and SSI)
outperformed the reference market, contributing
to the growth of consolidated revenues. The VAD
Sector, active in the IT value distribution market
and led by the full-owned subsidiary Computer
Gross Italia SpA, generated revenues and other
income of Euro 1.154 billion, an increase of 4.7%
compared to the previous year, thanks to the
development of sales of value added IT solutions,
favoured by investments in integration services and
solutions and the expansion of the portfolio of
brands offered to customers. The SSI Sector, active
in the Software & System Integration market for
end users in the SME and Enterprise segments,
through its fully-owned subsidiary Var Group SpA,
thanks to the strategy of focusing on value added
and development potential segments (ERP &
Industry Solution, Managed and Security Services,
Digital Services) recorded revenues and other
income of Euro 289 million, up 20.7% compared to
30 April 2017.
The results for the year confirm an increase in the
Group's profitability, both at operating level and in
terms of net profit after taxes. Gross operating
profit (EBITDA) amounted to Euro 63.1 million, up
9.0% compared to Euro 57.9 million at 30 April
2017. EBITDA went from 4.55% to 4.63% at 30 April
2018, showing a progressive acceleration trend
during the year. Consolidated net profit reached
Euro 30.2 million, an increase of 11.4% compared
to the result of Euro 27.1 million at 30 April 2017,
while the Group's share of net profit reached Euro
26.8 million, recording an increase of 7.3%. The
adjusted consolidated net profit at 30 April 2018
reached a total of Euro 32.9 million, an increase of
15% compared to 30 April 2017 (the Group
adjusted net profit after minority interests was Euro
29.6 million at 30 April 2018, compared to Euro 26.6
million at 30 April 2017).
Since the Group was founded, the business vision
and future sustainability have been the values at
the basis of each strategic action. The consolidated
Net Financial Position at 30 April 2018 is positive
(net liquidity) by Euro 54.7 million, with an
improvement of Euro 2.7 million compared to 30
April 2017, achieved thanks to the generation of
cash deriving from the operating profitability for
the year and the control of working capital, net of
significant investments for the period in the
acquisition of new companies, business branches
and technological infrastructures (approximately
Euro 30 million) and the distribution of dividends
to shareholders for Euro 8.7 million (dividend paid
in September 2017). These results confirm the
Group's ability to support current investment
requirements and growth with its operating cash
flow, remunerating its shareholders.

8
In the Value Added Distribution (VAD) Sector
the Sesa Group confirmed its leadership in the
Italian market by consolidating its market share and
integrating new vendors in its offer of value
solutions in the enterprise software, data centre
and cloud segments (with over 40 new vendors in
the year). The team of technical resources
dedicated to integration services in support of the
channel (Collaboration Value) was also
strengthened, with the acquisition of new areas of
specialisation. Thanks to this strategy, Computer
Gross Italia SpA has strengthened its leadership in
the Italian market for the distribution of value IT
solutions, recording an increase in revenues of
about 5% and a reversal in the profitability trend
with gross and net margins in the second half of
the year, up compared to the same period of the
previous year.
During the year, the majority of the share capital of
Icos SpA, a value distributor of enterprise software
and data center solutions on the Italian market,
with an annual turnover of approximately Euro 50
million, was acquired. The acquisition of 51% of
Icos SpA at the price of Euro 2.3 million took place
on 10 November 2017.
TheSoftware and System Integration (SSI)
Sector recorded an acceleration in revenue growth
and profitability, particularly in the more dynamic
areas of the infrastructure services and business
applications market. Var Group SpA consolidates
the evolution of its business model in order to
support the digital transformation of the Italian
medium-sized company, also thanks to the
virtuous path of investments in specialised
resources. The following are the main corporate
acquisition transactions.
In January 2018 Var Group SpA acquired 51% of
Tech-Value SpA, a leading company in the Italian
market for PLM and CAD solutions in the industry
4.0 sector for the "engineering intensive"
manufacturing sector. The operation was
completed through the purchase of 51% of Newco
Industria 4.0 Srl, owner of 100% of the shares of
Tech-Value SpA (with 78% acquired thanks to the
contribution of the founding shareholders and the
remaining 22% through a public purchase offer on
all the shares of Tech-Value on the AIM market).
The total price for the acquisition of 51% of Tech
Value was Euro 5.3 million, of which Euro 3.7 million
at the closing and Euro 1.6 million conditional to
the continuity of company management (in the
following 24 months), in addition to an earn-out of
up to Euro 1.2 million to achieve the growth targets
of the three-year consolidated average Ebitda
result for 2019-2021, applying a multiplier of 4.75x
Ebitda. Newco Industria 4.0 Srl was merged into
Tech-Value in April 2018 (it was included in the
Group's consolidation setting from January 2018).
In March 2018, Var Group SpA signed a binding
agreement with Infracom SpA for the purchase of
the ERP Panthera software business. The business
branch includes 50 specialised human resources,
the ownership of the ERP Panthera software and a
customer base of over 800 companies belonging to
the SME and Enterprise segments active in the main
Italian manufacturing districts. The business branch
develops annual revenues for about Euro 6.5
million and an expected Ebitda of Euro 850
thousand. The acquisition of the branch was
completed on 7 May 2018 through the company
Sirio informatica e sistemi SpA of Milan, a
subsidiary of Var Group SpA, for a price, paid in part
via cash upon the signing of the document drawn
up by the notary public and in part possible and
extended over 24 months, depending on the
performance of the commercial partnership
between Infracom and Var Group for the supply of
telecommunications services, determined on the
basis of an expected EV/EBITDA multiplier of the
business branch in line with those applied in recent
acquisitions of the Sesa Group.
The Group determinedly pursues the creation of
a sustainable future for the benefit of its
stakeholders and its human capital. During the
year, significant investments were dedicated to the
development of human capital in recruitment,
training, worklife balance and company welfare
activities.
The preparation of Sesa's first Sustainability Report
is an important opportunity to show how the Group
operates with its internal and external stakeholders,
reveal the medium/long-term strategic guidelines
adopted by management and, more generally, to
fully understand the drivers of sustainable growth
that inspire the management of the Group.
In addition to its positive financial performance, in
the year ended 30 April 2018, the Sesa Group
achieved extremely positive results in generating
value for all its stakeholders, pursuing a business
model based on sustainable growth and based
primarily on the daily commitment and
professionalism of its human resources, as well as

9
on the solidity of its value system. Actions
continued during the year to strengthen the
corporate culture and identity of the Group,
enhancing diversity, skills and the spirit of
integration and developing an evolved corporate
welfare system enhanced in terms of flexibility and
work-life balance initiatives.
We will continue to operate and invest in our
wealth of skills and professionalism with the
primary objective of further fuelling the path of
sustainable growth to the benefit of creating value
for all our stakeholders.
Paolo Castellacci, Chairman Alessandro Fabbroni, CEO
10
Company Headquarters and Group’s facilities
Sesa SpA’s legal and operational headquarters in Empoli (Florence), Via Piovola 138.
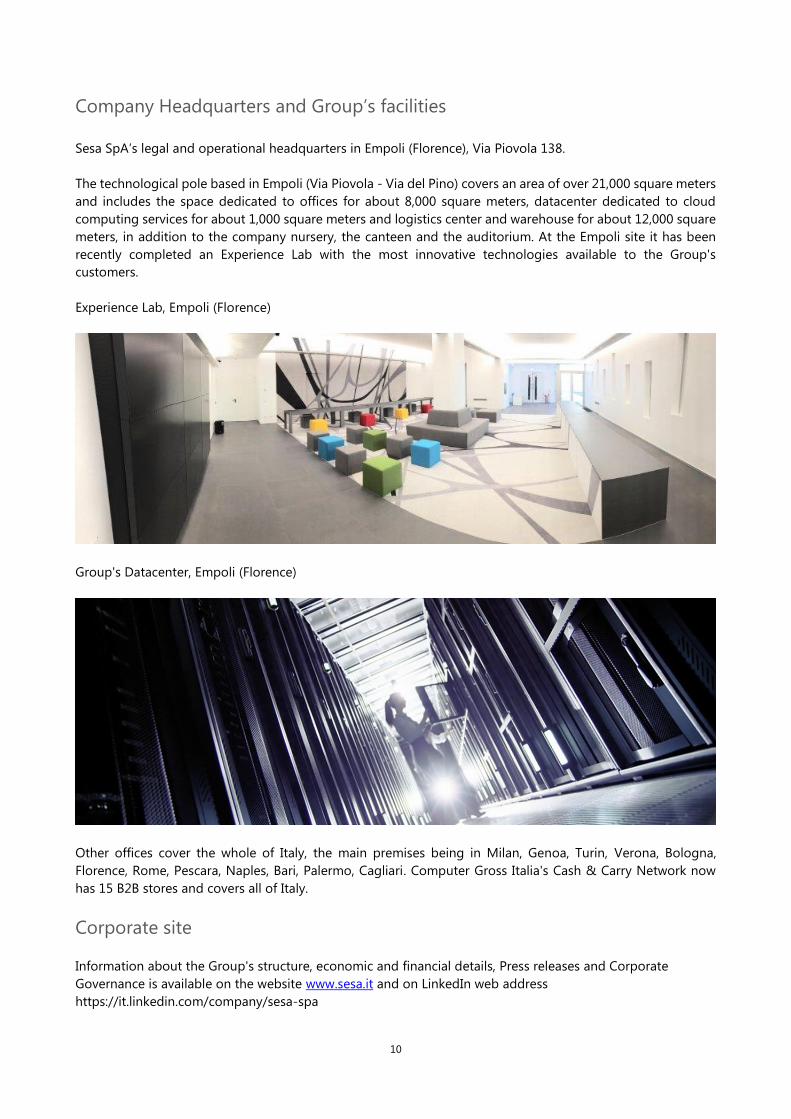
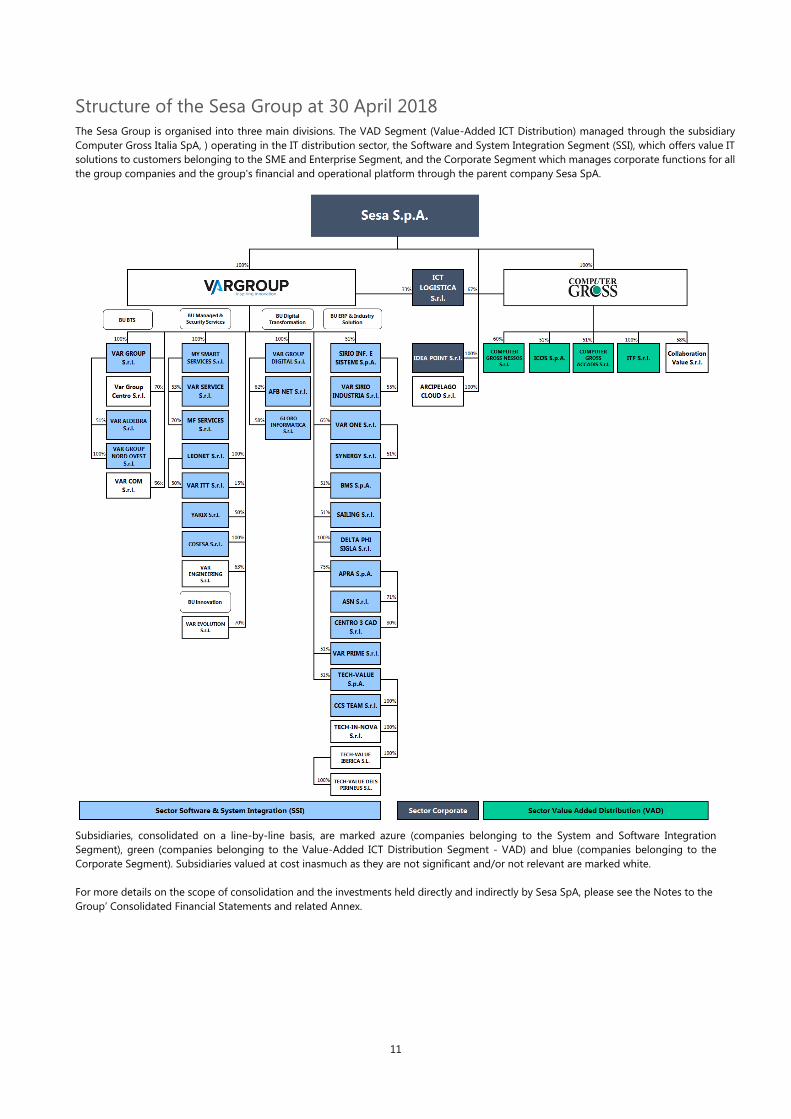
The technological pole based in Empoli (Via Piovola - Via del Pino) covers an area of over 21,000 square meters
and includes the space dedicated to offices for about 8,000 square meters, datacenter dedicated to cloud
computing services for about 1,000 square meters and logistics center and warehouse for about 12,000 square
meters, in addition to the company nursery, the canteen and the auditorium. At the Empoli site it has been
recently completed an Experience Lab with the most innovative technologies available to the Group's
customers.
Experience Lab, Empoli (Florence)
Group's Datacenter, Empoli (Florence)
Other offices cover the whole of Italy, the main premises being in Milan, Genoa, Turin, Verona, Bologna,
Florence, Rome, Pescara, Naples, Bari, Palermo, Cagliari. Computer Gross Italia's Cash & Carry Network now
has 15 B2B stores and covers all of Italy.
Corporate site
Information about the Group's structure, economic and financial details, Press releases and Corporate
Governance is available on the website www.sesa.it and on LinkedIn web address
https://it.linkedin.com/company/sesa-spa
11
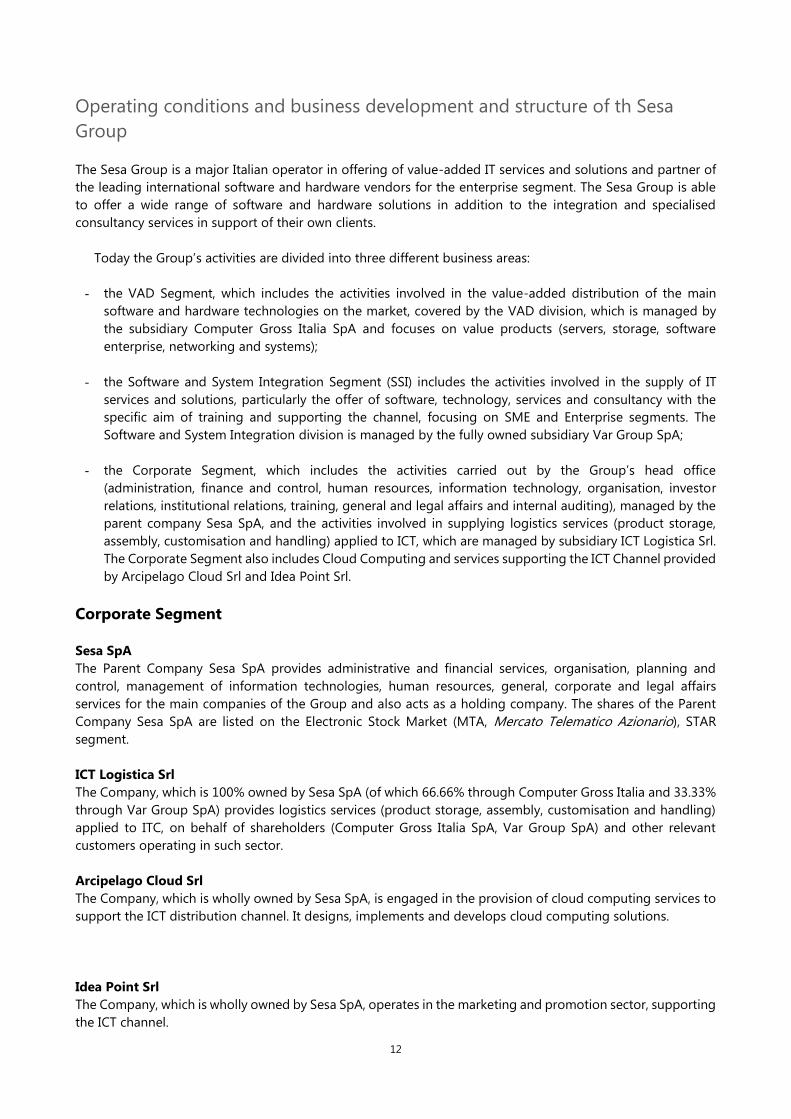
Structure of the Sesa Group at 30 April 2018
The Sesa Group is organised into three main divisions. The VAD Segment (Value-Added ICT Distribution) managed through the subsidiary
Computer Gross Italia SpA, ) operating in the IT distribution sector, the Software and System Integration Segment (SSI), which offers value IT
solutions to customers belonging to the SME and Enterprise Segment, and the Corporate Segment which manages corporate functions for all
the group companies and the group's financial and operational platform through the parent company Sesa SpA.
Subsidiaries, consolidated on a line-by-line basis, are marked azure (companies belonging to the System and Software Integration
Segment), green (companies belonging to the Value-Added ICT Distribution Segment - VAD) and blue (companies belonging to the
Corporate Segment). Subsidiaries valued at cost inasmuch as they are not significant and/or not relevant are marked white.
For more details on the scope of consolidation and the investments held directly and indirectly by Sesa SpA, please see the Notes to the
Group’ Consolidated Financial Statements and related Annex.
12
Operating conditions and business development and structure of th Sesa
Group
The Sesa Group is a major Italian operator in offering of value-added IT services and solutions and partner of
the leading international software and hardware vendors for the enterprise segment. The Sesa Group is able
to offer a wide range of software and hardware solutions in addition to the integration and specialised
consultancy services in support of their own clients.
Today the Group’s activities are divided into three different business areas:
- the VAD Segment, which includes the activities involved in the value-added distribution of the main
software and hardware technologies on the market, covered by the VAD division, which is managed by
the subsidiary Computer Gross Italia SpA and focuses on value products (servers, storage, software
enterprise, networking and systems);
- the Software and System Integration Segment (SSI) includes the activities involved in the supply of IT
services and solutions, particularly the offer of software, technology, services and consultancy with the
specific aim of training and supporting the channel, focusing on SME and Enterprise segments. The
Software and System Integration division is managed by the fully owned subsidiary Var Group SpA;
- the Corporate Segment, which includes the activities carried out by the Group’s head office
(administration, finance and control, human resources, information technology, organisation, investor
relations, institutional relations, training, general and legal affairs and internal auditing), managed by the
parent company Sesa SpA, and the activities involved in supplying logistics services (product storage,
assembly, customisation and handling) applied to ICT, which are managed by subsidiary ICT Logistica Srl.
The Corporate Segment also includes Cloud Computing and services supporting the ICT Channel provided
by Arcipelago Cloud Srl and Idea Point Srl.
Corporate Segment
Sesa SpA
The Parent Company Sesa SpA provides administrative and financial services, organisation, planning and
control, management of information technologies, human resources, general, corporate and legal affairs
services for the main companies of the Group and also acts as a holding company. The shares of the Parent
Company Sesa SpA are listed on the Electronic Stock Market (MTA, Mercato Telematico Azionario), STAR
segment.
ICT Logistica Srl
The Company, which is 100% owned by Sesa SpA (of which 66.66% through Computer Gross Italia and 33.33%
through Var Group SpA) provides logistics services (product storage, assembly, customisation and handling)
applied to ITC, on behalf of shareholders (Computer Gross Italia SpA, Var Group SpA) and other relevant
customers operating in such sector.
Arcipelago Cloud Srl
The Company, which is wholly owned by Sesa SpA, is engaged in the provision of cloud computing services to
support the ICT distribution channel. It designs, implements and develops cloud computing solutions.
Idea Point Srl
The Company, which is wholly owned by Sesa SpA, operates in the marketing and promotion sector, supporting
the ICT channel.
13
Software and System Integration Segment (SSI)
Business Unit Business Technology Solutions (“BTS”)
Var Group SpA
Var Group SpA, which is wholly owned by Sesa SpA, markets software and IT products and services to end
customers that mainly belong to the small and medium business segment and Enterprise. Var Group serves
the Italian ERP services and system integration market, through its sub-holdings specialized in specific solutions
and business lines, with a model based on 4 business units (Business Technology Solutions, ERP & Verticals,
Managed & Security Services and Digital Transformation) and 3 cross functions (Outsourcing, Financial
Solutions and Innovation).
Var Group Srl
The Company, which is wholly owned by Var Group SpA, markets hardware and software services and solutions
for the parent company Var Group SpA in central Italy.
Var Aldebra Srl
The Company, which is 51% owned by Var Group Srl, markets ICT products and solutions and provides system
integration services focused on the Emilia Romagna region.
Var Group Nord Ovest Srl
The Company, which is wholly owned by Var Group Srl, develops and markets hardware, software and
applications for the SME market in the North-West of Italy (through the branches of Milan, Turin and Genoa).
Business Unit Digital Transformation
Var Group Digital Srl
The Company, which is wholly owned by Var Group SpA, provides IT solutions for its business customers, with
particular reference to the digital area (web marketing, e-commerce and digital solutions) for the business and
finance segment.
Agenzia senza nome Srl
The Company, 71.25% owned by Apra SpA, offers digital agency services with specific skills in creating and
implementig web sites/e-commerce and digital marketing.
Globo Informatica Srl
The Company, which is 58% owned by Var Group SpA, is an IT Consulting company specialized in Digital
Transformation solutions enabled by Enterprise Content and Information Management platforms of Vendor’s
software OpenText, of which it is a key partner for the Documentum Family and point of reference in the Italian
market.
AFB Net Srl
The Company, 62% owned by Var Digital Srl, is active in the digital transformation sector with specific expertise
on omnichannel projects, digital marketing, social, BPM and IBM Asset Management Solutions.
Business Unit Managed & Security Services
Leonet Srl
The Company, which is wholly owned by Var Group SpA, operates in the telecommunications services sector,
cloud computing and systems assistance sectors, with a portfolio of services that meets the requirements of
business and professional customers.
14
My Smart Services Srl
The Company, which is wholly owned by Var Group SpA, provides management, maintenance, technical
assistance and repair services of computers and IT products on the Italian market.
Var Service Srl
The Company, which is 52.59% owned by My Smart Services Srl, provides services for the maintenance,
technical assistance and repair of computers and IT products.
MF Services Srl
The Company, which is 70% owned by My Smart Services Srl, provides services for the maintenance, technical
assistance and repair of computers and IT products, in central and northern Italy.
Yarix Srl
The Company, 50% owned by Var Group SpA, is active in the field of services and technology solutions for the
IT security of private companies and public administrations.
Yarix Srl opened a R&D center in Tel Aviv for the development of innovative security systems.
Cosesa Srl
The Company, which is 100% owned by Var Group SpA, provides Strategic Outsourcing services to the major
corporate customers.
Business Unit ERP & Industry solutions
Sirio Informatica e Sistemi SpA
The Company, which is 51% owned by Var Group SpA, develops and markets proprietary ERP software and
applications for small- and medium-sized businesses.
Var Sirio Industria Srl
The Company, which is 55% owned by Sirio Informatica e Sistemi SpA, operates in the technological innovation
sector (Industry 4.0), specialized in production, IoT and Energy.
Var One Srl
The Company, which is 65% owned by Var Group SpA, provides solutions and integrated services on the SAP
Business One platform. Thanks to its network of qualified partners and a widespread presence on the territory
it is one of the main SAP Business One expertise centres in Italy.
Synergy Srl
The Company, 51% owned by Var One SpA, operates in the solutions and integrated services sector on the
SAP Business One platform for SME market. Synergy Srl provides consulting, business solutions and services
to their customers concentrated in central of Italy. The Company entered the scope of consolidation on 1 May
2017.
BMS SpA
The Company, 51% owned by Var Group SpA, is a leading consulting firm, focused on SAP ERP services. BMS
SpA operates mainly in Northern Italy, with reference to Enterprise clients.
Apra SpA
The Company, which is 75% owned by Var Group SpA, is a System Integrator active in Central and Eastern Italy
that offers software solutions and specific ERP to many production sectors (Furniture, Wine, etc).
Centro 3Cad Srl
80% owned by Apra SpA, it develops 3cad products in the furniture industry area. It operates in partnership
with DAU and Intres, with which it forms the Consorzio 3cad for the development and support of the graphic
15
products suite of the “3cad evolution” configurator in Italy and in the world.
Sailing Srl
The Company, which is 51% owned by Var Group SpA, operates in the production and marketing of software
and IT services for the Retail sector, with large retailers as major customers.
Var Prime Srl
The Company, which is 51% owned by Var Group SpA, is a leader in Italy for the services on the Microsoft
Dynamics platform dedicated to the SME segment with value-added expertise through integrated solutions
and project management for major industrial sectors.
Tech-Value Srl
The Company, 51% owned by Var Group SpA, is specialized in IT services and PLM solutions towards
“engineering intensive” companies in manufacturing sector with over 1,000 customers and over 120 resources
in its branches in Milan, Turin, Genoa, Bologna, Roncade (TV), Fara Vicentina (VI), Viareggio (LU) and Barcelona
(Spain). Tech-Value SpA fully owns the companies CCSTeam Srl, Tech.In-Nova Srl, Tech-Value IBERICA SI and
through the latter Tech-Value dels Pirineus s.I.. Tech-Value Srl and CCSTeam Srl entered in the scope of
consolidation starting from January 2018.
Delta Phi Sigla Srl
The Company, which is wholly owned by Var Group SpA, develops and markets software and proprietary
applications for the Small Business market. Specifically, it owns the SIGLA++ software platform, which has a
user database of a few thousands of customers throughout Italy, mainly small businesses.

16
Value Added Distribution (VAD) Segment
Computer Gross Italia SpA
The Company, which is wholly owned by Sesa SpA, distributes value-added ICT products to dealers (software
houses, system integrators and dealers) with a portfolio of about 12,000 active customers in Italy, which in turn
are present and operate in the small and medium business, corporate and public administration markets.
Computer Gross Italia SpA is a leading Italian operator in the marketing of products and solutions provided by
the main international vendors, including Citrix, Cisco, Dell, EMC², HP, HPE, IBM, Lenovo, Lexmark, Microsoft,
Oracle, Symantec, Vmware.
The Company, with revenues equal to Euro 1,114 million and a net profit of Euro 20.3 million in the year ended
30 April 2018, is the main subsidiary of the Sesa Group. Computer Gross Italia SpA, with about 300 employees,
is organized in business units with sales and technical staff dedicated to market segments (software,
networking, POS) and/or distributed strategic brands.
ICOS SpA
Icos SpA, 51% owned by Computer Gross Italia SpA, is a value-added distributor of enterprise software and
data center solutions on the Italian market with branches in Ferrara, Milan and Rome, with an historical
partnership with the Vendor Oracle and furthermore distributor of NetApp, CommVault and Huawei solutions.
Icos SpA entered in the scope of consolidation starting from November 2017.
Computer Gross Nessos Srl
Computer Gross Nessos Srl, which is 60% owned by Computer Gross Italia SpA, employs the personnel
dedicated to the management of Networking products and solutions, a sector in which it is the Italian market
leader thanks to the completeness and added value range of the products offered. In particular, its brand
portfolio includes Cisco which is a leading vendor at global level in the networking market.
ITF Srl
The Company, which is wholly owned by Computer Gross Italia SpA, is the related Financial Services business
unit, which provides financial services and solutions in support of the customer business partners.
ITF controls Integration Customer Center Srl.
Computer Gross Accadis Srl
The Company, which is 51% owned by Computer Gross Italy SpA, markets Hitachi Data Systems solutions on
behalf of its parent Company Computer Gross Italy SpA.
17
Performance of operations
General economic trend
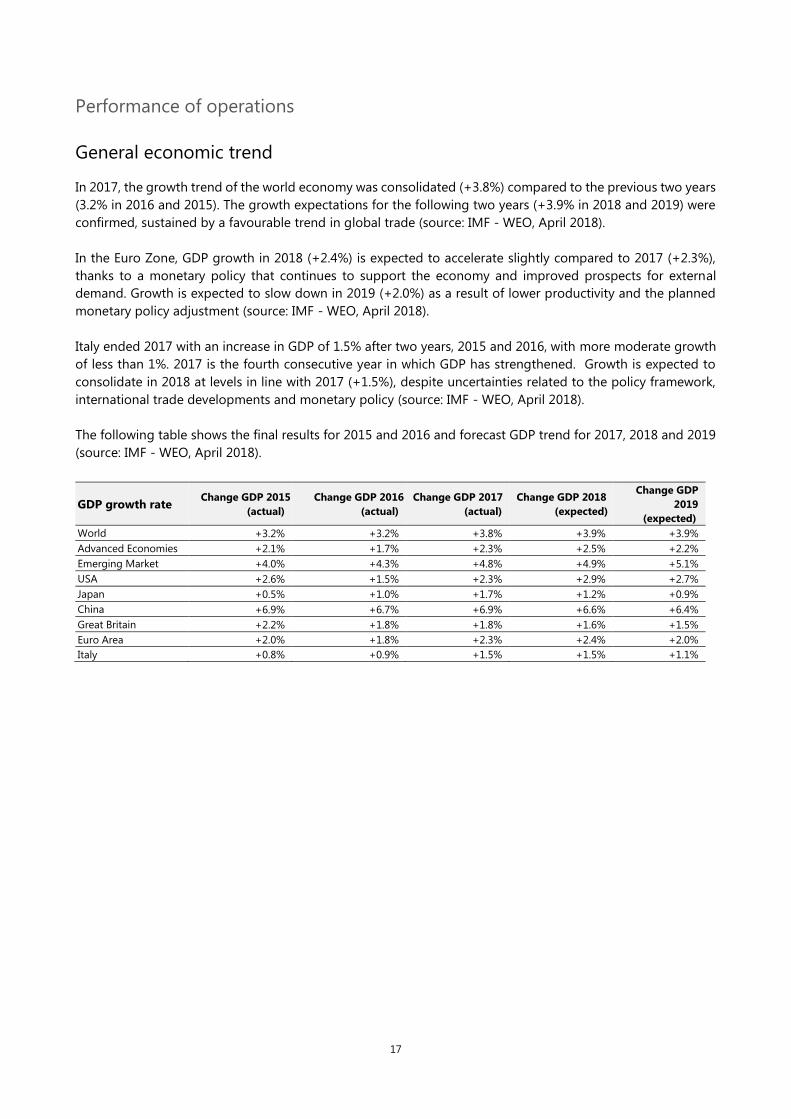
In 2017, the growth trend of the world economy was consolidated (+3.8%) compared to the previous two years
(3.2% in 2016 and 2015). The growth expectations for the following two years (+3.9% in 2018 and 2019) were
confirmed, sustained by a favourable trend in global trade (source: IMF - WEO, April 2018).
In the Euro Zone, GDP growth in 2018 (+2.4%) is expected to accelerate slightly compared to 2017 (+2.3%),
thanks to a monetary policy that continues to support the economy and improved prospects for external
demand. Growth is expected to slow down in 2019 (+2.0%) as a result of lower productivity and the planned
monetary policy adjustment (source: IMF - WEO, April 2018).
Italy ended 2017 with an increase in GDP of 1.5% after two years, 2015 and 2016, with more moderate growth
of less than 1%. 2017 is the fourth consecutive year in which GDP has strengthened. Growth is expected to
consolidate in 2018 at levels in line with 2017 (+1.5%), despite uncertainties related to the policy framework,
international trade developments and monetary policy (source: IMF - WEO, April 2018).
The following table shows the final results for 2015 and 2016 and forecast GDP trend for 2017, 2018 and 2019
(source: IMF - WEO, April 2018).
GDP growth rate Change GDP 2015
(actual)
Change GDP 2016
(actual)
Change GDP 2017
(actual)
Change GDP 2018
(expected)
Change GDP
2019
(expected)
World +3.2% +3.2% +3.8% +3.9% +3.9%
Advanced Economies +2.1% +1.7% +2.3% +2.5% +2.2%
Emerging Market +4.0% +4.3% +4.8% +4.9% +5.1%
USA +2.6% +1.5% +2.3% +2.9% +2.7%
Japan +0.5% +1.0% +1.7% +1.2% +0.9%
China +6.9% +6.7% +6.9% +6.6% +6.4%
Great Britain +2.2% +1.8% +1.8% +1.6% +1.5%
Euro Area +2.0% +1.8% +2.3% +2.4% +2.0%
Italy +0.8% +0.9% +1.5% +1.5% +1.1%

18
Development of demand and performance of the sector in which the Group
operates
The Information Technology market shows a trend of progressive development with more marked growth in
the areas of higher added value, services and cloud computing solutions.
Since 2014, the IT market in Italy has reversed its trend, showing growing growth rates with values well above
the Gross Domestic Product. In 2017 there was a strengthening of the growth of the IT market (+1.9%), which
began in 2016 (+1.6%) and is expected to continue in 2018. The progressive market development trend is
expected to accelerate further in 2018 and 2019 (+2.5% in 2018 and +3.5% in 2019) (source: Sirmi, June 2018).
The recovery of the IT market was mainly driven by the development of the Management Services segment
(+4.5% in 2016, +6.0% in 2017 and +7.4% in 2018), which was the most dynamic and included IT services for
infrastructures, security and cloud computing, the latter with growth rates of over 20% (source: Sirmi, June
2018).
The following table represents the IT market trend in Italy in 2014-2017 and the forecasts for 2018 and 2019
(Source: Sirmi, June 2018).
Italian IT Market
2014 2015 2016 2017 2018E 2019E Ch.
15/14
Ch.
16/15
Ch.
17/16
Ch.
18/17
Ch.
19/18 (in millions of euros)
Hardware 6,427 5,886 6,006 6,044 6,088 6,131 -8.4% 2.0% 0.6% 0.7% 0.7%
Software 3,881 3,857 3,848 3,833 3,825 3,820 -0.6% -0.2% -0.2% -0.2% -0.1%
Project Services 3,557 3,475 3,423 3,436 3,471 3,511 -2.3% -1.5% 0.4% 1.0% 1.2%
Management Services 4,751 4,970 5,193 5,504 5,910 6,353 4.6% 4.5% 6.0% 7.4% 7.5%
Total IT Market 18,616 18,188 18.470 18,817 19,294 19,815 -2.3% 1.6% 1.9% 2.5% 2.7%
O/w Cloud
Computing 954 1,128 1,510 1,862 2,282 2,784 28.7% 23.0% 23.3% 22.6% 22.0%
% Cloud on total IT 5.1% 6.8% 8.2% 9.9% 11.8% 14.1%
The IT distribution segment, where the Group operates through its main subsidiary Computer Gross Italia SpA
(VAD Sector) grew by approximately 2% in 2017, with expectations of a slight acceleration in 2018 with rates
between 2% and 3%, supported by the networking, enterprise software (analytics, security, etc.) segments.
Thanks to the development of the market areas connected with Technological Innovation (Digital
transformation of companies and organisations, Security services and infrastructure and application Cloud
services), the System Integrator segment recorded average growth in 2017 of 5%, with more marked
development prospects in 2018 in the areas of greatest value (mainly Application services, Infrastructure
services, Security, IOT). These market areas are covered by the Sesa Group with its SSI Sector, the reference
system integrator of the Italian market for the SME and Enterprise segments, with investments that continued
into the year just ended.

19
Foreword
The reclassified balance sheets, income statements and statements of cash flows of the Group and of the parent
company Sesa SpA, reported hereunder, have been prepared on the basis of the consolidated and separate
financial statements at 30 April 2018, drawn up in observance of the International Financial Reporting Standards
(“IFRS”) issued by the International Accounting Standards Board (“IASB”) as endorsed by the European Union,
as well as the provisions issued in implementation of art. 9 of Legislative Decree no. 38/2005. In accordance
with Recommendation CESR/05-178b on alternative performance measures, within the scope of the report on
operations, in addition to the financial measures envisaged by the IFRS, other measures deriving from the latter
are also illustrated, despite not being envisaged by the IFRS (Non-GAAP Measures). These measures are
presented in order to allow a better assessment of the Group’s operations and are not to be considered as an
alternative to those envisaged by the IFRS.
Main income statement data of the Sesa Group
The reclassified consolidated income statement at 30 April 2018 is shown below (data in thousands of euros),
compared with the reclassified consolidated income statement of the previous year at 30 April 2017.
Reclassified Income statement 30/04/2018 % 30/04/2017 % Change
2018/17 Revenues 1,350,900 1,260,275 7.2%
Other income 12,135 11,194 8.4%
Total Revenues and Other Income 1,363,035 100,0% 1,271,469 100.0% 7.2%
Purchase of goods 1,114,393 81.8% 1,055,182 83.0% 5.6%
Costs for services and leased assets 102,820 7.5% 85,106 6.7% 20.8%
Personnel costs 79,053 5.8% 70,107 5.5% 12.8%
Other operating charges 3,648 0.3% 3,189 0.3% 14.4%
Total Purchase of goods and Operating Costs 1,299,914 95.4% 1,213,584 95.4% 7.1%
EBITDA 63,121 4.63% 57,885 4.55% 9.0%
Depreciation and Amortisation of tangible and
intangible assets (software) 6,546 5,289 23.8%
Amortisation client lists and technological know-how 2,438 1,557 56.6%
Accruals to provision for bad debts and risks and
other non-monetary costs 7,847 6,253 25.5%
EBIT 46,290 3.40% 44,786 3.52% 3.4%
Profit from companies valued at equity 376 172 118.6%
Financial income and charges (3,635) (4,621) -21.3%
EBT 43,031 3.16% 40,337 3.17% 6.7%
Income taxes 12,848 13,239 -3.0%
Net Profit 30,183 2.21% 27,098 2.13% 11.4%
Net profit attributable to the Group 26,861 25,043 7.3%
Net profit attributable to non-controlling interests 3,322 2,055 61.7%
Adjusted EBIT * 50,121 3.68% 47,049 3.70% 6.5%
Adjusted EBT * 46,862 3.44% 42,600 3.35% 10.0%
Adjusted Net Profit * 32,910 2.41% 28,630 2.25% 15.0%
Adjusted Net Profit attributable to the Group* 29,588 26,575 11.3%
* Adjusted EBIT and Adjusted EBT are gross of non-monetary items related to the Stock Grant plans towards Executive Directors and powered by buy back
and gross of the amortization of intangible assets (client lists and technological know-how) recorded as a result of the Purchase Price Allocation (PPA) process.
Adjusted Net profit and Adjusted Net profit attributable to the Group are gross of non-monetary items related to the Stock Grant plans towards Executive
Directors and powered by buy back and gross of the amortization of intangible assets (client lists and technological know-how) recorded as a result of the
Purchase Price Allocation (PPA) process, both net of the related tax effects
20
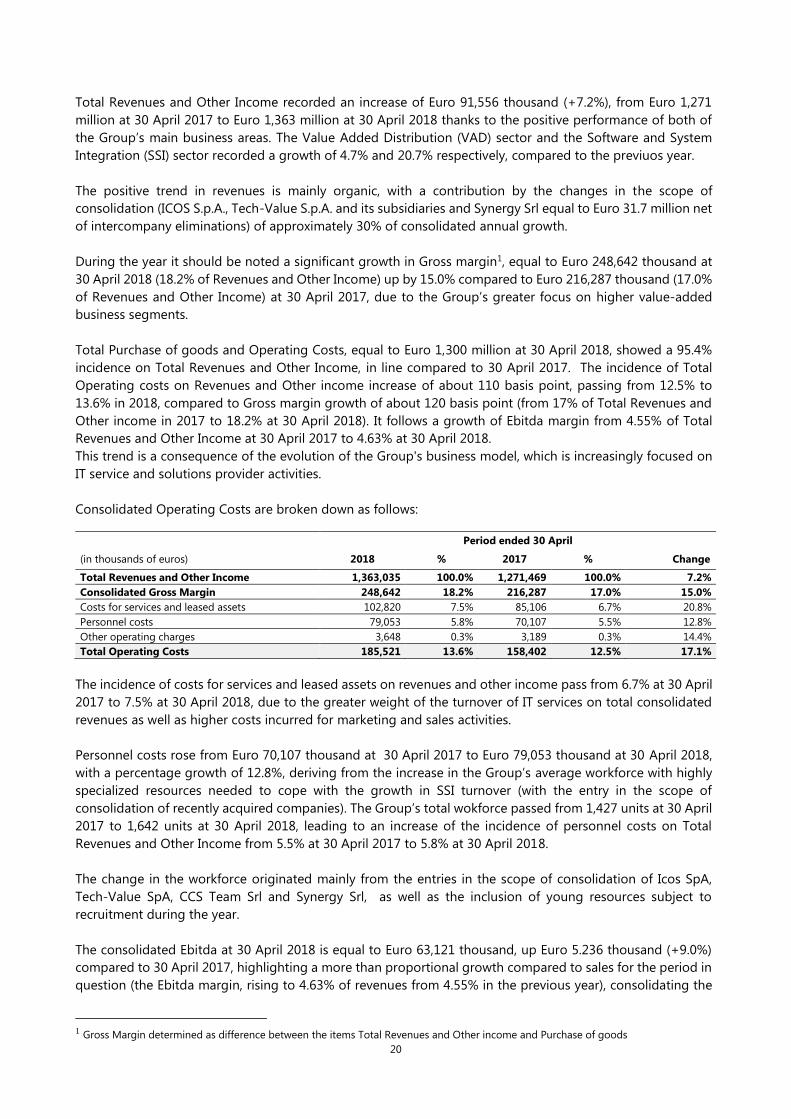
Total Revenues and Other Income recorded an increase of Euro 91,556 thousand (+7.2%), from Euro 1,271
million at 30 April 2017 to Euro 1,363 million at 30 April 2018 thanks to the positive performance of both of
the Group’s main business areas. The Value Added Distribution (VAD) sector and the Software and System
Integration (SSI) sector recorded a growth of 4.7% and 20.7% respectively, compared to the previuos year.
The positive trend in revenues is mainly organic, with a contribution by the changes in the scope of
consolidation (ICOS S.p.A., Tech-Value S.p.A. and its subsidiaries and Synergy Srl equal to Euro 31.7 million net
of intercompany eliminations) of approximately 30% of consolidated annual growth.
During the year it should be noted a significant growth in Gross margin1, equal to Euro 248,642 thousand at
30 April 2018 (18.2% of Revenues and Other Income) up by 15.0% compared to Euro 216,287 thousand (17.0%
of Revenues and Other Income) at 30 April 2017, due to the Group’s greater focus on higher value-added
business segments.
Total Purchase of goods and Operating Costs, equal to Euro 1,300 million at 30 April 2018, showed a 95.4%
incidence on Total Revenues and Other Income, in line compared to 30 April 2017. The incidence of Total
Operating costs on Revenues and Other income increase of about 110 basis point, passing from 12.5% to
13.6% in 2018, compared to Gross margin growth of about 120 basis point (from 17% of Total Revenues and
Other income in 2017 to 18.2% at 30 April 2018). It follows a growth of Ebitda margin from 4.55% of Total
Revenues and Other Income at 30 April 2017 to 4.63% at 30 April 2018.
This trend is a consequence of the evolution of the Group's business model, which is increasingly focused on
IT service and solutions provider activities.
Consolidated Operating Costs are broken down as follows:
Period ended 30 April
(in thousands of euros) 2018 % 2017 % Change
Total Revenues and Other Income 1,363,035 100.0% 1,271,469 100.0% 7.2%
Consolidated Gross Margin 248,642 18.2% 216,287 17.0% 15.0%
Costs for services and leased assets 102,820 7.5% 85,106 6.7% 20.8%
Personnel costs 79,053 5.8% 70,107 5.5% 12.8%
Other operating charges 3,648 0.3% 3,189 0.3% 14.4%
Total Operating Costs 185,521 13.6% 158,402 12.5% 17.1%
The incidence of costs for services and leased assets on revenues and other income pass from 6.7% at 30 April
2017 to 7.5% at 30 April 2018, due to the greater weight of the turnover of IT services on total consolidated
revenues as well as higher costs incurred for marketing and sales activities.
Personnel costs rose from Euro 70,107 thousand at 30 April 2017 to Euro 79,053 thousand at 30 April 2018,
with a percentage growth of 12.8%, deriving from the increase in the Group’s average workforce with highly
specialized resources needed to cope with the growth in SSI turnover (with the entry in the scope of
consolidation of recently acquired companies). The Group’s total wokforce passed from 1,427 units at 30 April
2017 to 1,642 units at 30 April 2018, leading to an increase of the incidence of personnel costs on Total
Revenues and Other Income from 5.5% at 30 April 2017 to 5.8% at 30 April 2018.
The change in the workforce originated mainly from the entries in the scope of consolidation of Icos SpA,
Tech-Value SpA, CCS Team Srl and Synergy Srl, as well as the inclusion of young resources subject to
recruitment during the year.
The consolidated Ebitda at 30 April 2018 is equal to Euro 63,121 thousand, up Euro 5.236 thousand (+9.0%)
compared to 30 April 2017, highlighting a more than proportional growth compared to sales for the period in
question (the Ebitda margin, rising to 4.63% of revenues from 4.55% in the previous year), consolidating the
1 Gross Margin determined as difference between the items Total Revenues and Other income and Purchase of goods

21
growth trend recorded, quarter by quarter, during the whole fiscal year. The increase of consolidated Ebitda
was reached thanks to the performance of SSI’s sector (+39.7%), which contributed to the consolidated
Ebitda’s result , passing from 25.5% at 30 April 2017 to 32.7% at 30 Aprile 2018.
The growth in Ebitda achieved during the year is essentially organic; the contribution of the companies
included in the scope of consolidation for the first time in the fiscal year to 30 April 2018 (ICOS SpA, Tech-
Value SpA and Synergy Srl) to the change in consolidated Ebitda is equal to about 10% (Euro 581 thousand).
The consolidated Ebit is equal to Euro 46,290 thousand (Ebit margin 3.40%), up by 3.4% compared to Euro
44,786 thousand (Ebit margin 3.52%) at 30 April 2017, after amortisation for a total amount of Euro 8,984
thousand (+31.2% YoY) and provisions and other non monetary items for Euro 7,847 thousand (+25.5% YoY).
The growth in Ebit reflects the above-mentioned increase in Ebitda net of the increase in amortisation and
depreciation following the Group’s investments in technology and software solutions supporting the growth
and the commercial offer, as well as the increase in the item amortisation client lists and technological know-
how related to the recent acquisitions. Provisions and other non-monetary costs equal to Euro 7,847 thousand
at 30 April 2018 reflect the hedging requirements of provisions for risks and bad debts together with the
figurative costs recognized in application of IFRS 2. Excluding amortisation of the items client lists and
technologiacal know-how and the figurative costs related to the stock grant plan, the Adjusted Ebit recorded
a 6.5% increase, from Euro 47,049 thousand at 30 April 2017 to Euro 50,121 thousands at 30 April 2018.
The consolidated Ebt at 30 April 2018 is equal to Euro 43,031 thousand (Ebt margin 3.16%) up by 6.7%
compared to Euro 40,337 thousand (Ebt margin 3.17%) at 30 April 2017, benefiting from a more efficient
financial management.
The net balance between financial income and charges increased from a negative amount of Euro 4,621
thousand at 30 April 2017 to a negative amount of Euro 3,635 thousand at 30 April 2018, thanks, among other
things, to the reduction in factoring charges and the result of foreign exchange management which showed
a net balance of Euro 559 thousand at 30 April 2018, with an improvement compared to a negative net balance
of Euro 12 thousand at 30 April 2017.
The consolidated Net profit after taxes recorded Euro 30,183 thousand at 30 April 2018, with an increase of
11.4% compared to Euro 27,098 thousand at 30 April 2017, benefiting, among other things, from the lower
IRES tax rate, passing from 27.5% at 30 April 2017 to 24% in the fiscal year ended on 30 April 2018. Excluding
amortisation of the items client lists and technologiacal know-how and the figurative costs related to the stock
grant plan, the consolidated Adjusted Net profit showed an even stronger positive trend (+15.0%), from Euro
28,630 thousand at 30 April 2017 to Euro 32,910 thousand at 30 April 2018.
The consolidated Net profit attributable to the Group at 30 April 2018 is equal to Euro 26,861 thousand,
showing a 7.3% growth compared to Euro 25,043 thousand at 30 April 2017 (the consolidated Adjusted Net
profit attributable to the Group up by 11.3% from Euro 26,575 thousand at 30 April 2017 to Euro 29,588
thousand at 30 April 2018).

22
Main balance sheet data of the Group
The reclassified consolidated balance sheet at 30 April 2018 is shown below (data in thousands of euros),
compared with the reclassified consolidated balance sheet of the previous year ended 30 April 2017.
Reclassified Balance Sheet 30/04/2018 30/04/2017 Change
2018/17 Intangible assets 39,083 21,848 17,235
Property, plant and equipment 55,221 49,736 5,485
Investments valued at equity 9,179 8,835 344
Other non-current receivables and deferred tax assets 17,264 13,998 3,266
Total non-current assets 120,747 94,417 26.330
Inventories 67,752 61,570 6,182
Current trade receivables 328,760 315,399 13,361
Other current assets 37,423 25,407 12,016
Current operating assets 433,935 402,376 31,559
Payables to suppliers 295,706 270,984 24,722
Other current payables 62,967 52,847 10,120
Short-term operating liabilities 358,673 323,831 34,842
Net working capital 75,262 78,545 (3,283)
Non-current provisions and other tax liabilities 14,175 8,457 5,718
Employee benefits 20,495 17,427 3,068
Non-current liabilities 34,670 25,884 8,786
Net Invested Capital 161,339 147,078 14,261
Total Equity 216,001 199,028 16,973
Medium-Term Net Financial Position 123,172 81,118 42,054
Short-Term Net Financial Position (177,834) (133,068) (44,766)
Total Net Financial Position (Net Liquidity) (54,662) (51,950) (2,712)
Equity and Net Financial Position 161,339 147,078 14,261
The balance sheet at 30 April 2018 showed a growth equal to 9.7% of Net Invested Capital, which rose from
Euro 147,078 thousand to Euro 161,339 thousand, essentially as a result of:
increase in Total non-current assets, equal to Euro 120,747 thousand at 30 April 2018 compared to Euro
94,417 thousand at 30 April 2017, generated by investments in company acquisitions and tangible assets;
improvement in Net working capital decreasing to Euro 75,262 thousand (NWC/Revenue 5.5%) at 30 April
2018 from Euro 78,545 thousand (NWC/Revenue equal to 6.2%) at 30 April 2017.
Regarding financing sources it should be noted:
a further improvement in Net Financial Position from a positive balance of Euro 51,950 (net liquidity) to a
positive balance of Euro 54,662 (net liquidity) at 30 April 2018 with an improvement of 5.2% thanks to self-
financing for the period;
the increase in the Group equity which reached a total of Euro 216,001 thousand at 30 April 2018 compared
to Euro 199,028 thousand at 30 April 2017 thanks to the profit for the period of Euro 30,183 thousand, net
of the payment of dividends by the parent company Sesa SpA for Euro 8.7 million.
Non-current assets at 30 April 2018 amounted to Euro 120,747 thousand with an increase of Euro 26,330
thousand compared to 30 April 2017, generated essentially by:
increase of intangible assets rising from Euro 21,848 thousand at 30 April 2017 to Euro 39,083 thousand at
30 April 2018, due mainly to the acquisition of controlling interests carried out in the year, such as Icos SpA
and Tech-Value SpA. The difference between the price to acquire control and the net book value of related
assets was allocated to the client list and technological know-how items, for a total amount of Euro 8.5
million (net of deferred taxes for Euro 3.5 million) for Tech-Value SpA and its subsidiaries and Euro 1.8
million for Icos SpA (net of deferred taxes for Euro 0.7 million);
increase of property, plant and equipment, rising from Euro 49,736 thousand at 30 April 2017 to Euro 55,221

23
thousand at 30 April 2018, mainly due to technological investments carried out by the Group in support of
the development of cloud computing services towards the customers.
Net working capital amounted to Euro 75,262 thousand at 30 April 2018 and despite an increase in turnover,
it showed a reduction of 6.2% compared to the amount of Euro 78,545 thousand for the fiscal year ended 30
April 2017, thanks to a more efficient working capital management. Inventories showed a 10.0% growth
compared to 30 April 2017, substantially in line with the increase in turnover, mainly recorded in the last months
of the fiscal year as a result of the expansion of the portfolio of distributed brands.
The Group's Net Financial Position at 30 April 2018 is positive (net liquidity) and equal to Euro 54,662 thousand
with an improvement of Euro 2,712 thousand compared to Euro 51,950 thousand at 30 April 2017. The positive
change in the Net Financial Position compared to the previous period is mainly attributable to the cash flow
generated by operating management and working capital management, net of investments in acquisitions of
new companies and technological infrastructures carried out in the period and the distribution of dividends to
shareholders. During the year, the efficiency of financial management carried on with the finding of medium-
term financing lines coverong the pro-tempore financial requirements arising during the year and supporting
future investments (the financial debt over 12 months is equal to 63% of the total loans at 30 April 2018
compared to 57% at 30 April 2017).
The Group's Net Financial Position (in thousands of euros) for the year ending 30 April 2018 is given below,
compared with the previous year, ending 30 April 2017.
Net financial position 30/04/2018 30/04/2017 Change
2018/17 Liquidity 247,194 191,951 55,243
Current financial receivables 3,344 1,995 1,349
Current financial debt 72,704 60,878 11,826
Short-term net financial position (177,834) (133,068) (44,766)
Non-current financial debt 123,172 81,118 42,054
Net financial position (54,662) (51,950) (2,712)
24
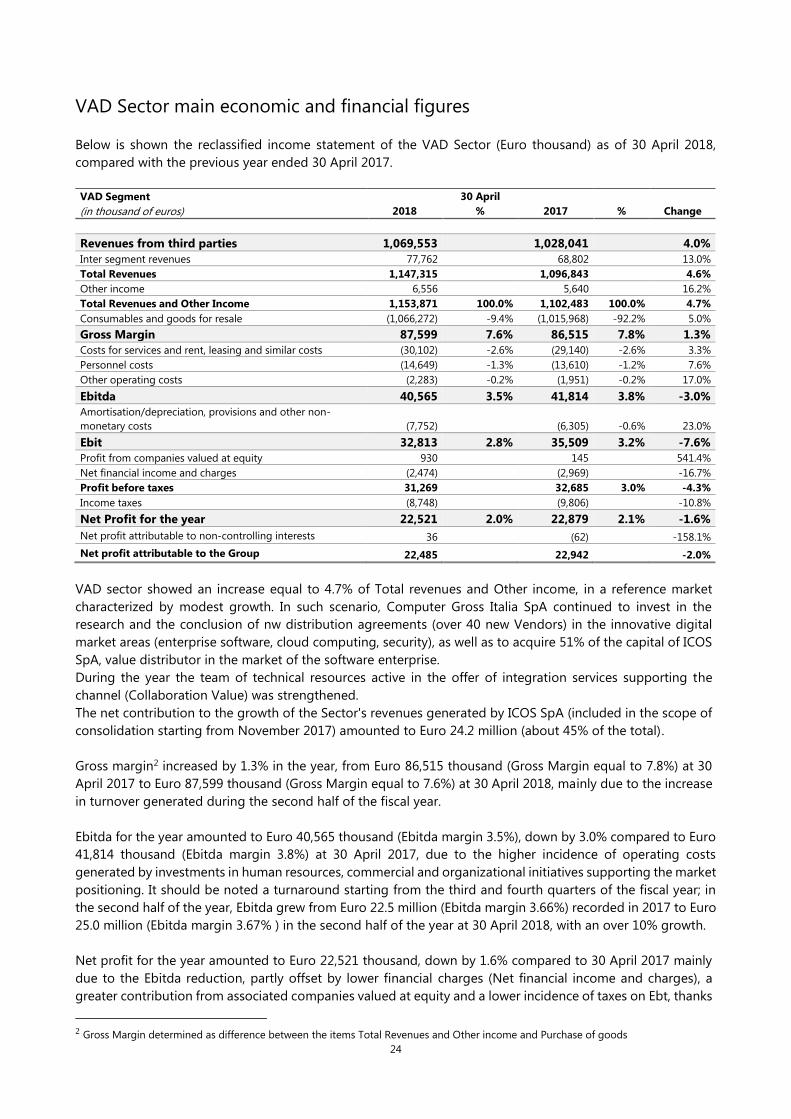
VAD Sector main economic and financial figures
Below is shown the reclassified income statement of the VAD Sector (Euro thousand) as of 30 April 2018,
compared with the previous year ended 30 April 2017.
VAD Segment 30 April
(in thousand of euros) 2018 % 2017 % Change
Revenues from third parties 1,069,553 1,028,041 4.0%
Inter segment revenues 77,762 68,802 13.0%
Total Revenues 1,147,315 1,096,843 4.6%
Other income 6,556 5,640 16.2%
Total Revenues and Other Income 1,153,871 100.0% 1,102,483 100.0% 4.7%
Consumables and goods for resale (1,066,272) -9.4% (1,015,968) -92.2% 5.0%
Gross Margin 87,599 7.6% 86,515 7.8% 1.3%
Costs for services and rent, leasing and similar costs (30,102) -2.6% (29,140) -2.6% 3.3%
Personnel costs (14,649) -1.3% (13,610) -1.2% 7.6%
Other operating costs (2,283) -0.2% (1,951) -0.2% 17.0%
Ebitda 40,565 3.5% 41,814 3.8% -3.0%
Amortisation/depreciation, provisions and other non-
monetary costs (7,752) (6,305) -0.6% 23.0%
Ebit 32,813 2.8% 35,509 3.2% -7.6%
Profit from companies valued at equity 930 145 541.4%
Net financial income and charges (2,474) (2,969) -16.7%
Profit before taxes 31,269 32,685 3.0% -4.3%
Income taxes (8,748) (9,806) -10.8%
Net Profit for the year 22,521 2.0% 22,879 2.1% -1.6%
Net profit attributable to non-controlling interests 36 (62) -158.1%
Net profit attributable to the Group 22,485 22,942 -2.0%
VAD sector showed an increase equal to 4.7% of Total revenues and Other income, in a reference market
characterized by modest growth. In such scenario, Computer Gross Italia SpA continued to invest in the
research and the conclusion of nw distribution agreements (over 40 new Vendors) in the innovative digital
market areas (enterprise software, cloud computing, security), as well as to acquire 51% of the capital of ICOS
SpA, value distributor in the market of the software enterprise.
During the year the team of technical resources active in the offer of integration services supporting the
channel (Collaboration Value) was strengthened.
The net contribution to the growth of the Sector's revenues generated by ICOS SpA (included in the scope of
consolidation starting from November 2017) amounted to Euro 24.2 million (about 45% of the total).
Gross margin2 increased by 1.3% in the year, from Euro 86,515 thousand (Gross Margin equal to 7.8%) at 30
April 2017 to Euro 87,599 thousand (Gross Margin equal to 7.6%) at 30 April 2018, mainly due to the increase
in turnover generated during the second half of the fiscal year.
Ebitda for the year amounted to Euro 40,565 thousand (Ebitda margin 3.5%), down by 3.0% compared to Euro
41,814 thousand (Ebitda margin 3.8%) at 30 April 2017, due to the higher incidence of operating costs
generated by investments in human resources, commercial and organizational initiatives supporting the market
positioning. It should be noted a turnaround starting from the third and fourth quarters of the fiscal year; in
the second half of the year, Ebitda grew from Euro 22.5 million (Ebitda margin 3.66%) recorded in 2017 to Euro
25.0 million (Ebitda margin 3.67% ) in the second half of the year at 30 April 2018, with an over 10% growth.
Net profit for the year amounted to Euro 22,521 thousand, down by 1.6% compared to 30 April 2017 mainly
due to the Ebitda reduction, partly offset by lower financial charges (Net financial income and charges), a
greater contribution from associated companies valued at equity and a lower incidence of taxes on Ebt, thanks
2 Gross Margin determined as difference between the items Total Revenues and Other income and Purchase of goods

25
to the change in the IRES rate (from 27.5% to 24%). At 30 April 2018, the Net profit incidence on Total Revenues
and Other Income is equal to 2.0%, substantially in line compared to 2.1% at 30 April 2017. Below is shown the reclassified balance sheet of the VAD Sector (Euro thousand) as of 30 April 2018, compared
with the previous year-end 30 April 2017.
Reclassified Balance Sheet 30/04/2018 30/04/2017 Change
Intangible assets 3,388 1,211 2,177
Property, plant and equipment 41,034 41,772 (738)
Investments valued at equity 5,923 4,749 1,174
Other non-current receivables and deferred tax assets 7,937 6,832 1,105
Total non-current assets 58,282 54,564 3,718
Inventories 57,380 51,738 5,642
Current trade receivables 269,031 266,331 2,700
Other current assets 15,044 7,385 7,659
Current operating assets 341,455 325,454 16,001
Payables to suppliers 257,030 245,002 12,028
Other current payables 14,586 9,534 5,052
Short-term operating liabilities 271,616 254,536 17,080
Net working capital 69,839 70,918 (1,079)
Non-current provisions and other tax liabilities 4,284 2,680 1,604
Employee benefits 1,828 1,479 349
Non-current liabilities 6,112 4,159 1,953
Net Invested Capital 122,009 121,323 686
Group Equity 172,123 160,530 11,593
Medium-Term Net Financial Position 77,401 59,717 17,684
Short-Term Net Financial Position (127,515) (98,924) (28,591)
Total Net Financial Position (Net Liquidity) (50,114) (39,207) (10,907)
Equity and Net Financial Position 122,009 121,323 686
The VAD Sector showed a further improvement in key financial indicators. The equity recorded a positive
change of Euro 11,593 thousand during the year, reaching a total amount of Euro 172,123 at 30 April 2018
thanks to profits net of dividends distributed. The Net Financial Position recorded a further improvement of
Euro 10,907 thousand in the year, passing from a positive balance (net liquidity) of Euro 39,207 thousand at 30
April 2017 to Euro 50,114 at 30 April 2018, net of the dividend distribution towards the parent company Sesa
SpA and investments in client list and technological know how (intangible assets) relating to the acquisition of
51% of Icos SpA.
26
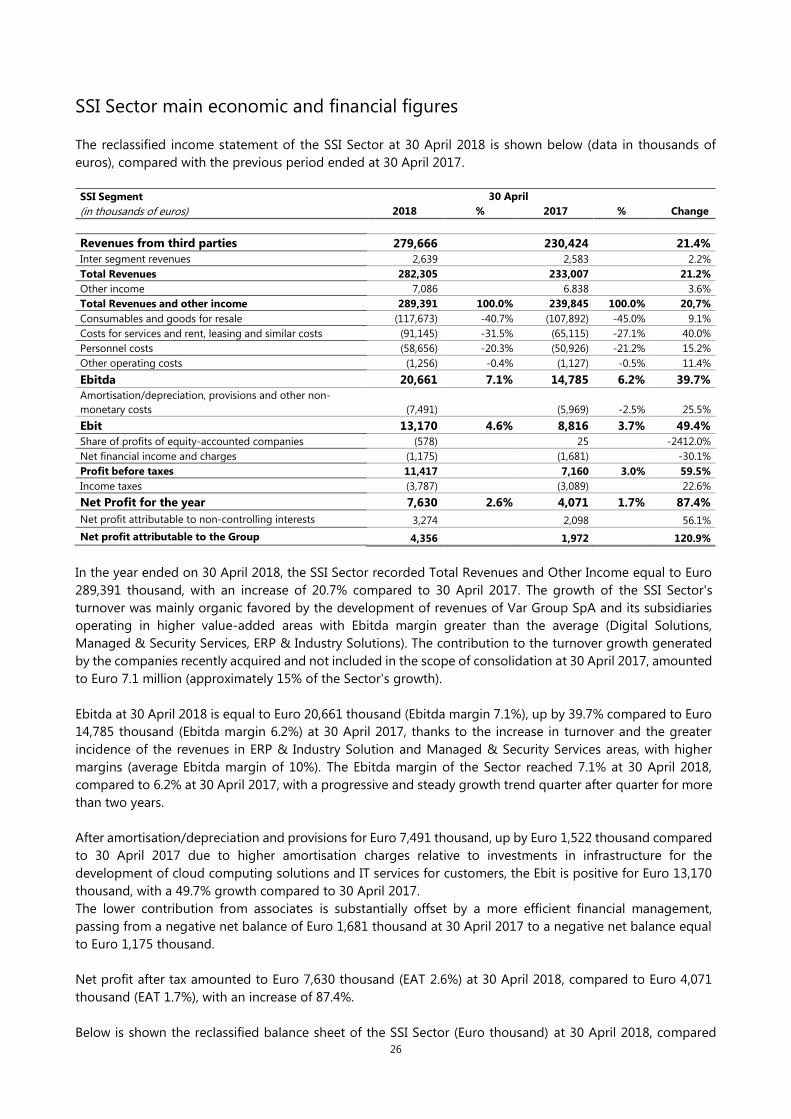
SSI Sector main economic and financial figures
The reclassified income statement of the SSI Sector at 30 April 2018 is shown below (data in thousands of
euros), compared with the previous period ended at 30 April 2017.
SSI Segment 30 April
(in thousands of euros) 2018 % 2017 % Change
Revenues from third parties 279,666 230,424 21.4%
Inter segment revenues 2,639 2,583 2.2%
Total Revenues 282,305 233,007 21.2%
Other income 7,086 6.838 3.6%
Total Revenues and other income 289,391 100.0% 239,845 100.0% 20,7%
Consumables and goods for resale (117,673) -40.7% (107,892) -45.0% 9.1%
Costs for services and rent, leasing and similar costs (91,145) -31.5% (65,115) -27.1% 40.0%
Personnel costs (58,656) -20.3% (50,926) -21.2% 15.2%
Other operating costs (1,256) -0.4% (1,127) -0.5% 11.4%
Ebitda 20,661 7.1% 14,785 6.2% 39.7%
Amortisation/depreciation, provisions and other non-
monetary costs (7,491) (5,969) -2.5% 25.5%
Ebit 13,170 4.6% 8,816 3.7% 49.4%
Share of profits of equity-accounted companies (578) 25 -2412.0%
Net financial income and charges (1,175) (1,681) -30.1%
Profit before taxes 11,417 7,160 3.0% 59.5%
Income taxes (3,787) (3,089) 22.6%
Net Profit for the year 7,630 2.6% 4,071 1.7% 87.4%
Net profit attributable to non-controlling interests 3,274 2,098 56.1%
Net profit attributable to the Group 4,356 1,972 120.9%
In the year ended on 30 April 2018, the SSI Sector recorded Total Revenues and Other Income equal to Euro
289,391 thousand, with an increase of 20.7% compared to 30 April 2017. The growth of the SSI Sector's
turnover was mainly organic favored by the development of revenues of Var Group SpA and its subsidiaries
operating in higher value-added areas with Ebitda margin greater than the average (Digital Solutions,
Managed & Security Services, ERP & Industry Solutions). The contribution to the turnover growth generated
by the companies recently acquired and not included in the scope of consolidation at 30 April 2017, amounted
to Euro 7.1 million (approximately 15% of the Sector's growth).
Ebitda at 30 April 2018 is equal to Euro 20,661 thousand (Ebitda margin 7.1%), up by 39.7% compared to Euro
14,785 thousand (Ebitda margin 6.2%) at 30 April 2017, thanks to the increase in turnover and the greater
incidence of the revenues in ERP & Industry Solution and Managed & Security Services areas, with higher
margins (average Ebitda margin of 10%). The Ebitda margin of the Sector reached 7.1% at 30 April 2018,
compared to 6.2% at 30 April 2017, with a progressive and steady growth trend quarter after quarter for more
than two years.
After amortisation/depreciation and provisions for Euro 7,491 thousand, up by Euro 1,522 thousand compared
to 30 April 2017 due to higher amortisation charges relative to investments in infrastructure for the
development of cloud computing solutions and IT services for customers, the Ebit is positive for Euro 13,170
thousand, with a 49.7% growth compared to 30 April 2017.
The lower contribution from associates is substantially offset by a more efficient financial management,
passing from a negative net balance of Euro 1,681 thousand at 30 April 2017 to a negative net balance equal
to Euro 1,175 thousand.
Net profit after tax amounted to Euro 7,630 thousand (EAT 2.6%) at 30 April 2018, compared to Euro 4,071
thousand (EAT 1.7%), with an increase of 87.4%.
Below is shown the reclassified balance sheet of the SSI Sector (Euro thousand) at 30 April 2018, compared

27
with the previous period ended at 30 April 2017.
Reclassified Balance Sheet 30/04/2018 30/04/2017 Change
Intangible assets 35,627 20,556 15,071
Property, plant and equipment 13,661 7,477 6,184
Investments valued at equity 2,602 3,296 (694)
Other non-current receivables and deferred tax assets 8,777 7,085 1,692
Total non-current assets 60,667 38,414 22,253
Inventories 10,497 9,977 520
Current trade receivables 93,228 80,799 12,429
Other current assets 22,695 17,738 4,957
Current operating assets 126,420 108,514 17,906
Payables to suppliers 82,610 70,408 12,202
Other current payables 45,949 38,490 7,459
Short-term operating liabilities 128,559 108,898 19,661
Net working capital (2,139) (384) (1,755)
Non-current provisions and other tax liabilities 10,113 5,989 4,124
Employee benefits 17,109 14,518 2,591
Non-current liabilities 27,222 20,507 6,715
Net Invested Capital 31,306 17,523 13,783
Equity 26,366 21,136 5,230
Medium-Term Net Financial Position 45,771 21,401 24,370
Short-Term Net Financial Position (40,831) (25,014) (15,817)
Total Net Financial Position (Net Liquidity) 4,940 (3,613) 8,553
Equity and Net Financial Position 31,306 17,523 13,783
From a financial point of view, the Sector recorded an increase in Net Invested Capital of Euro 13,783 thousand
mainly due to investments in non-current assets, which rose from Euro 38,414 thousand at 30 April 2017 to
Euro 60,667 thousand at 30 April 2018. The change in non-current assets reflects investments for business
development in the sectors with higher margins: intangible assets, up by Euro 15,071 thousand compared to
30 April 2017, and tangible assets, up by Euro 6,184 thousand compared to 30 April 2017, mainly reflect
investments in software and technologies supporting the development of cloud computing services and IT
solutions for customers, together with investments for the purchase of 51% of Tech-Value SpA which
contributed to the growth in the items technological know-how and client lists for Euro 8.6 million net of
deferred taxes for Euro 3.4 million.
Regarding financing sources, the growth in Net Invested Capital was covered thanks to company self-financing
(the equity increased by Euro 5,230 thousand in the year) and through the third-party financing, maintaining a
balance between the different maturities. As a result of the above, the Net Financial Position increased by Euro
8.6 million, from a positive balance of Euro 3.6 million at 30 April 2017 to a negative balance of Euro 4.9 million
at 30 April 2018.

28
Corporate Sector main economic and financial figures
Below is shown the reclassified income statement of the Corporate Sector (Euro thousand) as of 30 April 2018,
compared with the previous year ended 30 April 2017.
Corporate Segment 30 April
(in thousand of euros) 2018 % 2017 % Change
Revenues from third parties 1,681 1,810 -7.1%
Inter segment revenues 12,019 10,727 12.0%
Revenues 13,700 12,537 9.3%
Other income 2,501 2,575 -2.9%
Total Revenues and other income 16,201 100.0% 15,112 100.0% 7.2%
Consumables and goods for resale (396) -2.4% (629) -4.2% -37.0%
Costs for services and rent, leasing and similar costs (7,973) -49.2% (7,422) -49.1% 7.4%
Personnel costs (5,748) -35.5% (5,571) -36.9% 3.2%
Other operating costs (208) -1.3% (156) -1.0% 33.3%
Ebitda 1,876 11.6% 1,334 8.8% 40.6%
Amortisation, depreciation and other non-monetary costs (1,588) (825) -5.5% 92.5%
Ebit 288 1.8% 509 3.4% -43.4%
Profit from companies valued at equity 24 2 1100.0%
Net financial income and charges 14 29 -51.7%
Profit before taxes 326 540 3.6% -39.6%
Income taxes (308) (360) -14.4%
Net Profit for the year 18 0.1% 180 1.2% -90.0%
Net profit attributable to non-controlling interests - 18 -100.0%
Net profit attributable to the Group 18 162 -88.9%
Total Revenues and other income of the Sector, equal to Euro 16,201 thousand, showed an increase compared
to the previous year, thanks to the growth of professional services, financial and administrative management
and human resources and IT consulting provided by Sesa SpA towards Group’s companies. The composition
of turnover changed with a lower contribution of services, mainly logistics, to companies outside the Group.
The Ebitda was up by 40.6% compared to the previous year thanks to the lower incidence of operating costs
on sales.
Despreciation and amortisation, provisions and other non-monetary costs mainly included the amount related
to the stock grant plan, increased compared to the previous year as a result of the increase in the stock price
of the Sesa SpA shares.
After financial management, equity investments and taxes, the net profit for the year is equal to Euro 18
thousand at 30 April 2018, compared to Euro 180 thousand at 30 April 2017.
From a financial point of view, there is an improvement in the main indicators compared to the previous year.
Reclassified Balance Sheet 30/04/2018 30/04/2017 Change
Intangible assets 68 81 (13)
Property, plant and equipment 816 777 39
Investments valued at equity 901 1,037 (136)
Other non-current receivables and deferred tax assets 68,661 67,538 1,123
Total non-current assets 70,446 69,433 1,013
Inventories
Current trade receivables 5,538 7,940 (2,402)
Other current assets 1,117 2,958 (1,841)
Current operating assets 6,655 10,898 (4,243)
Payables to suppliers 3,104 4,494 (1,390)
Other current payables 2,521 4,885 (2,364)

29
Short-term operating liabilities 5,625 9,379 (3,754)
Net working capital 1,030 1,519 (489)
Non-current provisions and other tax liabilities 17 27 (10)
Employee benefits 1,558 1,430 128
Non-current liabilities 1,575 1,457 118
Net Invested Capital 69,901 69,495 406
Group Equity 85,889 85,125 764
Medium-Term Net Financial Position
Short-Term Net Financial Position (15,988) (15,630) (358)
Total Net Financial Position (Net Liquidity) (15,988) (15,630) (358)
Equity and Net Financial Position 69,901 69,495 406

30
Parent Company Sesa SpA main economic and financial figures
Below is shown the reclassified income statement (Euro thousand) as of 30 April 2018, compared with the
previous year ended 30 April 2017.
Reclassified income statement 30/04/2018 % 30/04/2017 % Change
2018/17
Revenues 6,784 5,483 23.7%
Other income 1,143 1,585 -27.9%
Total Revenues and Other Income 7,927 100.0% 7,068 100.0% 12.2%
Goods for resale 48 0.6% 43 0.6% 11.6%
Costs for services and leased assets 2,131 26.9% 1,921 27.2% 10.9%
Personnel costs 4,119 52.0% 3,972 56.2% 3.7%
Other operating charges 84 1.1% 70 1.0% 20.0%
Total operating costs 6,382 80.5% 6,006 85.0% 6.3%
EBITDA 1,545 19.5% 1,062 15.0% 45.5%
Amortisation and depreciation 104 42 147.6%
Accruals to provisions for bad debts and risks and
other non-monetary costs 1,393 713 95.4%
EBIT 48 0.6% 307 4.3% -84.4%
Financial income and charges 9,383 8,790 6.7%
EBT 9,431 119.0% 9,097 128.7% 3.7%
Income taxes 224 290 -22.8%
Net profit 9,207 116.1% 8,807 124.6% 4.5%
Total revenues and Other Income are equal to Euro 7,927 thousand at 30 April 2018, an increase of Euro 859
thousand (+12.2%) compared to previous fiscal year, thanks to an increase of the activities in the core area of
administrative and financial management, organization, planning and control, management of information
systems, human resources, general, corporate and legal affairs of the main group companies. The shares of
Parent Company Sesa SpA are listed on the MTA market, STAR segmet.
At 30 April 2018 the Total operating costs were equal to Euro 6,382 thousand, up by Euro 376 thousand
compared to Euro 6,006 thousand at 30 April 2017, thanks to the increase of the business volume. The most
relevant changes refer to higher costs for services, mainly relating to the supply of specialist services to
customers and to the personnel costs resulting in the consolidation of the workforce necessary to tackle the
increase in the scope of services provided.
Ebitda amounted to Euro 1,545 thousand at 30 April 2018, up by Euro 483 thousand compared to Euro 1,062
thousand at 30 April 2017, due to the increase in operating effincency generated by incremental revenues.
Ebitda margin rose from 15.0% at 30 April 2017 to Euro 19.5% at 30 April 2018.
Accruals to provision for bad debts and risks and other non-monetary costs reflected the higher cost of the
three-year Stock Grant plan resolved by shareholders’ meeting on 25 August 2017.
Cash flow operations and the management of investments grew from Euro 8,790 thousand at 30 April 2017 to
Euro 9,383 thousand at 30 April 2018, thanks to the higher dividends resolved by subsidiaries compared to the
previous year.
Net profit after taxes amounted to Euro 9,207 thousand at 30 April 2018, with an increase of Euro 400 thousand
compared to Euro 8,807 thousand as of 30 April 2017.

31
Below is shown the reclassified balance sheet (Euro thousand) as of 30 April 2018, compared with the previous
year ended 30 April 2017.
Reclassified balance sheet 30/04/2018 30/04/2017 Change
2018/17
Intangible assets 59 70 (11)
Property, plant and equipment 352 322 30
Equity Investments and Other non-current receivables 69,839 68,761 1,078
Total non-current assets 70,250 69,153 1,097
Inventories
Current trade receivables 859 675 184
Other current assets 1,562 5,547 (3,985)
Current operating assets 2,421 6,222 (3,801)
Payables to suppliers 431 409 22
Other current payables 2,550 6,365 (3,815)
Short-term operating liabilities 2,981 6,774 (3,793)
Net working capital (560) (552) (8)
Non-current provisions and other tax liabilities
Employee benefits 1,268 1,146 122
Non-current liabilities 1,268 1,146 122
Net Invested Capital 68,422 67,455 967
Group Equity 82,978 82,239 739
Medium-Term Net Financial Position
Short-Term Net Financial Position (14,556) (14,784) 228
Total Net Financial Position (Net Liquidity) (14,556) (14,784) 228
Equity and Net Financial Position 68,422 67,455 967
At 30 April 2018 the balance sheet of the Parent company Sesa SpA showed a slight growth (+1.4%) of the Net
invested capital, passing from Euro 67,455 thousand to Euro 68,422 thousand, thanks to the increase in non-
current assets, resulting from the acquisition of 1.93% of the capital of the Cabel Holding SpA by Sesa SpA
(additional 1.93% by Var Group SpA) for a total of Euro 1,007 thousand, with which it signed of a commercial
and operative partnership.
Despite the changes in the turnover, there are not significant changes in the net workins capital thanks to an
efficient management.
About source of finance, the net financial position is positive by Euro 14,556 thousand at 30 April 2018 down
by Euro 228 thousand compared to Euro 14,784 thousand at 30 April 2017, due to the day-to-day running and
equity investments portfolio. At 30 April 2018 Equity amounted to Euro 82,978 thousand, up by Euro 739
thousand compared to Euro 82,239 thousand at 30 April 2017. The positive change is mainly due to the Net
profit of the current year equal to Euro 9,207 thousand, net of dividends paid in September 2017, equal to Euro
8,666 thousand, as well as to the purchase of treasury shares for Euro 1,190 thousand and to the accounting
for the Stock Grant for the period.
Net financial position 30/04/2018 30/04/2017 Change
2018/17 Liquidity 8,056 8,284 (228)
Current financial receivables 6,500 6,500 0
Current financial debt - -
Short-term net financial position (14,556) (14,784) 228
Non-current financial debt - -
Net financial position (14,556) (14,784) 228

32
Corporate Governance
The Corporate Governance system adopted by Sesa SpA complies with the indications contained in the Code
of Corporate Governance of Italian listed companies, published by Borsa Italiana SpA with integrations of the
specific characteristics of the Group. In particular, numerous meetings of the Audit and Risks and Related
Parties Committee, the Remuneration Committee and the Strategic Committee were held during the year. The
first two of these Committees are made up entirely of non-executive members of the Board of Directors with
a majority of independent directors.
In addition, pursuant to Law 231 of 2001, the Company has a Supervisory Body and an Internal Audit office,
which also operated with reference to the main subsidiaries Computer Gross Italia SpA and Var Group SpA.
The Board of Directors held on 12 July 2018, on the proposal of the Remuneration Committee, defined the
Remuneration Policy, in compliance with the recommendations of the Corporate Governance Code and with
the regulatory provisions issued by Consob.
The Board of Directors held on 12 July 2018 also approved the Report on Corporate Governance, which
contains a general description of the corporate governance system adopted by the Group and contains
information on the ownership structure and compliance with the Corporate Governance Code, including the
main governance procedures applied and the characteristics of the internal control and risk management
system also in relation to the financial reporting process. The above-mentioned Report is available on the
website www.sesa, it, Corporate Governance section. The Corporate Governance Code can be consulted on the
Borsa Italiana SpA website www.borsaitaliana.it.
At the meeting held on 12 July 2018, the Board of Directors approved the update of the Procedure for
Transactions with Related Parties as no longer applicable to Sesa SpA the facilitations for the recently listed
companies on the approval of the transactions of greater relevance.
It should be noted also that the Board of Directors held on 12 July 2018 approved the Audit Report at 30 April
2018 prepared by the Internal Audit function and previously approved by the Control and Risk Committee,
verified the adequacy of the administrative and accounting organizational structure of the Company and its
strategic subsidiaries, and examined and expressed a favorable opinion on the Report of the Financial Manager
regarding the adequacy and effectiveness of the administrative and accounting procedures.
Finally, the Board of Directors examined and approved the annual report prepared by the Supervisory Body.
Treasury shares
At 30 April 2018, the parent company Sesa SpA held 38,712 shares, equal to 0.2498% of the share capital,
purchased at an average price of Euro 25.59 in accordance with the purchase plan of Treasury shares resolved
by the shareholders’ meeting on 25 August 2017. In application of the international accounting standards,
these instruments are deducted from the company shareholders’ equity.
Research and development activity
Pursuant to article 2428, paragraph 2 no. 1, it is acknowledged that some Group companies, in particular Sirio
Informatica e Sistemi SpA, Var Digital Srl, Delta Phi Srl, Apra SpA, Sailing Srl, Leonet Srl, Var Aldebra Srl and
BMS SpA, carried out research and development activities.

33
Relations with subsidiaries, associates, controlling companies and related
concerns
With regard to the information concerning relations with related parties pursuant to articles 2427 and 2428 of
the Civil Code and in compliance with the provisions of IAS 24, it should be noted that the transactions carried
out with these entities, which pertain to ordinary management, have been concluded at market conditions and
with mutual economic convenience.
The management of relations with Related Parties is subject to a specific regulation approved by the Risk
Committee and Related Parties Committee in application of the Corporate Governance Code for listed
companies.
The identification of the Group’s related parties was carried out in accordance with IAS 24. For further details
on the relationships with related parties, please refer to the specific section reported in the explanatory notes
to the Group’s consolidated financial statements.
These relationships, which do not include atypical and / or unusual transactions, are regulated at normal market
conditions.
Social responsibility of the Sesa Group (declaration of non-financial data) Corporate Social Responsibility is a founding element of the Sesa Group's corporate culture.
Since its foundation, the Group has actively contributed to the creation of a fair and loyal working environment,
attentive to the needs of its human resources and all its stakeholders. In particular, during the year, a number
of important initiatives aimed at structuring the actions of the Sesa Group in terms of social responsibility and
corporate welfare in a more organic and systematic manner were implemented.
A detailed description of the corporate social responsibility actions carried out by the Sesa Group is provided
in the consolidated non-financial declaration which constitutes a separate report and which is approved by
Sesa's Board of Directors at the same time as this Annual Report. The declaration of non-financial data has
been prepared in compliance with the provisions of Article 5, paragraph 3, letter b. of Legislative Decree
254/2016, according to the "GRI Standards" reporting framework and is available on the Group's website
www.sesa.it.
Evolution of human capital Human capital is the main asset of the Sesa Group: skills, professionalism, specialisation and integrity are the
distinctive values to face the competitive challenges of the market.
The Sesa Group invests in its human resources through programmes of selection, management and
enhancement, training and corporate welfare.
During the year, investments in human resources continued, with more than 150 hires, mainly of young
graduates from Italian universities, brought into the company with training plans in the areas of the greatest
growth and development potential in Information Technology (cloud computing, security, digital services, IT
consulting), professional traineeships and apprenticeships (54 trainees and 116 apprentices at 30 April 2018),
confirmed for an indefinite period at the end of the training period with percentages close to 100%.
The average age of the Group's resources is about 40 and the composition of the workforce shows a qualified
component of more than 30% of the total and this percentage is gradually increasing.
The Group's selection process aims to identify the best resources available through agreements with the main

34
universities in Italy, participation in career days and the use of primary job sites, in compliance with the
principles of transparency and impartiality. To this end, special internal company procedures have been
developed for the selection, placement and professional development of personnel.
Continuous training and refresher courses are in place, involving a significant percentage of employees in the
current year, covering technical areas (also through dedicated seminars and events), as well as legislative and
motivational aspects. Around 10,000 hours of training were provided during the year, including professional,
technical and regulatory training.
In order to achieve management objectives, individual incentive plans are assigned, involving the majority of
commercial resources and all key Group figures, linked to the achievement of qualitative/quantitative
performance defined at the beginning of each year in line with the Group's strategy. Targeted career paths and
professional development plans are also defined for the growth and enhancement of key figures, particularly
those that are younger, and human capital in general.
Lastly, during the year, the Group's welfare system was further strengthened by introducing flexible plans,
customisable through a dedicated corporate portal with the option of selecting benefits and services from a
digital menu. This initiative complements and reinforces the corporate welfare system that has been in
operation for over five years within the Group, which, for 2018, includes benefits and work-life balance services
for workers to support income, education and the wellbeing of human resources (scholarships, grants to stay
in health-related spa centres and travel abroad to study in summer, contributions to crèches, flexible benefits
and work-life balance services).
The historical evolution of the Group's human resources shows continuous growth, supporting the
development of the Group's revenues and business.
At 30 April 2018, the Group workforce had reached a total of 1,642 units, showing a growth trend of around
200 resources, of which 120 units following consolidated of ICOS SpA, Tech-Value SpA e Synergy Srl, and about
80 units following targeted recruitment plans, in partnership with some of the main Italian Universities, for the
development of higher value businees areas.
818 863 912 974 959
1,215
1,427
1,642
2011 2012 2013 2014 2015 2016 2017 2018
Historical evolution of the Group workforce(actual number at 30 April of each year)
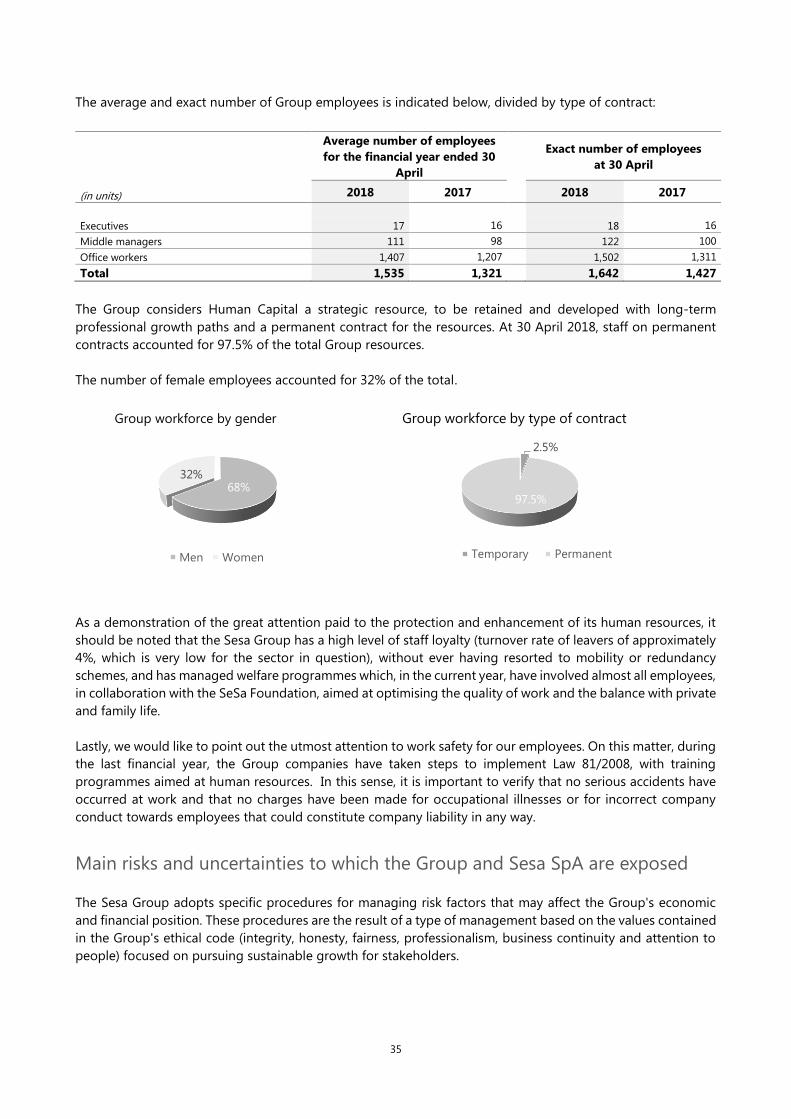
35
The average and exact number of Group employees is indicated below, divided by type of contract:
Average number of employees
for the financial year ended 30
April
Exact number of employees
at 30 April
(in units) 2018 2017 2018 2017
Executives 17 16 18 16
Middle managers 111 98 122 100
Office workers 1,407 1,207 1,502 1,311
Total 1,535 1,321 1,642 1,427
The Group considers Human Capital a strategic resource, to be retained and developed with long-term
professional growth paths and a permanent contract for the resources. At 30 April 2018, staff on permanent
contracts accounted for 97.5% of the total Group resources.
The number of female employees accounted for 32% of the total.
As a demonstration of the great attention paid to the protection and enhancement of its human resources, it
should be noted that the Sesa Group has a high level of staff loyalty (turnover rate of leavers of approximately
4%, which is very low for the sector in question), without ever having resorted to mobility or redundancy
schemes, and has managed welfare programmes which, in the current year, have involved almost all employees,
in collaboration with the SeSa Foundation, aimed at optimising the quality of work and the balance with private
and family life.
Lastly, we would like to point out the utmost attention to work safety for our employees. On this matter, during
the last financial year, the Group companies have taken steps to implement Law 81/2008, with training
programmes aimed at human resources. In this sense, it is important to verify that no serious accidents have
occurred at work and that no charges have been made for occupational illnesses or for incorrect company
conduct towards employees that could constitute company liability in any way.
Main risks and uncertainties to which the Group and Sesa SpA are exposed
The Sesa Group adopts specific procedures for managing risk factors that may affect the Group's economic
and financial position. These procedures are the result of a type of management based on the values contained
in the Group's ethical code (integrity, honesty, fairness, professionalism, business continuity and attention to
people) focused on pursuing sustainable growth for stakeholders.
68%32%
Group workforce by gender
Men Women
2.5%
97.5%
Group workforce by type of contract
Temporary Permanent
36
External Risks
Risks linked to the macroeconomic context and the ICT market
With reference to management risks, they can be traced back to the possible unfavourable situation in the
external environment, characterised by general conditions of the economy and the ICT sector which highlight
a correlated performance and a weak growth trend in demand. The ICT market is linked to the performance
of the economy of industrialised countries, where the demand for high-tech products is greater. An
unfavourable economic trend at national and/or international level could negatively influence the growth in
demand for IT with consequent repercussions on the Group’s business and its economic, equity and financial
situation.
Despite the weak demand (macroeconomic context and IT market) recorded in the last five years and the
consequent potential effect on the performance of business, in the last five years the Group has succeeded in
growing, out-performing the reference market with a sustainable trend in revenues and profits.
The ICT market is characterised also by a high level of competition, where in addition to national operators,
the Group has to face up to multinational competitors. If the Group were unable to generate added value
through its sales, taking on the reference competitors, this could have a negative impact on the economic,
equity and financial situation. To cope with this risk, the Group pursues an expansion of value added products
for its customers, providing competitive, efficient and innovative services.
Lastly, the IT market is subject to extensive technological evolution and, consequently, to a constant
transformation of the professional skills and expertise required. To operate with a competitive advantage on
the ICT market, it is necessary to constantly develop skills, the offer of products and the strategic management
of relations with international vendors. The Group carries out a constant and important analysis of the market
trends and opportunities, in order to pre-empt future evolutions of its customers’ needs, developing internal
expertise, the aggregation of external specialisations and investments in research and development.
Internal Risks
Risks relating to dependency on key resources
The group’s success, its business and its development depend largely on certain key managers, including the
executive directors of Sesa SpA. Doing without the services of one of the key figures without an adequate
replacement, as well as the inability to attract and keep new and qualified resources, could have negative
effects on the Group’s prospects and its economic and financial results. To cope with this risk, the Group has
developed a retention strategy and long-term incentive plans based also on medium-term equity-based
remuneration plans. The management believes that Sesa SpA and the Group have an operational structure
capable of ensuring continuity in the management of corporate affairs.
Risks linked to the concentration of and dependence on distribution agreements and the ability to
negotiate and maintain distribution contracts with Vendors
This risk factor is important for the Group’s main subsidiary, Computer Gross Italia SpA, reference operator in
the value added distribution (VAD) area, and partner of the main producers of IT solutions for the Italian market.
The main distribution agreements signed with Vendors are entered into on a non-exclusive basis, have a short-
term duration (usually one or two years), are tacitly renewed and represent strategic assets. The Group tackles
this risk offering vendors pre-and aftersales assistance with qualified staff, progressively expanding the
portfolio of the vendors distributed, gradually diversifying the concentration of the brands distributed. The
rates of termination of distribution agreements have usually been close to zero, confirming the Group’s ability
to create long-term strategic partnerships with its suppliers.
37
Risks linked to failure to fulfil contractual and compliance obligations
The Group offers IT services and solutions with a high technological content, and enters into agreements that
can envisage the application of penalties in the event of failure to meet deadlines, performances (SLA) and
quality standards agreed upon, with the consequent possibility of negative effects on the economic and
financial situation. To mitigate this risk, the Group has implemented procedures to manage and monitor the
services supplied and taken out adequate insurance policies.
In relation to compliance risks, the Group has implemented policies and procedures, including the adoption of
Form pursuant to Law 231/2001 for the parent company and the main subsidiaries, aimed at minimising
compliance risks (particularly tax and legal risks).
Market risks
Credit risk
Credit risk is represented by the Group companies’ exposure to potential losses arising from its customers’
failure to meet their obligations. Credit risk arising from the Group companies’ ordinary operations with its
customers is constantly monitored using customer information and assessment procedures and covered
through insurance and assignments without recourse (pro soluto). An appropriate provision for bad debts is
allocated and monitored.
Liquidity risk
During the financial year the Sesa Group Companies’ core business generates a requirement for working capital
with an ensuing financial exposure. Specifically, the Group closed the financial statements at 30 April 2018, with
a net liquidity of Euro 54,662 thousand. In certain phases of the year, especially at the end of calendar quarters,
a borrowing requirement is generated by the seasonal nature of the business and by increases in requirements
for net working capital. The liquidity risk is covered by periodic planning of cash requirements and by financing
these requirements with short-term self-liquidating loans and credit lines mainly concentrated with the Group’s
two main operating companies, Computer Gross Italia SpA and Var Group SpA. In the year ended 30 April
2018, the Group increased the medium/long-term share of financial debt by exploiting the reduction of market
rates and further reducing the liquidity risk.
Interest rate risk
Exposure to interest rate risk arises from the fact that the Group Companies conduct a business activity
characterised by a negative working capital cycle (calculated as the difference between short-term operating
liabilities and short-term operating assets) at certain times of the year and thus have a temporary financial
exposure to the banking system caused by the need to finance their working capital requirements.
These requirements are met from self-liquidating loans and credit lines at variable rates, exposed to interest
rate fluctuations.
At 30 April 2018, the Group had no derivative instruments in place relating to interest rates.
In the light of present interest rate trends and the moderate level of average annual debt, the Company’s risk
management policy does not envisage recourse to derivatives to hedge interest rate risks.
Exchange rate risk
The Group companies do not operate on foreign markets and primarily use the euro as the currency for its
commercial and financial transactions.
There were some purchases of IT goods and products, mainly involving Computer Gross Italia SpA, all using
the US dollar.

38
Furthermore, it should be noted that there are no foreign currency derivatives, but there are forward currency
contracts to hedge the exchange rate risk attached to foreign currency payables to a part of suppliers. There
were 50 transactions in place at 30 April 2018 with a fair value of Euro 165 thousand.
Price risk
The Group did not hold any financial instruments or shares listed on stock markets as of 30 April 2018, except
for Sesa SpA treasury shares as a deduction of the shareholders’ equity. As regards inventory risk, the Group
companies that distribute and market IT products monitor this aspect of their operations by conducting
periodic inspections and analyses for the possible existence of a risk of obsolescence of the goods in order to
decide the steps to take to curb the risk. Moreover, it should be noted that the value of inventories at 30 April
2018 was primarily concentrated in the accounts of Computer Gross Italia SpA and Var Group SpA.
Significant events occurring after the end of the year
After the end of the year, the Group's management continued in line with its strategy of focusing on the market
for value added IT solutions and services in the areas of the ICT market with the greatest potential, confirming
its commitment to developing its human capital in support of the technological innovation of its clientele.
Commercial initiatives and investments in areas of the IT market with higher than average Group margins are
continuing. In this context, the ERP Panthera branch was purchased on 7 May 2018 by the subsidiary Panthera
Srl, a company incorporated and 100% controlled by Sirio informatica e Sistemi SpA. The contribution of
Panthera Srl to the results of the Sesa Group will therefore be recognised from May 2018.
No other significant events occurred after the end of the year.
Outlook
In the first months of the new year the Group operated in a context of moderate growth of the IT market,
sustained by the innovative trends of the digital economy, continuing its management in continuity with the
previous year.
The Group will continue to operate and invest in the wealth of skills and professionalism of its human resources,
with the primary objective of further fuelling the path of sustainable growth to the benefit of creating value for
all stakeholders.
Allocation of the profit for the year of the parent Sesa SpA
The shareholders’ meeting is invited to distribute a dividend equal to Euro 0.60 per share totalling Euro 9.3
million gross of treasury shares in portfolio.
Thanking you for the confidence you place in us, you are invited to approve the separate financial statements
of the Parent Company Sesa SpA and the Consolidated financial statements of the Group.
The Chairman of the Board of Directors
Paolo Castellacci

39
Consolidated Financial Statements at 30 April 2018

40
Consolidated Income Statement
Note FY ended 30 April
(in thousands of euros) 2018 2017
Revenues 6 1,350,900 1,260,275
Other income 7 12,135 11,194
Consumables and goods for resale 8 (1,114,393) (1,055,182)
Costs for services and rent, leasing, and similar costs 9 (104,213) (85,812)
Personnel costs 10 (79,053) (70,107)
Other operating costs 11 (10,102) (8,736)
Amortisation and depreciation 12 (8,984) (6,846)
EBIT 46,290 44,786
Profit from companies valued at equity 13 376 172
Financial income 14 5,608 4,224
Financial charges 14 (9,243) (8,845)
Profit before taxes 43,031 40,337
Income taxes 15 (12,848) (13,239)
Profit for the year 30,183 27,098
of which:
Profit attributable to non-controlling interests 3,322 2,055
Profit attributable to the Group 26,861 25,043
Earnings per share (basic) (in euros) 24 1.74 1.62
Earnings per share (diluted) (in euros) 24 1.73 1.62
Consolidated Statement of Comprehensive Income
Note FY ended 30 April
(in thousands of euros) 2018 2017
Profit for the year 30,183 27,098
Actuarial gain/loss for employees benefits - gross effect 24 (285) (71)
Actuarial loss for employees benefits - tax effect 24 68 16
Comprehensive income for the year 29,966 27,043
of which:
Comprehensive income – non-controlling interests
3,237 2,159
Comprehensive income - Group 26,729 24,884

41
Consolidated Statement of Financial Position
Note At 30 April
(in thousands of euros) 2018 2017
Intangible assets 16 39,083 21,848
Property, plant and equipment 17 55,221 49,736
Investment property 18 290 290
Equity investments valued at equity 13 9,179 8,835
Deferred tax assets 19 6,532 5,548
Other non-current receivables and assets 20 10,442 8,160
Total non-current assets 120,747 94,417
Inventories 21 67,752 61,570
Current trade receivables 22 328,760 315,399
Current tax receivables 7,452 4,687
Other current receivables and assets 20 33,315 22,715
Cash and cash equivalents 23 247,194 191,951
Total current assets 684,473 596,322
Non-current assets held for sale
Total assets 805,220 690,739
Share capital 37,127 37,127
Share premium reserve 33,144 33,144
Other reserves 1,723 6,587
Profits carried forward 132,961 114,427
Total Group Equity 204,955 191,285
Equity attributable to non-controlling interests 11,046 7,743
Total Equity 24 216,001 199,028
Non-current loans 25 123,172 81,118
Employee benefits 26 20,495 17,427
Non-current provisions 27 2,836 1,746
Deferred tax liabilities 19 11,339 6,711
Total non-current liabilities 157,842 107,002
Current loans 25 72,704 60,878
Payables to suppliers 295,706 270,984
Current tax payables 2,187 3,241
Other current liabilities 28 60,780 49,606
Total current liabilities 431,377 384,709
Total liabilities 589,219 491,711
Total equity and liabilities 805,220 690,739

42
Consolidated Statement of Cash Flows
Note FY ended 30 April
(in thousands of euros) 2018 2017
Profit before taxes 43,031 40,337
Adjustments for:
Amortisation and depreciation 12 8,984 6,846
Accruals to provisions for personnel and other provisions 11,10 9,448 7,119
Net financial (income)/charges 14 2,219 1,608
Profit from companies valued at equity 13 (376) (172)
Other non-monetary items 1,151 395
Cash flows generated from operating activities before changes in net
working capital 64,457 56,133
Change in inventories 21 (5,658) (2,234)
Change in trade receivables 22 (2,542) (7,757)
Change in payables to suppliers 13,428 4,279
Change in other assets 20 (5,725) (522)
Change in other liabilities 28 6,778 354
Use of provisions for risks 27 (87) (87)
Payment of employee benefits 26 (796) (514)
Change in deferred taxes 19 (569) (351)
Change in current tax payables and receivables (6,969) (1,241)
Interest paid 14 (2,535) (2,907)
Taxes paid (9,698) (11,435)
Net cash flow generated from operating activities 50,084 33,718
Investments in companies, net of acquired cash 5 (8,622) (2,246)
Investments in property, plant and equipment 17 (10,007) (7,444)
Investments in intangible assets 16 (4,923) (2,522)
Disposals of property, plant and equipment and intangible assets 16,17 576 876
Disposals of investment property 18 - -
Disposal of assets held for sale - -
Investments in associated companies 13 (545) (5,563)
Disposals of associated companies 13 - -
Investments in other non-current financial assets 20 (2,014) -
Receipts from non-current financial assets 20 360 462
Dividends collected 250 91
Interest collected 14 543 1,413
Net cash flow generated from/(used in) investing activities (24,382) (14,933)
New disbursements of long-term loans and finance lease 3,25 95,420 71,500
Repayments of long-term loans 3,25 (56,176) (32,462)
(Decrease)/increase in short-term loans 3,25 663 (2,968)
Financial investments/disinvestments (48)
Capital increase 24 (697)
Change in group equity 24 505
Change in equity attributable to non-controlling interests 24 (1,178)
Treasury shares 24 (1,189) 158
Dividends distributed 24 (9,129) (7,860)
Net cash flow generated from/(used in) financing activities 29,541 26,998
Translation difference on cash and cash equivalents
Change in cash and cash equivalents 55,243 45,783
Cash and cash equivalents at the beginning of the year 191,951 146,168
Cash and cash equivalents at the end of the year 247,194 191,951

43
Consolidated Statement of Changes in Equity
Share
capital
Share premium
reserve
Other
reserves
Profit for the
year and Profits
carried forward
Group
Equity
Equity
attributable to
non-controlling
interests
Total
Equity (in thousands of euros)
At 30 April 2016 37,127 33,144 5,330 96,738 172,339 7,075 179,414
Profit for the year 25,043 25,043 2,055 27,098
Actuarial gain/(loss) for employees benefit -
gross (76) (76) 5 (71)
Actuarial gain/(loss) for employees benefit - tax
effect 18 18 (2) 16
Comprehensive income for the year 5,272 121,781 197,324 9,133 206,457
Purchase of treasury shares (1,342) (1,342) (1,342)
Sale of treasury shares 1,500 1,500 1,500
Dividends ditribution (7,408) (7,408) (452) (7,860)
Stock Grant Plan - shares vesting in the period 706 706 706
Non-refundable shareholders' payment
Allocation of profit for the year 848 (848)
Changes in the scope of consolidation and
other changes (397) 902 505 (938) (433)
At 30 April 2017 37,127 33,144 6,587 114,427 191,285 7,743 199,028
Profit for the year 26,861 26,861 3,322 30,183
Actuarial gain/(loss) for employees benefit -
gross (173) (173) (112) (285)
Actuarial gain/(loss) for employees benefit - tax
effect 41 41 27 68
Comprehensive income for the year 6,455 141,288 218,014 10,980 228,994
Purchase of treasury shares (1,189) (1,189) (1,189)
Sale of treasury shares
Dividends ditribution (299) (8,367) (8,666) (463) (9,129)
Assignment of shares in execution Stock Grant
plan 371 371 371
Stock Grant Plan - shares vesting in the period 1,022 1,022 1,022
Allocation of profit for the year 440 (440)
Changes in the scope of consolidation and
other changes (5,077) 480 (4,597) 529 (4,068)
At 30 April 2018 37,127 33,144 1,723 132,961 204,955 11,046 216,001
44
Explanatory Notes to the Consolidated Financial Statements
1 General Information
Sesa SpA (hereinafter “Sesa”, the “Company” or the “Parent Company”) is a company that has been
incorporated and is domiciled in Italy, with registered office in Empoli, at Via Piovola no. 138, and is organised
according to the legal system of the Italian Republic.
The Company and its subsidiaries (hereinafter collectively referred to as the “Group”) operate in Italy in the
field of Information Technology, and in particular in the value-added distribution of software and hardware
(value-added distribution or VAD) and in the offering of software, technology, services and consultancy aimed
at training and supporting businesses as end-users of IT (Software and System Integration or VAR).
Furthermore, the Group is active in the field of logistics services, mainly for companies of its Group. The
Company is owned by ITH SpA., which holds a stake of 52.81%.
This document was approved by the Company’s Board of Directors on 12 July 2018.
2 Summary of Accounting Policies
Below are reported the main accounting policies and standards applied in the preparation of these
consolidated financial statements for the financial year ended 30 April 2018 (hereinafter the “Consolidated
Financial Statements”).
2.1 Basis of Preparation
The Consolidated Financial Statements at 30 April 2018 were prepared in accordance with the International
Financial Reporting Standards (“IFRS”) issued by the International Accounting Standards Board (“IASB”) and
adopted by the European Union, as well as with the provisions implementing Article 9 of Legislative Decree no.
38/2005. The designation “IFRS” also includes all revised International Accounting Standards (“IAS”), as well as
all interpretations issued by the International Financial Reporting Interpretations Committee (“IFRIC”), and by
the formerly Standing Interpretations Committee (“SIC”).
The Consolidated Financial Statements were prepared on a going-concern basis, since the Directors verified
that there were no financial or operating indicators, or indicators of any other kind, that suggested the existence
of any doubts regarding the Group’s ability to meet its obligations in the foreseeable future and in particular
in the next 12 months. The procedures through which the Group manages financial risks are described in note
3 “Financial risk management” below.
The Consolidated Financial Statements were prepared and presented in Euro, which is the currency of the
primary economic environment in which the Group operates. All amounts included in this document are
expressed in thousands of euros, except as otherwise specified.
Below are specified the financial statement schedules and the related classification criteria adopted by the
Group, within the scope of the options envisaged in IAS 1 Presentation of financial statements:
• The Statement of financial position was prepared by classifying assets and liabilities according to the
criterion of “current/non-current” items;
• The Income Statement was prepared by classifying operating costs by nature;
• The Statement of comprehensive income includes the profit for the year arising from the income statement,
as well as any other changes in equity attributable to transactions that were not carried out with the
Company’s shareholders;
45
• The Statement of Cash Flows was prepared by reporting cash flows from operating activities according to
the “indirect method”.
The Consolidated Financial Statements were prepared according to the conventional historical cost method,
except for the measurement of financial assets and liabilities, in cases in which it is mandatory to apply the fair
value criterion.
2.2 Scope of Consolidation and Consolidation Criteria
The Consolidated Financial Statements include the Company’s separate financial statements as well as the
separate financial statements of subsidiaries approved by their respective governing bodies. These financial
statements were properly adjusted, if required, in order to comply them with IFRS and at the reporting date of
the Company at 30 April.
The companies included in the scope of consolidation at 30 April 2018 are detailed in annex 1, which forms an
integral part of the Consolidated Financial Statements. For additional information on the main changes in the
scope of consolidation that occurred in the financial years under examination, see note 5.
SUBSIDIARY COMPANIES
Subsidiary companies are consolidated on a line-by-line basis from the date on which control is actually
acquired and cease to be consolidated from the date on which control is transferred to third parties. Below are
reported the criteria adopted for consolidation on a line-by-line basis:
• assets and liabilities, income and expenses of subsidiary companies are accounted for on a line-by-line
basis, allocating to minority shareholders their respective share of equity and of the net result for the period,
if applicable; these shares are reported separately under equity and in the income statement;
• any business combinations by virtue of which control is acquired over a business entity are recognised, in
accordance with IFRS 3, according to the acquisition method. The acquisition cost is represented by the
current value (fair value) of the assets sold, of the liabilities assumed and of the equity instruments issued,
at the acquisition date. Any identifiable assets acquired, as well as any liabilities and contingent liabilities
assumed are entered at the related current value at the acquisition date, except for deferred tax assets and
liabilities, assets and liabilities for employee benefits and assets held for sale, which are entered on the basis
of the related reference accounting standards. If the difference between acquisition cost and the current
value (fair value) of the assets or liabilities that have been acquired is positive, it is recognised as goodwill
under intangible assets and if it is negative, after rechecking that the current values of the assets and
liabilities acquired and the acquisition cost have been correctly measured, it is recognised directly as income
in the income statement. Any additional charges relating to the transaction are recognised in the income
statement when incurred;
• the acquisition cost also includes the contingent consideration, measured at fair value on the date of the
acquisition of control. Any subsequent changes in the fair value are recognised in the income statement or
in the statement of comprehensive income if the contingent consideration is a financial asset or liability.
Contingent considerations classified as equity are not recalculated and the subsequent settlement is
recognised directly in equity;
• if the business combinations whereby control is acquired take place in more than one phase, the Group
recalculates the stake that it previously held in the acquiree at its fair value at the acquisition date and
recognises any resulting profit or loss in the income statement;
• any acquisitions of non-controlling interests relating to entities for which control has already been acquired
or the transfer of non-controlling interests that do not entail any loss of control are considered to be equity
transactions; therefore, any difference between the acquisition/transfer cost and the related fraction of
equity acquired/transferred is accounted for as an adjustment to the Group equity;
• business combinations whereby the participating companies are permanently controlled by the same
company or companies both before and after the combination transaction, control not being transitional,
46
are described as transactions “under common control”. These transactions do not fall within the scope of
application of IFRS 3, which regulates the method of accounting for business combinations, nor of other
IFRS. In the absence of an applicable accounting standard, the Group, in accordance with OPI 1
(Orientamenti Preliminari, Preliminary Guidelines) – “Accounting treatment of business combinations of
entities under common control in separate and consolidated financial statements” (Trattamento contabile
delle “business combinations of entities under common control” nel bilancio d’esercizio e nel bilancio
consolidato), issued by Assirevi and with IAS 8, adopted, as the accounting criterion for the recognition of
such transactions that of accounting for the acquirees on the basis of their carrying amounts resulting from
the financial statements of the same on the date of transfer. Any differences between the cost incurred for
the acquisition and the related shares of equity acquired are accounted for directly in equity;
• any substantial profits and losses, including their tax effects, arising from transactions carried out between
companies that have been consolidated on a line-by-line basis and that have not been settled with the
counterparties are derecognised, except for losses that are not derecognised when the transaction provides
evidence of an impairment loss of the transferred asset. Furthermore, any mutual credit and debt relations,
costs and revenues, as well as financial income and charges, are also eliminated, if significant.
The financial statements of subsidiary companies have been prepared by using the currency of the primary
economic environment in which they operate.
ASSOCIATED COMPANIES
Associated companies are entities over which the Group has significant influence, which is presumed to exist
when equity investments are included between 20% and 50% of voting rights. Investments in associated
companies are valued according to the equity method and are initially recognised at cost. Below is described
the equity method:
• the carrying amount of these equity investments appears to be in line with the adjusted equity, if required,
to reflect the application of the IFRS and includes the recognition of any higher values attributed to assets
and liabilities and of goodwill (if any), as identified at the time of the acquisition;
• any profits or losses attributable to the Group are reported from the date on which the significant influence
starts and up to the date on which it ceases. Should the company whose value is measured using this
method return negative equity as a result of the losses, the carrying amount of the investment is cancelled
and any excess attributable to the Group, if the Group has undertaken to meet legal or constructive
obligations in the investee company, or in any case has undertaken to cover its losses, is recognised in a
specific provision; any changes in equity of companies valued according to the equity method, which are
not represented by the result in the income statement, are accounted for directly in the statement of
comprehensive income;
• any profits and losses that have not been realised generated on transactions carried out between the
Company/subsidiaries and an investee company valued at equity, including any distribution of dividends,
are derecognised according to the value of the Group’s investment in the investee itself, except for losses
that represent an impairment in the underlying asset.
TRANSLATION OF TRANSACTIONS DENOMINATED IN A CURRENCY OTHER THAN THE
FUNCTIONAL CURRENCY
Any transactions in a currency other than the functional currency of the entity that undertakes the transaction
are translated by using the exchange rate prevailing on the date of the transaction. Any foreign exchange gains
and losses generated from the closing of the transaction or from the year-end translation of foreign currency
assets and liabilities are entered in the income statement.

47
2.3 Accounting policies
Below are summarised the most significant accounting standards and policies used for the preparation of the
Consolidated Financial Statements.
PROPERTY, PLANT AND EQUIPMENT
Property, plant and equipment are entered at their purchase or production cost, net of accumulated
depreciation and impairment losses (if any). Purchase or production cost includes any costs directly sustained
in preparing the assets for their use, as well as any dismantling or removal costs that are to be incurred as a
result of contractual obligations that require the asset to be restored to its original condition. Any borrowing
costs directly attributable to the acquisition, construction or production of qualifying assets are capitalized and
depreciated on the basis of the useful life of the asset to which they refer.
Any costs of day-to-day and/or periodic maintenance and repairs are recognised in the income statement
when incurred. Costs related to the enlargement, modernisation or improvement of owned or leased structural
elements are capitalised within the limits to which they meet the requirements for being classified separately
as assets or parts of an asset. Any assets recognised in relation to leasehold improvements are depreciated on
the basis of the lease term, or on the basis of the specific useful life of the asset, if lower.
Depreciation is calculated on a straight-line basis by applying rates that allow the assets concerned to be
depreciated until the end of their useful life. When the asset being depreciated is composed of distinctly
identifiable elements whose useful lives differ significantly from those of the other parts of the asset, the
depreciation is carried out separately for each of such parts, in the application of the component approach
method.
Below is reported the indicative useful life estimated for the various categories of property, plant and
equipment:
Class of property, plant and equipment Useful life in years
Buildings 33
Generic plants 7
Specific data center plants 20
Furniture and furnishings 8
Office machines 2-5
Motor vehicles 4
The useful life of property, plant and equipment is reviewed and updated, if necessary, at least at the end of
each financial year.
Land are not depreciated.
Leased assets
Property, plant and equipment held under finance lease agreements, under which the risks and benefits of
ownership are substantially transferred to the Group, are recognised as Group assets at fair value on the date
of the execution of the agreement or, if lower, at the present value of the minimum lease payments, including
any amount to be paid for the exercise of the option to purchase. The corresponding liability to the lessor is
entered under financial payables in the accounts.
48
The assets are depreciated applying the policy and the rates specified above, unless the term of the lease
agreement is shorter than the useful life represented by these rates and there is no reasonable certainty of the
transfer of the ownership of the leased asset on the natural expiry of the agreement; in this case, the period of
depreciation will be represented by the lease term.
The leases in which the lessor substantially retains all the risks and benefits incident to the ownership of the
assets are classified as operating leases. Operating lease rentals are recognised as an expense on a straight-
line basis over the lease term.
INTANGIBLE ASSETS
Intangible assets are made up of identifiable non-monetary assets without physical substance, which can be
controlled and from which future economic benefits are expected. These assets are initially recognised at their
purchase and/or production cost, including any directly attributable cost of preparing the asset for its intended
use. Any interest payable accrued during and for the development of intangible assets are considered part of
the purchase cost. Specifically, the following main intangible assets can be identified within the Group:
(a) Goodwill
If goodwill exists, it is classified as an intangible asset with an indefinite useful life and is initially measured at
cost, as described above, and is subsequently subjected to measurement at least once a year in order to verify
whether there has been any impairment (impairment test). The value of goodwill that has previously suffered
an impairment loss may not be reinstated.
(b) Other intangible assets with definite useful life
Intangible assets with definite useful life are recognised at cost, as previously described, net of accumulated
amortization and impairment losses (if any). Amortisation begins when the asset is available for use and is
allocated on a systematic basis in relation to the residual possible use of the same, i.e. on the basis of its
estimated useful life.
Below is reported the estimated useful life of the Group for the various categories of intangible assets:
Class of intangible asset Useful life in years
Software licences and similar rights 5
List of customers 10
Technological know-how 20
The useful life of intangible assets is reviewed and updated, if necessary, at least at the end of each financial
year.
INVESTMENT PROPERTY
Property held to earn rentals or for capital appreciation is classified under “Investment Property”; it is measured
at its purchase or production cost, as increased by additional costs (if any), net of accumulated depreciation
and impairment losses (if any).
49
IMPAIRMENT OF INTANGIBLE ASSETS, PROPERTY, PLANT AND EQUIPMENT AND OF
INVESTMENT PROPERTY
(a) Goodwill
As previously mentioned, if goodwill exists, it is subjected to an impairment test once a year or more frequently
when there are indications of possible impairment. No goodwill is recognised in the Consolidated Financial
Statements at 30 April 2018.
If goodwill exists, the impairment test is conducted on each of the Cash Generating Units (CGU) to which
goodwill has been allocated. Any impairment of goodwill is recognised in the event that the recoverable value
of the same is lower than the carrying amount. Recoverable value means the higher of fair value of the CGU,
net of costs of disposal, and the related value in use, i.e. the present value of estimated future cash flows from
this asset. In measuring value in use, the expected future cash flows are discounted by using a pre-tax discount
rate that reflects current market assessments of the time value of money, compared to the investment period
and to the risks specific to the asset. In the event that the impairment loss arising from the impairment test
exceeds the value of the goodwill allocated to the CGU, any residual excess is allocated to the assets included
in the CGU in proportion to their carrying amount. This allocation should not be reduced below the highest of:
• the asset’s fair value, less costs of disposal;
• the value in use, as defined above;
• zero.
The original carrying amount of goodwill may not be reinstated when the reasons that led to its impairment
no longer exist.
(b) Assets (intangible assets, property, plant and equipment and investment property) with
definite useful life
An assessment is carried out on each reporting date to verify whether there are indications that property, plant
and equipment, intangible assets and investment property may have incurred an impairment loss. For this
purpose, both external and internal sources of information may be made use of. Among the former (internal
sources), consideration is given to the obsolescence or physical deterioration of the asset or significant changes
in the use of the asset or in its economic performance in comparison with expectations. Among external sources
of information, consideration is given to trends in the asset’s market price or possible adverse changes in
technology, the market or legislation, the trend in market interest rates or the cost of capital used to assess
investments.
If such indications are found to exist, the recoverable value of the asset is estimated and the write-down (if
any) with respect to its carrying amount is recognised in the income statement. The recoverable value of an
asset is represented by the higher of fair value, net of additional costs to sell, and the related value in use, i.e.
the present value of estimated future cash flows from this asset. In measuring value in use, the expected future
cash flows are discounted by using a pre-tax discount rate that reflects current market assessments of the time
value of money, compared to the investment period and to the risks specific to the asset. The recoverable value
of an asset that does not generate cash flows that are largely independent is determined in relation to the cash
generating unit to which said asset belongs.
An impairment loss is recognised in profit or loss when the carrying amount of an asset, or of the related CGU
to which it is allocated, exceeds its recoverable amount. Any impairment losses of CGUs are firstly allocated to
reduce the carrying amount of any goodwill allocated to the same and, then, to reduce the carrying amounts
of other assets, on a pro-rata basis and within the limits of the related recoverable value. If the grounds for a
write-down previously recognised no longer exist, the asset’s carrying amount is reinstated and the increase is
recognised in the income statement within the limits of the net carrying amount of the asset if the write-down
had not been carried out and had been amortised/depreciated.
50
RECEIVABLES FROM CUSTOMERS AND OTHER FINANCIAL ASSETS
Receivables from customers and other financial assets are initially measured at fair value and subsequently
measured at amortised cost according to the effective interest rate method. Receivables from customers and
other financial assets are recognised under current assets, except for those that have a contract term exceeding
twelve months compared to the reporting date, which are classified under non-current assets.
For trade receivables, factoring transactions that do not envisage the risks and rewards related to the
receivables assigned being transferred to the factor (therefore, the Group remains exposed to the risk of
insolvency and delayed payments – so-called assignments with recourse (pro solvendo)), the transaction is
considered equivalent to taking out a secured loan backed by the assigned receivable. In these circumstances
the assigned receivable remains reported in the Group’s statement of financial position until it is collected by
the factor and a financial debt is reported as a contra-entry to the advance (if any) obtained from the factor.
The financial cost of factoring transactions is represented by interest on advanced amounts charged to the
income statement in compliance with the accruals principle, which is classified under financial charges. Any
commissions that accrue on assignments with recourse are recognised under financial charges, while any
commissions on assignments without recourse (pro soluto) are recognised under other operating costs.
Impairment losses on receivables are accounted for in the accounts if there is objective evidence that the Group
will not be able to recover the receivable owed by the counterparty on the basis of the conditions of the
contract.
Objective evidence includes circumstances such as:
• significant financial difficulties of the debtor;
• legal disputes entered into with the debtor in relation to the receivables;
• the likelihood of the debtor declaring bankruptcy or of the initiation of other debt restructuring procedures.
The amount of the write-down is measured as the difference between the carrying amount of the asset and
the present value of the estimated future cash flows and is recognised under “Other operating costs” in the
income statement. If the reasons for the previous write-downs no longer exist in subsequent periods, the value
of the asset is reinstated up to the amount that would have resulted from the application of amortised cost.
AVAILABLE-FOR-SALE FINANCIAL ASSETS
Equity investments in other companies that constitute available-for-sale financial assets are measured at fair
value, if this is determinable, and any profits and losses arising from fair value changes are recognised directly
under other comprehensive income (expense) until they are sold or have suffered an impairment loss; at that
time, other comprehensive income (expense) previously recognised under equity is charged to the income
statement for the period. Any other unlisted equity investments classified under “available-for-sale financial
assets”, the fair value of which cannot be measured reliably, are valued at cost adjusted by any impairment
losses, which are recognised in the consolidated income statement, as required by IAS 39.
Any dividends received from equity investments in other companies are recognised under financial income.
INVENTORIES
Inventories are recognised at the lower of purchase or production cost and net realizable value, which is
represented by the amount which the Group expects to obtain from their sale in the ordinary course of
business, net of selling costs. Cost is determined according to the FIFO method.
The cost of finished and semi-finished products includes any costs of design, raw materials, direct labour and
other production costs (as determined on the basis of the normal operating capacity). The measurement of
51
inventories does not include financial charges, which are charged to the income statement when they are
incurred, as the temporal requirements for their capitalisation are not satisfied.
Inventories of raw materials and semi-finished products that can no longer be used in the production cycle
and inventories of finished products that cannot be sold are written down.
CASH AND CASH EQUIVALENTS
Cash and cash equivalents include cash, available bank deposits and the other forms of short-term investment
with an original maturity of three months or fewer. Any items entered under cash and cash equivalents are
measured at fair value and the related changes are recognised through profit or loss.
NON-CURRENT ASSETS HELD FOR SALE
Any non-current assets whose carrying amount will be recovered mainly through its sale, rather than through
its continuous use, are classified as held for sale and are recognised separately from other assets in the
statement of financial position. This condition is deemed to have been fulfilled when sale is highly probable
and the asset or group of assets being disposed of is available for immediate sale in its or their present
condition.
Non-current assets held for sale are not amortised/depreciated and are measured at the lower of carrying
amount and fair value, less costs to sell.
A discontinued operation is a part of an enterprise that has been disposed of or classified as held for sale and
(i) is an important branch of business or geographical area of business; (ii) is part of a coordinated plan for the
disposal of an important branch of business or geographical area of business; or (iii) a subsidiary acquired
exclusively in order to be sold.
The results from discontinued operations are recognised separately in the income statement, net of tax effects.
The corresponding values posted in the previous financial year, if any, are reclassified and recognised separately
in the income statement, net of tax effects, for comparative purposes.
FINANCIAL PAYABLES
Financial payables are initially recognised at fair value, net of any directly-attributable additional costs, and
subsequently are measured at amortised cost, applying the effective interest rate method. If there is a change
in estimated expected cash flows, the value of the liabilities is recalculated to reflect this change on the basis
of the present value of the new expected cash flows and the effective initially determined internal rate. Financial
payables are classified under current liabilities, except those due by contract more than twelve months beyond
the reporting date and those whose payment the Group has an unconditional right to defer for at least twelve
months after the reporting date.
Financial payables are accounted for at the trade date and are derecognised at the time when they are
discharged and when the Group has transferred all risks and charges related to the instrument itself.
DERIVATIVE INSTRUMENTS
Derivatives are valued as securities held for trading and measured at fair value through profit or loss and are
classified under other current and non-current assets or liabilities.
Financial assets and liabilities through profit or loss are initially recognised and subsequently measured at fair
value and the related additional costs are expensed immediately in the income statement. Any profits and

52
losses arising from fair value changes in derivatives on exchange rates are reported under financial income and
financial charges in the income statement, in the period when they are recognised.
EMPLOYEE BENEFITS
Short-term benefits are made up of salaries, wages, related social security contributions, allowance in lieu of
paid annual leave and incentives paid out in the form of bonuses payable in the twelve months from the
reporting date. These benefits are accounted for as components of personnel costs in the period when service
is rendered. Under defined-benefit plans, which also include the severance pay due to employees pursuant to
article 2120 of the Italian Civil Code (“TFR”, Trattamento di Fine Rapporto), the amount of the benefit payable
to the employee can be quantified only after the termination of the employment relationship, and is linked to
one or more factors, such as age, length of service and compensation; therefore, the related charge is
recognised in the relevant income statement on the basis of an actuarial calculation. The liability recognised
for defined-benefit plans corresponds to the present value of the obligation at the reporting date.
Obligations for defined-benefit plans are determined by an independent actuary on an annual basis, by using
the projected unit credit method. The present value of defined-benefit plans is determined by discounting
future cash flows at an interest rate equal to that of (high-quality corporate) bonds issued in Euro and which
reflects the duration of the related pension plan. Any actuarial gains and losses arising from the
abovementioned adjustments and any changes in actuarial assumptions are charged to the statement of
comprehensive income.
On 1 January 2007 the so-called 2007 Finance Act and the relative implementing decrees introduced substantial
amendments to the regulations governing staff severance pay, among which the possibility for the workers to
choose where to send their accrued entitlement. In particular, workers may send the new TFR flows to selected
pension funds or retain them in their company. If the TFR is transferred to pension funds, the company is only
liable to pay a defined contribution to the chosen fund and from that date the newly-accrued contributions
have the nature of defined-contribution plans that are not subjected to actuarial measurement.
STOCK GRANT PLAN
As provided for in IFRS 2 - Share-Based Payment, the total amount of the present value of stock grant at the
date of assignment is recognised wholly in profit or loss under employee costs, with a counter entry recognised
directly in shareholders’ equity. If a “maturity period” is required, in which certain conditions are necessary
before grantees become holders of the right (achievement of objectives), the cost for payments, determined
on the basis of the present value of the shares at the date of assignment, is recognised under employee costs
on a straight line basis for the period between the date of assignment and maturity, with a counter entry
directly recognised in shareholders’ equity.
PROVISIONS FOR RISKS AND CHARGES
Provisions for risks and charges are recognised for losses and charges of a determinate nature, whose existence
is certain or probable, but whose amount and/or timing are uncertain. The provision is recognised only when
there is a present, legal or constructive obligation entailing a future outflow of resources as the result of past
events and it is probable that the outflow will be necessary in order to settle the obligation.
Such amount is the best estimate of the expenditure required to settle the obligation. The rate used in
determining the present value of the liabilities reflects the current market conditions and takes account of the
specific risk attached to each liability.
53
When the financial effect of timing is significant and the dates of the payment of the obligation can be
estimated reliably, provisions are measured at the present value of the expected outflow of funds, using a rate
that reflects market conditions, variations in the cost of money over time and the specific risk attached to the
obligation. Any increase in the provision, determined by changes in the time value of money, is accounted for
as an interest expense.
Risks for which a liability is only possible are mentioned in the appropriate section on contingent liabilities and
for the same no provision has been set aside.
PAYABLES TO SUPPLIERS AND OTHER LIABILITIES
Payables to suppliers and other liabilities are initially measured at fair value, net of any directly-attributable
additional costs, and subsequently are measured at amortised cost, applying the effective interest rate method.
EARNINGS PER SHARE
(a) Earnings per share - basic
Basic earnings per share are calculated by dividing the net profit attributable to the Group by the weighted
average number of ordinary shares outstanding during the financial year, excluding own shares.
(b) Earnings per share – diluted
Diluted earnings per share are calculated by dividing the net profit attributable to the Group by the weighted
average number of ordinary shares outstanding during the financial year, excluding own shares. For the
purposes of the calculation of diluted earnings per share, the weighted average of outstanding shares is
changed by assuming the exercise by all the assignees of rights that potentially have a dilutive effect, while the
net profit attributable to the Group is adjusted to take account of effects (if any), net of taxes, of the exercise
of said rights.
TREASURY SHARES
Treasury shares are recognised as a reduction in equity. The initial cost of treasury shares and any revenues
arising from subsequent sales (if any) are recognised as changes in equity.
REVENUE RECOGNITION
Revenue is measured at the fair value of the consideration received for the sale of goods and services in the
ordinary operations of the Group’s business. Revenue is recognised net of added-value tax, expected returns,
rebates, discounts and some marketing activities carried out with the help of the customers, whose value is a
function of the revenues themselves.
Revenues from the sale of products are recognised when the risks and rewards related to the ownership of the
asset are transferred to the buyer and when the sale price has been agreed and can be determined and is
expected to be collected.
COST RECOGNITION
Costs are recognised when they relate to goods and services acquired or consumed in the financial year or by
systematic allocation. The invoice discounts defined with the technology vendors are reduced to the purchase
cost since the commercial component is considered to be the most prevalent.

54
TAXES
Current taxes are determined on the basis of the estimated taxable income, in accordance with the tax
regulations applicable to the Group companies.
Deferred tax assets and liabilities are calculated on all the differences that arise between the taxable base of
an asset or liability and its carrying amount, except for goodwill when initially recognised and the differences
resulting from investments in subsidiaries, when the timing of the reversal of these differences is under the
Group’s control and it is likely that they will not be reversed in a reasonably foreseeable period of time. The
portion of deferred tax assets, including those related to past tax losses, that is not offset by deferred tax
liabilities, is recognised to the extent that there will be future taxable income from which they can be recovered.
Deferred tax assets and liabilities are calculated using the tax rates that are expected to apply in the financial
years during which the differences will be realised or settled.
Current taxes, deferred tax assets and liabilities are recognised under “Income taxes” in the income statement,
except for those relating to items recognised under comprehensive income components other than net profit
and those relating to items directly debited or credited to equity. In the latter cases, deferred tax liabilities are
recognised in the statement of comprehensive income and directly in equity. Deferred tax assets and liabilities
are offset when they are applied by the same tax authority, when there is a legal right to offset them and when
the net balance is expected to be settled.
Other taxes that are not correlated to income, such as indirect taxes and duties, are entered under “Other
operating costs” in the income statement.
2.4 Newly issued accounting standards
As at date of the Annual Report, the competent bodies of the European Union approved the adoption of the
following accounting standards and amendments applied to the Group on 1 May 2017.
On February 2016 IASB issued some amedments to IAS 12 – Income taxes on the recognition of deferred
tax assets for unrealised losses which clarify how to account for deferred tax assets related to debt
instruments measured at fair value. These amendments are applicable from years beginning on or after 1
January 2017.
On 25 February 2016 IASB issued some amedments to IAS 7 - Statement of cash flows on disclosure
initiative. These amendments to IAS 7 introduce an additional disclosure that will enable users of financial
statements to evaluate changes in liabilities arising from financing activities. These amendments are
applicable from years beginning on or after 1 January 2017.
On December 2016, the IASB issued an amendment (Annual Improvements to IFRSs 2014-2016 Cycle)
concerning IFRS 12 "Disclosure of interests in other entities". The amendments are effective for annual
periods beginning on or after 1 January 2017. The amendment clarifies that the information required by
the standard must be provided for equity investments classified as held for sale, with the exception of that
required by point B12.
The adoption of the new standards mentioned above had no significant effect on the consolidated financial
statements.
As at the date of the present Consolidated Financial Statements, the competent bodies of the European Union
have approved the adoption of the following accounting standards and amendments, not yet applied by the
Group.
55
On 12 November 2009 the IASB published IFRS 9 – Financial instruments, which was then amended
on 28 October 2010 and 24 July 2014. The standard, which will be applicable for financial years
commencing on or after 1 January 2018 on a retrospective basis, falls within the scope of a multi-
phase process aimed at fully replacing IAS 39 and introduces new criteria for the classification and
measurement of financial assets and liabilities and for the derecognition of financial assets from the
accounts. Specifically, for financial assets the new standard adopts a single approach based on the
method of the management of the financial instruments and the characteristics of their contractual
cash flows in order to determine their measurement policy, replacing the different rules laid down in
IAS 39. On the contrary, as regards financial liabilities, the main amendment involved the accounting
treatment of changes in the fair value of a financial liability designated as financial liability valued at
fair value through profit or loss, in the event that said changes are due to a change in the credit risk
of the liability itself. Based on the new standard, such adjustments have to be charged in the
statement of comprehensive income rather than profit and loss statement. During the year, the
Group carried out a preliminary assessment of the effects of IFRS 9 determining that there will be no
significant effects on the Group’s equity and net profit.
On June 2016 the IASB issued some further amedments to IFRS 2 – “Share based payment” clarifying
the evaluation of the “cash-settled share-based payments” and how to account for certain types of
share-based payment transactions. It also introduces an exception to IFRS 2 that will require an
award to be treated as if it was wholly equity-settled, where an employer is obliged to withhold an
amount for the employee’s tax obligation associated with a share-based payment and pay that
amount to the tax authority. These amendments will be applicable from years beginning on or after 1
January 2018.
On 28 May 2014 the FASB issued IFRS 15 “Revenue from contracts with customers”. The new
standard will be applicable as of years beginning on or after 1 January 2018. The standard replaces
IAS 18 – “Revenue” IAS 11 "Construction Contracts", IFRIC 13 “Customer Loyalty Programmes”, “IFRIC
15 - Agreements for the Construction of Real Estate”, IFRIC 18 – “Transfers of Assets from
Customers”, SIC 31 – “Revenue—Barter Transactions Involving Advertising Services”. The new
standard applies to all contracts with customers, apart from contracts falling within the scope of
application of IAS 17 – Leases, for insurance contracts and financial instruments. It establishes a
process consisting of five phases to define the timing and the amount of the revenues to be
disclosed (identification of contracts with customers, identification of the performance obligations
envisaged by the contract, determination of the price of the transaction, allocation of the price of the
transaction, disclosure of revenues upon fulfilment of the performance obligation). The Group plans
to apply this new standard from the mandatory effective date, using the method of full retrospective
application. During the period the Group carried out a preliminary assessment of the effects of IFRS
15. On the basis of such analysis, the Group will continue to recognize its revenues consistently with
the accounting policies of the previous years. Consequently, no significant impacts are expected on
Group’s equity and net profit.
On 12 April 2016 the IASB issued some further amedments to IFRS 15 - Revenue from Contracts with
Customers, “Clarifications to IFRS 15″, clarifying some points and allowing more semplifications, with
the aim to reduce costs and complexity, for early adopters. These amendments will be applicable from
years beginning on or after 1 January 2018.
On September 2016, the IASB issued an amendment to IFRS 4 "Insurance contracts" regarding the
application of IFRS 9 "Financial instruments". The amendments will allow all companies that issue
insurance contracts the option of recognising in the statement of comprehensive income, rather than
in the income statement, the volatility that could arise when IFRS 9 is applied before the new standard
on insurance contracts is issued. In addition, it will allow companies whose business is predominantly
related to insurance contracts an optional temporary derogation in the application of IFRS 9 until 2021.
Entities deferring the application of IFRS 9 will continue to apply IAS 39. The amendments apply for
annual periods beginning on or after 1 January 2018.
On December 2016, the IASB issued a collection of amendments to IFRS (Annual Improvements to
IFRSs 2014-2016 Cycle). Improvements amended the following standards: (i) IFRS 1 “First-time
Adoption of International Financial Reporting Standards” in relation to the deletion of some
56
exemptions related to IFRS 7, IAS 19 and IFRS 10 in case of first-time adoption, (ii) IAS 28 “Investments
in Associates and Joint Ventures” relating to measurement at fair value of associates or joint ventures.
These amendments will be applicable from years beginning on or after 1 January 2018.
On 13 January 2016 the IASB issued new IFRS 16 – Leases. This standard replaces the current guidance
in IAS 17 no more suitable to represent leases in the current business. New standard now requires to
recognise lease contracts in the balance sheet as assets or liabilitiy whether financial or operting lease.
Lease contrats with 12 months o less duration and leases of low-value assets are out of new standard
scope. The standard will be applicable from years beginning on or after 1 January 2019. New standards
can generally be adopted early by IFRS 15 (Revenue from contracts with customers) adopters.
On December 2016, the IASB issued some further amendments to IAS 40 “Investment Property”
providing guidance on transfers of property to, or from, “Investment properties” line item, underlying
that transfers to investment property can be made when there is an evident change in use. These
amendments will be applicable from years beginning on or after 1 January 2018.
On December 2016, IASB issued IFRIC 22 “Foreign currency transactions and advance consideration”.
The document clarifies the accounting for transactions or part of transactions where there is
consideration that is priced in a foreign currency. These amendments will be applicable from years
beginning on or after 1 January 2018.
On October 2017, the IASB published an amendment to IAS 28 "Long-term Interests in Associates and
Joint Ventures". The amendment clarifies the accounting treatment of investments in associates and
joint ventures that are not evaluated using the equity method in accordance with IFRS 9. The
amendments are effective for annual periods beginning on or after 1 January 2019.
As at the date of the present Consolidated Financial Statements, the competent bodies of the European
Union have not yet completed the necessary process of endorsement for the adoption of the following
accounting standards and amendments.
On June 2017, the IASB published the interpretation IFRIC 23 "Uncertainty over Income Tax Treatments".
The document provides guidance on how to reflect uncertainties in the tax treatment of a given
phenomenon in the accounting for current and/or deferred income taxes. The amendments are effective
for annual periods beginning on or after 1 January 2019.
On October 2017, the IASB published an amendment to IFRS 9 "On prepayment features with negative
compensation". The amendment confirms that when a financial liability recognised at amortised cost is
modified without this leading to its de-recognition, the related gain or loss must be recognised
immediately in the income statement. The gain or loss is measured as the difference between the previous
cash flow and the cash flow restated to reflect the change. The amendments are effective for annual periods
beginning on or after 1 January 2019.
On May 2017 the IASB issued the new standard IFRS 17 - Insurance Contracts. The new standard will replace
IFRS 4 and will be effective for annual periods beginning on or after 1 January 2021.
On December 2017, the IASB issued a set of amendments to IFRS (Annual Improvements to IFRSs 2015-
2017 Cycle). The provisions approved have amended: (i) IFRS 3 "Business Combinations"; (ii) IFRS 11 "Joint
arrangements"; (iii) IAS 12 "Income Taxes"; (iv) IAS 23 "Borrowing costs" in relation to the accounting
treatment of loans originally linked to the development of a business. The amendments are effective for
annual periods beginning on or after 1 January 2019.
On February 2018, the IASB published an amendment to IAS 19 "Employee benefits" that introduces
changes essentially aimed at requiring the use of updated actuarial assumptions in the calculation of
current service cost and net interest for the period following a change in an existing defined benefit plan.
Application of the amendments is effective for financial years beginning on or after 1 January 2019.
The Group will adopt these new standards, amendments and interpretations , on the basis of the expected
date of application, and will assess potential impacts, when these are approved by the European Union.

57
3 Financial risk management
The Group’s business is exposed to the following risks: market risk (defined as exchange and interest rate risk),
credit risk, liquidity risk and capital risk.
The Group’s risk management strategy is aimed at minimizing potential adverse effects on the Group’s financial
performance. Some types of risk are mitigated through recourse to derivative instruments. Risk management
is centralised within the treasury function that identifies, assesses and hedges financial risks in close
cooperation with the Group’s operating units. The treasury function provides instructions to monitor risk
management, as well as provides instructions for specific areas, concerning interest rate risks, exchange rate
risks and the use of derivative and non-derivative instruments.
MARKET RISK
The Group is exposed to market risks as regards interest rate risks and exchange rate risks.
Interest Rate Risk
The exposure to interest rate risks mainly arises from the fact that the Group companies carry out business
activities characterized by negative financing requirements during certain periods of the year. These
requirements are covered through assignments of receivables, loans and variable-rate credit lines. The Group
has not deemed it appropriate to enter into specific financial instruments to hedge interest rate risks, as the
same would result, as a whole, particularly onerous compared to benefits (if any), considering the current level
of financial debt and interest rates.
The amount of variable-rate indebtedness that is not covered by the interest rate risk represents the main
element of risk for the impact that could be produced on the income statement following an increase in market
interest rates.
On the basis of the analysis of the Group’s indebtedness, it should be noted that 100% of long- and short-term
debt at 30 April 2018 is variable-rate debt.
Exchange Rate Risk
The Group is active exclusively in the Italian market and its exposure limited to exchange rate risks relates to
some minor purchases and sales of goods in US dollars. In order to reduce exchange rate risks arising from
assets, liabilities and expected cash flows in foreign currency, the Group makes recourse to forward contracts
in order to hedge cash flows in currencies other than the Euro. The Group mainly sets the exchange rates of
the functional currencies of the Group companies (Euro) against US dollar, as some purchases and sales of
consumables and goods are denominated in US dollars. In fact, it is the Group’s policy to hedge, where possible,
forecast trade flows in US dollars arising from certain or highly probable contractual commitments. The term
of the existing forward contracts does not exceed 12 months. The instruments adopted by the Group do not
meet all the necessary requirements to be accounted for according to the rules of hedge accounting.
At 30 April 2018, there are 50 forward contracts with a positive fair value of Euro 165 thousand.
CREDIT RISK
The credit risk essentially arises from receivables from customers for the sale of products and services. As
regards the credit risk relating to the management of financial or cash resources, temporarily deposited with
banks, the Group has in place procedures aimed at ensuring that the Group companies maintain relations with
independent counterparties that are of high standing and reliable. At 30 April 2018 almost all of the financial
and cash resources were held with counterparties with a good credit rating and investment grade.
58
In order to mitigate the credit risk correlated to its business counterparties, and therefore to its customers, the
Group has implemented procedures aimed at ensuring that its products are sold to customers that are
considered to be reliable on the basis of past experience and any available information. The Group also adopted
procedures to hedge credit risk by purchasing credit insurance and/or through factoring without recourse.
Furthermore, the Group controls its commercial exposure on an ongoing basis and monitors that the debt
collection takes place within the preset contractual time limits.
With reference to trade receivables, the more risky situation concerns relations with retailers. Therefore, receipts
and payment times relating to these receivables are monitored on an ongoing basis. However, the amount of
financial assets that are considered to be of insignificant amount and the recoverability of which may be
doubtful is covered by appropriate provisions for bad debts. For more details on the provision for bad debts,
see note 22.
The table below provides a breakdown of current receivables from customers at 30 April 2018 and 30 April
2017, by overdue amounts, net of the portion of provision for bad debts.
At 30 April 2018 At 30 April 2017
(in thousands of euros)
Falling due 296,266 274,572
Overdue from 0-90 days 25,334 26,151
Overdue from 90-180 days 2,433 5,208
Overdue from 180-360 days 1,612 3,269
Overdue from more than 360 days 3,115 6,198
Total 328,760 315,399
LIQUIDITY RISK
The liquidity risk is associated to the Group’s ability to meet any commitments mainly arising from financial
liabilities. A prudent management of the liquidity risk arising from the Group’s ordinary operations requires
the maintenance of an adequate level of cash and cash equivalents and the availability of funds that can be
obtained through an adequate amount of credit lines.
Furthermore, it should be noted that:
• there are different sources of financing, with different banks;
• there are no significant concentrations of liquidity risk both as regards financial assets and as regards
sources of financing.
The tables below report the expected cash flows in the coming financial years in relation to financial liabilities
at 30 April 2018 and 30 April 2017:
At 30 April 2018 Book value
Within 12
months
Between 1
and 5 years
Beyond 5
years (in thousands of euros)
Current and non-current loans 153,214 44,164 109,050
Short-term loans 26,121 26,121
Advances received from factors 1,121 1,121
Liabilities for finance leases 15,420 1,298 5,504 8,618
Derivatives on exchange rates
Payables to suppliers 295,706 295,706
Other current and non-current payables 3,193 3,193

59
At 30 April 2017 Book value
Within 12
months
Between 1
and 5 years
Beyond 5
years (in thousands of euros)
Current and non-current loans 111,319 45,621 65,698
Short-term loans 9,021 9,021
Advances received from factors 4,787 4,787
Liabilities for finance leases 16,869 1,449 4,622 10,798
Derivatives on exchange rates 77 77
Payables to suppliers 270,984 270,984
Other current and non-current payables 5,322 5,322
CAPITAL RISK
The Group’s objective within the scope of the capital risk management is mainly that of safeguarding its
continuation as a going-concern so as to guarantee returns to shareholders and benefits to any other
stakeholders. The Group also intends to maintain an optimal capital structure so as to reduce the cost of debt.
FINANCIAL ASSETS AND LIABILITIES BY CLASS
The fair value of receivables from customers and of other financial assets, payables to suppliers and other
payables and of other financial liabilities, recognised under the “current” items of the consolidated statement
of financial position, measured using the amortised cost method, does not differ from the book values reported
in the financial statements at 30 April 2018 and 30 April 2017, as reference is mainly made to assets underlying
business relations, the settlement of which is expected in the short term.
Non-current financial liabilities and assets are settled or measured at market rates and, therefore, their fair
value is considered to be substantially in line with the present book values.
A classification of financial assets and liabilities by class at 30 April 2018 and 30 April 2017 is reported below:
At 30 April 2018 Loans and
receivables
Held-to-
maturity
investments
Financial
asset or
liability at
fair value
Total
financial
assets or
liabilities
Non-financial
assets and
liabilities
Total
(in thousands of euros)
Assets
Current receivables from customers 328,760 328,760 328,760
Other current and non-current assets 19,822 16 7,586 27,424 16,333 43,757
Cash and cash equivalents 247,194 247,194 247,194
Total assets 348,582 16 254,780 603,378 16,333 619,711
Liabilities
Current and non-current loans 191,342 4,534 195,876 195,876
Payables to suppliers 295,706 295,706 295,706
Other current liabilities 3,193 3,193 57,587 60,780
Total liabilities 490,241 494,775 57,587 552,362

60
At 30 April 2017 Loans and
receivables
Held-to-
maturity
investments
Financial
asset or
liability at
fair value
Total
financial
assets or
liabilities
Non-
financial
assets and
liabilities
Total
(in thousands of euros)
Assets
Current receivables from customers 315,399 315,399 315,399
Other current and non-current assets 12,878 1.615 4,155 18,648 12,227 30,875
Cash and cash equivalents 191,951 191,951 191,951
Total assets 328,277 1.615 196,106 525,998 12,227 538,225
Liabilities
Current and non-current loans 141,996 141,996 141,996
Payables to suppliers 270,984 270,984 270,984
Other current liabilities 5,322 77 5,399 44,207 49,606
Total liabilities 418,302 77 418,379 44,207 462,586
FAIR VALUE ESTIMATE
IFRS 13 defines the fair value as the price that would be received for the sale of an asset or that would be paid
for the transferral of a liability on the date of evaluation on a free transaction between market operators.
The fair value of financial instruments listed on an active market is based on market prices on the reporting
date. The fair value of instruments that are not listed on an active market is calculated using evaluation
techniques based on a series of methods and assumptions linked to market conditions at the reporting date.
The fair value classification of financial instruments is given below, based on the following hierarchical levels:
Level 1: fair value calculated with reference to listed prices (not adjusted) on active markets for identical
financial instruments;
Level 2: fair value calculated using evaluation techniques with reference to variables that can be observed on
active markets;
Level 3: fair value calculated using evaluation techniques with reference to market variables that cannot be
observed.
The table below shows the assets and liabilities which, at 30 April 2018, were measured and booked at fair
value, providing an indication of the hierarchical level of the relative fair value:
(in thousands of euros) Level 1 Level 2 Level 3
Assets measured at Fair Value Financial derivatives 165 Assets destined for sale
Equity investments in other enterprises 5,759
Other Assets 1,662
Total 0 1,827 5,759
Liabilities measured at Fair Value Financial derivatives
Financial liabilities at Fair Value recognised in the Income Statement 2,329
Other Liabilities 2,205
Total 0 4,534 0
Financial derivatives are forward transactions in foreign currency entered into by the Group for the
management of the exchange rate risk on certain supplies in currencies other than the Euro. The positive and
negative fair value was determined using the exchange risks observable at the reporting date.
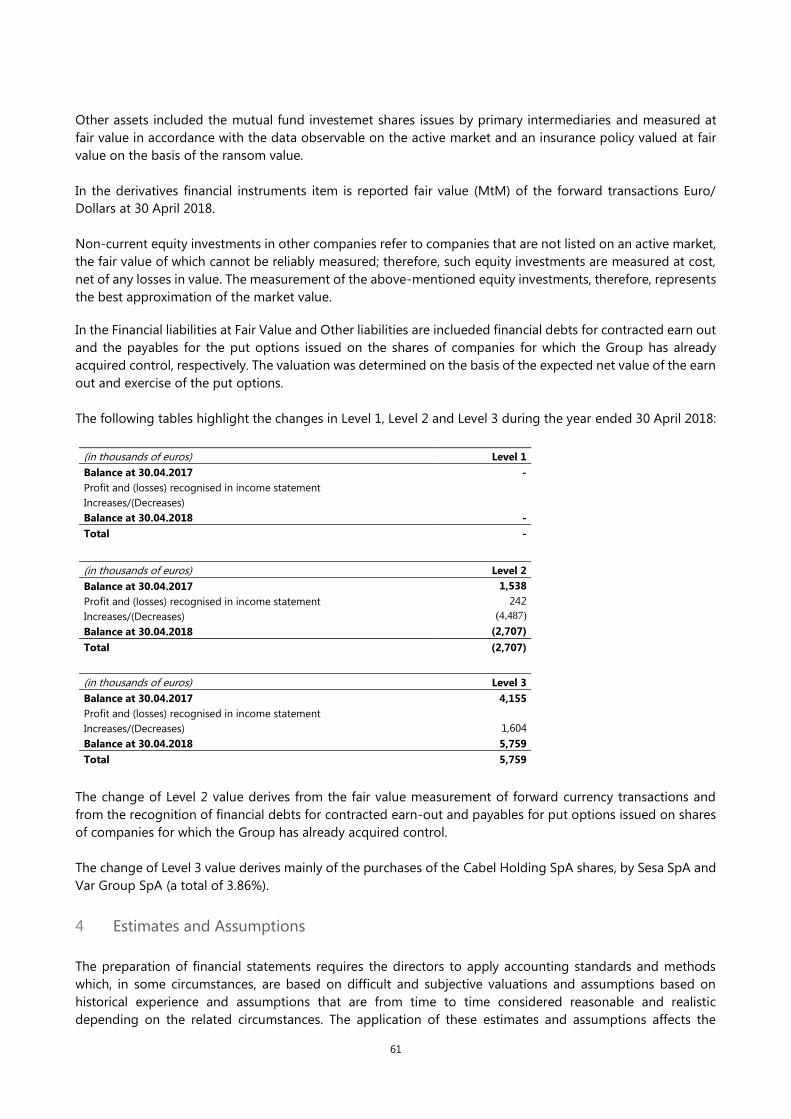
61
Other assets included the mutual fund investemet shares issues by primary intermediaries and measured at
fair value in accordance with the data observable on the active market and an insurance policy valued at fair
value on the basis of the ransom value.
In the derivatives financial instruments item is reported fair value (MtM) of the forward transactions Euro/
Dollars at 30 April 2018.
Non-current equity investments in other companies refer to companies that are not listed on an active market,
the fair value of which cannot be reliably measured; therefore, such equity investments are measured at cost,
net of any losses in value. The measurement of the above-mentioned equity investments, therefore, represents
the best approximation of the market value.
In the Financial liabilities at Fair Value and Other liabilities are inclueded financial debts for contracted earn out
and the payables for the put options issued on the shares of companies for which the Group has already
acquired control, respectively. The valuation was determined on the basis of the expected net value of the earn
out and exercise of the put options.
The following tables highlight the changes in Level 1, Level 2 and Level 3 during the year ended 30 April 2018:
(in thousands of euros) Level 1
Balance at 30.04.2017 -
Profit and (losses) recognised in income statement Increases/(Decreases) Balance at 30.04.2018 -
Total -
(in thousands of euros) Level 2
Balance at 30.04.2017 1,538
Profit and (losses) recognised in income statement 242
Increases/(Decreases) (4,487)
Balance at 30.04.2018 (2,707)
Total (2,707)
(in thousands of euros) Level 3
Balance at 30.04.2017 4,155
Profit and (losses) recognised in income statement Increases/(Decreases) 1,604
Balance at 30.04.2018 5,759
Total 5,759
The change of Level 2 value derives from the fair value measurement of forward currency transactions and
from the recognition of financial debts for contracted earn-out and payables for put options issued on shares
of companies for which the Group has already acquired control.
The change of Level 3 value derives mainly of the purchases of the Cabel Holding SpA shares, by Sesa SpA and
Var Group SpA (a total of 3.86%).
4 Estimates and Assumptions
The preparation of financial statements requires the directors to apply accounting standards and methods
which, in some circumstances, are based on difficult and subjective valuations and assumptions based on
historical experience and assumptions that are from time to time considered reasonable and realistic
depending on the related circumstances. The application of these estimates and assumptions affects the

62
amounts reported in the financial statement schedules, the statement of financial position, the income
statement, the statement of comprehensive income, the statement of cash flows, as well as any information
provided. The final results of the financial statement items for which the abovementioned estimates and
assumptions have been used could differ from those reported in the financial statements that recognise the
effects of the occurrence of the event being estimated, because of the uncertainty that characterizes the
assumptions and conditions on which estimates are based.
Below are summarised the areas that require, more than others, greater subjectivity on the part of the directors
in preparing estimates and for which a change in the conditions underlying the assumptions used could have
a significant impact on financial data.
(a) Impairment of assets
In accordance with the accounting standards applied by the Group, property, plant and equipment, intangible
assets and investment property are tested for impairment in order to establish whether there is evidence of an
impairment loss, which must be recognised through a write-down, when there are indications that it may be
difficult to recover the related net book value through their use. The verification of the existence of the
abovementioned indicators requires the directors to apply subjective valuations based on the information
available within the Group and in the market, as well as on historical experience. Furthermore, if it is established
that a potential impairment loss may have occurred, the Group takes steps to determine the same by using
valuation techniques that are considered to be suitable. The correct identification of any evidence of the
existence of a potential impairment loss of property, plant and equipment, intangible assets and investment
property, as well as any estimates for the determination of the same, depend on factors that can vary over
time, thus affecting the valuations and estimates made by the directors.
(b) Amortisation and depreciation
The cost of property, plant and equipment and intangible assets is depreciated/amortised on a straight-line
basis over the estimated useful life of the related assets. The useful economic life of said assets is determined
by the directors at the time when they are acquired; it is based on historical experience for similar assets, market
conditions and anticipations of future events that could have an impact on the useful life of the assets, including
changes in technology. Therefore, the actual economic life could differ from the estimated useful life.
(c) Provision for bad debts
The provision for bad debts reflects any losses estimated for the Group’s portfolio of receivables. The Group
has set aside provisions against expected losses on receivables, which have been estimated on the basis of
past experience with reference to receivables with a similar credit risk, to current and historical outstanding
amounts, as well as to the careful monitoring of the quality of the portfolio of receivables and of the current
and expected conditions of the relevant economy and markets. The estimates and assumptions are reviewed
periodically and the effects of any change are reported in the income statement in the relevant financial year.
(d) Provision for obsolescence of inventories
The Group recognises probable liabilities attributable to impairment losses of inventories in the provision for
obsolescence of inventories. The determination of these provisions entails the assumption of estimates based
on the current knowledge of factors that can vary over time, thus being able to generate final results that may
also be significantly different from those taken into account in the preparation of these disclosures.
(e) Employee benefits
The present value of pension funds entered in the Consolidated Financial Statements depends on an
independent actuarial calculation and on the different assumptions taken into consideration. Any changes in
63
the assumptions and in the discount rate used are promptly reflected in the calculation of the present value
and could have a significant impact on the data reported in the accounts. The assumptions used for the
purposes of the actuarial calculation are examined on an annual basis.
The present value is determined by discounting the future cash flows at an interest rate equal to that of (high-
quality corporate) bonds issued in the currency in which the liability will be settled and which takes account of
the duration of the related pension plan. For additional information, reference is made to notes 26 Employee
benefits and 10 Personnel costs.
5 Business Combinations
During the fiscal year the most significant business combination are reported below: the acquired control of
Icos SpA and Tech-Value Srl respectively in the VAD and SSI segment.
In September 2017 Computer Gross Italia SpA (VAD segment) signed a binding agreement for the purchase of
51% of the company Icos SpA, value distributor of enterprise software and solutions for datacenter on the
Italian market based in Ferrara, Milan and Rome, with an historic partnership with the Vendor Oracle, of which
is an authorized distributor on the Italian market, and Vendors NetApp, CommVault and Huawei. Following
AGCM’s favourable authorization, the acquisition of 51% of Icos Spa was completed on 10 November 2017,
for a price of Euro 2.29 million. The amount of Euro 1,264 thousand (before taxes) was allocated to the item
Technological Know-How, amortised over a twenty-year horizon and Euro 1,264 thousand (before taxes) to the
item Client list, amortised over a ten-year horizon, due to allocation of the consideration paid.
To the founders, who will remain active in the managment, has been granted the possibility to exercise put
options for the sale to CGI of such 49% of ICOS in two tranches, in April 2019 and April 2020, for a total price
of Euro 2.21 million, including the share of profits earned by ICOS during the three-year period 2018-2020 and
following the achievement of fixed business continuity conditions. These options were reflected in financial
liabilities.
In January 2018 Var Group SpA (SSI segment) acquired 51% of Tech-Value SpA (which then became Tech-
Value Srl), leading company in Italian market of PLM and CAD solutions in Industry 4.0 for the “engineering
intensive” manufacturing sector. The transaction was completed on 22 January 2018 through the purchase by
Var Group SpA of 51% of Newco Industria 4.0 Srl which held 100% of the Tech-Value SpA shares. 78% of such
shares were acquired following the contribution of the founders and the remaining 22% through a public bid
on totality of Tech-Value shares for a price of Euro 5.3 million paid for Euro 3.7 million at the closing and for
the remaining amount of Euro 1.6 million conditional on the continuity in business management and paid in
the following 24 months, plus an earn-out up to a maximum of Euro 1.2 million subject to the achievement of
Tech-Value average consolidated Ebitda targets in the three-year period 2019- 2021, applying a multiple of
4.75x Ebitda. The completion of the reverse merger of Newco Industia 4.0 Srl into Tech-Value Srl took place in
April 2018. Tech-Value Srl and totalitarian subsidiary CCS Team Srl were consolidated in January 2018, with the
consequent registration of the total amount of Euro 12,066 thousand (before taxes) in the item Technological
Know-How, amortized in twenty-years horizon.
In accordance with IFRS 3, the fair value of assets, liabilities and contingent liabilities was determined at 30
April 2018.

64
The following table shows the details of the fair value of acquired assets and liabilities for all the companies
included in the scope of consolidation at 30 April 2018:
Synergy
Srl Icos SpA
Tech-Value
Srl and CCS
Team Srl
Total
(in thousands of euros)
Property, plant and equipment 313 2,535 12,297 15,145
Investment property 95 14 265 374
Other current and non-current assets 43 142 4,418 4,603
Inventories 522 2 524
Current trade receivables 371 9,586 7,336 17,293
Cash and cash equivalents 289 5 1,643 1,937
Acquired assets 1,111 12,804 25,961 39,876
Non-current loans 1,725 6,979 8,704
Employee benefits 180 393 760 1,333
Current loans 36 200 - 236
Deferred tax liabilities 74 728 3,478 4,280
Payables to suppliers 199 6,574 4,456 11,229
Other liabilities 293 398 3,918 4,609
Acquired liabilities 782 10,018 19,591 30,391
Non-controlling interests (99) (491) (1,033) (1,623)
Acquired net assets 230 2,295 5,337 7,862
The amount paid for acquisitions made during the year is shown below:
Synergy Srl Icos SpA
Tech-Value
Srl and CCS
Team Srl
Total
(in thousands of euros)
Fee 230 2,295 5,337 7,862
Net financial debt (net cash)* (289) (5) (1,643) (1,937)
Amount paid (59) 2,290 3,694 5,925
* Net financial debt calculated at the date of the corporate control acquisition and entry in the scope of consolidation
6 Segment Reporting
The criteria applied to identify the business segments being reported are in line with the procedures through
which the management runs the Group. In particular, the organisation of the business segments being reported
corresponds to the structure of the reports that are periodically analysed by the Board of Directors for the
purposes of the management of the Group’s business. Specifically, the main scope of operational analysis used
by the Group is that relating to the following operating segments:
• Value-Added Distribution, which includes the value-added distribution, through the subsidiary Computer
Gross Italia SpA, of IT products and solutions in the categories of servers, storage, software and networking
to the operators in the enterprise and small/medium enterprise segment. The Group’s VAD offer, integrated
to software houses and integrators of technology for the implementation of complex technology solutions,
is targeted at the end users of products distributed.
• Software and System Integration (VAR), which includes the offer of software, technology, services and
consultancy, through the subsidiary Var Group SpA, aimed at training and supporting businesses as end

65
users of IT. The Group provides services for the design, consultancy, development and installation of
software and complex technology, pre- and after-sales assistance and strategic outsourcing.
• Corporate, which includes services such as administrative and finance management, organisation, planning
and control, management of IT systems, human resources, general, corporate and legal affairs of the main
Group companies carried out by the parent company Sesa SpA and also logistics services, (storage,
assembly, customisation and handling of products) through Ict Logistica Srl.
The operating segments of Value-Added Distribution and Software and System Integration are vertically
integrated through the sale of IT products and solutions from Computer Gross Italia SpA to Var Group SpA.
Computer Gross Italia SpA uses the logistics services included in the Corporate segment.
The Group’s management assesses the performance of the different operating segments, using the following
indicators:
• revenues from third parties by operating segment;
• Ebitda defined as the profit for the year before amortisation/depreciation, accruals to provisions for bad
debts, accruals to provision for risks, non-monetary costs related to stock grant plans assigned to executive
directors, financial income and charges, the profit (loss) of companies valued at equity and taxes;
• profit for the year.
As Ebitda is not a recognized measure of financial performance under IFRS (Non-GAAP Measures) the
quantitative calculation may not be unique. Ebitda is a measure used by management to monitor and evaluate
the operating performance of the companies of the Group.
The criteria in determining the Ebitda reported above and applied by the Group may not be consistent with
that used by other companies or groups, and therefore the figures may not be comparable with those
determined by such groups.
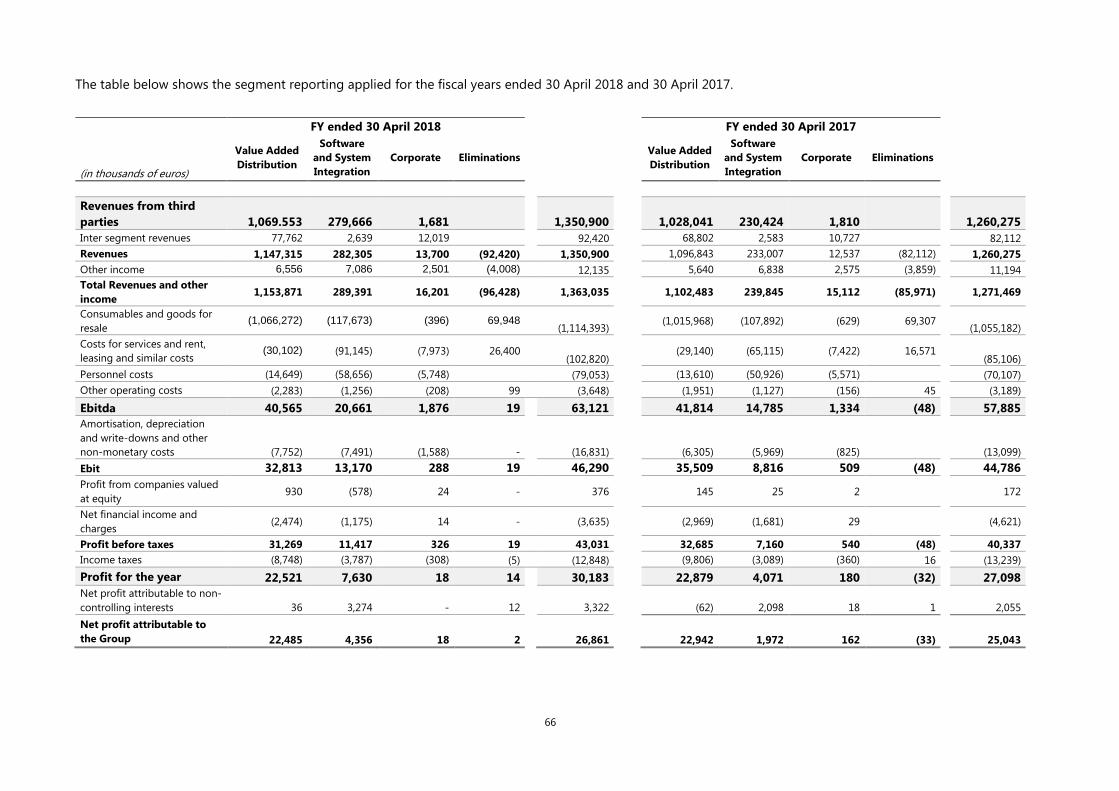
66
The table below shows the segment reporting applied for the fiscal years ended 30 April 2018 and 30 April 2017.
FY ended 30 April 2018 FY ended 30 April 2017
(in thousands of euros)
Value Added
Distribution
Software
and System
Integration
Corporate Eliminations
Value Added
Distribution
Software
and System
Integration
Corporate Eliminations
Revenues from third
parties 1,069.553 279,666 1,681 1,350,900 1,028,041 230,424 1,810
1,260,275
Inter segment revenues 77,762 2,639 12,019 92,420 68,802 2,583 10,727 82,112
Revenues 1,147,315 282,305 13,700 (92,420) 1,350,900 1,096,843 233,007 12,537 (82,112) 1,260,275
Other income 6,556 7,086 2,501 (4,008) 12,135 5,640 6,838 2,575 (3,859) 11,194
Total Revenues and other
income 1,153,871 289,391 16,201 (96,428) 1,363,035
1,102,483 239,845 15,112 (85,971) 1,271,469
Consumables and goods for
resale (1,066,272) (117,673) (396) 69,948
(1,114,393) (1,015,968) (107,892) (629) 69,307
(1,055,182)
Costs for services and rent,
leasing and similar costs (30,102) (91,145) (7,973) 26,400
(102,820) (29,140) (65,115) (7,422) 16,571
(85,106)
Personnel costs (14,649) (58,656) (5,748) (79,053) (13,610) (50,926) (5,571) (70,107)
Other operating costs (2,283) (1,256) (208) 99 (3,648) (1,951) (1,127) (156) 45 (3,189)
Ebitda 40,565 20,661 1,876 19 63,121 41,814 14,785 1,334 (48) 57,885
Amortisation, depreciation
and write-downs and other
non-monetary costs (7,752) (7,491) (1,588) - (16,831) (6,305) (5,969) (825)
(13,099)
Ebit 32,813 13,170 288 19 46,290 35,509 8,816 509 (48) 44,786
Profit from companies valued
at equity 930 (578) 24 - 376 145 25 2 172
Net financial income and
charges (2,474) (1,175) 14 - (3,635) (2,969) (1,681) 29 (4,621)
Profit before taxes 31,269 11,417 326 19 43,031 32,685 7,160 540 (48) 40,337
Income taxes (8,748) (3,787) (308) (5) (12,848) (9,806) (3,089) (360) 16 (13,239)
Profit for the year 22,521 7,630 18 14 30,183 22,879 4,071 180 (32) 27,098
Net profit attributable to non-
controlling interests 36 3,274 - 12 3,322 (62) 2,098 18 1
2,055
Net profit attributable to
the Group 22,485 4,356 18 2 26,861 22,942 1,972 162 (33)
25,043

67
The table below shows the financial segment reporting applied for the fiscal years ended 30 April 2018 and 30 April 2017.
FY ended 30 April 2018 FY ended 30 April 2017
(in thousands of euros)
Value
Added
Distribution
Software
and
System
Integration
Corporate Eliminations Value
Added
Distribution
Software
and
System
Integration
Corporate Eliminations
Intangible assets 3,388 35,627 68 39,083 1,211 20,556 81 21,848
Property, plant and equipment 41,034 13,661 526 55,221 41,772 7,477 487 49,736
Investment property 290 290 290 290
Equity investments valued at equity 5,923 2,602 901 (247) 9,179 4,749 3,296 1,037 (247) 8,835
Deferred tax assets 3,510 2,698 392 (68) 6,532 3,172 2,119 321 (64) 5,548
Other non-current receivables and assets 4,427 6,079 68,269 (68,333) 10,442 3,660 4,966 67,217 (67,683) 8,160
TOTAL NON-CURRENT ASSETS 58,282 60,667 70,446 (68,648) 120,747 54,564 38,414 69,433 (67.994) 94,417
Inventories 57,380 10,497 (125) 67,752 51,738 9,977 (145) 61,570
Current trade receivables 269,031 93,228 12,038 (45,537) 328,760 266,331 80,799 14,440 (46,171) 315,399
Current tax receivables 3,705 3,449 298 7,452 619 2,075 1,993 4,687
Other current receivables and assets 11,339 22,590 819 (1,433) 33,315 6,766 17,658 965 (2,674) 22,715
Cash and cash equivalents 164,818 72,888 9,488 247,194 135,720 47,101 9,130 191,951
TOTAL CURRENT ASSETS 506,273 202,652 22,643 (47,095) 684,473 461,174 157,610 26,528 (48,990) 596,322
Non-current assets held for sale
TOTAL ASSETS 564,555 263,319 93,089 (115,743) 805,220 515,738 196,024 95,961 (116,984) 690,739
Share capital 40,000 3,800 37,126 (43,799) 37,127 40,000 3,800 37,127 (43,800) 37,127
Share premium reserve 4,051 33,144 (4,051) 33,144 4,051 33,144 (4,051) 33,144
Other reserves and Profits carried forward 131,254 8,515 15,619 (20,704) 134,684 119,701 7,162 14,299 (20,148) 121,014
TOTAL GROUP EQUITY 171,254 16,366 85,889 (68,554) 204,955 159,701 15,013 84,570 (67,999) 191,285
Equity attributable to non-controlling interests 869 10,000 177 11,046 829 6,123 555 236 7,743
TOTAL EQUITY 172,123 26,366 85,889 (68,377) 216,001 160,530 21,136 85,125 (67,763) 199,028
Non-current loans 77,401 45,771 123,172 59,717 21,401 81,118
Employee benefits 1,828 17,109 1,558 20,495 1,479 14,518 1,430 17,427
Non-current provisions 1,878 958 2,836 1,299 447 1,746
Deferred tax liabilities 2,406 9,155 17 (239) 11,339 1,381 5,542 27 (239) 6,711
TOTAL NON-CURRENT LIABILITIES 83,513 72,993 1,575 (239) 157,842 63,876 41,908 1,457 (239) 107,002
Current loans 37,303 35,401 72,704 36,796 24,082 60,878
Payables to suppliers 257,030 82,610 3,104 (47,038) 295,706 245,002 70,408 4,494 (48,920) 270,984
Current tax payables 177 1,990 10 10 2,187 1,097 2,116 18 10 3,241
Other current liabilities 14,409 43,959 2,511 (99) 60,780 8,437 36,374 4,867 (72) 49,606
TOTAL CURRENT LIABILITIES 308,919 163,960 5,625 (47,127) 431,377 291,332 132,980 9,379 (48,982) 384,709
TOTAL LIABILITIES 392,432 236,953 7,200 (47,366) 589,219 355,208 174,888 10,836 (49,221) 491,711
TOTAL EQUITY AND LIABILITIES 564,555 263,319 93,089 (115,743) 805,220 515,738 196,024 95,961 (116,984) 690,739
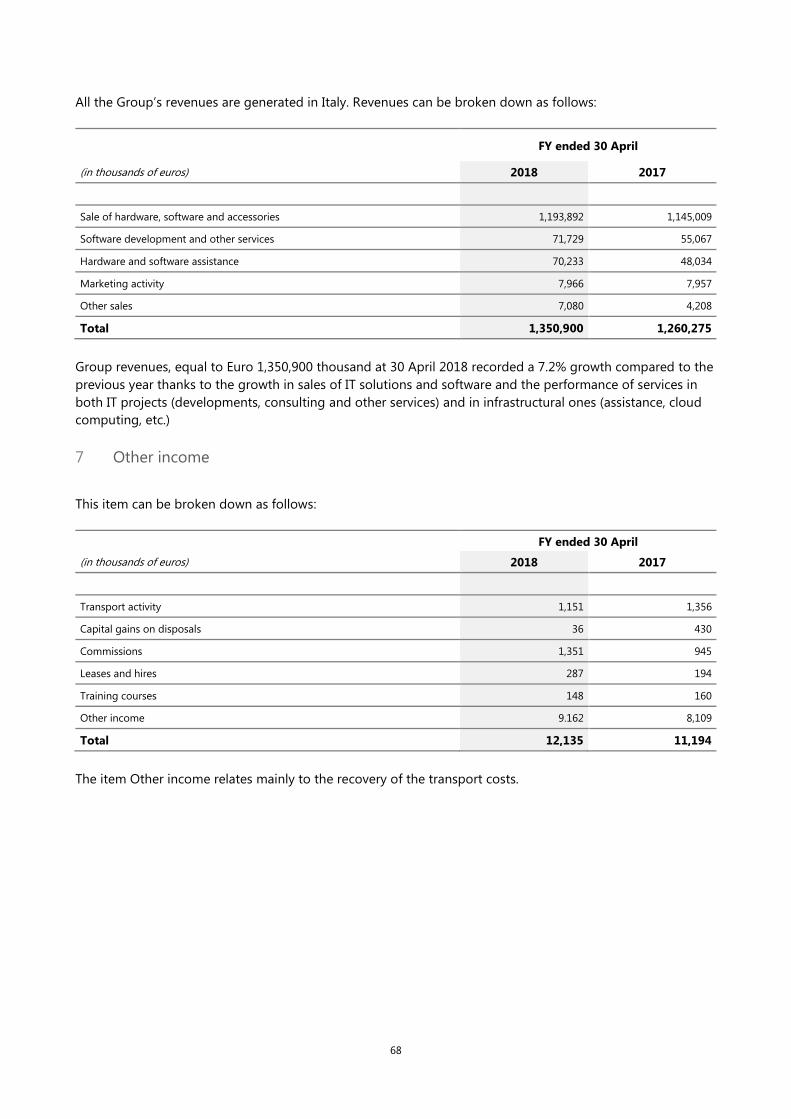
68
All the Group’s revenues are generated in Italy. Revenues can be broken down as follows:
FY ended 30 April
(in thousands of euros) 2018 2017
Sale of hardware, software and accessories 1,193,892 1,145,009
Software development and other services 71,729 55,067
Hardware and software assistance 70,233 48,034
Marketing activity 7,966 7,957
Other sales 7,080 4,208
Total 1,350,900 1,260,275
Group revenues, equal to Euro 1,350,900 thousand at 30 April 2018 recorded a 7.2% growth compared to the
previous year thanks to the growth in sales of IT solutions and software and the performance of services in
both IT projects (developments, consulting and other services) and in infrastructural ones (assistance, cloud
computing, etc.)
7 Other income
This item can be broken down as follows:
FY ended 30 April
(in thousands of euros) 2018 2017
Transport activity 1,151 1,356
Capital gains on disposals 36 430
Commissions 1,351 945
Leases and hires 287 194
Training courses 148 160
Other income 9.162 8,109
Total 12,135 11,194
The item Other income relates mainly to the recovery of the transport costs.

69
8 Consumables and Goods for resale
This item can be broken down as follows:
FY ended 30 April
(in thousands of euros) 2018 2017
Purchase of hardware 715,466 690,755
Purchase of software 396,910 362,860
Consumables and other purchases 2,017 1,567
Total 1,114,393 1,055,182
Cash discount granted by the suppliers are reclassified to reduce the purchase cost of the goods since the
commercial compenent is considered prevalent, as practiced in the distribution sector.
9 Costs for services and rent, leasing and similar costs
This item can be broken down as follows:
FY ended 30 April
(in thousands of euros) 2018 2017
Hardware and software technical assistance 37,294 27,692
Consultancy 24,609 19,516
Commissions and contributions due to agents 8,805 7,475
Leases and hires 9,080 6,961
Marketing 4,488 3,394
Transport 3,722 3,985
Insurance 1,756 1,619
Utilities 1,889 1,650
Logistics and warehousing 1,516 1,492
Support and training expenses 1,037 689
Maintenance 3,343 2,957
Other expenses for services 6,674 8,382
Total 104,213 85,812
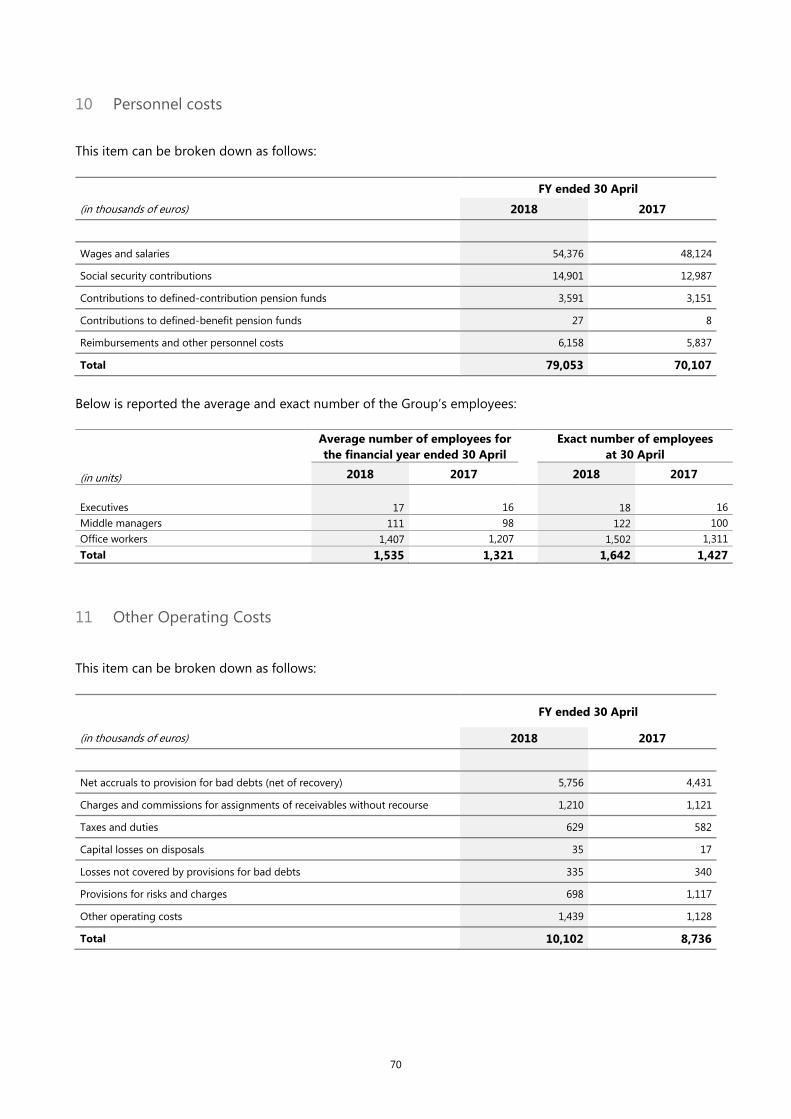
70
10 Personnel costs
This item can be broken down as follows:
FY ended 30 April
(in thousands of euros) 2018 2017
Wages and salaries 54,376 48,124
Social security contributions 14,901 12,987
Contributions to defined-contribution pension funds 3,591 3,151
Contributions to defined-benefit pension funds 27 8
Reimbursements and other personnel costs 6,158 5,837
Total 79,053 70,107
Below is reported the average and exact number of the Group’s employees:
Average number of employees for
the financial year ended 30 April
Exact number of employees
at 30 April
(in units) 2018 2017 2018 2017
Executives 17 16 18 16
Middle managers 111 98 122 100
Office workers 1,407 1,207 1,502 1,311
Total 1,535 1,321 1,642 1,427
11 Other Operating Costs
This item can be broken down as follows:
FY ended 30 April
(in thousands of euros) 2018 2017
Net accruals to provision for bad debts (net of recovery) 5,756 4,431
Charges and commissions for assignments of receivables without recourse 1,210 1,121
Taxes and duties 629 582
Capital losses on disposals 35 17
Losses not covered by provisions for bad debts 335 340
Provisions for risks and charges 698 1,117
Other operating costs 1,439 1,128
Total 10,102 8,736

71
12 Amortisation and depreciation
This item can be broken down as follows:
FY ended 30 April
(in thousands of euros) 2018 2017
Intangible assets 3,547 2,969
Property, plant and equipment 5,437 3,877
Total 8,984 6,846
13 Profit from companies valued at equity
Below is reported the breakdown of changes in the value of equity investments in associated companies valued
at equity in the financial years ended 30 April 2018 and 30 April 2017:
FY ended 30 April
(in thousands of euros) 2018 2017
Balance at the beginning of the period 8,835 3,938
Acquisitions and capital increases 563 5,563
Transfers and winding-ups (18)
Dividends received (249)
Profit from companies valued at equity 376 172
Reclassifications (328) (838)
Balance at the end of the period 9,179 8,835
Below is reported the share of profit of the main associated companies and the combined value of their assets,
liabilities and revenues:
(in thousands of euros)
Total
assets
Total
liabilities Revenues
Profit (loss)
for the year
Ownership
%
30 April 2018
ATTIVA SPA 60,871 35,956 324,475 3,588 20.0%
M.K. ITALIA S.r.l. 1,628 1,206 5,326 93 45.0%
STUDIO 81 DATA SYSTEM SRL 1,579 1,359 2,209 24 50.0%
C.G.N. Srl 1,221 5 165 8 47.5%
WEBGATE SRL 623 53 606 140 30.0%
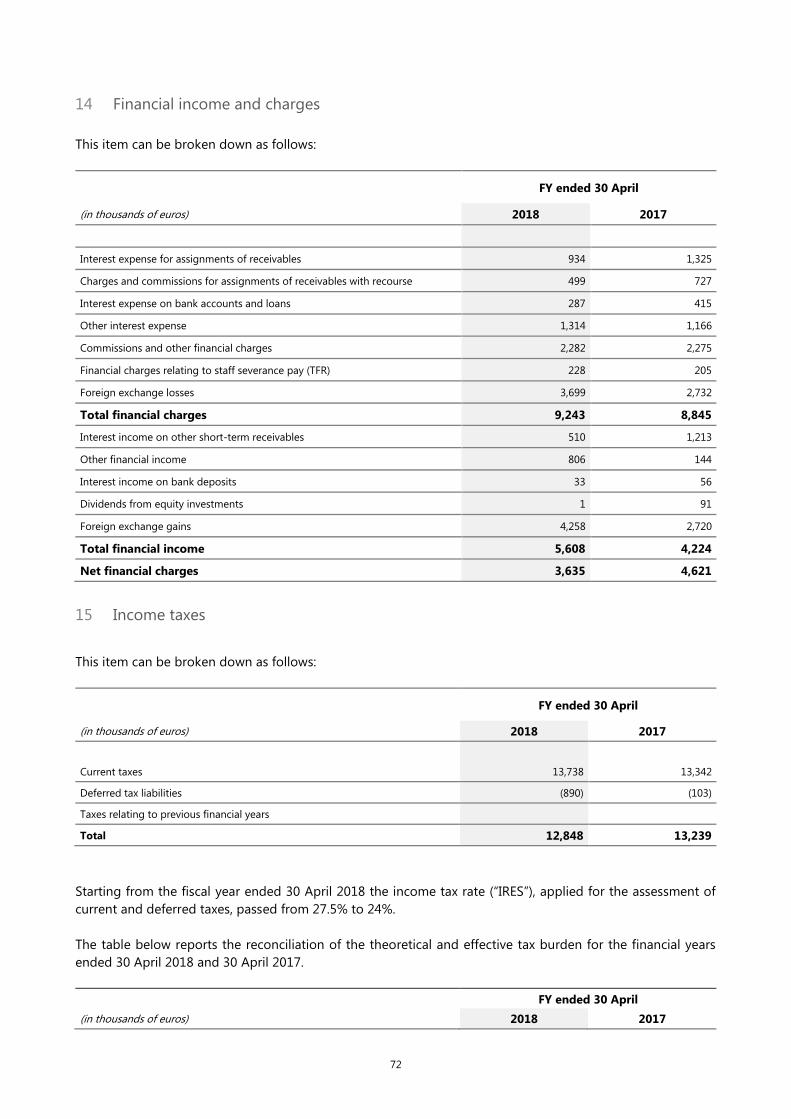
72
14 Financial income and charges
This item can be broken down as follows:
FY ended 30 April
(in thousands of euros) 2018 2017
Interest expense for assignments of receivables 934 1,325
Charges and commissions for assignments of receivables with recourse 499 727
Interest expense on bank accounts and loans 287 415
Other interest expense 1,314 1,166
Commissions and other financial charges 2,282 2,275
Financial charges relating to staff severance pay (TFR) 228 205
Foreign exchange losses 3,699 2,732
Total financial charges 9,243 8,845
Interest income on other short-term receivables 510 1,213
Other financial income 806 144
Interest income on bank deposits 33 56
Dividends from equity investments 1 91
Foreign exchange gains 4,258 2,720
Total financial income 5,608 4,224
Net financial charges 3,635 4,621
15 Income taxes
This item can be broken down as follows:
FY ended 30 April
(in thousands of euros) 2018 2017
Current taxes 13,738 13,342
Deferred tax liabilities (890) (103)
Taxes relating to previous financial years
Total 12,848 13,239
Starting from the fiscal year ended 30 April 2018 the income tax rate (“IRES”), applied for the assessment of
current and deferred taxes, passed from 27.5% to 24%.
The table below reports the reconciliation of the theoretical and effective tax burden for the financial years
ended 30 April 2018 and 30 April 2017.
FY ended 30 April
(in thousands of euros) 2018 2017
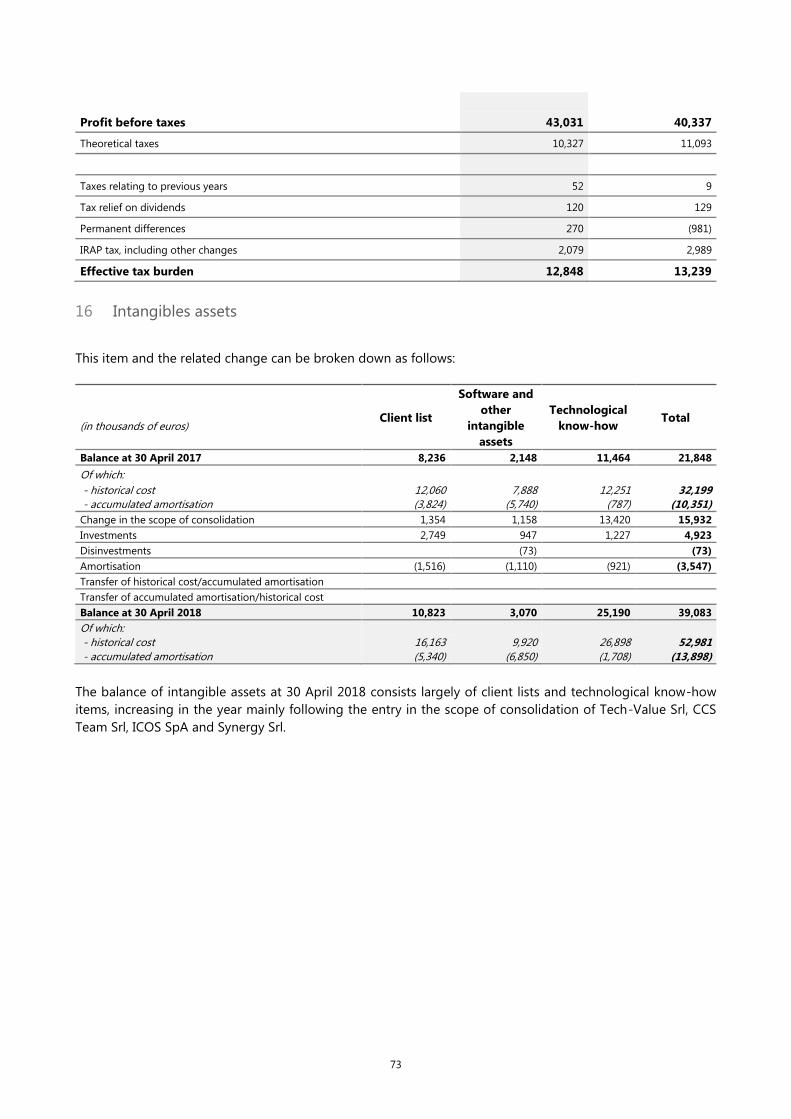
73
Profit before taxes 43,031 40,337
Theoretical taxes 10,327 11,093
Taxes relating to previous years 52 9
Tax relief on dividends 120 129
Permanent differences 270 (981)
IRAP tax, including other changes 2,079 2,989
Effective tax burden 12,848 13,239
16 Intangibles assets
This item and the related change can be broken down as follows:
Client list
Software and
other
intangible
assets
Technological
know-how Total
(in thousands of euros)
Balance at 30 April 2017 8,236 2,148 11,464 21,848
Of which: - historical cost 12,060 7,888 12,251 32,199
- accumulated amortisation (3,824) (5,740) (787) (10,351)
Change in the scope of consolidation 1,354 1,158 13,420 15,932
Investments 2,749 947 1,227 4,923
Disinvestments (73) (73)
Amortisation (1,516) (1,110) (921) (3,547)
Transfer of historical cost/accumulated amortisation
Transfer of accumulated amortisation/historical cost
Balance at 30 April 2018 10,823 3,070 25,190 39,083
Of which:
- historical cost 16,163 9,920 26,898 52,981
- accumulated amortisation (5,340) (6,850) (1,708) (13,898)
The balance of intangible assets at 30 April 2018 consists largely of client lists and technological know-how
items, increasing in the year mainly following the entry in the scope of consolidation of Tech-Value Srl, CCS
Team Srl, ICOS SpA and Synergy Srl.
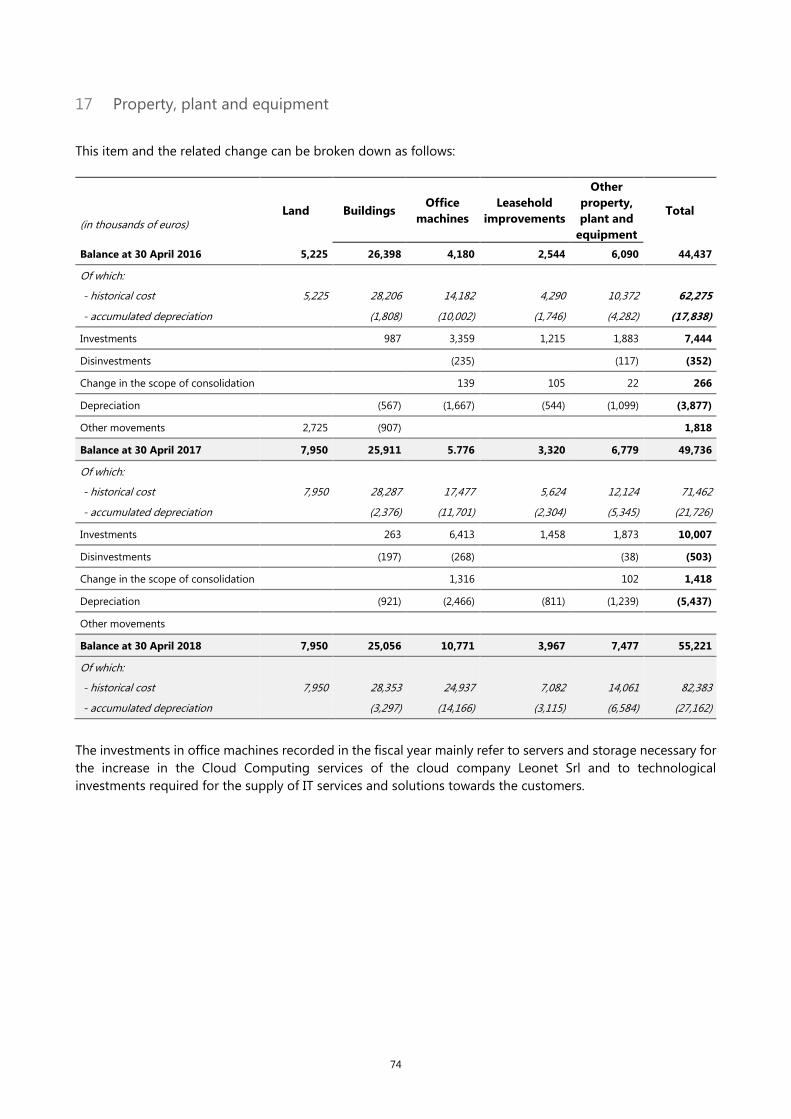
74
17 Property, plant and equipment
This item and the related change can be broken down as follows:
Land Buildings Office
machines
Leasehold
improvements
Other
property,
plant and
equipment
Total (in thousands of euros)
Balance at 30 April 2016 5,225 26,398 4,180 2,544 6,090 44,437
Of which:
- historical cost 5,225 28,206 14,182 4,290 10,372 62,275
- accumulated depreciation (1,808) (10,002) (1,746) (4,282) (17,838)
Investments 987 3,359 1,215 1,883 7,444
Disinvestments (235) (117) (352)
Change in the scope of consolidation 139 105 22 266
Depreciation (567) (1,667) (544) (1,099) (3,877)
Other movements 2,725 (907) 1,818
Balance at 30 April 2017 7,950 25,911 5.776 3,320 6,779 49,736
Of which:
- historical cost 7,950 28,287 17,477 5,624 12,124 71,462
- accumulated depreciation (2,376) (11,701) (2,304) (5,345) (21,726)
Investments 263 6,413 1,458 1,873 10,007
Disinvestments (197) (268) (38) (503)
Change in the scope of consolidation 1,316 102 1,418
Depreciation (921) (2,466) (811) (1,239) (5,437)
Other movements
Balance at 30 April 2018 7,950 25,056 10,771 3,967 7,477 55,221
Of which:
- historical cost 7,950 28,353 24,937 7,082 14,061 82,383
- accumulated depreciation (3,297) (14,166) (3,115) (6,584) (27,162)
The investments in office machines recorded in the fiscal year mainly refer to servers and storage necessary for
the increase in the Cloud Computing services of the cloud company Leonet Srl and to technological
investments required for the supply of IT services and solutions towards the customers.

75
18 Investment Property
This item and the related change can be broken down as follows:
Land Buildings Total
(in thousands of euros)
Balance at 30 April 2016 281 9 290
Of which:
- historical cost 281 10 291
- accumulated depreciation (1) (1)
Depreciation
Disposals
Balance at 30 April 2017 281 9 290
Of which:
- historical cost 281 10 291
- accumulated depreciation (1) (1)
Investments
Disposals
Depreciation
Balance at 30 April 2018 281 9 290
19 Deferred tax assets and liabilities
Below is the breakdown of the expected maturity of deferred tax assets and deferred tax liabilities:
At 30 April
(in thousands of euros) 2018 2017
Deferred tax assets due within 12 months 5,974 4,951
Deferred tax assets due beyond 12 months 558 597
Total deferred tax assets 6,532 5,548
Deferred tax liabilities within 12 months 400
Deferred tax liabilities beyond 12 months 11,339 6,311
Total deferred tax liabilities 11,339 6,711
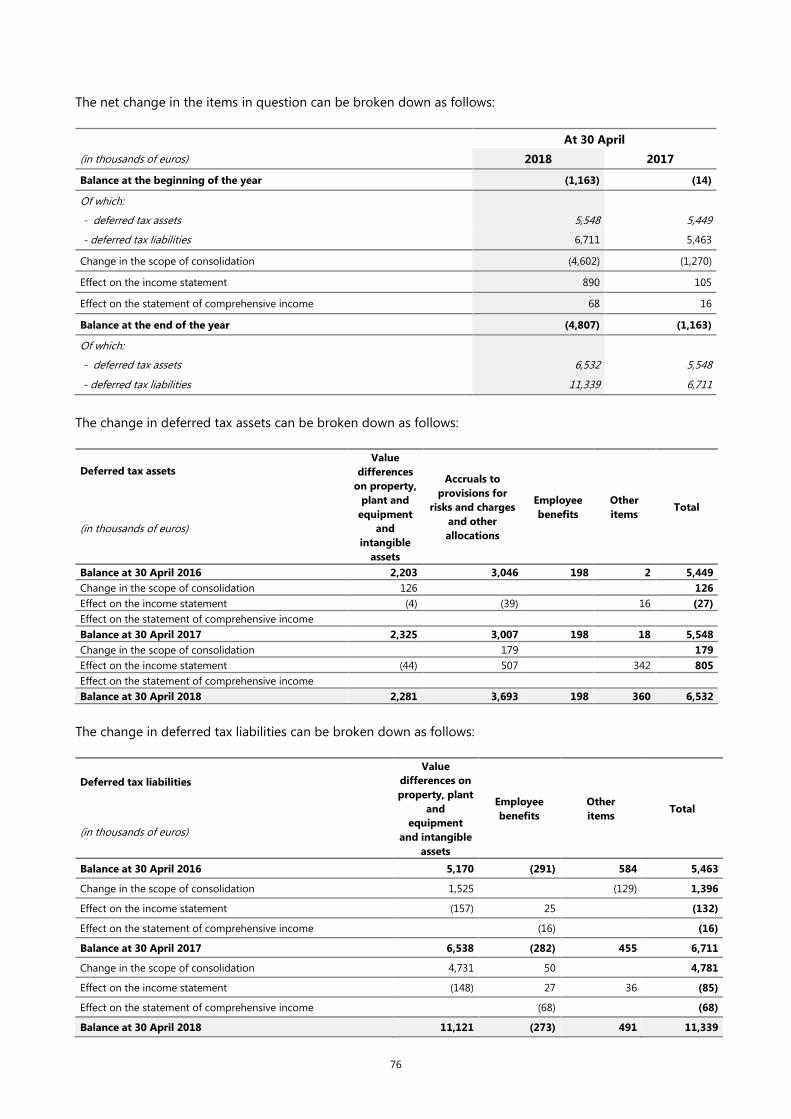
76
The net change in the items in question can be broken down as follows:
At 30 April
(in thousands of euros) 2018 2017
Balance at the beginning of the year (1,163) (14)
Of which:
- deferred tax assets 5,548 5,449
- deferred tax liabilities 6,711 5,463
Change in the scope of consolidation (4,602) (1,270)
Effect on the income statement 890 105
Effect on the statement of comprehensive income 68 16
Balance at the end of the year (4,807) (1,163)
Of which:
- deferred tax assets 6,532 5,548
- deferred tax liabilities 11,339 6,711
The change in deferred tax assets can be broken down as follows:
Deferred tax assets
Value
differences
on property,
plant and
equipment
and
intangible
assets
Accruals to
provisions for
risks and charges
and other
allocations
Employee
benefits
Other
items Total
(in thousands of euros)
Balance at 30 April 2016 2,203 3,046 198 2 5,449
Change in the scope of consolidation 126 126
Effect on the income statement (4) (39) 16 (27)
Effect on the statement of comprehensive income
Balance at 30 April 2017 2,325 3,007 198 18 5,548
Change in the scope of consolidation 179 179
Effect on the income statement (44) 507 342 805
Effect on the statement of comprehensive income
Balance at 30 April 2018 2,281 3,693 198 360 6,532
The change in deferred tax liabilities can be broken down as follows:
Deferred tax liabilities
Value
differences on
property, plant
and
equipment
and intangible
assets
Employee
benefits
Other
items Total
(in thousands of euros)
Balance at 30 April 2016 5,170 (291) 584 5,463
Change in the scope of consolidation 1,525 (129) 1,396
Effect on the income statement (157) 25 (132)
Effect on the statement of comprehensive income (16) (16)
Balance at 30 April 2017 6,538 (282) 455 6,711
Change in the scope of consolidation 4,731 50 4,781
Effect on the income statement (148) 27 36 (85)
Effect on the statement of comprehensive income (68) (68)
Balance at 30 April 2018 11,121 (273) 491 11,339
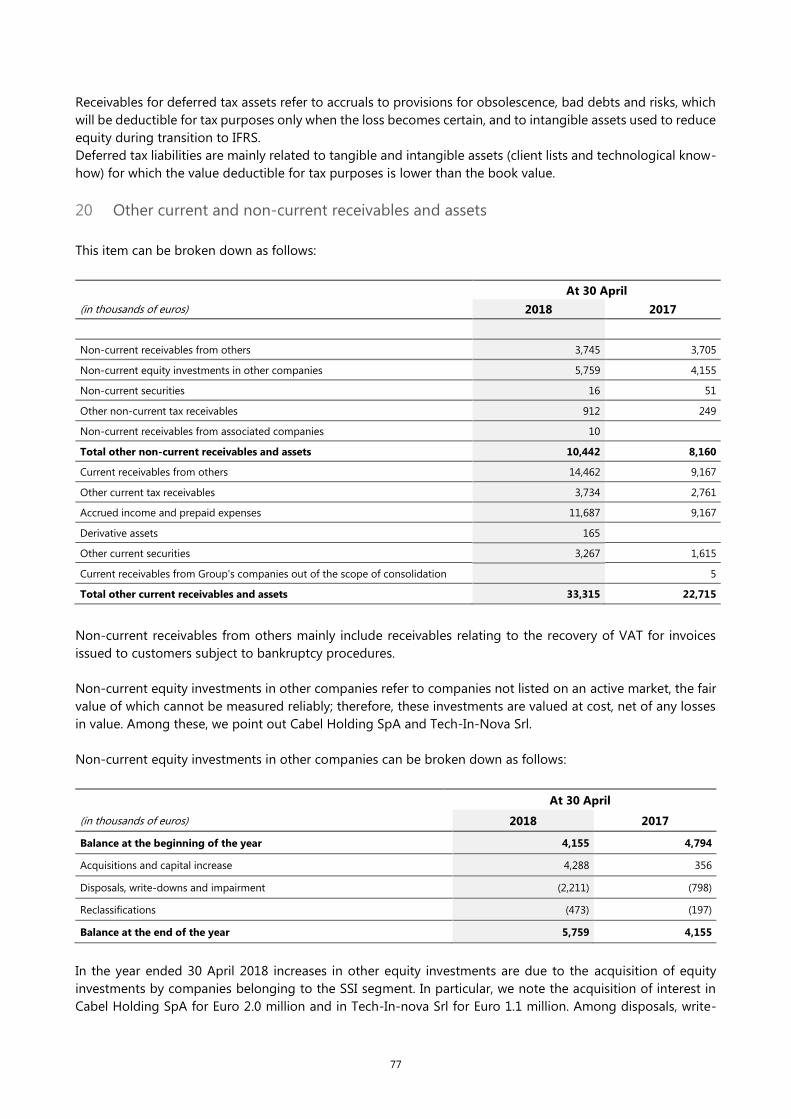
77
Receivables for deferred tax assets refer to accruals to provisions for obsolescence, bad debts and risks, which
will be deductible for tax purposes only when the loss becomes certain, and to intangible assets used to reduce
equity during transition to IFRS.
Deferred tax liabilities are mainly related to tangible and intangible assets (client lists and technological know-
how) for which the value deductible for tax purposes is lower than the book value.
20 Other current and non-current receivables and assets
This item can be broken down as follows:
At 30 April
(in thousands of euros) 2018 2017
Non-current receivables from others 3,745 3,705
Non-current equity investments in other companies 5,759 4,155
Non-current securities 16 51
Other non-current tax receivables 912 249
Non-current receivables from associated companies 10
Total other non-current receivables and assets 10,442 8,160
Current receivables from others 14,462 9,167
Other current tax receivables 3,734 2,761
Accrued income and prepaid expenses 11,687 9,167
Derivative assets 165
Other current securities 3,267 1,615
Current receivables from Group's companies out of the scope of consolidation 5
Total other current receivables and assets 33,315 22,715
Non-current receivables from others mainly include receivables relating to the recovery of VAT for invoices
issued to customers subject to bankruptcy procedures.
Non-current equity investments in other companies refer to companies not listed on an active market, the fair
value of which cannot be measured reliably; therefore, these investments are valued at cost, net of any losses
in value. Among these, we point out Cabel Holding SpA and Tech-In-Nova Srl.
Non-current equity investments in other companies can be broken down as follows:
At 30 April
(in thousands of euros) 2018 2017
Balance at the beginning of the year 4,155 4,794
Acquisitions and capital increase 4,288 356
Disposals, write-downs and impairment (2,211) (798)
Reclassifications (473) (197)
Balance at the end of the year 5,759 4,155
In the year ended 30 April 2018 increases in other equity investments are due to the acquisition of equity
investments by companies belonging to the SSI segment. In particular, we note the acquisition of interest in
Cabel Holding SpA for Euro 2.0 million and in Tech-In-nova Srl for Euro 1.1 million. Among disposals, write-

78
downs and impairments it should be noted the sale of the equity investment in Dedagroup SpA, previously
recorded for Euro 1.9 million with a gain of Euro 508 thousand.
21 Inventories
This item can be broken down as follows:
At 30 April
(in thousands of euros) 2018 2017
Finished products and goods for resale 65,243 57,813
Work in progress and semi-finished products 2,509 3,757
Total 67,752 61,570
Finished products and goods for resale were recognised net of the provision for write-down for obsolescence.
The related changes are reported in the table below.
Provision for
obsolescence of
finished products
and goods for
resale
((in thousands of euros)
Balance at 30 April 2017 1,406
Net changes (160)
Balance at 30 April 2018 1,246
22 Current trade receivables
This item can be broken down as follows:
At 30 April
(in thousands of euros) 2018 2017
Receivables from customers (*) 339,767 324,205
Provision for write-down of receivables from customers (**) (13,402) (12,381)
Receivables from customers, net of provision for bad debts 326,365 311,824
Receivables from associated companies 2,395 3,575
Total current trade receivables 328,760 315,399
(*) For the purposes of a better portrayal of receivables from customers, they are presented net of the balance
of customers subject to bankruptcy and composition with creditors proceedings which at 30 April 2018 was
equal to Euro 31,553 thousand, compared to Euro 28,789 thousand at 30 April 2017. These positions have been
fully written down via the booking of a specific provision.

79
The table below reports the change in the provision for bad debts:
Provision
for bad debts (in thousands of euros)
Balance at 30 April 2016 12,030
Allocation 4,848
Use and other changes (4,552)
Change in scope of consolidation 55
Balance at 30 April 2017 12,381
Allocation 6,858
Use and other changes (6,080)
Change in scope of consolidation 243
Balance at 30 April 2018 13,402
23 Cash and cash equivalents
This item can be broken down as follows:
At 30 April
(in thousands of euros) 2018 2017
Bank and postal deposits 247,137 191,620
Cheques 17 281
Cash 40 50
Total cash and cash equivalents 247,194 191,951
The following table shows the Group’s cash and cash equivalents by currency at 30 April 2018 and 30 April
2017:
At 30 April
(in thousands of euros) 2018 2017
Cash and cash equivalents in euros 246,961 190,258
Cash and cash equivalents in other currency 233 1,693
Total cash and cash equivalents 247,194 191,951

80
24 Equity
Share capital
At 30 April 2018 the Parent Company’s share capital, fully subscribed and paid-up, amounted to Euro 37,127
thousand and was divided into 15,494,590 ordinary shares, all of which were no-par-value shares. The Company
has no outstanding Warrants or shares other than ordinary ones.
The treasury shares held at 30 April 2018 are no. 38,712, equivalent to Euro 959 thousand.
The table below shows details of the changes during the year of the outstanding and treasury shares:
Number of shares
Balance at 30 April 2017
Issued shares 15,494,590
Treasury shares 44,383
Outstanding shares 15,450,207
Changes during the year
Assignment of shares in execution of the Stock Grant Plan 53,000
Purchase of treasury shares 47,329
Balance at 30 April 2018
Issued shares 15,494,590
Treasury shares 38,712
Outstanding shares 15,455,878
Below are the Shareholders who, at 30 April 2018, held a significant equity investment with voting right of the
share capital of the Issuer:
Declarer Direct Shareholder No. of shares with
voting right held
% on the total share
capital with voting
right
HSE S.p.A. ITH S.p.A. 8,183,323 52.814%
Franklin Templeton Institutional LLC Franklin Templeton Institutional LLC 753,000 4.860%
There are no other shareholders in addition to those mentioned above, with a significant equity investment
who informed Consob and Sesa SpA, pursuant to art. 117 of the Consob Regulation no. 11971/99 about the
obligation to notify any significant equity investments.
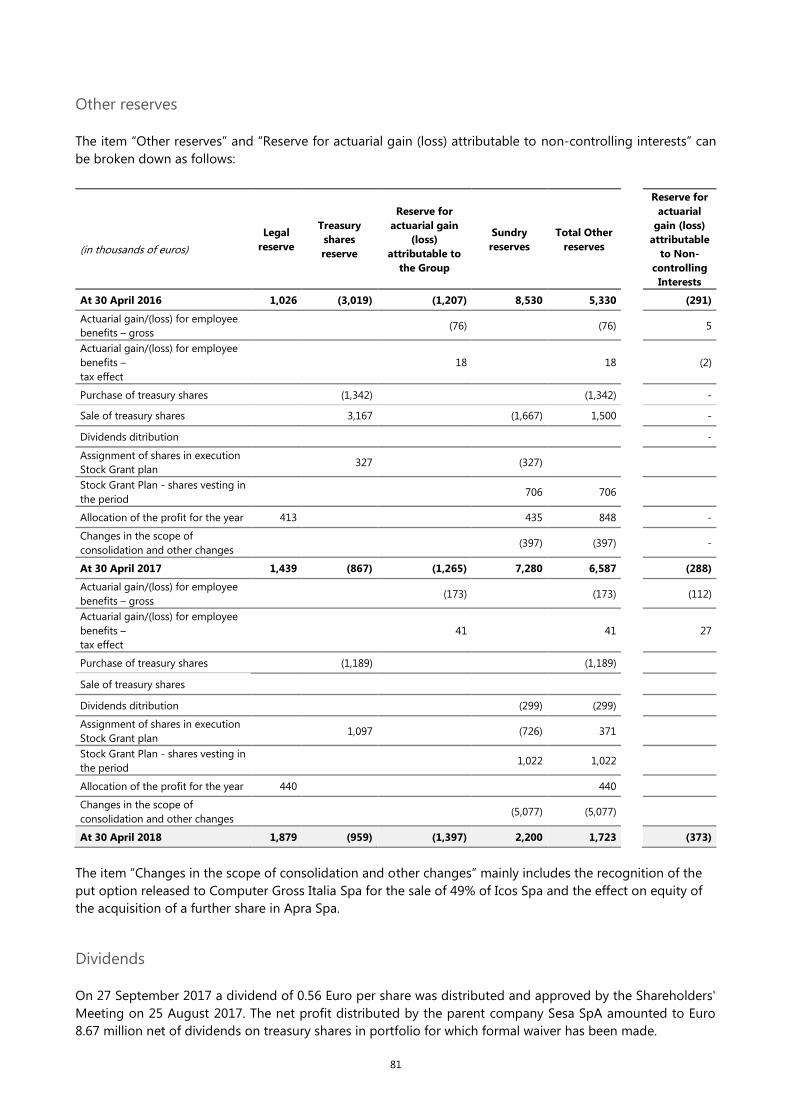
81
Other reserves
The item “Other reserves” and “Reserve for actuarial gain (loss) attributable to non-controlling interests” can
be broken down as follows:
Legal
reserve
Treasury
shares
reserve
Reserve for
actuarial gain
(loss)
attributable to
the Group
Sundry
reserves
Total Other
reserves
Reserve for
actuarial
gain (loss)
attributable
to Non-
controlling
Interests
(in thousands of euros)
At 30 April 2016 1,026 (3,019) (1,207) 8,530 5,330 (291)
Actuarial gain/(loss) for employee
benefits – gross (76) (76) 5
Actuarial gain/(loss) for employee
benefits –
tax effect
18 18 (2)
Purchase of treasury shares (1,342) (1,342) -
Sale of treasury shares 3,167 (1,667) 1,500 -
Dividends ditribution -
Assignment of shares in execution
Stock Grant plan 327 (327)
Stock Grant Plan - shares vesting in
the period 706 706
Allocation of the profit for the year 413 435 848 -
Changes in the scope of
consolidation and other changes (397) (397)
-
At 30 April 2017 1,439 (867) (1,265) 7,280 6,587 (288)
Actuarial gain/(loss) for employee
benefits – gross (173) (173) (112)
Actuarial gain/(loss) for employee
benefits –
tax effect
41 41 27
Purchase of treasury shares (1,189) (1,189)
Sale of treasury shares
Dividends ditribution (299) (299)
Assignment of shares in execution
Stock Grant plan 1,097 (726) 371
Stock Grant Plan - shares vesting in
the period 1,022 1,022
Allocation of the profit for the year 440 440
Changes in the scope of
consolidation and other changes (5,077) (5,077)
At 30 April 2018 1,879 (959) (1,397) 2,200 1,723 (373)
The item “Changes in the scope of consolidation and other changes” mainly includes the recognition of the
put option released to Computer Gross Italia Spa for the sale of 49% of Icos Spa and the effect on equity of
the acquisition of a further share in Apra Spa.
Dividends
On 27 September 2017 a dividend of 0.56 Euro per share was distributed and approved by the Shareholders'
Meeting on 25 August 2017. The net profit distributed by the parent company Sesa SpA amounted to Euro
8.67 million net of dividends on treasury shares in portfolio for which formal waiver has been made.
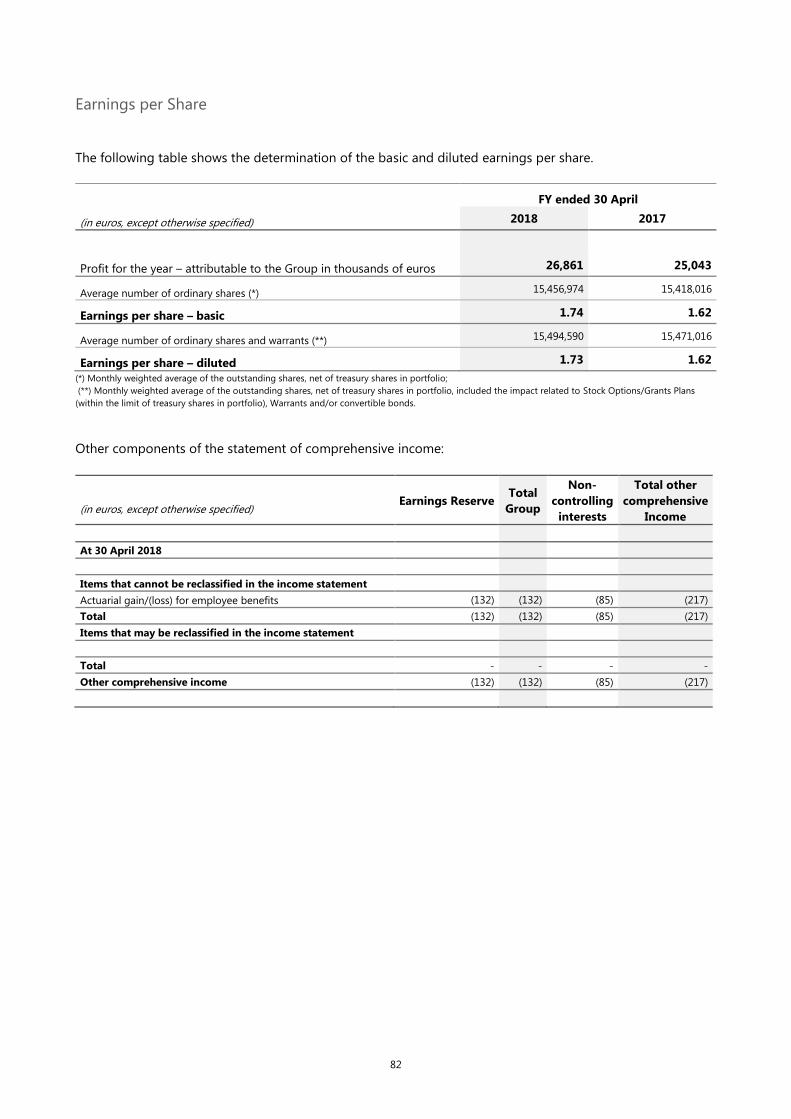
82
Earnings per Share
The following table shows the determination of the basic and diluted earnings per share.
FY ended 30 April
(in euros, except otherwise specified) 2018 2017
Profit for the year – attributable to the Group in thousands of euros 26,861 25,043
Average number of ordinary shares (*) 15,456,974 15,418,016
Earnings per share – basic 1.74 1.62
Average number of ordinary shares and warrants (**) 15,494,590 15,471,016
Earnings per share – diluted 1.73 1.62
(*) Monthly weighted average of the outstanding shares, net of treasury shares in portfolio; (**) Monthly weighted average of the outstanding shares, net of treasury shares in portfolio, included the impact related to Stock Options/Grants Plans
(within the limit of treasury shares in portfolio), Warrants and/or convertible bonds.
Other components of the statement of comprehensive income:
Earnings Reserve Total
Group
Non-
controlling
interests
Total other
comprehensive
Income (in euros, except otherwise specified)
At 30 April 2018
Items that cannot be reclassified in the income statement
Actuarial gain/(loss) for employee benefits (132) (132) (85) (217)
Total (132) (132) (85) (217)
Items that may be reclassified in the income statement
Total - - - -
Other comprehensive income (132) (132) (85) (217)

83
25 Current and non-current loans
This item at 30 April 2018 and 30 April 2017 can be broken down as follows:
At 30 April 2018 Within 12
months
Between 1 and
5 years Beyond 5 years Total
(in thousands of euros)
Long-term loans 44,164 109,050 153,214
Short-term loans 26,121 26,121
Advances received from factors 1,121 1,121
Finance lease liability 1298 5,504 8,618 15,420
Total 72,704 114,554 8,618 195,876
At 30 April 2017 Within 12
months
Between 1 and
5 years Beyond 5 years Total
(in thousands of euros)
Long-term loans 45,621 65,698 111,319
Short-term loans 9,021 9,021
Advances received from factors 4,787 4,787
Finance lease liability 1,449 4,622 10,798 16,869
Total 60,878 70,320 10,798 141,996
The table below summarises the main outstanding loans with a book value higher than Euro 5,000 thousand:
(in thousands of euros) At 30 April
Lending bank Initial
amount company
New
loan Expiry
Applied
rate
2018
of
which
current
2017
of
which
current
2016
of
which
current
BNL BNP Paribas S.p.A. 20,000
Computer
Gross Italia
S.p.A
May-17 May-20 Taeg 0.52% 20,000
Unicredit S.p.A. 10,000
Computer
Gross Italia
S.p.A
Apr-17 May-19 Taeg 0.75% 10,000 10,000
Banca MPS S.p.A. 10,000
Computer
Gross Italia
S.p.A
Apr-17 Jun-22 Taeg 0.51% 8,500 2,000 10,000 1,500
UBI Banca S.p.A. 10,000
Computer
Gross Italia
S.p.A
Jun-17 Jun-20 Euribor 3m +
0.57% 7,239 3,330
Banca MPS S.p.A. 10,000
Computer
Gross Italia
S.p.A
Nov-15 Dec-20 Euribor 6m +
1.10% 6,000 2,000 8,000 2,000 10,000 2,000
Banca CR Firenze
S.p.A.(Gruppo Intesa) 10,000
Computer
Gross Italia
S.p.A
Nov-15 Dec-20 Euribor 3m +
1.00% 5,500 2,000 7,500 2,000 9,500 2,000
CARIPARMA S.p.A. -
Credit Agricole 10,000
Var Group
S.p.A. May-16 May-20 Euribor 3m + 0.9% 5,654 2,504 8,144 2,490
BNL BNP Paribas S.p.A. 10,000 Var Group
S.p.A. May-17 May-19 Taeg 0.61% 10,000 5,000
Unicredit S.p.A. 10,000 Var Group
S.p.A. Dec-17 Dec-22
Euribor 3m +
1.10% 9,509 1,972
Banco BPM S.p.A. 10,000 Var Group
S.p.A. Mar-18 Mar-23
Euribor 3m +
0.75% 10,000 1,983
Banca MPS S.p.A. 8,000 Var Group
S.p.A. Dec-17 Dec-22 Euribor 6m + 0.5% 8,000 1,600
It should be noted that current loans do not include capital and / or financial covenants, but essentially
termination clauses in case of cross-default or change-of-control events with the following exception:

84
Euro 5.0 million (residual value Euro 4.3 million) signed by Computer Gross Italia SpA with Banca CR Firenze
on May 2017 (expiry 2022);
Euro 10.0 million (residual value Euro 5.5 million) signed by Computer Gross Italia SpA with Banca CR
Firenze on November 2015 (expiry 2020);
Euro 5.0 million (residual value Euro 4.3 million) signed by Var Group SpA with Banca CR Firenze on May
2017 (expiry 2022);
Euro 10.0 million (residual value Euro 10.0 million) signed by Var Group SpA with Banco BMP SpA on
March 2018 (expiry 2023).
The above parameters provide for compliance with certain Net Financial Position/Equity and/or Net Financial
Position/Ebitda on a consolidated basis. In the fiscal year ended 30 April 2018 those parameters were met.
The table below summarises the financial lease agreements of which the main ones were entered into with
Leasint SpA and refer to properties in Empoli owned by Computer Gross Italia SpA:
(in thousands of euros) At 30 April
Lending bank New lease
agreement Expiry 2018
of which
current 2017
of which
current 2016
of which
current
Leasint SpA Jan-17 Sep-25 7,880 689 8,552 671 8,801
Leasint SpA Sep-13 Sep-25 541 40 579 38 615 36
Leasint SpA Oct-10 Sep-25 6,516 484 6,990 475 7,456 466
Leasint SpA Dec-08 Oct-23 472 74 542 70 608 66
Dell Bank International Limited May-15 Jun-18 11 11 206 195 401 195
Total 15,420 1,298 16,869 1,449 17,881 763
The table below summarises the minimum payments for finance lease liabilities:
At 30 April
(in thousands of euros) 2018 2017
Minimum payments due
Within 12 months 1676 1861
Between 1 and 5 years 6,663 6,674
Beyond 5 years 9,025 10,691
17,364 19,226
Future financial charges -1,944 -2,357
Present value of finance lease liabilities 15,420 16,869
At 30 April 2018 and 30 April 2017, the Group’s financial debt was represented by loans raised in Euro.
A summary of the Group’s net financial position is shown below:
At 30 April
(in thousands of euros) 2018 2017
A. Cash 40 51
B. Cheques and bank and postal deposits 247,154 191,900
C. Securities held for trading -
D. Liquidity (A) + (B) + (C) 247,194 191,951
E. Current financial receivables 3,344 1,294
F. Current bank debts 27,242 13,808
G. Current portion of non-current debt 44,164 45,621
H. Other current financial payables 1,298 1,449

85
I. Current financial debt (F) + (G) + (H) 72,704 60,878
J. Net current financial debt (I) - (E) - (D) (177,834) (132,367)
K. Non-current bank debts 109,050 65,698
L. Bonds issued -
M. Other non-current payables 14,122 15,420
N. Non-current financial debt (K) + (L) + (M) 123,172 81,118
O. Net financial debt (J) + (N) (54,662) (51,249)
26 Employee Benefits
This item includes the provision relating to the staff severance pay (TFR) for the employees of the Group
companies.
The change in the item can be broken down as follows:
FY ended 30
April
(in thousands of euros) 2018 2017
Balance at the beginning of the year 17,427 15,836
Service cost 1,603 1,142
Interest on the obligation 228 205
Uses and advances (796) (729)
Actuarial loss/(gain) 284 107
Change in the scope of consolidation and purchase of corporate branches 1,749 866
Balance at the end of the year 20,495 17,427
The table below shows details of the actuarial calculation assumptions for the purposes of the determination
of defined-benefit pension plans:
At 30 April
(in thousands of euros) 2018 2017
Economic assumptions
Rate of inflation 1.50% 1.50%
Discount rate 1.44% 1.35%
Rate of increase in staff severance pay (TFR) 2.63% 2.63%
As regards the discount rate, reference has been made to the iBoxx Eurozone Corporates AA index with
duration 10+ as at the various valuation dates, commensurate with the residual average term of the staff
subject to assessment.
Sensitivity analysis
According to IAS 19R, a sensitivity analysis was carried out when the main actuarial assumptions used in the
calculation model changed. In detail, the most significant assumptions, meaning the average annual discount
rate, the average annual rate of inflation and the turnover rate, were increased and decreased by half a
percentage point, a quarter of a percentage point and two percentage points, respectively.
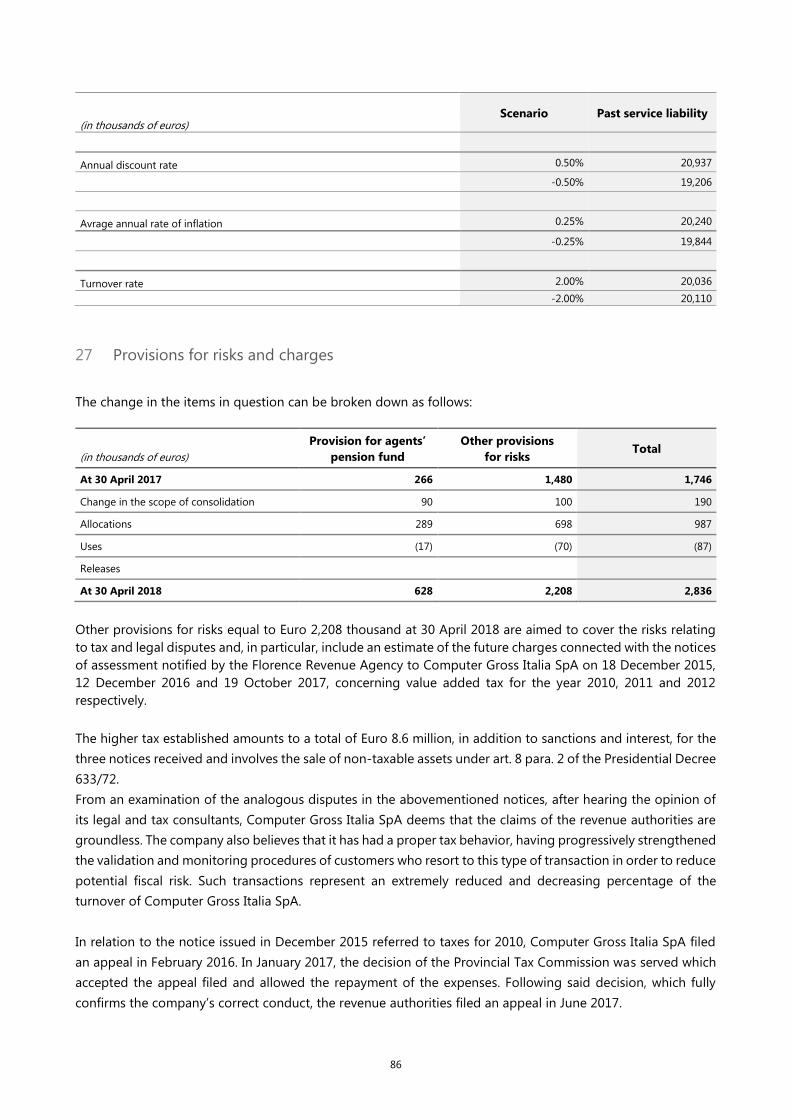
86
Scenario Past service liability
(in thousands of euros)
Annual discount rate 0.50% 20,937
-0.50% 19,206
Avrage annual rate of inflation 0.25% 20,240
-0.25% 19,844
Turnover rate 2.00% 20,036
-2.00% 20,110
27 Provisions for risks and charges
The change in the items in question can be broken down as follows:
Provision for agents’
pension fund
Other provisions
for risks Total
(in thousands of euros)
At 30 April 2017 266 1,480 1,746
Change in the scope of consolidation 90 100 190
Allocations 289 698 987
Uses (17) (70) (87)
Releases
At 30 April 2018 628 2,208 2,836
Other provisions for risks equal to Euro 2,208 thousand at 30 April 2018 are aimed to cover the risks relating
to tax and legal disputes and, in particular, include an estimate of the future charges connected with the notices
of assessment notified by the Florence Revenue Agency to Computer Gross Italia SpA on 18 December 2015,
12 December 2016 and 19 October 2017, concerning value added tax for the year 2010, 2011 and 2012
respectively.
The higher tax established amounts to a total of Euro 8.6 million, in addition to sanctions and interest, for the
three notices received and involves the sale of non-taxable assets under art. 8 para. 2 of the Presidential Decree
633/72.
From an examination of the analogous disputes in the abovementioned notices, after hearing the opinion of
its legal and tax consultants, Computer Gross Italia SpA deems that the claims of the revenue authorities are
groundless. The company also believes that it has had a proper tax behavior, having progressively strengthened
the validation and monitoring procedures of customers who resort to this type of transaction in order to reduce
potential fiscal risk. Such transactions represent an extremely reduced and decreasing percentage of the
turnover of Computer Gross Italia SpA.
In relation to the notice issued in December 2015 referred to taxes for 2010, Computer Gross Italia SpA filed
an appeal in February 2016. In January 2017, the decision of the Provincial Tax Commission was served which
accepted the appeal filed and allowed the repayment of the expenses. Following said decision, which fully
confirms the company’s correct conduct, the revenue authorities filed an appeal in June 2017.

87
In relation to the notices referred to taxes for 2011 and 2012, the appeal filed by Computer Gross Italia SpA,
which is based on the same assumptions of the appeal won for 2010, is pending with the Provincial
Commission.
It is also stated that at the date of the preparation of this Annual Report, the above is the only tax claim of
insignificant amount for all the Sesa Group companies.
28 Other current liabilities
This item can be broken down as follows:
At 30 April
(in thousands of euros) 2018 2017
Accrued expenses and deferred income 27,348 19,006
Tax payables 4,865 6,599
Payables to personnel 13,085 10,934
Other payables 3,193 5,322
Payables to social security institutions 2,796 2,408
Advances from customers 9,493 5,260
Derivative liabilities 77
Total other current liabilities 60,780 49,606
29 Other information
Potential Liabilities
We are not aware of the existence of additional tax disputes or proceedings able to have a material impact on
the Group's economic and financial position with the exception of the tax disputes mentioned above in Note
27 - Provisions for risks and charges.
Other information
There is no further information to underline.
Commitments
At 30 April 2018 the Group did not undertake commitments which were not recognised in the accounts.
Fees due to Directors and Statutory Auditors
Details of fees due to the parent company Directors and Statutory Auditors are given below, gross of welfare
charges and taxes paid by Sesa SpA and the other Group’s companies for the year. For a full description and
analysis of the fees due to Directors, Statutory Auditors and Executives with strategic responsibilities, please
refer to the Remuneration Report available for consultation at the head office and on the company website, in
the “Corporate Governance” section.

88
FY ended 30 April
(in thousands of euros) 2018
Fees due to Directors
640
Fees due to Statutory Auditors 68
The fees to Directors reported in the table include fixed and variable amounts, as well as those due for
participation in internal committees. They do not include amounts to be paid to directors and shares assigned
under the stock grant plan approved by the Shareholders' Meeting on 25 August 2017. In relation to the stock
grant plan at 30 April 2018 42,000 shares matured.
To gain an organic picture of the fees and payments disbursed to the corporate bodies, please refer to the
Remuneration Report.
Fees due to Independent Auditors
The following statement, drawn up in compliance with article 149-duodecies of the Consob Issuers’
Regulations, highlights the payments related to the year ended 30 April 2018 for auditing and other services
rendered by the Independent Auditors and by organisations belonging to their network, including expenses.
Service Entity providing the
service Recipient
Fees for the year ended 30 April
2018
(Thousands of euros)
Audit PwC Parent company Sesa SpA 99
Audit PwC Subsidiaries 180
The amounts include fees, out-of-pocket expenses and the supervisory fee. At 30 April 2018 no services other
than the audit were rendered by Indipendent Audiotors or by the organisations belonging to its network.

89
30 Transactions with Related Parties
Relations maintained by the Group with associated and parent companies are mainly of a commercial nature
and mainly concern the purchase and sale of hardware and software materials and their related technical
assistance.
The Company believes that all relations maintained with related parties are substantially regulated on the basis
of standard market conditions.
The table below shows details of the financial balances with related parties at 30 April 2018 and 30 April 2017:
Associated
companies
Parent
companies
Top
management
Other
related
parties
Total
Effect on the
balance-
sheet item (in thousands of euros)
Current trade receivables
At 30 April 2018 2,648 3 1 23 2,675 0.81%
At 30 April 2017 3,529 5 1 30 3,565 1.13%
Other current receivables and assets
At 30 April 2018 93 93 0.29%
At 30 April 2017 198 198 0.87%
Employee benefits
At 30 April 2018 123 123 0.60%
At 30 April 2017 108 108 0.62%
Payables to suppliers
At 30 April 2018 1,477 28 1,505 0.51%
At 30 April 2017 1,905 83 1,988 0.73%
Other current liabilities
At 30 April 2018 311 177 488 0.79%
At 30 April 2017 375 140 515 1.04%
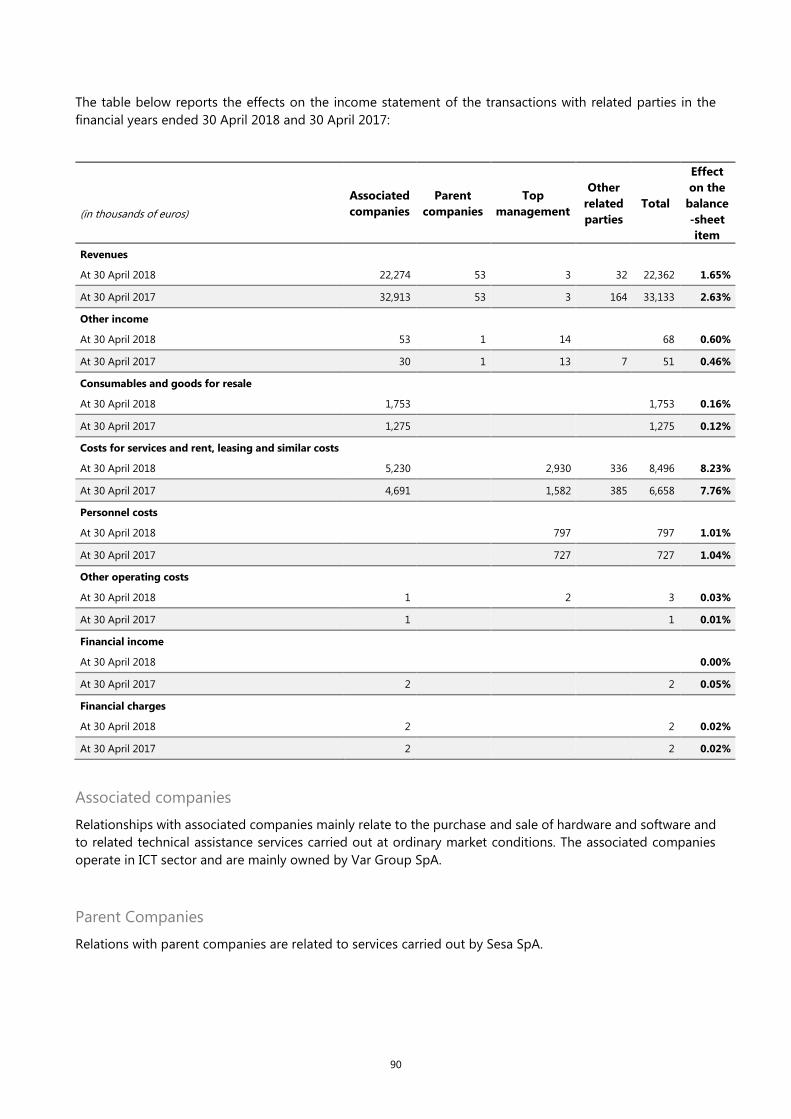
90
The table below reports the effects on the income statement of the transactions with related parties in the
financial years ended 30 April 2018 and 30 April 2017:
Associated
companies
Parent
companies
Top
management
Other
related
parties
Total
Effect
on the
balance
-sheet
item
(in thousands of euros)
Revenues
At 30 April 2018 22,274 53 3 32 22,362 1.65%
At 30 April 2017 32,913 53 3 164 33,133 2.63%
Other income
At 30 April 2018 53 1 14 68 0.60%
At 30 April 2017 30 1 13 7 51 0.46%
Consumables and goods for resale
At 30 April 2018 1,753 1,753 0.16%
At 30 April 2017 1,275 1,275 0.12%
Costs for services and rent, leasing and similar costs
At 30 April 2018 5,230 2,930 336 8,496 8.23%
At 30 April 2017 4,691 1,582 385 6,658 7.76%
Personnel costs
At 30 April 2018 797 797 1.01%
At 30 April 2017 727 727 1.04%
Other operating costs
At 30 April 2018 1 2 3 0.03%
At 30 April 2017 1 1 0.01%
Financial income
At 30 April 2018 0.00%
At 30 April 2017 2 2 0.05%
Financial charges
At 30 April 2018 2 2 0.02%
At 30 April 2017 2 2 0.02%
Associated companies
Relationships with associated companies mainly relate to the purchase and sale of hardware and software and
to related technical assistance services carried out at ordinary market conditions. The associated companies
operate in ICT sector and are mainly owned by Var Group SpA.
Parent Companies
Relations with parent companies are related to services carried out by Sesa SpA.

91
Top management
Relations with top management mainly relate to the fees due to directors and executives with strategic
responsibilities, as well as to their close relatives. In particular, “personnel costs” include the remuneration of
directors and executives with strategic responsibilities as wage-earning employee, while “costs for service and
rent, leasing and similar costs” include fees due as company directors.
Other related parties
Relations with other related parties, which are mainly companies in which statutory auditors or directors of the
controlling companies of Sesa SpA hold equity invetments, relate to commercial activities regulated under
standard market conditions.
31 Events After the Year-end
No significant events occurred after the end of the year at 30 April 2018.
32 Authorization for publication
Publication of the Sesa Group’s consolidated financial statements as at 30 April 2018 was authorised by
resolution of the Board of Directors on 12 July 2018.
92
Attestation of the Consolidated Financial Statements pursuant to art. 154-bis
of Italian Legislative Decree no. 58/98
1. The undersigned Paolo Castellacci, in his capacity as Chairman of the Board of Directors, and
Alessandro Fabbroni, in his capacity as Financial Reporting Manager of Sesa S.p.A’s accounting
documents certify, also taking into account that envisaged by article 154‐bis, paragraphs 3 and 4 of
Legislative Decree no. 58 of 24 February 1998:
The adequacy in relation to the enterprise characteristics and
the effective application of the administrative and accounting procedures for the preparation of the
consolidated financial statements at 30 April 2018.
2. No important aspects emerged from the application of the administrative and accounting procedures
for the preparation of the consolidated financial statements at 30 April 2018.
3. It is also certified that:
3.1 The consolidated financial statements:
a) are drawn up in compliance with the applicable international accounting standards recognised in
the European Community, pursuant to EC regulation no. 1606/2002 of the European Parliament and
the Council, dated 19 July 2002;
b) correspond to the company accounts, books and records;
c) offer a true and fair representation of the financial position, result of operations and cash flows of
the issuer and of the group of companies included within the scope of consolidation.
3.2 the Report on Operations includes a reliable analysis of the performance and of the operating result
as well as of the situation of the issuer and of the group of companies included within the scope of
consolidation, together with a description of the main risks and uncertainties to which they are
exposed.
Empoli, 12 July 2018
Paolo Castellacci Alessandro Fabbroni
Chairman of the Board of Directors Financial Reporting Manager

93
Independent Auditor’s Report on the Consolidated Financial Statements of the
Sesa Group

94
95

96
97
98

99
Annex 1
Subsidiary Companies
Owned by Company Registered
Office
Share
capital in Euro
Ownership percentage
at 30 April
2018 2017
VAR GROUP SRL 365ONLINE S.r.l. Empoli (Florence) 100,650 100.0% 100.0%
VAR GROUP DIGITAL SRL AFB NET SRL Ponte San Giovanni
(Perugia) 15,790 62.0% 62.0%
APRA SPA AGENZIA SENZA NOME SRL Jesi (Ancona) 25,000 75.0% 75.0%
VAR GROUP SPA APRA SPA Jesi (Ancona) 150,000 71.3% 60.0%
SESA SPA ARCIPELAGO CLOUD SRL Empoli (Florence) 50,000 100.0% 100.0%
VAR GROUP SPA BMS SPA Milan 1,000,000 51.0% 51.0%
TECH VALUE SRL CCSTEAM SRL Roncade (Treviso) 50,000 100.0% n.a.
APRA SPA CENTRO 3 CAD SRL Jesi (Ancona) 10,000 80.0% 80.0%
COMPUTER GROSS ITALIA
SPA
COMPUTER GROSS ACCADIS
SRL Rome 100,000 51.0% 51.0%
SESA SPA COMPUTER GROSS ITALIA SPA Empoli (Florence) 40,000,000 100.0% 100.0%
COMPUTER GROSS ITALIA
SPA COMPUTER GROSS NESSOS SRL Empoli (Florence) 52,000 60.0% 60.0%
VAR GROUP SRL VAR GROUP NORD OVEST SRL Genoa 10,000 100.0% 100.0%
VAR GROUP SPA COSESA SRL Empoli (Florence) 15,000 100.0% 100.0%
VAR GROUP SPA DELTA PHI SIGLA SRL Empoli (Florence) 99,000 100.0% 100.0%
VAR GROUP SPA GLOBO INFORMATICA SRL Druento (Turin) 10,200 57.5% 57.5%
COMPUTER GROSS ITALIA
SPA ICOS SPA Ferrara 500,000 51.0% n.a.
COMPUTER GROSS ITALIA
SPA ICT LOGISTICA SRL Empoli (Florence) 775,500
66.7% 33.3%
VAR GROUP SPA 33.3% 33.3%
SESA SPA IDEA POINT SRL Empoli (Florence) 10,000 100.0% 100.0%
MY SMART SERVICES SRL VAR SERVICE SRL Empoli (Florence) 66,263
52.6% 55.4%
M.F. SERVICES SRL 2.8% 3.0%
COMPUTER GROSS ITALIA
SPA COLLABORATION VALUE SRL Empoli (Florence) 104,000 58.0% 100.0%
COMPUTER GROSS ITALIA
SPA ITF SRL Empoli (Florence) 100,000 100.0% 100.0%
VAR GROUP SPA LEONET SRL Empoli (Florence) 60,000 100.0% 100.0%
MY SMART SERVICES SRL M.F. SERVICES SRL Campagnola Emilia (Reggio
Emilia) 118,000 70.0% 70.0%
VAR GROUP SPA MY SMART SERVICES SRL Empoli (Florence) 20,000 100.0% 100.0%
SIRIO INFORMATICA E
SISTEMI SPA PANTHERA SRL Milan 16,920
89.4% n.a.
VAR GROUP SPA 10.6% n.a.
VAR GROUP SPA VAR EVOLUTION SRL Empoli (Florence) 10,000 70.0% 70.0%
VAR GROUP SPA VAR GROUP DIGITAL SRL Empoli (Florence) 10,400 100.0% 100.0%
VAR GROUP SPA SAILING SRL Reggio Emilia 10,000 51.0% 51.0%
VAR ONE SRL SYNERGY SRL Carpi (Modena) 10,400 51.0% 51.0%
VAR GROUP SPA SIRIO INFORMATICA E SISTEMI
SPA Milan 1,020,000 51.0% 51.0%
TECH VALUE SRL TECH IN NOVA SRL Roncade (Treviso) 12,000 100.0% n.a.
VAR GROUP SPA TECH VALUE SRL Milan 308,504 51.0% n.a.
TECH VALUE SRL TECH VALUE IBERICA SRL Milan 50,000 100.0% n.a.

100
TECH VALUE IBERICA SRL TECH VALUE DELS PIRINEUS S.L. Andorra La Valle (AND) 3,000 100% n.a.
VAR GROUP SPA VAR COM SRL Empoli (Florence) 26,786 56.0% 51.0%
VAR GROUP SRL VAR ALDEBRA SRL Rimini
223,325
50.5%
50.5%
VAR GROUP SRL VAR ENGINEERING SRL Empoli (Florence) 50,000
63.0% 63.0%
VAR ALDEBRA SRL 15.0% 15.0%
AFB NET SRL VAR GROUP CENTRO SRL Rome 12,000 91.7% n.a.
SESA SPA VAR GROUP SPA Empoli (Florence) 3,800,000 100.0% 100.0%
VAR GROUP SPA VAR GROUP SRL Empoli (Florence) 100,000 100.0% 100.0%
LEONET SRL VAR ITT SRL Empoli (Florence) 392,272
50.0% n.a.
VAR GROUP SPA 15.0% n.a.
VAR GROUP SPA VAR ONE SRL Empoli (Florence) 248,535 64.9% 65.3%
VAR GROUP SPA VAR PRIME SRL Empoli (Florence) 136,402 51.8% 51.0%
SIRIO INFORMATICA E
SISTEMI SPA VAR SIRIO INDUSTRIA SRL Milan 165,000 54.6% 54.6%
VAR GROUP SRL VAR TECH SRL Empoli (Florence) 22,000 n.a. 71.8%
VAR GROUP SPA YARIX SRL Montebelluna (Treviso) 30,000 50.0% 50.0%
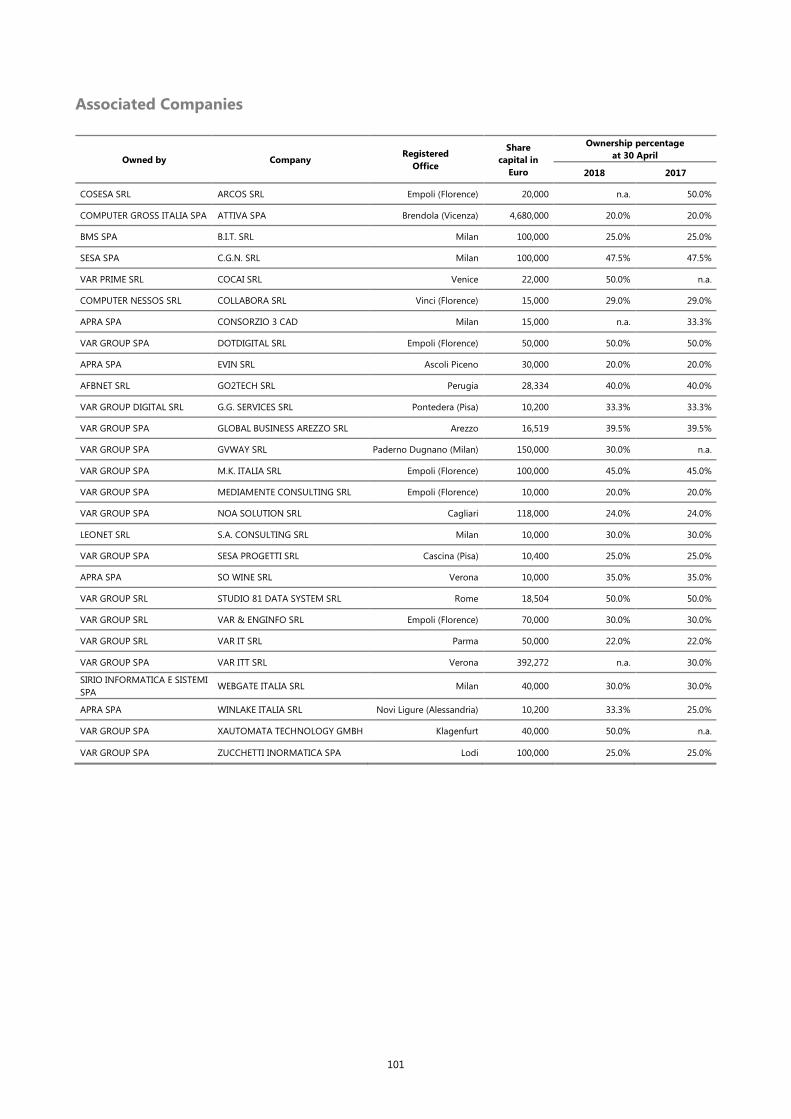
101
Associated Companies
Owned by Company Registered
Office
Share
capital in
Euro
Ownership percentage
at 30 April
2018 2017
COSESA SRL ARCOS SRL Empoli (Florence) 20,000 n.a. 50.0%
COMPUTER GROSS ITALIA SPA ATTIVA SPA Brendola (Vicenza) 4,680,000 20.0% 20.0%
BMS SPA B.I.T. SRL Milan 100,000 25.0% 25.0%
SESA SPA C.G.N. SRL Milan 100,000 47.5% 47.5%
VAR PRIME SRL COCAI SRL Venice 22,000 50.0% n.a.
COMPUTER NESSOS SRL COLLABORA SRL Vinci (Florence) 15,000 29.0% 29.0%
APRA SPA CONSORZIO 3 CAD Milan 15,000 n.a. 33.3%
VAR GROUP SPA DOTDIGITAL SRL Empoli (Florence) 50,000 50.0% 50.0%
APRA SPA EVIN SRL Ascoli Piceno 30,000 20.0% 20.0%
AFBNET SRL GO2TECH SRL Perugia 28,334 40.0% 40.0%
VAR GROUP DIGITAL SRL G.G. SERVICES SRL Pontedera (Pisa) 10,200 33.3% 33.3%
VAR GROUP SPA GLOBAL BUSINESS AREZZO SRL Arezzo 16,519 39.5% 39.5%
VAR GROUP SPA GVWAY SRL Paderno Dugnano (Milan) 150,000 30.0% n.a.
VAR GROUP SPA M.K. ITALIA SRL Empoli (Florence) 100,000 45.0% 45.0%
VAR GROUP SPA MEDIAMENTE CONSULTING SRL Empoli (Florence) 10,000 20.0% 20.0%
VAR GROUP SPA NOA SOLUTION SRL Cagliari 118,000 24.0% 24.0%
LEONET SRL S.A. CONSULTING SRL Milan 10,000 30.0% 30.0%
VAR GROUP SPA SESA PROGETTI SRL Cascina (Pisa) 10,400 25.0% 25.0%
APRA SPA SO WINE SRL Verona 10,000 35.0% 35.0%
VAR GROUP SRL STUDIO 81 DATA SYSTEM SRL Rome 18,504 50.0% 50.0%
VAR GROUP SRL VAR & ENGINFO SRL Empoli (Florence) 70,000 30.0% 30.0%
VAR GROUP SRL VAR IT SRL Parma 50,000 22.0% 22.0%
VAR GROUP SPA VAR ITT SRL Verona 392,272 n.a. 30.0%
SIRIO INFORMATICA E SISTEMI
SPA WEBGATE ITALIA SRL Milan 40,000 30.0% 30.0%
APRA SPA WINLAKE ITALIA SRL Novi Ligure (Alessandria) 10,200 33.3% 25.0%
VAR GROUP SPA XAUTOMATA TECHNOLOGY GMBH Klagenfurt 40,000 50.0% n.a.
VAR GROUP SPA ZUCCHETTI INORMATICA SPA Lodi 100,000 25.0% 25.0%
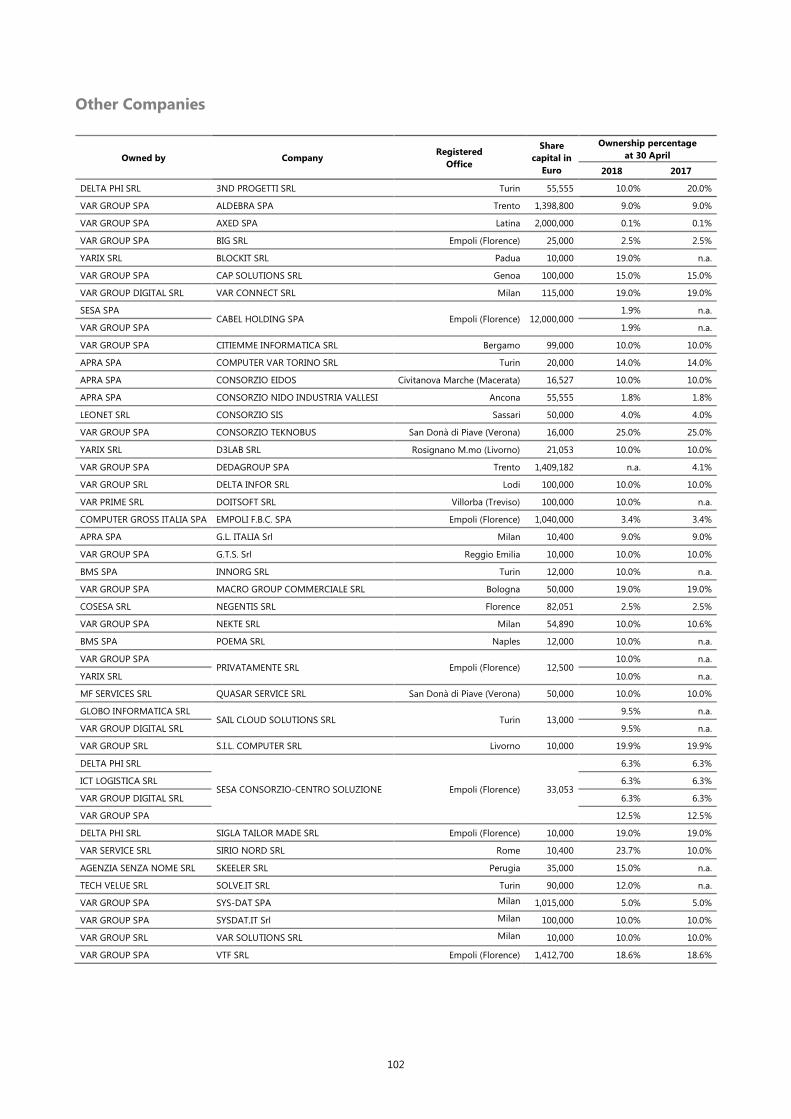
102
Other Companies
Owned by Company Registered
Office
Share
capital in
Euro
Ownership percentage
at 30 April
2018 2017
DELTA PHI SRL 3ND PROGETTI SRL Turin 55,555 10.0% 20.0%
VAR GROUP SPA ALDEBRA SPA Trento 1,398,800 9.0% 9.0%
VAR GROUP SPA AXED SPA Latina 2,000,000 0.1% 0.1%
VAR GROUP SPA BIG SRL Empoli (Florence) 25,000 2.5% 2.5%
YARIX SRL BLOCKIT SRL Padua 10,000 19.0% n.a.
VAR GROUP SPA CAP SOLUTIONS SRL Genoa 100,000 15.0% 15.0%
VAR GROUP DIGITAL SRL VAR CONNECT SRL Milan 115,000 19.0% 19.0%
SESA SPA CABEL HOLDING SPA Empoli (Florence) 12,000,000
1.9% n.a.
VAR GROUP SPA 1.9% n.a.
VAR GROUP SPA CITIEMME INFORMATICA SRL Bergamo 99,000 10.0% 10.0%
APRA SPA COMPUTER VAR TORINO SRL Turin 20,000 14.0% 14.0%
APRA SPA CONSORZIO EIDOS Civitanova Marche (Macerata) 16,527 10.0% 10.0%
APRA SPA CONSORZIO NIDO INDUSTRIA VALLESI Ancona 55,555 1.8% 1.8%
LEONET SRL CONSORZIO SIS Sassari 50,000 4.0% 4.0%
VAR GROUP SPA CONSORZIO TEKNOBUS San Donà di Piave (Verona) 16,000 25.0% 25.0%
YARIX SRL D3LAB SRL Rosignano M.mo (Livorno) 21,053 10.0% 10.0%
VAR GROUP SPA DEDAGROUP SPA Trento 1,409,182 n.a. 4.1%
VAR GROUP SRL DELTA INFOR SRL Lodi 100,000 10.0% 10.0%
VAR PRIME SRL DOITSOFT SRL Villorba (Treviso) 100,000 10.0% n.a.
COMPUTER GROSS ITALIA SPA EMPOLI F.B.C. SPA Empoli (Florence) 1,040,000 3.4% 3.4%
APRA SPA G.L. ITALIA Srl Milan 10,400 9.0% 9.0%
VAR GROUP SPA G.T.S. Srl Reggio Emilia 10,000 10.0% 10.0%
BMS SPA INNORG SRL Turin 12,000 10.0% n.a.
VAR GROUP SPA MACRO GROUP COMMERCIALE SRL Bologna 50,000 19.0% 19.0%
COSESA SRL NEGENTIS SRL Florence 82,051 2.5% 2.5%
VAR GROUP SPA NEKTE SRL Milan 54,890 10.0% 10.6%
BMS SPA POEMA SRL Naples 12,000 10.0% n.a.
VAR GROUP SPA PRIVATAMENTE SRL Empoli (Florence) 12,500
10.0% n.a.
YARIX SRL 10.0% n.a.
MF SERVICES SRL QUASAR SERVICE SRL San Donà di Piave (Verona) 50,000 10.0% 10.0%
GLOBO INFORMATICA SRL SAIL CLOUD SOLUTIONS SRL Turin 13,000
9.5% n.a.
VAR GROUP DIGITAL SRL 9.5% n.a.
VAR GROUP SRL S.I.L. COMPUTER SRL Livorno 10,000 19.9% 19.9%
DELTA PHI SRL
SESA CONSORZIO-CENTRO SOLUZIONE Empoli (Florence) 33,053
6.3% 6.3%
ICT LOGISTICA SRL 6.3% 6.3%
VAR GROUP DIGITAL SRL 6.3% 6.3%
VAR GROUP SPA 12.5% 12.5%
DELTA PHI SRL SIGLA TAILOR MADE SRL Empoli (Florence) 10,000 19.0% 19.0%
VAR SERVICE SRL SIRIO NORD SRL Rome 10,400 23.7% 10.0%
AGENZIA SENZA NOME SRL SKEELER SRL Perugia 35,000 15.0% n.a.
TECH VELUE SRL SOLVE.IT SRL Turin 90,000 12.0% n.a.
VAR GROUP SPA SYS-DAT SPA Milan 1,015,000 5.0% 5.0%
VAR GROUP SPA SYSDAT.IT Srl Milan 100,000 10.0% 10.0%
VAR GROUP SRL VAR SOLUTIONS SRL Milan 10,000 10.0% 10.0%
VAR GROUP SPA VTF SRL Empoli (Florence) 1,412,700 18.6% 18.6%
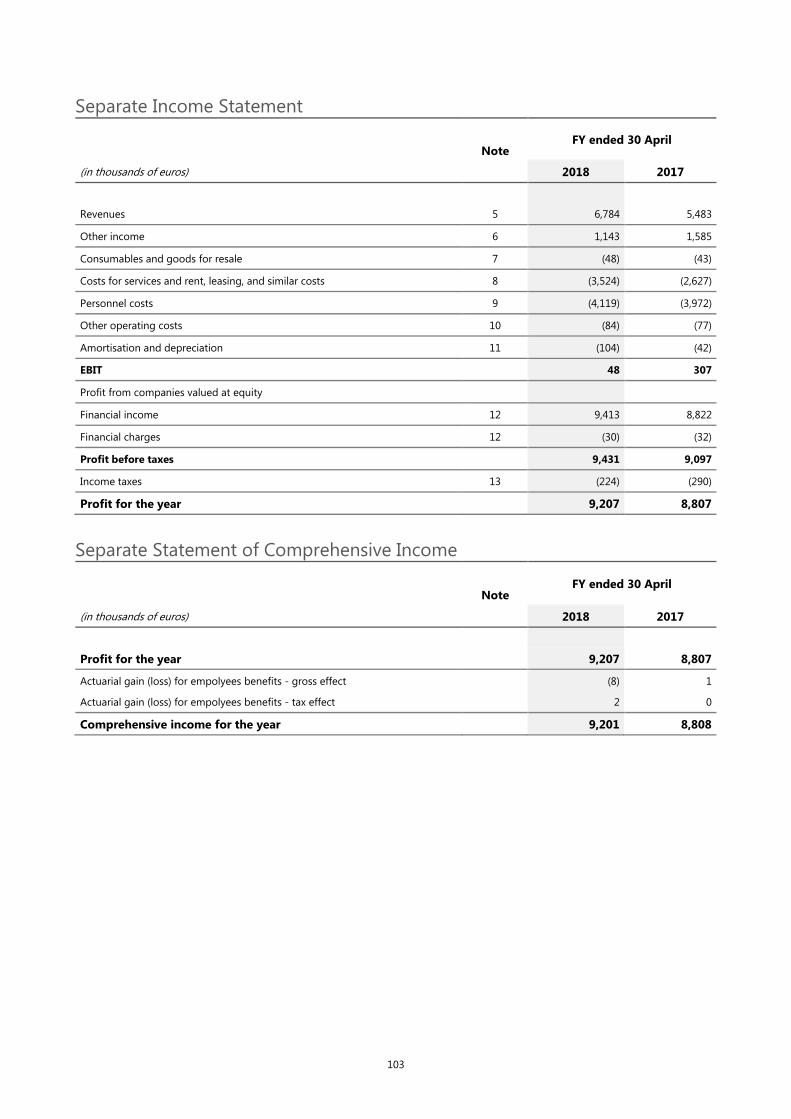
103
Separate Income Statement
Note
FY ended 30 April
(in thousands of euros) 2018 2017
Revenues 5 6,784 5,483
Other income 6 1,143 1,585
Consumables and goods for resale 7 (48) (43)
Costs for services and rent, leasing, and similar costs 8 (3,524) (2,627)
Personnel costs 9 (4,119) (3,972)
Other operating costs 10 (84) (77)
Amortisation and depreciation 11 (104) (42)
EBIT 48 307
Profit from companies valued at equity
Financial income 12 9,413 8,822
Financial charges 12 (30) (32)
Profit before taxes 9,431 9,097
Income taxes 13 (224) (290)
Profit for the year 9,207 8,807
Separate Statement of Comprehensive Income
Note
FY ended 30 April
(in thousands of euros) 2018 2017
Profit for the year 9,207 8,807
Actuarial gain (loss) for empolyees benefits - gross effect
(8) 1
Actuarial gain (loss) for empolyees benefits - tax effect 2 0
Comprehensive income for the year 9,201 8,808

104
Separate Statement of Financial Position
Note
At 30 April
(in thousands of euros) 2018 2017
Intangible assets 14 59 70
Property, plant and equipment 15 352 322
Investment property 16 289 289
Equity investments 17 68,241 68,241
Deferred tax assets 18 258 187
Other non-current receivables and assets 19 1,051 44
Total non-current assets 70,250 69,153
Current trade receivables 20 859 675
Current tax receivables 236 1,916
Other current receivables and assets 19 7,827 10,131
Cash and cash equivalents 8,056 8,284
Total current assets 16,978 21,006
Total assets 87,228 90,159
Share capital 21 37,127 37,127
Share premium reserve 33,144 33,144
Other reserves 21 3,500 3,161
Profits carried forward 9,207 8,807
Total Equity 82,978 82,239
Non-current loans 23
Employee benefits 24 1,268 1,146
Non-current provisions 25
Deferred tax liabilities 18 1
Total non-current liabilities 1,269 1,146
Current loans 23
Payables to suppliers 431 409
Current tax payables 9
Other current liabilities 26 2,541 6,365
Total current liabilities 2,981 6,774
Total liabilities 4,250 7,920
Total equity and liabilities 87,228 90,159

105
Separate Statement of Cash Flows
Note FY ended 30 April
(in thousands of euros) 2018 2017
Profit before taxes 9,431 9,097
Adjustments for:
Amortisation and depreciation 11 104 42
Provisions for personnel and other provisions 24 118 113
Net financial (income)/charges 12 (9,383) (8,804)
Profit from companies valued at equity
Other non-monetary items 1,393 706
Cash flows generated from operating activities before changes in net working
capital 1,663 1,154
Change in inventories
Change in trade receivables 20 (184) 427
Change in payables to suppliers 22 78
Change in other assets 19 2,304 4,771
Change in other liabilities 26 (3,824) (2,855)
Use of provisions for risks
Payment of employee benefits 24 (21) (68)
Change in deferred taxes 2
Change in current tax payables and receivables 1,636 (1,954)
Interest paid (13)
Taxes paid (241) (12)
Net cash flow generated from operating activities 1,344 1,541
Investments in companies, net of acquired cash
Investments in property, plant and equipment 15 (117) (319)
Investments in intangible assets 14 (6) (63)
Investments in non-current financial assets (1,007)
Disposals of non-current financial assets 4
Disbusrement of loans (1,500)
Dividends collected 9,364 8,750
Interest collected 49 72
Net cash flow generated from/(used in) investing activities 8,283 6,944
Repayments of financial assets
(Decrease)/increase in short-term loans
Treasury shares 21 (1,189) 158
Capital increase and/or shareholders payment
Change in equity
Dividends ditribution (8,666) (7,408)
Net cash flow generated from/(used in) financing activities (9,855) (7,250)
Translation difference on cash and cash equivalents
Cash and cash equivalents of assets held for sale
Change in cash and cash equivalents (228) 1,235
Cash and cash equivalents at the beginning of the year 8,284 7,049
Cash and cash equivalents at the end of the year 8,056 8,284
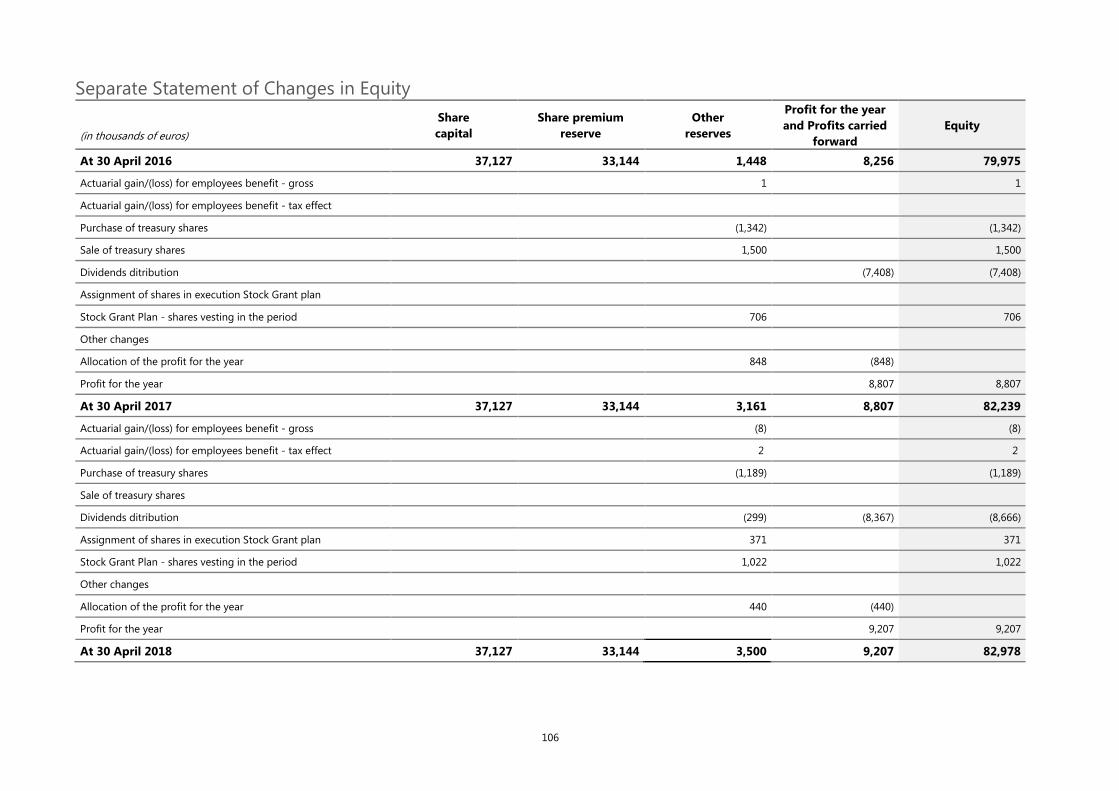
106
Separate Statement of Changes in Equity
Share
capital
Share premium
reserve
Other
reserves
Profit for the year
and Profits carried
forward
Equity (in thousands of euros)
At 30 April 2016 37,127 33,144 1,448 8,256 79,975
Actuarial gain/(loss) for employees benefit - gross 1 1
Actuarial gain/(loss) for employees benefit - tax effect
Purchase of treasury shares (1,342) (1,342)
Sale of treasury shares 1,500 1,500
Dividends ditribution (7,408) (7,408)
Assignment of shares in execution Stock Grant plan
Stock Grant Plan - shares vesting in the period 706 706
Other changes
Allocation of the profit for the year 848 (848)
Profit for the year 8,807 8,807
At 30 April 2017 37,127 33,144 3,161 8,807 82,239
Actuarial gain/(loss) for employees benefit - gross (8) (8)
Actuarial gain/(loss) for employees benefit - tax effect 2 2
Purchase of treasury shares (1,189) (1,189)
Sale of treasury shares
Dividends ditribution (299) (8,367) (8,666)
Assignment of shares in execution Stock Grant plan 371 371
Stock Grant Plan - shares vesting in the period 1,022 1,022
Other changes
Allocation of the profit for the year 440 (440)
Profit for the year 9,207 9,207
At 30 April 2018 37,127 33,144 3,500 9,207 82,978

107
Explanatory Notes to the Separate Financial Statements
1 General Information
Sesa SpA is a company that has been incorporated and is domiciled in Italy, with registered office in Empoli,
at Via Piovola no. 138, and is organised according to the legal system of the Italian Republic.
Sesa SpA is the parent company of the Sesa Group and provides administrative and financial services,
namely organisation, planning and management control, manages IT systems and human resources on
behalf of subsidiaries and also acts as a holding company, mainly as regards companies operating in the
ICT sector.
In particular, Sesa SpA is the company resulting from the merger of the pre-merger Sesa SpA into Made in
Italy 1 SpA that was the first special purpose acquisition company (so-called “SPAC”) established in Italy. On
1 February 2013, the merger of the pre-merger Sesa S.p.A. into Made in Italy 1 became effective and at the
same time, the company name was changed from “Made in Italy 1 SpA” to “Sesa SpA”.
Sesa SpA is an Italian company with shares listed on the Italian Stock Exchange - MTA market, STAR
segment.
This document was approved by the Company’s Board of Directors on 12 July 2018.
2 Summary of Accounting Policies
Below are reported the main accounting policies and standards applied in the preparation of these separate
financial statements for the financial year ended 30 April 2018.
2.1 Basis of Preparation
The Separate Financial Statements at 30 April 2018 were prepared in accordance with International Financial
Reporting Standards (“IFRS”) issued by the International Accounting Standards Board (“IASB”) and adopted
by the European Union, as well as with the provisions implementing Article 9 of Legislative Decree no.
38/2005. The designation “IFRS” also includes all the revised International Accounting Standards (“IAS”), as
well as all interpretations issued by the International Financial Reporting Interpretations Committee
(“IFRIC”), and by the formerly Standing Interpretations Committee (“SIC”).
These separate financial statements present the comparative data at 30 April 2017 that were prepared in
compliance with the same standards.
The Separate Financial Statements were prepared on a going-concern basis, since the Directors verified that
there were no financial or operating indicators, or indicators of any other kind, that suggested the existence
of any doubts regarding the Company’s ability to meet its obligations in the foreseeable future and in
particular in the next 12 months. The procedures through which the Company manages financial risks are
described in note 3 “Financial risk management” below.
The Separate Financial Statements were prepared and presented in Euro, which is the currency of the
primary economic environment in which the Company operates. All amounts included in this document are
expressed in thousands of euros, except as otherwise specified.

108
Below are specified the financial statement schedules and the related classification criteria adopted by the
Group, within the scope of the options envisaged in IAS 1 Presentation of financial statements:
• The Statement of financial position was prepared by classifying assets and liabilities according to the
criterion of “current/non-current” items;
• The Income Statement was prepared by classifying operating costs by nature;
• The Statement of comprehensive income includes the profit for the year arising from the income
statement, as well as any other changes in equity attributable to transactions that have not been carried
out with the Company’s shareholders;
• The Statement of Cash Flows was prepared by reporting cash flows from operating activities according
to the “indirect method”.
The Separate Financial Statements were prepared according to the conventional historical cost method,
except for the measurement of financial assets and liabilities, in cases in which it is mandatory to apply the
fair value criterion.
2.2 Accounting policies
Below are summarised the most significant accounting standards and policies used for the preparation of
the Separate Financial Statements.
PROPERTY, PLANT AND EQUIPMENT
Property, plant and equipment are entered at their purchase or production cost, net of accumulated
depreciation and impairment losses (if any). Purchase or production cost includes any costs directly
sustained in preparing the assets for their use, as well as any dismantling or removal costs that are to be
incurred as a result of contractual obligations that require the asset to be restored to its original condition.
Any borrowing costs directly attributable to the acquisition, construction or production of qualifying assets
are capitalized and depreciated on the basis of the useful life of the asset to which they refer.
Any costs of day-to-day and/or periodic maintenance and repairs are recognised in the income statement
when incurred. Costs related to the enlargement, modernisation or improvement of owned or leased
structural elements are capitalised within the limits to which they meet the requirements for being classified
separately as assets or parts of an asset. Any asset recognised in relation to leasehold improvements is
depreciated on the basis of the lease term, or on the basis of the specific useful life of the asset, if lower.
Depreciation is calculated on a straight-line basis by applying rates that allow the assets concerned to be
depreciated until the end of their useful life. When the asset being depreciated is composed of distinctly
identifiable elements whose useful lives differ significantly from those of the other parts of the asset, the
depreciation is carried out separately for each of such parts, in the application of the "component approach"
method.
Below is reported the indicative useful life estimated for the various categories of property, plant and
equipment:
Class of property, plant and equipment Useful life in
years
Buildings 33
Furniture and furnishings 8
Office machines 5
Motor vehicles 4
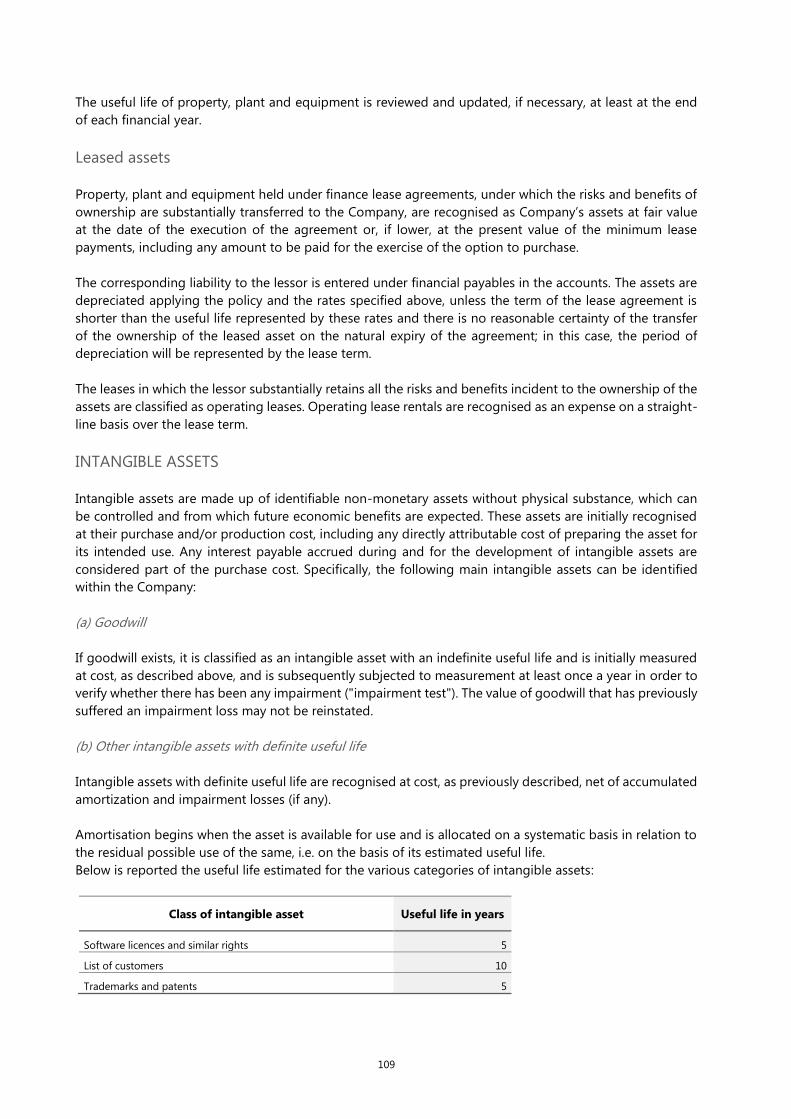
109
The useful life of property, plant and equipment is reviewed and updated, if necessary, at least at the end
of each financial year.
Leased assets
Property, plant and equipment held under finance lease agreements, under which the risks and benefits of
ownership are substantially transferred to the Company, are recognised as Company’s assets at fair value
at the date of the execution of the agreement or, if lower, at the present value of the minimum lease
payments, including any amount to be paid for the exercise of the option to purchase.
The corresponding liability to the lessor is entered under financial payables in the accounts. The assets are
depreciated applying the policy and the rates specified above, unless the term of the lease agreement is
shorter than the useful life represented by these rates and there is no reasonable certainty of the transfer
of the ownership of the leased asset on the natural expiry of the agreement; in this case, the period of
depreciation will be represented by the lease term.
The leases in which the lessor substantially retains all the risks and benefits incident to the ownership of the
assets are classified as operating leases. Operating lease rentals are recognised as an expense on a straight-
line basis over the lease term.
INTANGIBLE ASSETS
Intangible assets are made up of identifiable non-monetary assets without physical substance, which can
be controlled and from which future economic benefits are expected. These assets are initially recognised
at their purchase and/or production cost, including any directly attributable cost of preparing the asset for
its intended use. Any interest payable accrued during and for the development of intangible assets are
considered part of the purchase cost. Specifically, the following main intangible assets can be identified
within the Company:
(a) Goodwill
If goodwill exists, it is classified as an intangible asset with an indefinite useful life and is initially measured
at cost, as described above, and is subsequently subjected to measurement at least once a year in order to
verify whether there has been any impairment ("impairment test"). The value of goodwill that has previously
suffered an impairment loss may not be reinstated.
(b) Other intangible assets with definite useful life
Intangible assets with definite useful life are recognised at cost, as previously described, net of accumulated
amortization and impairment losses (if any).
Amortisation begins when the asset is available for use and is allocated on a systematic basis in relation to
the residual possible use of the same, i.e. on the basis of its estimated useful life.
Below is reported the useful life estimated for the various categories of intangible assets:
Class of intangible asset Useful life in years
Software licences and similar rights 5
List of customers 10
Trademarks and patents 5

110
The useful life of intangible assets is reviewed and updated, if necessary, at least at the end of each financial
year.
INVESTMENT PROPERTY
Properties held to earn rentals or for capital appreciation are classified under “Investment Property”; they
are measured at their purchase or production cost, as increased by additional costs (if any), net of
accumulated depreciation and impairment losses (if any).
IMPAIRMENT OF INTANGIBLE ASSETS, PROPERTY, PLANT AND EQUIPMENT AND OF
INVESTMENT PROPERTY
(a) Goodwill
As previously mentioned, if goodwill exists, it is subjected to an impairment test once a year or more
frequently when there are indications of possible impairment. No goodwill was recognised at 30 April 2018.
If goodwill exists, the impairment test is conducted on each of the "Cash Generating Units" ("CGU") to which
goodwill has been allocated. Any impairment of goodwill is recognised in the event that the recoverable
value of the same is lower than the carrying amount. Recoverable value means the higher of fair value of
the CGU, net of costs of disposal, and the related value in use, i.e. the present value of estimated future cash
flows from this asset. In measuring value in use, the expected future cash flows are discounted by using a
pre-tax discount rate that reflects current market assessments of the time value of money, compared to the
investment period and to the risks specific to the asset.
In the event that the impairment loss arising from the impairment test exceeds the value of the goodwill
allocated to the CGU, any residual excess is allocated to the assets included in the CGU in proportion to
their carrying amount. This allocation should not be reduced below the highest of:
• the asset’s fair value, less costs of disposal;
• the value in use, as defined above;
• zero.
The original carrying amount of goodwill may not be reinstated when the reasons that led to its impairment
no longer exist.
(b) Assets (intangible assets, property, plant and equipment and investment property) with definite useful
life
An assessment is carried out on each reporting date to verify whether there are indications that property,
plant and equipment, intangible assets and investment property may have incurred an impairment loss. For
this purpose, both external and internal sources of information may be made use of. Among the former
(internal sources), consideration is given to the obsolescence or physical deterioration of the asset or
significant changes in the use of the asset, if any, and its economic performance in comparison with
expectations. Among external sources of information, consideration is given to trends in the asset’s market
price or possible adverse changes in technology, the market or legislation, the trend in market interest rates
or the cost of capital used to assess investments.
If such indications are found to exist, the recoverable value of the asset is estimated and the write-down (if
any) with respect to its carrying amount is recognised in the income statement. The recoverable value of an
asset is represented by the higher of fair value, net of additional costs to sell, and the related value in use,
i.e. the present value of estimated future cash flows from this asset. In measuring value in use, the expected
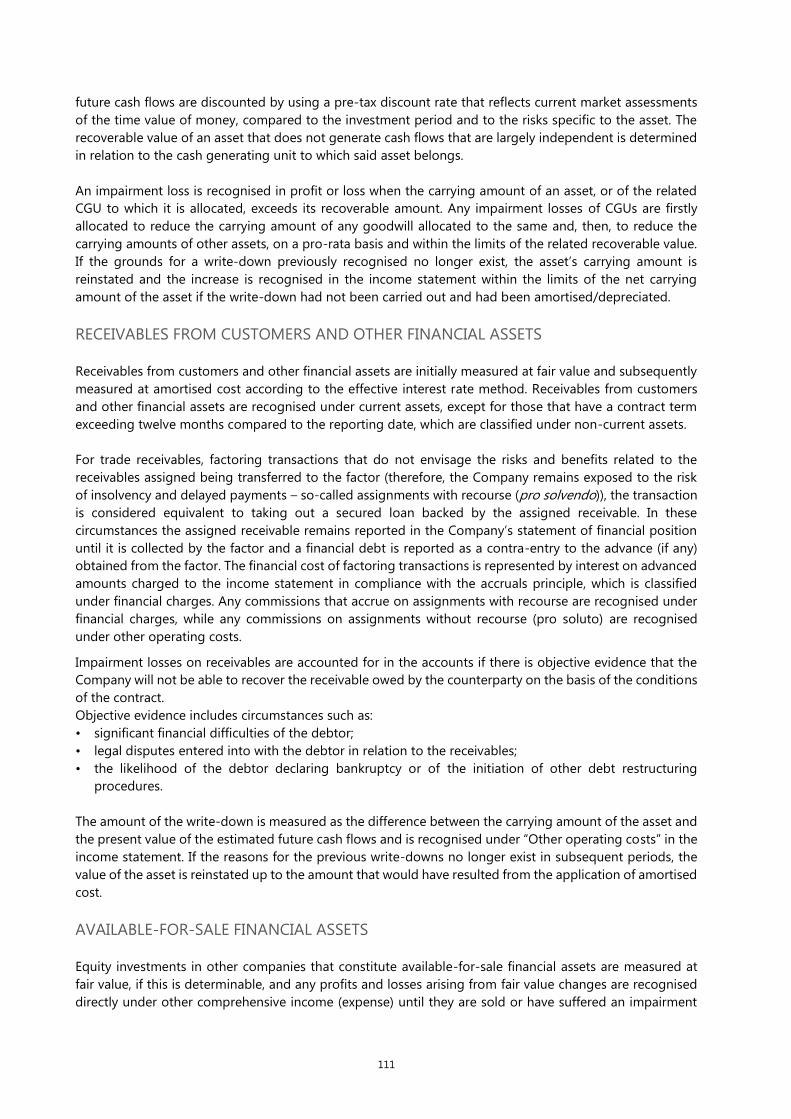
111
future cash flows are discounted by using a pre-tax discount rate that reflects current market assessments
of the time value of money, compared to the investment period and to the risks specific to the asset. The
recoverable value of an asset that does not generate cash flows that are largely independent is determined
in relation to the cash generating unit to which said asset belongs.
An impairment loss is recognised in profit or loss when the carrying amount of an asset, or of the related
CGU to which it is allocated, exceeds its recoverable amount. Any impairment losses of CGUs are firstly
allocated to reduce the carrying amount of any goodwill allocated to the same and, then, to reduce the
carrying amounts of other assets, on a pro-rata basis and within the limits of the related recoverable value.
If the grounds for a write-down previously recognised no longer exist, the asset’s carrying amount is
reinstated and the increase is recognised in the income statement within the limits of the net carrying
amount of the asset if the write-down had not been carried out and had been amortised/depreciated.
RECEIVABLES FROM CUSTOMERS AND OTHER FINANCIAL ASSETS
Receivables from customers and other financial assets are initially measured at fair value and subsequently
measured at amortised cost according to the effective interest rate method. Receivables from customers
and other financial assets are recognised under current assets, except for those that have a contract term
exceeding twelve months compared to the reporting date, which are classified under non-current assets.
For trade receivables, factoring transactions that do not envisage the risks and benefits related to the
receivables assigned being transferred to the factor (therefore, the Company remains exposed to the risk
of insolvency and delayed payments – so-called assignments with recourse (pro solvendo)), the transaction
is considered equivalent to taking out a secured loan backed by the assigned receivable. In these
circumstances the assigned receivable remains reported in the Company’s statement of financial position
until it is collected by the factor and a financial debt is reported as a contra-entry to the advance (if any)
obtained from the factor. The financial cost of factoring transactions is represented by interest on advanced
amounts charged to the income statement in compliance with the accruals principle, which is classified
under financial charges. Any commissions that accrue on assignments with recourse are recognised under
financial charges, while any commissions on assignments without recourse (pro soluto) are recognised
under other operating costs.
Impairment losses on receivables are accounted for in the accounts if there is objective evidence that the
Company will not be able to recover the receivable owed by the counterparty on the basis of the conditions
of the contract.
Objective evidence includes circumstances such as:
• significant financial difficulties of the debtor;
• legal disputes entered into with the debtor in relation to the receivables;
• the likelihood of the debtor declaring bankruptcy or of the initiation of other debt restructuring
procedures.
The amount of the write-down is measured as the difference between the carrying amount of the asset and
the present value of the estimated future cash flows and is recognised under “Other operating costs” in the
income statement. If the reasons for the previous write-downs no longer exist in subsequent periods, the
value of the asset is reinstated up to the amount that would have resulted from the application of amortised
cost.
AVAILABLE-FOR-SALE FINANCIAL ASSETS
Equity investments in other companies that constitute available-for-sale financial assets are measured at
fair value, if this is determinable, and any profits and losses arising from fair value changes are recognised
directly under other comprehensive income (expense) until they are sold or have suffered an impairment
112
loss; at that time, other comprehensive income (expense) previously recognised under equity is charged to
the income statement for the period.
Any other unlisted equity investments classified under “available-for-sale financial assets”, the fair value of
which cannot be measured reliably, are valued at cost adjusted by any impairment losses, which are
recognised in the income statement, as required by IAS 39.
Any dividends received from equity investments in other companies are recognised under financial income.
CASH AND CASH EQUIVALENTS
Cash and cash equivalents include cash, available bank deposits and the other forms of short-term
investment with an original maturity of three months or fewer. Any items entered under cash and cash
equivalents are measured at fair value and the related changes are recognised through profit or loss.
NON-CURRENT ASSETS HELD FOR SALE
Any non-current assets whose carrying amount will be recovered mainly through its sale, rather than
through its continuous use, are classified as held for sale and are recognised separately from other assets
in the statement of financial position. This condition is deemed to have been fulfilled when sale is highly
probable and the asset or group of assets being disposed of is available for immediate sale in its or their
present condition.
Non-current assets held for sale are not amortised/depreciated and are measured at the lower of carrying
amount and the related fair value, less costs to sell.
A discontinued operation is a part of an enterprise that has been disposed of or classified as held for sale
and (i) is an important branch of business or geographical area of business; (ii) is part of a coordinated plan
for the disposal of an important branch of business or geographical area of business; or (iii) a subsidiary
acquired exclusively in order to be sold.
The results from discontinued operations are recognised separately in the income statement, net of tax
effects. The corresponding values posted in the previous financial year, if any, are reclassified and
recognised separately in the income statement, net of tax effects, for comparative purposes.
FINANCIAL PAYABLES
Financial payables are initially recognised at fair value, net of any directly-attributable additional costs, and
subsequently are measured at amortised cost, applying the effective interest rate method. If there is a
change in estimated expected cash flows, the value of the liabilities is recalculated to reflect this change on
the basis of the present value of the new expected cash flows and the effective initially determined internal
rate. Financial payables are classified under current liabilities, except those due by contract more than twelve
months beyond the reporting date and those whose payment the Company has an unconditional right to
defer for at least twelve months after the reporting date.
Financial payables are accounted for at the trade date and are derecognised at the time when they are
discharged and when the Company has transferred all risks and charges related to the instrument itself.
DERIVATIVE INSTRUMENTS
113
Derivatives are valued as securities held for trading and measured at fair value through profit or loss and
are classified under other current and non-current assets or liabilities.
Financial assets and liabilities through profit or loss are initially recognised and subsequently measured at
fair value and the related additional costs are expensed immediately in the income statement. Any profits
and losses arising from fair value changes in derivatives on exchange rates are reported under financial
income and financial charges in the income statement, in the period when they are recognised.
EMPLOYEE BENEFITS
Short-term benefits are made up of salaries, wages, related social security contributions, allowance in lieu
of paid annual leave and incentives paid out in the form of bonuses payable in the twelve months from the
reporting date. These benefits are accounted for as components of personnel costs in the period when
service is rendered. Under defined-benefit plans, which also include the severance pay due to employees
pursuant to article 2120 of the Italian Civil Code (“TFR”, Trattamento di Fine Rapporto), the amount of the
benefit payable to the employee can be quantified only after the termination of the employment
relationship, and is linked to one or more factors, such as age, length of service and compensation;
therefore, the related charge is recognised in the relevant income statement on the basis of an actuarial
calculation. The liability recognised for defined-benefit plans corresponds to the present value of the
obligation at the reporting date.
Obligations for defined-benefit plans are determined by an independent actuary on an annual basis, by
using the projected unit credit method. The present value of defined-benefit plans is determined by
discounting future cash flows at an interest rate equal to that of (high-quality corporate) bonds issued in
Euro and which reflects the duration of the related pension plan. Any actuarial gains and losses arising from
the abovementioned adjustments and any changes in actuarial assumptions are charged to the statement
of comprehensive income.
On 1 January 2007 the so-called 2007 Finance Act and the relative implementing decrees introduced
substantial amendments to the regulations governing staff severance pay, among which the possibility for
the workers to choose where to send their accrued entitlement. In particular, workers may send the new
TFR flows to selected pension funds or retain them in their company. If the TFR is transferred to pension
funds, the company is only liable to pay a defined contribution to the chosen fund and from that date the
newly-accrued contributions have the nature of defined-contribution plans that are not subjected to
actuarial measurement.
STOCK GRANT PLAN
As provided for in IFRS 2 - Share-Based Payment, the total amount of the present value of stock grant at
the date of assignment is recognised wholly in profit or loss under employee costs, with a counter entry
recognised directly in shareholders’ equity. If a “maturity period” is required, in which certain conditions are
necessary before grantees become holders of the right (achievement of objectives), the cost for payments,
determined on the basis of the present value of the shares at the date of assignment, is recognised under
employee costs on a straight line basis for the period between the date of assignment and maturity, with a
counter entry directly recognised in shareholders’ equity.
PROVISIONS FOR RISKS AND CHARGES
Provisions for risks and charges are recognised for losses and charges of a determinate nature, whose
existence is certain or probable, but whose amount and/or timing are uncertain. The provision is recognised
114
only when there is a present, legal or constructive obligation entailing a future outflow of resources as the
result of past events and it is probable that the outflow will be necessary in order to settle the obligation.
Such amount is the best estimate of the expenditure required to settle the obligation. The rate used in
determining the present value of the liabilities reflects the current market conditions and takes account of
the specific risk attached to each liability.
When the financial effect of timing is significant and the dates of the payment of the obligation can be
estimated reliably, provisions are measured at the present value of the expected outflow of funds, using a
rate that reflects market conditions, variations in the cost of money over time and the specific risk attached
to the obligation. Any increase in the provision, determined by changes in the time value of money, is
accounted for as an interest expense.
Risks for which a liability is only possible are mentioned in the appropriate section on contingent liabilities
and for the same no provision has been set aside.
PAYABLES TO SUPPLIERS AND OTHER LIABILITIES
Payables to suppliers and other liabilities are initially measured at fair value, net of any directly-attributable
additional costs, and subsequently are measured at amortised cost, applying the effective interest rate
method.
EARNINGS PER SHARE
(a) Earnings per share - basic
Basic earnings per share are calculated by dividing the net profit attributable to the Company by the
weighted average number of ordinary shares outstanding during the financial year, excluding own shares.
(b) Earnings per share – diluted
Diluted earnings per share are calculated by dividing the net profit attributable to the Company by the
weighted average number of ordinary shares outstanding during the financial year, excluding own shares.
For the purposes of the calculation of diluted earnings per share, the weighted average of outstanding
shares is changed by assuming the exercise by all the assignees of rights that potentially have a dilutive
effect, while the net profit attributable to the Company is adjusted to take account of effects (if any), net of
taxes, of the exercise of said rights.
TREASURY SHARES
Treasury shares are recognised as a reduction in equity. The initial cost of treasury shares and any revenues
arising from subsequent sales (if any) are recognised as changes in equity.
REVENUE RECOGNITION
Revenue is measured at the fair value of the consideration received for the sale of goods and services in the
ordinary operations of the Company’s business. Revenue is recognised net of added-value tax, expected
returns, rebates, discounts and some marketing activities carried out with the help of the customers, whose
value is a function of the revenues themselves.
Revenues from the sale of products are recognised when the risks and rewards related to the ownership of
the asset are transferred to the buyer and when the sale price has been agreed and can be determined and
is expected to be collected.
COST RECOGNITION

115
Costs are recognised when they relate to goods and services acquired or consumed in the financial year or
by systematic allocation.
TAXES
Current taxes are determined on the basis of the estimated taxable income, in accordance with the tax
regulations applicable to the Group companies.
Deferred tax assets and liabilities are calculated on all the differences that arise between the taxable base
of an asset or liability and its carrying amount, except for goodwill when initially recognised and the
differences resulting from investments in subsidiaries, when the timing of the reversal of these differences
is under the Company’s control and it is likely that they will not be reversed in a reasonably foreseeable
period of time. The portion of deferred tax assets, including those related to past tax losses, that is not
offset by deferred tax liabilities, is recognised to the extent that there will be future taxable income from
which they can be recovered. Deferred tax assets and liabilities are calculated using the tax rates that are
expected to apply in the financial years during which the differences will be realised or settled.
Current taxes, deferred tax assets and liabilities are recognised under “Income taxes” in the income
statement, except for those relating to items recognised under comprehensive income components other
than net profit and those relating to items directly debited or credited to equity. In the latter cases, deferred
tax liabilities are recognised in the statement of comprehensive income and directly in equity. Deferred tax
assets and liabilities are offset when they are applied by the same tax authority, when there is a legal right
to offset them and when the net balance is expected to be settled.
Other taxes that are not correlated to income, such as indirect taxes and duties, are entered under “Other
operating costs” in the income statement.
2.4 Recently-issued accounting standards
As at the date of the Annual Report, the competent bodies of the European Union approved the adoption
of the following accounting standards and amendments applied to the Company on 1 May 2017.
On February 2016 the IASB issued some amedments to IAS 12 – Income taxes on the recognition of
deferred tax assets for unrealised losses which clarify how to account for deferred tax assets related to
debt instruments measured at fair value. These amendments are applicable from years beginning on or
after 1 January 2017.
On 25 February 2016 the IASB issued some amedments to IAS 7 - Statement of cash flows on disclosure
initiative. These amendments to IAS 7 introduce an additional disclosure that will enable users of
financial statements to evaluate changes in liabilities arising from financing activities. These
amendments are applicable from years beginning on or after 1 January 2017.
On December 2016, IASB issued a collection of amendments (Annual Improvements to IFRSs 2014-2016
Cycle to IFRS 12 “Disclosure of Interests in Other Entities”. The application of the amendments is
effective starting from the fiscal years beginning on or after 1 January 2017. The amendment clarifies
that the disclosure required by the standard must be given for investments classified as held for sale,
excepted as provided at point B12.
The adoption of the new standards mentioned above had no significant effect on the consolidated financial
statements.
As at the date of the present Separate Financial Statements, the competent bodies of the European Union
have approved the adoption of the following accounting standards and amendments, not yet applied by
the Group.
116
On 12 November 2009 the IASB published IFRS 9 – Financial instruments, which was then amended on
28 October 2010 and 24 July 2014. The standard, which will be applicable for financial years
commencing on or after 1 January 2018 on a retrospective basis, falls within the scope of a multi-phase
process aimed at fully replacing IAS 39 and introduces new criteria for the classification and
measurement of financial assets and liabilities and for the derecognition of financial assets from the
accounts. Specifically, for financial assets the new standard adopts a single approach based on the
method of the management of the financial instruments and the characteristics of their contractual cash
flows in order to determine their measurement policy, replacing the different rules laid down in IAS 39.
On the contrary, as regards financial liabilities, the main amendment involved the accounting treatment
of changes in the fair value of a financial liability designated as financial liability valued at fair value
through profit or loss, in the event that said changes are due to a change in the credit risk of the liability
itself. Based on the new standard, such adjustments have to be charged in the statement of
comprehensive income rather than profit and loss statement. During the year, the Company carried out
a preliminary assessment of the effects of IFRS 9 determining that there will be no significant effects on
the Company’s equity and net profit.
On June 2016 the IASB issued some further amedments to IFRS 2 – “Share-based payment” clarifying
the evaluation of the “cash-settled share-based payments” and how to account for certain types of
share-based payment transactions. It also introduces an exception to IFRS 2 that will require an award
to be treated as if it was wholly equity-settled, where an employer is obliged to withhold an amount for
the employee’s tax obligation associated with a share-based payment and pay that amount to the tax
authority. These amendments will be applicable from years beginning on or after 1 January 2018.
On 28 May 2014 the FASB issued IFRS 15 “Revenue from contracts with customers”. The new standard
will be applicable as of years beginning on or after 1 January 2018. The standard replaces IAS 18 –
“Revenue” IAS 11 "Construction Contracts", IFRIC 13 “Customer Loyalty Programmes”, “IFRIC 15 -
Agreements for the Construction of Real Estate”, IFRIC 18 – “Transfers of Assets from Customers”, SIC
31 – “Revenue—Barter Transactions Involving Advertising Services”. The new standard applies to all
contracts with customers, apart from contracts falling within the scope of application of IAS 17 – Leases,
for insurance contracts and financial instruments. It establishes a process consisting of five phases to
define the timing and the amount of the revenues to be disclosed (identification of contracts with
customers, identification of the performance obligations envisaged by the contract, determination of
the price of the transaction, allocation of the price of the transaction, disclosure of revenues upon
fulfilment of the performance obligation). The Company plans to apply this new standard from the
mandatory effective date, using the method of full retrospective application. During the period the
Company carried out a preliminary assessment of the effects of IFRS 15. On the basis of such analysis,
the Company will continue to recognize its revenues consistently with the accounting policies of the
previous years. Consequently, no significant impacts are expected on Company’s equity and net profit.
On 12 April 2016 the IASB issued some further amedments to IFRS 15 - Revenue from Contracts with
Customers, “Clarifications to IFRS 15″, clarifying some points and allowing more semplifications, with
the aim to reduce costs and complexity, for early adopters. These amendments will be applicable from
years beginning on or after 1 January 2018.
On September 2016, the IASB issued an amendment to IFRS 4 "Insurance contracts" as regards the
application of IFRS 9 "Financial instruments". The amendments will allow all the companies that issue
insurance contracts the option to recognize in the statement of comprehensive income, rather than in
the income statement, the volatility that could arise when IFRS 9 will be applied before the new principle
on insurance contracts is issued. In addition, it will allow companies whose activities are mainly linked
to insurance contracts an optional temporary exemption in the application of IFRS 9 up to 2021. Entities
that postpone the application of IFRS 9 will continue to apply IAS 39. These amendments will be
applicable from years beginning on or after 1 January 2018.
On December 2016, the IASB issued a collection of amendments to IFRS (Annual Improvements to IFRSs
2014-2016 Cycle). Improvements amended the following standards: (i) IFRS 1 “First-time Adoption of
International Financial Reporting Standards” in relation to the deletion of some exemptions related to
IFRS 7, IAS 19 and IFRS 10 in case of first-time adoption, (ii) IAS 28 “Investments in Associates and Joint

117
Ventures” relating to measurement at fair value of associates or joint ventures. These amendments will
be applicable from years beginning on or after 1 January 2018.
On 13 January 2016 the IASB issued new IFRS 16 – Leases. This standard replaces the current guidance
in IAS 17 no more suitable to represent leases in the current business. New standard now requires to
recognise lease contracts in the balance sheet as assets or liabilitiy whether financial or operting lease.
Lease contrats with 12 months o less duration and leases of low-value assets are out of new standard
scope. The standard will be applicable from years beginning on or after 1 January 2019. New standards
can generally be adopted early by IFRS 15 (Revenue from contracts with customers) adopters.
On December 2016, the IASB issued some further amendments to IAS 40 “Investment Property”
providing guidance on transfers of property to, or from, “Investment properties” line item, underlying
that transfers to investment property can be made when there is an evident change in use. These
amendments will be applicable from years beginning on or after 1 January 2018.
On December 2016, IASB issued IFRIC 22 “Foreign currency transactions and advance consideration”.
The document clarifies the accounting for transactions or part of transactions where there is
consideration that is priced in a foreign currency. These amendments will be applicable from years
beginning on or after 1 January 2018.
On October 2017, the IASB published an amendment to IAS 28 "Long-term Interests in Associates and
Joint Ventures". The amendment clarifies the accounting treatment of investments in associates and
joint ventures that are not evaluated using the equity method in accordance with IFRS 9. The
amendments are effective for years beginning on or after 1 January 2019.
As at the date of the present Separate Financial Statements, the competent bodies of the European Union
have not yet completed the necessary process of endorsement for the adoption of the following accounting
standards and amendments.
On June 2017, the IASB published the interpretation IFRIC 23 "Uncertainty over Income Tax Treatments".
The document provides guidance on how to reflect uncertainties in the tax treatment of a given
phenomenon in the accounting for current and/or deferred income taxes. The amendments are
effective for annual periods beginning on or after 1 January 2019.
On October 2017, the IASB published an amendment to IFRS 9 "On prepayment features with negative
compensation". The amendment confirms that when a financial liability recognised at amortised cost is
modified without this leading to its de-recognition, the related gain or loss must be recognised
immediately in the income statement. The gain or loss is measured as the difference between the
previous cash flow and the cash flow restated to reflect the change. The amendments are effective for
annual periods beginning on or after 1 January 2019.
On May 2017 the IASB issued the new standard IFRS 17 - Insurance Contracts. The new standard will
replace IFRS 4 and will be effective for annual periods beginning on or after 1 January 2021.
On December 2017, the IASB issued a set of amendments to IFRS (Annual Improvements to IFRSs 2015-
2017 Cycle). The provisions approved have amended: (i) IFRS 3 "Business Combinations"; (ii) IFRS 11
"Joint arrangements"; (iii) IAS 12 "Income Taxes"; (iv) IAS 23 "Borrowing costs" in relation to the
accounting treatment of loans originally linked to the development of a business. The amendments are
effective for annual periods beginning on or after 1 January 2019.
On February 2018, the IASB published an amendment to IAS 19 "Employee benefits" that introduces
changes essentially aimed at requiring the use of updated actuarial assumptions in the calculation of
current service cost and net interest for the period following a change in an existing defined benefit
plan. Application of the amendments is effective for financial years beginning on or after 1 January
2019.
The Company will adopt these new standards, amendments and interpretations , on the basis of the
expected date of application, and will assess potential impacts, when these are approved by the European
Union.
3 Financial risk management

118
The Company business is exposed to the credit risk.
Risk management strategy is aimed at minimizing potential adverse effects on the company financial
performance. Risk management is centralised within the treasury function that identifies, assesses and
hedges financial risks. The treasury function provides instructions to monitor risk management, as well as
provides instructions for specific areas, concerning interest rate risks and exchange rate risks.
MARKET RISK
The Company is exposed to market risks only in relation to credit risks.
Interest Rate Risk
The Company presents a financial structure characterized by a positive net financial position thus is not
exposed to interest rate risk.
Exchange Rate Risk
In the financial year ended 30 April 2018, the Company did not operate with a currency different from Euro.
Credit Risk
Credit risk is represented by the Company’s exposure to potential losses arising from its customers’ failure
to meet their obligations. In order to mitigate the credit risk correlated to its business counterparties, and
therefore to its customers, the Company has implemented procedures aimed at ensuring that services were
delivered to customers that are considered to be reliable on the basis of past experience and any available
information. Furthermore, the company controls its commercial exposure on an ongoing basis and monitors
that the debt collection takes place within the preset contractual time limits. Moreover, the exposure of the
Company is maily related to the Sesa Group companies.
Credit risk due to ordinary operations is monitored on an ongoing basis through the use of information
and client assessment with an appropriate provision for bad debts.
The table below provides a breakdown of current receivables from customers at 30 April 2018 and 30 April
2017, by overdue amounts, net of provision for bad debts.
FY ended 30 April
2018 2017
Falling due 799 653
Overdue from 0-30 days 48 8
Overdue from 31-90 days 2 8
Overdue from 91-360 days 3 3
Overdue from more than 360 days 7 3
Total 859 675
LIQUIDITY RISK
The liquidity risk is associated to the Company’s ability to meet any commitments mainly arising from
financial liabilities. A prudent management of the liquidity risk arising from the Company’s ordinary
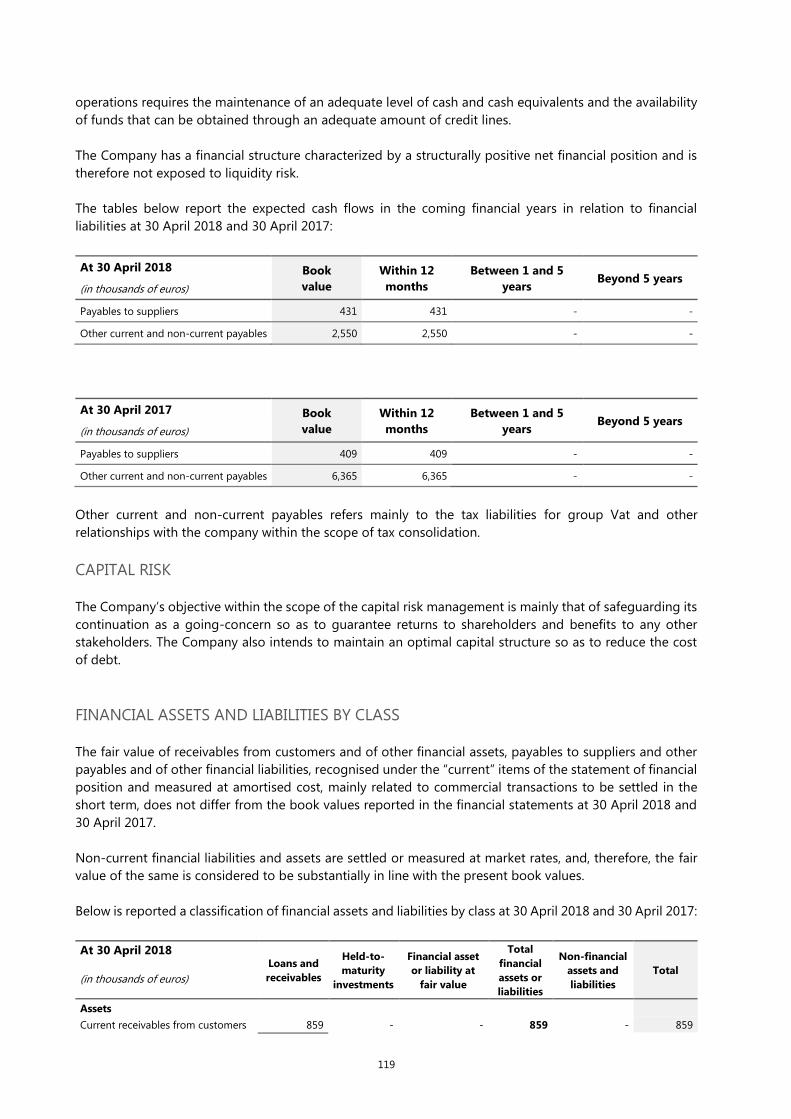
119
operations requires the maintenance of an adequate level of cash and cash equivalents and the availability
of funds that can be obtained through an adequate amount of credit lines.
The Company has a financial structure characterized by a structurally positive net financial position and is
therefore not exposed to liquidity risk.
The tables below report the expected cash flows in the coming financial years in relation to financial
liabilities at 30 April 2018 and 30 April 2017:
At 30 April 2018 Book
value
Within 12
months
Between 1 and 5
years Beyond 5 years
(in thousands of euros)
Payables to suppliers 431 431 - -
Other current and non-current payables 2,550 2,550 - -
At 30 April 2017 Book
value
Within 12
months
Between 1 and 5
years Beyond 5 years
(in thousands of euros)
Payables to suppliers 409 409 - -
Other current and non-current payables 6,365 6,365 - -
Other current and non-current payables refers mainly to the tax liabilities for group Vat and other
relationships with the company within the scope of tax consolidation.
CAPITAL RISK
The Company’s objective within the scope of the capital risk management is mainly that of safeguarding its
continuation as a going-concern so as to guarantee returns to shareholders and benefits to any other
stakeholders. The Company also intends to maintain an optimal capital structure so as to reduce the cost
of debt.
FINANCIAL ASSETS AND LIABILITIES BY CLASS
The fair value of receivables from customers and of other financial assets, payables to suppliers and other
payables and of other financial liabilities, recognised under the “current” items of the statement of financial
position and measured at amortised cost, mainly related to commercial transactions to be settled in the
short term, does not differ from the book values reported in the financial statements at 30 April 2018 and
30 April 2017.
Non-current financial liabilities and assets are settled or measured at market rates, and, therefore, the fair
value of the same is considered to be substantially in line with the present book values.
Below is reported a classification of financial assets and liabilities by class at 30 April 2018 and 30 April 2017:
At 30 April 2018
Loans and
receivables
Held-to-
maturity
investments
Financial asset
or liability at
fair value
Total
financial
assets or
liabilities
Non-financial
assets and
liabilities
Total (in thousands of euros)
Assets
Current receivables from customers 859 - - 859 - 859

120
Other current and non-current assets 9,372 - - 9,372 - 9,372
Cash and cash equivalents 8,056 - - 8,056 - 8,056
Total assets 18,287 - - 18,287 - 18,287
Liabilities
Current and non-current loans - - - - - -
Payables to suppliers 431 - - 431 - 431
Other current liabilities 2,541 - - 2,541 - 2,541
Total liabilities 2,972 - - 2,972 - 2,972
At 30 April 2017
Loans and
receivables
Held-to-
maturity
investments
Financial asset
or liability at
fair value
Total
financial
assets or
liabilities
Non-financial
assets and
liabilities
Total in thousands of euros)
Assets
Current receivables from customers 675 - - 675 - 675
Other current and non-current assets 12,278 - - 12,278 - 12,278
Cash and cash equivalents 8,284 - - 8,284 - 8,284
Total assets 21,237 - - 21,237 - 21,237
Liabilities
Current and non-current loans - - - - - -
Payables to suppliers 409 - - 409 - 409
Other current liabilities 6,365 - - 6,365 - 6,365
Total liabilities 6,774 - - 6,774 - 6,774
FAIR VALUE ESTIMATE
IFRS 13 defines the fair value as the price that would be received for the sale of an asset that would be paid
for the transferral of a liability at the date of evaluation on a free transaction between market operators.
The fair value of financial instruments listed on an active market is based on market prices at the reporting
date. The fair value of instruments that are not listed on an active market is calculated using evaluation
techniques based on a series of methods and assumptions linked to market conditions at the reporting
date.
The fair value classification of financial instruments is given below, based on the following hierarchical levels:
Level 1: fair value calculated with reference to listed prices (not adjusted) on active markets for identical
financial instruments;
Level 2: fair value calculated using evaluation techniques with reference to variables that can be observed
on active markets;
Level 3: fair value calculated using evaluation techniques with reference to market variables that cannot be
observed.
At 30 April 2018 the amount of non current equity investments in other companies is equal 1,007
thousand and mainly includes the investment in Cabel Holding SpA.

121
4 Estimates and Assumptions
The preparation of financial statements requires the directors to apply accounting standards and methods
which, in some circumstances, are based on difficult and subjective valuations and estimates based on
historical experience and assumptions that are from time to time considered reasonable and realistic
depending on the related circumstances. The application of these estimates and assumptions affects the
amounts reported in the financial statement schedules, the statement of financial position, the income
statement, the statement of comprehensive income, the statement of cash flows, as well as any information
provided.
The final results of the financial statement items for which the abovementioned estimates and assumptions
have been used could differ from those reported in the financial statements that recognise the effects of
the occurrence of the event being estimated, because of the uncertainty that characterizes the assumptions
and conditions on which estimates are based.
Below are summarised the areas that require, more than others, greater subjectivity on the part of the
directors in preparing estimates and for which a change in the conditions underlying the assumptions used
could have a significant impact on financial data.
(a) Impairment of assets
In accordance with the accounting standards applied by the Company, property, plant and equipment,
intangible assets and investment property are tested for impairment in order to establish whether there is
evidence of an impairment loss, which must be recognised through a write-down, when there are
indications that it may be difficult to recover the related net book value through their use. The verification
of the existence of the abovementioned indicators requires the directors to apply subjective valuations
based on the information available within the Company and in the market, as well as on historical
experience.
Furthermore, if it is established that a potential impairment loss may have occurred, the Company takes
steps to determine the same by using valuation techniques that are considered to be suitable. The correct
identification of any evidence of the existence of a potential impairment loss of property, plant and
equipment, intangible assets and investment property, as well as any estimates for the determination of the
same, depend on factors that can vary over time, thus affecting the valuations and estimates made by the
directors.
(b) Amortisation and depreciation
The cost of property, plant and equipment and intangible assets is amortised/depreciated on a straight-line
basis over the estimated useful life of the related assets. The useful economic life of said assets is determined
by the directors at the time when they are acquired; it is based on historical experience for similar assets,
market conditions and anticipations of future events that could have an impact on the useful life of the
assets, including changes in technology. Therefore, the actual economic life could differ from the estimated
useful life.
(c) Provision for bad debts
The provision for bad debts reflects any losses estimated for the Company portfolio of receivables. The
Company has set aside provisions against expected losses on receivables, which have been estimated on
the basis of past experience with reference to receivables with a similar credit risk, to current and historical
outstanding amounts, as well as to the careful monitoring of the quality of the portfolio of receivables and
of the current and expected conditions of the relevant economy and markets. The estimates and

122
assumptions are reviewed periodically and the effects of any change are reported in the income statement
in the relevant financial year.
(d) Employee benefits
The present value of pension funds entered in the Separate Financial Statements depends on an
independent actuarial calculation and on the different assumptions taken into consideration. Any changes
in the assumptions and in the discount rate used are promptly reflected in the calculation of the present
value and could have a significant impact on the data reported in the accounts. The assumptions used for
the purposes of the actuarial calculation are examined on an annual basis.
The present value is determined by discounting the future cash flows at an interest rate equal to that of
(high-quality corporate) bonds issued in the currency in which the liability will be settled and which takes
account of the duration of the related pension plan. For additional information, reference is made to notes
24 Employee benefits and 9 Personnel costs.

123
5 Revenues
All the Group’s revenues are generated in Italy. Revenues can be broken down as follows:
FY ended 30 April
(in thousands of euros) 2018 2017
Services rendered and other revenues 6,097 4,983
Other revenues 687 500
Total 6,784 5,483
Revenues were mainly related to services such as administration, finance and control services, personnel
management and information systems management rendered to the companies of the Sesa Group.
6 Other Income
This item can be broken down as follows:
FY ended 30 April
(in thousands of euros) 2018 2017
Leases and hires 40 40
Other income 1,103 1,545
Total 1,143 1,585
Leases were relatated to the lease of the premises in Rome.
Other income was mainly related to the reversible fees of the Chairman of the Board of Directors and of an
Executive Vice-Chairman.
7 Consumables and Goods for resale
This item can be broken down as follows:
FY ended 30 April
(in thousands of euros) 2018 2017
Consumables and other purchases 48 43
Total 48 43

124
8 Costs for services and rent, leasing and similar costs
This item can be broken down as follows:
FY ended 30 April
(in thousands of euros) 2018 2017
Hardware and software technical assistance 73 51
Consultancy 2,826 2,085
Leases and hires 246 171
Marketing 62 79
Transport
Insurance 65 58
Utilities 22 10
Support and training expenses 9 6
Maintenance 1
Other expenses for services 220 167
Total 3,524 2,627
The item Consultancy includes the costs relative to the Stock Grant Plan towards Excutive Directors for Euro
1,393 thousand.
9 Personnel costs
This item can be broken down as follows:
FY ended 30 April
(in thousands of euros) 2018 2017
Wages and salaries 2,929 2,812
Social security contributions 856 835
Contributions to defined-contribution pension funds 190 185
Contributions to defined benefit pension funds
Reimbursements and other personnel costs 144 140
Total 4,119 3,972
Below is reported the average and actual number of the Group’s employees:
Average number of employees
at 30 April
Actual number of employees
at 30 April
(in units) 2018 2017 2018 2017
Executives 2 2
2 2
Middle managers
8 8 8 8
Office workers
68 65 70 66
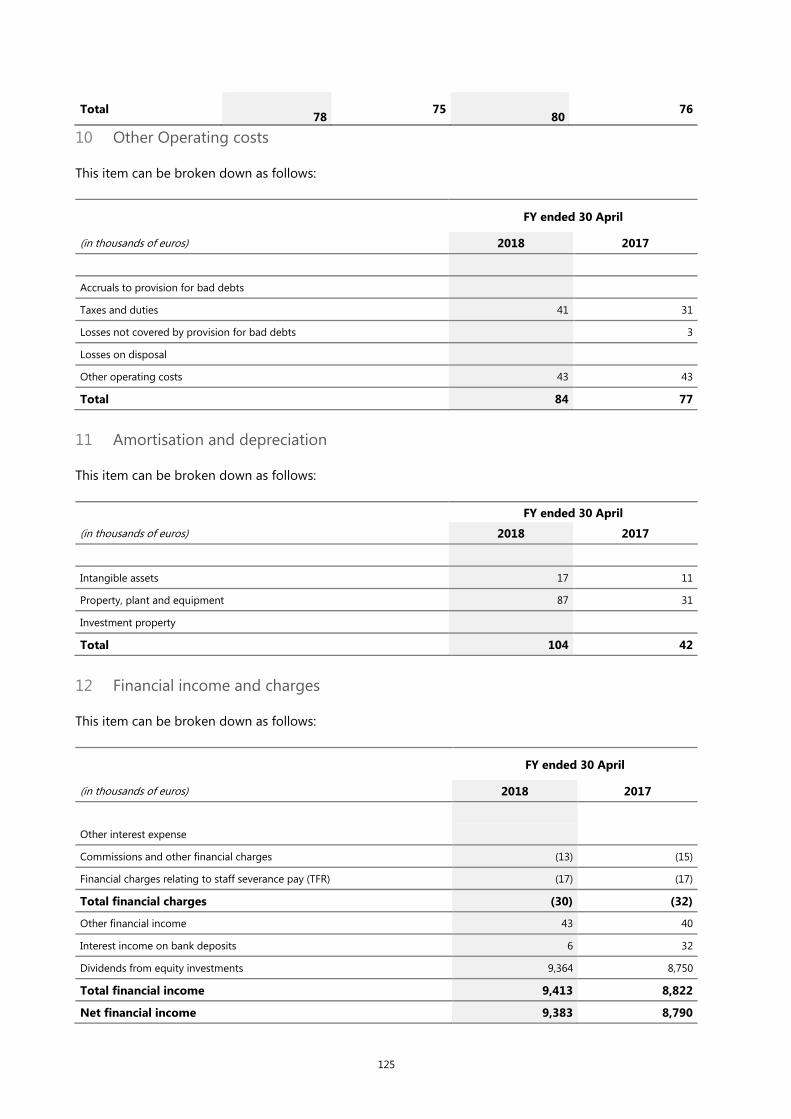
125
Total
78 75
80 76
10 Other Operating costs
This item can be broken down as follows:
FY ended 30 April
(in thousands of euros) 2018 2017
Accruals to provision for bad debts
Taxes and duties 41 31
Losses not covered by provision for bad debts 3
Losses on disposal
Other operating costs 43 43
Total 84 77
11 Amortisation and depreciation
This item can be broken down as follows:
FY ended 30 April
(in thousands of euros) 2018 2017
Intangible assets 17 11
Property, plant and equipment 87 31
Investment property
Total 104 42
12 Financial income and charges
This item can be broken down as follows:
FY ended 30 April
(in thousands of euros) 2018 2017
Other interest expense
Commissions and other financial charges (13) (15)
Financial charges relating to staff severance pay (TFR) (17) (17)
Total financial charges (30) (32)
Other financial income 43 40
Interest income on bank deposits 6 32
Dividends from equity investments 9,364 8,750
Total financial income 9,413 8,822
Net financial income 9,383 8,790

126
13 Income taxes
This item can be broken down as follows:
FY ended 30 April
(in thousands of euros) 2018 2017
Current taxes 293 156
Deferred taxes (69) 134
Total 224 290
Starting from financial year ended 30 April 2014 and with renew in January 2017, the Company exercised,
as consolidating company, the option to adopt the national tax consolidation mechanism (Consolidato
fiscale nazionale) (art. 117 et seq. of TUIR, Consolidated Income Tax Code) which enables to calculate the
IRES (Corporate income tax) tax on a consolidated taxable base, made up of the sum of taxable profits and
losses of each company adopting the tax consolidation mechanism, specifically Computer Gross Italia SpA,
Var Group SpA and ICT Logistica Srl (the consolidated companies). The financial statements were prepared
taking into account the effects of the consolidated companies’ tax positions transferred to the consolidating
entity arising from the mechanism above and as governed by the relevant tax consolidation arrangements;
in particular, the financial statements reflect receivables/payables from/to the consolidated companies
accordingly.
Furthermore, in February 2017, the option to adopt the VAT Group regime was exercised, sending the
specific form to the Revenue Agency. Therefore, Sesa SpA has acted, since such date, as the payer of the
VAT receivables and payables also for the subsidiaries Computer Gross Italia SpA and Var Group SpA.
It should be noted that, starting from the financial year ended 30 April 2018, the IRES rate applied for the
calculation of current and deferred taxes passed from 27.5% to 24%.
The table below reports the reconciliation of the theoretical tax burden with the effective tax burden for the
financial years ended 30 April 2018 and 30 April 2017:
FY ended 30 April
(in thousands of euros) 2018 2017
Profit before taxes 9,431 9,097
Theoretical taxes 2,263 24.0% 2,502 27.5%
Taxes relating to previous years 3
Favourable taxation on dividends (2,135) (2,286)
Taxes on costs for the year charged as a reduction of equity during the
FTA (184)
Other differences 77 113
IRAP tax, including other changes 19 142
Effective tax burden 224 2.38% 290 3.19%

127
14 Intangible assets
This item and the related change can be broken down as follows:
Client list
Software and other
intangible assets
Trademarks and
patents Total
(in thousands of euros)
Balance at 30 April 2016 12 5 1 18
Of which:
- historical cost 25 56 9 90
- accumulated amortisation (13) (51) (8) (72)
Investments 63 63
Disinvestments
Amortisation (2) (8) (1) (11)
Balance at 30 April 2017 10 60 70
Of which:
- historical cost 25 119 9 153
- accumulated amortisation (15) (59) (9) (83)
Investments 6 6
Disinvestments
Amortisation (3) (14) (17)
Balance at 30 April 2018 7 52 59
Of which:
- historical cost 25 125 9 159
- accumulated amortisation (18) (73) (9) (100)
The balance of intangible assets as of 30 April 2018 is mainly formed by management software used by the
Company. For further details please refer to note 4.
15 Property, plant and equipment
This item and the related change can be broken down as follows:
Office machines
Other
property,
plant and
equipment
Total (in thousands of euros)
Balance at 30 April 2016 33 1 34
Of which: - historical cost 142 131 273
- accumulated depreciation (109) (130) (239)
Investments 328 2 330
Disinvestments (13) (13)
Depreciation (28) (1) (29)
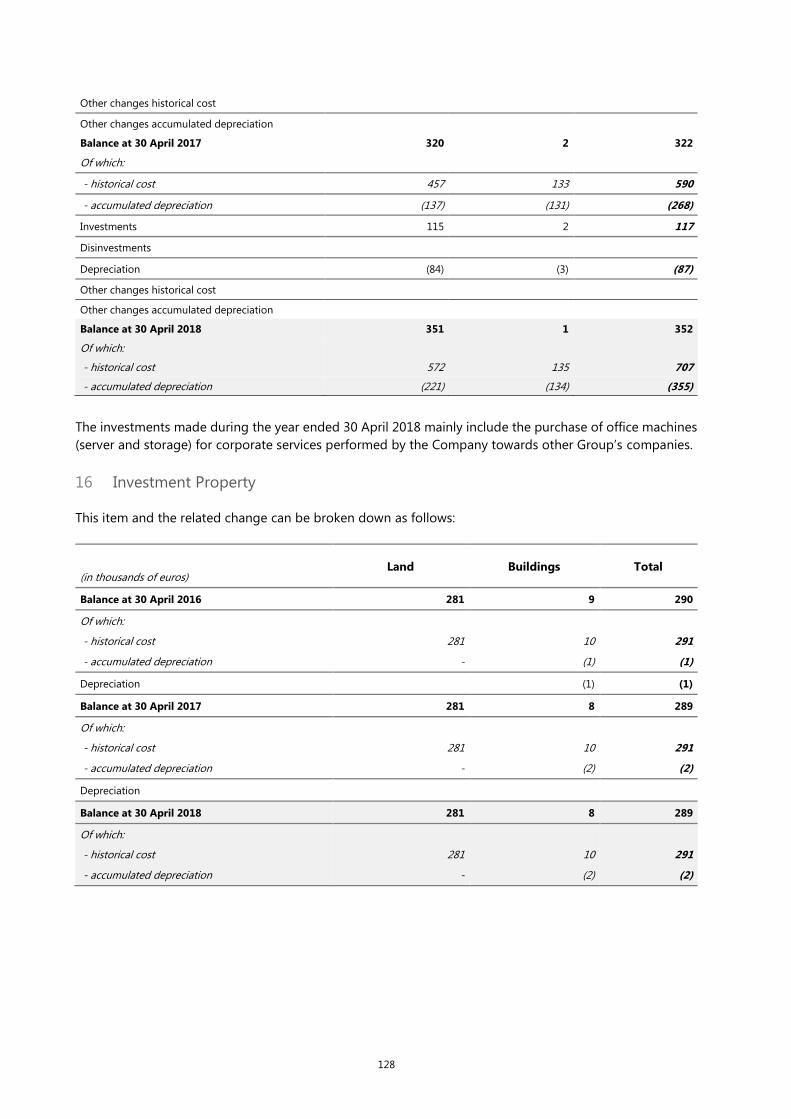
128
Other changes historical cost
Other changes accumulated depreciation
Balance at 30 April 2017 320 2 322
Of which:
- historical cost 457 133 590
- accumulated depreciation (137) (131) (268)
Investments 115 2 117
Disinvestments
Depreciation (84) (3) (87)
Other changes historical cost
Other changes accumulated depreciation
Balance at 30 April 2018 351 1 352
Of which:
- historical cost 572 135 707
- accumulated depreciation (221) (134) (355)
The investments made during the year ended 30 April 2018 mainly include the purchase of office machines
(server and storage) for corporate services performed by the Company towards other Group’s companies.
16 Investment Property
This item and the related change can be broken down as follows:
Land Buildings Total
(in thousands of euros)
Balance at 30 April 2016 281 9 290
Of which:
- historical cost 281 10 291
- accumulated depreciation - (1) (1)
Depreciation (1) (1)
Balance at 30 April 2017 281 8 289
Of which:
- historical cost 281 10 291
- accumulated depreciation - (2) (2)
Depreciation
Balance at 30 April 2018 281 8 289
Of which:
- historical cost 281 10 291
- accumulated depreciation - (2) (2)
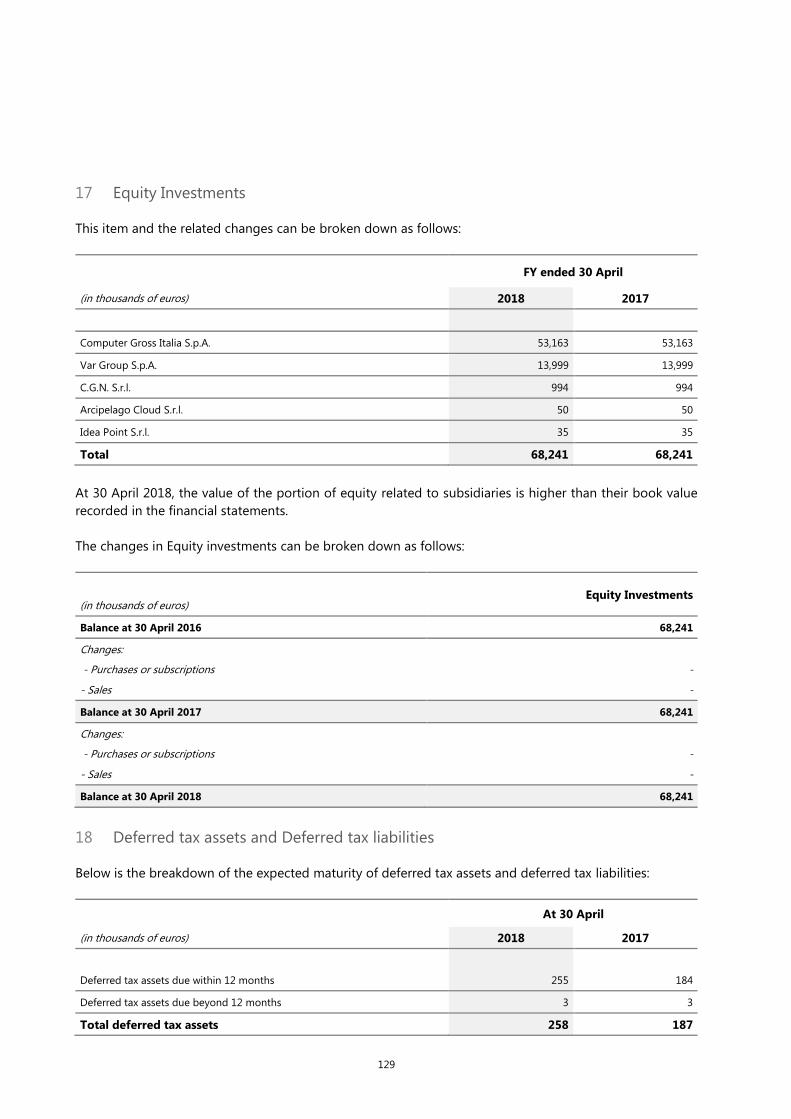
129
17 Equity Investments
This item and the related changes can be broken down as follows:
FY ended 30 April
(in thousands of euros) 2018 2017
Computer Gross Italia S.p.A. 53,163 53,163
Var Group S.p.A. 13,999 13,999
C.G.N. S.r.l. 994 994
Arcipelago Cloud S.r.l. 50 50
Idea Point S.r.l. 35 35
Total 68,241 68,241
At 30 April 2018, the value of the portion of equity related to subsidiaries is higher than their book value
recorded in the financial statements.
The changes in Equity investments can be broken down as follows:
Equity Investments
(in thousands of euros)
Balance at 30 April 2016 68,241
Changes:
- Purchases or subscriptions -
- Sales -
Balance at 30 April 2017 68,241
Changes:
- Purchases or subscriptions -
- Sales -
Balance at 30 April 2018 68,241
18 Deferred tax assets and Deferred tax liabilities
Below is the breakdown of the expected maturity of deferred tax assets and deferred tax liabilities:
At 30 April
(in thousands of euros) 2018 2017
Deferred tax assets due within 12 months 255 184
Deferred tax assets due beyond 12 months 3 3
Total deferred tax assets 258 187

130
Deferred tax liabilities within 12 months 1 -
Deferred tax liabilities beyond 12 months - -
Total deferred tax liabilities 1 -
The net change in the items in question can be broken down as follows:
At 30 April
(in thousands of euros) 2018 2017
Balance at the beginning of the year 187 317
Increase by merger
Effect on the income statement 72 (130)
Effect on the statement of comprehensive income
Reclassifications
Balance at the end of the year 259 187
Of which:
- deferred tax assets 258 187
- deferred tax liabilities 1 0
The change in deferred tax assets can be broken down as follows:
Deferred tax assets Value differences
on property, plant
and equipment and
intangible assets
Provisions
for risks and
charges and
other
allocations
Employee
benefits
Other
items Total
(in thousands of euros)
Balance at 30 April 2016 327 (10) - 317
Effect on the income statement (130) - (130)
Effect on the statement of comprehensive income
Other changes
Balance at 30 April 2017 197 (10) - 187
Effect on the income statement 72 - 72
Effect on the statement of comprehensive income
Other changes
Balance at 30 April 2018 269 (10) - 259
The change in deferred tax liabilities can be broken down as follows:
Deferred tax liabilities Value differences
on property, plant
and equipment
and intangible
assets
Employee
benefits
Other
items Total
(in thousands of euros)
Balance at 30 April 2016 - - -
Reclassifications
Effect on the income statement
Effect on the statement of comprehensive income
Balance at 30 April 2017
Reclassifications

131
Effect on the income statement 1 1
Effect on the statement of comprehensive income
Balance at 30 April 2018 1 1
19 Other current and non-current receivables and assets
This item can be broken down as follows:
At 30 April
(in thousands of euros) 2018 2017
Non-current receivables from others 44 44
Non-current equity investments in other companies 69,248 68,241
Non-current securities
Total other non-current receivables and assets 69,292 68,285
Current receivables from subsidiaries 7,616 9,743
Current receivables from others 21 132
Other current tax receivables 5 13
Accrued income and prepaid expenses 185 243
Derivative assets - -
Total other current receivables and assets 7,827 10,131
Non-current equity investments in other companies relate to companies that are not listed on an active
market and the fair value of which cannot be measured reliably; therefore, these investments are valued at
cost, net of any losses in value.
Among receivables from subsidiaries we note the interest-bearing financial receivables for Euro 6.5 million
from Computer Gross Italia SpA and Var Group SpA.
20 Current trade receivables
This item can be broken down as follows:
At 30 April
(in thousands of euros) 2018 2017
Receivables from customers (*) 835 711
Provision for write-down of receivables from customers (85) (118)
Receivables from customers, net of provision for bad debts 750 593
Receivables from subsidiaries 106 77
Receivables from associated companies
Receivables from parent companies 3 5
Total current trade receivables 859 675
(*) For the purposes of a better portrayal of receivables from customer, they are presented net of the balance
relating to customers subject to bankruptcy and composition with creditors proceedings which, at 30 April
2017 and 30 April 2018 were respectively Euro 109 thousand and Euro 77 thousand. These positions have
been fully written down via the booking of a specific provision. Receivables from customers pertain mainly
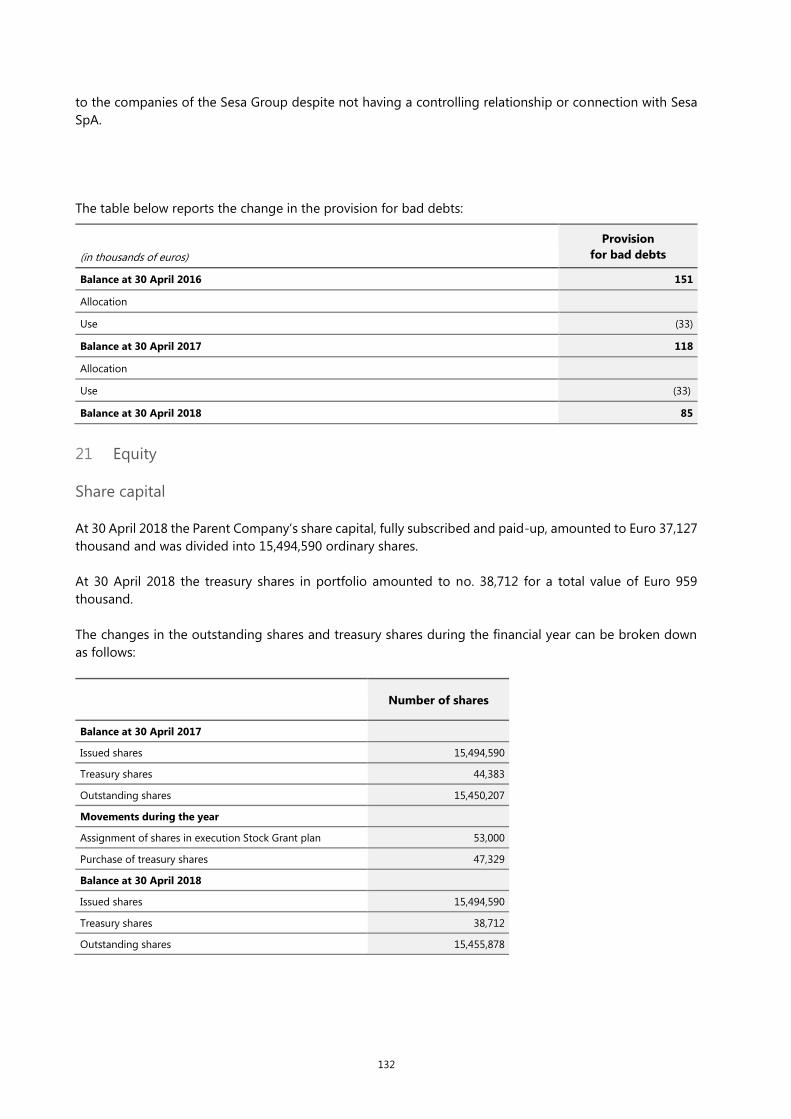
132
to the companies of the Sesa Group despite not having a controlling relationship or connection with Sesa
SpA.
The table below reports the change in the provision for bad debts:
Provision
for bad debts (in thousands of euros)
Balance at 30 April 2016 151
Allocation
Use (33)
Balance at 30 April 2017 118
Allocation
Use (33)
Balance at 30 April 2018 85
21 Equity
Share capital
At 30 April 2018 the Parent Company’s share capital, fully subscribed and paid-up, amounted to Euro 37,127
thousand and was divided into 15,494,590 ordinary shares.
At 30 April 2018 the treasury shares in portfolio amounted to no. 38,712 for a total value of Euro 959
thousand.
The changes in the outstanding shares and treasury shares during the financial year can be broken down
as follows:
Number of shares
Balance at 30 April 2017
Issued shares 15,494,590
Treasury shares 44,383
Outstanding shares 15,450,207
Movements during the year
Assignment of shares in execution Stock Grant plan 53,000
Purchase of treasury shares 47,329
Balance at 30 April 2018
Issued shares 15,494,590
Treasury shares 38,712
Outstanding shares 15,455,878
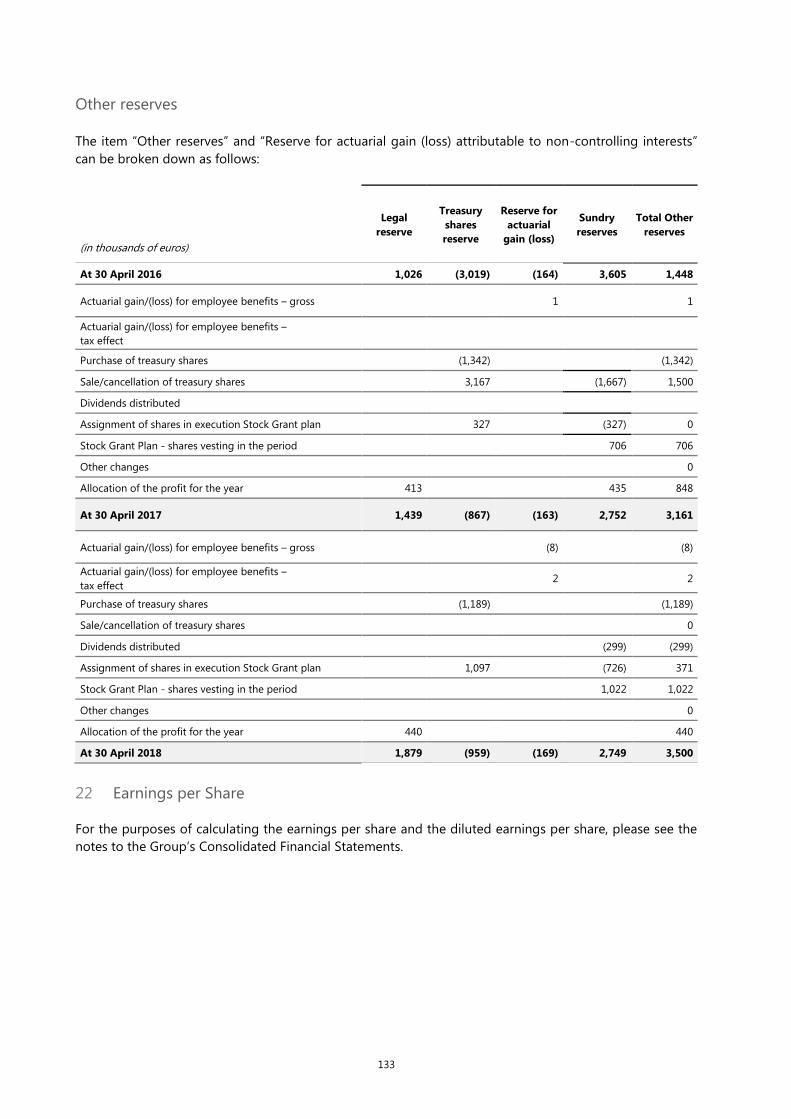
133
Other reserves
The item “Other reserves” and “Reserve for actuarial gain (loss) attributable to non-controlling interests”
can be broken down as follows:
Legal
reserve
Treasury
shares
reserve
Reserve for
actuarial
gain (loss)
Sundry
reserves
Total Other
reserves
(in thousands of euros)
At 30 April 2016 1,026 (3,019) (164) 3,605 1,448
Actuarial gain/(loss) for employee benefits – gross 1 1
Actuarial gain/(loss) for employee benefits –
tax effect
Purchase of treasury shares (1,342) (1,342)
Sale/cancellation of treasury shares 3,167 (1,667) 1,500
Dividends distributed
Assignment of shares in execution Stock Grant plan 327 (327) 0
Stock Grant Plan - shares vesting in the period 706 706
Other changes 0
Allocation of the profit for the year 413 435 848
At 30 April 2017 1,439 (867) (163) 2,752 3,161
Actuarial gain/(loss) for employee benefits – gross (8) (8)
Actuarial gain/(loss) for employee benefits –
tax effect 2 2
Purchase of treasury shares (1,189) (1,189)
Sale/cancellation of treasury shares 0
Dividends distributed (299) (299)
Assignment of shares in execution Stock Grant plan 1,097 (726) 371
Stock Grant Plan - shares vesting in the period 1,022 1,022
Other changes 0
Allocation of the profit for the year 440 440
At 30 April 2018 1,879 (959) (169) 2,749 3,500
22 Earnings per Share
For the purposes of calculating the earnings per share and the diluted earnings per share, please see the
notes to the Group’s Consolidated Financial Statements.
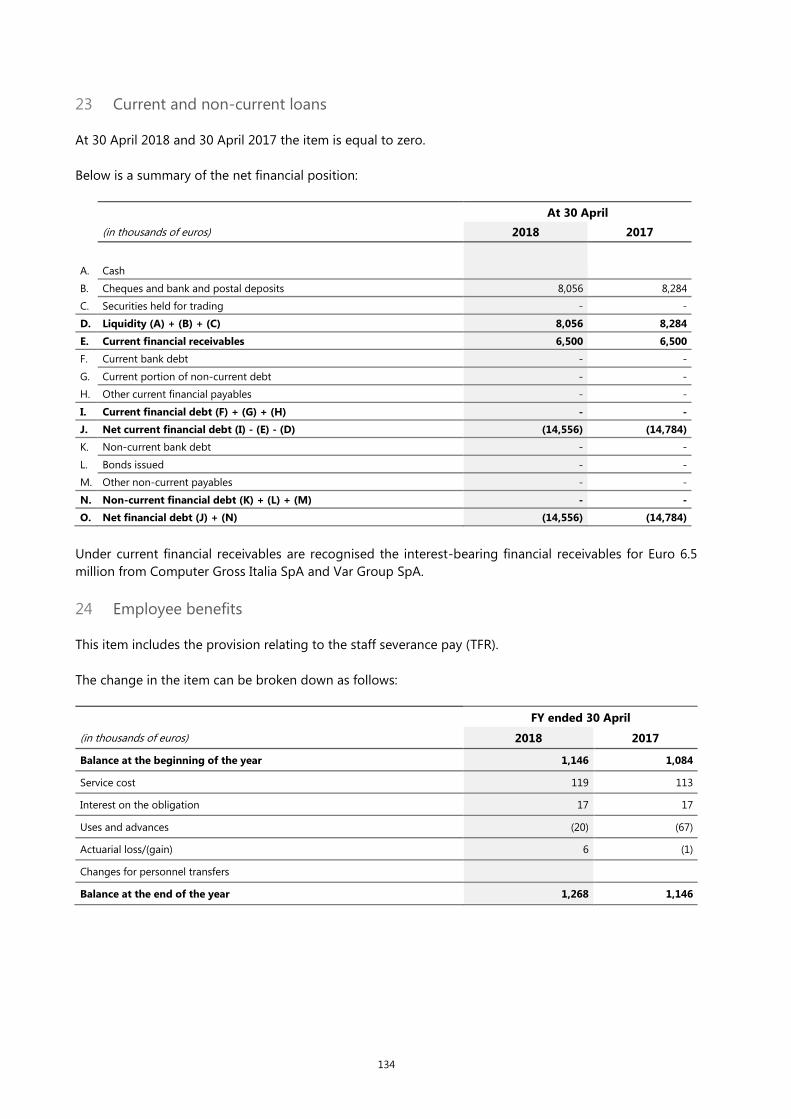
134
23 Current and non-current loans
At 30 April 2018 and 30 April 2017 the item is equal to zero.
Below is a summary of the net financial position:
At 30 April
(in thousands of euros) 2018 2017
A. Cash
B. Cheques and bank and postal deposits 8,056 8,284
C. Securities held for trading - -
D. Liquidity (A) + (B) + (C) 8,056 8,284
E. Current financial receivables 6,500 6,500
F. Current bank debt - -
G. Current portion of non-current debt - -
H. Other current financial payables - -
I. Current financial debt (F) + (G) + (H) - -
J. Net current financial debt (I) - (E) - (D) (14,556) (14,784)
K. Non-current bank debt - -
L. Bonds issued - -
M. Other non-current payables - -
N. Non-current financial debt (K) + (L) + (M) - -
O. Net financial debt (J) + (N) (14,556) (14,784)
Under current financial receivables are recognised the interest-bearing financial receivables for Euro 6.5
million from Computer Gross Italia SpA and Var Group SpA.
24 Employee benefits
This item includes the provision relating to the staff severance pay (TFR).
The change in the item can be broken down as follows:
FY ended 30 April
(in thousands of euros) 2018 2017
Balance at the beginning of the year 1,146 1,084
Service cost 119 113
Interest on the obligation 17 17
Uses and advances (20) (67)
Actuarial loss/(gain) 6 (1)
Changes for personnel transfers
Balance at the end of the year 1,268 1,146
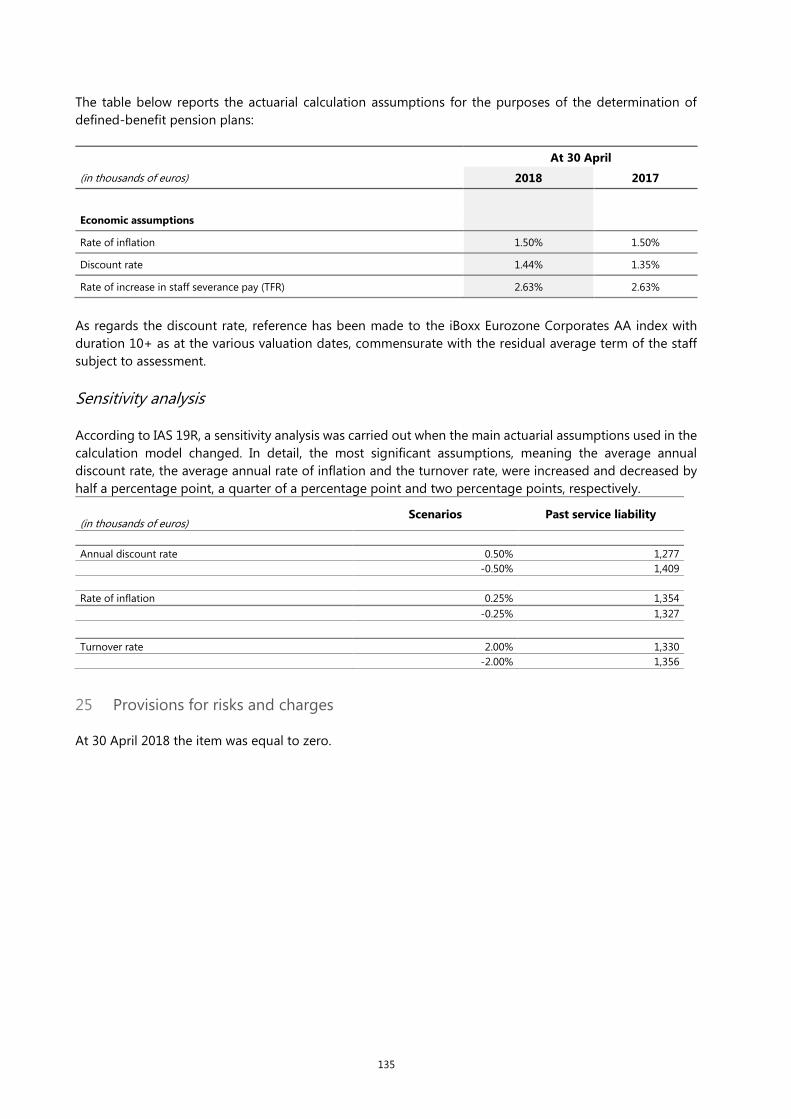
135
The table below reports the actuarial calculation assumptions for the purposes of the determination of
defined-benefit pension plans:
At 30 April
(in thousands of euros) 2018 2017
Economic assumptions
Rate of inflation 1.50% 1.50%
Discount rate 1.44% 1.35%
Rate of increase in staff severance pay (TFR) 2.63% 2.63%
As regards the discount rate, reference has been made to the iBoxx Eurozone Corporates AA index with
duration 10+ as at the various valuation dates, commensurate with the residual average term of the staff
subject to assessment.
Sensitivity analysis
According to IAS 19R, a sensitivity analysis was carried out when the main actuarial assumptions used in the
calculation model changed. In detail, the most significant assumptions, meaning the average annual
discount rate, the average annual rate of inflation and the turnover rate, were increased and decreased by
half a percentage point, a quarter of a percentage point and two percentage points, respectively.
Scenarios Past service liability
(in thousands of euros)
Annual discount rate 0.50% 1,277
-0.50% 1,409
Rate of inflation 0.25% 1,354
-0.25% 1,327
Turnover rate 2.00% 1,330
-2.00% 1,356
25 Provisions for risks and charges
At 30 April 2018 the item was equal to zero.

136
26 Other current liabilities
This item can be broken down as follows:
At 30 April
(in thousands of euros) 2018 2017
Accrued expenses and deferred income 13 18
Tax payables 1,159 3,550
Payables to personnel 770 724
Other payables 472 1,944
Payables to social security institutions 127 129
Advances from customers
Derivatives
Total other current liabilities 2,541 6,365
27 Other information
Contingent liabilities
There are no pending disputes.
Commitments
The Company issued surety guarantees in favour of a leading Group supplier, in the interest of certain Group
companies. At 30 April 2018, the amount of the guarantees, net of the sum already paid, is equal to Euro
1,125 thousand.
Fees due to Directors and Statutory Auditors
Details of fees due to Sesa SpA directors and Statutory Auditors are given below, gross of welfare charges
and taxes paid by them for the year. For a full description and analysis of the fees due to Directors, Statutory
Auditors and Executives with strategic responsibilities, please refer to the Remuneration Report, which is
available for consultation at the head office and on the website of the company in the “Corporate
Governance” section.
FY ended 30 April
(in thousands of euros) 2018
Fees due to Directors 508
Fees due to Statutory Auditors 55
Fees to Directors reported in the table above include fixed and variable amounts, as well as those due for
participation in internal committees. They do not include reversible fees to directors and shares assigned
under the stock grant plan approved by the shareholders' meeting on 25 August 2017. In relation to the
foregoing, it should be noted that, at 30 April 2018, a total of 42,000 shares matured.

137
Fees due to Independent Auditors
The following table, prepared pursuant to art. 149 duodecies of the Consob Issuers' Regulations, shows the
fees for the year ended 30 April 2018 for audit and non-audit services provided by the independent Auditors
and by entities belonging to their network, including expenses.
Service Entity providing the
service Recipient
Fees for the year ended 30 April
2018
(thousands of euros)
Audit PWC Sesa SpA 99
The amount includes the fees, out-of-pocket expenses and the supervisory fee.
28 Transactions with related parties
Relations maintained by the Company with related parties that are associated and parent companies are
mainly of a commercial and financial nature.
The Company believes that all relations maintained with related parties are substantially regulated on the
basis of standard market conditions.
The table below shows details of the financial balances with related parties at 30 April 2018 and 2017.
Subsidiaries
Associated
Companie
s
Parent
Companies
Top
manageme
nt
Other
related
parties
Total
% on the
balance-
sheet
item (in thousands of euros)
Current trade receivables
At 30 April 2018
260
8 3
271 31.5%
At 30 April 2017 222 13 5
240 35.6%
Other current receivables
and assets
At 30 April 2018
6,500
6,500 83.0%
At 30 April 2017 9,857 9,857 97.3%
Employee benefits
At 30 April 2018
1
1 0.1%
At 30 April 2017
1
1 0.1%
Payables to suppliers
At 30 April 2018 59
59 13.7%
At 30 April 2017 40
40 9.8%
Other current liabilities
At 30 April 2018 -
72 72 2.8%
At 30 April 2017 1
63
64 1.0%
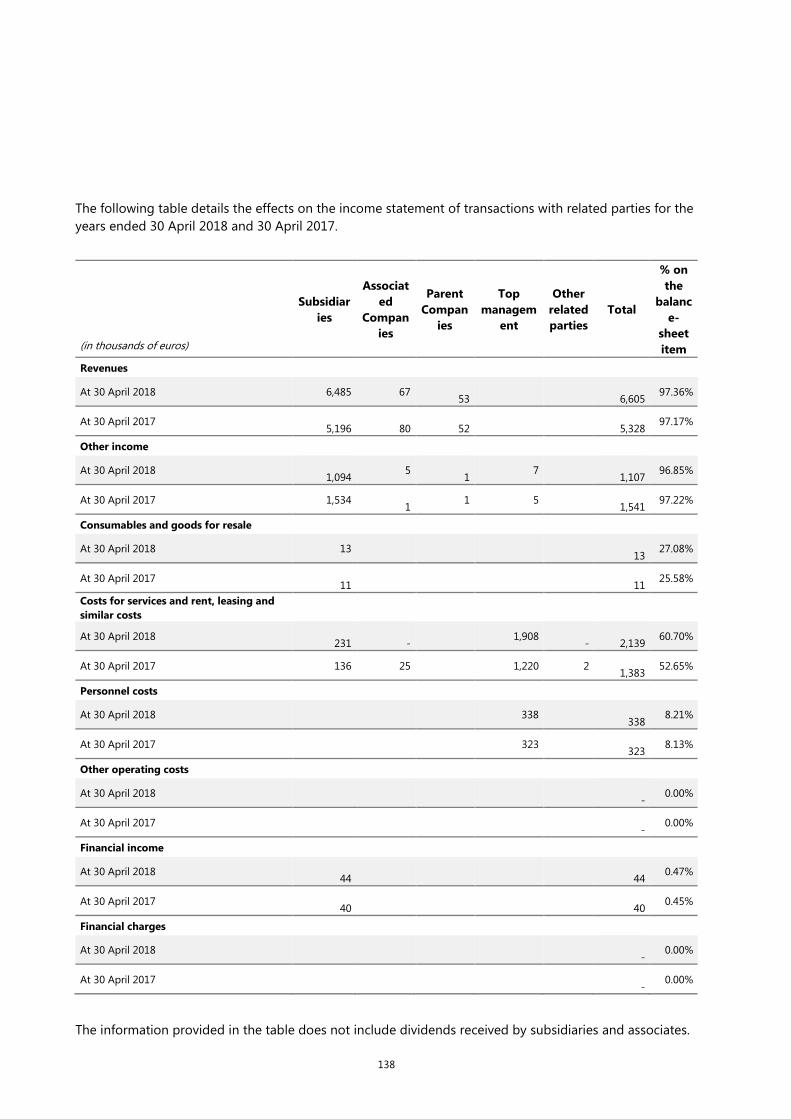
138
The following table details the effects on the income statement of transactions with related parties for the
years ended 30 April 2018 and 30 April 2017.
Subsidiar
ies
Associat
ed
Compan
ies
Parent
Compan
ies
Top
managem
ent
Other
related
parties
Total
% on
the
balanc
e-
sheet
item (in thousands of euros)
Revenues
At 30 April 2018 6,485 67
53
6,605 97.36%
At 30 April 2017
5,196
80
52
5,328 97.17%
Other income
At 30 April 2018
1,094 5
1 7
1,107 96.85%
At 30 April 2017 1,534
1 1 5
1,541 97.22%
Consumables and goods for resale
At 30 April 2018 13
13 27.08%
At 30 April 2017
11
11 25.58%
Costs for services and rent, leasing and
similar costs
At 30 April 2018
231
- 1,908
-
2,139 60.70%
At 30 April 2017 136 25 1,220 2
1,383 52.65%
Personnel costs
At 30 April 2018 338
338 8.21%
At 30 April 2017 323
323 8.13%
Other operating costs
At 30 April 2018
- 0.00%
At 30 April 2017
- 0.00%
Financial income
At 30 April 2018
44
44 0.47%
At 30 April 2017
40
40 0.45%
Financial charges
At 30 April 2018
- 0.00%
At 30 April 2017
- 0.00%
The information provided in the table does not include dividends received by subsidiaries and associates.

139
Subsidiaries, Associated and Parent Companies
Relations with subsidiaries, associated and parent companies mainly relate to the supply of administration,
finance and control services, organisation, personnel management and the management of information
systems for the Group companies. At 30 April 2018 there are interest-bearing financial receivables from
subsidiaries for Euro 6.5 million. Under payables and receivables to/from subsidiaries are recognised
receivables and payables relating to tax consolidation and Group VAT.
Top Management
Relations with top management mainly relate to the fees due to directors and executives with strategic
responsibilities. Specifically, “personnel costs” include fees due to members of the companies’ Board of
Directors, which were not included in “costs for services”.
29 Events After the Year-End
No significant events occurred after the year-end.
30 Authorisation for publication
The publication of the Separate financial statements of Sesa SpA at 30 April 2018 was authorised by
resolution of the Board of Directors on 12 July 2018.
140
Attestation of the Separate Financial Statements pursuant to art. 154-bis of
Italian Legislative Decree no. 58/98
1. The undersigned Paolo Castellacci, in his capacity as Chairman of the Board of Directors, and
Alessandro Fabbroni, in his capacity as Financial Reporting Manager of Sesa S.p.A.’s accounting
documents, certify, also taking into account that envisaged by article 154‐bis, paragraphs 3 and 4
of Legislative Decree no. 58 of 24 February 1998:
the adequacy in relation to the enterprise characteristics and
the effective application of the administrative and accounting procedures for the preparation
of the separate financial statements at 30 April 2018.
2. No important aspects emerged from the application of the administrative and accounting
procedures for the preparation of the separate financial statements at 30 April 2018.
3. It is also certified that:
3.1 The separate financial statements:
a) are drawn up in compliance with the applicable international accounting standards recognised
by the European Community, pursuant to EC regulation no. 1606/2002 of the European Parliament
and Council, dated 19 July 2002;
b) correspond to the company accounts, books and records;
c) offer a true and fair representation of the financial position, results of operations and cash flows
of the issuer.
3.2 the Report on Operations includes a reliable analysis of the performance and of the operating
result, as well as of the situation of the issuer and of the group of companies included within the
scope of consolidation, together with a description of the main risks and uncertainties to which
they are exposed.
Empoli, 12 July 2018
Paolo Castellacci Alessandro Fabbroni
Chairman of the Board of Directors Financial Reporting Manager

141
Independent Auditor’s Report on the Separate Financial Statements of Sesa
SpA

142

143
144
145

146
Report of the Board of Satatutory Auditors to the Shareholders’ Meeting
Dear Shareholders,
With this report, prepared pursuant to art. 153 of Legislative Decree no. 58/98 and art.
2429, paragraph 3 of Civil Code, the Board of Statutory Auditors of Sesa S.p.A. wants to make
you aware of supervisory and control activities, according to its role, during the year ended
30 April 2018.
1. NORMATIVE, REGULATORY AND DEONTOLOGICAL SOURCES
During the year ended 30 April 2018, the Board of Statutory Auditors carried out the supervisory activity pursuant to article 149 of Legislative Decree no. 58/98 in accordance with the Rules of Conduct of the Board of Statutory Auditors, as recommended by the National Councils of Professional and Public Accountants with documents of April 2015 updated on April 2018 (Consigli Nazionali dei Dottori Commercialisti e degli Esperti Contabili) and the recommendations of Consob about audit and activities of the Board of Statutory Auditors (and , in particular: Communication no . 1025564 of 6 April 2001, as subsequently integrated with Communication no. 3021582 of 4 April 2003 and Communication no. 6031329 of 7 April 2006) and the guidance provided in the Code of Corporate Governance in the version updated to July 2015, adopted by the Company.
The Board of Statutory Auditors, during the year, carried out its activities by performing 6 meetings, all duly recorded, lasting about 80 minutes each; at the meetings of the Board of Statutory Auditors attended the Group's Internal Auditor.
The Board also took part in 6 meetings of the Board of Directors held during the year ended 30 April 2018.
The Board of Statutory Auditors, together with the Supervisory Board (of which a member of the Board of Statutory Auditors holds the office of President), every six months, met with representatives of the company in charge of statutory audit of accounts.
The Chairman of the Board of Statutory Auditors attended the meetings of Control and Risk Commitee.
The Board of Statutory Auditors asked for and received regular reports from the administrative body, the Independent Auditors, the Parties involved in Control and Risk Management, the Internal Auditor, the Supervisory Board.
The Board of Statutory Auditors also examined the company's documentation, accounting and not, that was provided by the persons responsible of the various functions.
On the Basis of the information acquired during the supervisory activities, the Board of Statutory Auditors did not verify any omissions and/or reprehensible events and/or irregularities or anyway significant facts, such as to be reported to supervisory Bodies or to be mentioned in this report; the Board of Statutory Auditors also noted that have not received any complaints pursuant to art. 2408 Civil Code.
The Board of Statutory Auditors also reports that, with reference to the obligations relating to non-financial information pursuant to Legislative Decree no. 254/2016, the
147
legislation introduced provides that the public-interest entities involved prepare, for each fiscal year, a declaration aimed to ensuring to the public a properly information about the company's business, its performance, its results and the impact on energetic, environmental, social and personnel issues as well as on respect for human rights and the fight against active and passive corruption. The declaration reports, among other things, the main risks generated or suffered in relation to the above-mentioned issues as well as the business model of activities’ management and organization, the policies carried out and the actions adopted by the Group in order to manage them.
The Independent Auditors verified the preparation of the non-financial information and expressed, with a specific report issued on 24/07/2018, separate from that relative to the financial statements, a report of compliance about the information provided compared to the provisions of the Legislative Decree.
2. SUPERVISORY ACTIVITY
2.1. Supervisory activity on compliance with the law, the Statute and the Code of Corporate Governance for Listed Companies currently in force
The Board of Statutory Auditors notes that the flow of internal and external information, have been implemented by the Company by means the coordination between the parties involved pursuant the law, the Statute and the Code of Corporate Governance, as outlined in the Report on Corporate Governance and ownership structure prepared by Board of Directors pursuant to art . 123-bis of TUF.
The Board of Statutory Auditors also states that:
- the obligations relative to confidential information are regulated by a "Procedure for reporting to the public of Confidential Information" adopted by the Board of Directors in the meeting of 25 June 2013;
- The Group continues to manage and update the Register of Internal Dealing according to Internal Dealing Procedure approved by the Board of Directors on 25 June 2013, recently updated by Board of Directors on 30 May 2016 in order to make it compliant to some of the provisions contained in art. 18 of the EU Regulation n. 596/2014, even in advance of its applications on 3 July 2016, issuing a mandate to the Chairman of the Board of Directors to make the amendments to the Internal Dealing Procedure that would have been necessary following any interventions by Consob;
- the management of the requirements arising from the Internal Dealing regulation takes place according to the Internal Dealing Procedure approved by the Board of Directors on 25 June 2013, as amended on 22 December 2015 and on 30 May 2016 and finally on 14 July 2017.
The Board of Statutory Auditors acknowledges that, according to information collected during its supervisory activity, every office or function of the Company has duly complied with the information requirements imposed by law.
Based on information obtained referring to the period before the appointment of this Board of Statutory Auditors, no violations of law, the Code of Corporate Governance, Statute of the Company and its Board/Committees have been noted or compliant received from

148
shareholders.
The Board of Statutory Auditors met regularly in the year, during which it also took part in meetings of the Board of Directors.
The Board of Statutory Auditors notes that starting from July 2017, Sesa Group has undertaken a project to adapt the organization to the data processing in compliance with the provisions from the above Regulation. Specifically, it’s appointed a Group’s company that already carries out privacy consulting, for assessment, gap analysis and remediation activities relating to companies belonging to the Group. At the same time, an inter-functional working group made up of Group's legal resources was set up in order to support the consulting company in the implementation of the legislation on Group’s companies. With subsequent resolution of the Board of Directors held on 16 May 2018, Sesa Spa appointed the Data Protection Manager to perform the activities identified in art. 39 of the GDPR and the specific data protection guidelines.
2.2. Supervisory activity on compliance with principles of proper management
Based on information obtained performing control and supervisory activities, in particular information received from the Directors on quarterly basis regarding the Group (parent and subsidiaries) main activities and operations with economics, financial e patrimonial impact, as well as information obtained from corporate documentation, we are not aware of any:
- operations not compliant with principles of good management;
- operations not compliant with law and the Statute;
- operations outside Company scope;
- operations in contrast with Shareholders’ Meetings’ resolutions or such as to compromise the integrity of social assets;
- operations in a potential conflict of interest.
2.3. Supervisory activity on adequacy of the Company’s structure
The Board of Statutory Auditors checked the adequacy of the Company’s structure, through information collecting from the function responsibles and regular exchanges of information with the Auditing Company.
The Board of Statutory Auditors has no particular observations about the Company's organization, that, as regards the structure, procedures, skills and responsibilities, at the moment, seems to be appropriate to the size of the Company, as well as the nature and mode through which it is proposed the achievement of the corporate objects.
The Board of Directors in office is made up of eight components; The members of the Board of Directors include three independent directors, of which the company confirmed compliance with independence requirements art. 147-ter, par. 4, of the TUF and by art. 3 of the Code of Corporate Governance, according with art. 2.2.3, par. 3, letter l) of the Regulation of the Borsa Italiana and by art. IA.2.10.6 of the Instructions for Regulation of the

149
Borsa - both applicable to issuers in possession of STAR qualification. In this respect, Board of Statutory Auditors confirms the compliance by the Company with the law and regulations and principles and criteria established by the Code of Corporate Governance.
The Company's Board of Directors has full powers for the ordinary and extraordinary management of the Company, with the authority to perform all acts deemed appropriate to achieve the corporate objects, excluding only those reserved by law to the Shareholders' Meeting; In compliance with art. 15 of the Statute, the board of directors is granted the faculty, notwithstanding the concurrent competence of the extraordinary Shareholders' Meeting, to take on the resolutions concerning mergers and demergers in the cases envisaged by articles 2505 and 2505-bis, c.c., the setting up or shutting down of secondary offices, the indication of which among the Directors shall represent the Company, the reduction of the share capital in the event of withdrawal by a Shareholder, the adaptations of the Statute to legislative provisions, the transferral of the registered office within Italy.
Board of directors decided to allocate powers within the Board instead of appoint an Executive Committee. In this respect, Board of Statutory Auditors verified correspondence between organizational structure and power of attorney.
Board of Statutory Auditors in charge, composed by three standing auditors and two supplementary auditors, verified the existence of the requirements of independence of each auditors (check performed and sent on 27 June 2018) , in compliance with art. 2397 Civil Code, as well as no grounds for ineligibility or incompatibility exist, and that they meet the requirements established by art. 2382 and 2399 Civil Code, art. 148, paragraph 3 of the TUF and art.8 of the Code of Corporate Governance. Members of the Board of Statutory Auditors compliant with the limits on the cumulation of positions established by the prevailing legislation art 148-bis of TUF and artt. 144-duodecies and following of the Consob Issuer's Regulation.
The function of audit of accounts has been given in accordance with art. 2364 Civil Code to the Auditing Company PricewaterhouseCoopers SpA, by resolution of 15 July 2013 with effect until approval of the financial year ended 30 April 2022.
2.4. Supervisory activity on adequacy of internal control systems and risk management
Board of Statutory Auditors confirms that the Board of Directors of Sesa Spa established the type and level of risk compatible with the issuer's strategic aims, both during the preparation for the listing and systematically in relation to the indications supplied by the Audit and Risks Committee. This has been disclosed in the Annual Report at 30 April 2017 and Board of Statutory Auditors has no issues to report.
The Board of Directors, in line with the contents of par. 7.C.1 of the Code of Corporate Governance, performs the role of guiding and assessing the adequacy of the internal audit and risk management system, using work perfomed by Appointed Director for the Internal Audit and Risk Management System and an Audit and Risks Committee.
The subjects and functions involved in internal control systems and risk management are:
- the Board of Directors, assisted by the Control and Risk Committee and the Internal Auditor;
- the Board of Statutory Auditors;
- the Supervisory Board;
150
- Internal Auditor;
- the Manager responsible for drawing up the Company’s accounts.
The Board of Statutory Auditors states that, in the year:
- checked the activities of Subjects responsible of internal control;
- had regular meetings with subjects involved in internal control systems and risk
management; in this regard, it should be noted that the Internal Auditor participated in all
Board of Statutory Auditors' meetings;
- its Chairman participated to meetings of Control and Risk Committee;
- one of its members participated to the Supervisory Board's meetings, as Chairman;
- examined business documents;
- analyzed the results obtained by the Indipendent Auditors;
- verified the results obtained by the Supervisory Board.
During the year, Board of Statutory Auditors obtained from the Supervisory Board all the useful information in order to verify independence, adequacy, and competences requirements necessary to performs activities assigned.
Board of Statutory Auditors has been informed by the Supervisory Board regarding the effectiveness and observance of the Organisational and management model pursuant to Legislative Decree 231/2001.
With a report of 30 May 2018, the Supervisory Board disclosed results of its activities of the year ended at 30 April 2018 with no significant issue, confirming compliance with the management model pursuant to Legislative Decree 231/2001 and demanding update of the general part of the management model.
The Board of Statutory Auditors appreciated the effort of the Company to improve and amend its internal control framework, quickly updated in order to be compliant to the latest regulamentary requirements adopted. In this regard, we noted:
- the update of 14 July 2017 of the procedure adopted by the Board of Directors on 25 June 2013 for the management of the Group Register of persons who have access to Confidential Information to comply with the regulatory updates introduced by art. 18 of EU Regulation n. 596/2014, empowering the Chairman of the Board of Directors to review the procedure in order to be compliant with Consob;
- Management model pursuant to Legislative Decree 231/2001 adopted on 27 February 2013 has been amended on December 2016 and a subsequent regulatory update (last update registered of 31 October 2017);
- Issuing of a plan to integrate administrative and accounting procedures aimed at harmonizing control standards and procedures and group risk analysis. The project was shared with the Board of Statutory Auditors, Supervisory Board pursuanto to Legislative Decree 231/2001 as well as with the Control and Risks Committee. At the moment the project is under construction ad it is expected to be completed on October.
Based on information obtained we confims the methods of coordination set up by the Company among the various parties involved in the Internal Audit and Risk Management

151
System guarantee, an effective and efficient sharing of information among the bodies with these functions and Company internal controls is adequate.
2.5. Supervisory activity on adequacy of administrative and accounting system and auditing activity
2.5.1Supervisory activity on administrative and accounting system
The Board of Statutory Auditors supervised on the adequacy of administrative and
accounting system to correctly represent the business events through direct observations,
information obtained from the heads of the various departments, the exam of company's
documents and the analysis of the results obtained by the Indipendent Auditors.
The Board of Statutory Auditors examined the results of tests conducted by KPMG S.p.A.
(the relative report was made available on 09/07/2018) to test the operating effectiveness
of the internal control system on the administrative and accounting procedures to oversee
the financial reporting and, taking into account the outcome of the tests, no deficiencies in
the adequacy and effective application of procedures is revealed.
2.5.2Supervisory activity on Indipendent Auditors' job
The Board of Statutory Auditors carried out the supervisory activity on the job of
Indipendent Auditors which, as said, is PricewaterhouseCoopers S.p.A.
The Board of Statutory Auditors met the Indipendent Auditors several times during the
year in order to exchange data and information relating to their respective activities. The
Board of Statutory Auditors acknowledges that PricewaterhouseCoopers S.p.A. performed
the audit of financial statements in accordance with International Standards on Auditing (ISA
Italy) established pursuant to art. 11 of Legislative Decree no. 39/2010 and that the resulting
report pursuant to art. 14, paragraph 2, of Legislative Decree no. 39/2010, issued on 24 July
2018, did not reveal any facts considered reprehensible or irregularities to be pointed out
pursuant art. 155 of Consolidated Financial Act (TUF).
It is pointed out that, according to the express declaration of the Board of Directors,
confirmed by PricewaterhouseCoopers S.p.A., Sesa S.p.A. did not confer additional
assignments to the Indipendent Auditors or to parties related to the latter by continuous
relationships.
2.6. Comments on statutory and consolidated financial statements
The Board of Statutory Auditors examined the draft of the statutory and consolidated
financial statements at 30 April 2018, which is available notwithstanding to art. 154-ter,
paragraph 1-ter of Legislative Decree no. 58/98.
Not being entitled to this Board the analytical control of the content of the financial
statements, the Board of Statutory Auditors monitored the compliance with the procedural
requirements concerning the preparation and setting of the draft of the statutory and
152
consolidated financial statements at 30 April 2018 and points out to have no particular
comments.
In particular, regarding the statutory financial statements as of 30 April 2018, the Board
of Statutory Auditors verified the compliance with laws regulating its setting and
development, by means of checks and through the information provided by the Indipendent
Auditors, within the Board's competence pursuant to art. 149 Legislative Decree no. 58/98.
The Board of Statutory Auditors also verified the compliance of the financial statements
to the facts and information known following the execution of its duties and has no
comments.
The Board of Statutory Auditors has no specific comments about the Report on
Operations which has been prepared in accordance with the law.
2.7. Application of corporate governance principles
Board of Statutory Auditors noted the Companys’ adoption of the Code of Corporate
Governance drawn up by the Committee for Corporate Governance of listed companies in
the latest version of July 2015 and relative amendments to corporate governance structure.
Board of Statutory Auditors confirmed the Report on corporate governance and
ownership structures has been prepared in compliance with art. 123-bis of the TUF,
according to instructions and principles included in Regulation of the Borsa Italiana and
noted the disclosure of adoption level of the Code of Corporate Governance.
2.8. Supervisory activities regarding relations with subsidiaries and transactions with related parties
Board of Statutory Auditors confirmed periodic inspections and audits of the Company
didn’t show atypical and/or unusual, with third parties, related parties or within the Group,
as defined by Consob Communication of 28 July 2006.
Regarding intra-group transactions, Board of Statutory Auditors confirmed, as disclosed
by the Directors in the Note to financial statements, the existence of numerous commercial
relations, concerning overall the sale and purchase of hardware and software products and
technical support, stating that they have been regulated on the basis of normal market
conditions.
In this regard, we note that at the meeting of 23 September 2013, the Board of
Directors also approved the adoption of the "Procedure for transactions with related
parties" adopted pursuant to Consob Regulation n. 17221 of 12 March 2010 and
subsequent amendments thereto, appointing the Audit and Risks Committee as Related
Parties Committee.
153
3. CONCLUSIONS
On the basis of the above, a compendium of the supervisory activity carried out during
the year, the Board of Statutory Auditors, taking into account the results of the activity
carried out by the Auditing Company and contained in the Audit Reports relating to statutory
and consolidated financial statements, do not have observations to make pursuant to art.
153 of Legislative Decree n. 58/98 on the extent of its competence regarding statutory and
consolidated financial statements and related notes and the management report.
Empoli, 24 July 2018
THE BOARD OF STATUTORY AUDITORS
Prof. Avv. Sergio Menchini – Chairman
Dott. Luca Parenti – Standing Auditor
Dott.ssa Chiara Pieragnoli – Standing Auditor
This report has been traslated into English from the Italian original solely for the convenience
of international readers