Embed Size (px)
Citation preview

FOR DISCLOSURES AND OTHER IMPORTANT INFORMATION, PLEASE REFER TO THE BACK OF THIS REPORT.
February 23, 2016
Authors
Michael J. Mauboussin
Dan Callahan, CFA
Darius Majd
Source: Credit Suisse HOLT® and FactSet Estimates.
“‘Pallid’ statistical information is routinely discarded when it is incompatible with one’s personal impressions of a case.”
Daniel Kahneman1
Successful active investing requires a forecast that is different than what
the market is discounting.
Forecasts about outcomes relevant to us commonly suffer from biases of
optimism and overconfidence.
Research reveals that consideration of the results for an appropriate
reference class can enhance the quality of forecasts.
Sales growth is the most important value driver for most companies.
This report shows the base rate of sales growth rates for a large sample of
companies over more than six decades. We sort the companies into
deciles, allowing for easy identification of an appropriate reference class.
We provide a method to integrate individual views with base rates in order
to improve forecasts.
0
5
10
15
20
25
30
35
40
<(2
5)
(25)-
(20)
(20)-
(15)
(15)-
(10)
(10)-
(5)
(5)-
0
0-5
5-1
0
10
-15
15
-20
20
-25
25
-30
30
-35
35
-40
40
-45
>4
5
Fre
quency
(P
erc
ent)
3-Year Net Income CAGR (Percent)
Base Rates
Current Estimates
GLOBAL FINANCIAL STRATEGIES
www.credit-suisse.com
The Base Rate Book – Sales Growth Integrating the Past to Better Anticipate the Future

February 23, 2016
The Base Rate Book – Sales Growth 2
Introduction
An investor’s primary task is to determine whether the expectations for future financial performance, as implied by the stock price, are too optimistic or pessimistic relative to how the company is likely to perform. In
other words, the intelligent investor seeks gaps between expectations and fundamentals.2 This approach does not require forecasts of pinpoint accuracy, but rather only judgments as to whether the expectations
embedded in the shares are too high or low.
Sales growth is the most important driver of corporate value.3 For companies that earn a return on invested capital in excess of the cost of capital, growth amplifies value creation. For those that earn a return below the
opportunity cost, growth destroys value. Sales growth ripples through the income statement by determining operating leverage and the degree of economies of scale a company can realize.
Naturally, executives want their companies to generate healthy rates of sales growth, and more than a third of
the companies in the S&P 500 Index provide guidance for sales growth.4 Researchers who study forecasts find two common biases: optimism and overconfidence.
Optimism about predictions that are personally important encourages perseverance in the face of adversity but also offers a distorted view of likely outcomes.5 Consider that only about one-half of new businesses survive
five or more years. Notwithstanding that fact, a survey of thousands of entrepreneurs found that more than 8 of 10 of them rated their odds of success at 70 percent or higher, and fully one-third did not allow for any
probability of failure at all.6 The bottom line on optimism: “People frequently believe that their preferred outcomes are more likely than is merited.”7
Overconfidence also distorts the ability to make sound predictions. This bias reveals itself when an individual’s
confidence in his or her subjective judgments is higher than the objective outcomes warrant. For instance, more than five thousand people answered 50 true-false questions and provided a confidence level for each. On average, they were 60 percent correct but were 70 percent confident in their answers. When these
subjects were 100 percent confident in their response, they were correct only 77 percent of the time.8 Most people, including financial analysts, place too much weight on their own information.9
Overconfidence shows up in forecasts as ranges of outcomes that are too narrow.10 As a case in point,
researchers asked chief financial officers to predict the results for the stock market, including high and low growth rates of return within which the executives were 80 percent sure the results would land. They were
correct only one-third of the time.11
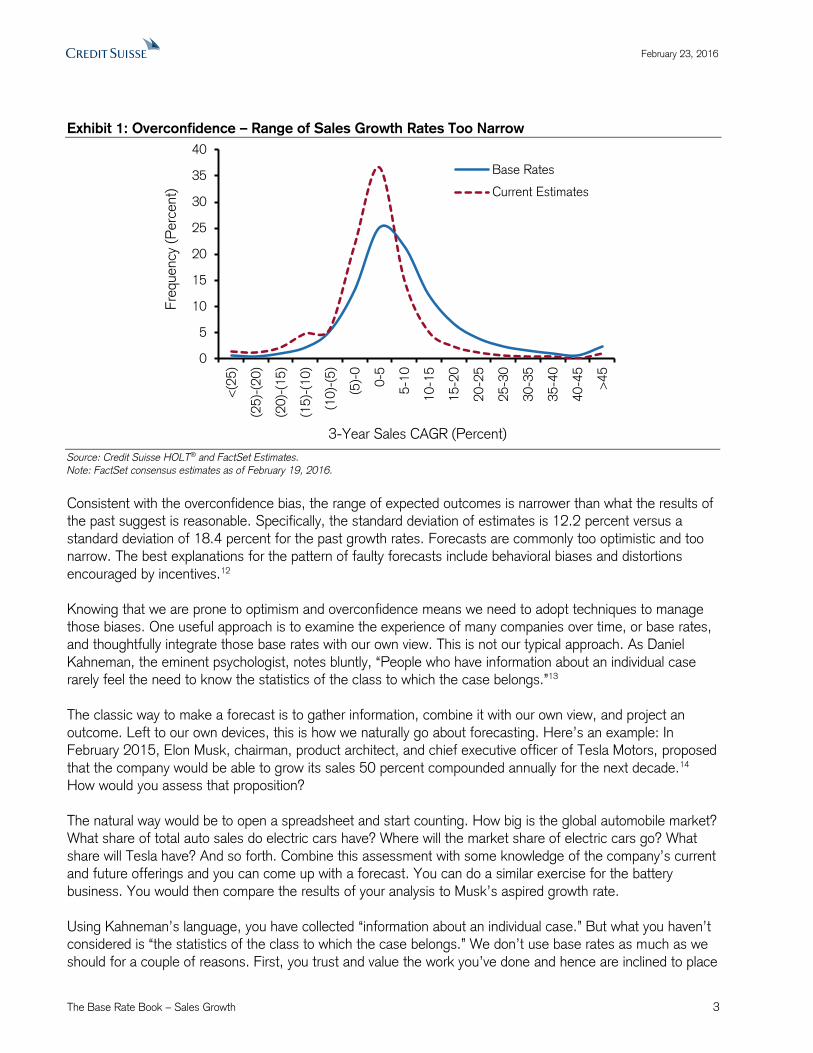
Exhibit 1 shows how this bias manifests in forecasts of revenue growth. The solid line is the distribution of sales growth rates, annualized over three years and adjusted for inflation, for the 1,000 largest companies in
the world by market capitalization. These base rates reflect results from 1950 to 2014. The dashed line is the distribution of available analyst forecasts for the sales growth rates of the largest 1,000 companies today.
February 23, 2016
The Base Rate Book – Sales Growth 3
Exhibit 1: Overconfidence – Range of Sales Growth Rates Too Narrow
Source: Credit Suisse HOLT® and FactSet Estimates.
Note: FactSet consensus estimates as of February 19, 2016.
Consistent with the overconfidence bias, the range of expected outcomes is narrower than what the results of the past suggest is reasonable. Specifically, the standard deviation of estimates is 12.2 percent versus a
standard deviation of 18.4 percent for the past growth rates. Forecasts are commonly too optimistic and too narrow. The best explanations for the pattern of faulty forecasts include behavioral biases and distortions
encouraged by incentives.12
Knowing that we are prone to optimism and overconfidence means we need to adopt techniques to manage those biases. One useful approach is to examine the experience of many companies over time, or base rates, and thoughtfully integrate those base rates with our own view. This is not our typical approach. As Daniel
Kahneman, the eminent psychologist, notes bluntly, “People who have information about an individual case rarely feel the need to know the statistics of the class to which the case belongs.”13
The classic way to make a forecast is to gather information, combine it with our own view, and project an
outcome. Left to our own devices, this is how we naturally go about forecasting. Here’s an example: In February 2015, Elon Musk, chairman, product architect, and chief executive officer of Tesla Motors, proposed
that the company would be able to grow its sales 50 percent compounded annually for the next decade.14
How would you assess that proposition?
The natural way would be to open a spreadsheet and start counting. How big is the global automobile market? What share of total auto sales do electric cars have? Where will the market share of electric cars go? What
share will Tesla have? And so forth. Combine this assessment with some knowledge of the company’s current and future offerings and you can come up with a forecast. You can do a similar exercise for the battery
business. You would then compare the results of your analysis to Musk’s aspired growth rate.
Using Kahneman’s language, you have collected “information about an individual case.” But what you haven’t considered is “the statistics of the class to which the case belongs.” We don’t use base rates as much as we
should for a couple of reasons. First, you trust and value the work you’ve done and hence are inclined to place
0
5
10
15
20
25
30
35
40
<(2
5)
(25)-
(20)
(20)-
(15)
(15)-
(10)
(10)-
(5)
(5)-
0
0-5
5-1
0
10
-15
15
-20
20
-25
25
-30
30
-35
35
-40
40
-45
>4
5
Fre
quency
(P
erc
ent)
3-Year Sales CAGR (Percent)
Base Rates
Current Estimates

February 23, 2016
The Base Rate Book – Sales Growth 4
a lot of weight on it. Second, base rates are rarely at your fingertips. You have to find a suitable reference class and incorporate the information appropriately.
Though decision scientists have known for a long time that the proper integration of base rates improves the
quality of forecasts, the technique remains remarkably underused.15 We believe this reflects the human desire for a narrative. Causality is clear in stories about the specifics, which makes those scenarios vivid. Base rates,
on the other hand, are largely antiseptic and hence less appealing to the mind.
Base Rates of Sales Growth
We analyze the distribution of sales growth rates for the top 1,000 global companies by market capitalization since 1950.16 This sample represents roughly 60 percent of the global market capitalization and includes all
sectors. The population includes companies that are now “dead.” The main reason public companies cease to exist is they merge or are acquired.17
We calculate the compound annual growth rates (CAGR) of sales for 1, 3, 5, and 10 years for each firm. We adjust all of the figures to remove the effects of inflation, which translates all of the numbers to 2014 dollars.
Exhibit 2 shows the results for the full sample. In the panel on the left, the rows show sales growth rates and
the columns reflect time periods. Say you want to know what percent of the universe grew sales at a CAGR of 15-20 percent for three years. You start with the row marked “15-20” and slide to the right to find the column
“3-Yr.” There, you’ll see that 6.8 percent of the companies achieved that rate of growth. The panel on the right shows the sample sizes for each growth rate and time period, allowing us to see where that percentage
comes from: 3,261 instances out of the total of 48,136 (3,261/48,136 = 6.8 percent).
Exhibit 2: Base Rates of Sales Growth (1950-2014)
Source: Credit Suisse HOLT®. Note: CAGR = compound annual growth rate.
Full Universe Full Universe
Sales CAGR (%) 1-Yr 3-Yr 5-Yr 10-Yr Sales CAGR (%) 1-Yr 3-Yr 5-Yr 10-Yr
<(25) 1.8% 0.6% 0.3% 0.0% <(25) 947 273 152 14
(25)-(20) 1.0% 0.5% 0.3% 0.1% (25)-(20) 524 221 113 30
(20)-(15) 1.7% 1.1% 0.7% 0.3% (20)-(15) 859 515 307 110
(15)-(10) 3.1% 2.2% 1.7% 0.9% (15)-(10) 1,608 1,053 758 334
(10)-(5) 6.2% 5.2% 4.3% 3.4% (10)-(5) 3,174 2,509 1,925 1,235
(5)-0 12.1% 13.1% 13.0% 13.1% (5)-0 6,236 6,319 5,842 4,785
0-5 20.6% 25.1% 28.8% 34.6% 0-5 10,597 12,079 12,897 12,668
5-10 18.0% 21.4% 24.2% 28.2% 5-10 9,272 10,300 10,828 10,321
10-15 11.4% 12.3% 12.5% 11.2% 10-15 5,899 5,916 5,607 4,120
15-20 6.8% 6.8% 6.0% 4.3% 15-20 3,520 3,261 2,666 1,580
20-25 4.5% 3.9% 3.1% 1.9% 20-25 2,322 1,874 1,393 679
25-30 3.0% 2.4% 1.9% 1.0% 25-30 1,541 1,145 845 359
30-35 2.0% 1.5% 1.0% 0.5% 30-35 1,031 739 441 178
35-40 1.3% 1.0% 0.7% 0.3% 35-40 695 495 301 96
40-45 1.0% 0.7% 0.4% 0.2% 40-45 523 317 191 62
>45 5.4% 2.3% 1.1% 0.3% >45 2,799 1,120 509 92
Mean 15.0% 8.0% 6.7% 5.5% Total 51,547 48,136 44,775 36,663
Median 5.8% 5.5% 5.2% 4.7%
StDev 287.0% 18.4% 12.0% 7.8%
ObservationsBase Rates
February 23, 2016
The Base Rate Book – Sales Growth 5
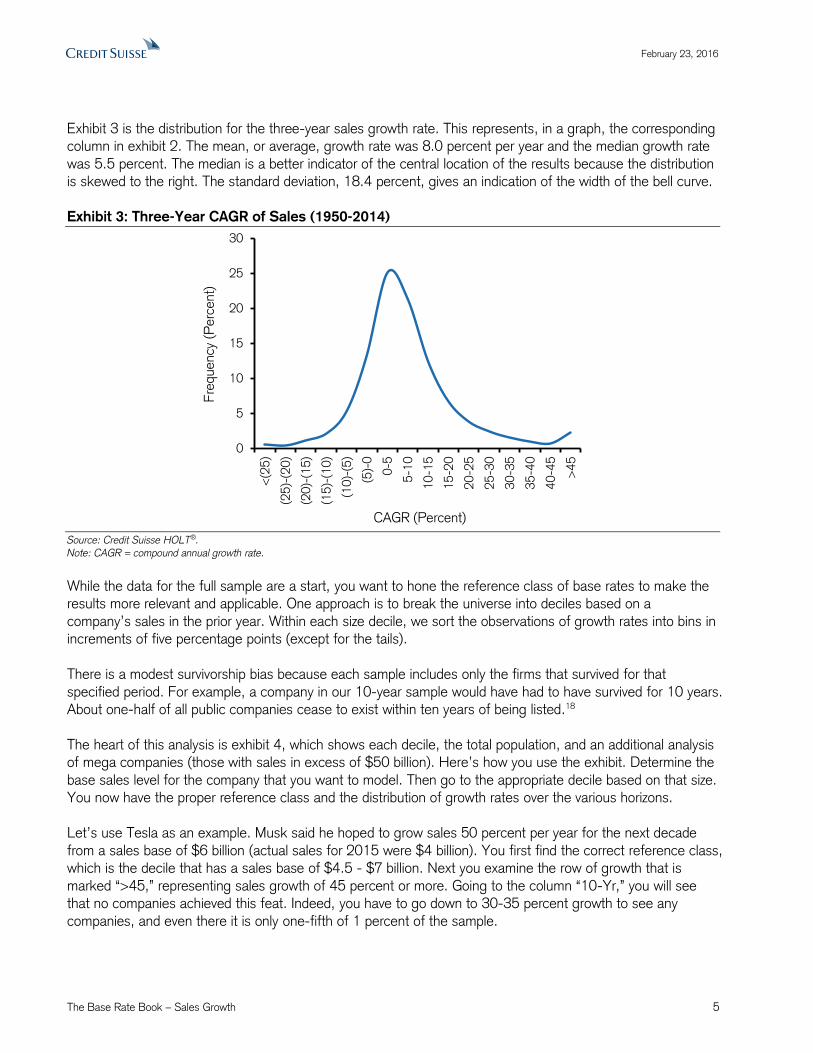
Exhibit 3 is the distribution for the three-year sales growth rate. This represents, in a graph, the corresponding column in exhibit 2. The mean, or average, growth rate was 8.0 percent per year and the median growth rate
was 5.5 percent. The median is a better indicator of the central location of the results because the distribution is skewed to the right. The standard deviation, 18.4 percent, gives an indication of the width of the bell curve.
Exhibit 3: Three-Year CAGR of Sales (1950-2014)
Source: Credit Suisse HOLT®.
Note: CAGR = compound annual growth rate.
While the data for the full sample are a start, you want to hone the reference class of base rates to make the results more relevant and applicable. One approach is to break the universe into deciles based on a
company’s sales in the prior year. Within each size decile, we sort the observations of growth rates into bins in increments of five percentage points (except for the tails).
There is a modest survivorship bias because each sample includes only the firms that survived for that
specified period. For example, a company in our 10-year sample would have had to have survived for 10 years. About one-half of all public companies cease to exist within ten years of being listed.18
The heart of this analysis is exhibit 4, which shows each decile, the total population, and an additional analysis of mega companies (those with sales in excess of $50 billion). Here’s how you use the exhibit. Determine the
base sales level for the company that you want to model. Then go to the appropriate decile based on that size. You now have the proper reference class and the distribution of growth rates over the various horizons.
Let’s use Tesla as an example. Musk said he hoped to grow sales 50 percent per year for the next decade
from a sales base of $6 billion (actual sales for 2015 were $4 billion). You first find the correct reference class, which is the decile that has a sales base of $4.5 - $7 billion. Next you examine the row of growth that is
marked “>45,” representing sales growth of 45 percent or more. Going to the column “10-Yr,” you will see that no companies achieved this feat. Indeed, you have to go down to 30-35 percent growth to see any
companies, and even there it is only one-fifth of 1 percent of the sample.
0
5
10
15
20
25
30
<(2
5)
(25)-
(20)
(20)-
(15)
(15)-
(10)
(10)-
(5)
(5)-
0
0-5
5-1
0
10
-15
15
-20
20
-25
25
-30
30
-35
35
-40
40
-45
>4
5
Fre
quency
(P
erc
ent)
CAGR (Percent)

February 23, 2016
The Base Rate Book – Sales Growth 6
Exhibit 4: Base Rates by Decile (1950-2014)
Sales: $0-325 Mn
Sales CAGR (%) 1-Yr 3-Yr 5-Yr 10-Yr
<(25) 1.4% 0.5% 0.4% 0.0%
(25)-(20) 0.6% 0.2% 0.1% 0.0%
(20)-(15) 1.0% 0.4% 0.3% 0.3%
(15)-(10) 1.3% 1.2% 0.5% 0.6%
(10)-(5) 3.2% 1.8% 1.3% 0.7%
(5)-0 6.8% 5.6% 4.4% 3.7%
0-5 13.6% 15.2% 16.2% 17.5%
5-10 15.1% 18.9% 22.0% 30.8%
10-15 12.2% 14.9% 18.1% 19.5%
15-20 9.1% 10.6% 10.1% 9.7%
20-25 6.6% 6.3% 6.6% 6.1%
25-30 4.4% 4.8% 5.1% 3.8%
30-35 3.8% 3.4% 3.2% 2.6%
35-40 2.6% 2.9% 2.8% 1.6%
40-45 2.1% 2.0% 1.8% 1.1%
>45 16.0% 11.5% 7.1% 2.0%
Mean 73.7% 21.9% 16.8% 12.2%
Median 12.8% 12.0% 11.1% 9.3%
StDev 950.6% 42.5% 22.3% 11.9%
Base Rates Sales: $325-700 Mn
Sales CAGR (%) 1-Yr 3-Yr 5-Yr 10-Yr
<(25) 1.0% 0.2% 0.1% 0.0%
(25)-(20) 0.4% 0.4% 0.1% 0.0%
(20)-(15) 1.1% 0.7% 0.4% 0.1%
(15)-(10) 2.3% 0.9% 0.9% 0.7%
(10)-(5) 4.0% 2.6% 1.9% 2.3%
(5)-0 8.6% 7.3% 6.9% 6.8%
0-5 19.3% 23.7% 24.6% 27.4%
5-10 18.3% 23.5% 29.2% 35.4%
10-15 13.6% 16.3% 16.5% 16.1%
15-20 8.2% 8.3% 7.8% 5.8%
20-25 6.5% 4.9% 4.1% 2.9%
25-30 3.6% 2.9% 2.5% 1.2%
30-35 2.2% 2.1% 1.8% 0.7%
35-40 1.8% 1.6% 0.9% 0.3%
40-45 1.4% 1.1% 0.8% 0.1%
>45 7.8% 3.5% 1.4% 0.1%
Mean 16.7% 11.2% 9.4% 7.3%
Median 8.6% 7.8% 7.3% 6.5%
StDev 53.3% 16.2% 11.0% 7.2%
Base Rates Sales: $700-1,250 Mn
Sales CAGR (%) 1-Yr 3-Yr 5-Yr 10-Yr
<(25) 1.5% 0.4% 0.3% 0.2%
(25)-(20) 0.9% 0.3% 0.4% 0.1%
(20)-(15) 1.4% 0.8% 0.6% 0.3%
(15)-(10) 2.5% 1.9% 1.3% 0.9%
(10)-(5) 4.5% 3.5% 3.4% 2.3%
(5)-0 9.7% 9.4% 9.0% 9.8%
0-5 19.2% 22.9% 25.9% 32.1%
5-10 18.7% 23.3% 25.9% 31.0%
10-15 12.5% 14.8% 15.6% 14.5%
15-20 8.2% 8.3% 7.4% 5.1%
20-25 5.1% 4.5% 4.4% 2.2%
25-30 3.3% 3.2% 2.4% 1.0%
30-35 2.8% 2.1% 1.1% 0.3%
35-40 2.0% 1.6% 1.0% 0.1%
40-45 1.4% 0.8% 0.4% 0.1%
>45 6.3% 2.3% 0.9% 0.0%
Mean 12.9% 9.4% 8.0% 6.1%
Median 7.4% 7.0% 6.5% 5.5%
StDev 32.8% 13.6% 10.6% 7.1%
Base Rates
Sales: $1,250-2,000 Mn
Sales CAGR (%) 1-Yr 3-Yr 5-Yr 10-Yr
<(25) 1.4% 0.4% 0.4% 0.0%
(25)-(20) 0.9% 0.4% 0.1% 0.1%
(20)-(15) 1.2% 0.8% 0.4% 0.4%
(15)-(10) 2.5% 1.7% 1.1% 0.8%
(10)-(5) 4.9% 3.9% 3.2% 2.1%
(5)-0 9.4% 10.6% 10.2% 10.3%
0-5 20.4% 24.7% 29.0% 36.6%
5-10 19.7% 23.9% 27.0% 30.2%
10-15 12.9% 13.3% 13.5% 12.3%
15-20 7.3% 7.3% 6.5% 4.1%
20-25 4.2% 4.1% 3.5% 1.5%
25-30 3.6% 3.0% 2.2% 0.8%
30-35 2.3% 1.9% 1.0% 0.3%
35-40 1.6% 1.0% 0.7% 0.1%
40-45 1.5% 0.6% 0.5% 0.2%
>45 6.2% 2.4% 0.8% 0.1%
Mean 12.8% 8.8% 7.3% 5.6%
Median 7.2% 6.3% 5.8% 5.0%
StDev 35.9% 14.2% 10.3% 6.8%
Base Rates Sales: $2,000-3,000 Mn
Sales CAGR (%) 1-Yr 3-Yr 5-Yr 10-Yr
<(25) 1.5% 0.4% 0.2% 0.0%
(25)-(20) 1.0% 0.2% 0.1% 0.1%
(20)-(15) 1.5% 1.0% 0.4% 0.1%
(15)-(10) 2.7% 1.8% 1.2% 0.3%
(10)-(5) 5.1% 4.8% 3.7% 2.7%
(5)-0 11.3% 12.0% 11.6% 13.1%
0-5 21.5% 26.5% 31.1% 38.1%
5-10 18.9% 22.5% 26.5% 28.7%
10-15 11.9% 12.8% 12.6% 10.3%
15-20 7.6% 6.8% 5.6% 4.5%
20-25 5.0% 4.4% 3.4% 1.1%
25-30 2.8% 2.4% 1.8% 0.8%
30-35 2.1% 1.4% 0.6% 0.1%
35-40 1.4% 1.0% 0.4% 0.1%
40-45 0.8% 0.7% 0.2% 0.1%
>45 4.9% 1.3% 0.4% 0.0%
Mean 10.2% 7.4% 6.3% 5.1%
Median 6.2% 5.5% 5.2% 4.5%
StDev 23.4% 12.1% 9.0% 6.1%
Base Rates Sales: $3,000-4,500 Mn
Sales CAGR (%) 1-Yr 3-Yr 5-Yr 10-Yr
<(25) 1.6% 0.5% 0.2% 0.0%
(25)-(20) 1.1% 0.4% 0.1% 0.0%
(20)-(15) 1.9% 0.9% 0.7% 0.0%
(15)-(10) 3.5% 2.0% 1.9% 0.6%
(10)-(5) 6.5% 5.2% 3.9% 2.8%
(5)-0 12.1% 14.4% 14.7% 15.2%
0-5 21.8% 26.1% 30.6% 40.5%
5-10 17.6% 22.5% 25.0% 27.7%
10-15 11.6% 11.8% 12.2% 8.6%
15-20 7.0% 7.1% 5.5% 3.1%
20-25 4.6% 3.6% 2.7% 0.8%
25-30 2.9% 2.2% 1.4% 0.4%
30-35 1.7% 1.3% 0.5% 0.1%
35-40 1.2% 0.7% 0.1% 0.0%
40-45 0.8% 0.4% 0.2% 0.0%
>45 4.1% 0.8% 0.2% 0.0%
Mean 8.7% 6.4% 5.4% 4.4%
Median 5.4% 5.1% 4.7% 4.0%
StDev 24.6% 11.3% 8.6% 5.7%
Base Rates

February 23, 2016
The Base Rate Book – Sales Growth 7
Source: Credit Suisse HOLT®.
Sales: $4,500-7,000 Mn
Sales CAGR (%) 1-Yr 3-Yr 5-Yr 10-Yr
<(25) 1.7% 0.5% 0.3% 0.0%
(25)-(20) 1.1% 0.7% 0.2% 0.2%
(20)-(15) 1.7% 1.0% 0.7% 0.1%
(15)-(10) 3.8% 2.8% 1.9% 1.1%
(10)-(5) 6.6% 5.5% 4.4% 4.1%
(5)-0 12.7% 14.6% 15.3% 15.3%
0-5 21.8% 27.8% 33.0% 40.5%
5-10 19.2% 21.4% 23.4% 26.6%
10-15 11.3% 10.9% 10.7% 7.8%
15-20 6.4% 6.2% 5.5% 2.7%
20-25 3.8% 3.7% 2.2% 0.8%
25-30 3.0% 1.9% 1.1% 0.5%
30-35 1.8% 1.2% 0.6% 0.2%
35-40 0.9% 0.5% 0.3% 0.0%
40-45 0.7% 0.4% 0.2% 0.0%
>45 3.7% 1.0% 0.4% 0.0%
Mean 8.0% 5.8% 5.0% 4.0%
Median 5.2% 4.5% 4.2% 3.7%
StDev 23.0% 11.8% 8.8% 6.1%
Base Rates Sales: $7,000-12,000 Mn
Sales CAGR (%) 1-Yr 3-Yr 5-Yr 10-Yr
<(25) 2.0% 0.5% 0.4% 0.0%
(25)-(20) 1.2% 0.5% 0.2% 0.1%
(20)-(15) 1.8% 1.2% 0.7% 0.6%
(15)-(10) 3.4% 2.9% 2.4% 1.0%
(10)-(5) 8.0% 7.2% 6.2% 4.5%
(5)-0 14.4% 16.8% 17.6% 18.5%
0-5 22.0% 27.6% 31.6% 40.4%
5-10 18.4% 20.3% 23.5% 25.1%
10-15 10.9% 10.7% 9.6% 6.5%
15-20 5.4% 5.4% 4.1% 2.2%
20-25 3.8% 3.1% 1.7% 0.7%
25-30 2.2% 1.5% 1.2% 0.3%
30-35 1.6% 1.0% 0.4% 0.1%
35-40 0.9% 0.4% 0.2% 0.1%
40-45 0.8% 0.3% 0.1% 0.0%
>45 3.2% 0.6% 0.1% 0.0%
Mean 7.0% 4.8% 4.0% 3.3%
Median 4.3% 3.8% 3.5% 3.2%
StDev 25.8% 10.8% 8.4% 5.9%
Base Rates Sales: $12,000-25,000 Mn
Sales CAGR (%) 1-Yr 3-Yr 5-Yr 10-Yr
<(25) 2.5% 0.9% 0.3% 0.0%
(25)-(20) 1.3% 0.6% 0.6% 0.1%
(20)-(15) 2.3% 1.8% 1.3% 0.5%
(15)-(10) 3.7% 2.9% 2.5% 1.4%
(10)-(5) 8.0% 7.4% 6.6% 5.8%
(5)-0 16.2% 18.8% 18.9% 20.4%
0-5 22.6% 27.8% 33.3% 40.5%
5-10 17.9% 20.1% 21.3% 21.2%
10-15 9.6% 9.3% 8.4% 6.7%
15-20 5.0% 4.4% 3.8% 2.6%
20-25 3.1% 2.7% 1.6% 0.7%
25-30 2.3% 1.3% 0.8% 0.1%
30-35 1.4% 0.9% 0.4% 0.0%
35-40 0.9% 0.4% 0.3% 0.0%
40-45 0.5% 0.3% 0.0% 0.0%
>45 2.6% 0.5% 0.1% 0.0%
Mean 5.1% 3.8% 3.3% 2.9%
Median 3.6% 3.2% 2.9% 2.8%
StDev 17.8% 10.5% 8.3% 6.0%
Base Rates
Sales: >$25,000 Mn
Sales CAGR (%) 1-Yr 3-Yr 5-Yr 10-Yr
<(25) 3.2% 1.4% 1.0% 0.1%
(25)-(20) 1.5% 0.8% 0.5% 0.2%
(20)-(15) 2.3% 1.9% 1.3% 0.7%
(15)-(10) 4.7% 3.4% 3.0% 2.1%
(10)-(5) 8.9% 9.1% 8.1% 8.4%
(5)-0 16.7% 19.4% 21.1% 23.2%
0-5 21.8% 27.2% 32.7% 37.3%
5-10 16.1% 18.5% 18.2% 20.6%
10-15 9.2% 9.3% 8.6% 5.9%
15-20 5.5% 4.3% 3.3% 1.3%
20-25 3.4% 2.2% 1.3% 0.2%
25-30 2.4% 1.1% 0.4% 0.0%
30-35 1.0% 0.4% 0.2% 0.0%
35-40 0.7% 0.5% 0.1% 0.0%
40-45 0.5% 0.2% 0.1% 0.0%
>45 2.0% 0.3% 0.0% 0.0%
Mean 4.0% 2.7% 2.2% 1.9%
Median 2.8% 2.3% 2.1% 2.0%
StDev 18.1% 10.8% 8.6% 6.0%
Base Rates Sales: >$50,000 Mn
Sales CAGR (%) 1-Yr 3-Yr 5-Yr 10-Yr
<(25) 3.4% 1.5% 1.6% 0.0%
(25)-(20) 1.9% 0.7% 0.5% 0.1%
(20)-(15) 2.3% 1.9% 1.0% 0.5%
(15)-(10) 5.3% 3.9% 2.6% 1.9%
(10)-(5) 9.8% 11.1% 9.3% 7.8%
(5)-0 17.2% 21.0% 22.9% 28.3%
0-5 21.9% 27.2% 34.8% 38.7%
5-10 15.5% 17.3% 17.3% 18.6%
10-15 8.8% 9.5% 6.9% 3.5%
15-20 5.3% 3.3% 2.3% 0.6%
20-25 3.4% 1.5% 0.7% 0.0%
25-30 2.3% 0.7% 0.1% 0.0%
30-35 1.0% 0.1% 0.1% 0.0%
35-40 0.5% 0.3% 0.0% 0.0%
40-45 0.4% 0.1% 0.0% 0.0%
>45 1.2% 0.0% 0.0% 0.0%
Mean 2.6% 1.5% 1.3% 1.3%
Median 2.3% 1.6% 1.6% 1.3%
StDev 15.6% 9.9% 7.9% 5.2%
Base Rates Full Universe
Sales CAGR (%) 1-Yr 3-Yr 5-Yr 10-Yr
<(25) 1.8% 0.6% 0.3% 0.0%
(25)-(20) 1.0% 0.5% 0.3% 0.1%
(20)-(15) 1.7% 1.1% 0.7% 0.3%
(15)-(10) 3.1% 2.2% 1.7% 0.9%
(10)-(5) 6.2% 5.2% 4.3% 3.4%
(5)-0 12.1% 13.1% 13.0% 13.1%
0-5 20.6% 25.1% 28.8% 34.6%
5-10 18.0% 21.4% 24.2% 28.2%
10-15 11.4% 12.3% 12.5% 11.2%
15-20 6.8% 6.8% 6.0% 4.3%
20-25 4.5% 3.9% 3.1% 1.9%
25-30 3.0% 2.4% 1.9% 1.0%
30-35 2.0% 1.5% 1.0% 0.5%
35-40 1.3% 1.0% 0.7% 0.3%
40-45 1.0% 0.7% 0.4% 0.2%
>45 5.4% 2.3% 1.1% 0.3%
Mean 15.0% 8.0% 6.7% 5.5%
Median 5.8% 5.5% 5.2% 4.7%
StDev 287.0% 18.4% 12.0% 7.8%
Base Rates
February 23, 2016
The Base Rate Book – Sales Growth 8
In total, exhibit 4 shows results for 44 reference classes (11 size ranges times 4 time horizons) that should cover the vast majority of possible outcomes for sales growth. The appendix contains the sample sizes for
each of the reference classes. Bear in mind that these data are adjusted for inflation and that most forecasts reflect inflation expectations. We will show how to incorporate these base rates into your forecasts for sales
growth in a moment. For now, it’s useful to acknowledge the utility of these data as an analytical guide and a valuable reality check.
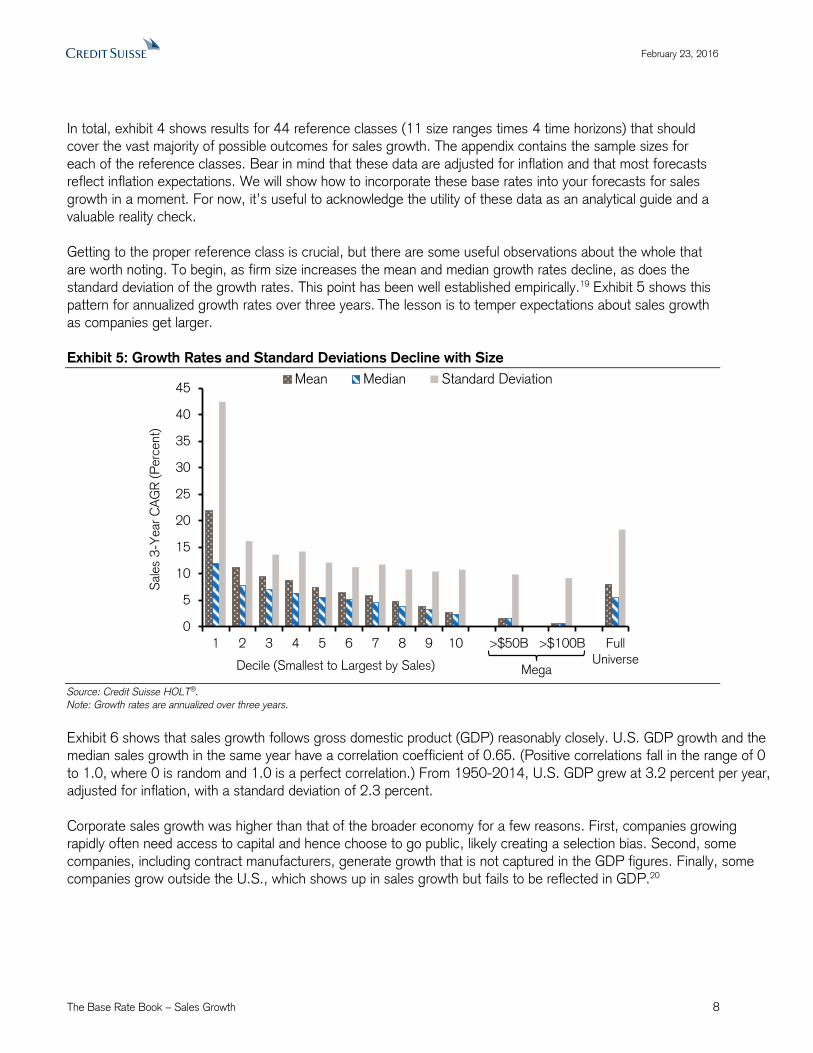
Getting to the proper reference class is crucial, but there are some useful observations about the whole that
are worth noting. To begin, as firm size increases the mean and median growth rates decline, as does the standard deviation of the growth rates. This point has been well established empirically.19 Exhibit 5 shows this
pattern for annualized growth rates over three years. The lesson is to temper expectations about sales growth as companies get larger.
Exhibit 5: Growth Rates and Standard Deviations Decline with Size
Source: Credit Suisse HOLT®.
Note: Growth rates are annualized over three years.
Exhibit 6 shows that sales growth follows gross domestic product (GDP) reasonably closely. U.S. GDP growth and the median sales growth in the same year have a correlation coefficient of 0.65. (Positive correlations fall in the range of 0
to 1.0, where 0 is random and 1.0 is a perfect correlation.) From 1950-2014, U.S. GDP grew at 3.2 percent per year, adjusted for inflation, with a standard deviation of 2.3 percent.
Corporate sales growth was higher than that of the broader economy for a few reasons. First, companies growing rapidly often need access to capital and hence choose to go public, likely creating a selection bias. Second, some
companies, including contract manufacturers, generate growth that is not captured in the GDP figures. Finally, some companies grow outside the U.S., which shows up in sales growth but fails to be reflected in GDP.20
0
5
10
15
20
25
30
35
40
45
1 2 3 4 5 6 7 8 9 10 >$50B >$100B FullUniverse
Sal
es
3-Y
ear
CA
GR
(P
erc
ent)
Decile (Smallest to Largest by Sales)
Mean Median Standard Deviation
Mega

February 23, 2016
The Base Rate Book – Sales Growth 9
Exhibit 6: Median Sales Growth Is Correlated with GDP Growth
Source: Credit Suisse HOLT® and Bureau of Economic Analysis.
Note: Sales growth is for the top 1,000 global companies by market capitalization in each year.
Finally, notwithstanding our natural tendency to anticipate growth, 23 percent of the companies in the sample had negative sales growth rates for 3 years, after an adjustment for inflation, and 20 percent shrank for 5 years. Whereas
a decline in sales need not be bad if it occurs for the right reasons, few analysts or corporate leaders project shrinking sales unless there is a clear strategy of divestiture.21
Using Base Rates to Model Growth
We have established that there are two ways of making a forecast. You can do bottom-up research, which is the most natural method, or you can turn to a base rate. The research in decision making shows that the bottom-up approach is
subject to biases and that incorporating the base rate generally improves the quality of the forecast. Yet we don’t want to lean too much on either our own analysis or the base rate. We want to combine the two intelligently.
There is a technique to combine the two approaches, which we will apply to our sales growth data.22 Correlation is the
key to the method. The correlation coefficient measures the degree of linear relationship between variables in a pair of distributions. The value of a correlation coefficient can fall between -1.0 (the rise in one variable perfectly correlates
with the fall of the other) and 1.0 (both variables move in tandem). A zero correlation indicates randomness. We will examine a single variable, sales growth, measured over time, and all of the correlations are positive.
If the correlation between two distributions is high, then what happened before gives you a really good sense of what will follow. For example, the correlation for cash flow return on investment (CFROI®*) for companies in the consumer
staples sector is about 0.90 from one year to the next.23 That means if you know Unilever’s CFROI from last year, you can forecast it this year with a great deal of accuracy. The bottom-up work is highly relevant.
*CFROI®
is a registered trademark in the United States and other countries (excluding the United Kingdom) of Credit Suisse Group AG or its
affiliates.
-5
0
5
10
15
-5 0 5 10
Annual R
eal S
ale
s G
row
th (
Perc
ent)
Annual Real GDP Growth (Percent)
r = 0.65
February 23, 2016
The Base Rate Book – Sales Growth 10
If the correlation is low, what happened before provides no inkling of what will happen next. Take the annual total shareholder returns for the S&P 500 as a case.24 The correlation from year to year, from 1928 through 2015, is
essentially zero. Telling you last year’s return provides no help in forecasting the return for this year. Your best forecast is the average of the reference class.
The basic idea is that the correlation determines how you should weight the bottom-up analysis and the base rate. For
Unilever, a sensible forecast is nine parts last year’s CFROI and one part last year’s average sector CFROI, the base rate. For your S&P 500 forecast, you should place minimal weight on what happened last year and rely largely on the
average return since 1928, the base rate.
Studying base rates for sales growth is logical for two reasons. First, sales growth is the most important driver of value for most companies. Second, sales growth has a higher correlation from year to year than does earnings growth,
which is the most commonly discussed item on the income statement.25 Sales growth is important and more predictable than profit growth.
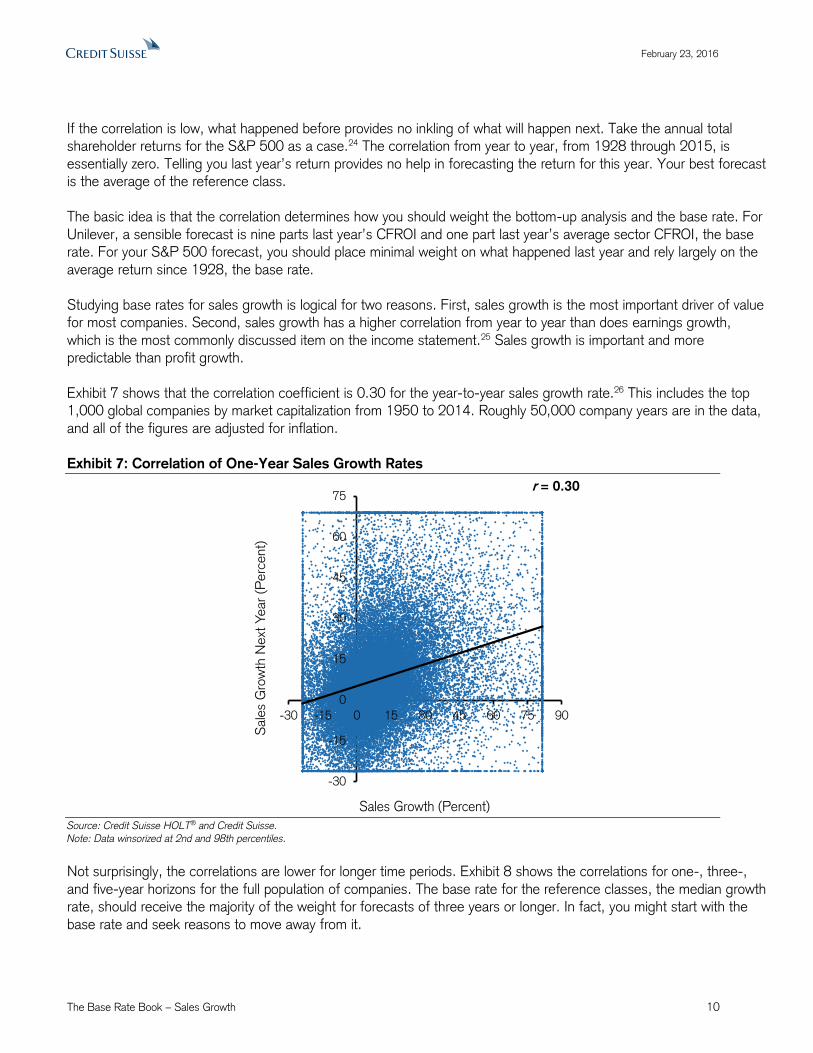
Exhibit 7 shows that the correlation coefficient is 0.30 for the year-to-year sales growth rate.26 This includes the top 1,000 global companies by market capitalization from 1950 to 2014. Roughly 50,000 company years are in the data,
and all of the figures are adjusted for inflation.
Exhibit 7: Correlation of One-Year Sales Growth Rates
Source: Credit Suisse HOLT® and Credit Suisse.
Note: Data winsorized at 2nd and 98th percentiles.
Not surprisingly, the correlations are lower for longer time periods. Exhibit 8 shows the correlations for one-, three-,
and five-year horizons for the full population of companies. The base rate for the reference classes, the median growth rate, should receive the majority of the weight for forecasts of three years or longer. In fact, you might start with the
base rate and seek reasons to move away from it.
-30
-15
0
15
30
45
60
75
-30 -15 0 15 30 45 60 75 90
Sale
s G
row
th N
ext
Year
(Perc
ent)
Sales Growth (Percent)
r = 0.30

February 23, 2016
The Base Rate Book – Sales Growth 11
Exhibit 8: Correlation of Sales Growth Rates for 1-, 3-, and 5-Year Horizons
Source: Credit Suisse HOLT® and Credit Suisse.
This approach to modelling regression toward the mean does not say that some companies will not grow
rapidly and others will not shrink. We know that companies will fill the tails of the distribution. What it does say is that the best forecast for a large sample of companies is something close to the median, and that
companies that anticipate sales growth well in excess of the median are likely to be disappointed.
0.30
0.160.18
0.00
0.40
1-Year 3-Year 5-Year
Correlation (r)
Period

February 23, 2016
The Base Rate Book – Sales Growth 12
Current Expectations
Exhibit 1 shows the current expectations for sales growth over three years for a thousand public companies around the world. The median expected growth rate is 1.7 percent. Exhibit 9 represents the three-year sales
growth rates, adjusted for inflation, which analysts expect for ten companies with sales in excess of $50 billion. We superimposed the expected growth rates on the distribution of historical sales growth rates for the
reference class of mega companies.
Exhibit 9: Three-Year Expected Sales Growth Rates for Ten Mega Companies
Source: Credit Suisse HOLT® and FactSet Estimates.
Note: FactSet consensus estimates as of February 19, 2016; Growth rates are annualized; P&G = Procter & Gamble, IBM = International Business Machines, and GE = General Electric.
Analysts expect negative sales growth for four of the ten, which corporate actions or commodity prices can largely explain. The standard deviation of growth rates for this small sample is 7.0 percent.
Summary
Active investing requires having a point of view that is different than that of the stock market. Implicit in such a
variant perception is a forecast of outcomes that is at odds with what the market price implies.
Research shows that optimism and overconfidence can creep into our forecasts and distort them. This is especially pronounced when the outcomes have personal relevance. Research also shows that incorporating a base rate can improve the quality of our forecasts. Notwithstanding the utility of this method, it remains
substantially underutilized.
In this piece we provide the base rates for sales growth rates for a large sample of global companies over a span of more than six decades. We start with sales growth because it is the most important value driver. We
then provide a method to integrate our views with base rates to sharpen the quality of our forecasts.
0
5
10
15
20
25
30
<(2
5)
(25)-
(20)
(20)-
(15)
(15)-
(10)
(10
)-(5
)
(5)-
0
0-5
5-1
0
10
-15
15
-20
20
-25
25
-30
30
-35
35
-40
40
-45
>45
Fre
quency
(P
erc
ent)
CAGR (Percent)
PetroChina
Wal-Mart
GEWells Fargo
Alphabet
Apple
Amazon.com
IBM
Unilever
P&G

February 23, 2016
The Base Rate Book – Sales Growth 13
Appendix: Observations for Each Base Rate by Decile (1950-2014)
Sales: $0-325 Mn
Sales CAGR (%) 1-Yr 3-Yr 5-Yr 10-Yr
<(25) 64 21 16 0
(25)-(20) 30 8 5 2
(20)-(15) 48 16 15 12
(15)-(10) 62 53 22 25
(10)-(5) 148 83 57 32
(5)-0 317 257 197 157
0-5 629 692 733 745
5-10 700 864 993 1,314
10-15 565 679 816 834
15-20 420 486 456 412
20-25 306 287 299 260
25-30 206 218 228 164
30-35 176 153 144 109
35-40 122 133 128 69
40-45 98 92 81 47
>45 743 524 321 85
Total 4,634 4,566 4,511 4,267
Observations Sales: $325-700 Mn
Sales CAGR (%) 1-Yr 3-Yr 5-Yr 10-Yr
<(25) 49 10 5 0
(25)-(20) 18 17 5 1
(20)-(15) 52 34 21 6
(15)-(10) 112 44 42 30
(10)-(5) 194 124 90 100
(5)-0 418 348 324 293
0-5 943 1,135 1,149 1,175
5-10 896 1,125 1,365 1,519
10-15 664 782 771 692
15-20 402 396 366 249
20-25 318 237 190 125
25-30 177 137 116 53
30-35 106 103 82 28
35-40 87 77 44 13
40-45 68 54 37 4
>45 382 168 64 3
Total 4,886 4,791 4,671 4,291
Observations Sales: $700-1,250 Mn
Sales CAGR (%) 1-Yr 3-Yr 5-Yr 10-Yr
<(25) 72 20 11 6
(25)-(20) 42 13 16 3
(20)-(15) 67 35 25 11
(15)-(10) 117 85 58 36
(10)-(5) 209 158 147 92
(5)-0 452 426 392 386
0-5 897 1,037 1,134 1,259
5-10 873 1,057 1,132 1,218
10-15 586 672 683 569
15-20 381 378 325 199
20-25 237 202 194 87
25-30 153 146 106 41
30-35 131 93 50 12
35-40 92 72 42 5
40-45 67 37 19 2
>45 295 104 40 1
Total 4,671 4,535 4,374 3,927
Observations
Sales: $1,250-2,000 Mn
Sales CAGR (%) 1-Yr 3-Yr 5-Yr 10-Yr
<(25) 62 16 16 1
(25)-(20) 40 19 6 3
(20)-(15) 55 34 17 14
(15)-(10) 114 74 47 27
(10)-(5) 220 167 131 76
(5)-0 420 455 417 368
0-5 915 1,063 1,190 1,312
5-10 881 1,026 1,110 1,082
10-15 577 570 553 440
15-20 328 316 268 147
20-25 188 175 143 55
25-30 162 131 91 29
30-35 102 83 40 12
35-40 72 43 27 4
40-45 65 25 19 7
>45 279 103 32 3
Total 4,480 4,300 4,107 3,580
Observations Sales: $2,000-3,000 Mn
Sales CAGR (%) 1-Yr 3-Yr 5-Yr 10-Yr
<(25) 68 18 10 0
(25)-(20) 45 10 5 3
(20)-(15) 67 42 17 3
(15)-(10) 121 75 48 11
(10)-(5) 231 205 149 92
(5)-0 511 510 467 443
0-5 968 1,128 1,245 1,289
5-10 853 956 1,062 973
10-15 538 545 506 349
15-20 343 288 223 152
20-25 224 189 138 37
25-30 128 102 74 26
30-35 94 59 24 4
35-40 61 42 15 2
40-45 36 28 8 2
>45 221 56 18 0
Total 4,509 4,253 4,009 3,386
Observations Sales: $3,000-4,500 Mn
Sales CAGR (%) 1-Yr 3-Yr 5-Yr 10-Yr
<(25) 80 23 8 1
(25)-(20) 53 18 6 1
(20)-(15) 96 42 30 1
(15)-(10) 173 92 80 23
(10)-(5) 320 240 168 99
(5)-0 601 668 636 540
0-5 1,080 1,212 1,321 1,434
5-10 872 1,045 1,079 981
10-15 572 548 526 306
15-20 345 327 239 111
20-25 226 166 116 28
25-30 145 101 62 13
30-35 83 61 23 2
35-40 60 34 4 1
40-45 40 19 10 0
>45 202 39 8 0
Total 4,948 4,635 4,316 3,541
Observations

February 23, 2016
The Base Rate Book – Sales Growth 14
Source: Credit Suisse HOLT®.
Sales: $4,500-7,000 Mn
Sales CAGR (%) 1-Yr 3-Yr 5-Yr 10-Yr
<(25) 93 24 12 1
(25)-(20) 57 36 8 7
(20)-(15) 90 52 31 4
(15)-(10) 206 137 88 39
(10)-(5) 358 273 202 149
(5)-0 686 725 698 558
0-5 1,181 1,382 1,501 1,483
5-10 1,038 1,063 1,068 974
10-15 611 543 486 287
15-20 347 309 252 99
20-25 208 185 98 31
25-30 160 97 49 20
30-35 95 59 27 6
35-40 50 25 12 0
40-45 38 18 7 0
>45 201 49 16 0
Total 5,419 4,977 4,555 3,658
Observations Sales: $7,000-12,000 Mn
Sales CAGR (%) 1-Yr 3-Yr 5-Yr 10-Yr
<(25) 125 28 19 1
(25)-(20) 73 28 13 4
(20)-(15) 112 69 35 23
(15)-(10) 213 165 126 40
(10)-(5) 504 412 323 176
(5)-0 905 964 914 729
0-5 1,377 1,585 1,644 1,592
5-10 1,157 1,166 1,223 988
10-15 683 617 501 255
15-20 337 313 216 87
20-25 239 179 86 26
25-30 137 89 64 10
30-35 100 59 20 4
35-40 58 24 11 2
40-45 50 18 6 0
>45 202 37 6 0
Total 6,272 5,753 5,207 3,937
Observations Sales: $12,000-25,000 Mn
Sales CAGR (%) 1-Yr 3-Yr 5-Yr 10-Yr
<(25) 157 48 13 1
(25)-(20) 84 34 29 2
(20)-(15) 145 99 63 19
(15)-(10) 233 164 123 48
(10)-(5) 501 414 329 202
(5)-0 1,011 1,046 938 713
0-5 1,409 1,550 1,647 1,415
5-10 1,117 1,118 1,053 741
10-15 599 518 414 235
15-20 315 244 187 90
20-25 192 149 78 24
25-30 141 72 38 3
30-35 87 49 21 1
35-40 56 23 13 0
40-45 31 18 1 0
>45 164 26 3 0
Total 6,242 5,572 4,950 3,494
Observations
Sales: >$25,000 Mn
Sales CAGR (%) 1-Yr 3-Yr 5-Yr 10-Yr
<(25) 177 65 42 3
(25)-(20) 82 38 20 4
(20)-(15) 127 92 53 17
(15)-(10) 257 164 124 55
(10)-(5) 489 433 329 217
(5)-0 915 920 859 598
0-5 1,198 1,295 1,333 964
5-10 885 880 743 531
10-15 504 442 351 153
15-20 302 204 134 34
20-25 184 105 51 6
25-30 132 52 17 0
30-35 57 20 10 0
35-40 37 22 5 0
40-45 30 8 3 0
>45 110 14 1 0
Total 5,486 4,754 4,075 2,582
Observations Sales: >$50,000 Mn
Sales CAGR (%) 1-Yr 3-Yr 5-Yr 10-Yr
<(25) 78 29 26 0
(25)-(20) 44 13 8 1
(20)-(15) 53 38 16 5
(15)-(10) 121 76 42 18
(10)-(5) 224 217 152 74
(5)-0 394 410 373 269
0-5 502 532 566 368
5-10 357 339 281 177
10-15 201 185 113 33
15-20 122 64 37 6
20-25 77 30 11 0
25-30 53 13 2 0
30-35 23 2 1 0
35-40 12 5 0 0
40-45 9 2 0 0
>45 27 0 0 0
Total 2,297 1,955 1,628 951
Observations Full Universe
Sales CAGR (%) 1-Yr 3-Yr 5-Yr 10-Yr
<(25) 947 273 152 14
(25)-(20) 524 221 113 30
(20)-(15) 859 515 307 110
(15)-(10) 1,608 1,053 758 334
(10)-(5) 3,174 2,509 1,925 1,235
(5)-0 6,236 6,319 5,842 4,785
0-5 10,597 12,079 12,897 12,668
5-10 9,272 10,300 10,828 10,321
10-15 5,899 5,916 5,607 4,120
15-20 3,520 3,261 2,666 1,580
20-25 2,322 1,874 1,393 679
25-30 1,541 1,145 845 359
30-35 1,031 739 441 178
35-40 695 495 301 96
40-45 523 317 191 62
>45 2,799 1,120 509 92
Total 51,547 48,136 44,775 36,663
Observations

February 23, 2016
The Base Rate Book – Sales Growth 15
Endnotes
1 Daniel Kahneman, Thinking, Fast and Slow (New York: Farrar, Straus and Giroux, 2011), 249. 2 Alfred Rappaport and Michael J. Mauboussin, Expectations Investing: Reading Stock Prices for Better Returns
(Boston, MA: Harvard Business School Press, 2001). 3 Ibid. Growth only creates value when a company earns in excess of the cost of capital. Growth at a negative spread
destroys value. 4 Benjamin Lansford, Baruch Lev, Jennifer Wu Tucker, “Causes and Consequences of Disaggregating Earnings
Guidance,” Journal of Business Finance & Accounting, Vol. 40, No. 1-2, January/February 2013, 26-54. 5 Kahneman, 257. 6 See Small Business Association, Office of Advocacy, “Frequently Asked Questions,” January 2011 (https://www.sba.gov/sites/default/files/sbfaq.pdf) and Arnold C. Cooper, Carolyn Y. Woo, and William C.
Dunkelberg, “Entrepreneurs’ Perceived Chances for Success,” Journal of Business Venturing, Vol. 3, No. 2, Spring 1988, 97-108. 7 Cade Massey, Joseph P. Simmons, and David A. Armor, “Hope Over Experience: Desirability and the
Persistence of Optimism,” Psychological Science, Vol. 22, No. 2, February 2011, 274-281. Also, David A. Armor, Cade Massey, and Aaron M. Sackett, “Prescribed Optimism: Is It Right to Be Wrong About the
Future?” Psychological Science, Vol. 19, No. 4, April 2008, 329-331. For a more detailed discussion of optimism, see Tali Sharot, The Optimism Bias: A Tour of the Irrationally Positive Brain (New York: Pantheon
Books, 2011). 8 Michael J. Mauboussin and Dan Callahan, “IQ versus RQ: Differentiating Smarts from Decision-Making
Skills,” Credit Suisse Global Financial Strategies, May 12, 2015. 9 Geoffrey Friesen and Paul A. Weller, “Quantifying Cognitive Biases in Analyst Earnings Forecasts,” Journal
of Financial Markets, Vol. 9, No. 4, November 2006, 333-365. 10 Jack B. Soll and Joshua Klayman, “Overconfidence in Interval Estimates,” Journal of Experimental
Psychology: Learning, Memory, and Cognition, Vol. 30, No. 2, March 2004, 299-314. 11 Itzhak Ben-David, John R. Graham, and Campbell R. Harvey, “Managerial Miscalibration,” Quarterly Journal of Economics, Vol. 128, No. 4, August 2013, 1547-1584. 12 Bent Flyvbjerg, Massimo Garbuio, Dan Lovallo, “Better Forecasting for Large Capital Projects,” McKinsey on Finance, Autumn 2014, 7-13. Also, Bent Flyvbjerg, “Truth and Lies about Megaprojects,” Speech at Delft
University of Technology, September 26, 2007. 13 Kahneman, 249. 14 Tesla Motors, Inc. Q4 2014 Earnings Call, February 11, 2015. See FactSet: callstreet Transcript, page 7. 15 Berkeley J. Dietvorst, Joseph P. Simmons, and Cade Massey, “Algorithm Aversion: People Erroneously
Avoid Algorithms After Seeing Them Err,” Journal of Experimental Psychology: General, Vol. 144, No. 1, February 2015, 114-126. 16 The sample size is somewhat smaller than 1,000 in the early years but reaches 1,000 by the late 1960s. 17 Most public companies “die” as the result of mergers and acquisitions. See Michael J. Mauboussin and Dan Callahan, “Why Corporate Longevity Matters: What Index Turnover Tells Us about Corporate Results,” Credit
Suisse Global Financial Strategies, April 16, 2014. 18 Madeleine I. G. Daepp, Marcus J. Hamilton, Geoffrey B. West, and Luís M. A. Bettencourt, “The mortality
of companies,” The Royal Society Publishing, Vol. 12, No. 106, April 1, 2015. 19 Michael H. R. Stanley, Luís A. N. Amaral, Sergey V. Buldyrev, Shlomo Havlin, Heiko Leschhorn,
Philipp Maass, Michael A. Salinger, and H. Eugene Stanley, “Scaling Behaviour in the Growth of Companies,” Nature, Vol. 379, February 29, 1996, 804-806. Also, Rich Perline, Robert Axtell, and Daniel Teitelbaum,
“Volatility and Asymmetry of Small Firm Growth Rates Over Increasing Time Frames,” Small Business Research Summary, No. 285, December 2006.
February 23, 2016
The Base Rate Book – Sales Growth 16
20 Tim Koller, Marc Goedhart, and David Wessels, Valuation: Measuring and Managing the Value of Companies, 6th Edition (Hoboken, NJ: John Wiley & Sons, 2015), 126-127. 21 Sheridan Titman, K. C. John Wei, and Feixue Xie, “Capital Investments and Stock Returns,” The Journal of Financial and Quantitative Analysis, Vol. 39, No. 4, December 2004, 677-700. 22 William M. K. Trochim and James P. Donnelly, The Research Methods Knowledge Base, Third Edition (Mason, OH: Atomic Dog, 2008), 166. See http://www.socialresearchmethods.net/kb/regrmean.php. 23 Michael J. Mauboussin, Dan Callahan, Bryant Matthews, and David A. Holland, “How to Model Reversion to the Mean: Determining How Fast, and to What Mean, Results Revert,” Credit Suisse Global Financial
Strategies, September 17, 2013. 24 “Credit Suisse Global Investment Returns Yearbook 2016,” Credit Suisse Research Institute, February 2016. 25 Michael J. Mauboussin, Dan Callahan, and Darius Majd, “The Base Rate Book – Earnings Growth,” Credit Suisse Global Financial Strategies, December 16, 2015. Louis K.C. Chan, Jason Karceski, and Josef
Lakonishok, “The Level and Persistence of Growth Rates,” Journal of Finance, Vol. 58, No. 2, April 2003, 643-684. Also, Michael J. Mauboussin, “The True Measures of Success,” Harvard Business Review, October 2012, 46-56. 26 We winsorize the top and bottom two percent of the growth rates. Companies with growth rates in the top two percent are generally extremely small firms or firms that engaged in a significant merger and acquisition activity.

Important information
This document was produced by and the opinions expressed are those of Credit Suisse as of the date of writing and are subject to change. It has been prepared solely for information purposes and for the use of the recipient. It does not constitute an offer or an invitation by or on behalf of Credit Suisse to any person to buy
or sell any security. Nothing in this material constitutes investment, legal, accounting or tax advice, or a representation that any investment or strategy is suitable or appropriate to your individual circumstances, or otherwise constitutes a personal recommendation to you. The price and value of investments mentioned and any income that might accrue may fluctuate and may fall or rise. Any reference to past performance is not a guide to the future.
The information and analysis contained in this publication have been compiled or arrived at from sources believed to be reliable but Credit Suisse does not make
any representation as to their accuracy or completeness and does not accept liability for any loss arising from the use hereof. A Credit Suisse Group company may have acted upon the information and analysis contained in this publication before being made available to clients of Credit Suisse. Investments in emerging markets are speculative and considerably more volatile than investments in established markets. Some of the main risks are political risks, economic risks, credit
risks, currency risks and market risks. Investments in foreign currencies are subject to exchange rate fluctuations. Before entering into any transaction, you should consider the suitability of the transaction to your particular circumstances and independently review (with your professional advisers as necessary) the specific financial risks as well as legal, regulatory, credit, tax and accounting consequences. This document is issued and distributed in the United States by
Credit Suisse Securities (USA) LLC, a U.S. registered broker-dealer; in Canada by Credit Suisse Securities (Canada), Inc.; and in Brazil by Banco de Investimentos Credit Suisse (Brasil) S.A.
This document is distributed in Switzerland by Credit Suisse AG, a Swiss bank. Credit Suisse is authorized and regulated by the Swiss Financial Market
Supervisory Authority (FINMA). This document is issued and distributed in Europe (except Switzerland) by Credit Suisse (UK) Limited and Credit Suisse Securities (Europe) Limited, London. Credit Suisse Securities (Europe) Limited, London and Credit Suisse (UK) Limited, authorised by the Prudential Regulation Authority (PRA) and regulated by the Financial Conduct Authority (FCA) and PRA, are associated but independent legal and regulated entities within Credit Suisse. The
protections made available by the UK‘s Financial Services Authority for private customers do not apply to investments or services provided by a person outside the UK, nor will the Financial Services Compensation Scheme be available if the issuer of the investment fails to meet its obligations. This document is distributed in Guernsey by Credit Suisse (Guernsey) Limited, an independent legal entity registered in Guernsey under 15197, with its registered address at Helvetia Court, Les Echelons, South Esplanade, St Peter Port, Guernsey. Credit Suisse (Guernsey) Limited is wholly owned by Credit Suisse and is regulated by the Guernsey
Financial Services Commission. Copies of the latest audited accounts are available on request. This document is distributed in Jersey by Credit Suisse (Guernsey) Limited, Jersey Branch, which is regulated by the Jersey Financial Services Commission. The business address of Credit Suisse (Guernsey) Limited, Jersey Branch, in Jersey is: TradeWind House, 22 Esplanade, St Helier, Jersey JE2 3QA. This document has been issued in Asia-Pacific by whichever of the following
is the appropriately authorised entity of the relevant jurisdiction: in Hong Kong by Credit Suisse (Hong Kong) Limited, a corporation licensed with the Hong Kong Securities and Futures Commission or Credit Suisse Hong Kong branch, an Authorized Institution regulated by the Hong Kong Monetary Authority and a Registered Institution regulated by the Securities and Futures Ordinance (Chapter 571 of the Laws of Hong Kong); in Japan by Credit Suisse Securities (Japan)
Limited; elsewhere in Asia/Pacific by whichever of the following is the appropriately authorized entity in the relevant jurisdiction: Credit Suisse Equities (Australia) Limited, Credit Suisse Securities (Thailand) Limited, Credit Suisse Securities (Malaysia) Sdn Bhd, Credit Suisse AG,Singapore Branch,and elsewhere in the world by the relevant authorized affiliate of the above.
This document may not be reproduced either in whole, or in part, without the written permission of the authors and CREDIT SUISSE.
With respect to the analysis in this report based on the Credit Suisse HOLT methodology, Credit Suisse certifies that (1) the views expressed in this report
accurately reflect the Credit Suisse HOLT methodology and (2) no part of the Firm’s compensation was, is, or will be directly related to the specific views disclosed in this report. The Credit Suisse HOLT methodology does not assign recommendations to a security. It is an analytical tool that involves use of a set of proprietary quantitative
algorithms and warranted value calculations, collectively called the Credit Suisse HOLT valuation model, that are consistently applied to all the companies included in its database. Third-party data (including consensus earnings estimates) are systematically translated into a number of default variables and incorporated into the algorithms available in the Credit Suisse HOLT valuation model. The source financial statement, pricing, and earnings data provided by outside data vendors are
subject to quality control and may also be adjusted to more closely measure the underlying economics of firm performance. These adjustments provide consistency when analyzing a single company across time, or analyzing multiple companies across industries or national borders. The default scenario that is produced by the Credit Suisse HOLT valuation model establishes the baseline valuation for a security, and a user then may adjust the default variables to produce alternative scenarios, any of which could occur. Additional information about the Credit Suisse HOLT methodology is available on request.
The Credit Suisse HOLT methodology does not assign a price target to a security. The default scenario that is produced by the Credit Suisse HOLT valuation model establishes a warranted price for a security, and as the third-party data are updated, the warranted price may also change. The default variables may also be adjusted to produce alternative warranted prices, any of which could occur. Additional information about the Credit Suisse HOLT methodology is available on
request.
© 2016 CREDIT SUISSE GROUP AG and/or its affiliates. All rights reserved