Embed Size (px)
Citation preview

Evaluating alternative water sources and their use for small-holder agriculture from a systemic
perspective.A focus on water reuse and rainwater harvesting in
Namibia.
Laura Woltersdorf
2016
15
Frankfurt Hydrology Paper

Institute of Physical Geography, Goethe University FrankfurtP.O. Box 11 19 32, D-60054 Frankfurt am Main, Germany Phone +49 (0)69 798 40155, Fax +49 (0)69 798 40170 http://www.uni-frankfurt.de/45217668/dl
Please cite as: Woltersdorf, L. (2016): Evaluating alternative water sources and their use for small-holder agriculture from a systemic perspective. A focus on water reuse and rainwater harvesting in Namibia. Frankfurt Hydrology Paper 15, Institute of Physical Geography, Goethe University Frankfurt, Frankfurt am Main, Germany.
Frankfurt Hydrology Papers:
01 A Digital Global Map of Irrigated Areas - An Update for Asia 02 Global-Scale Modeling of Nitrogen Balances at the Soil Surface 03 Global-Scale Estimation of Diffuse Groundwater Recharge 04 A Digital Global Map of Artificially Drained Agricultural Areas 05 Irrigation in Africa, Europe and Latin America -
Update of the Digital Global Map of Irrigation Areas to Version 4 06 Global data set of monthly growing areas of 26 irrigated crops 07 The Global Crop Water Model (GCWM):
Documentation and first results for irrigated crops 08 Towards mapping the extent of irrigation in the last century:
time series of irrigated area per country 09 Global estimation of monthly irrigated and rainfed crop areas
on a 5 arc-minute grid 10 Entwicklung der transdisziplinären Methode
„Akteursbasierte Modellierung“ und ihre Anwendung im Problemfeld der mobilen, organischen Fremdstoffe
11 Expert-based Bayesian Network modeling for environmental management
12 Anthropogenic river flow alterations and their impacts on freshwater ecosystems in China.
13 Design, implementation and evaluation of a participatory strategy development- A regional case study in the problem field of renewable electricity generation
14 Global-scale modeling and quantification of indicators for assessing transboundary aquifers. A contribution to the GEF Transboundary
Waters Assessment Programme (TWAP) 15 Evaluating alternative water sources and their use for small-holder
agriculture from a systemic perspective. A focus on water reuse and rainwater harvesting in Namibia.

Evaluating alternative water sources and their use for
small-holder agriculture from a systemic perspective.
A focus on water reuse and rainwater harvesting in
Namibia.
Dissertation
zur Erlangung des Doktorgrades der Naturwissenschaften
vorgelegt beim Fachbereich Geowissenschaften/
Geographie (FB 11)
der Johann Wolfgang Goethe- Universität
in Frankfurt am Main
von
Laura Woltersdorf
aus Frankfurt am Main
Frankfurt 2016
(D 30)

�
��
vom Fachbereich Geowissenschaften/Geographie (FB 11) der
Johann Wolfgang Goethe - Universität als Dissertation angenommen.
Dekan:
Prof: Dr. Ulrich Achatz
Institut für Atmosphäre und Umwelt
Johann Wolfgang Goethe - Universität
Gutachter :
Prof. Dr. Petra Döll
Institut für Physische Geographie
Johann Wolfgang Goethe - Universität
Prof. Dr.-Ing. Peter Cornel
Institut IWAR
Technische Universität Darmstadt
Datum der Disputation: 01. Februar 2016

�
�
Acknowledgements The PhD was carried out in the frame of the CuveWaters project with financial support of the
German Federal Ministry of Education and Research (BMBF) under the research project
033L001A. While developing and accomplishing the presented dissertation, I received invaluable
support from my colleagues, friends and family, for which I am deeply thankful. I would like to
express my deep gratitude to my first supervisor Prof. Petra Döll from the Goethe University
Frankfurt for the many fruitful discussions, encouragements, very constructive criticism, support
and advice. Thanks go also to my second supervisor Prof. Peter Cornel from the Technische
Universität Darmstadt for his willingness to evaluate the thesis. I would also like to thank my two
other informal supervisors for their continuous support, advice and help to accomplish the
research: Stefan Liehr at the Institute for Social-Ecological Research ISOE and Ruth Scheidegger
at the Swiss Federal Institute of Aquatic Science and Technology EAWAG. In particular, I am also
grateful to Thomas Kluge for always supporting me and giving me trust and very valuable advice
in critical situations. Many thanks go also to my other colleagues from the CuveWaters project, in
particular to Jörg Felmeden and Martin Zimmermann, and also to Jutta Deffner, Katharina Müller
and Alexander Jokisch. I am also thankful for the enormous valuable day-to-day support and
advice received from my office colleagues Nina Stiehr and Robert Lütkemeier. Also I would like to
thank my Scimento female group and our mentor Prof. Gerhard Kost for the continuous motivation
and constructive support given, as well as the Scimento mentoring program for organizing the
groups. I am very grateful to my parents Marilena and Manfred who have always supported me
personally and played a key role in carrying out my research by taking care of my daughter Sofia
while I was working. Thanks go also to my husband Haykel and my brother Stefano for
continuously supporting me with my PhD. My deepest thanks go also to my daughter Sofia for
showing me what is important in life.
i

�
�
Abstract Water is scarce in semi-arid and arid regions. Using alternative water sources (i.e. non-
conventional water sources), such as municipal reuse water and harvested rain, contributes to
using existing water resources more efficiently and productively. The aim of this study is to
evaluate the two alternative water sources reuse water and harvested rain for the irrigation of
small-holder agriculture from a system perspective. This helps decision and policy makers to have
proper information about which system and technology to adopt under local conditions. For this,
the evaluation included ecologic, societal, economic, institutional and political as well as technical
aspects. For the evaluation, the study area in central-northern Namibia was chosen in the frame
of the research and development project CuveWaters. The main methods used include a
mathematical material flow analysis, the computation and modelling of crop requirements, a multi-
criteria decision analysis using the Analytical Hierarchy Process (AHP) method and a financial
cost-benefit analysis. From a systemic perspective, the proposed novel systems were compared
to the exciting conventional infrastructure. The results showed that both water reuse and rainwater
harvesting systems for the irrigation of small-holder horticulture offer numerous technological,
ecologic, economic, societal, institutional and political benefits. Rainwater harvesting based
gardens have a positive benefit-cost ratio under favorable conditions. Government programs could
fund the infrastructure investment costs, while the micro-entrepreneur can assume a micro-credit
to finance operation and maintenance costs. Installing sanitation in informal settlements and
reusing municipal water for irrigation reduces the overall water demand of households and
agriculture by 39%, compared to improving sanitation facilities in informal settlements without
reusing the water for agriculture. Given that water is the limiting factor for crop fertigation, the
generated nutrient-rich reuse water is sufficient to annually irrigate about 10 m2 to 13 m2 per
sanitation user. Compared to crop nutrient requirements, there are too many nutrients in the reuse
water. Thus when using nutrient-rich reuse water, no use of fertilizers and a careful salt
management is necessary. When comparing this novel system with to the conventional and to two
adapted infrastructures, results showed that the novel CuveWaters system is the best option for
the given context in a semi-arid developing country. Therefore, the results of this study suggest a
further roll-out of the CuveWaters system. The methodology developed and the results of this
study demonstrated that taking sanitation users into consideration plays a major role for the
planning of an integrated water reuse infrastructure because they are the determinant factor for
the amount of available nutrient-rich reuse water. In addition, it could be shown that water reuse
and rainwater harvesting systems for the irrigation of small-scale gardens provide a wide range of
benefits and can be key to using scarce water resources more efficiently and to contributing to the
Sustainable Development Goals.
ii
�
�
Zusammenfassung Einleitung
Wasser ist in semi-ariden und ariden Gebieten eine knappe Ressource. Die Nutzung alternativer
Wasserressourcen, wie gesammeltes Regenwasser und wiedergenutztes kommunales Wasser,
zur Bewässerung in der kleinbäuerlichen Landwirtschaft, trägt dazu bei, die lokal verfügbaren
Wasserressourcen effizienter und produktiver zu nutzen. Das Ziel dieser Studie ist es, die
Regenwassersammlung und die Wiedernutzung von nährstoffreichen kommunalen Wasser für
die Bewässerung in der kleinbäuerlichen Landwirtschaft aus einer Systemperspektive zu
bewerten. Dies trägt dazu bei, dass Entscheidungsträger in Politik und Verwaltung wichtige
Informationsgrundlagen und eine Unterstützung bei ihrer Entscheidungsfindung erhalten,
insbesondere für der Frage welches System und welche Technologie unter den lokalen
Bedingungen am geeignetsten ist. Dazu hat die vorliegende Bewertung ökologische, soziale,
ökonomische, institutionelle und politische als auch technische Aspekte integriert berücksichtigt.
Als Fallbeispiel für die Bewertung wurde der zentrale Norden Namibias, im Rahmen des
CuveWaters Forschungs- und Entwicklungsprojekt, ausgewählt. Als grundlegende
Herangehensweise wurde eine Systemperspektive gewählt, mit der das hier vorgeschlagene
neuartige Konzept mit der bestehenden, konventionellen Infrastruktur verglichen wird.
Methoden
Folgende Methoden wurden für die Bewertung der Regenwassersammlung angewendet: Mit einer
Literaturrecherche wurde der technische, ökonomische, ökologische und soziale Nutzen von
Regenwassersammlung zur Bewässerung von Kleingärten zusammengestellt. Dann wurde eine
finanzielle Kosten-Nutzen Analyse mit Hilfe der Barwertmethode erstellt. Dafür wurden zwei
Optionen zur Bewässerung eines Nutzgartens bewertet: a) Die Sammlung von Regenwasser von
einem Hausdach mit Speicherung in einem Ferrozementtank, und b) die Regenwassersammlung
und -speicherung in einem wellblechbedachten Teich. Beide Regenwassersammlungsoptionen
wurden mit einem Subsistenzgarten und einem am Marktverkauf orientierten Garten kombiniert.
Erträge und Preise aus der Pilotphase wurden mit den Literaturwerten verglichen. Ebenso, wurde
die Regenwassersammlungs- und Bewässerungsinfrastruktur mit dem Namibia Green Scheme
Projekt verglichen, ein Vorhaben mit dem die großflächige und maschinelle Landwirtschaft mit
konventionellen Wasserressourcen massiv ausgeweitet werden soll. Zusätzlich wurde ein
Finanzierungsmodell entwickelt, dass Mikrokredite mit Staatsprogrammen kombiniert.
Zur Bewertung der Wasserwiederverwendung in der Landwirtschaft wurden folgende Methoden
angewendet: Für die Erstellung eines angepassten Anbausszenarios für die Bewässerung mit
iii
�
�
wiedergenutztem Wasser wurde zuerst die Anzahl pathogener Keime berechnet, die durch die
neuartige Abwasser- und Bewässerungsanlage erreicht werden kann (nach WHO 2006). Danach
wurden die Pflanzensorten ausgesucht und der Bewässerungsbedarf mit der FAO Software
CROPWAT modelliert sowie der Wasserbedarf zur Salzauswaschung nach FAO berechnet
(Pescod 1992). Eine mathematische Materialflussanalyse wurde mit SIMBOX durchgeführt, diese
umfasste: Eine Systemanalyse, die Programmierung des mathematischen Modells, das
Zusammentragen von geeigneten Daten, die Kalibrierung des Modells mit Felddaten, die
Simulation der Wasser, Nährstoff und Salzflüsse zwischen Haushalten, der Abwasserkläranlage,
der Landwirtschaft und der Umwelt, die Unsicherheitsanalyse mit Parameterranking, eine Monte
Carlo Simulation sowie die Interpretation der Resultate. Für die Quantifizierung der Wasserflüsse
wurden drei Fälle berechnet und verglichen: (i) die Situation vor dem Bau der verbesserten
Sanitäranlagen und der Wasserwiederverwendung und die Situation beim CuveWaters System,
mit (ii) alleiniger Benutzung, oder (iii) geringerer Benutzung der Sanitäranalgen. Für die
Quantifizierung der Nährstoff- und Salzflüsse wurde anstatt des Falls mit geringerem Nutzen der
Sanitäranlagen, ein Fall quantifiziert, in dem Ergebnisse der Pilotanlage eingegangen sind. Des
Weiteren wurde das CuveWaters System mit dem konventionellen System und zwei angepasste
System verglichen. Hierzu wurde eine Multi-kriterielle Entscheidungsanalyse mit der AHP
Methode angewendet. Dafür wurde eine Hierarchie von Kriterien formuliert, die Kriterien wurden
gewichtet, die vier Optionen wurden bewertet und parallel dazu die Bewertung auf Konsistenz
überprüft. Dann wurden diese Bewertungen aggregiert und schließlich die Sensitivität der
Ergebnisse ausgewertet, indem die Ergebnisse aus den unterschiedlichen Gewichtungen der
Nachhaltigkeitsdimensionen analysiert wurden.
Ergebnisse und Diskussion
Die Ergebnisse zeigen, dass sowohl die Regenwassersammlung als auch die
Wasserwiedernutzung zur Bewässerung in der kleinbäuerlicher Landwirtschaft eine große Zahl
technischer, ökologischer, ökonomischer, sozialer sowohl als institutionellen und politischen
Aspekten aufweist. Die Regenwassersammlung zur Bewässerung von Kleingärten hat in
Kombination mit dem marktorientiertem Garten, über die Lebensdauer der Anlage hinweg, eine
positive Kosten-Nutzen Bilanz: Der Ferrozementtank von 46.943 Namibian Dollar (N$) und der
Teich von 64.443 N$ pro Anlage. Dagegen haben mit dem Subsistenzgartenszenario beide
Regenwassersammelanlagen eine negative Kosten-Nutzen-Bilanz. Es wurde dabei auch deutlich,
dass die Materialkosten der Regenwassersammlungsanlage darin die Hauptkostenkomponente
darstellen. Währenddessen sind die Kosten für den Nutzgarten, sowie den Betrieb und die
Ersatzteile für die Regenwassersammlungsanlage sehr gering. Die erzielte Erträge und
iv

�
�
registrierte Preise waren deutlich höher als vorher angenommen. Der durchgeführte Vergleich mit
dem Green Scheme Projekt ergab, dass die Schaffung von 11.750 vollzeitequivalenten Jobs in
einem Zeitraum von 15 Jahren eine 9,6 bis 14,3-fach höhere Investition pro Job erforderte als bei
dem Regenwassersammelteich mit Kleingärten, oder dem Regenwasserferrozementtank mit
Kleingärten im gleichen Zeitraum. Jedoch bewässert das Green Scheme eine deutlich größere
Fläche und hat eine höhere Produktion pro geschaffenen Job. Die private Finanzierung der
Regenwasseranlagen stellt ein Problem für den Großteil der Kleinbauern dar und ist das größte
Hindernis für eine Verbreitung der neuartigen Technologie. Daher wird ein Finanzierungsmodell
vorgeschlagen, in dem mit Hilfe von staatlichen Programmen die Infrastrukturkosten der
Regenwassersammelanlagen finanziert werden. Kosten für Betrieb und Ersatzteile der Anlage
können dann mit Mikrokrediten an den Landwirten finanziert werden. Hierfür sollten finanzielle
Programme bereitgestellt werden. Des Weiteren muss die Regenwassersammlung für ländliche
Kleinstbauern in Namibische Gesetzte und Richtlinien einfließen. Somit hätte die Technologie das
Potential, ein wichtiger Bestandteil Namibias Wasserinfrastruktur zu werden. Risiken und
Herausforderungen sind der geringe Bildungsgrad und die schwachen Marktstrukturen in der
Region. Essentiell ist Bildung und Training um den Mangel an Kenntnissen und Erfahrung im
Feldbau in der Region auszugleichen. Zusammenfassend konnte gezeigt werden, dass die
Regenwassersammlung für die Bewässerung von Kleingärten eine ganze Reihe vorteilhafter
Aspekte aufweist und ein praktikabler und effektiver Weg ist, die ländliche Bevölkerung zu
erreichen und sie auf dem Weg aus der Armut zu unterstützen.
Die Ergebnisse der Wiederverwendung von kommunalem Abwasser für die Bewässerung haben
gezeigt, dass die Kläranlage und die Wasserwiedernutzungsfläche die von der WHO (2006)
geforderte Absenkung der Keimzahl zur uneingeschränkten Bewässerung von Blattgemüse
erreichen. Im Vergleich zur Trinkwasserbewässerung ist der Bewässerungswasserbedarf bei der
Bewässerung mit wiedergenutztem Wasser etwas höher, wegen des etwas höheren
Wasserbedarfs zur Salzauswaschung. Zwar ist mit den neu errichteten Sanitäranlagen der
Wasserbedarf der Haushalte erheblich höher, verglichen mit der vorherigen Praktik des
öffentlichen Defäkierens und der Nutzung der Grubenlatrinen. Aber bei einer ausschließlichen
Nutzung der verbesserten Sanitäreinrichtungen und der Bewässerung mit wiedergenutztem
Wasser bestehen immerhin 85 % des Bewässerungswassers aus wiedergenutztem Wasser.
Darüber hinaus kann der Austrag von ungeklärtem Abwasser und von Exkreta in die Umwelt auf
ein Minimum reduziert werden. Pro Kubikmeter Wasser, der von Haushalten und der
Landwirtschaft zusammen verbraucht wird, können 3,4 kg Feldfrüchte produziert werden. Im
Vergleich zu der Situation ohne verbesserte Sanitäreinrichtungen und ohne
v

�
�
Wasserwiedernutzung kann der Wasserbedarf von Haushalten und Landwirtschaft zusammen um
10% reduziert werden. Verglichen mit dem Fall, in dem die sanitären Einrichtungen verbessert
werden, aber keine Wasserwiederverwendung in der Landwirtschaft stattfindet, verringert sich der
den Wasserverbrauch von Haushalten und Landwirtschaft zusammengelegt sogar um 39 %. Mit
ausschließlichem Nutzen der Sanitäreinrichtungen und minimalen Wasserverlusten, die immer
entstehen, weil nicht das gesamte Abwasser in der Kanalisation gesammelt wird (z.B. Wasser für
Kochen oder Garten gießen), sind pro Jahr 27.600 m³ wiederverwendbares Wasser verfügbar.
Bei gemischter Nutzung der neuen Sanitäreinrichtungen zusammen mit fortgesetztem
öffentlichem Defäkieren und Nutzung der Grubenlatrinen wären jedoch jährlich nur 13.000 m³
verfügbar. Dagegen, würde eine simple Berechnung mit einem festen Wasserverbrauch pro Kopf
von beispielsweise 60 l/Person/Tag bei 1.500 Nutzern und der Annahme, dass das gesamte
Abwasser in der Kanalisation gesammelt werden kann, eine wesentlich überschätzte jährliche
Verfügbarkeit von 32.850 m³ wiederverwendbarem Wasser ergeben. Der Grund hierfür ist, dass
die Menge, die zur Wiederverwendung im Bewässerungsfeldbau zur Verfügung steht, maßgeblich
von dem Nutzerverhalten in den Sanitäreinrichtungen abhängt. Mit 1.500 Nutzern und
ausschließlichem Nutzen der am System angeschlossenen Sanitäreinrichtungen ist das
Bewässerungswasser, welches pro Sanitärnutzer produziert werden kann, unter den klimatischen
Bedingungen im zentralen-Norden Namibias ausreichend, um 1,5 ha oder 10 m² pro Sanitärnutzer
zu bewässern (mit 90% Unsicherheitsbereich 1,1 - 1,8 ha und 7 - 12 m²/cap). Während der
Pilotphase hat sich gezeigt, dass der Wasserverbrauch pro Person so hoch war wie für den Fall
der idealen Nutzung der Sanitäranlagen angenommen wurde. Jedoch waren deutlich weniger
Nährstoffe im Wasser enthalten, da die fortgesetzte öffentliche Defäkation und
gewohnheitsmassige Nutzung der Grubenlatrinen die ursprüngliche Einschätzung erheblich
übertraf. Es zeigte sich auch, dass die Zahl von 1.500 Nutzern der Sanitäranlagen während der
Designphase erheblich zu hoch eingeschätzt worden war und die Modellierung mit Daten aus der
Pilotphase auf 588 Nutzer schließen lässt. Die Ergebnisse haben ebenso gezeigt, dass das
Verhältnis der Nährstoffe (N, P, K, Ca, Mg) im Abwasser nicht dem Verhältnis entspricht, welches
Pflanzen zum Wachstum brauchen. Für eine optimale Düngung enthält das geklärte Wasser zu
viel N und nicht genug P und K. Dies könnte sich in anderen Ländern mit abweichender
Proteinzufuhr der Bevölkerung anders darstellen, denn es gelangten dann andere N- und P-
Mengen ins Abwasser, was die Ergebnisse beeinflussen würde. Ebenso könnte dies mit anderen
Feldfrüchten ebenfalls variieren, die einen besonders hohen Bedarf eines bestimmten Nähstoffes
haben. Um das Düngungspotential menschlicher Exkremente im Abwasser zu erhöhen, müsste
die öffentliche Defäkation und die weitere Nutzung der öffentlichen Grubenlatrinen vermieden
werden. Zusätzlich dazu müssten weitere Siedlungen an die Abwasserentsorgung angeschlossen
vi

�
�
werden um die Auslastung der Kläranlage zu gewährleisten. Da Wasser in der Region knapp ist,
wird es, trotz Bewässerung und Düngung mit wiederverwendetem, nährstoffreichem Wasser,
auch in Zukunft immer der limitierende Faktor bei der Bewässerung und Düngung bleiben. Beim
Vergleich des neuartigen Systems (sanitären Einrichtungen in informellen Siedlungen, erweiterte
Abwasserklärung und Wasser- und Nährstoffwiederverwendung) bei CuveWaters, gegenüber
dem konventionellen und der zwei angepassten Sanitär- und Abwasserinfrastrukturen, erweist
sich das CuveWaters System klar als die nachhaltigste Option. Schaut man sich dabei die
einzelnen Dimensionen an, so zeigt sich, dass vor allem in der ökologischen Dimension und in
der sozialen Dimension das CuveWaters System die höchsten Prioritäten aufweist. In der
ökonomischen Dimension, schneiden alle Optionen vergleichbar ab, jedoch belegt das
konventionelle angepasste System knapp den ersten Rang. In der institutionellen und politischen
Dimension belegt klar das konventionelle System den ersten Rang. In der technischen Dimension
dagegen, belegt das neuartig angepasste System den ersten Platz. Das Ergebnis der gesamten
Nachhaltigkeitsbewertung ergibt, bei ausgeglichener Gewichtung der Dimensionen, dass das
neuartige CuveWaters System klar die beste Option ist (31 % Priorität), gefolgt von dem
neuartigen angepassten System (26% Priorität), während die beiden konventionellen Systeme die
letzten Ränge belegen (21% und 22% Priorität). Gewichtet man die Nachhaltigkeitsdimensionen
dann unterschiedlich, so führt eine extrem hohe Gewichtung der sozialen und der ökologischen
Dimension zu einer noch klareren Präferenz des neuartigen CuveWaters Systems. Bei einer
extrem hohen Gewichtung der ökonomischen Dimension ist das konventionell angepasste
System knapp die bessere Option. Die Antwort auf die Frage, welches System unter lokalen
Bedingungen am besten geeignet ist, hängt also davon ab, welchen Fokus auf die jeweilige
Nachhaltigkeitsdimension gelegt wird.
Schlussfolgerungen
Die Ergebnisse dieser Studie belegen deutlich, wie unerlässlich es ist, das Verhalten der Nutzer
der sanitären Einrichtungen schon bei der Planung und dann auch während des Betriebes eines
integrierten Wasserwiedernutzungssystems zu berücksichtigen und ggf. zu beeinflussen, wenn
dieses möglichst effizient sein soll. Außerdem konnte gezeigt werden, dass die
Wasserwiedernutzung und die Regenwassersammlung für die Bewässerung kleinbäuerlicher
Landwirtschaft eine Vielzahl positiver Aspekte aus einer ganzen Reihe von Lebensbereichen mit
sich bringt und der Schlüssel sein könnte, knappe Wasserressourcen effizienter zu nutzen und
somit zu den Nachhaltigkeitsentwicklungszielen beizutragen.
vii

Table of contents
Acknowledgements ................................................................................................................... i
Abstract .................................................................................................................................... ii
Zusammenfassung .................................................................................................................. iii
List of figures ............................................................................................................................ x
List of tables ............................................................................................................................. x
List of abbreviations ................................................................................................................ xi
1 Synopsis ............................................................................................................................ 1
1.1 Introduction ................................................................................................................ 1
1.1.1 Alternative water sources ................................................................................... 1
1.1.1.1 Harvested rainwater…………………………………………………………………2
1.1.1.2 Reuse water…………………………… …………………………………………...2
1.1.2 Small-holder agriculture ...................................................................................... 3
1.1.3 Evaluation of the sustainability of water resource systems ................................ 4
1.2 The CuveWaters research project and the study area central-northern Namibia ...... 5
1.3 Research goal and questions .................................................................................... 9
1.4 Overview of the papers with methods, results and discussion .................................. 9
1.4.1 Paper 1 ............................................................................................................. 11
1.4.2 Paper 2 ............................................................................................................. 13
1.4.3 Paper 3 ............................................................................................................. 15
1.4.4 Paper 4 ............................................................................................................. 17
1.5 Conclusions ............................................................................................................. 18
1.6 Recommendations ................................................................................................... 20
1.7 Outlook ..................................................................................................................... 22
References ............................................................................................................................. 24
Curriculum Vitae ..................................................................................................................... 27
viii

2 Papers ............................................................................................................................. 29
2.1 Author contributions ................................................................................................. 29
2.2 Full copies of paper 1 to 4 ........................................................................................ 32
Paper 1: Woltersdorf et al. 2014 (Water Policy) ......................................................... 33
Paper 2: Woltersdorf et al. 2015 (Urban Water Journal) ............................................ 53
Paper 3: Woltersdorf et al. 2016 (Journal of Environmental Management) ................ 70
Paper 4: Woltersdorf et al. (submitted to Resources, Conservation and Recycling) .. 83
ix

List of figures
Figure 1: Central-northern Namibia and the Cuvelai-Etosha Basin with CuveWaters project
sites (Röhrig 2011) ................................................................................................................... 6
Figure 2: Characteristics of the population in central-northern Namibia at a glance (Republic
of Namibia 2008 a, Namibia Statistics Agency 2012) .............................................................. 8
Figure 3: Area that can be fertigated per person and year with grid water (caseconv) or
nutrient-rich reuse water and sludge (caseideal, caseassess) [m2/cap/yr] (mean value and 90%
probability range) (Woltersdorf et al. 2016). ........................................................................... 16
Figure 4: Results of the evaluation of the four options depending on weighting of
dimensions ............................................................................................................................. 18
List of tables
Table 1: Overview of papers and evolution of data during the time of paper preparation ...... 10
Table 2: Cases created for the material flow analysis of the water reuse system .................. 11
Table 3: Results of the cost-benefit analysis of two rainwater harvesting options and gardens,
assuming best case costs as with large-scale production, with discount rate of 5%
(Woltersdorf et al. 2014) ......................................................................................................... 12
Table 4: Summary of mean variable results (Woltersdorf et al. 2015) ................................... 15
x

�
��
List of abbreviations
AHP Analytical Hierarchy Process
Ca Calcium
Cap Capita
FAO Food and Agricultural Organization
IWRM Integrated Water Resources Management
K Potassium
Mg Magnesium
N Nitrogen
Na Sodium
N$ Namibian Dollar
P Phosphor
RBC Rotating biological contactors
UASB Upflow anaerobic sludge blanket
UV Ultraviolet
WHO World Health Organization
Yr Year
xi
�
��
1 Synopsis 1.1 Introduction Water for hygiene and agriculture is scarce in semi-arid regions. Many urban and most rural areas
in developing countries are characterized by a lack of inadequate infrastructures to provide
sanitation, treat wastewater and provide irrigation water. Worldwide around 1.2 billion people live
in areas of physical water scarcity and 2.6 billion (194 million alone in cities) are without improved
sanitation (UN Water and FAO 2007). At the same time, agriculture accounts already now for
around 70% of global freshwater withdrawals; yet, to meet growing future demands, the world
needs to produce 70 % more food by 2050 (WWAP 2012). Therefore, the Millennium Development
Goals and now the Sustainable Development Goals aim to expand access to sanitation to improve
human and environmental well-being, and to decrease poverty, hunger and disease (United
Nations 2015, United Nations 2011).
1.1.1 Alternative water sources Water infrastructure supplying water from conventional water sources such as groundwater and
surface water are coming increasingly under pressure. This is particularly the case in areas with
limited or scarce water resources, where demand for water by humans is growing and increasing
fresh water withdrawals have a growing negative ecological impact. This calls for change in the
present conventional water and wastewater system and examining alternative sources of water
(Guest et al. 2009). Alternative water sources (or also called non-conventional water sources)
include harvested rainwater, reuse water (i.e. former wastewater that has been treated) and
desalinated water (Boulware 2013, Qadir et al. 2007). Alternative water sources can be used for
non-potable uses (e.g. irrigation, toilet flushing, dust control, fire suppression) and with more
advanced treatment for direct or indirect potable reuse (i.e. discharged into a water body before
being used in the potable water system) (Qadir et al. 2007, Leflaive 2009). Alternative water
systems differ from prevailing ones as they reuse water for a variety of uses and/or they can be
based on decentralized infrastructures, producing water where it is consumed. Contexts where
alternative ways of supplying water can be viable include rural areas where land is abundant and
density is low and urban areas in developing countries where no central infrastructures pre-exist
or the existing infrastructure needs to be extended (Leflaive 2009). Potential benefits from an
alternative water system are (1) reduced demand for fresh water resources, diversified water
sources and enhanced reliability of access to resource; (2) reduced volume of wastewater
discharged into the environment; (3) reduced energy to transport water from the point of
production to the point of use and reduced greenhouse gas emissions due to energy savings; (4)
less infrastructure and reduced costs for the construction of networks; (5) relieving public finance
1

�
��
from part of the investment burden, as new players are incited to invest their own money in the
(decentralized) infrastructure; and (6) flexibility and adaptation to changes in population and
consumption, land use, and technology (Leflaive 2009). Challenges of alternative water systems
include for instance their additional costs, in particular when not initially integrated in the plan for
service provision and building construction; their risk, associated with the economy of water
services at the municipal level, the difficulty of how decentralized water systems will contribute to
a sustainable network and, in particular, the combination of decentralized systems with existing,
central infrastructures (Leflaive 2009). This study focused on the evaluation of two alternative
water sources: reuse water and harvested rain, as they are key to use local water resources in
water scarce areas more efficiently.
1.1.1.1 Harvested rainwater Rainwater can be harvested with a wide range of technologies that collect, store and provide water
for humans (Barron 2009). Water can be harvested in rural and urban areas, from natural or
artificial surfaces such as roofs, roads, pavements, ground catchments or slopes. The water is
then stored in wells, dams, ponds or cisterns (Ishaku et al. 2012; Pachpute et al. 2009). In recent
decades rainwater harvesting has experienced rapid expansion in many countries around the
world (Barron 2009). Especially in semi-arid regions, governments have promoted rainwater
harvesting for the irrigation of agriculture to raise agricultural yields and bridge dry periods.
Examples include the Laikipia District in Kenya (Malesu et al. 2006, Hatibu and Mahoo 1999), the
Western Pare Lowlands in Tanzania (Senkondo et al. 2004), Rajasthan and Gujarat in north-
western India (Agarwal et al. 2001) and the Gansu Province in north-central China (Li et al. 2000,
Barron 2009). These regions are characterized by a semi-arid climate with short rainy seasons,
high annual potential evaporation, severe seasonal droughts and water shortages and low
agricultural productivity. South Africa and the Indian state of Rajasthan have already integrated
rainwater harvesting into their national water policy (Mwenge Kahinda et al. 2007, UN-HABITAT
and Government of Madhya Pradesh 2007, DWAF 2004). This study focuses on the evaluation of
rainwater harvesting from corrugated iron roofs with storage either in ferrocement tanks (30 m³)
or ponds (80 m³) in a rural area.
1.1.1.2 Reuse water During the past decades, the attitude towards domestic wastewater has been changing, moving
to no longer considering wastewater as a waste but rather as a resource for water, energy and
plant fertilizing nutrients (McCarty et al. 2011, Guest et al. 2009). The reuse of treated water in
agriculture has been rapidly increasing worldwide, particularly in regions facing physical or
2

�
��
economic water stress, growing urban populations and growing demand for irrigation water
(Drechsel et al. 2010, Scheierling et al. 2010, Asano 2007, Hamilton et al. 2007). Drivers for water
reuse are increased demand for water; reduced availability of water supply, affordability due to
falling costs for membrane technologies, practicality of water reuse as a local solution, public
policy as for instance stringent standards for wastewater discharge as an incentive to recycle
water (Leflaive 2009). Today treated and untreated wastewater is reused in agriculture on an
estimated 20 million ha in 50 countries – a tenth of the world’s irrigated crops (Jiménez and Asano
2008). Semi-arid higher income countries (e.g. USA (California), Israel and Spain) extensively
practice planned reuse of treated water for irrigation, while middle income countries (e.g. Mexico,
Chile, Egypt) use not only treated but also untreated wastewater, indicating a transition between
unplanned and uncontrolled reuse to planned and controlled reuse. In lower income countries,
water supply and sanitation is often inadequate and highly polluted waters from surface-water
bodies are reused for irrigation, predominantly unplanned and unintentionally. The resulting
agricultural activities are most common in and around cities, as in most cities of Sub-Saharan
Africa (Woltersdorf et al. 2015, Drechsel et al. 2010, Scheierling et al. 2010). Especially semi-arid
regions with low fertilizer applications and little irrigation, such as in Sub-Saharan Africa, can
benefit from a stable supply of nutrient-rich reuse water for irrigation in order to increase yields
and local food production (Zaidi 2007). In spite of its potential in developing countries, municipal
wastewater is not widely treated and reused in urban agriculture due to a lack of appropriate water
infrastructure (Drechsel et al. 2010, Scheierling et al. 2010). In addition, previous studies indicated
that the management of existing water reuse schemes can lead to significant challenges such as
health risks through the spread of pathogens, soil degradation through salinization, toxic ions,
eutrophication or increased mobility of organic contaminants and critical public perceptions toward
the reuse of treated water for agricultural irrigation (Chen et al. 2012, Murray and Ray 2010,
O’Connor et al. 2008, Hamilton et al. 2007). Keeping the electrical conductivity in soils and
irrigation water below tolerable levels for crops is essential for the long-term success for irrigation
with reuse water (Biggs and Jiang 2009, O'Connor et al. 2008, Devitt et al. 2007). This study
focuses on the evaluation of water reuse designed to be collected from about 1,500 sanitation
users in formal and informal settlements of an urban area and is advanced treated in a treatment
plant in proximity of the settlements and reused for human food crops. The study focuses on using
the reuse water exclusively for the irrigation of small-holder agriculture.
1.1.2 Small-holder agricultureThere is no universal definition of “small” farms as the size is relative and depends on the local
context. Criteria often used to define whether a farm is considered small are the size of the farm
3

�
��
land, the amount of workers, or the amount of capital invested (HLPE 2013). The most commonly
used criterion to define “small” is land (HLPE 2013) and the Food and Agriculture Organization of
the United Nations (FAO) adopted a 2 ha threshold as a broad measure of a small farm (IFAD and
UNEP 2013); in Africa 80 % of the holdings are below 2 ha, 90 % below 5 ha (HLPE 2013). Also,
smallholders provide up to 80 % of the food supply in sub-Saharan Africa (FAO 2012). Smallholder
farmers use mainly family labor and retain part of the produce for family consumption. They are
characterized by family-focused motives such as favoring the stability of the farm household
system and the need to generate high productivity and enough income to fulfill basic needs, and
by marginalization in terms of accessibility to markets, resources, information, technology, capital
and assets (IFAD and UNEP 2013, HLPE 2013, FAO 2012). The capacity of small-holder
agriculture to achieve higher production levels per unit of land compared to larger farms has been
widely documented (HLPE 2013). The vast majority of smallholders live in rural areas, although
urban and peri-urban smallholdings are an increasingly important source of supply for developing
urban areas (IFAD and UNEP 2013). Historical evidence shows that smallholder agriculture,
adequately supported by policy and public investments, has the capacity to contribute effectively
to food security, food sovereignty, and substantially and significantly to economic growth, the
generation of employment, poverty reduction, the emancipation of neglected and marginalized
groups, and the reduction of spatial and socio-economic inequalities (HLPE 2013). Within an
enabling political and institutional environment, it can contribute to sustainable management of
biodiversity and other natural resources while preserving cultural heritage (HLPE 2013). The FAO
recognizes agricultural growth involving smallholders to be most effective in reducing extreme
poverty and hunger when it increases returns to labor and generates employment for the poor
(FAO et al. 2012). However, the productivity of smallholder agriculture and its contribution to the
economy, food security, and poverty reduction depend on soil fertility and freshwater delivery
among others (IFAD and UNEP 2013). This study analyzes the use of alternative water sources
for two extremes of small-holder agriculture: one end is an area of about 50 m² to 220 m² cultivated
by one or several small-holders using rainwater harvesting for irrigation. The other end is an area
of about 1 to 3 ha cultivated by a group of small-holder farmers using municipal reuse water. Thus,
a broad range of small-holder agriculture could be included in the evaluation.
1.1.3 Evaluation of the sustainability of water resource systems Whether alternative water sources for irrigation are a viable and sustainable option needs to be
evaluated. A working group of the American Society of Civil Engineers and the UNESCO has
defined sustainability of water resource systems in general as “designed and managed to fully
contribute to the objectives of society, now and in the future, while maintaining their ecological,
4

�
��
environmental and [engineering] integrity” (ASCE and UNESCO 1998). Their understanding of
sustainability implies the provision of efficient services that maintain public health and welfare, are
cost-effective, and reduce negative environmental impacts, today and into the future. (ASCE and
UNESCO 1998). Sustainable agriculture and rural development has been defined by FAO as:
“..the management and conservation of the natural resource base, and the orientation of
technological and institutional change in such a manner as to ensure the attainment and continued
satisfaction of human needs for present and future generations. Such sustainable development in
the agricultural [..] sector conserves land, water, plant and animal genetic resources, is
environmentally non-degrading, technically appropriate, economically viable and socially
acceptable” (FAO 1989). A system perspective implies taking into account all behaviors of a
system as a whole in the context of its environment. This includes the interactions and
relationships between the system and the environment (Bar-Yam 2011). This study evaluated the
two alternative water sources presented above, reuse water and rainwater harvesting, from a
system perspective considering ecologic, economic, societal, technical, political and institutional
aspects.
1.2 The CuveWaters research project and the study area central-northern Namibia The research project CuveWaters (2003 – 2015) developed and implemented measures to
support the Namibian process towards an Integrated Water Resources Management (IWRM). The
aim is to strengthen the potential of the region’s water resources by developing, adapting and
implementing novel technologies for water supply and sanitation as pilot plants. IWRM relies on
solutions that use various sources, types and qualities of water for different purposes. Depending
on its quality, the water is used as drinking water or to irrigate vegetable gardens. CuveWaters
implemented pilot plants for rain- and floodwater harvesting, groundwater desalination, and a
system consistent of sanitation units connected to a wastewater treatment plant and an agricultural
water reuse site (Figure 1) (CuveWaters 2013).
5

�
��
Figure 1: Central-northern Namibia and the Cuvelai-Etosha Basin with CuveWaters project sites
(Röhrig 2011)
The case study area central-northern Namibia located in the Cuvelai- Etosha Basin is the most
densely populated region in Namibia with around 42% of the Namibian population (Namibian
Statistics Agency 2012). The region is semi-arid and water scarce with short rainy seasons, high
precipitation variability, alternating droughts and floods, ephemeral river systems, no perennial
rivers and mostly brackish or saline (>5 g/l) groundwater (Sturm et al. 2009, Kluge et al. 2008,
Heyns 1995). Annual precipitation is highly variable ranging from 262 mm to 666 mm in 2/3 of
years, with an average of 464 mm, 96% occurring from November to April (Woltersdorf et al.
2015). Mean monthly temperature ranges from 18°C in June to 28°C in November and December
(Ondangwa station, data 2004 to 2007) leading together with high solar radiation and low humidity
to high potential evaporation rates of approximately 2600 mm/a (Heyns 1995). Presently, drinking
water is abstracted from the Calueque reservoir in Angola from the perennial Kunene river that is
shared between Angola and Namibia. The water is transported through an extensive grid of open
concrete and earthen canals (150 km) and pipelines (2,000 km) to the settlements in central-
norhtern Namibia, making it one of the largest water supply networks in Africa (Heyns 1995).
6

�
��
Growing demand for water has increased pressure and dependency on the water infrastructure
(Kluge et al. 2008). The majority of the population is rural (81%), but migration to cities has been
increasing and the urban population has doubled from 2001 to 2011 to 19% (Republic of Namibia
2012a). The region has a high demand for agricultural products for food security and import
substitution (Government of Namibia 2006). Mean annual per capita income in the region is 9,346
N$ (about 715 Euro), while Namibia wide the mean per capita income of subsistence farmers is
lower with 6,533 N$ (about 500 Euro) (Namibia Statistics Agency 2012).
In urban areas in Namibia, around 40% of the population does not have access to improved
sanitation. In informal settlements such as in the city of Outapi the situation is even more dramatic
and there is an acute need to improve sanitary conditions (Deffner et al. 2012) (Figure 2). Towns
in the region, such as Outapi have high population growth and mostly low-density and partly
informal settlements (Kluge et al. 2008) and exemplify the typical problems of water supply and
low access to sanitation facilities of urban areas in developing countries (see Deffner et al. 2012)
with an only partly coverage of sewer and wastewater treatment system, a high rate of people
practicing open defecation and insufficient access to functioning public latrines (Deffner et al.
2012). Namibia-wide 8% of the urban households practice urban agriculture (Republic of Namibia
2012 a). Ongoing population growth (up to 0.9% per year, Republic of Namibia 2012 a), further
urbanization, increasing withdrawal of Kunene water on the Angolan side, plans for extension of
commercial agricultural activities and expected effects of climate change are likely to increase
pressure on already scarce water resources in the area (Deffner and Mazambani 2010, Kluge
2008). Therefore the sanitation and wastewater treatment systems of the future need to be
adapted to these urban dynamics (CuveWaters 2013) and the Namibian government undertakes
considerable efforts to improve the access to water supply and sanitation in accordance with the
Millennium Development Goals (Republic of Namibia 2008 c, d).
In rural and remote areas the incidence of poverty is particularly pronounced with 38% of the
population being poor (Republic of Namibia 2008 b). Agricultural yields are generally very low,
leaving many households vulnerable to food insecurity and inadequate food supplies (Republic of
Namibia 2008 c). Unemployment is high (45%) and people mostly depend on subsistence rain-
fed crop farming during the rainy season and livestock farming (64%), which is a main source of
income for many (43%) households, while income from commercial farming plays a negligible role
(0.1%) (Namibia Statistics Agency 2012).
7

�
��
Figure 2: Characteristics of the population in central-northern Namibia at a glance (Republic of
Namibia 2008 a, Namibia Statistics Agency 2012)
The Namibian government extensively aims to increase and to invest in commercial, large-scale
irrigated crop production including maize and vegetables for import substitution, self-sufficiency,
job creation and food security at the national and the household level (MAWF 2008, Republic of
Namibia 2008 d, Weidlich 2007). For this, the Namibian government has developed a
comprehensive policy framework to promote household food security. However, so far insufficient
attention has been given to encourage micro- to small-scale (< 3 ha) local food production (Werner
2011). Current policies and legislation encourage the use of alternative water sources (Republic
of Namibia 2008 b). During the 1950s and 1960s several attempts have been made to harvest
rain in uncovered pump storage dams in central-northern Namibia. However, owing to poor water
quality, caused by evaporation, pollution and salinization, the dams fell into disrepair (Driessen
and Jokisch, 2010). Since 1969, in the capital Windhoek domestic wastewater is treated and
reused for potable purposes (Du Pisani 2006). Alternative water resources such as harvested
rainwater or reuse water for the irrigation of agriculture are not used so far. Alternative water
infrastructures could have a broad range of benefits and give essential impetus for the expansion
of micro- and small scale irrigated agriculture, the regional economy and poverty reduction.
Fertilizers have to be imported, although prices are currently relatively low for commercial farmers.
New ways to use the existing and scarce water resources most efficiently and productively have
to be found.
0 10 20 30 40 50 60 70 80 90
Households with piped water inside
Households with access to safe water
Households with private flush connected to main sewer
Households with no access to toilet facility
Household main source of income: subsistence faming
Household main source of income: commercial faming
Households engaged in crop farming
Unemployment
Rural population
Urban population
Percentage [%]
8
�
��
1.3 Research goal and questions The goal of this study was to evaluate the two alternative water sources reuse water and rainwater
harvesting providing irrigation water for two ends of small-holder agriculture from a system
perspective. For this we considered ecologic, economic, societal, technical, political and
institutional aspects. The evaluation is based on a case study in central-northern Namibia.
The goal will be reached by answering the following research questions:
(1) How can rainwater harvesting for the irrigation of small gardens be evaluated in terms of
sustainability and especially regarding economic aspects? Are rainwater harvesting based
gardens economically advantageous in comparison to conventional large-scale irrigated
agriculture?
(2) How much reuse water is available for irrigation when implementing the novel CuveWaters
concept? Does the reuse of municipal water for irrigation reduce the overall water demand
of households and agriculture?
(3) What quantities of nutrients and salts does municipal reuse water contain? What impact
do the users of the sanitation users have on nutrient and salt content of the reuse water?
What implications does this have for the area that can be fertilized and for preventing soil
salinization? To what extend does the use of sanitation units and wastewater treatment
reduce the diffuse discharge of nutrients and salts by inhabitants?
(4) How does a system of improved sanitation connected to advanced wastewater treatment
and water reuse for irrigation perform in relation to the local conventional infrastructure?
The research questions 1 to 4 will each be answered in one paper as described below.
1.4 Overview of the papers with methods, results and discussion The analysis of rainwater harvesting is presented in paper 1 and focuses on the financial part. The
analysis of water reuse is presented in paper 2, 3 and 4. Paper 2 and 3 analyze environmental
considerations, while paper 4 evaluates technical, economic, environmental, societal, as well as
institutional and political aspects of the CuveWaters system in comparison to the local
conventional infrastructure. As the research presented in paper 2, 3 and 4 is based on the same
pilot facility, but the research was conducted partly simultaneously and partly consecutively, also
the data and knowledge available in the course of the time evolved (Table 1). Paper 4 integrated
in its ecologic evaluation the results generated in paper 2 and 3. From paper 2, the quantification
of water flows was included in the criterion “Resource use efficiency” to calculate the indicator
“Share of reused water for irrigation out of total water consumption of irrigation and households”.
From paper 3, the results of wastewater discharge to the environment were used for the criterion
“Biogeochemical impacts” to calculate the indicator “Wastewater discharged untreated to the
9

�
��
environment”. As well from paper 3, the quantified amount of available nutrients from sanitation
for agriculture was used to calculate the indicator “Costs of irrigation water and fertilizer (farmer
perspective)” for the criterion “cost-benefit”.
Table 1: Overview of papers and evolution of data during the time of paper preparation
Paper
number
Water
source
Main topic Main research Evolution of data during time
of research
1 Rainwater
harvesting
Sustainability
criteria with focus on
economic and
financial part
early – end 2012
-
2 Water
reuse
Water flows,
planning data
second half 2011
– early 2013 -
3 Water
reuse
Nutrient and salt
flows, planning and
monitoring data
second half 2011
– mid 2014
In comparison to paper 2:
Availability of more accurate
data for the irrigation site:
� leaching efficiency of the
soil
� electrical conductivity of the
soil and of irrigation water
� agricultural produce and
yield
New calculation of
� irrigation and leaching
water demand
4 Water
reuse
Sustainability
evaluation,
integration of results
generated in paper
2 and 3
early 2015 –
early 2016
� Irrigation and leaching
water demand same as in
paper 3
� Greater irrigation site
For the mathematical material flow analysis of the water reuse system the following four cases
were created and partly renamed in paper 3 (see Table 2).
10

�
��
Table 2: Cases created for the material flow analysis of the water reuse system
Presented
in paper
number
Case with
previous water
and sanitation
infrastructure
Case with ideal
sanitation use,
design data
during planning
Case with realistic
sanitation use,
design data
during planning
Case with realistic
sanitation use,
assessment data
during pilot phase
2 Case 0 Case 1 Case 2 -
3 Caseconv Caseideal - Caseassess
Differences Case 0 and
caseconv are the
same
Case 1 and
caseideal are the
same
- -
1.4.1 Paper 1 The first paper assesses an infrastructure consistent of rainwater harvesting tanks and gardens
for small-holder agriculture regarding their benefits in technical, economic, environmental and
social terms. Then the paper focuses on the economic part with a financial cost-benefit analysis
for the pilot rainwater harvesting and gardening facilities in central-northern Namibia. Also a
financial comparison to the existing irrigation and drinking water infrastructure in central-northern
Namibia was performed. At the end, financial and policy implications for the implementation of
rainwater harvesting based gardening are proposed for the Namibian government. The
methodology covers five parts: (1) A literature review categorized technological, economic,
environmental and social benefits of rainwater harvesting for gardening. (2) Financial benefits for
a household or micro-entrepreneur were calculated with a financial cost–benefit analysis using
the net present value (NPV) method. Two rainwater harvesting options were analyzed: A roof
catchment with ferrocement tank at household level and a roof catchment with pond at community
level. For each of the two rainwater harvesting options, two crop scenarios were developed and
analyzed: A market garden scenario with only tomatoes, and a subsistence garden scenario with
vegetables and fruits for household consumption. (3) Then, yields and prices monitored at the pilot
plants in 2011 were presented and compared to those used in the cost–benefit analysis from Price
Waterhouse Coopers (2005). (4) The rainwater harvesting and gardening infrastructure was
compared to the existing Namibian green scheme project to irrigate large-scale agriculture with
conventional water sources, i.e. water abstracted from the Calueque dam and piped through
canals to the agricultural sites near the Angolan boarder. This helped to assess the use of an
alternative water source for small-holder agriculture against the local situation and current
government plans. (5) A proposal to finance the rainwater harvesting and gardening facilities by
combining microcredits and government subsidies was presented. The results showed that using
harvested rainwater for the irrigation of small-holder horticulture offers numerous technological,
environmental, social and economic benefits to local communities. Therefore the technology has
11

�
��
the potential to become an important part of Namibia’s water infrastructure. Nevertheless, the
implementation of small-scale water infrastructure is associated with certain risks and challenges.
In rural parts of Namibia, like in most other parts of rural Africa, the low level of education makes
it extremely difficult to implement the necessary structures to run gardening ventures that aim to
supply markets in the region. Education and training is also essential to counter the lack of
knowledge of horticultural production in the region. An additional challenge for planning gardens
irrigated with rainwater harvesting is the high rainfall variability in the region. The financial cost–
benefit analysis showed that the major cost component of a rainwater harvesting and garden
facility are the material costs of the rainwater harvesting facility, while costs for garden material
and operation and maintenance costs are relatively low. During the pilot construction phase
material costs were much higher than under ‘without project’ conditions. In addition, government
bulk purchase of important raw materials such as wood, steel and cement might drop current
monopoly prices considerably. The net present value of both rainwater harvesting facilities is
negative when assuming subsistence garden production and integrating the material costs of the
rainwater harvesting facility (Table 3). Assuming a market garden production, both facilities have
a positive net present value over their lifespan: the ferrocement tank of 46,943 N$ and the pond
of 95,711 N$.
Table 3: Results of the cost-benefit analysis of two rainwater harvesting options and gardens,
assuming best case costs as with large-scale production, with discount rate of 5% (Woltersdorf et
al. 2014)
Net present value [N$]
Rainwater
harvesting Garden
Including: material
investment costs,
labour construction
costs, O&M costs
Including: labour
construction costs,
O&M costs,
excluding: material
Ferrocement tank
(30 m³) *
subsistence (52 m²)
market (84 m²)
- 10,503
+ 46,943
+ 6,997
+ 64,443
Pond (80 m³) ** subsistence (146 m²)
market (229 m²)
- 17,521
+ 95,711
+ 25,579
+ 138,811
Calculation with lifespan of: * 40 years, ** 20 years
The monitoring of pilot plants after two years of operation showed that revenues were considerably
higher than estimated, while water use was higher than modelled. The comparison of rainwater
harvesting facilities to the green scheme project in Namibia showed, that in order to create 11,750
full time equivalent jobs over 15 years, the investment per job for the green scheme (914,145
12

�
��
N$/job) is 14.3 to 9.6 times higher compared to the one necessary for rainwater harvesting (with
a ferrocement tank: 63,775 N$/job and with storage pond: 95,312 N$/job). However, the Green
Scheme with large-scale and mechanized agriculture irrigates with water from the Calueque
reservoir a larger area and has a higher vegetable production per created job. Private financing of
initial investment costs represents a problem for most micro-entrepreneurs and is the major
limiting factor for the up-scaling of rainwater harvesting. In relation to this income level in the
Oshana region, tanks and gardens have high investment costs, while the maintenance costs of
rainwater harvesting facilities are very low. Therefore, in line with the concept of sustainable cost
recovery (OECD 2009), the paper proposes that the government could subsidize rainwater
harvesting infrastructure investment costs, while maintenance and operation costs can be
financed with a micro-credit to the micro-entrepreneur of the rainwater harvesting and gardening
facility. Also Namibian policy needs to be adapted, examples exist form its neighbor country South
Africa that has a policy to sustain micro-scale rural vegetable farming with grants and subsidies
for water supply infrastructure. Therefore, it could be shown, that the decentralized infrastructure
of rainwater harvesting for the irrigation of small-scale gardens provides a wide range of benefits
and can be a key in reaching the rural poor and sustain them to overcome poverty.
1.4.2 Paper 2 The second paper analyses the reuse of treated water to irrigate small-holder agriculture, focusing
on quantifying the amount of water flows and the water productivity within the system of water
supply, sanitation, wastewater treatment and water reuse for agriculture. The methodology
involved the four steps: (1) The modelling of the water requirement of the agricultural irrigation
site. The crop irrigation requirements were computed with the software CROPWAT 8.0 (FAO
1992, Allen et al. 1998) and the leaching requirement was calculated according to FAO (Pescod
1992). (2) The calculation of the pathogen reduction according to WHO (2006) achieved with the
proposed treatment plant, water storage, drip irrigation and an interval between final irrigation and
consumption of produce of three days. (3) Design of a crop scheme containing suitable crops for
safe unrestricted irrigation with reuse water. (4) A mathematical material flow analysis was
performed with SIMBOX, including the analysis of the system, programming of the mathematical
model, information on data collection and calibration, the simulation of the water flows including
three case calculations, the uncertainty analysis with parameter uncertainty ranking and Monte
Carlo simulation and finally the analysis and interpretation of the results. The three cases
compared the situation with the previous water supply and sanitation infrastructure, the situation
with the CuveWaters system and ideal use of sanitation units, and the situation with the
CuveWaters system and mixed use of sanitation units and open defecation. The results showed
13

�
��
that the proposed wastewater treatment plant and water reuse site achieves the necessary
pathogen reduction of 6 log units for unrestricted irrigation of edible leaf crops (WHO 2006), even
in the low range of uncertainty. Irrigating with reuse water, the agricultural irrigation requirement
was a little higher compared to drinking water irrigation (Table 4), due to the higher leaching
requirement. Household water consumption was considerably higher assuming improved
sanitation facilities compared to practicing open defecation and using pit latrines and public water
points. In the case of ideal use of sanitation unit and irrigation with reuse water (case 1), the water
inflow to the system was the lowest (36,800 m³/yr) as reusing the used water from households for
irrigation of agriculture contributed to lower the total water requirement of the system (-10%)
composed of households and agriculture, compared to the previous situation without improved
water supply, improved sanitation and water reuse (case 0, 40,700 m³/yr). As well, 85% of the
irrigation water was composed of reuse water and the discharge of untreated water and excreta
to the environment is the lowest (6,018 m³/yr) of all cases. For this reason, water productivity is
the highest with 3.4 kg fruits and vegetables produced per m³ of water used in the system.
Improving sanitation with reusing water for irrigation reduces therefore the overall water demand
of the system by 39%, compared to improving sanitation without reusing the water for agriculture.
In the case of ideal sanitation use, 27,600 m³ reuse water is available per year, compared to only
13,000 m³/yr in the case of low sanitation use mixed with open defecation and use of pit latrines
(case 2). In comparison to this, conducting a simple calculation with a fixed per capita wastewater
inflow, assuming only a water consumption per person of 60 liters/day and 1,500 inhabitants and
that wastewater is entirely collected by the sewer, would result in an expected overestimated
wastewater flow of 32,850 m³/year available for water reuse. This is because the amount of
household wastewater that is available for reuse in agriculture depends on the behavior of the
users of the sanitation facilities. The methodology developed and the results of this study
demonstrated that taking sanitation users into consideration plays a major role for the
quantification of expected water flows and productivity, as this is the most determinant factor for
the amount of available resue water.
14

�
��
Table 4: Summary of mean variable results (Woltersdorf et al. 2015)
Case 0 Case 1 Case 2
Agricultural production [kg/yr] 124,800
Agricultural irrigation water requirement [m³/yr] 23,400 27,084
Household water consumption [m³/yr] 17,340 32,870 25,120
Water inflow to the system [m³/yr] 40,700 36,800 43,700
- From tap water 40,700 34,200 41,100
- From ephemeral river 0 2,600 2,600
Water treated and available for reuse in agriculture [m³/yr] 0% 27,600 13,000
People using sanitation facilities [number] 649 1,501 1,165
Share of irrigation water composed of treated reused water [%] 0% 85% 32%
Untreated water and excreta discharged to the environment 17,769 6,018 12,810
Water productivity of the system [kg/ m³] 3.1 3.4 2.9
Change of water inflow to the system (or of water productivity) 0 -10% 7%
Change of water inflow to the system (or of water productivity)
compared to if no reuse takes place [%] 0 -39% -16%
1.4.3 Paper 3 The third paper analyses water reuse to irrigate small-holder agriculture, focusing on quantifying
the nutrient and salt flows as impacted by sanitation user behavior. The methodology involved the
quantification of nutrient and salt flows from the households to the wastewater treatment plant,
agriculture and the environment. Same as for the water flows this was performed again with
mathematical material flow analysis using the software SIMBOX. The model served to quantify
how many nutrients and salts are discharged from households to the environment, how many
nutrients can be recovered from wastewater for agriculture and which area can be fertilized as
well as how many salts are present in the reuse water under different assumptions. First, indicators
for nutrient content and salinity were identified and chosen, then the system was defined and the
mathematical model was set up, data was collected and calibrated, three cases were designed,
the cases were simulated and an uncertainty analysis and parameter uncertainty ranking were
performed, and finally the results were analyzed. The nutrient requirement for the crop scenario
that has been developed in paper 2 was calculated. In addition, also the leaching requirement for
agriculture was calculated for the given salinity of the reuse water and for drinking water based on
monitoring results. The results showed, that assuming ideal sanitation use, 1,500 users and the
developed crop scheme, the reuse water is sufficient to annually irrigate 1.5 ha (90% probability
range 1.1 - 1.8 ha) meaning 10 m² per sanitation user (7 - 12 m² per sanitation user) (Figure 3).
Compared to crop water and nutrient requirements, there are too many nutrients in the reuse
water.
15
�
��
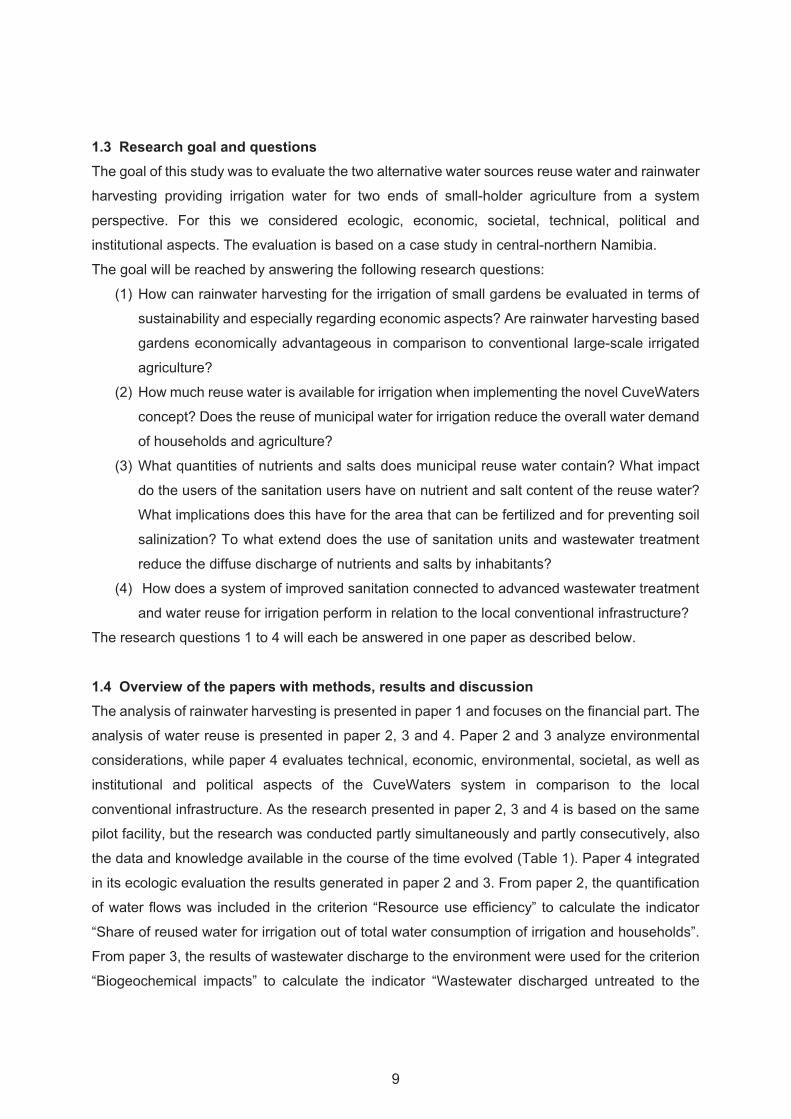
Figure 3: Area that can be fertigated per person and year with grid water (caseconv) or nutrient-rich reuse water and sludge (caseideal, caseassess) [m2/cap/yr] (mean value and 90% probability range) (Woltersdorf et al. 2016).
The assessment based on data from the CuveWaters pilot phase showed that water use per
person was as high as was expected in the design phase for the case of ideal sanitation use.
However fewer nutrients were present in the wastewater, because more open defecation than
expected took place even after construction of the CuveWaters infrastructure. As well the
assessment showed that the number of 1,500 sanitation users was overestimated in the design
phase and model results of this study suggest 588 users. Results also indicated, that the ratio of
nutrients (N, P, K, Ca, Mg) in wastewater differs from the ratio of the nutrients required by crops.
For optimum crop growth, wastewater contains too much N and not enough P and K. This might
be different in other counties with different protein intake of the population or with other crops
grown that have other nutrient requirements. To fully exploit the fertigation potential of human
excretions and wastewater, open defecation and latrine use needs to be avoided. In addition,
additional settlements should be connected to the wastewater treatment plant as its capacity is
currently not fully used. Using nutrient-rich reuse water for irrigation makes fertilizer application
unnecessary. However, because water is a scarce resource in the area, it is water itself that is
likely to remain the factor determining the size of the agricultural area.
020406080
100120140160180200220240260280
N P K Na Ca Mg water
Are
a p
ossib
ly fe
rtig
ate
d [m
²/ca
p/y
r]
Case conv: Previous water and sanitation infrastructure (1500 sanitation users)
Case ideal: Ideal sanitation use and water reuse (1500 sanitation users)
Case assess: Assessment during pilot phase (588 sanitation users)
16

�
��
1.4.4 Paper 4 The fourth paper compares water reuse to irrigate small-holder agriculture as proposed by the
CuveWaters project to the conventional sanitation, wastewater and irrigation infrastructure and to
two versions of these systems adapted by this study. The methodology involved first the definition
of the goal, scope, spatial and temporal boundary of the evaluation. Second, the options to be
compared were explained regarding the amount of sanitation users in formal and informal
settlements, the type of water supply, the sanitation infrastructure, the sewer system, the type of
wastewater treatment and the agriculture irrigation site. Third, a multi-criteria decision analysis
was performed using the Analytical Hierarchy Process (AHP) method, as the evaluation involved
multiple different criteria. The AHP Method involved first formulating a hierarchy of criteria, second
weighting the criteria, third the evaluation of the four systems and parallel evaluation of the
consistency of results, and finally the aggregation and analysis of the results. Fourth, the different
weighting of sustainability dimensions in order to test the sensitivity of the results was explained.
The results showed that looking at the single dimensions, in the ecologic dimension the
CuveWaters system scored highest (54 % priority) followed by the novel adapted system (priority
25%). In the economic dimension, the conventional adapted system scored highest having a
priority of 32%, even though all four systems are very close. In societal terms, the evaluation of
the four options showed that the novel CuveWaters system and the novel adapted system
comprising the same sanitation infrastructure in formal and informal settlements scored by far best
(34% priority), the other two having only a priority of 16%. Regarding the institutional and political
sustainability, the conventional system scored highest (49 % priority). The CuveWaters system
scored lowest, having the highest institutional complexity and requiring the most institutional
capacities. The technical sustainability was evaluated to be best for the novel adapted system (31
% priority) followed by the CuveWaters system (26 % priority). Aggregating the five dimensions,
the overall sustainability, weighting the dimensions equally, resulted that the CuveWaters system
scored highest, having a priority of 31 %, followed by the novel adapted system (26 % priority)
and the two conventional options (21 % and 22 % priority). Weighting the ecologic dimension as
“extremely important”, it contributes 69% and the other four dimensions together 31 % to the
overall sustainability, the CuveWaters system is by far the best choice with 45 % priority. Weighting
the economic dimension as “extremely important”, the conventional adapted system is the best
option with 28 % priority, even though all options are very close here, and differences might be
questioned due to a range of uncertainty among the priority values.
17

�
��
Figure 4: Results of the evaluation of the four options depending on weighting of dimensions
In summary, considering an equal, an ecologic and a societal focus of the dimensions, the
CuveWaters system is the most sustainable option compared to the other systems. The options’
ranking however depends on the weighting of the dimensions; the other three systems score best
in one case each. Therefore, the results of this study suggest a further roll-out of the implemented
CuveWaters system.
1.5 Conclusions The results of the study showed that the two alternative water sources, i.e. harvested rainwater
and municipal reuse water, offer a wide range of benefits for the irrigation of small-holder
agriculture. Rainwater harvesting is suited to irrigate gardens (ca. 50 – 220 m²) in rural areas and
offers numerous societal, economic, environmental and technical benefits. In addition, the activity
can be financially viable for micro-entrepreneurs, if specific aspects are considered: Material
investment costs for the rainwater harvesting infrastructure should be government funded, while
the investment costs for the garden and irrigation infrastructure as well as the operation and
maintenance costs for the rainwater harvesting plant can be privately financed, such as with a
micro-credit. In addition, horticultural crops combining high water efficiency with a high market
22%21%
31%
26%
35%
21% 22% 22%24%
28%26%
23%22% 21%
28%29%
18% 18%
33%31%
12%
17%
45%
26%
0%
5%
10%
15%
20%
25%
30%
35%
40%
45%
50%
1a: Conventional 1b: Conventionaladapted
2a: Novel 2b: Novel adapted
Pri
ori
ty %
Equal focus
Institutional and poltiical focus
Economic focus
Technical focus
Societal focus
Ecologic focus
18

�
��
price should be planted in order to achieve the necessary revenues. Finally, to facilitate broad
implementation and achieve benefits for the regional economy, the adoption of rainwater
harvesting in Namibia’s water policy framework is required. Reuse water offers a wide range of
benefits for small holder agriculture (ca. 1 - 3 ha) in urban areas. In order to collect sufficient
municipal wastewater, adequate sanitation facilities need to be implemented that are adapted to
the needs in formal and non-formal settlements. Then the wastewater can be advanced treated
and reused productively for agriculture, instead of discharging the wastewater untreated to the
environment spreading pathogens, salinity and nutrients. Looking at the area that can be fertigated
with reuse water, the water is the limiting factor followed by phosphorous. Depending on sanitation
user number and behavior, sufficient nutrient-rich reuse water can be generated to irrigate 10
m²/cap (90% uncertainty range: 7 – 12 m²/cap) assuming ideal sanitation use and a medium water
use per person of 1,500 inhabitants. About 13 m²/cap (90% uncertainty range: 9 – 16 m²/cap) can
be irrigated assuming mixed sanitation use and a higher water use per person of 588 inhabitants,
as monitored during the pilot phase of the CuveWaters infrastructure. If sanitation units are fully
used and the drainage pond is lined, the discharge of nutrients and salts to the environment can
be almost completely avoided. Enough municipal wastewater can only be collected if sufficient
people have access to sanitation units connected to the sewer and if the further use of pit latrines
and open defecation is avoided. This poses a significant challenge for planning, since in most
urban informal settlements there is no population census and the amount of sanitation users can
only be estimated. In addition, the number of inhabitants might considerably fluctuate over time,
due to fluctuations in the inhabitants of the settlement itself and due to the sanitation behavior of
the inhabitants that partly stick to either using pit latrines or still practicing open defecation, or due
to changes of the water and sanitation tariff. Given the conditions in Namibia and the protein intake
of the local population, it is likely that too many nutrients are contained in the water related to crop
requirements. Also due to the elevated levels of salts originating from human excreta, the risk of
soil salinization is higher than with drinking water irrigation. Therefore adequate leaching of the
soil is required.
In comparison to the conventional sanitation infrastructure in formal settlements, it is
advantageous to implement a sanitation infrastructure in informal settlements that is adapted to
the spatial and economic preconditions in the informal settlements and to offer, for instance,
shared sanitation facilities. Comparing the proposed adapted sanitation facilities connected to
advanced water treatment (UASB, RBC, microsieve, UV-light) for water reuse to the conventional
infrastructure including drinking water irrigation and two adapted versions of the systems showed
that the CuveWaters system is overall the most sustainable option. Looking at specific
sustainability dimensions, the CuveWaters system is clearly most sustainable in environmental
19

�
��
and societal terms. However, in the economic, institutional and political as well as in the technical
dimension, the other three options score each higher once. Benefits of the CuveWaters system
are its better resource efficiency, the lower biogeochemical impacts, the better cost-benefit ratio
for the farmer, the positive impact on poverty reduction, its high accordance with national policies,
its technical robustness, its superiority regarding accessibility, practicability, acceptance, creation
of social capacities, benefits regarding socio-economic and symbolic values and positive health
impacts. Challenges are the higher spatial impacts, user affordability, the cost-benefit ratio for the
town-council, the lower practicability and higher conflict potential for sanitation users, the higher
institutional complexity and a higher need of institutional capacities, its higher effort for
construction and maintenance and its lower lifetime. In summary, the results suggest a further roll-
out of the CuveWaters system to reuse municipal water for irrigation. Hence, expanding water
reuse and rainwater harvesting for agricultural irrigation is a viable way towards a more
sustainable use of water sources, using fewer resources, being economically feasible, as well as
being institutionally and politically practicable and technically sound. Then, the use of these two
alternative water sources is a valuable contribution to reach Namibia’s Vision 2030 and the
Sustainable Development Goals.
1.6 Recommendations In water scarce areas, the use of alternative water sources for the irrigation of small-holder
agriculture is a viable option to use existing water resources more efficiently. Two options for this
are the reuse of municipal water and the use of harvested rainwater. Thus, it has to be considered,
that each source of water is suited for a specific context:
� Before the introduction of a new rainwater harvesting and water reuse facility, planners
should evaluate different infrastructure options and systems regarding ecologic, economic,
societal, institutional and political as well as technical criteria, in order to assess which
option is suited best for the local conditions under the given priorities and constraints. For
this, a weighting of the different sustainability criteria should be performed in order to rank
the options depending on the prioritization of criteria.
� Rainwater harvesting should further be implemented in rural areas for the irrigation of
small-scale agriculture of about 50 to 220 m² gardens. To finance the material investment
costs of the rainwater harvesting infrastructure, policy makers should design and
implement programs and funds adapted to the local context. Programs and local support
infrastructure should also be set up to assign micro-credits to small entrepreneurs to
finance the garden and irrigation investment costs and the operation and maintenance
20

�
��
costs for both rainwater harvesting and gardens. In addition, local agricultural extension
officers should train and advice micro-entrepreneurs in rainwater harvesting and
gardening, such as on which crops to plant that combine high water efficiency and a high
market price. Also, policy makers should integrate a rainwater harvesting policy framework
into the national water policy in order to facilitate a broader implementation.
� When planning and implementing new sanitation, wastewater treatment and irrigation
infrastructure in the city, planners and decision-makers should opt for an integrated option
with water reuse. Reusing water for irrigation after advanced treatment and collection of
the water from adequate sanitation units is the most sustainable option. This is especially
the case if ecological and societal benefits have a high priority for the town. However, with
a very high priority on the economic side due to financial constraints, water reuse for
irrigation obtained after a low-tech treatment in a pond might be the most sustainable
option.
� Decision-makers and planners in town councils should further construct sanitation units in
informal settlements that are adapted to the spatial and economic preconditions and to the
needs in the informal settlements. Even though they are for instance shared by several
households and do not offer the benefits of individual sanitation connections in houses,
they offer numerous benefits in comparison to the current alternative of open defecation
and use of pit latrines.
� The further practice of open defecation and the use of pit latrines should be avoided in
order to minimize environmental pollution through the spread of salts and nutrients as well
as public health risks through the spread of pathogens. Instead, by closing the loop from
sanitation to agriculture through direct water reuse, the water and nutrients should be
reused productively for agriculture.
� The town council should concentrate on raising the number of sanitation users in order to
collect sufficient water and nutrients for the generation of sufficient nutrient-rich reuse
water for irrigation. This could be achieved by continuing to arrange trainings e.g. with
Community Health Clubs that have started in the CuveWaters project, where local
inhabitants using the sanitation units are trained to use the sanitation units instead of
further practicing open defecation or using the former pit latrines. In addition, the town
council should ensure that each inhabitant around the cluster washhouses has the
necessary access to the sanitation unit, such as having a key.
In summary, the results suggest a further roll-out of water reuse and rainwater harvesting for the
irrigation of small-holder agriculture.
21

�
��
1.7 Outlook
� The developed and applied methodology of this study can be used for all areas in developing
countries which are characterized by insufficient water supply and wastewater infrastructure
with similar starting conditions as those described in central-northern Namibia. Similar starting
conditions include for urban areas: informal settlements with public water points, public
latrines and a high share of inhabitants practicing open defecation, a low income, high
unemployment and low education level of the inhabitants, a semi-arid climate that requires
irrigation for agriculture and enough space available to build the wastewater treatment plant
and the irrigation area in proximity to the city, such as, for instance on the edge of a city with
either a developing area or low population density. The methodology could also be used in
semi-arid higher income countries, when adapting the system in the material flow analysis
including existing types of sanitation facilities and sanitation user behavior. For the evaluation
of an integrated sanitation, a wastewater treatment and water reuse system in comparison to
the conventional system, the method used for other areas in developing or developed
countries would be the same, however some criteria and indicators would need to be adjusted
to the different starting conditions and to the different local context.
� The results of the study could be generalized and broadly transferred to other areas which
have conditions similar to those in the model region central-northern Namibia. When
comparing the results of this study, also the scale of the water infrastructure should be similar,
since for water reuse this includes a similar amount of sanitation users and size of the
irrigation area, while for rainwater harvesting this implies a comparable amount of harvested
rain and area of the garden. Finally, regarding the necessary amount of irrigation, also the
climate including especially precipitation, temperature and UV-radiation should be similar.
� Further studies should test with different case studies, how the method can be easily
transferred to other countries and regions with different conditions as those of the presented
model region. Also the results obtained in this study could be tested and validated.
� For the evaluation of the water reuse system, future studies should be conducted that also
include the view of different local stakeholders into the evaluation process. The same method
used for this study would be used and each stakeholder would weigh the criteria and evaluate
the options separately. Then, with the evaluation of each participant, the software would
compute a result that is more accurate and directly integrate the local perspective. Tests could
also reveal if other evaluation methods generate the same results. In addition, further studies
could analyze the list of criteria and indicators and rank which ones have the highest impact
on the final results of the evaluation. This would result in a list of fewer indicators which
22

�
��
evaluate the water infrastructure, and in addition, this indicator ranking would show which
indicators scientists should put the most effort into when collecting the most accurate data.
For the ecologic indicators, a parameter ranking was performed indicating which parameters
are responsible for the major uncertainty of two ecological indicators. It showed that the
number of sanitation users and the share of wastewater that is collected by the sewer (i.e.
and not discharged into the environment) have the highest impact on the uncertainty.
Therefore, more effort should be put into collecting more certain data on these two
parameters.
� Future studies could quantify the amount of nutrients and salts excreted in other countries
with different total dietary protein intake and with different share of vegetable protein intake.
Also, nutrient requirements and salt tolerances of other crops could be analyzed and
categorized. Then, it could be analyzed whether the relationship among nutrients in
wastewater fits better to the one required by crops. This could also be analyzed under different
climatic conditions and irrigation requirements. However, water is likely to remain the limiting
factor for crop growth as related to the irrigation water and the nutrient requirement of crops,
the amount of excreted nutrients per person is way too high compared to the water use per
person. Scientists could further analyze the impacts of different amounts of users, combined
with different amounts of water use per person and amounts of toilet use in relation to different
sizes of the agricultural irrigation area.
� It could be quantified and tested how many nutrient and salts are in human excreta in other
countries and regions, where people have different diets. Especially a different protein intake
will have an impact on how much N and P is present in the wastewater. A different intake of
salt and minerals will also have an impact on how much salt is present in excreta. Then, the
quantity and the ratio in wastewater could be different. A different crop scenario could have a
different quantity and ratio of nutrient uptake. For this, the developed mathematical material
flow model of this study could be used for computation.
� For rainwater harvesting and garden facilities, the evaluation of the financial cost-benefit ratio
could be further improved by integrating more monitoring data on prices and yields. In
addition, also ratios of different tank, catchment and garden sizes should be scientifically
analyzed in order to discover the best cost-benefit ratio.
23

�
��
References Agarwal, A., Narain, S., Khurana, I., 2001. Making Water Everybody’s Business. Practice and
Policy of Water Harvesting. Centre for Science and Environment, New Delhi.
Asano, T., 2007. Water reuse issues, technologies and applications. New York: McGraw-Hill. ASCE, UNESCO, 1998. Sustainability criteria for water resource systems. American Society of
Civil Engineers, Reston, VA, USA. Bar-Yam, Y., 2011. Concepts: System Perspective. New England Complex Systems Institute.
http://necsi.edu/guide/concepts/system_perspective.html (accessed 24/09/2015)
Barron, J., 2009. Rainwater Harvesting: A Lifeline for Human Well-Being. UNEP. Stockholm. Biggs, T.W., Jiang, B., 2009. Soil Salinity and Exchangeable Cations in a Wastewater Irrigated
Area, India. J Environ Qual 38 (3), 887. Boulware, B., 2013. Alternative Water Sources and Wastewater Management. McGraw-Hill:
New York.
Chen, Z., Ngo, H., Guo, W., 2012. A critical review on sustainability assessment of recycled water schemes. Science of The Total Environment. 426: 13–31.
CuveWaters, 2013. Water is life – Omeya ogo omwenyo. CuveWaters mid-term report. Institute for social-ecological research ISOE. Frankfurt am Main.
Deffner, J., Reisenauer, S., Storch, K., 2012. Household Inventory Survey (HIS) in three informal
settlements in Outapi (Namibia). Institute for social-ecological research ISOE.Frankfurt am Main.
Deffner, J., Mazambani, C., 2010. Participatory empirical research on water and sanitation demand in central northern Namibia: A method for technology development with a user perspective. CuveWaters Papers 7. Institute for social-ecological research ISOE.
Frankfurt am Main. Devitt, D. A.; Lockett, M., Morris, R. L., Bird, B. M., 2007. Spatial and Temporal Distribution of
Salts on Fairways and Greens Irrigated with Reuse Water. Agronomy Journal, 99 (3): 692 – 700.
Drechsel, P., Scott, C.A., Raschid-Sally, L., Redwood, M., and Bahri, A., 2010. Wastewater
Irrigation and Health Assessing and Mitigating Risk in Low-Income Countries. London: Earthscan.
Du Pisani, P., 2006. Direct reclamation of potable water at Windhoek's Goreangab reclamation plant. Desalination 188, 79–88.
Driessen, C., Jokisch, A., 2010. Current Status of “Stengel Dams” in Central-Northern Namibia.
Internship Report, Darmstadt University of Technology. DWAF Department of Water Affairs and Forestry of South Africa, 2004. Policy on Financial
Assistance to Resource Poor Irrigation Farmers. In terms of sections 61 and 62 of the national Water Act, 1998. Pretoria, South Africa.
FAO, 2012. Smallholders and familiy farmers: Sustainability Pathways, 4 pp. (accessed 11-Mar-
15). FAO, 1989. Sustainable development and natural resources management. Twenty-Fifth
Conference, Paper C 89/2 - Sup. 2, Food and Agriculture Organization, Rome. Government of Namibia, 2006. Millennium challenge account Namibia. Government of Namibia,
Windhoek. Guest, J. S., Skerlos, S. J., Barnard, J. L., Beck, M. B., Daigger, G. T., Hilger, H., Jackson, S. J.,
Karvazy, K., Kelly, L., MacPherson, L., Mihelcic, J. R., Pramanik, A., Raskin, L., van Loosdrecht, M. C. M., Yeh, D., Love, N. G., 2009. A New Planning and Design Paradigm to Achieve Sustainable Resource Recovery from Wastewater. Environmental Science and Technology 43(16), 6126-6130.
Hamilton, A.J., Stagnitti, F., Xiong, X., Kreidl, S.L., Benke, K.K., Maher, P., 2007. Wastewater Irrigation: The State of Play. Vadose Zone Journal, 6 (4), 823.
24
�
��
Hatibu, N., Mahoo, H., 1999. Rainwater Harvesting Technologies for Agricultural Production: A case for Dodoma, Tanzania. Animal Traction Network for Eastern and Southern Africa. Bulawayo, Zimbabwe.
Heyns, P., 1995. The Namibian Perspective on Regional Collaboration in the Joint Development
of International Water Resources. Water Resource Development 11(4), 467–492. Kluge, T., Liehr, S., Lux, A., Moser, P., Niemann, S., Umlauf, N., Urban, W., 2008. IWRM
concept for the Cuvelai Basin in northern Namibia. Physics and Chemistry of the Earth 33, 48–55.
High Level Panel of Experts on Food Security and Nutrition (HLPE), 2013. Investing in smallholder agriculture for food security. A report by the High Level Panel of Experts on Food Security and Nutrition of the Committee on World Food Security. HLPE Report 6. Rome.
IFAD, UNEP, 2013. Small-holder, food security and the environment, 54 pp. (accessed 11-Mar-15).
Ishaku, H.T., Rafee Majid, M., Johar, F., 2012. Rainwater harvesting: An alternative to safe water supply in Nigerian rural communities. J. Water Resource Management 26, 295–305.
Jiménez, B., Asano, T., 2008. Water reuse: An international survey of current practice, issues
and needs. London: IWA Publishing. Leflaive, X., 2009. Alternative Ways of Providing. Water Emerging Options and Their Policy
Implications. OECD, Paris, 34 pp. Li, F., Cook, S., Geballe, G. T., Burch, W. R., 2000. Rainwater harvesting agriculture: an
integrated system for water management on rainfed land in China’s semiarid areas. An
integrated system for water management rain-fed land in China’s semiarid areas. Royal Swedish Academy of Science 29 (8), 477–483.
Malesu, M., Sang, J., Odhiambo, O., Oduor, A., Nyabenge, M., 2006. Rainwater Harvesting Innovations in Response to Water Scarcity: Runoff water harvesting in Lare, Kenya. Technical Manual. World Agroforestry Centre, Nairobi.
MAWF, 2008. Green Scheme Policy. Namibian Ministry of Water Agriculture and Forestry, Windhoek.
McCarty, P.L., Bae, J., Kim, J., 2011. Domestic Wastewater Treatment as a Net Energy Producer–Can This be Achieved? Environmental Science and Technology 45 (17), 7100–7106.
Murray, A., Ray, I., 2010. Wastewater for agriculture: A reuse-oriented planning model and its application in peri-urban China. Water Research. 44 (5): 1667–1679.
Mwenge Kahinda, J.- M., Taigbenu, A., Boroto, J., 2007. Domestic rainwater harvesting to improve water supply in rural South Africa. Physics and Chemistry of the Earth, Parts A/B/C 32 (15-18) 1050–1057.
Namibian Statistics Agency, 2012. Namibia Household Income & Expenditure Survey (NHIES) 2009/2010. Winhoek. 229 pp.
O’Connor, G.A., Elliott, H.A., and Bastian, R.K., 2008. Degraded water reuse: An overview. Journal of Environment Quality, 37 (5), S157–S168.
Pachpute, J.S., Tumbo, S.D., Sally, H., Mul, M.L, 2009. Sustainability of rainwater harvesting
systems in rural catchment of sub-Saharan Africa. J. Water Resources Management. 23, 2815–2839.
Pescod, M.B., 1992. Wastewater treatment and use in agriculture. Irrigation and Drainage Paper 47. Food and Agricultural Organization. Rome.
Qadir, R., Sharma, B., Choukr-Allah, R., Karajeh, F., 2007. Non-conventional water resources
and opportunities for water augmentation to achieve food security in water scarce countries. Agricultural Water Management 87 (1) 2–22
Republic of Namibia, 2012 a. Namibia 2011 population and housing census. Windhoek.
25
�
��
Republic of Namibia, 2008 b. Review of Poverty and Inequity in Namibia. Central Bureau of Statistics, Windhoek.
Republic of Namibia, 2008 c. Third National Development Plan 2007–2011: Volume 1. National Planning Commission Namibia. Windhoek.
Republic of Namibia, 2008 d. The Green Scheme: Policy Articulation and Project Implementation – Past, Present and Future? Ministry of Agriculture, Water and Forestry Namibia, Windhoek.
Röhrig, J. 2011. Map of CuveWaters implementation sites. Data source of cartography: NNEP and EEP, MET, 2000. Institute for social-ecological research ISOE. Frankfurt am Main.
Senkondo, E., Msangi, A., Xavery, P., Lazaro, E., Hatibu, N., 2004. Profitability of rainwater harvesting for agricultural production in selected semi-arid areas of Tanzania. Journal of Applied Irrigation Science 39, 65–81.
Scheierling, S., Bartone, C., Mara, D., Drechsel, P., 2010. Improving wastewater use in agriculture: An emerging priority. Policy Research Working Paper 5412. Washington, DC: The World Bank Group.
Sturm, M., Zimmermann, M., Schütz, K., Urban, W., Hartung, H., 2009. Rainwater harvesting as an alternative water resource in rural sites in central northern Namibia. Physics and Chemistry of the Earth, Parts A/B/C 34, 776–785.
United Nations, 2015. Sustainable Development Knowledge Platform. https://sustainabledevelopment.un.org/ (accessed 29/09/2015)
United Nations, 2011. The Millennium Development Goals Report 2011, New York. UN-HABITAT, Government of Madhya Pradesh, 2007. Measures for Ensuring Sustainability of
Rainwater Harvesting. Policy Paper. Nairobi.
UN Water and FAO, 2007. Coping with water scarcity. Challenge of the 21st century. Rome. WHO, 2006. WHO Guidelines for the safe use of wastewater, excreta and greywater: Volume II
Wastewater use in agriculture, Geneva, 222 pp. Woltersdorf, L., Scheidegger, R., Liehr, S., Döll, P., 2016. Municipal water reuse for urban
agriculture in Namibia: Modeling nutrient and salt flows as impacted by sanitation user
behavior. Journal of Environmental Management 169, 272-284. Woltersdorf, L., Liehr, S., Scheidegger, R., Döll, P., 2015. Small-scale water reuse for urban
agriculture in Namibia: Modeling water flows and productivity, Urban Water Journal, 5 (12): 414-429. DOI: http://dx.doi.org/10.1080/1 573062X.2014.938295
Woltersdorf, L., Jokisch, A., Kluge, T., 2014. Benefits of rainwater harvesting for gardening and
implications for future policy in Namibia. Water Policy 16: 124–143. Weidlich, B., 2007. Green Scheme in desperate need of funding. The Namibian 13/03/2007. Werner, W., 2011. Policy Framework for Small-Scale Gardening. CuveWaters Paper 8. Institute
for Social-Ecological Research ISOE. Frankfurt am Main. WWAP (World Water Assessment Programme), 2012. The United Nations World Water
Development Report 4: Managing Water under Uncertainty and Risk. UNESCO, Paris. Zaidi, M.K., 2007. Wastewater reuse-risk assessment, decision-making and environmental
security. Dordrecht: Springer.
26

�
��
Curriculum Vitae
Laura Woltersdorf Born 12. August 1983 in Frankfurt am Main
WORK EXPERIENCE
Oct. 2015 - present
March 2011- Sep. 2015
May 2009 – Feb. 2011
March – July 2008
Aug. 2007 – Feb. 2008
Aug. 2007, July 2007, Nov. 2009
March - June 2007
Oct. 2006 – Feb. 2007
Institute of Physical Geography, Goethe University Frankfurt, GermanyResearch associate: Methods of transdisciplinary knowledge integration
Institute for Social-Ecological Research (ISOE), Frankfurt, Germany Research associate in the projects: - Sustainable water management in Namibia (CuveWaters), sub project
sanitation, wastewater treatment and water reuse Project leader: PD Dr. Thomas Kluge - Sustainable concepts for the municipal water sector (netWORKS 3) Project leader: Dr. Martina Winker
Institute for Social-Ecological Research (ISOE), Frankfurt, Germany Research assistant in the projects: - Biodiversity and Climate Research Centre (BiK-F) - Management Strategies for Hormonally Active Agrochemicals (start2) Team leader: Dr. Alexandra Lux
German Technical Cooperation (GTZ), Tunis, Tunisia Junior in the project “ Efficient Water Resource Management in Tunisia”,
Writing a study on water users associations and other project supporting work
African Development Bank, Tunis, Tunisia /
German Technical Cooperation (GTZ), Tunis, Tunisia- Junior Consult in the GTZ financed project “ Environmental support for projects financed by the African Development Bank in the Maghreb region ”, Research and draft background papers - Junior Consultant in the Sustainable Development Department, project revision and environmental policies, drafting concept notes
- Assistant in the GTZ office, Environmental Report of the GTZ Office Tunis
German Technical Cooperation (GTZ), Yaoundé/ Cameroon, Nouakchott/ Mauritania, Rabat/ Morocco Junior Consult preparing the environmental report of the GTZ Office in
Yaoundé, Nouakchott and Rabat
African Development Bank, Tunis, Tunisia /
German Technical Cooperation (GTZ), Tunis, TunisiaIntern as Assistant in the GTZ financed project “ Environmental support for
projects financed by the African Development Bank in the Maghreb region ”
German-Tunisian Chamber of Industry and Commerce, Tunis, Tunisia Market Consulting Department
27

�
��
Sept. - Dec. 2005
Intern as Assistant, Project work, organising an international conference on environment, research studies on renewable energies
Food and Agricultural Organisation (FAO), Rome, Italy Investment Centre of the Technical Cooperation Intern as Research Assistant Research and writing of research studies with focus on Microfinance, the overall economy and the agricultural sector, building the website of a network of international finance institutions “Eastagri”.
EDUCATION
March2011- Sep. 2015
Oct. 2008 – Dec. 2010
Sep. 2002 – July 2006
Jan. – June 2005
1993 – 2002
1999 – 2000
PhD student at the Institute of Physical Geography, Goethe University Frankfurt, Germany Thesis: “Evaluating alternative water sources and their use for small-holder agriculture from a systemic perspective. A focus on water reuse and rainwater harvesting in Namibia.” Supervisors: Prof. Petra Döll, Dr. Stefan Liehr, Ruth Scheidegger
Master of Science in environmental sciences, Goethe University Frankfurt, Germany Grade average: 1.5. Focus on hydrology, climatology, and social ecology Thesis: “Sustainability of Rainwater Harvesting Systems in the Context of Integrated Water Resource Management and Climate Change. An Example
from the Cuvelai-Etosha Basin, Namibia” Supervisors: Prof. Petra Döll, Dr. Stefan Liehr
Diploma in International Business Administration, FH Wiesbaden, GermanyGrade average: 2.3, Thesis: “Agriculture in the Transition Process of Central Asian Republics with a Particular Emphasis on the Kyrgyz Republic” Supervisor: Prof. Günther Abstein
Institut des Hautes Études Économiques et Commerciales INSEEC, Bordeaux, France Erasmus Semester
Carl - Schurz - Gymnasium in Frankfurt, Germany. Abitur, grade average: 1.4
High School: Solebury School in New Hope, Pennsylvania, USA
28
�
��
2 Papers 2.1 Author contributions The following section describes the contribution of each author to the respective paper.
Paper 1: Woltersdorf, L., Jokisch, A., Kluge, T., 2014. Benefits of rainwater harvesting for gardening and implications for future policy in Namibia. Water Policy 16: 124–143
Contribution of PhD candidate: Laura Woltersdorf generated the results of the cost-benefit
analysis, performed the literature research on the benefits of rainwater
harvesting based gardening and did the calculation for the comparison
to the green scheme project as well as for the financing model and policy
implications. She coordinated the preparation of the article and wrote the
main text parts, except for the ones mentioned below (Chapter 4.3 and
last paragraph of chapter 5.1 by Alexander Jokisch. Chapter 5.2 and 6 in
close cooperation with Thomas Kluge).
Contribution of co-authors: Alexander Jokisch provided the data such as costs, prices and
dimensions of the pilot rainwater harvesting plants and from monitoring
of the plants. He wrote chapter “4.3. First results from monitoring”,
researched the information about the South African policy ‘Financial
Assistance to Resource Poor Irrigation Farmers’ and wrote the last
paragraph of chapter “5.1. Proposed policy implications” on that topic.
Thomas Kluge conceptualized the article, supported with discussions,
provided comments and advice and assisted in writing the chapter “5.2.
Transferability of results” and the “6. conclusions” chapter.
Paper 2: Woltersdorf, L., Liehr, S., Scheidegger, R., Döll, P., 2015. Small-scale water reuse for urban agriculture in Namibia: Modeling water flows and productivity, Urban Water Journal 5 (12): 414-429. DOI: http://dx.doi.org/10.1080/1 573062X.2014.938295
Contribution of PhD candidate: Laura Woltersdorf conceptualized the article, generated the
results, prepared the text of the article and coordinated and integrated
the author’s contributions.
Contribution of co-authors: Ruth Scheidegger provided assistance with the SIMBOX software,
controlled the formulated equations of the mathematical material flow
analysis, helped with discussions about what to analyze, provided
29

�
��
comments to the article and formatted the figures of the mathematical
material flow analysis (Figure 2 and Figure 4).
Stefan Liehr informally supervised the PhD thesis and helped with
discussions about what to analyze, and provided comments to the article.
Petra Döll supervised the PhD thesis and the preparation of the article,
supported with discussions, conceptualization, structuring, provided
comments and advice for modification of the article and supported
improving the language style of the article.
Paper 3: Woltersdorf, L., Scheidegger, R,. Liehr, S., Döll, P., 2016. Municipal water reuse for urban agriculture in Namibia: Modeling nutrient and salt flows as impacted by sanitation user behavior. Journal of Environmental Management 169: 272-284.
Contribution of PhD candidate: Laura Woltersdorf conceptualized the article, generated the
results, prepared the text of the article and coordinated and integrated
the author’s contributions.
Contribution of co-authors: Ruth Scheidegger provided assistance with the SIMBOX software,
controlled the formulated equations of the mathematical material flow
analysis, helped with discussions about what to analyze, provided
comments to the article and formatted the figures of the mathematical
material flow analysis (Figure 2 and Figure 4).
Stefan Liehr informally supervised the PhD thesis and helped with
discussions about what to analyze, and provided comments to the article.
Petra Döll supervised the PhD thesis and the preparation of the article,
supported with discussions, conceptualization, structuring, provided
comments and advice for modification of the article and supported
improving the language style of the article.
Paper 4: Woltersdorf, L., Zimmermann, M., Deffner, J., Gerlach, M., Liehr, S., 2016. Benefits of an integrated water and nutrient reuse system for urban areas in semi-arid developing countries. Submitted to Resources, Conservation and Recycling. Contribution of PhD candidate: Laura Woltersdorf conceptualized the article and prepared the
main text of the article. She organized the generation of results together
with Martin Zimmermann, by integrating the relevant contributing experts
to the various sustainability dimensions. Together with Martin
Zimmermann she jointly determined the indicators and indicator values.
30

�
��
She calculated the results with the online-tool for the AHP calculations,
calculated the sensitivity analysis and generated the tables and figures.
Contribution of co-authors: Martin Zimmermann generated the results of the article together with
Laura Woltersdorf by jointly determining indicators and indicator values.
He supported with discussions and provided comments and input to the
article.
Jutta Deffner provided the data for the societal evaluation of the pilot
plant from results of the social empirical monitoring. She helped with
discussions to develop and evaluate the societal indicators. She also
contributed in writing chapter “4.3 societal sustainability”.
Markus Gerlach helped with discussions to develop and evaluate the
technical indicators. He also reviewed and added passages to the
chapter “3.2.3 Option 2a” and “4.5 Technical sustainability”.
Stefan Liehr set up the evaluation framework consisting of the five
sustainability dimensions, the criteria, indicators and indicator values. He
supervised the application of the framework, supported with discussions
and provided comments to the article.
31

�
��
2.2 Full copies of paper 1 to 4 Paper 1: Woltersdorf et al. 2014 (Water Policy)
Paper 2: Woltersdorf et al. 2015 (Urban Water Journal)
Paper 3: Woltersdorf et al. 2016 (Journal of Environmental Management)
Paper 4: Woltersdorf et al. (submitted to Resources, Conservation and Recycling)
32
Benefits of rainwater harvesting for gardening and implicationsfor future policy in Namibia
L. Woltersdorfa, A. Jokischb and T. KlugeaaInstitute for Social-Ecological Research (ISOE), Hamburger Allee 45, 60486 Frankfurt/Main, Germany
bCorresponding author. Institute for Water Supply and Groundwater Protection, Wastewater Technology, Waste Management,
Industrial Material Cycles, Environmental and Spatial Planning (IWAR), Darmstadt University of Technology,
Franziska-Braun-Str. 7, 64287 Darmstadt, Germany. E-mail: [email protected]
Abstract
Rainwater harvesting to irrigate small-scale gardens enhances food self-sufficiency to overcome rural poverty.So far rainwater harvesting is not encouraged by the Namibian National Water Supply and Sanitation Policy norsupported financially by the Namibian government. This study proposes two rainwater harvesting facilities to irri-gate gardens; one collects rain from household roofs with tank storage, the second collects rain on a pond roof withpond storage. The aim of this paper is to assess the benefits of rainwater harvesting-based gardening and to pro-pose policy and financing implications for the Namibian government. We investigate the benefits of rainwaterharvesting through a literature review, a cost–benefit analysis, monitoring of project pilot plants and a comparisonwith the existing irrigation and drinking water infrastructure. The results indicate that rainwater harvesting offersnumerous benefits in technological, economic, environmental and social terms. The facilities have a positive netpresent value under favourable circumstances. However, material investment costs pose a financing problem. Werecommend that government fund the rainwater harvesting infrastructure and finance privately garden and oper-ation and maintenance costs. Integrating these aspects into a national rainwater harvesting policy would createthe conditions to achieve the benefits of an up-scale of rainwater harvesting based gardening in Namibia.
Keywords: Benefits; Central-northern Namibia; Cost–benefit analysis; Financing; Gardening; RainwaterHarvesting; Roof and ground catchments; Water policy; Water supply
1. Introduction
Rainwater harvesting for the irrigation of household gardens buffers the dry season and droughts (vanSteenbergen & Tuinhof, 2009). Rainwater harvesting consists of a wide range of technologies that canbe divided into in situ and ex situ techniques to collect and store water (Barron, 2009). In situ rainwaterharvesting are soil management strategies that enhance rainfall infiltration and reduce surface runoff,
Water Policy 16 (2014) 124–143
doi: 10.2166/wp.2013.061
© IWA Publishing 2014
33
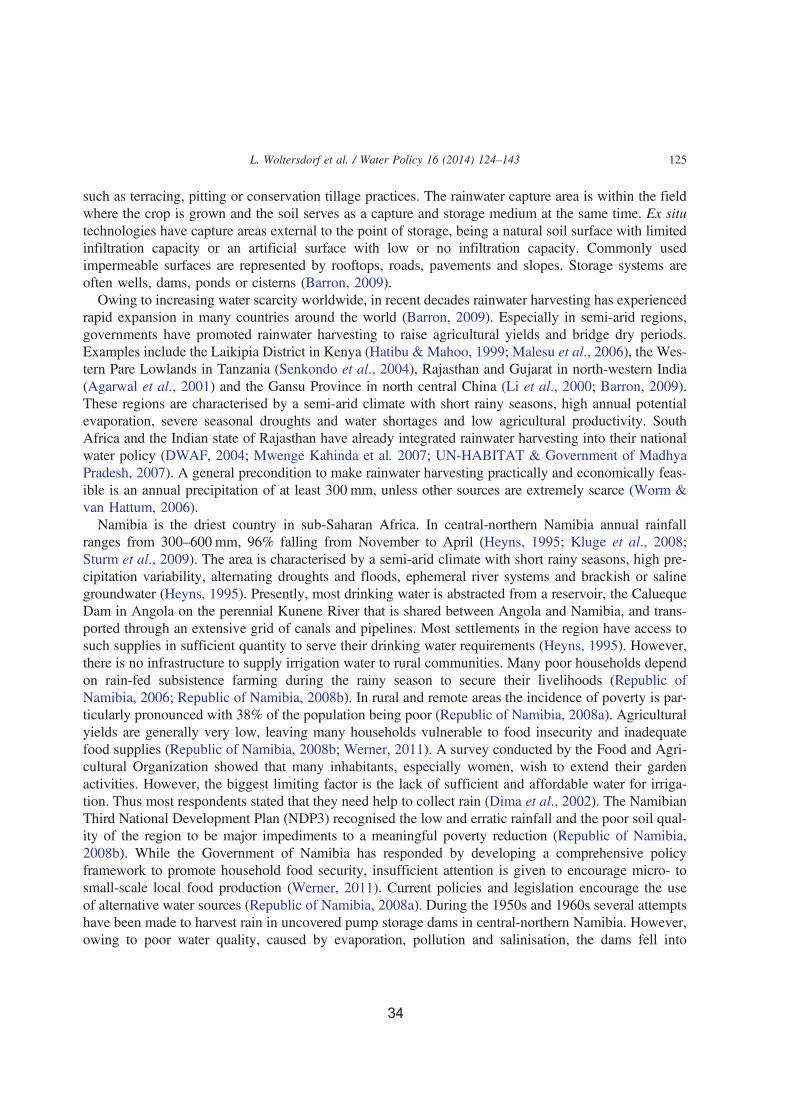
such as terracing, pitting or conservation tillage practices. The rainwater capture area is within the fieldwhere the crop is grown and the soil serves as a capture and storage medium at the same time. Ex situtechnologies have capture areas external to the point of storage, being a natural soil surface with limitedinfiltration capacity or an artificial surface with low or no infiltration capacity. Commonly usedimpermeable surfaces are represented by rooftops, roads, pavements and slopes. Storage systems areoften wells, dams, ponds or cisterns (Barron, 2009).
Owing to increasing water scarcity worldwide, in recent decades rainwater harvesting has experiencedrapid expansion in many countries around the world (Barron, 2009). Especially in semi-arid regions,governments have promoted rainwater harvesting to raise agricultural yields and bridge dry periods.Examples include the Laikipia District in Kenya (Hatibu & Mahoo, 1999; Malesu et al., 2006), the Wes-tern Pare Lowlands in Tanzania (Senkondo et al., 2004), Rajasthan and Gujarat in north-western India(Agarwal et al., 2001) and the Gansu Province in north central China (Li et al., 2000; Barron, 2009).These regions are characterised by a semi-arid climate with short rainy seasons, high annual potentialevaporation, severe seasonal droughts and water shortages and low agricultural productivity. SouthAfrica and the Indian state of Rajasthan have already integrated rainwater harvesting into their nationalwater policy (DWAF, 2004; Mwenge Kahinda et al. 2007; UN-HABITAT & Government of MadhyaPradesh, 2007). A general precondition to make rainwater harvesting practically and economically feas-ible is an annual precipitation of at least 300 mm, unless other sources are extremely scarce (Worm &van Hattum, 2006).
Namibia is the driest country in sub-Saharan Africa. In central-northern Namibia annual rainfallranges from 300–600 mm, 96% falling from November to April (Heyns, 1995; Kluge et al., 2008;Sturm et al., 2009). The area is characterised by a semi-arid climate with short rainy seasons, high pre-cipitation variability, alternating droughts and floods, ephemeral river systems and brackish or salinegroundwater (Heyns, 1995). Presently, most drinking water is abstracted from a reservoir, the CaluequeDam in Angola on the perennial Kunene River that is shared between Angola and Namibia, and trans-ported through an extensive grid of canals and pipelines. Most settlements in the region have access tosuch supplies in sufficient quantity to serve their drinking water requirements (Heyns, 1995). However,there is no infrastructure to supply irrigation water to rural communities. Many poor households dependon rain-fed subsistence farming during the rainy season to secure their livelihoods (Republic ofNamibia, 2006; Republic of Namibia, 2008b). In rural and remote areas the incidence of poverty is par-ticularly pronounced with 38% of the population being poor (Republic of Namibia, 2008a). Agriculturalyields are generally very low, leaving many households vulnerable to food insecurity and inadequatefood supplies (Republic of Namibia, 2008b; Werner, 2011). A survey conducted by the Food and Agri-cultural Organization showed that many inhabitants, especially women, wish to extend their gardenactivities. However, the biggest limiting factor is the lack of sufficient and affordable water for irriga-tion. Thus most respondents stated that they need help to collect rain (Dima et al., 2002). The NamibianThird National Development Plan (NDP3) recognised the low and erratic rainfall and the poor soil qual-ity of the region to be major impediments to a meaningful poverty reduction (Republic of Namibia,2008b). While the Government of Namibia has responded by developing a comprehensive policyframework to promote household food security, insufficient attention is given to encourage micro- tosmall-scale local food production (Werner, 2011). Current policies and legislation encourage the useof alternative water sources (Republic of Namibia, 2008a). During the 1950s and 1960s several attemptshave been made to harvest rain in uncovered pump storage dams in central-northern Namibia. However,owing to poor water quality, caused by evaporation, pollution and salinisation, the dams fell into
L. Woltersdorf et al. / Water Policy 16 (2014) 124–143 125
34

disrepair (Driessen & Jokisch, 2010). New investments in more appropriate rainwater harvesting infra-structure could have a broad range of benefits and give essential impetus for the regional economy andpoverty reduction. However, in spite of its potential in Namibia, rainwater harvesting has so far not beenconsidered in the current National Water Supply and Sanitation Policy (Republic of Namibia, 2008c)nor in the latest Water Act (Republic of Namibia, 2004).
The aim of this study is to assess the benefits of rainwater harvesting in irrigating small-scale gardensand to propose policy and financing implications for Namibia. In addition, the goal was to draw possiblegeneralisations and broader implications for other regions. The study summarises the benefits identifiedin previous studies and presents research results of a cost–benefit analysis and first monitoring results forthe most promising pilot rainwater harvesting facilities. The amount of investment and number of cre-ated jobs related to an up-scaling of rainwater harvesting is modelled and considered in relation toexisting Namibian investment in irrigation and drinking water supply. Financing problems are revealedand a financing concept and policy implications are proposed to up-scale the technology in Namibia.
2. Pilot rainwater harvesting facilities in central-northern Namibia
The project CuveWaters1 introduced three different options for ex-situ rainwater harvesting in central-northern Namibia. The pilot plants were built in the villages Epyeshona and Iipopo in the Oshana regionand were conceived based on a preliminary literature research (Gould & Nissen-Petersen, 2006), a par-ticipatory demand-responsive approach with local communities (Deffner & Mazambani, 2010; Deffneret al., 2012; Zimmermann et al., 2012) and consultations with Namibian ministries and the NamibianDesert Research Foundation. During this process the pilot plants were adjusted to local needs andwishes in terms of size, combinations and materials. The three introduced facilities differ in terms ofharvesting surface and storage media; the first consists of a corrugated iron roof (100 m2) and a tank(30 m3) either made of ferrocement, bricks or polyethylene. Such tanks can be used for single house-holds and public buildings (schools, clinics, etc.) and are sufficient to irrigate up to 90 m2 ofcultivated garden area. A second pilot facility collects rainwater from a concrete ground catchment(480 m2) and a greenhouse roof (160 m2) and stores the water in a covered underground ferrocementtank (120 m3) and a covered and sealed pond (80 m3). The stored water irrigates an outside garden(900 m2) and a greenhouse (160 m2) jointly used by six households. A third pilot facility collects rain-water from nearby ephemeral rivers, so-called Oshanas, at the height of the rainy season and stores thewater in a covered ferrocement underground tank and a pond with a combined storage capacity of400 m3. The stored water is sufficient to irrigate a 1,000 m2 outdoor garden area and a greenhouse of176 m2, which are jointly managed by ten households. The Oshanas are difficult to use for permanentirrigation owing to high evaporation rates and therefore quick quality degradation and thus salinisationof the water.
This study assesses the two most promising rainwater harvesting facilities based on a preliminaryassessment of the pilot plants (Jokisch et al., 2011). The first is the ferrocement tank with roof catch-ment at household level as piloted in Epyeshona village (Figure 1). The second is the pond with roofcatchment at community level which is an optimal combination of piloted facilities in Epyeshonabased on project experience and costs (Figure 2; Table 1). The possible duration of irrigation of gardens
1 http://www.cuvewaters.net.
L. Woltersdorf et al. / Water Policy 16 (2014) 124–143126
35

with harvested rainwater depends on the irrigation technique, cropping pattern, garden area and theextent of the rainy season. Considering these factors, the stored water is sufficient for the irrigationof one or two additional annual growth seasons. In the project region, rainwater harvesting is meantto enhance the water supply for the productive irrigation of small-scale gardens and not to serve as asubstitute for drinking water. However, in remote areas far from the existing pipeline grid harvestedrainwater could also be treated and serve as drinking water.
3. Methodology
3.1. Benefits of rainwater harvesting for gardening
The benefits of rainwater harvesting were assessed through a literature review and categorised in tech-nological, economic, environmental and social terms. In this section, non-market benefits were listed in
Fig. 2. Rainwater harvesting with roof catchment and pond at community level.
Table 1. Proposed rainwater harvesting options in central-northern Namibia.
Rainwater harvesting optionTankmaterial
Catchmentmaterial
Catchment area(m2)
Storage volume(m3)
Tank with roof catchment household level Ferrocement Corrugated iron 100 30Pond with roof catchment communitylevel
Dam liner Corrugated iron 285 80
Fig. 1. Rainwater harvesting with roof catchment and ferrocement tank at household level.
L. Woltersdorf et al. / Water Policy 16 (2014) 124–143 127
36

a qualitative manner since placing monetary values on environmental and social non-market costs andbenefits is extremely difficult, controversial and not always meaningful (Atkinson & Mourato, 2008).
3.2. Financial cost–benefit analysis
In this section, we assessed the financial benefits of rainwater harvesting-based gardening in monet-ary terms. We carried out a financial cost–benefit analysis by identifying monetary costs and benefits ofrainwater harvesting and gardening for a household or micro-entrepreneur. A cost–benefit analysisinvolves the identification of costs and benefits occurring over the economic life of a project (Gilpin,2000; Pearce et al., 2006; Ward, 2012). The common method of reducing costs and benefits over thelifespan of a facility to a unique value is the net present value (NPV) method (LAWA, 2005; Pearceet al., 2006). Key steps are first to identify the costs and benefits of a project, second to quantifycosts and benefits in monetary terms as far as possible and third to discount costs and benefits overthe lifetime of the project with a selected discount rate. In purely economic terms, the production ofa good is economically justified when the total benefits exceed the total costs (Gilpin, 2000). Benefitscorrespond to the value of gardening produce at market prices, while costs are equal to expenses. Amedium discount rate of 5% was used over an estimated life span of 40 years for the ferrocementtank and 20 years for the pond. These values are based on experiences made by the responsibleKenyan rainwater harvesting consulting company ‘One World Consultants’ (Kariuki, 2012, personalcommunication) which has constructed more than 100 rainwater harvesting tanks and ponds in severalcountries in eastern and southern Africa. The NPV has been calculated as Equation (1) (LAWA, 2005):
NPV ¼ �I0 þXTt¼1
Rt†(1þ i)�t (1)
where NPV¼ net present value, I¼ investment, t¼ time period from 0 to T, Rt¼ inflow-outflow inperiod t, T¼ time horizon (life span), and i¼ discount factor. The costs of a rainwater harvestingand gardening facility include material investment costs, labour construction costs and operation andmaintenance costs. Material costs include the tank, the pipes and gutters for the roof, the gardenfences and the drip irrigation system, Operation and maintenance costs include annual materials costsfor spare parts, seeds, fertilizer and pesticides. In a first step, we conducted a cost–benefit analysisincluding all these costs. In a second step, to show the potential for a more positive cost–benefitratio, we included only labour, garden material, operation and maintenance costs and excluded thematerial costs for the rainwater harvesting facility. We calculated with material costs that occurredduring the pilot construction phase, operation and maintenance costs were estimated based on localcosts and first project experience during the pilot phase. Additionally, we estimated material costs with-out the conditions of the project.
Financial benefits, the revenue from gardening products at market prices, were modelled based oncrop yields, local irrigation requirements, garden area and local market prices. Crop yields weretaken as indicated by Price Waterhouse Coopers (2005). Possible garden areas to irrigate with the har-vested rainwater were calculated with modelled local irrigation requirements. Specific crop waterrequirements were calculated with local climate data using the Food and Agricultural Organisation(FAO) software CROPWAT 8.0 (FAO, 1992). A drip irrigation system efficiency of 0.75 was used
L. Woltersdorf et al. / Water Policy 16 (2014) 124–143128
37

assuming a conveyance efficiency of 0.85 and an application efficiency of 0.9, calculated according toBrouwer et al. (1989) In a preliminary assessment four garden variants considering the amount ofannual harvested rainwater were modelled (Woltersdorf et al., 2013). The garden size was fitted sothat the rainwater harvesting facilities are sufficient for full irrigation with a frequency of 3 out of 4years, a probability level recommended as appropriate by the FAO (Savva & Frenken, 2002). Thisstudy presents a subsistence and a market garden variant. The market scenario contains tomatoes plantedin the pilot village Epyeshona, modelled assuming one annual growth cycle with a market price mon-itored in the market of Epyeshona in 2011. The subsistence garden variant contains vegetables and fruitssuitable for household consumption; the surplus can be sold at local markets, planted for two annualgrowth cycles (Woltersdorf, 2010). Owing to the lack of local market prices, prices were assumed asindicated by Price Waterhouse Coopers (2005) which presents wholesale market prices for importedhorticulture products from January to December 2003 to Namibia in N$ per ton. The follow-upstudy from Price Waterhouse Coopers in 2008 (Price Waterhouse Coopers, 2008) was not used toowing to the unavailability of all data needed. In addition, the CuveWaters Project monitors localprices, which are, however, inconsistent so far owing to the lack of experience of the rainwater harvest-ing tank owners. In both garden variants yields and revenues are determined to be achieved in 3 out of 4years, when the garden area can be fully irrigated. In 1 out of 4 years, owing to natural precipitationvariability, precipitation is lower and not sufficient to irrigate the garden area fully and thereforeyields and revenues will be lower; this is not presented in this study. Further detail regarding gardenvariants, precipitation probability analysis and calculation of irrigation requirements exceeds thescope of this paper and is provided by Woltersdorf et al. (2013).
3.3. Monitoring pilot plants
The rainwater harvesting pilot plants were monitored in terms of maintenance effort and costs, wateruse and gardening input and output among other criteria. Most data were monitored by tank owners,while some data were also monitored by project team members. This paper presents the first monitoringresults from the pilot village Epyeshona of yields of harvested vegetables and local market pricesachieved in 2011. Monitored market prices were compared to market prices used in this study forthe cost–benefit analysis indicated by Price Waterhouse Coopers (2005).
3.4. Comparison of rainwater harvesting facilities to the Namibian green scheme project
The Namibian government plans to implement an ambitious agricultural project known as the greenscheme project (Republic of Namibia, 2008d). In order to put our proposed rainwater harvesting andgardening infrastructure in the light of the local situation, rainwater harvesting and associated gardenfacilities were compared to the envisaged Namibian green scheme project. The emphasis is to estimatean order of magnitude and to put these different infrastructures in relation to each other rather than cal-culating accurate absolute numbers. Information about the green scheme was taken from the literature(Weidlich, 2007; Republic of Namibia, 2008d). Over the next 15 years the green scheme plans to create11,750 full time equivalent jobs. This study calculated how many rainwater harvesting facilities and gar-dens would need to be constructed to create the same number of 11,750 jobs. Then the green schemeand the rainwater harvesting and garden facilities were compared in terms of required investment andinvestment per job. For comparability, only investment costs of labour and material were included
L. Woltersdorf et al. / Water Policy 16 (2014) 124–143 129
38

over a time span of 15 years. Assumptions and estimations are based on the pilot construction phase ofthe CuveWaters project. The same market and subsistence planting schemes as designed for gardensirrigated with harvested rainwater were transferred to the envisaged area of the green scheme. Owingto the lack of further data about the green scheme, such as operation and maintenance costs, a NPVcalculation was not possible.
3.5. Financing of rainwater harvesting facilities
Financing rainwater harvesting and garden infrastructure is the determining criterion for an up-scaleof the technology. These costs were related to the household income in central-northern Namibia inorder to determine the possibility of financing these infrastructures. We evaluated the possibility offinancing rainwater harvesting facilities with microcredits and proposed financing possibilities.
4. Results
4.1. Benefits of rainwater harvesting for gardening
Rainwater harvesting for gardening offers numerous benefits to local communities in technological,environmental, social and economic terms (Table 2). While rainwater harvesting-based gardeningbroadly effects and stimulated the regional economy, livelihood benefits extend far beyond materialgain. Therefore the technology has the potential to become an important part of Namibia’s waterinfrastructure.
During the construction of the pilot tanks, a team of tank technicians, known in the region as the‘Blue Team’, have been enabled to build new tanks and operate and maintain existing tanks, planbudgets, calculate costs and procure construction materials. The technicians proved their skills in con-structing a privately financed tank in the absence of the CuveWaters staff. Tank users were trained inproper tank operation and maintenance, gardening and irrigation techniques. Trained technicians,tank users and farmers were highly committed owing to community involvement from the very begin-ning. The pilot rainwater harvesting facility soon became locally known as the ‘Epyeshona GreenVillage’ and represents a local success story receiving considerable attention from the media andpeople from surrounding villages.
Nevertheless the implementation of small-scale water infrastructure is associated with certain risksand challenges. In rural parts of Namibia, like in most other parts of rural Africa, the low level of edu-cation makes it extremely difficult to implement the necessary structures to run gardening ventures thataim to supply markets in the region. Training and education is also essential to counter the lack ofknowledge of horticultural production in the region. An additional challenge for planning gardensirrigated with rainwater harvesting is the high rainfall variability in the region (UNEP, 2006).
4.2. Financial cost–benefit analysis
4.2.1. Cost. The costs of pilot rainwater harvesting facilities and estimated costs without project con-ditions are shown in Table 3.
L. Woltersdorf et al. / Water Policy 16 (2014) 124–143130
39

Table 2. Benefits of rainwater harvesting.
Area Benefits of rainwater harvesting and gardening Source
Technology • Maintenance is easy, therefore the technology isalso appropriate for remote rural areas
• Local water resources are used instead of inter-basinwater transfer
Li et al. (2000)
Economy • Broad spill-over effects for the regional economy(e.g. knowledge extension for rainwater harvestingand gardening)
• Job creation and income generation in poor ruraland peri-urban communities through
• Tank and garden construction, maintenance• Local market sale of crops• Education of tank builders, gardeners, etc. improvesown (career) prospective for future life
• Productive use of rainwater• Higher crop yields• Extended annual planting season of crops throughirrigation into the dry season
• Possible to plant crops with a longer growth periodand higher water requirements (i.e. tomatoes,cabbages)
• Additional annual harvest during the dry seasonachieves higher revenues
Agarwal et al. (2001); Senkondo et al. (2004); Yuanet al. (2003); Rockström et al. (2002)
Environment • Adaptation strategy to climate change and climaticvariability
• Effective use of heavy rainfall events• Bridge the dry season• Higher crop growth security by bridging rainfallvariations and dry periods during the rainy season
• Provides additional water supply reducing pressureand demand on surrounding surface water
• Contributes to the regeneration of landscapes byincreasing biomass for food, fodder, fibre and woodfor human consumption
Pandey et al. (2003); Barron (2009); Rockströmet al. (2002); UNEP (2006); Ngigi et al. (2007);Jianbing et al. (2010); van Steenbergen & Tuinhof(2009); Barron (2009); Li et al. (2000); Machiwalet al. (2004); Barron (2009)
Social • Improved food-security and availability particularlyduring the dry season
• Increased household and community self-sufficiency• Improvement of living conditions for vulnerable ormarginalised groups through a better diet and thepossibility to engage in a productive activity
• Time saved for productive activities throughavailability of water near the house
• Improvement of children’s education and healthconditions due to additional income
• Enables communities to adapt to droughts anddeclining availability of drinking water
• Creation of knowledge and capacity building
Wakefield et al. (2007); Wills et al. (2010);Swanwick (2009); van Averbeke (2007)
L. Woltersdorf et al. / Water Policy 16 (2014) 124–143 131
40

The major cost component of a rainwater harvesting and garden facility are the material costs of therainwater harvesting facility. The market garden contains a shade net, while the subsistence garden doesnot, as it contains fruit trees for shade. Costs for garden material and operation and maintenance costsare relatively low, for example because only pedal pumps are used for pumping the stored water into theirrigation system. It has to be considered that during the pilot construction phase material costs wereextraordinary high, as the project was forced to build during a specific and limited timeframe beforeholidays and during the rainy season. During this period market prices are higher and, because Oshanaswere flooded, the sand had to be purchased. Therefore prices are not transferable to ‘without project’conditions and costs are expected to decrease down to an estimated 12,000 N$ for the ferrocementtank and 35,000 N$ for the pond if construction takes place at a greater scale without project conditions(i.e. built by locals in the dry season with optimised material use). In addition, government bulk pur-chase of important raw materials such as wood, steel and cement might drop current monopolyprices considerably.
4.2.2. Benefit. The ferrocement tank achieves annual revenues from gardening of 5,053 N$ (457 €)(337 kg tomatoes) in the market garden variant and 1,143 N$ (103 €) (548 kg of fruit and vegetable)in the subsistence garden variant (Table 4). The pond achieves annual revenues from gardening of
Table 3. Costs of rainwater harvesting and gardening facilities in central-northern Namibia.
Type of facility Material (N$)a
Labourconstruction(N$)b
Operation andmaintenance per year(N$/yr)
Ferrocementtank (30 m3)
School (under specificproject conditions)
13,592 Ferrocement, gutters,pipes
5,500 100
Household (underspecific projectconditions)
18,571
Without specific projectconditions, estimateddown (see below)
12,000
Garden Market: 1 crop cycle/yr(52 m2)
2,572 Fence, drip irrigation,pedal pump, tools,(shade net)
none 200 (material) 560 (seeds,pesticides, fertilizer)
Subsistence: 2 cropcycles/yr (84 m2)
3,320 200 (material) 100 (seeds,pesticides)c
Pond (80 m3) Community 48,766 Timber, dam liner,Corrugated ironsheet, gutters, pipes
8,100 155Estimated down 35,000
Garden Market: 1 crop cycle/yr(229 m2)
6,615 Fence, drip irrigation,pedal pump, tools,(shade net)
none 400 (material)1,550 (seeds,pesticides, fertilizer)
Subsistence: 2 cropcycles/yr (148 m2)
4,808 400 (material) 300 (seeds,pesticides,***)
aCurrency exchange rate: 1 N$¼ € 0.07625 (oanda.com, on 17 September 2013).bLabour costs are calculated with Namibian union labour tariffs of 100 N$/day.cSubsistence farmers are assumed to use goat manure as fertilizer.
L. Woltersdorf et al. / Water Policy 16 (2014) 124–143132
41

Table 4. Revenues per year of gardening products from rainwater harvesting with different garden variants.
Crop typePlantingdatea
Harvestingdatea
Cultivatedarea (m2)
Local yield perareab(kg/m2)
Priceb
(N$/kg)Gross irrigationrequirementa (m)
Production(kg)
Revenue(N$)
Ferrocement household tank (30 m3) with roof catchment (100 m2)Subsistence
(worst case)Watermelon
1 Jan 21 Mar 17 5.0 1.07 5.0 86 91
Cucumber 1 Jul 13 Oct 17 4.0 5.47 10.1 68 372Cabbage 1 Jan 14 Jun 17 3.1 0.96 12.9 53 51Pepper 1 Dec 30 Mar 17 1.4 6.13 10.8 24 146Tomato 15 Apr 2 Sep 17 4.0 2.91 13.8 68 198Potato 1 Apr 24 Jul 17 5.2 1.54 8.6 88 136Oranged 1 Jan 31 Dec 1 23.0 0.92 25.5 161 149Sum/year 52 86.7 548 1,143
Market (bestcase)
Tomatoes 1 Jan 4 Jun 84 4.0 15.0c 63.9 337 5,053
Pond (80 m3) with roof catchment (200 m2)Subsistence
(worst case)Watermelon
1 Jan 21 Mar 48.2 5.0 1.07 14.1 243 259
Cucumber 1 Jul 13 Oct 48.2 4.0 5.47 28.5 193 1,055Cabbage 1 Jan 14 Jun 48.2 3.1 0.96 36.5 151 145Pepper 1 Dec 30 Mar 48.2 1.4 6.13 30.6 67 413Tomato 15 Apr 2 Sep 48.2 4.0 2.91 39.2 193 562Potato 1 Apr 24 Jul 48.2 5.2 1.54 24.4 249 385Oranged 1 Jan 31 Dec 3 23.0 0.92 1.5 345 318Sum/year 146 174.9 1,442 3,138
Market (bestcase)
Tomatoes 1 Jan 4 Jun 229 4.0 15.0c 174.1 918 13,774
aThe planting and harvesting date has been determined based on Savva & Frenken (2002) with the growth season coinciding with the rainy season. Thegross irrigation requirement has been calculated with Cropwat 8.0 based on local climate data from Ondangwa station; data: Namibian Weather Bureau andcrop data for semi-arid regions Savva & Frenken (2002). The area is fitted with probability of tank failure determined to occur in 3 out of 4 years(Woltersdorf et al., 2013).bData: Price Waterhouse Coopers (2005).cData: project monitoring of market price in Epyeshona village in 2010.dThe orange fruit tree is assumed to occupy 1 m2 on the ground and 6 m2 at the treetop.
L.Woltersdorf
etal.
/Water
Policy
16(2014)
124–143
133
42

13,774 N$ (1,247 €) (918 kg tomatoes) in the market garden variant and 3,138 N$ (284 €) (1,442 kg offruit and vegetable) in the subsistence garden variant.
4.2.3. Cost–benefit. The NPV of both rainwater harvesting facilities is negative when assuming sub-sistence garden production and integrating the material costs of the rainwater harvesting facility(Table 5). Assuming a market garden production, both facilities have a positive NPV: the ferrocementtank of þ46,943 N$ (4,248 €) and the pond of þ95,711 N$ (8,662 €). Subsistence garden productioncan also have a positive NPV when excluding the material costs of the rainwater harvesting facility,while still including labour costs for rainwater harvesting facility construction, operation and mainten-ance (O&M) costs and garden material costs. In this case, the ferrocement tank has a NPV of þ6,997 N$(633 €) and the pond of þ25,578 N$ (2,315 €). Further research results for the CuveWaters projectclearly show that in remote villages of central-northern Namibia (e.g. more than 65 km distance fromthe pipeline scheme) the construction of an adequate number of rainwater harvesting tanks can be con-siderably cheaper than a connection to the pipeline scheme (Jokisch et al., 2011).
4.3. First results from monitoring
Pilot rainwater harvesting tanks and gardens were built in the village of Epyeshona in 2010; a drip irri-gation infrastructure was added in 2011. The first harvest in 2010 included butternut, spinach and differentvarieties of pepper. Gardening products served household consumption and achieved good prices on localmarkets contributing to household income generation. Since February 2011, the farmers monitor theamount of harvest, income, amount of fertilizers and pesticides applied on the fields. The most popularcrop so far is spinach, mainly because it can cope well with the poor soil conditions and grows fast. In2012, individual household farmers earned up to 900 N$ per month from the sale of spinach. In the green-house, tomatoes performed best, as they can be harvested over a long period and generate the highestincome. On local markets these tomatoes achieved a mean price of 13 N$/kg compared to 2.91 N$/kg indi-cated by Price Waterhouse Coopers (2005). In 2012 the farmers focused mainly on spinach and tomatoesbased on their experiences in 2011 and stabilised their income from the individual gardens at around900 N$ per month from the sale of spinach and tomatoes, but in parallel also produced certain othercrops for their own consumption thus improving their own diet and health situation. Furthermore thedaily water use decreased as a consequence of more experience and knowledge gained in 2011. So far
Table 5. Cost–benefit analysis of two rainwater harvesting options in combination with gardening assuming best case costs(estimated in case of large-scale production), with discount rate of 5%.
NPV (N$)
Rainwater harvestingoption Garden variant
Including: material investmentcosts, labour construction costs,O&M costs
Including: labour construction costs,O&M costs, excluding: materialinvestment cost
Ferrocement tank(30 m3), lifespan 40years
Subsistence (52 m2)Market (84 m2)
�10,503 þ46,943 þ6,997 þ64,443
Pond (80 m3), lifespan20 years
Subsistence (146 m2)Market (229 m2)
�17,521 þ95,711 þ25,579 þ138,811
L. Woltersdorf et al. / Water Policy 16 (2014) 124–143134
43

monitoring shows that revenues used in the worst case garden variant are (partly) underestimated, as realincome is considerably higher than expected. This is mainly due to higher prices on local markets incentral-northern Namibia compared to wholesale prices in the capital Windhoek, used in the Price Water-house Coopers (2005) study. Nonetheless, observed water use was higher than calculated and fluctuatedconsiderably over the course of the season, mainly owing to the little experience of the users.
4.4. Comparison of rainwater harvesting facilities to existing water and irrigation infrastructure inNamibia
In 2003 the Namibian government adopted its green scheme policy through the Ministry of Agricul-ture, Water and Forestry (MAWF). The green scheme’s objectives are to increase commerciallarge-scale irrigated crop production, import substitution, self-sufficiency, food security at nationaland household level and create jobs (Weidlich, 2007; MAWF, 2008; Republic of Namibia, 2008d).The scheme aims to put an area of approximately 27,000 hectares under irrigation over a period of15 years (Republic of Namibia, 2008d; Allgemeine Zeitung Namibia, 2011). Irrigated crops includemaize, wheat, pearl millet (mahangu) and vegetables mainly along perennial rivers at Namibia’s borders(Weidlich, 2007). For project realisation, over the next 15 years the Namibian government aims to invest3,311 million N$ and 7,430 million N$ are expected to be contributed by the private sector (Weidlich,2007; Allgemeine Zeitung Namibia, 2007). According to government estimates the green scheme couldcreate 10,000 permanent and 3,500 seasonal jobs. However funding is a permanent constraint and themajor reason for slow progress (Weidlich, 2007). In 2007, Namibia had 9,000 ha under irrigation,including 3,000 ha under the green scheme (Weidlich, 2007). Table 6 puts the proposed rainwater har-vesting technology in relation to the Namibian green scheme in terms of total investment, created jobs,irrigated area, estimated value of garden produce and investment per job.
We estimated the amount of rainwater harvesting facilities and gardens that can be constructed andcultivated when creating the same number of 11,750 full time equivalent jobs as planned under the
Table 6. Comparison of gardening with rainwater harvesting and the Namibian green scheme (over 15 years’ investment),assuming the creation of 11,750 full-time equivalent jobs per technology option.
Green schemeFerrocement rainwaterharvesting tank Rainwater harvesting pond
Amount of RWH facilities andgardens that can be constructed,creating circa 13,500 jobs over 15years
– 21,875 22,500
Total investment (million N$) 10,741 million N$ 747 million N$ (626 millionN$ material costs, 120million N$ labour costs)
1,119 million. N$ (936million N$ material costs,182 million. N$ labourcosts)
Irrigated area (ha) 27,000 ha 114 to 184 ha 328 to 515 haEstimated value of horticultureproduce assuming same cropschemes (million N$/year)
3,150 million N$to 5,264million. N$
25 million N$ to 111 millionN$
71 million N$ to 310 millionN$
Investment per job (N$/job) 914,145 N$/job 63,775 N$/job 95,312 N$/job
L. Woltersdorf et al. / Water Policy 16 (2014) 124–143 135
44

green scheme. We estimated that the construction of one ferrocement tank requires a team of one skilledand ten unskilled workers and takes 12 days. Calculating with 250 annual working days it finds that 770tank builders (70 teams) can construct 21,875 ferrocement rainwater harvesting tanks over a time span of15 years. A further 10,938 jobs are created in the gardening sector, assuming that workload and incomefrom the gardening with the water from one ferrocement tank is equivalent to one half day job. Whencreating 11,736 new jobs, 22,500 ponds and gardens can be constructed and cultivated. For this, 486pond builders (54 teams) with one skilled and eight unskilled workers per team take nine days to con-struct 1 pond, resulting in 1,500 ponds per year and 22,500 ponds over a period of 15 years. Further11,250 jobs are created to cultivate gardens, assuming that the workload and income from the gardeningwith the water from one pond is equivalent to a half day job.
The construction of 21,875 ferrocement rainwater harvesting tanks requires an investment of 747million N$ resulting in an investment per job of 63,775 N$. The construction of 22,500 rainwater har-vesting ponds requires an investment of 1,119 million N$, resulting in an investment per job of95,312 N$. The income generated with this number of rainwater harvesting tanks and gardens throughthe sale of horticulture products is 25–111 million N$ per year. These ponds and gardens generate anannual income of 71–310 million N$ (subsistence and market garden variant, respectively). In contrast,the green scheme is expected to require a considerably higher investment of 10,741 Mio N$ creating thesame number of jobs but requiring a significantly higher investment per job of 914,145 N$. Assumingthe same crop schemes for the green scheme would result in an annually generated income of 3,150–5,264 million N$. However it has to be considered that in reality the green scheme is also producingmaize and wheat so that the generated income will be considerably lower than estimated here.
In central-northern Namibia, investment costs for water infrastructure are extraordinary high, owing tothe large water supply network (Heyns, 1995). In central-northern Namibia the sales price of grid wateris currently around 8.3 N$/m3, but this price is heavily subsidised. In contrast, we estimate that the fullcost recovery price including infrastructure investment costs is between 10 and 15 N$/m3. In comparisonto this, the full cost recovery price of our proposed rainwater harvesting infrastructure (ferrocement rain-water harvesting tank) is 15 N$/m3. Therefore, the costs per square meter of harvested rainwater are nothigher than the cost of grid water.
4.5. Financing of rainwater harvesting facilities
Private financing of initial investment costs represents a problem for most micro-entrepreneurs and isthe major limiting factor for the up-scaling of rainwater harvesting. Average annual household income incentral-northern Namibia ranges from 26,788 N$ in the Oshikoto region to 45,708 N$ in the Oshanaregion (Republic of Namibia, 2006). In relation to this income level, tanks and gardens have high invest-ment costs, while the maintenance costs of rainwater harvesting facilities are very low. Therefore, wepropose other sources to finance infrastructure material investment costs.
The results of this study indicate that microcredits are not suitable to finance material costs of rain-water harvesting facilities. On the one hand, traditional microcredit loans are usually too small with tooshort repayment periods (up to 2 years) and are not compatible with the necessary medium- to long-terminvestment of over 6 years for investment sums of over 12,000 N$. On the other hand repayments forannual interest rates (currently 24–35% p.a. in Namibia) (Chitambo et al., 2006) exceed annual gardenrevenues of the subsistence garden. However, if only garden construction costs have to be financedthrough a microcredit, the credit can be easily repaid within a reasonable time. For instance, a
L. Woltersdorf et al. / Water Policy 16 (2014) 124–143136
45
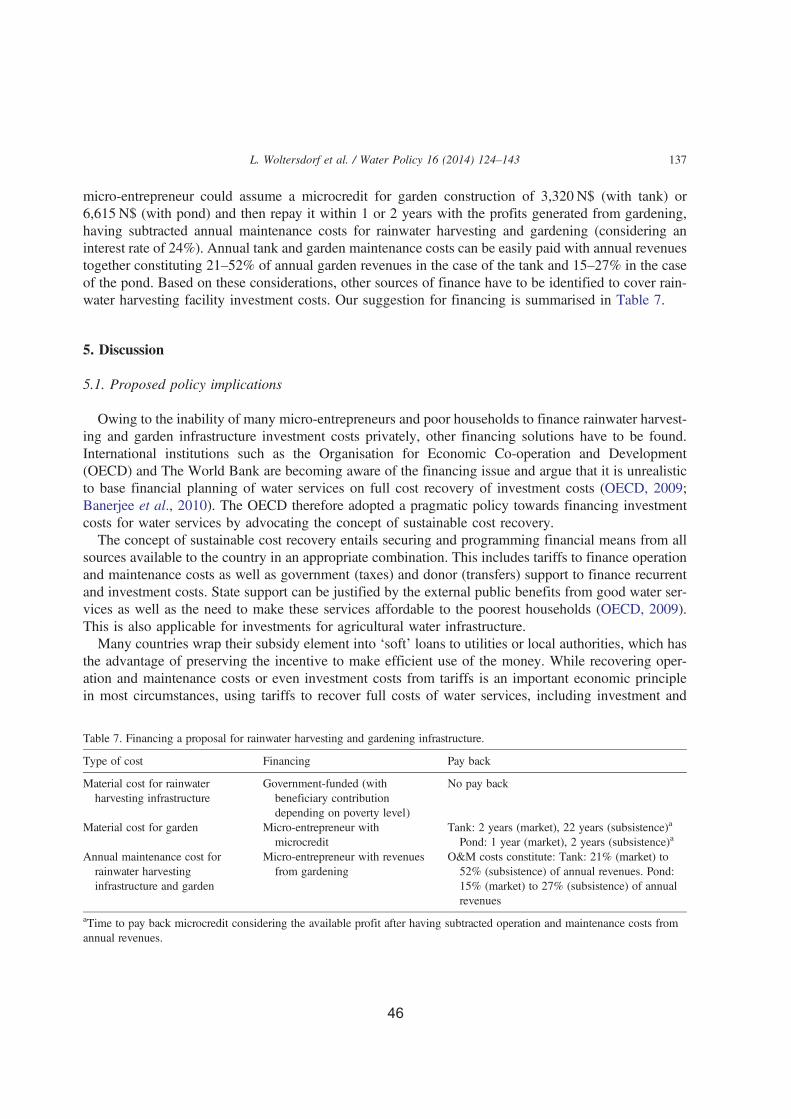
micro-entrepreneur could assume a microcredit for garden construction of 3,320 N$ (with tank) or6,615 N$ (with pond) and then repay it within 1 or 2 years with the profits generated from gardening,having subtracted annual maintenance costs for rainwater harvesting and gardening (considering aninterest rate of 24%). Annual tank and garden maintenance costs can be easily paid with annual revenuestogether constituting 21–52% of annual garden revenues in the case of the tank and 15–27% in the caseof the pond. Based on these considerations, other sources of finance have to be identified to cover rain-water harvesting facility investment costs. Our suggestion for financing is summarised in Table 7.
5. Discussion
5.1. Proposed policy implications
Owing to the inability of many micro-entrepreneurs and poor households to finance rainwater harvest-ing and garden infrastructure investment costs privately, other financing solutions have to be found.International institutions such as the Organisation for Economic Co-operation and Development(OECD) and The World Bank are becoming aware of the financing issue and argue that it is unrealisticto base financial planning of water services on full cost recovery of investment costs (OECD, 2009;Banerjee et al., 2010). The OECD therefore adopted a pragmatic policy towards financing investmentcosts for water services by advocating the concept of sustainable cost recovery.
The concept of sustainable cost recovery entails securing and programming financial means from allsources available to the country in an appropriate combination. This includes tariffs to finance operationand maintenance costs as well as government (taxes) and donor (transfers) support to finance recurrentand investment costs. State support can be justified by the external public benefits from good water ser-vices as well as the need to make these services affordable to the poorest households (OECD, 2009).This is also applicable for investments for agricultural water infrastructure.
Many countries wrap their subsidy element into ‘soft’ loans to utilities or local authorities, which hasthe advantage of preserving the incentive to make efficient use of the money. While recovering oper-ation and maintenance costs or even investment costs from tariffs is an important economic principlein most circumstances, using tariffs to recover full costs of water services, including investment and
Table 7. Financing a proposal for rainwater harvesting and gardening infrastructure.
Type of cost Financing Pay back
Material cost for rainwaterharvesting infrastructure
Government-funded (withbeneficiary contributiondepending on poverty level)
No pay back
Material cost for garden Micro-entrepreneur withmicrocredit
Tank: 2 years (market), 22 years (subsistence)a
Pond: 1 year (market), 2 years (subsistence)a
Annual maintenance cost forrainwater harvestinginfrastructure and garden
Micro-entrepreneur with revenuesfrom gardening
O&M costs constitute: Tank: 21% (market) to52% (subsistence) of annual revenues. Pond:15% (market) to 27% (subsistence) of annualrevenues
aTime to pay back microcredit considering the available profit after having subtracted operation and maintenance costs fromannual revenues.
L. Woltersdorf et al. / Water Policy 16 (2014) 124–143 137
46

major rehabilitation, is unusual even in developed countries. In practice, in many countries the govern-ments prefer to subsidise investment costs through taxation (OECD, 2009). Nonetheless, recovering thecost of providing service, at least for operation and maintenance, is a stated objective of water utilitiesaround the world (Banerjee et al., 2010). Therefore, government could subsidise rainwater harvestinginfrastructure investment costs. Beneficiary contribution of capital costs, for instance of 5–20% depend-ing on beneficiary poverty level, could be considered in order to enhance ownership and sustainability.Then, local tank owners and farmers can finance garden investment costs and maintenance of tanks andgardens by assuming a microcredit and repay it with market sale of gardening products. In doing so, thegovernment could give incentives for value added production, local job creation, improvement andextension of water infrastructure and regional development. Therefore this study recommends state-funded rainwater harvesting material costs.
Besides these financial aspects, current Namibian policy is also an important precondition for thefurther development of rainwater harvesting-based gardening. The FAO recognises agriculturalgrowth involving smallholders, especially women, to be most effective in reducing extreme povertyand hunger when it increases returns to labour and generates employment for the poor (FAO et al.,2012). Historically, smallholders have proved to be key players in meeting food demand. Today, small-holders face considerable challenges, such as limited accessibility to markets, credit, information andresources. Yet, smallholders are capable of meeting these challenges, although they need an appropriateenabling environment in order to do so. Providing improved rural infrastructure such as roads, markets,storage facilities and communication services will reduce transaction costs, enable farmers to reach mar-kets, contribute to a better conservation of products and provide the possibility to add value to productsby, for example, processing food. Interventions to ensure land tenure and property rights security willencourage smallholders to invest in land improvements. Provision of education in rural areas is essentialif smallholders are to participate in markets (FAO et al., 2012). Currently, Namibia has an extensivepolicy framework to foster food security (Werner, 2011).
With regard to irrigation, however, current policies focus on large-scale commercial production anddo not specifically target small-scale food producers at the local level. Therefore, despite the politicalintention of improving household food security, the majority of poor households in rural areas cultivat-ing less than 20 ha does not directly benefit from current political programmes (Werner, 2011). Theproposed rainwater harvesting infrastructure is explicitly not intended to replace the large-scale agricul-ture plans of the Namibian government. Instead, it is intended to complement it by also addressingsmall-scale agriculture and local market production. Thus, Namibian and international experts (e.g.Dima et al., 2002; Werner, 2011) recommend a review of the current policy framework to providemore focus on micro- to small-scale food production (below 20 ha) and on appropriate technical supportand advice in urban, peri-urban and rural areas. This policy review also needs to address institutionalmandates and responsibilities in order to provide the appropriate regulation. Promotion of gardeningand rainwater harvesting require a concerted campaign at all levels of government and the target popu-lation to explain the potential importance and benefits (Werner, 2011). To complement gardeningactivities, a working infrastructure will be necessary including extension and consulting services forgardening, plant protection and seed nurseries.
An example of financing rainwater harvesting infrastructures with grants is the South African policy‘Financial Assistance to Resource Poor Irrigation Farmers’ of the South African Department of WaterAffairs and Forestry (DWAF) published in 2004 as part of the National Water Act of 1998. South Africaand Namibia have a similar history of political and economic imbalance between different parts of the
L. Woltersdorf et al. / Water Policy 16 (2014) 124–143138
47
population. The South African DWAF aims to promote social and economic development in the countrythrough the use of water in an equitable way. It acknowledges micro-scale vegetable farming, where anestimated 150,000 farmers produce food for millions of people, to be an important sector of rural farm-ing in South Africa. It complements the top-down managed large irrigation schemes that are one of thebiggest success stories in agricultural development in the country. The act provides financial assistancefor the development of irrigated agriculture by providing resource-poor farmers with grants and subsi-dies for water supply infrastructure and assistance for water management committees. The grant servesto construct rainwater harvesting storage tanks for resource-poor farmers in rural areas, to serve familyfood production and other productive uses. The grants provides annually 425,500 €, sufficient to buildaround 1,000 rainwater harvesting tanks per year (DWAF, 2004). Through this programme, the SouthAfrican DWAF aims to contribute to the achievement of the UN Millennium Development Goals inSouth Africa by reducing the number of households suffering from food insecurity (DWAF, 2004).A similar programme can be established in Namibia to reduce poverty especially in its northern regionswhich are also disadvantaged in terms of economic and agricultural development.
5.2. Transferability of results
Our research and previous studies revealed a broad range of benefits of rainwater harvesting in tech-nical, economic, environmental and social terms. Existing challenges can be handled by training andeducating the local population. The results of the cost–benefit analysis in this study showed that rain-water harvesting is a profitable activity with a positive NPV over the lifespan of the infrastructurewhen planting crops that achieve high local market prices and excluding material costs for the rainwaterharvesting facility, while including maintenance and operation costs and garden material. It has to beconsidered that the result of cost–benefit analyses depends on the choice and quality of data inputand often, as in our case, only limited data (e.g. prices and yields of only 1 year from 2003) or datanot specific for the model region (e.g. length of growth season for semi-arid regions) are available.
The validity of the results of our cost–benefit calculation has two aspects: the specific data used from theliterature are reliable and therefore our specific results are also reliable. However, owing to inter-annualvariability of, for example, market prices or agricultural yields, the literature data used from 1 year has lim-ited significance. Therefore, the results of the cost–benefit calculation can be considered as preliminary. Inthe following years further field data should be collected in order to refine the cost–benefit calculation andobtain a more representative result for central-northern Namibia. In reality, the cost–benefit ratio depends onthe actual lifespan of the facilities which we determined according to the extensive experience of a Kenyanrainwater harvesting consultant who constructed more than a hundred rainwater harvesting facilities inKenya and Uganda in low-tech areas with comparable conditions to central-northern Namibia. In addition,irrigation requirements were modelled which also depend on climatic and crop data input.First monitoring results showed that local market prices are higher than assumed (according to Price
Waterhouse Coopers, 2005) in the worst garden variant and therefore revenues might be underestimated.This indicates that the benefit might be closer to the best case garden variant with a positive cost–benefitratio. In addition there is a high demand for agricultural products in local markets. Putting rainwaterharvesting in the frame of current water and irrigation infrastructure in Namibia, the results of thisstudy indicate that rainwater harvesting-based small-scale gardening has relative low investment costsper created job. Therefore, the invested funds in rainwater harvesting and small-scale gardens arevery effective in creating new jobs.
L. Woltersdorf et al. / Water Policy 16 (2014) 124–143 139
48

The role of rainwater harvesting for the irrigation of small-scale gardens has not been sufficiently exam-ined in Namibia. However, ground and roof rainwater harvesting is significant for regions with an annualprecipitation of at least 300mm (Gould & Nissen-Petersen, 2006), contrasting rainy and dry seasons andis suitable for rural as well as peri-urban areas. A constraint to an up-scaling in Namibia is the high materialcost of steel mesh, cement and wood compared to the poor local income situation. In other African countiescomparable rainwater harvesting tanks, that is, 30 m3 ferrocement tanks, have similar costs to Namibia. InAsia, material costs are 60–80% lower (Li et al., 2000; Agarwal et al., 2001; Cruddas, 2007; Kariuki,2012, personal communication). The reasons are the unavailability of cement and clean graded river sandin some parts of Africa and a lack of sufficient water for construction in others. In addition, many partsof Africa have lower and seasonal rainfall and impervious roofs are smaller in number and size. In particular,compared to typical household incomes rainwater harvesting tanks aremore expensive inAfrica than inAsia.Nevertheless, rainwater collection is becomingmorewidespread in Africa and in some parts rapid expansionhas occurred in recent years, even though progress has been slower than in Southeast Asia (UNEP 2002). InNamibia, government subsidies are necessary to finance the water harvesting infrastructure. The advantageof these technologies is that they are low-tech, they can be constructed by local inhabitants themselves, theybetter integrate into the natural landscape and into social circumstances and necessary investments are sig-nificantly lower than for large-scale irrigation projects. The water buffering capacity of the rainwaterharvesting facilities are a good adaptation to the increasing variability of precipitation caused by climatechange. Therefore, rainwater harvesting for irrigating gardens has a great future.
6. Conclusion
This study has shown that rainwater harvesting for the irrigation of small-scale gardens and theassociated capacity development measures provide a wide range of benefits. Water harvesting and itsproductive use for horticulture is one key in reaching the poor in peri-urban and rural areas as the decen-tralised infrastructure provides them with direct access to means of production and allows them toimprove their daily meals and their income in order to overcome poverty. In addition, rainwater harvest-ing is an effective adaptation strategy to climate change and climatic variability. Yet, the potential ofrainwater harvesting in combination with gardening has not been developed in Namibia so far. Toachieve broader benefits for the regional economy, investments in infrastructure and an adequatepolicy framework are needed. Owing to the high material costs in Namibia compared to low householdincomes, subsidies are necessary to finance the water harvesting infrastructure. We recommend govern-ment funding of the rainwater harvesting infrastructure and private finance of garden and maintenancecosts. The adoption of rainwater harvesting in Namibia’s water policy framework would improve wateraccess for communities in rural areas. Then, rainwater harvesting is a valuable contribution to reachNamibia’s Vision 2030 and the Millennium Development Goals.
Acknowledgments
The research project CuveWaters is funded by the German Federal Ministry for Education and Research(BMBF) and is a joint research project of the Institute for Social-Ecological Research ISOE and theUniversityof Technology Darmstadt. The authors thank the inhabitants of the Epyeshona village for their continuous
L. Woltersdorf et al. / Water Policy 16 (2014) 124–143140
49

willingness to answer our questions and for their overwhelming hospitality. We thank Piet Heyns, AlexandraLux, Julia Röhrig, Marian Brenda and Martin Zimmermann for their comments to improve the paper.
References
Agarwal, A., Narain, S. & Khurana, I. (2001). Making Water Everybody’s Business. Practice and Policy of Water Harvesting.Centre for Science and Environment, New Delhi.
Allgemeine Zeitung Namibia (2007). Iyambo Verteidigt das Green Scheme. Allgemeine Zeitung Namibia, 03.06.2007. URL:http://www.az.com.na/politik/iyambo-verteidigt-das-green-scheme.18652.php (accessed 18 September 2013).
Allgemeine Zeitung Namibia (2011). Steuergeld gezielt einsetzen: Ökonom fordert Prioritäten bei staatlichenGroßinvestitionen sowie Zielanalyse. Allgemeine Zeitung Namibia, URL: http://www.az.com.na/wirtschaft/steuergeld-gezielt-einsetzen.128995.php (accessed 18 September 2013).
Atkinson, G.&Mourato, S. (2008). Environmental cost–benefit analysis.Annual Review of Environment and Resources 33, 317–344.Banerjee, S., Foster, V., Ying, Y., Skilling, H. & Wodon, Q. (2010). Cost recovery, equity, and efficiency in water tariffs: evi-dence from African utilities. Policy Research Working Paper. The World Bank, Washington.
Barron, J. (2009). Rainwater Harvesting: A Lifeline for Human Well-Being. UNEP. Stockholm.Brouwer, C., Prins, K. & Heilbloem, M. (1989). Irrigation Water Management: Irrigation Scheduling. Training manualno. 4. Food and Agricultural Organization. Rome, Italy.
Chitambo, G., Mathole, S. & Cloete, J. (2006). Study on Microfinance for Small, Medium and Micro Enterprises (SMEs)Development in Namibia. Study commissioned by the Joint Consultative Council (JCC) and executed by the ZimbabweAssociation of Microfinance Institutions (ZAMFI), Joint Consultative Council, Windhoek.
Cruddas, P. (2007). An Investigation into the Potential to Reduce the Cost of Constructed Rainwater Harvesting Tanks inUganda. Master Thesis. Cranfield University School of Applied Sciences. Cranfield.
Deffner, J., Kluge, T. & Müller, K. (2012). Pressure of urbanisation and a sustainable sanitation infrastructure: experiences witha research-driven planning method in Northern Namibia. GWF-Wasser Abwasser, International Issue 2012, p. 2–8.
Deffner, J. & Mazambani, C. (2010). Participatory empirical research on water and sanitation demand in central-NorthernNamibia: a method for technology development with a user perspective. CuveWaters Papers, No. 7, Institute for Social-Eco-logical Research (ISOE), Frankfurt/Main, Germany.
Dima, S., Ogunmakun, A. & Nantanga, T. (2002). The Status of Urban and Peri-Urban Agriculture. Food and AgriculturalOrganization, Windhoek and Oshakati, Namibia.
Driessen, C. & Jokisch, A. (2010). Current Status of “Stengel Dams” in Central-Northern Namibia. Internship Report,Darmstadt University of Technology.
DWAF Department of Water Affairs and Forestry of South Africa (2004). Policy on Financial Assistance to Resource PoorIrrigation Farmers. In terms of sections 61 and 62 of the national Water Act, 1998. Pretoria, South Africa.
FAO (1992). CROPWAT: A computer program for irrigation planning and management. FAO Irrigation and Drainage Paper46. Developed by: Martin Smith, Rome, Italy.
FAO, WFP & IFAD (2012). The State of Food Insecurity in the World 2012. Economic growth is necessary but not sufficient toaccelerate reduction of hunger and malnutrition. Rome.
Gilpin, A. (2000). Environmental Economics. A critical Review. John Wiley and Sons, Chichester.Gould, J. & Nissen-Petersen, E. (2006). Rainwater Catchment Systems for Domestic Supply. Intermediate Technology Publi-cations. London.
Hatibu, N. & Mahoo, H. (1999). Rainwater Harvesting Technologies for Agricultural Production: A case for Dodoma, Tan-zania. Animal Traction Network for Eastern and Southern Africa. Bulawayo, Zimbabwe.
Heyns, P. (1995). The Namibian Perspective on Regional Collaboration in the Joint Development of International WaterResources. Water Resource Development 11(4), 467–492.
Jianbing, Z., Changming, L. & Hongxing, Z. (2010). Cost–benefit analysis for urban rainwater harvesting in Beijing. WaterInternational 35(2), 195–209.
Jokisch, A., Kariuki, I., Woltersdorf, L., Zimmermann, M., Brenda, M. & Polak, M. (2011). Rainwater Harvesting for Micro-scale Gardening within the frame of Project CuveWaters Planning, Construction and Operation of Pilot Plants 2009–2011.Internal CuveWaters Working Paper.
L. Woltersdorf et al. / Water Policy 16 (2014) 124–143 141
50

Kariuki, I. (2012). Costs of Rainwater Harvesting Tanks in Kenya and in Other Parts of Africa. Personal communication. Osha-kati, 14 January 2012.
Kluge, T., Liehr, S., Lux, A., Moser, P., Niemann, S., Umlauf, N. & Urban, W. (2008). IWRM concept for the Cuvelai Basin innorthern Namibia. Physics and Chemistry of the Earth 33, 48–55.
LAWA (2005). Leitlinien zur Durchführung dynamischer Kostenvergleichsrechnungen (KVR-Leitlinien). Länderarbeitsge-meinschaft Wasser (LAWA). Kulturbuchverlag, Berlin.
Li, F., Cook, S., Geballe, G. T. & Burch, W. R. (2000). Rainwater harvesting agriculture: an integrated system for water man-agement on rainfed land in China’s semiarid areas. an integrated system for water management rainfed land in China’ssemiarid areas. Royal Swedish Academy of Science 29(8), 477–483.
Machiwal, D., Jha, M., Singh, P. K., Mahnot, S. C. & Gupta, A. (2004). Planning and design of cost-effective water harvestingstructures for efficient utilization of scarce water resources in semi-arid regions of Rajasthan, India. Water Resources Man-agement 18, 219–235.
Malesu, M., Sang, J., Odhiambo, O., Oduor, A. & Nyabenge, M. (2006). Rainwater Harvesting Innovations in Response toWater Scarcity: Runoff water harvesting in Lare, Kenya. Technical Manual. World Agroforestry Centre, Nairobi.
MAWF (2008). Green Scheme Policy. Namibian Ministry of Water Agriculture and Forestry, Windhoek.Mwenge Kahinda, J. M., Taigbenu, A. & Boroto, J. (2007). Domestic rainwater harvesting to improve water supply in rural
South Africa. Physics and Chemistry of the Earth, Parts A/B/C 32(15–18), 1050–1057.Ngigi, S., Savenije, H. & Gichuki, F. (2007). Land use changes and hydrological impacts related to up-scaling of rainwater
harvesting and management in upper Ewaso Ng’iro river basin, Kenya. Land Use Policy, 24, 129–140.OECD (2009). Strategic Financial Planning for Water Supply and Sanitation. OECD, Paris.Pandey, D. N., Gupta, A. & Anderson, D. (2003). Rainwater harvesting as an adaptation to climate change. Current Science 85
(1), 46–59.Pearce, D., Atkinson, G. &Mourato, S. (2006).Cost–benefit Analysis and the Environment: Recent Developments. OECD, Paris.Price Waterhouse Coopers (2005). Irrigation Development in Namibia: Green Scheme and Horticulture Initiative for Namibia
– Cost–benefit Analysis. Price Waterhouse Coopers, Windhoek.Price Waterhouse Coopers (2008). Horticultural Production and the Maximum Possible Import Substitution. Namibian Agro-
nomic Board, Windhoek.Republic of Namibia (2004). Water Resources Management Act 2004. Government Gazette of the Republic of Namibia,
Windhoek.Republic of Namibia (2006). Namibia Household Income and Expenditure Survey 2003/2004: Preliminary Report. Windhoek.Republic of Namibia (2008a). Review of Poverty and Inequity in Namibia. Central Bureau of Statistics, Windhoek.Republic of Namibia (2008b). Third National Development Plan 2007–2011: Volume 1. National Planning Commission Nami-
bia, Windhoek.Republic of Namibia (2008c). Water Supply and Sanitation Policy. Ministry of Agriculture, Water and Forestry Namibia,
Windhoek.Republic of Namibia (2008d). The Green Scheme: Policy Articulation and Project Implementation – Past, Present and Future?
Ministry of Agriculture, Water and Forestry Namibia, Windhoek.Rockström, J., Barron, J. & Fox, P. (2002). Rainwater management for increased productivity among small-holder farmers in
drought prone environments. Physics and Chemistry of the Earth, Parts A/B/C 27, 949–959.Savva, A. & Frenken, K. (2002). Crop Water Requirements and Irrigation Scheduling. Irrigation Manual Module 11. Food and
Agricultural Organization. Rome, Italy.Senkondo, E., Msangi, A., Xavery, P., Lazaro, E. & Hatibu, N. (2004). Profitability of rainwater harvesting for agricultural
production in selected semi-arid areas of Tanzania. Journal of Applied Irrigation Science 39, 65–81.Sturm, M., Zimmermann, M., Schütz, K., Urban, W. & Hartung, H. (2009). Rainwater harvesting as an alternative water
resource in rural sites in central northern Namibia. Physics and Chemistry of the Earth, Parts A/B/C 34, 776–785.Swanwick, C. (2009). Society’s attitudes to and preferences for land and landscape. Land Use Policy, 26 S, S62–S75.UNEP (2002). Rainwater Harvesting and Utilisation: An Environmentally Sound Approach for Sustainable Urban Water Man-
agement: An Introductory Guide for Decision-Makers. Examples of Rainwater Harvesting and Utilisation Around the World.http://www.unep.or.jp/ietc/publications/urban/urbanenv-2/9.asp (Accessed 17 June 2013).
UNEP (2006). Harvesting Rainfall a Key Climate Adaptation Opportunity for Africa. United Nations Environment Programme(UNEP). http://www.unep.org/Documents.Multilingual/Default.asp?ArticleID=5420&DocumentID=485&l=en.
L. Woltersdorf et al. / Water Policy 16 (2014) 124–143142
51

UN-HABITAT & Government of Madhya Pradesh (2007). Measures for Ensuring Sustainability of Rainwater Harvesting.Policy Paper. Nairobi.
van Averbeke, W. (2007). Urban farming in the informal settlements of Atteridgeville, Pretoria, South Africa. Water SA 33,337–342.
van Steenbergen, F. & Tuinhof, A. (2009). Managing the Water Buffer for Development and Climate Change Adaptation:Groundwater Recharge, Retention, Reuse and Rainwater Storage. 3R organization, Denhaag.
Wakefield, S., Yeudall, F., Taron, C., Reynolds, J. & Skinner, A. (2007). Growing urban health: Community gardening inSouth-East Toronto. Health Promotion International 22, 92–101.
Ward, F. (2012). Cost–benefit and water resources policy: a survey. Water Policy 14(2), 250–280.Weidlich, B. (2007). Green Scheme in Desperate Need of Funding. The Namibian, 13.03.2007. URL: http://www.namibian.com.na/indexx.php?archive_id=35671&page_type=archive_story_detail&page=4274 (accessed 9 September 2013).
Werner, W. (2011). Policy Framework for Small-Scale Gardening. CuveWaters Papers. CuveWaters, Frankfurt am Main.Wills, J., Chinemana, F. & Rudolph, M. (2010). Growing or connecting? An urban food garden in Johannesburg. Health Pro-motion International 25, 33–41.
Woltersdorf, L. (2010). Sustainability of Rainwater Harvesting Systems Used for Gardening in the Context of Climate Changeand IWRM. An example from the Cuvelai-Etosha Basin in Namibia.Master Thesis. University Frankfurt am Main. Frankfurtam Main.
Woltersdorf, L., Liehr, S. & Döll, P. (2013). Rainwater harvesting for small-holder horticulture in semi-arid regions: Design ofgarden variants and assessment of climate change impacts and adaptation. Paper Submitted to Water ResourcesManagement.
Worm, J. & van Hattum, T. (2006). Rainwater harvesting for Domestic Use. Agromisa Foundation and CTA, Wageningen.Yuan, T., Fengmin, L. & Puhai, L. (2003). Economic analysis of rainwater harvesting and irrigation methods, with an examplefrom China. Agricultural Water Management 60, 217–226.
Zimmermann, M., Jokisch, A., Deffner, J., Brenda, M. & Urban, W. (2012). Stakeholder participation and capacity develop-ment during the implementation of rainwater harvesting pilot plants in Central Northern Namibia. Water Science &Technology 12(4), 540–548.
Received 19 April 2013; accepted in revised form 28 June 2013. Available online 14 October 2013
L. Woltersdorf et al. / Water Policy 16 (2014) 124–143 143
52

RESEARCH ARTICLE
Small-scale water reuse for urban agriculture in Namibia: Modeling water flows andproductivity
L. Woltersdorfa*, S. Liehra, R. Scheideggerb and P. Dollc
aInstitute for Social-Ecological Research (ISOE), Frankfurt, Germany; bEawag, Swiss Federal Institute of Aquatic Science andTechnology, Duebendorf, Switzerland; cInstitute of Physical Geography, Goethe University Frankfurt, Frankfurt, Germany
(Received 4 August 2013; accepted 26 February 2014)
Treating and reusing municipal wastewater for urban agriculture raises water productivity. This paper developed amethodology to quantify water flows and productivity of a proposed infrastructure including water supply, sanitation,wastewater treatment and water reuse for agriculture. The methodology consists in calculating the pathogen reductionachieved with wastewater treatment, designing a crop scheme for the irrigation with treated water, modeling irrigationrequirements and quantifying water flows with mathematical material flow analysis. This methodology was applied for thecurrent state and with the planned facility in semi-arid Namibia. This infrastructure has the potential to raise waterproductivity by þ10% as household water use increases with improved sanitation. Compared to not reusing the water foragriculture, water productivity can be raised byþ39%. This methodology allowed the consideration of the impact of facilityuser behavior on water flows and found that water productivity increases less than computed with a fixed wastewater inflow.
Keywords: municipal water reuse; urban agriculture; water cycle; material flow analysis; uncertainty; productivity
1. Introduction
Water for drinking, hygiene and agriculture is scarce in
semi-arid regions. Worldwide around 1.2 billion people live
in areas of physical water scarcity, 1.1 billion lack access to
improved water supply and 2.6 billion (194 million alone in
cities) are without improved sanitation (UNWater and FAO
2007). Poor water supply and sanitation have a considerable
health impact (WWAP 2012).With increasing urbanization,
cities require appropriate urban infrastructure to improve
water supply and sanitation services that contribute to a
sustainable development (Meinzinger 2010). In addition,
agriculture accounts already now for around 70% of global
freshwater withdrawals and tomeet growing future demand,
theworld needs to produce 70%more food by 2050 (WWAP
2012). In developing countries urban dwellers often partly or
completely depend on urban agriculture that contributes to
solving several urbanization problems by enhancing the
availability of fresh food, providing employment, increasing
income and food security, greening cities and recycling
wastes (vanVeenhuizen 2006,WWAP2012). Involving 800
million urban residentsworldwide in 1996 (Smit et al. 1996),
in the last couple of decades urban and peri-urban agriculture
has been steadily increasing (van Veenhuizen 2006).
Therefore, it is essential to provide urban farmers with
sufficient means of production while using scarce resources
such as water most productively. A holistic approach entails
closing the loop between sanitation and agriculture by
reusing treated municipal wastewater and recovering
nutrients from human excreta for the irrigation and
fertilization of food crops that are in turn consumed by
humans (Meinzinger 2010, Pasqualino et al. 2011).
During the past four decades the reuse of treated water in
agriculture has been rapidly increasing worldwide, particu-
larly in regions facing physical or economic water stress,
growing urban populations and growing demand
for irrigation water (Asano 2007, Hamilton et al. 2007,
Drechsel et al. 2010, Scheierling et al. 2010). Especially in
regions with low nutrient applications in agriculture such as
in Sub-Saharan Africa, the reuse of treated and nutrient rich
municipal water for irrigation increases yields and local food
production by providing a stable supply of water and
nutrients (Zaidi 2007). Today the reuse of treated and
untreated wastewater in agriculture is practiced on an
estimated 20 million ha in 50 countries – a tenth of the
world’s irrigated crops (Jimenez andAsano2008). Semi-arid
higher income countries (e.g. USA (California), Israel and
Spain) extensively practice planned reuse of treatedwater for
irrigation, while middle income countries (e.g. Mexico,
Chile, Egypt) use not only treated but also untreated
wastewater, indicating a transition between unplanned and
uncontrolled reuse to planned and controlled reuse. In lower
income countries, water supply and sanitation is often
inadequate and highly polluted waters from surface-water
bodies are reused for irrigation, predominantly unplanned
q 2014 Taylor & Francis
*Corresponding author. Email: [email protected]
Urban Water Journal, 2015
Vol. 12, No. 5, 414–429, http://dx.doi.org/10.1080/1573062X.2014.900691
Dow
nloa
ded
by [$
{ind
ivid
ualU
ser.d
ispl
ayN
ame}
] at 0
0:21
30
July
201
5
53

and unintentionally. The resulting agricultural activities are
most common in and around cities, as in most cities of Sub-
Saharan Africa (Drechsel et al. 2010, Scheierling et al.
2010). In spite of its potential, so far the collection and
treatment of municipal wastewater and its direct reuse in
urban agriculture is not widely practiced in developing
countries due to a lack of appropriate water infrastructure
(Drechsel et al. 2010, Scheierling et al. 2010). Previous
studies have shown that failure to manage existing water
reuse schemes optimally has led to significant problems such
as health risks through the spread of pathogens, soil
degradation through salinization, toxic ions, eutrophication
or increased mobility of organic contaminants and critical
public perceptions toward the reuse of treated water for
agricultural irrigation (Hamilton et al. 2007, O’Connor et al.
2008, Murray and Ray 2010, Chen et al. 2012). In addition,
conducting only a simple calculationwith a fixedwastewater
inflow including water consumption per person and number
of inhabitants without also considering social aspects and
user behavior risks to overestimate the expected quantity of
water available for water reuse. Planning new water and
wastewater infrastructure depends on the choice and quality
of data. The low availability of suitable and certain data is a
common problem in developing countries.
A systematic assessment of a proposed water supply,
sanitation, water treatment and water reuse infrastructure
during project planning could help to considerably diminish
these challenges. A first step is a quantification of water
flows and water productivity from a system perspective. So
far several studies on water flows between households and
agriculture have been carried out in developing countries
usually on a city scale or regional scale (Belevi 2002,
Montangero et al. 2005, Meinzinger et al. 2009, Erni et al.
2011). To the authors’ knowledge this study is the first to
assess the water flows for a small-scale sanitation and water
reuse scheme for agriculture. The aim of this study was
to develop and apply a methodology to quantify water
flows and water productivity of a new water infrastructure
including water supply, sanitation, water treatment and
water reuse for agriculture. The research is relevant for
the future planning and decision making process before the
introduction of such a new infrastructure to show to what
degree water needs can be reduced and productivity raised
in a given area. For this, a combination of modeling
methods including mathematical material flow analysis and
modeling of crop irrigation requirements was developed.
The mathematical material flow analysis accounts for the
low availability of direct data and for data uncertainty by
including data ranges and probability distributions and by
assessing the effects of different assumptions in cases.
The proposed infrastructure is designed to offer sanitation
facilities for around 1500 inhabitants and to irrigate an
agricultural area of 1.5 ha. The study forms the basis for
further assessment steps; the quantification of salt and
nutrient fluxes which are solved in the water and the
potential for nutrient recycling. Finally, a sustainability
analysis of the proposed water reuse infrastructure will
include economic and social aspects. Nutrient flows, salt
flows, economic and social aspects are not within the scope
of this paper and will be published elsewhere.
2. Study area
The city of Outapi in central-northern Namibia exemplifies
the typical problems of water supply and low access to
sanitation facilities of urban areas in low-income countries
(see Deffner et al. 2012). The Namibian government
undertakes considerable efforts to improve the access to
water supply and sanitation in accordance with the
Millennium Development Goals (Republic of Namibia
2008). However, water resources are scarce and conse-
quently water use conflicts between households and
agriculture occur. In order to use scarce water resources
most productively, a new sanitation and water reuse
infrastructure is proposed to be implemented in the town.
Outapi has about 4600 inhabitants, high population growth
and mostly low-density and partly informal settlements
(Kluge et al. 2008). The region is semi-arid andwater scarce:
Precipitation is highly variable ranging from 262–666mm/
year in 2/3 of years, with an average of 464mm, 96%
occurring fromNovember to April (Woltersdorf et al. 2013).
Annual potential evaporation is estimated to be 2600mm
(Heyns 1995). Groundwater is mostly brackish or saline,
wetlands are seasonal, perennial rivers are absent and
frequent droughts alter seasonal floods. Freshwater is
provided by a water pipeline originating from the Angolan-
Namibian border river Kunene (Heyns 1995). Growing
demand for water has increased pressure and dependency on
water infrastructure, making the region particularly vulner-
able (Kluge et al. 2008). Access to drinking water and
sanitation in the four project settlements in Outapi (Shack
dwellers, Tobias Hainyeko, Onhimbu and Okaikongwe) was
investigated during a household inventory survey in June
2012 (Deffner et al. 2012). The type of water source
predominately used was the communal water taps (95% in
Shack dwellers, 91% in Tobias Hainyeko, 87% in Onhimbu,
and 96% in Okaikongwe), the remaining used a private
tap. Other water sources such as the ephemeral river do not
play a significant role (,2%) due to their unreliable and
seasonal availability. The minority of the respondents has
access to latrines (37% in Shack dwellers, 44% in Tobias
Hainyeko, and 4% in Okaikongwe) and most practice open
defecation. Only in Onhimbu 90% of the residents use
latrines and 10% practice open defecation (Deffner et al.
2012). The region has a high demand for agricultural
products for food security and import substitution (Govern-
ment of Namibia 2006). Ongoing population growth, further
urbanization, possible effects of an upswing in Angola’s
economy, plans for commercial agricultural activities in the
town’s surroundings and expected effects of climate change
Urban Water Journal 415
Dow
nloa
ded
by [$
{ind
ivid
ualU
ser.d
ispl
ayN
ame}
] at 0
0:21
30
July
201
5
54
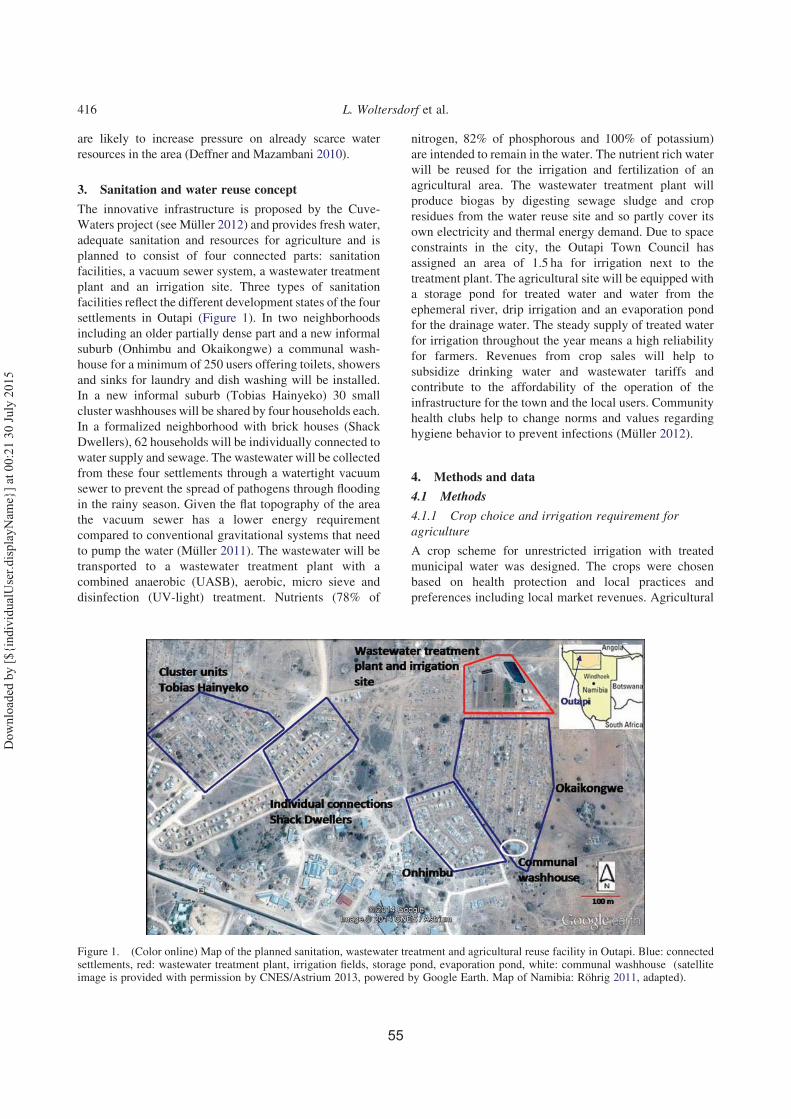
are likely to increase pressure on already scarce water
resources in the area (Deffner and Mazambani 2010).
3. Sanitation and water reuse concept
The innovative infrastructure is proposed by the Cuve-
Waters project (see Muller 2012) and provides fresh water,
adequate sanitation and resources for agriculture and is
planned to consist of four connected parts: sanitation
facilities, a vacuum sewer system, a wastewater treatment
plant and an irrigation site. Three types of sanitation
facilities reflect the different development states of the four
settlements in Outapi (Figure 1). In two neighborhoods
including an older partially dense part and a new informal
suburb (Onhimbu and Okaikongwe) a communal wash-
house for a minimum of 250 users offering toilets, showers
and sinks for laundry and dish washing will be installed.
In a new informal suburb (Tobias Hainyeko) 30 small
cluster washhouses will be shared by four households each.
In a formalized neighborhood with brick houses (Shack
Dwellers), 62 households will be individually connected to
water supply and sewage. The wastewater will be collected
from these four settlements through a watertight vacuum
sewer to prevent the spread of pathogens through flooding
in the rainy season. Given the flat topography of the area
the vacuum sewer has a lower energy requirement
compared to conventional gravitational systems that need
to pump the water (Muller 2011). The wastewater will be
transported to a wastewater treatment plant with a
combined anaerobic (UASB), aerobic, micro sieve and
disinfection (UV-light) treatment. Nutrients (78% of
nitrogen, 82% of phosphorous and 100% of potassium)
are intended to remain in the water. The nutrient rich water
will be reused for the irrigation and fertilization of an
agricultural area. The wastewater treatment plant will
produce biogas by digesting sewage sludge and crop
residues from the water reuse site and so partly cover its
own electricity and thermal energy demand. Due to space
constraints in the city, the Outapi Town Council has
assigned an area of 1.5 ha for irrigation next to the
treatment plant. The agricultural site will be equipped with
a storage pond for treated water and water from the
ephemeral river, drip irrigation and an evaporation pond
for the drainage water. The steady supply of treated water
for irrigation throughout the year means a high reliability
for farmers. Revenues from crop sales will help to
subsidize drinking water and wastewater tariffs and
contribute to the affordability of the operation of the
infrastructure for the town and the local users. Community
health clubs help to change norms and values regarding
hygiene behavior to prevent infections (Muller 2012).
4. Methods and data
4.1 Methods
4.1.1 Crop choice and irrigation requirement for
agriculture
A crop scheme for unrestricted irrigation with treated
municipal water was designed. The crops were chosen
based on health protection and local practices and
preferences including local market revenues. Agricultural
Figure 1. (Color online) Map of the planned sanitation, wastewater treatment and agricultural reuse facility in Outapi. Blue: connectedsettlements, red: wastewater treatment plant, irrigation fields, storage pond, evaporation pond, white: communal washhouse (satelliteimage is provided with permission by CNES/Astrium 2013, powered by Google Earth. Map of Namibia: Rohrig 2011, adapted).
L. Woltersdorf et al.416
Dow
nloa
ded
by [$
{ind
ivid
ualU
ser.d
ispl
ayN
ame}
] at 0
0:21
30
July
201
5
55

yields in Namibia were taken from a study by Price
Waterhouse Coopers (2005). Local preferences were
determined in close collaboration with local farmers
(personal communication Hilengwa 2013). The level of
achieved health protection was determined following the
approach described in the WHO (2006) health guidelines
for the irrigation with treated wastewater. For unrestricted
irrigation and full health protection the WHO (2006)
requires that the amount of pathogens present in the
wastewater is reduced by six log units for leaf crops and
seven log units for root crops. The pathogen reduction
achieved with the proposed wastewater treatment plant,
water storage, drip irrigation and an interval between
final irrigation and consumption of produce of three days
was calculated indicating a lower and upper range of
uncertainty. The wastewater treatment plant includes a
microsieve to filter helminth eggs, but unfortunately the
WHO (2006) does not provide any data on possible
reduction amounts and therefore this could not be included
in the calculation. The pathogen die-off on crop surfaces
that occurs between last irrigation and consumption
depends on climate (temperature, sunlight intensity,
humidity), time and crop type. In order to be on the safe
side, for all crops a pathogen reduction of two log units
was assumed, as indicated for low growing crops irrigated
with drip irrigation that grow just above the soil and
partially in contact with it. The reason is that it cannot be
assured that the harvested part does not contact the soil at
some point. With high growing crops, where the harvested
part is not in contact with the soil, pathogens can be
reduced by further two log units (WHO 2006). In addition,
further health protection measures by the consumer further
reduce pathogens, including produce peeling, washing and
cooking. These are however, not considered here, as the
water reuse will produce hygienically safe products.
Growth periods and length of crop growth consider local
climate conditions and were taken from Savva and
Frenken (2002), in accordance with the experience of local
farmers (personal communication Hilengwa 2013). Plant-
ing dates of crops consider the necessary time for sowing,
transplanting, harvest and land preparation for the
next crop (Savva and Frenken 2002). Maize provides
considerable residues that are needed for the digester of
the wastewater treatment plant to produce energy, while
the cobs can be sold. Therefore an area of 0.5 ha will be
planted with maize.
Crop irrigation requirements were computed with the
software CROPWAT 8.0 (FAO 1992, Allen et al. 1998).
Input parameters included latitude, monthly precipitation,
monthly mean minimum and maximum temperature,
relative humidity and wind speed. Local climate data from
Ondangwa weather station, which is 90 km away from
Outapi, were used as provided by the Namibian Weather
Bureau. The three latter parameters were calculated with
the limited available daily data for temperature from 2003
to 2007, for humidity from 2004 to 2007 and for wind
speed from 2006 to 2007. Precipitation and a precipitation
probability analysis were calculated with data of the
past 30 available years (ranging from 1950 to 2008)
(see Woltersdorf et al. 2013). Following FAO recommen-
dations (Savva and Frenken 2002), the 75% dependable
rainfall was used instead of the mean monthly precipi-
tation for the computation of irrigation requirements.
The 75% dependable rainfall is expected to be exceeded in
3 out of 4 years. Crop specific data, e.g. length of growth
season of crops, was taken for semi-arid regions from
literature (Savva and Frenken 2002) and backed up with
experiences from local farmers (Hilengwa 2013). Data on
agricultural yields was limited and available from only
1 year in Namibia, from 2003 in Pricewaterhouse Coopers
(2007). Due to inter-annual variability of yields and
climate, agricultural yields taken from literature data from
one year have limited significance but are nonetheless an
indicative value. Soil data was used as suggested by
CROPWAT 8.0 for light sandy soil. A drip irrigation
efficiency of 0.75 was used assuming a conveyance
efficiency of 0.85 and an application efficiency of 0.9,
calculated according to Brouwer et al. (1989). To obtain
the gross irrigation water requirement, the calculated net
irrigation requirement was divided by the irrigation
efficiency. Then the leaching requirement (LR) was
calculated, which is the amount of water necessary to
remove salts that have accumulated from the irrigation
water as a result of evapotranspiration (Pescod 1992). It is
expressed as percentage of the gross irrigation requirement
(Equation (1)) (Savva and Frenken 2002):
LR ¼ ECw
2MaxECe
·1
Leð1Þ
where ECw is the electrical conductivity of the irrigation
water (0.9 dS/m) (CuveWaters 2009), MaxECe is the
maximum tolerable electrical conductivity of the soil
saturation extract for each crop according to Savva and
Frenken (2002) and Le is the leaching efficiency (sandy
soils 0.3). Irrigation and leaching water add to a raising
water table and require adequate sub-surface drainage
(Ayers and Westcot 1985). For the model calculations,
it was assumed that the amount of leaching water that
percolates through the root zone equals the amount of
drainage water that is collected by drainage pipes; i.e. there
is no loss or accumulation of water in the soil.
4.1.2 Mathematical material flow analysis
Water flows within the system were described, quantified
and modeled with a mathematical material flow analysis
(MMFA) (Baccini and Bader 1996). By modeling the
water flows in the system under investigation, an MMFA
highlights the linkages between human behavior, technical
Urban Water Journal 417
Dow
nloa
ded
by [$
{ind
ivid
ualU
ser.d
ispl
ayN
ame}
] at 0
0:21
30
July
201
5
56

infrastructure and the impact on the environment. New
concepts for linking sanitation with resource recovery for
agriculture can be assessed in regard to their sustainability
and compared to the current state of water use in the
area (Montangero et al. 2005, Meinzinger et al. 2009).
This allows recognizing problems such as low water
productivity early. For the calculations, the material flow
modeling software SIMBOX was used (Baccini and Bader
1996). A stationary water flow model was developed with
the aim to acquire system knowledge by quantifying water
flows in, out and within the system in a first approximation,
rather than to develop a highly detailed process-based
model that would be able to describe all the processes very
accurately. The MMFA comprised the following steps
(Bader and Scheidegger 2012):
(1) System analysis. The temporal and spatial
boundaries were defined to identify the processes,
balances, flows and interrelationships of the system. The
time scale of the system is 1 year, the system boundaries
are the four settlements, the wastewater treatment and
water reuse site in Outapi. The boxes represent the balance
volumes and the arrows indicate the water flows (inputs,
outputs and internal flows) of the system at steady-state).
The households with a sanitation unit in their house are
represented by the box “HH ‘individual’” and their
individual sanitation units by the box “individual”. The
households using the cluster units are represented by the
box “HH ‘cluster’” and the cluster sanitation units by
the box “cluster”. The households using the community
unit are represented by the box “HH ‘community’” and
the community sanitation unit is represented by the box
“community”. A MMFA system generally obeys the
law of mass conservation. Only key water flows above
1m3/y were considered and given in cubic meters per
year [m3/y].
(2) Mathematical model. Variables were determined
with parameters to describe the current knowledge and the
relationships of the input, output and internal water flows
as well as processes (stock rate changes) of the system in
mathematical terms. The designed MMFA model for the
system under consideration is based on 53 system
variables and 58 parameters (Figure 2).
(3) Data collection and calibration. Input data for the
model parameters were derived by primary and secondary
sources including publications, modeling software, esti-
mations, balancing and expert opinions. These data were
Water
Wastewater
Wastewater
Wastewater
Irrigation water
Precipitation
Precipitation
ETAgricultural products
Agricultural products
Food
Drained water
FoodFood
Treated water
Excretion
Excretion
Excretion
Wastewater
Water
Excretion
ExcretionExcretion
Water
Water
Water
WastewaterWastewater
Wastewater
ExcretionExcretion
Excretion
Water
Evaporation
Evaporation
Excretion
Water
Water
Water
Percolation
Groundwater flow
Water
Channeled water
Food
Food
Food
Inflow
Water
HH Individual
Cluster
Community
Sewer
WWTP Agriculture
Storage pond Drainage pond
Distributor
External consumers Atmosphere
HH
HH
Latrine
Water grid
Environment Groundwater
Ephemeral river
"Individual"
"Cluster"
"Community"
Figure 2. Water flows in the planned sanitation and agricultural reuse system in Outapi, representing the current situation and futuredevelopment. Red: water in food and beverages, blue: water of good quality, grey-blue: wastewater, brown: water in excreta, purple:treated and irrigation water. HH: households. Future development is reflected by the boxes: individual, cluster and community units,sewer, wastewater treatment plant (wwtp), storage pond and drainage pond.
L. Woltersdorf et al.418
Dow
nloa
ded
by [$
{ind
ivid
ualU
ser.d
ispl
ayN
ame}
] at 0
0:21
30
July
201
5
57

combined to produce best estimates for the parameters used.
It was not yet possible to include primary measurements as
the facility is still in the construction phase.
(4) Simulation of the material flows including case
calculations. Three cases were simulated; the current state
of water infrastructure with a new agriculture site and two
cases with the proposed sanitation and water reuse facility
(see Section 4.1.2).
(5) Uncertainty analysis, parameter uncertainty
ranking and Monte Carlo distribution. Model results are
always tied to a certain uncertainty. The uncertainty
(standard deviation) and probability density distribution
of each parameter was estimated from literature sources,
expert opinions and plausible reasoning. Where no
uncertainties could be defined for a particular parameter,
an standard deviation of 10% was assumed. Depending on
the available knowledge of a specific parameter, either a
uniform, normal, truncated normal or lognormal prob-
ability density distribution was assigned. Then the
distribution of the parameters and variables was calculated
with a Monte Carlo simulation and the 90% prabability
range could be shown. For this a probability density
distribution was numerically described for all parameters
by a sample size of 10,000. The input parameters were
ranked for their impact on the uncertainty of a calculated
variable. The parameters were listed making up the bulk
uncertainty of model results of two key variables of the
system: The first key variable is the water flowing into the
system to the water grid, which is an indicator for the
overall water requirement of the system. The second key
variable is the irrigation water supplied by the grid to
agriculture, indicating the amount of fresh water needed by
agriculture that cannot be covered with reused water or the
ephemeral river.
(6) Analysis and interpretation of results. The results
of the material flow analysis were analyzed using the water
productivity of the system as the main indicator for the
efficiency of the water reuse scheme. The water
productivity P is defined as the ratio of the mass of
agricultural production M to the total water input to the
system Q (Equation (2)) (Sadras et al. 2011). The total
water input to the system equals to the water consumption
of the households and of the agricultural area.
P ¼ M
Qð2Þ
The percent change in water productivity associated
with the implementation of the new sanitation and water
reuse infrastructure in comparison to the current state
before the new infrastructure is implemented was
calculated. As in this study the mass of agricultural
production is defined to be the same in all cases, the
change in water input to the system is proportional to the
change in water productivity.
4.1.3 Cases
Three cases to quantify water flows were designed. Case 0
includes the current situation in the four project
settlements with the current water and sanitation
infrastructure and a new agriculture site. Case 1 assumes
the implementation of the new sanitation and water reuse
infrastructure with ideal utilization. Case 2 assumes the
implementation of the new sanitation and water reuse
infrastructure with a low utilization and acceptance.
Currently, extensive new agricultural areas with food
crops to be irrigated with grid water are planned and
expanded in the surroundings of the city. For compar-
ability, this study assumed the same agricultural crop
scheme for case 0 as designed for the new sanitation and
water reuse facility (in Section 4.1.1) with an area of 1.5 ha
as assigned by the Outapi Town Council. For the crop
scheme, an agricultural production of 154,000 kg/y and an
irrigation requirement excluding leaching of 26,640m3/y
were calculated. Leaching requirements differ, as in case 0
grid water with a lower salt content is used requiring less
leaching water (283m3/y), while case 1 and 2 use treated
water with a higher salt content requiring more leaching
water (3980m3/y). The agricultural water requirement,
including irrigation water and leaching water, is
23,386m3/y in case 0 and 27,083m3/y in case 1 and 2.
Also the agricultural infrastructure differs; case 0 has a
drip irrigation system but no other elaborate infrastructure,
case 1 and 2 have drip irrigation, a drainage and storage
pond and a channel to the ephemeral river. The irrigation
requirement was not optimized to the calculated available
wastewater, as the area assigned for the water reuse site
was determined by the Outapi Town council to be 1.5 ha at
first. Parameter input and variations for the three cases are
shown in Table 1 and Table 2.
4.2 Data
The 58 parameters used to model water flows of the system
are shown with their values for case 1 (Table 1). For the
three cases, 19 parameters were varied (Table 2) while the
other 39 parameters are the same for all cases.
5. Results and Discussion
5.1 Crop choice and irrigation requirement foragriculture
The proposed wastewater treatment plant and water reuse
site reduce pathogens as shown in Table 4.
Considering these calculated reductions (Table 3) the
wastewater treatment and water reuse site achieve – even
in the worst case – the necessary level of pathogen
reduction of six log units, corresponding to a pathogen
reduction of 99.9999%, for unrestricted irrigation of edible
leaf crops (WHO 2006). In addition, the microsieve
considerably reduces the number of helminth eggs, which
Urban Water Journal 419
Dow
nloa
ded
by [$
{ind
ivid
ualU
ser.d
ispl
ayN
ame}
] at 0
0:21
30
July
201
5
58

Table 1. Parameters used for modeling water flows; values given for case 1.
Parameter Unit Mean STDV Distrib. Lower bound. Upper bound. Source
H2O dietary intake l/p/d 1.5 0.15 tnormal 0.8 4 study assumption
Number of inhabitants designated for:
capita tnormalIndividual units 264 80 150 500 project estimationCluster units 840 150 350 1300Communal washhouse 397 150 250 1600
Fresh water use per person designated for:
l/p/dIndividual units 60 6 tnormal 33 120 project estimation, according to Howard
and Bartram 2003Cluster units 34 120Communal washhouse 26 120
Fraction of fresh water becoming rawwaste water generated per user of:Individual units decimal 0.9 0.09 tnormal study assumptionCluster units 0.8 0.08Communal washhouse 0.8 0.08 0 1
Urine excreted l/p/d 1.382 0.724 lognormal Redelinghuys et al. 2010, data South Africa
Ratio of inhabitants designated to useindividual sanitation units:Practicing open defecation decimal 0 0 uniform study assumptionUsing latrinesUsing directly the water grid
Ratio of inhabitants designated to usecluster sanitation units:Practicing open defecation decimal 0 0 uniform study assumptionUsing latrinesUsing directly the water grid
Ratio of inhabitants designated to usethe communal washhouse:Practicing open defecation decimal 0 0 uniform study assumptionUsing latrinesUsing directly the water grid
Storage pondvolume m3 3000 0 uniform project designsurface m2 2000 0 uniform project designrunoff coefficient decimal 0.8 0.05 tnormal 0.7 1.0 Gould and Nissen-Petersen 2006
Max. volume from ephemeral river m3/y 2600 520 uniform project estimation
Share of mean precipitation becomingnot effective precipitation
decimal 0.13 0.03 tnormal 0.1 0.2 modeled with CROPWAT 8.0, data NamibianWeather Bureau
Part of not effective precipitation andof inefficiency of drip irrigation systemthat evaporates to the atmosphere
decimal 0.85 0.03 tnormal 0.8 0.9 estimation according to Heyns 1995
(Continued)
L.Woltersd
orfet
al.420
Downloaded by [${individualUser.displayName}] at 00:21 30 July 2015
59

Table 1 – continued
Parameter Unit Mean STDV Distrib. Lower bound. Upper bound. Source
Size of agriculture area: uniformtotal m2 15,000 0 project designplanted with maize 5000 0
Irrigation water requirement:maize m3/m2/y 0.751 0.075
lognormalmodeled with CROPWAT 8.0, data NamibianWeather Bureau, Savva and Frenken 2002crops, without maize 0.520 0.052
Leaching water requirement:maize m3/m2/y 0.124 0.012
lognormalcalculated with formula from Savva andFrenken 2002crops without maize 0.091 0.009
Crop cycles per year:maize number 2 0 uniform study assumptioncrops without maize 3 0
Precipitation m/y 0.464 0.202 lognormal Namibian Weather Bureau
Evapotranspiration:maize m3/m2/y 0.702 0.0702 lognormal modeled with CROPWAT 8.0, data Namibian
Weather Bureaucrops, without maize 0.517 0.0517
Drip irrigation efficiency decimal 0.75 0.08 tnormal 0.65 1 Brouwer et al. 1989
Yield:maize 3.50 0.35tomato 4.00 0.40pumpkin 3.50 0.35watermelon kg/m2 5.04 0.50 normal Price Waterhouse Coopers 2005 and estimations
for spinach and sweet melonpepper 1.40 0.14spinach 1.00 0.10sweet melon 3.00 0.30
Evaporation from open water surface m/y 2.6 0.2 lognormal Heyns 1995
ECw of irrigation water dS/m 0.9 0.09 lognormal estimation according to project laboratory valuesfor wastewater pond in Outapi (2009)study assumption, according to Savva andFrenken 2002
Leaching efficiency of soil decimal 0.3 0.03 lognormal
Max ECsoil 0% tolerance:maize 10.0 1.00tomato 7.4 0.74pumpkin 8.6 0.86watermelon dS/m 10.0 1.00 lognormal Savva and Frenken 2002, estimations for pumpkin,
watermelon and sweet melonpepper 10.0 1.00spinach 15.0 1.50sweet melon 8.0 0.80
H2O contained in producedmaize cobs m3/m2/y 0.00262 0.00026 lognormal Souci et al. 2008, Price Waterhouse Coopers 2005fruits and vegetable, without maize 0.00272 0.000272
Ratio of food produced sold to usersof the sanitation facilities
decimal 0.8 0.08 tnormal 0 1 study assumption
UrbanWater
Journal
421
Downloaded by [${individualUser.displayName}] at 00:21 30 July 2015
60

could unfortunately not be quantified. Also, planting high-
growing crops and the semi-arid climate in Namibia with
high temperatures and high sunlight intensity are expected to
cause a high pathogen reduction. Therefore, the actual
pathogen reduction is likely to be more on the estimated
upper boundaryof thevalues calculated inTable 3.However,
in order to be on the safe side, root crops that require a
minimum reduction of seven log units were excluded from
the crop pattern. The resulting crop pattern for water reuse
based on health protection, local habits and preferences and
economic considerations that was used for the material flow
analysis is shown in Figure 3.
Under local conditions, maize has a mean crop water
requirement of 0.751m3/m2/y and a leaching requirement
of 0.009m3/m2/y when irrigating with tap water and
0.124m3/m2/y when irrigating with reuse water. The
vegetable and fruit area has a mean crop water requirement
of 0.520m3/m2/y and a leaching requirement of 0.006m3/
m2/y when irrigating with tap water and 0.091m3/m2/y
when irrigating with reuse water.
Table 2. Parameter variations (mean value) for different cases.
Parameter Unit Case 0 Case 1 Case 2
Fresh water used per user of:Individual units
l/p/d33 47
Cluster units 34 60 47Communal washhouse 26 43
Fresh water becoming raw waste water generated per user of:Individual units
decimal0.9 0.9
Cluster units 0 0.8 0.6Communal washhouse 0.8 0.6
Ratio of individual unit users:Practicing open defecation
decimal0.64
Using latrines 0.36 0 0.1Using the water grid 1
Ratio of cluster unit users:Practicing open defecation
decimal0.56 0.25
Using latrines 0.44 0 0.1Using the water grid 1 0.3
Ratio of communal washhouse users:Practicing open defecation
decimal0.535 0.25
Using latrines 0.465 0 0.25Using the water grid 1 0.25
Leaching requirement:maize m3/m2/y 0.009 0.124 0.124crops without maize 0.006 0.091 0.091
ECw of irrigation water dS/m 0.1 0.9 0.9Ratio of food produced sold to sanitation facility users decimal 0.8 0.8 0.3
Table 3. Range of pathogen reduction (log units) achieved with components of the proposed wastewater treatment plant and water reusesite (WHO 2006).
Pathogen reduction (log units)
Viruses Bacteria Protozoan (oo) cysts Helminth eggs
Primary sedimentation (primary treatment) 0 to 1 0 to 1 0 to 1 0 to 1UASB anaerobe treatment (secondary treatment) 0 to 1 0.5 to 1.5 0 to 1 0.5 to 1Aerobe treatment 1 to 2 1 to 2 0 to 1 1 to 3Ultraviolet radiation (tertiary treatment) 1 to . 3 2 to . 4 .3 0Microsieve 0 0 data missingAerated lagoon and settling pond (water reuse site) 1 to 2 1 to 2 0 to 1 1 to 3Three day interval between final irrigation and consumption 1.5 to 6Drip irrigation and low growing crops 2SUM 6.5 to 12.5 8 to 14 6.5 to 10.5 6 to 11.5
L. Woltersdorf et al.422
Dow
nloa
ded
by [$
{ind
ivid
ualU
ser.d
ispl
ayN
ame}
] at 0
0:21
30
July
201
5
61

5.2 Mathematical material flow analysis
5.2.1 Case 0: Current water infrastructure with a new
agricultural irrigation site
In case 0 household water consumption and sanitation
habits were assumed as indicated in the household
inventory survey in July 2012 (Deffner et al. 2012).
Household water consumption was: 33 l/p/d in Shack
dwellers, 34 l/p/d in Tobias Hainyeko and 25 l/d/p in
Onhimbu and Okaikongwe. As a result, the households
consume 17,340m3/y. In the absence of other water sources,
households and agriculture are solely supplied by the water
grid. Simulation results show that the totalwater inflow to the
system through the grid is 40,700m3/y (Figure 4). With
23,400m3, agriculture consumes the largest part of the
water (57%). Currently, there is no wastewater sewer and
household wastewater is neither collected, treated nor can be
reused in a productive manner. Instead wastewater and
excrements are discharged untreated to the environment
(17,769m3/y) either through open defecation or the pit
latrine, thus potentially causing soil, groundwater and
surfacewater pollution as well as diseases, especially during
seasonal floods. The agricultural irrigation site was assumed
to have only simple equipment and no drainage pond,
2730m3/y of water infiltrate into the soil.
5.2.2 Case 1: Ideal use of new sanitation and water
reuse facility
For case 1 a water consumption of 60 l/d/p was assumed,
which is slightly higher than the value indicated by the
WHO (Howard and Bartram 2003) to assure all basic
personal needs, food hygiene, laundry and bathing. All
potential users use the sanitation facilities; there is no open
defecation and no use of the latrine and the communal
water point. Irrigation water is supplied with first priority
by the wastewater treatment plant, second by the
ephemeral river and third by the water grid. Simulation
results show that the main water input to the system comes
through the water grid (36,800m3/y) (Figure 5). The
agricultural site is supplied with the maximum possible
annual amount of water from the ephemeral river
(2600m3/y). The household water consumption is
32,870m3/y, the irrigation water requirement 27,084m3/y.
Household water consumption is the highest of the three
cases due to the improved availability of water. Still, the
water inflow to the system is the lowest of the three cases,
due to treatment and reuse of 27,600m3/y household
wastewater for irrigation. The irrigation water is composed
of 85% treated reuse water, also taking into account that
the reuse water in the storage pond is reduced by
evaporation and increased by precipitation on the surface
of the pond. Since all residents use the sanitation facilities,
no excreta are released to the environment and pathogens
are prevented to spread in the area. A high share ofTable
4.
Param
etersresponsible
forbulk
uncertainty
ofmodel
resultsofthetwokey
variables.
Key
variable
[m3/y]
Case0
Case1
Case2
Water
inflow
from
outsideto
thewater
grid
Number
ofinhabitants(57%)
Irrigationwater
requirem
ent(40%)
Number
ofinhabitants(42%)
Irrigationwater
requirem
ent(26%)
Fresh
water
becomingraw
waste
water
per
sanitationunituser(39%)
Irrigationwater
requirem
ent(34%)
Fresh
water
usedper
inhabitant(12%)
Number
ofinhabitants(9%)
Fresh
water
usedper
inhabitant(9%)
Theseparam
etersareresponsible
for
uncertainty
of(%
Sum)
95%
87%
85%
Irrigationwater
from
gridto
agriculture
Irrigationwater
requirem
ent(84%)
Number
ofinhabitants(64%)
Number
ofinhabitants(43%)
Maize
cycles
per
year(16%)
Irrigationwater
requirem
ent(11%)
Irrigationwater
requirem
ent(35%)
Fresh
water
becomingraw
waste
water
per
sanitationunituser(11%)
Fresh
water
usedper
inhabitant(7%)
Fresh
water
usedper
inhabitant(11%)
Theseparam
etersareresponsible
foruncertainty
of(%
Sum)
100%
97%
84%
Urban Water Journal 423
Dow
nloa
ded
by [$
{ind
ivid
ualU
ser.d
ispl
ayN
ame}
] at 0
0:21
30
July
201
5
62

household wastewater, 90% in individual units and 80% in
cluster units and the communal washhouse, can be
collected and treated. The remaining 6018m3/y of
untreated domestic water without excreta are not collected
by the sewer system and are discharged to the environment.
This occurs e.g. when people take the water home in
buckets and use it in front of their houses for food, personal
hygene or watering the garden. For this reason the water
cannot be reused for agricultural irrigation. Due to the lined
drainage pond, no polluted leaching water infiltrates to the
groundwater.
5.2.3 Case 2: Low utilization and acceptance of new
sanitation and water reuse facility
In case 2 it was assumed that the users maintain a similar
fresh water consumption and partly stick to their former
sanitation habits due to long distances between the
community sanitation unit and the houses, especially for
children or at night. Inhabitants therefore use less the new
sanitation facilities and still practice open defection, use
the existing latrines and fetch water from the existing
water grid to a certain extend. For this, the use of the new
sanitation facilities and the amount of daily water
consumption per person is assumed to be in between the
current state and the case of an ideal utilization of the new
infrastructure.
Compared to case 1, less wastewater in the cluster unit
and the communal washhouse is collected by the sewer
(only 60%) as more users were assumed to stick to their
former habits and e.g. take their water home. Due to lower
acceptance, the users of the sanitation facilities buy less
food produced from the water reuse site and the produce is
sold to external consumers. Simulation results (Figure 6)
indicate that the water requirement of the system is
43,700m3/y, of which 41,100m3/y are supplied through
Field Jan Feb Mar Apr May Jun Jul Aug Sep Oct Nov Dec1 1st maize 20th 1st maize 17th2 1st maize 20th 1st maize 18th3 1st pepper 30th 10th pumpkin 17th 1st spinach 9th4 1st tomato 15th 10th sweet melon 7th 10th watermelon 28th
Figure 3. Optimal cropping pattern used for material flow analysis with crop type, planting and harvesting date.
Figure 4. Simulation results for case 0: Current water infrastructure with new agricultural irrigation site (mean value and standarddeviation in m3/y). HH: households, dt: change in time.
L. Woltersdorf et al.424
Dow
nloa
ded
by [$
{ind
ivid
ualU
ser.d
ispl
ayN
ame}
] at 0
0:21
30
July
201
5
63

the water grid and 2600m3/y through the ephemeral river.
Only 52% (13,000m3/y) of household wastewater can be
collected, treated and reused productively for irrigation.
The irrigation water consists by 32% of reuse water.
12,810m3/y of domestic wastewater with excreta are
discharged untreated to the environment.
5.2.4 Uncertainty analysis
With a probability of 90% the two key variables of the
system are within the following range: the first key
variable “water inflow from outside to the water grid” is in
case 0 between 36,277 and 46,812m3/y, in case 1 between
31,150 and 42,823m3/y and in case 2 between 37,007 and
46,518m3/y. The second key variable, the “water supplied
by the grid to agriculture” is between 20,426 and
26,610m3/y in case 0, between 21.0 and 8392m3/y in
case 1 and between 10,888 and 20,170m3/y in case 2.
The parameters responsible for the bulk uncertainty of
these model results are ranked in Table 4. It shows that out
of the 58 parameters of the system, 12 parameters are
alone responsible for over 84% of the uncertainty of the
modeled result of the two key variables. The uncertainty of
the modeled result of “water inflow from outside to the
water grid” in case 0 mainly depends on three parameters:
number of inhabitants (57%), the irrigation water
requirement and the amount of fresh water used per
inhabitant. These three parameters together make up 95%
of the uncertainty of the modeled result. For case 1 the
most determining parameter for result uncertainty is the
amount of irrigation water requirement (40%) and for case
2 the number of inhabitants (42%). The uncertainty of the
result of “water from grid to agriculture” is in case 0
mostly determined by the amount of irrigation water
(84%) while in case 1 and 3 by the number of inhabitants
(64% and 43%).
For both key water flows, the greatest uncertainty is
caused by parameters concerning the users and particu-
larly the number of users of the sanitation facilities. This is
because the number of users of the sanitation facilities
mainly determine the amount of total household water
consumption, and consequently the amount of water that
can be reused in the system for agriculture, which does not
have to be supplied by the grid. In addition, due to difficult
data estimation, the parameter values for the number of
facility users contain the largest uncertainties with
standard deviations of 18% to 38% and the largest ranges
between the lower and upper boundary. In comparison,
other parameters have a standard deviation of around 10%.
Also the amount of irrigation water requirement has a
Figure 5. Simulation results for case 1: Ideal use of new sanitation and water reuse facility (mean value and standard deviation in m3/y).HH: households, dt: change in time.
Urban Water Journal 425
Dow
nloa
ded
by [$
{ind
ivid
ualU
ser.d
ispl
ayN
ame}
] at 0
0:21
30
July
201
5
64

considerable impact on the results of the two key water
flows.
In order to reduce these uncertainties it will be
important to collect more information on the number of
users and their water consumption through detailed and
repeated surveys. The uncertainty of the share of
wastewater entering the sewer could be reduced by
measuring with water meters the difference between
drinking water consumption and wastewater entering the
sewer. The uncertainty of the amount of crop irrigation
water can hardly be reduced due to high inter-annual
variability of precipitation. Still it is likely that the user
parameters will remain the largest source of uncertainty
for the two key variables, as data concerning the users and
their behavior is more difficult to assess and has larger
uncertainties than measuring technical data does.
5.3 Water productivity
Water flows and water productivity of the system are
summarized in Table 5. The change of water inflow to the
system is equal to the change in water productivity. This is
because water productivity is defined as the ratio of the
mass of agricultural production to the total water input to
the system, and while the amount of agricultural
production is the same in all scenarios, the change in
water inflow to the system directly determines the change
of water productivity. In case 0, with a lack of sanitation
and nearby water supply infrastructure, household
water consumption is the lowest (17,340m3/y). In case
1, although household water consumption is the highest
(32,870m3/y), the amount of water supplied by the grid
can be reduced (by 6600m3/y) to 34,200m3/y compared to
case 0. The reason is that 27,600m3/y (84%) of household
wastewater is treated and reused for agriculture constitut-
ing 85% of the irrigation water. Therefore, water inflow to
the system is reduced and water productivity rises by
þ10% compared to case 0. In case 2, household water
consumption is in between case 0 and case 1, but only 52%
are collected by the sewer and treated. Therefore only 32%
of the irrigation water can be covered with reuse water and
consequently the water inflow to the system is the highest
of all cases and most water still needs to be supplied by the
grid (þ300m3/y compared to case 0). Water inflow to the
system increases and water productivity decreases by
þ7% compared to case 0, because more water is supplied
to the households and only a low share is reused in
agriculture. Without water reuse, households and agricul-
ture together consume 40,700m3/y in case 0, 59,954m3/y
in case 1 and 52,203m3/y in case 2. Introducing the new
Figure 6. Simulation results for case 2: Low utilization and acceptance of new sanitation and water reuse facility (mean value andstandard deviation in m3/y) HH: households, dt: change in time.
L. Woltersdorf et al.426
Dow
nloa
ded
by [$
{ind
ivid
ualU
ser.d
ispl
ayN
ame}
] at 0
0:21
30
July
201
5
65

water infrastructure and reusing the water for irrigation
reduces the water inflow to the system by 239% (from
59,954 to 36,800m3/y) in case 1 and 216% (from 52,203
to 43,700m3/y) in case 2, compared to the assumption that
an improved sanitation infrastructure would be introduced
without re-using the water.
Model results of this study showed that the expected
wastewater available for water reuse is 27,600m3/year in
case 1 and 13,000m3/year in case 2. In comparison to
this, conducting a simple calculation with a fixed per
capita wastewater inflow, assuming only a water
consumption per person of 60 liters/day and 1500
inhabitants in the area where the new water infrastruc-
ture is to be introduced, would result in an expected
overestimated wastewater flow of 32,850m3/year avail-
able for water reuse. This is because the amount of
household wastewater that is available for reuse in
agriculture depends on the behavior of the users of the
sanitation facilities. This could be taken into account
with the proposed methodology in this paper.
In the coming years, these results and the methodology
will need to be validated in the field. Field data needs to be
collected through interviews, survey and field measure-
ments over a longer period of time. Then modelling results
can be calibrated and refined. A more representative result
can be obtained specifically for the model region central-
northern Namibia and the city of Outapi. In addition to the
parameters integrated in the MMFA also further
parameters might affect the quantity of water flows, such
as periods of maintenance when the facility has to be
closed or leaking water pipes. So far, discussions with
local farmers (personal communication Hilengwa 2013)
showed that local yields in small farms are likely to be
higher than indicated by Price Waterhouse Coopers (2005)
and therefore water productivity might be underestimated
in this study.
6. Conclusion
Introducing an improved water supply, sanitation, water
treatment and water reuse infrastructure increases the
water consumption per person. The study showed that
for this reason reusing treated household wastewater for
agriculture does not automatically reduce overall water
consumption by households and agriculture significantly
(by 210% to þ7%) in comparison to before the
introduction of the proposed infrastructure. However, it
saves 16% to 39% of water compared to introducing the
improved water infrastructure without reusing the water
for agriculture.
By using the mathematical material flow analysis the
impact of user behavior on water flows within the
sanitation and water reuse system could be taken into
account. It was found that water productivity increases less
than would be computed assuming a fixed wastewater
inflow. The methodology is transferable to all urban areas
in developing countries characterized by insufficient water
supply and wastewater infrastructure with similar starting
conditions as described for the model city of this paper in
central-northern Namibia. Similar starting conditions
include: informal settlements with water points and public
latrines, inhabitants practicing open defecation, a similar
socio-economic situation with low income and low
education level, a semi-arid climate that requires irrigation
for agriculture, an urban area with only limited agricultural
Table 5. Summary of results with mean variable values.
Case 0 Case 1 Case 2
Agricultural production [kg/y] 124,800Agricultural irrigation water requirement [m3/y] 23,400 27,084Household water consumption [m3/y] 17,340 32,870 25,120Water inflow to the system [m3/y] 40,700 36,800 43,700
- From water grid 40,700 34,200 41,100- From ephemeral river 0 2600 2600
Water treated and reused for agriculture [m3/y] 0% 27,600 13,000People using sanitation facilities [number] 649 1501 1165Share of irrigation water composed oftreated reused water [%]
0% 85% 32%
Untreated water and excreta dischargedto the environment [m3/y]
17,769 6018 12,810
Water productivity of the system [kg/m3] 3.1 3.4 2.9Change of water inflow to the system comparedto case 0 [%] (the value is equal to the changein water productivity)
0 210% 7%
Change of water inflow to the system compared tointroducing improved water infrastructure withoutreusing water for agriculture [%] (the value is equalto the change in water productivity)
0 239% 216%
Urban Water Journal 427
Dow
nloa
ded
by [$
{ind
ivid
ualU
ser.d
ispl
ayN
ame}
] at 0
0:21
30
July
201
5
66

area available, and the possibility to install the sanitation
facilities in proximity of the wastewater treatment plant
and the irrigation site. The methodology can also be
transferred to semi-arid higher income countries, when
adapting the system in the material flow analysis including
the existing type of sanitation facilities and sanitation
behavior. The results of this study are comparable to
other areas with similar conditions to the model region,
with a similar scale of the water infrastructure including
a comparable amount of sanitation users and size of
agricultural area.
The methodology developed and the results of this
study demonstrated that taking socio-cultural aspects into
consideration plays a major role for the quantification of
expected water flows and productivity. The research is
relevant for the future planning and decision making
process before the introduction of a new water supply,
sanitation, water treatment and water reuse infrastructure
in order to quantify water flows and water productivity
more accurately.
Acknowledgements
The authors thank Hans-Peter Bader (Eawag), Jorg Felmeden,Jutta Deffner, Martina Winker (ISOE) and Katharina Muller(TUD) for valuable comments.
FundingThis research is part of the research project “CuveWaters -Integrated Water Research Management in Namibia” by theInstitute for Social-Ecological Research (ISOE) and the Tech-nische Universitat Darmstadt (TUD), funded by the GermanFederal Ministry for Education and Research (BMBF). The sub-project “Sanitation and Water Reuse” is implemented with theOutapi Town Council and the German industry partner RoedigerVacuum.
References
Allen, R., Pereira, L., and Smith, M., 1998. Crop evapotran-spiration - Guidelines for computing crop water require-ments. FAO Irrigation and drainage paper 56. Rome: FAO.
Asano, T., 2007. Water reuse issues, technologies andapplications. New York: McGraw-Hill.
Ayers, R. andWestcot, D.W., 1985.Water quality for agriculture.FAO Irrigation and drainage paper 29. Rome: FAO.
Baccini, P. and Bader, H.-P., 1996. Regionaler Stoffhaushalt:Erfassung, Bewertung und Steuerung. Heidelberg: Spektrum,Akad. Verl.
Bader, H.-P. and Scheidegger, R., 2012. MMFA Framework.Dubendorf: Eawag – Swiss Federal Institute for Environ-mental Science & Technology.
Belevi, H., 2002. Material flow analysis as a strategic planningtool for regional waste water and solid waste management.Department of Water & Sanitation in Developing Countries(SANDEC). Proceedings of GTZ/BMZ and ATV-DVWKworkshop: Globale Zukunft: Kreislaufwirtschaftskonzepte imkommunalen Abwasser- und Faekalienmanagement, 13–15May 2002, Munchen, Germany: GTZ/BMZ, 1–15.
Brouwer, C., Prins, K., and Heilbloem, M., 1989. IrrigationWater Management: Irrigation Scheduling. Training manualno. 4. Rome: FAO.
Chen, Z., Ngo, H.H., and Guo, W., 2012. A critical review onsustainability assessment of recycled water schemes. Scienceof The Total Environment, 426, 13–31.
CuveWaters, 2009. Laboratory results of wastewater qualityanalysis in the evaporation pond in Outapi. Internal workingpaper. Frankfurt am Main: Institut fuer sozial-oekologischeForschung ISOE.
Deffner, J. and Mazambani, C., 2010. Participatory empiricalresearch on water and sanitation demand in central northernNamibia: A method for technology development with a userperspective. CuveWaters Papers 7. Frankfurt am Main:Institute for Social-Ecological Research.
Deffner, J., Reisenauer, S., and Storch, K., 2012. HouseholdInventory Survey (HIS) in three informal settlements inOutapi (Namibia). Frankfurt am Main: Institut fuer sozial-oekologische Forschung ISOE.
Drechsel, P., Scott, C.A., Raschid-Sally, L., Redwood, M., andBahri, A., 2010.Wastewater Irrigation and Health Assessingand Mitigating Risk in Low-Income Countries. London:Earthscan.
Erni, M., Bader, H.-P., Drechsel, P., Scheidegger, R., Zurbrugg,C., and Kipfer, R., 2011. Urban water and nutrient flows inKumasi, Ghana. Urban Water Journal, 8 (3), 135–153.
Gould, J. and Nissen-Petersen, E., 2006. Rainwater CatchmentSystems for domestic supply. Warwickshire: IntermediateTechnology Publications.
Government of Namibia, 2006. Millennium challenge accountNamibia. Windhoek: Government of Namibia.
Hamilton, A.J., Stagnitti, F., Xiong, X., Kreidl, S.L., Benke, K.K.,and Maher, P., 2007. Wastewater Irrigation: The State ofPlay. Vadose Zone Journal, 6 (4), 823.
Heyns, P., 1995. The Namibian perspective on regionalcollaboration in the joint development of internationalwater resources. International Journal of Water ResourcesDevelopment, 11 (4), 467–492.
Hilengwa, E., 2013. Interview on crop scheme for water reusesite in Outapi based on local preferences, yields andrevenues. Interview by P. Rickert, Outapi, Namibia, 20 June2013. Frankfurt am Main: Institut fuer sozial-oekologischeForschung ISOE.
Howard, G. and Bartram, J., 2003. Domestic water quantity,service level and health. Geneva: WHO.
Jimenez, B. and Asano, T., 2008. Water reuse: An internationalsurvey of current practice, issues and needs. London: IWAPublishing.
Kluge, T., Liehr, S., Lux, A., Moser, P., Niemann, S., Umlauf, N.,and Urban, W., 2008. IWRM concept for the Cuvelai Basinin northern Namibia. Physics and Chemistry of the Earth,Parts A/B/C, 33 (1–2), 48–55.
Meinzinger, F., 2010. Resource efficiency of urban sanitationsystems: A Comparative Assessment using Material andenergy flow analysis. Thesis (PhD). Technical University ofHamburg, Harburg.
Meinzinger, F., Kroger, K., and Otterpohl, R., 2009. Materialflow analysis as a tool for sustainable sanitation planning indeveloping countries: case study of Arba Minch, Ethiopia.Water Science & Technology, 59 (10), 1911–1920.
Montangero, A., Ongmongkolkul, A., Sinsupan, T., Cau, L., andKoottatep, T., 2005. Material Flux Analysis (MFA) forenvironmental sanitation planning. An introduction. Bankok:Asian Institute of Technology; Swiss Federal Institute forEnvironmental Science and Technology Eawag.
Muller, K., 2011. Recapitulation of facts on vacuum and gravitysewer systems as a basis for technology selection in Outapi.
L. Woltersdorf et al.428
Dow
nloa
ded
by [$
{ind
ivid
ualU
ser.d
ispl
ayN
ame}
] at 0
0:21
30
July
201
5
67

Internal Report. Darmstadt: Technische Universitat Darm-stadt.
Muller, K., 2012. CuveWaters - Integrated Water ResourcesManagement in the Cuvelai-Etosha Basin (Central-NorthernNamibia): Sub-project: Sanitation and water reuse Darm-stadt: Technische Universitat Darmstadt.
Murray, A. and Ray, I., 2010. Wastewater for agriculture: A re-useoriented planningmodel and its application in semi-arid China.Water Research, 44, 1667–1679.
O’Connor, G.A., Elliott, H.A., and Bastian, R.K., 2008.Degraded water reuse: An overview. Journal of EnvironmentQuality, 37 (5), S157–S168.
Pasqualino, J.C., Meneses, M., and Castells, F., 2011. Life cycleassessment of urban wastewater reclamation and reusealternatives. Journal of Industrial Ecology, 15 (1), 49–63.
Pescod, M.B., 1992. Wastewater treatment and use inagriculture. FAO Irrigation and Drainage Paper 47. Rome:FAO.
Price Waterhouse Coopers, 2005. Irrigation development inNamibia: Green scheme and horticulture initiative forNamibia. Cost-Benefit Analysis.Windhoek: PriceWaterhouseCoopers.
Redelinghuys, M., Norton, G.R., Scott, L., Maseko, M.J.,Brooksbank, R., Majane, O.H.I., Sareli, P., and Woodiwiss,A.J., 2010. Relationship between urinary salt excretion andpulse pressure and central aortic hemodynamics independentof steady state pressure in the general population.Hypertension, 56 (4), 584–590.
Republic of Namibia, 2008. Water supply and sanitation policy.Windhoek: Ministry of Agriculture, Water and Forestry.
Rohrig, J., 2011. Map of CuveWaters implementation sites. Datasource of cartography: NNEP and EEP, MET (2000).Frankfurt am Main: Institut fuer sozial-oekologischeForschung ISOE.
Sadras, V., Grassini, P., and Steduto, P., 2011. Status of water useefficiency of main crops: SOLAW Background ThematicReport - TR07. Rome: Food and Agricultural Organization.
Savva, A. and Frenken, K., 2002. Crop Water Requirements and
Irrigation Scheduling. FAO Irrigation Manual Module 4.
Rome: FAO.Scheierling, S., Bartone, C., Mara, D., and Drechsel, P., 2010.
Improving wastewater use in agriculture: An emerging
priority. Policy Research Working Paper 5412. Washington,
DC: The World Bank Group.Smit, J., Ratta, A., and Nasr, J., 1996. Urban agriculture: Food,
jobs, and sustainable cities. New York: United Nations
Development Programme (UNDP).
Souci, S., Fachmann, W., Kraut, H., and Kirchhoff, E., 2008.Food composition and nutrition tables. On behalf of the
Bundesministerium fur Ernahrung, Landwirtschaft und
Verbraucherschutz. Boca Raton, FL: MedPharm Scientific
Publishers, CRC Press.
UNWater, FAO, 2007. Coping with water scarcity: Challenge ofthe 21st century. Rome: UN Water and FAO.
van Veenhuizen, R., ed., 2006. Cities farming for the future,
urban agriculture for green and productive cities. Ottawa:
RUAF Foundation, International Development ResearchCentre and International Institute of Rural Reconstruction
and ETC Urban Agriculture.
WHO, 2006. WHO Guidelines for the safe use of wastewater,
excreta and greywater: Volume II Wastewater use in
agriculture. Geneva: WHO.Woltersdorf, L., Liehr, S., and Doll, P., 2013. Rainwater
harvesting for small-holder horticulture in semi-arid regions:
Design of garden variants and assessment of climate change
impacts and adaptation. Water and Environment Journal,submitted.
WWAP (World Water Assessment Programme), 2012. The
United Nations world water development report 4: Mana-
ging water under uncertainty and risk. Paris: UNESCO.Zaidi, M.K., 2007. Wastewater reuse-risk assessment, decision-
making and environmental security. Dordrecht: Springer.
Urban Water Journal 429
Dow
nloa
ded
by [$
{ind
ivid
ualU
ser.d
ispl
ayN
ame}
] at 0
0:21
30
July
201
5
68

CORRIGENDUM
Small-scale water reuse for urban agriculture in Namibia: Modeling water flows andproductivity
L. Woltersdorf*, S. Liehr, R. Scheidegger and P. Doll
Urban Water Journal
When the above article was first published online, Table 3 was incorrectly amended at the revision stage. The table below is
the correct version.
Taylor & Francis apologises for this error.
q 2014 Taylor & Francis
Pathogen reduction (log units)
Viruses Bacteria Protozoan (oo)cysts Helminth eggs
Primary sedimentation (primary treatment) 0 to 1 0 to 1 0 to 1 0 to 1UASB anaerobe treatment 0 to 1 0.5 to 1,5 0 to 1 0.5 to 1Aerobe treatment (secondary treatment) 1 to 2 1 to 2 0 to 1 1 to 3Microsieve 0 0 data missingUltraviolet-radiation (disinfection) 1 to .3 2 to .4 .3 0Storage pond (water reuse site) 1 to 2 1 to 2 0 to 1 1 to 3Three day interval between final irrigation and consumption 1.5 to 6Drip irrigation and low growing crops 2SUM 6.5 to .17 8 to .18.5 6.5 to .15 6 to 16
Urban Water Journal, 2014
http://dx.doi.org/10.1080/1573062X.2014.938295
Dow
nloa
ded
by [4
1.22
8.40
.0] a
t 17:
26 2
5 Ju
ly 2
014
69

Research article
Municipal water reuse for urban agriculture in Namibia: Modelingnutrient and salt flows as impacted by sanitation user behavior
L. Woltersdorf a, *, R. Scheidegger b, S. Liehr a, P. D€oll c
a Institute for Social-Ecological Research ISOE, Hamburger Allee 45, 60486, Frankfurt, Germanyb Eawag, Swiss Federal Institute of Aquatic Science and Technology, Ueberlandstrasse 133, 8600, Duebendorf, Switzerlandc Institute of Physical Geography, Goethe University Frankfurt, Altenh€oferallee 1, 60438, Frankfurt, Germany
a r t i c l e i n f o
Article history:Received 29 June 2015Received in revised form15 October 2015Accepted 16 December 2015Available online xxx
Keywords:Water reuseNutrientsSaltsAgricultureSanitationMaterial flow analysis
a b s t r a c t
Adequate sanitation, wastewater treatment and irrigation infrastructure often lacks in urban areas ofdeveloping countries. While treated, nutrient-rich reuse water is a precious resource for crop productionin dry regions, excessive salinity might harm the crops. The aim of this study was to quantify, from asystem perspective, the nutrient and salt flows a new infrastructure connecting water supply, sanitation,wastewater treatment and nutrient-rich water reuse for the irrigation of agriculture, from a systemperspective. For this, we developed and applied a quantitative assessment method to understand thebenefits and to support the management of the new water infrastructure in an urban area in semi-aridNamibia. The nutrient and salt flows, as affected by sanitation user behavior, were quantified bymathematical material flow analysis that accounts for the low availability of suitable and certain data indeveloping countries, by including data ranges and by assessing the effects of different assumptions incases. Also the nutrient and leaching requirements of a crop scheme were calculated. We found that, withideal sanitation use, 100% of nutrients and salts are reclaimed and the slightly saline reuse water issufficient to fertigate 10 m2/cap/yr (90% uncertainty interval 7e12 m2/cap/yr). However, only 50% of theP contained in human excreta could be finally used for crop nutrition. During the pilot phase fewersanitation users than expected used slightly more water per capita, used the toilets less frequently andpracticed open defecation more frequently. Therefore, it was only possible to reclaim about 85% of nu-trients from human excreta, the reuse water was non-saline and contained less nutrient so that the P wasthe limiting factor for crop fertigation. To reclaim all nutrients from human excreta and fertigate a largeragricultural area, sanitation user behavior needs to be improved. The results and the methodology of thisstudy can be generalized and used worldwide in other semi-arid regions requiring irrigation for agri-culture as well as urban areas in developing countries with inadequate sanitation infrastructure.
© 2015 Elsevier Ltd. All rights reserved.
1. Introduction
In developing countries urban agriculture provides fresh food,employment and income as well as greens cities and recycleswastes (van Veenhuizen, 2006). In 1996, urban agriculture involved800 million urban residents worldwide (Smit et al., 1996) and thisnumber has steadily increased over the last twenty years (vanVeenhuizen, 2006). Like all farmers, urban farmers need sufficientfertilizer and, especially in dry areas of the globe, they need waterthat allows irrigationwithout producing soil salinization. Fertilizers
contain nitrogen, phosphorus, potassium, magnesium or calcium(Barker and Pilbeam, 2007). Between 1950 and 2000, global use ofsynthetic fertilizers increased by 600% (IFA, 2006). However, pro-duction of synthetic nitrogen fertilizer is particularly energyintensive, and phosphorous and potassium have to be derived fromfinite and non-renewable resources of phosphate rock and potash.Applications of nitrogen and phosphorous in excess of what can betaken up by crops cause environmental pollution (UNEP, 2011).While world reserves appear adequate for the foreseeable future,fertilizer costs will probably rise as the most easily extracted ma-terials are consumed (Fixen and Johnston, 2012). Already today,high costs and low accessibility prevent many farmers in Sub-Saharan Africa from acquiring fertilizer (UNEP, 2011). However,only small amounts of nutrients are recovered from waste and* Corresponding author.
E-mail address: [email protected] (L. Woltersdorf).
Contents lists available at ScienceDirect
Journal of Environmental Management
journal homepage: www.elsevier .com/locate/ jenvman
http://dx.doi.org/10.1016/j.jenvman.2015.12.0250301-4797/© 2015 Elsevier Ltd. All rights reserved.
Journal of Environmental Management 169 (2016) 272e284
70

recycled even though this would reduce environmental pressuresand increase long-term resource supply. Soil salinization, theaccumulation of salts from irrigation water, affects approximately10% of the world's irrigated lands (WWAP, 2012). Excess salinitywithin the plant root zone reduces plant transpiration and growthbecause it increases the energy that must be expended to acquirewater from the soil and to make the biochemical adjustmentsnecessary to survive under stress. This effect is primarily related tototal electrolyte concentration and is largely independent of itsspecific composition (Rhoades et al., 1992). Major ions making upsalinity are sodium, calcium, magnesium, potassium, chloride andnitrate (Tanji and Kielen, 2002).
An advantage of urban agriculture is that sufficient municipalwastewater can be collected and treated to produce nutrient-richirrigation water (Woltersdorf et al., 2015). Currently, treated oruntreated water is used for an estimated 10% of the irrigatedcrops (Jim�enez and Asano, 2008). Treated wastewater is exten-sively used for irrigation in semi-arid high-income countriessuch as USA (California), Israel and Spain. Nutrients are either(partly) removed or retained, depending on the treatment tech-nology and the amount of nutrients desired in the irrigationwater. For the desalinization of treated wastewater, most oftenmembrane filtration with reverse osmosis is used. However, thisprocess requires a lot of energy and also removes all nutrients.Processes for desalinization without removing nutrients areincreasingly being researched (Norton-Brand~ao et al., 2013). Thesalinity and nutrient levels that can be accepted in reuse waterfor irrigation depend on soil type, climate, crops and irrigationand drainage techniques. Middle income countries such asMexico, Chile, and Egypt use both treated and untreated waste-water, indicating that they are in transition between unplannedand uncontrolled reuse to planned and controlled reuse(Scheierling et al., 2010). In low income countries, such as in Sub-Saharan Africa, highly polluted water from surface-water bodiesis reused for irrigation, predominantly unintentionally. In thesecountries, and in spite of its potential, municipal wastewater hasnot yet been widely collected, treated and reused for fertigationof crops (combined application of nutrients and water) due to alack of appropriate water and sanitation infrastructure(Scheierling et al., 2010). Nevertheless, pilot projects exist such asin Burkina Faso, where treated water has been used on a verysmall scale (6 m3/d water, 15 m2 garden) for fertigation(Akponikp�e et al., 2011).
Previous studies have shown that failure to carefully manageexisting water reuse schemes adversely affect soils, groundwaterand crops. Accumulation of salinity is frequently the single mostimportant criterion determining the suitability of reuse water foragricultural irrigation (Bedbabis et al., 2014; Biggs and Jiang,2009). Thus keeping the electrical conductivity below levelstolerable for crops is essential for long-term successful irrigationwith wastewater (O'Connor et al., 2008; Devitt et al., 2007). Nu-trients in reuse water exceeding crop requirements can pollutesoil water, soil and air and reduce yield, crop maturation, and thedisease resistance of plants (Tanji and Kielen, 2002; Pablo et al.,2013). The challenge is to find ways of reusing treated nutrient-rich water efficiently for agricultural irrigation while minimizingthe risk of soil salinization and over fertilization. Therefore duringthe design and implementation phase a systematic assessment isnecessary.
The aim of this study was to quantify from a system perspectivethe nutrient and salt flows of an innovative infrastructure con-necting water supply, sanitation, wastewater treatment andnutrient-rich water reuse for the irrigation in urban agriculture(Henceforth, Water-Sanitation-Treatment-Irrigation (WSTI)
infrastructure). For this, we used a case study in northern Namibiafor which we have already quantified water flows and crop pro-ductivity (Woltersdorf et al., 2015), while we focus on the nutrientsand salts here.
2. Sanitation and water reuse concept
During the CuveWaters project (CuveWaters, 2013), the inno-vative WSTI infrastructure was implemented in the outskirts ofOutapi in central-northern Namibia. The low-density, partlyinformal settlements have poor water supply and poor sanitationtypical of urban areas in low income countries (Deffner et al., 2012).The region is semi-arid and water scarce (Woltersdorf et al., 2015).Water is supplied by a pipeline from the Kunene river on theAngolan-Namibian border. Currently, the town plans to establishextensive new agricultural areas with irrigation of piped water andwith use of mineral fertilizer. Population growth, further urbani-zation, the expected effects of climate change are likely to increasethe pressure on water resources (Deffner and Mazambani, 2010).The town council and the CuveWaters project estimated the fourproject settlements to have about 1500 inhabitants (Müller et al.,2013). Few of the residents have access to latrines and most defe-cate in the open (Deffner et al., 2012). In the four project settle-ments, three types of water supply and sanitation units wereconstructed: In an older partially dense suburb (Onhimbu) and anew informal suburb (Okaikongwe) a communal washhouse con-tains toilets, showers and sinks for laundry and dish washing. In anew informal suburb (Tobias Hainyeko) thirty small cluster wash-houses are each shared by four households. In a formalized suburbwith brick houses (Shack Dwellers), households were individuallyconnected to water supply and sewage. Even though water supplyand sanitation tariffs are in general affordable for the local in-habitants, the tariffs are expected to affect user behavior. In-habitants can still use the previously existing fee-based waterpoints and free latrines, which may lower the amount of waste-water that can be collected and treated. Even with ideal sanitationuse, not all wastewater can be collected by the sewer, as a certainshare is used for e.g. watering the garden, cooking or cleaning thehouse.
The wastewater is treated nearby with combined anaerobic(UASB), aerobic (RBC), micro strainer and disinfection (UV-light).The treatment removes 22% of the nitrogen, 18% of the phosphorusand none of the potassium (Müller et al., 2013). Salts are notremoved because of high investment and energy costs as well asthe intention to produce nutrient-rich reuse water. After treatmentthe hygienically safe and nutrient-rich water is reused for fertiga-tion of 1.5 ha growing human food crops. To minimize evaporationand, consequently, soil salinization, the fertigation is by drip irri-gation. The leaching water is collected with sub-surface drainage inan evaporation pond to prevent the salty water to rise and causeroot zone salinization. The constructed evaporation pond is un-lined, however in our modeling and analysis, we assume a linedpond that prevents groundwater contamination with nutrients,salts and other agro-pollutants. The agricultural site is equippedwith a storage pond for treated water. In addition to the infra-structure already in place, we also consider the possibility ofpumping water (up to 2600 m3/yr) from a nearby ephemeral riverin the rainy season and store it together with the reuse water in astorage pond. The soil of the root zone of the irrigation site (downto 30 cm) is a medium textured sandy loam with a medium infil-tration capacity, very little organic matter, low nutrient content, apH of 5.5e7.0 and medium salinity (EC 1.04 dS/m) (Reichenbach,2013).
L. Woltersdorf et al. / Journal of Environmental Management 169 (2016) 272e284 273
71

3. Methods
3.1. Mathematical material flow analysis (MMFA)
The MMFA comprised the following steps (see Bader andScheidegger, 2012):
(1) Choice of indicators for nutrient content and salinity
The most important plant nutrients are nitrogen (N), phospho-rous (P) and potassium (K) (Barker and Pilbeam, 2007). This studyquantified the mass of total N, P, and K as indicators and dids notconsider speciation or transformation processes. In feces, waste-water and soils, nutrients can be present in various compounds(J€onsson et al., 2004a,b). In urine they are excreted inwater-solubleform. Over 90% of N and P in urine is in the form of urea(H2NeCOeNH2), ammonium ðNH4
þÞ or phosphate ðPO43�Þ, while
all of the K occurs as the cation Kþ (Lentner, 1981). Feces containboth water-soluble nutrients and nutrients combined in particlesnot soluble in water. P is mostly found as calcium phosphate. Bymicrobiological degradation, the organic N and P content dissolvesand becomes available to plants. Urea is degraded within hours toNH4
þ by microbial urease, normally present in urban piping sys-tems. NH4
þ, if applied to arable soils, is transformed by aerobicmicrobes to nitrite ðNO2
�Þ and then to nitrate ðNO3�Þ, normally
within a few days. The transformation takes longer in soils withvery low microbial activity (or lack of oxygen). Under reducingconditions, dissolved nitrate can be denitrified to the gases nitrousoxide (N2O) or molecular nitrogen. NO3
� is transported with thesoil water, while NH4
þ can also be adsorbed to clay particles. P haslower mobility and may exist in the particulate phase as mineralPO4
3� with Fe3þ, Ca2þ or Al3þ counter ions or as organic P bound inplant matter rather than as PO4
3� ions in solution. Kþ is highlysoluble in water and also in soils. Plants take up N mainly as NO3
�,but also as NH4
þ and urea, P as PO43�, K as Kþ (Ongley, 1996;
J€onsson et al., 2004a,b).As indicators for the salinity of water and soils, we chose sodium
(Naþ), calcium (Ca2þ) and magnesium (Mg2þ) (after Blume et al.,2010). The anions were not quantified since they are present ascounter ions to Naþ, Ca2þ and Mg2þ and are more difficult toquantify due to their composition. Naþ is much more soluble thanCa2þ while Mg2þ ranges from highly soluble to sparingly soluble(Tanji and Kielen, 2002). Ca2þ and Mg2þ are also essential cropnutrients, while NO3�, Kþ and PO4
3� are also responsible for soilandwater salinity (Blume et al., 2010).We use henceforth the termsN, P, K, Na, Ca, and Mg to designate the total quantities of theseelements. In addition, in order to compare the salinity of the irri-gation water to crop tolerances, we also measured the electricalconductivity of the irrigationwater which is largely independent ofthe specific composition of solutes (Rhoades et al., 1992).
(2) System representation and mathematical model
Flows were modeled with MMFA using the software SIMBOX(Bader and Scheidegger, 2012). The nutrients and salts are dissolvedin water and thus correlated with the water flows that were pre-sented in Woltersdorf et al. (2015). We defined the temporal andspatial boundaries, the flows, processes, balances and in-terrelationships within and of the system. The system spatiallycomprised the four settlements and the WSTI infrastructure inOutapi. The nutrient and salt flows (represented by arrows in Fig. 1)among compartments (boxes in Fig. 1) of the systemwere averagedover 1 year at steady-state. Only flows and boxes with flows above1 kg/yr were indicated with a maximum of three significant digits.For each flow a variable was formulated and mathematically
expressed as system equation. There are 50 flows for each of the sixsubstances and 49 water flows, adding up to 349 variables. Thesevariables are characterized by 50 parameters that describe oursystem knowledge. For instance, the variable Nex “N excreted fromindividual household connections to the environment per year” ischaracterized by the three parameters (a) number of inhabitantsdesignated to use individual household connections, (b) amount ofN excreted daily in urine and feces and (c) ratio of inhabitantsdefecating in the open to those designated as using individualhousehold connections. The equation was thereforeNex ¼ a * b * 365 days * c. Open defecation was determined as“Excretion from households to the environment” (Fig. 1). The con-tent of the pit latrines was assumed to flow eventually to theenvironment. Precipitation is not shown in Fig. 1, as it only has animpact on the water balance, not on nutrient and salt flows.
Detergents for laundry, personal hygiene or cleaning are negli-gible inputs in the settlements and were not considered. N is notemitted to the atmosphere during the treatment process. Irrigationwater is supplied with first priority from the wastewater treatmentplant, secondly from the ephemeral river and thirdly from thewater grid. The size of the agricultural area was not optimum forthe quantity of nutrients and reuse water available, because thelocal authority assigned a limited area of 1.5 ha for urban agricul-ture. The amounts of substances contained in the upper 100 cm ofthe soil i.e. from the surface to the drainage pipes, were included inthe MMFA as material stock in the box “agriculture”.
(3) Data collection and calibration
Input data for the parameters were drawn from primary andsecondary sources including publications, modeling software, es-timations, balancing, expert opinion, plausible reasoning and localsoil and water analyses. We combined these data to produce bestestimates for the parameters used. The model was calibrated byintegrating empirical data and measurements as explained inSection 4.
(4) Designing three cases
We designed three cases simulating the situation (Table 1): Theconventional situationwithoutWSTI andwith a new crop irrigationsite (caseconv), with WSTI and the best available data during theplanning stage assuming exclusive use of new sanitation units(caseideal), and the pilot phase of the WSTI with available data after10 months of operation (caseassess). For comparability, all casescomprise the same agricultural crop scheme, production and irri-gation requirement. They have different leaching requirements, asthis depends on the concentration of ions dissolved in the water.Inhabitants of the three settlements have the option to use the newsanitation units or the preexisting latrines and the public waterpoints connected to the water grid. Residents not at home duringthe day and those using sanitation units in other parts of the townconnected to the old wastewater system were assumed in themodel to use the latrines. Data for the cases are described in Section4.
(5) Simulation, uncertainty analysis and parameter uncertaintyranking
For each parameter, the type of probability density distributionwas set together with its value for the mean, standard deviation,minimum andmaximum. Depending on the available knowledge ofa specific parameter, we assigned either a uniform, normal, trun-cated normal or lognormal probability density distribution. If novalue could be identified for the standard deviation, we assumed a
L. Woltersdorf et al. / Journal of Environmental Management 169 (2016) 272e284274
72
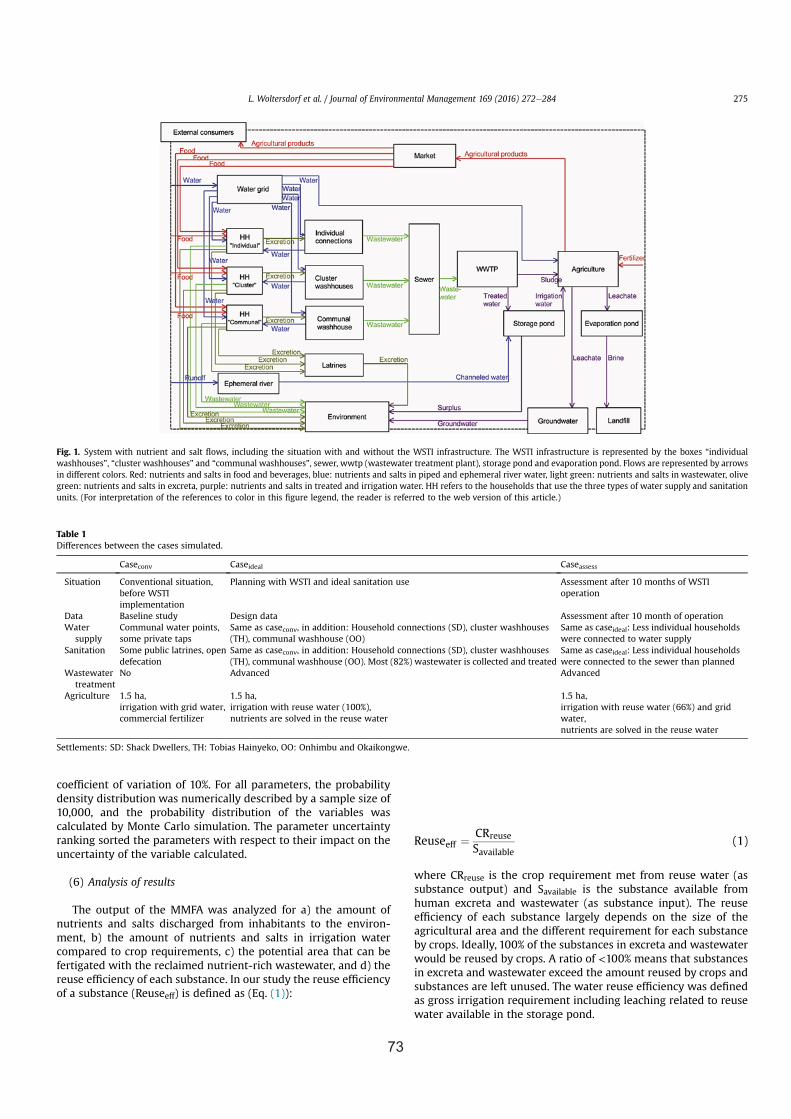
coefficient of variation of 10%. For all parameters, the probabilitydensity distribution was numerically described by a sample size of10,000, and the probability distribution of the variables wascalculated by Monte Carlo simulation. The parameter uncertaintyranking sorted the parameters with respect to their impact on theuncertainty of the variable calculated.
(6) Analysis of results
The output of the MMFA was analyzed for a) the amount ofnutrients and salts discharged from inhabitants to the environ-ment, b) the amount of nutrients and salts in irrigation watercompared to crop requirements, c) the potential area that can befertigated with the reclaimed nutrient-rich wastewater, and d) thereuse efficiency of each substance. In our study the reuse efficiencyof a substance (Reuseeff) is defined as (Eq. (1)):
Reuseeff ¼CRreuse
Savailable(1)
where CRreuse is the crop requirement met from reuse water (assubstance output) and Savailable is the substance available fromhuman excreta and wastewater (as substance input). The reuseefficiency of each substance largely depends on the size of theagricultural area and the different requirement for each substanceby crops. Ideally, 100% of the substances in excreta and wastewaterwould be reused by crops. A ratio of <100% means that substancesin excreta and wastewater exceed the amount reused by crops andsubstances are left unused. The water reuse efficiency was definedas gross irrigation requirement including leaching related to reusewater available in the storage pond.
Fig. 1. System with nutrient and salt flows, including the situation with and without the WSTI infrastructure. The WSTI infrastructure is represented by the boxes “individualwashhouses”, “cluster washhouses” and “communal washhouses”, sewer, wwtp (wastewater treatment plant), storage pond and evaporation pond. Flows are represented by arrowsin different colors. Red: nutrients and salts in food and beverages, blue: nutrients and salts in piped and ephemeral river water, light green: nutrients and salts in wastewater, olivegreen: nutrients and salts in excreta, purple: nutrients and salts in treated and irrigation water. HH refers to the households that use the three types of water supply and sanitationunits. (For interpretation of the references to color in this figure legend, the reader is referred to the web version of this article.)
Table 1Differences between the cases simulated.
Caseconv Caseideal Caseassess
Situation Conventional situation,before WSTIimplementation
Planning with WSTI and ideal sanitation use Assessment after 10 months of WSTIoperation
Data Baseline study Design data Assessment after 10 month of operationWater
supplyCommunal water points,some private taps
Same as caseconv, in addition: Household connections (SD), cluster washhouses(TH), communal washhouse (OO)
Same as caseideal: Less individual householdswere connected to water supply
Sanitation Some public latrines, opendefecation
Same as caseconv, in addition: Household connections (SD), cluster washhouses(TH), communal washhouse (OO). Most (82%) wastewater is collected and treated
Same as caseideal: Less individual householdswere connected to the sewer than planned
Wastewatertreatment
No Advanced Advanced
Agriculture 1.5 ha,irrigation with grid water,commercial fertilizer
1.5 ha,irrigation with reuse water (100%),nutrients are solved in the reuse water
1.5 ha,irrigation with reuse water (66%) and gridwater,nutrients are solved in the reuse water
Settlements: SD: Shack Dwellers, TH: Tobias Hainyeko, OO: Onhimbu and Okaikongwe.
L. Woltersdorf et al. / Journal of Environmental Management 169 (2016) 272e284 275
73

3.2. Leaching requirement for agriculture
The leaching requirement (LR) is the amount of water necessaryto remove salts that have accumulated from the irrigation water asa result of evapotranspiration (Pescod, 1992). The LR was calculatedfor different irrigation water salinities and shows how the leachingrequirement would vary depending on the electrical conductivity(EC) of the irrigation water. LR [mm] was calculated for localizedirrigation according to Eq. (2) (Savva and Frenken, 2002):
LR ¼ ETC�1�
�ECw
2MaxECe$1Le
��� ETC (2)
where ETc is the crop evapotranspiration [mm] computed withCROPWAT 8.0 (Woltersdorf et al., 2015), ECw is the electrical con-ductivity [dS/m] of the irrigation water, MaxECe is the maximumtolerable electrical conductivity of the soil saturation extract [dS/m]for each crop (from Savva and Frenken, 2002) and Le is the leachingefficiency [decimal]. Given amedium infiltration capacity of the soil(Reichenbach, 2013), a medium leaching efficiency (0.5) for sandyloam was chosen. For the model calculations, we assumed thatthere is no accumulation of substances in the soil because leachingis adequate. We also assumed that for the case without WSTI, thefertilizer application necessary exactly equals crop requirementsand we did not consider inefficiencies in crop uptake of nutrients.
4. Data
The data used for the modeling is presented below.
4.1. Human excretion of the six substances in Namibia
The amount of the six substances in excreta roughly equalsintake of adults (NHMRC, 2006). Therefore, due to lack of morespecific information, we assumed that the amounts in food intakeand excreta are equal. The amounts of the six substances in dietaryintake and human excretion for Namibia are given in Table 2. Weapplied standard equations to calculate N, P and K excretion fromdietary protein intake (J€onsson et al., 2004a,b). The estimatesproduced in our study depend strongly on the type of databaseused.
4.2. Nutrient and leaching requirement of agriculture
Weused an existing crop scheme for unrestricted irrigationwithtreated and nutrient-rich municipal water (Woltersdorf et al.,2015). The crops were chosen based on health protection, localpractices, preferences and market revenues, salt tolerance andnutrient requirements. Given a soil salinity of 1 dS/m (Reichenbach,2013) only moderately salt-sensitive crops should be cultivatedaccording to FAO (Ayers and Westcot, 1985) to achieve full yieldpotential. Salt sensitive crops were therefore excluded from thecrop scheme. Given the very low nutrient content of the soil, the
nutrient requirement of crops was assumed to be at the upper endof the range provided by FAO (Doorenbos, 1979) (see Supplement,Table S1). The crops chosen have relatively similar nutrient re-quirements except for maize which requires higher quantities of Nand P than the other crops (Doorenbos, 1979) and which cantherefore profit most from the nutrient-rich irrigation water.Therefore, 0.5 ha of the available 1.5 ha was planted with maize.
4.3. Empirical data of soil, water and sanitation users
Before construction of the WSTI infrastructure, one sample ofgrid water and one sample of sewage water was analyzed (Müller,2009) from an existing oxidation pond in Outapi that received ur-banwastewater. These data were used to characterize grid water incases 0 and 1, and the EC of reusewater in caseideal. Also one sampleof the close-by ephemeral river water was analyzed (CuveWaters,2011). The households in the settlements were surveyed in 2012in order to determine their sanitation habits (Deffner et al., 2012).The soil at the agriculture site was analyzed before irrigation withreuse water (Reichenbach, 2013).
The WSTI infrastructure started its operation step-wise in May2013. After 10 month of WSTI infrastructure operation, watersamples were taken from the WSTI in March and April 2014. Watersamples were taken at the inlet of the wastewater treatment plant,of the treated water, the storage pond, the washhouse, as well asselected cluster washhouses and individual household connections.For model calibration only the data from samples of the treatedwater were used (Table 3), as the data of the other sample pointsdid not exactly match due to the delays caused by water transportwithin the WSTI. Müller (2014) analyzed the EC of the watersamples during this period (Table 3) and recorded the water flowsduring March 2014. We then calculated the annual inflow to thewastewater treatment plant (15,955 m3/yr), the water use in thecommunal washhouse (7846 m3/yr) and in the cluster washhouses(6776 m3/yr). The difference was attributed to the individualhousehold connections (1333 m3/yr). Deffner and Kramm (2014)surveyed washhouse and cluster washhouses users regardingtheir sanitation and water use habits and the frequency with whichthey used the washhouse and the cluster washhouses.
4.4. Cases
The three cases differ in the use of sanitation units and numberof users as shown by parameter variations in Table 4. Differences inEC of the irrigation water is shown in Table 5. All other parameterinputs are the same for all cases.
In caseassess, the parameters shown in Table 4 were calibrated asfollows: (1) The wastewater inflow to the wastewater treatmentplant (15,955 m3/yr) which is equal to the amount of treated waterwas newly estimated (see Section 4.3). (2) The concentration ofsubstances measured in the treated water (Table 3) was multipliedby the amount of treated water to give the annual loads of sub-stances in treated water. However, the relation between nutrientsmeasured did not exactly match the one expected from
Table 2Daily per-capita human excretion of the substances N, P, K, Na, Ca and Mg in Namibia assumed in this study.
Substance Quantity in human excreta [g/p/d] Source
N 7.9 Dietary protein intake: FAO 2014 data Namibia 2011; Substance excreted from protein intake: J€onsson et al., 2004a,bP 1.1K 2.4 Urine measurements: Charlton et al., 2005, data South Africa, black; Share in urine: Schmidt et al., 2011Na 3.3Ca 0.2Mg 1.7
L. Woltersdorf et al. / Journal of Environmental Management 169 (2016) 272e284276
74

calculations. In particular the water samples contained more Naand Ca and much less N in relation to each other. Therefore theparameters were calibrated with the measured concentration of Kand P in treated water, the two substances in the middle. The ratioamong the substances contained in excreta indicated by literaturein Table 2 was left unchanged. The other substances were thenadjusted using these per capita excretion values. (3) The parametervalues concerning the number of sanitation users, water use percapita, fresh water use, use of latrines and the existing water gridand open defecation were calibrated to match a) the newly esti-mated annual loads of substances in treated water, b) the results of
the survey (Deffner and Kramm, 2014) of the number of users of thecluster washhouses and the washhouse, their water use per capitaand the frequency they use the toilets, showers and washing sinksof the sanitation units, and c) the information provided by theOutapi Town Council that 17 households were individually con-nected to the wastewater treatment plant. (4) This resulted in 588sanitation users, aweighted average for water use per capita of 97 l/cap/d, a slightly higher share of wastewater collected by the sewer(0.9), and more users practicing open defecation (0.18), using thelatrines (0.2) and the existing water grid (0.14).
Table 3Water sample analysis (our samples were analyzed by Namwater Ltd., water was sampled and EC measured by Müller (2014))
Point ofsample
Date n Type Mean quantitiy of substances [mg/l] and analysesmethods/standards
n Type meanEC [mS/cm ], analysismethod/ standard
Ntot Ptot K+ Na+ Ca2+ Mg2+
Treatedwater
Sat 29-03-2014,Mon 31-03-2014
2 9h00-17h00mean,8h00- 18h00mean
33 6.7 16 39 35 17 2 0h00-23h59mean,18h00-23h59mean
446Photo-meter,ISO 11905-01
Photo- meter,4500E
Inductively coupled plasma,3120B(APHA et al., 1992)
Multi 1970i, ECelectrode: TetraCon325, WTW
Table 4Case differences indicated by different parameter values. In caseassess parameters have been adjusted duringmodel calibration. Themean parameter value is shown. Parametersfor each type of sanitation unit are indicated, the weighted average for all sanitation units is printed in bold.
Parameter Unit Caseconv Caseideal Caseassess Source
Number of sanitation users (total) capita 1501 1501 588 Caseconv, Caseideal: Project estimationCaseassess: Own estimation based on Deffner and Kramm 2014Household connections 264 264 68
Cluster washhouse 840 840 260Communal washhouse 397 397 260Fresh water use (weighted mean) l/p/d 32 60 97 Caseconv: Own estimation based on CuveWaters, 2008.
Caseideal: Project estimation based on CuveWaters, 2008 and WHO (Howardand Bartram, 2003).Caseassess: Own estimation based on Deffner and Kramm 2014
Household connections 33 60 70Cluster washhouse 34 60 100Communal washhouse 26 60 100Share of wastewater collected by sewer (weighted
mean)decimal 0.00 0.80 0.90 Caseconv, Caseideal: Own estimation based on discussion with Deffner.
Caseassess: Own estimation based on Deffner and Kramm 2014Household connections 0.00 0.90 0.90Cluster washhouse 0.00 0.80 0.90Communal washhouse 0.00 0.80 0.90Ratio of users practicing open defecation
(weighted mean)decimal 0.57 0.00 0.18 Caseconv: Deffner et al., 2012.
Caseideal: Own estimation based on discussion with Deffner.Caseassess: Own estimation based on Deffner and Kramm 2014Household connections 0.64 0.00 0.00
Cluster washhouse 0.56 0.00 0.10Communal washhouse 0.54 0.00 0.30Ratio of users using the existing latrines
(weighted mean)decimal 0.43 0.00 0.20
Household connections 0.36 0.00 0.20Cluster washhouse 0.44 0.00 0.20Communal washhouse 0.47 0.00 0.20Ratio of users using the existing water grid
(weighted mean)decimal 1.00 0.00 0.14
Household connections 1.00 0.00 0.10Cluster washhouse 1.00 0.00 0.20Communal washhouse 1.00 0.00 0.10
Table 5Leaching requirement (LR) and leaching fraction (LF) depending on the type of irrigation water used with different salinity level.
Caseconv Caseideal Caseassess
Type of water used for irrigation grid water reuse water reuse and grid waterEC [dS/m] 0.075 0.902 0.446
(Müller, 2009) (Müller, 2009) (Müller, 2014)Classification and suitability according to FAO (Rhoades et al., 1992) non saline, drinking and irrigation slightly saline, irrigation non saline, drinking and irrigationLR [m3/y/ha] 114 1504 707LF [% of gross irrigation requirement] 1% 12% 5%
L. Woltersdorf et al. / Journal of Environmental Management 169 (2016) 272e284 277
75

5. Results and discussion
5.1. Leaching for agriculture
The leaching requirement and fraction (Table 5) are lowestwhen irrigating with non-saline grid water (caseconv), about 1% ofgross irrigation requirement. The reuse water assuming idealsanitation use is slightly saline and requires about 13-times morewater for leaching (12% of gross irrigation requirement). In case-assess, with fewer people using toilets and using them lessfrequently, the reuse water is non-saline and requires only half theleaching water required in caseideal. Calculating the irrigationrequirement of the crop pattern for 1.5 ha (after Woltersdorf et al.,2015), the net irrigation requirement without leaching is19,589 m3/yr for all cases. Adding the different leaching re-quirements (Table 5) and dividing by an irrigation efficiency of 0.9,the gross irrigation requirement is 21,956 m3/yr in caseconv,24,273 m3/yr in caseideal, and 22,944 m3/yr in caseassess.
Previous studies (Ben-Hur, 2004; Ayers andWestcot, 1985) evensuggest that an annual rainfall of about 500 mmmight be sufficientto leach excess salts in the soil below the root zone during the rainyseason, in particular when the rainy season is concentrated in 3e4months as it is in central-northern Namibia. The sodium adsorptionratio (SAR) indicating potential problems with infiltration or spe-cific ion toxicity was calculated according to FAO (Ayers andWestcot, 1985) to be slight to moderate (2.7) in caseideal and low(1.5) in caseassess. Therefore, no problems with soil salinization,infiltration or ion toxicity are expected.
5.2. MMFA: quantification of nutrient and salt flows
Results are first presented and discussed for the single cases.Then the system flows are compared and, finally, the two mostimportant flows of the system are analyzed.
5.2.1. CaseconvWithout WSTI, the inhabitants take their water from the water
grid via communal water points and some private taps. Of the in-habitants 57% practiced open defecation and the rest use the publiclatrines (Table 4). As indicated by the main flow of substances(Fig. 2a), as there is no sewer, all wastewater and excreta flowuntreated to the environment and so cannot be used for agriculture.Household discharge via open defecation, public latrines andwastewater to the environment is 4430 kg N (2.95 kg N/cap) with a90% probability interval of 3390-5950 kg (2.44e3.51 kg N/cap)(Fig. 3). For irrigation, piped water (Fig. 4) contains sufficientquantities of Ca and Mg to satisfy crop requirements, insufficientamounts of K and no N or P. Therefore, the remainder needed bycrops (assuming that crop uptake is equal to crop requirement) issupplied as fertilizer (498 kg N, 349 kg P, 444 kg K).
5.2.2. CaseidealThe potential of WSTI is indicated by caseideal assuming that all
users use the sanitation units ideally; there is no open defecationand no use of the latrine and the communal water point (Table 4).Thus (Fig. 2b) all excreta and a large proportion of the wastewater(90% in individual household connections, 80% in cluster wash-houses units and the communal washhouse) could be collected andtreated. For this reason, little greywater containing practically nosubstances are discharged from the households to the environment(Fig. 3). In consequence, the load of substances in the irrigationwater (Fig. 4) is the highest of all cases: For instance, a mean of3480 kg N (90% probability interval 2470e4440 kg N) is applied toagriculture. All nutrient loads far exceed crop requirements. Inaddition, 2010 kg Na originating from human excreta is applied to
agriculture with the reuse water. This is 15 times more than the138 kg reaching agriculture from irrigation with piped water(caseconv). Consequently, the nutrients and salts not taken up by thecrops are collected in the lined evaporation pond. From there theywould have, eventually, to be deposited in landfill. Major accu-mulation of nutrients and salts in the soil is not predicted due to themedium texture of the sandy loam and adequate leaching thatwashes out excess salts and nutrients. In contrast to caseconv, incaseideal all nutrient requirements could be provided in irrigationwater, no fertilizer is required and practically no wastewater dis-charged untreated to the environment.
5.2.3. CaseassessAfter 10 months of WSTI operation, during 2 days of sampling,
we found that the treated water contained far lower amounts ofnutrients and salts than had been expected in the planning phasewith ideal sanitation use. Instead of 66 households in the ShackDwellers settlement, only 17 were connected in April 2014, thehouseholds in Tobias Hainyeko settlement are considerably smallerthan previously assumed and only 270 and 260 residents used thecluster and the communal washhouse in March 2014 (Deffner andKramm, 2014). In addition, many inhabitants are often not at homeas theywork far away (Deffner and Kramm, 2014). On this basis, thenumber of users estimate was 588 (Section 4.4). As 588 usersexcrete far less than 1501 users as expected in the planning phase(Table 4), nutrient and salt flows are smaller in total than expected(Fig. 2). We estimated that 0% of individual connection users, 10% ofcluster washhouse users and 30% of communal washhouse userspracticed open defecation (Table 4). Toilet use was considerablylower than ideal, users using the toilets in all sanitation units ononly 62% of the occasions possible. For this reason, a fairly largeamount of substances are discharged from households to theenvironment, and less excreta is collected by the sewer (Fig. 3). Thisoutcome seems due, particularly, to the current tariff structures.Therefore, despite there being only 588 users, discharge to theenvironment is very much greater than it would have been withideal sanitation use (Fig. 3). Consequently, the irrigation waterconsists of 70% reuse water rather than 100% had sanitation usebeen ideal. Nevertheless, in the communal washhouse and thecluster washhouses, water use per person (100 l/p/d) is consider-ably higher than estimated in caseideal because sanitation userspredominantly use the washhouse to shower and to wash laundry,while urination predominantly still takes place in the open. In thecluster washhouses the hand wash basin is free of charge. Foragriculture, additional piped water (8690 m3) needs to be supplied.Irrigation water (Fig. 4) contains lower quantities of nutrients thanwith ideal sanitation use. N, Ca, and Mg were just sufficient to meetcrop requirements. Additional 188 kg P and 85 kg K need to besupplied as artificial fertilizers.
During the planning phase, we also modeled a more realisticcase with mixed sanitation use. This case included a lower wateruse per person and a greater proportion of open defecation andlatrine use than caseideal. Compared to caseassess, in the realistic casewater use per person was slightly lower, but toilet use was slightlyhigher (64% compared to 62% of times). Under these conditions theresults indicated slightly more reuse water and more nutrients andsalts to be available.
5.2.4. MMFA diagrams of the three casesThe MMFA diagrams (example for N; Fig. 2) demonstrate how
substance flows differ between the three cases. Nutrient inflows tothe system originatemostly from the food consumed in households(>89% N, >59% P, >68% K), the remainder originates from fertilizersapplied in agriculture and grid water supply for households andirrigation, while irrigation with water from the ephemeral river
L. Woltersdorf et al. / Journal of Environmental Management 169 (2016) 272e284278
76

Fig. 2. Simulation results of nitrogen (Ntot) flows for a) caseconv b) caseideal and c) caseassess (mean value and standard deviation) [kg/yr].
L. Woltersdorf et al. / Journal of Environmental Management 169 (2016) 272e284 279
77

plays a minor role. Salts also originate mostly from food (>77% Na,>7% Ca, >76% Mg) but also from grid and irrigation water supplyfrom thewater grid (>65% Ca, >6%Mg), the remainder coming fromirrigation water taken from the ephemeral river. The nutrients andsalts contained in 110,000 kg agricultural produce of the waterreuse site contain: 216 kg N, 33 kg P, 289 kg K,11 kg Na, 21 kg Ca and17 kgMg. This is the amount of recycled nutrients in the sanitation-agriculture loop. The MMFA diagrams show that without WSTI(Fig. 2a) most substances excreted from households end up in theenvironment, while with WSTI (Fig. 2b and c) the flow to theenvironment is smaller and most substances can be collected inlandfill. Furthermore, without WSTI, nutrients to agriculture aresupplied in fertilizers. With WSTI, however, they are supplied inirrigation water. Therefore, with WSTI the amount of substances inthe system is reduced by the amount of fertilizers supplied toagriculture without WSTI. Crop residues containing nutrients areleft on the agricultural area to improve the soil.
5.2.5. Analysis of the two most important flowsThe two most important flows are: 1) The discharge of
inhabitants to the environment (Fig. 3) and 2) the irrigation watereither supplied from the wastewater treatment plant to the storagepond or from grid water, related to crop requirements (Fig. 4). Thedischarge flow (via open defecation, the latrine and releasedwastewater) shows the potential of wastewater reclamation andtreatment to reduce environmental pollution through eutrophica-tion and salinization. The irrigation flow is important because itshows the amount of nutrients available from human excreta thatcan be used for crop nutrition and the amount of salts that mightharm crops and thus need to be managed carefully. Precipitationand evaporation in and from the storage pond have beenconsidered.
5.3. Parameters causing uncertainty in the results
Five parameters cause over 90% of the uncertainty of the resultof the two most important flows presented previously in Section5.2.5. The uncertainty of the flow “substances discharged per per-son through open defecation, public latrines and wastewater to theenvironment” presented in Fig. 3 depends, in caseideal, for all
Fig. 3. Substances discharged per person (through open defecation, public latrines, wastewater) to the environment (mean value and 90% probability range) [kg/cap/yr].
0 200 400 600 800
1,000 1,200 1,400 1,600 1,800 2,000 2,200 2,400 2,600 2,800 3,000 3,200 3,400 3,600 3,800 4,000 4,200 4,400 4,600 4,800
N P K Na Ca Mg water
Avai
labi
lity
in ir
rigat
ion
wat
er in
rela
tion
to
crop
requ
irem
ent o
f 1 h
a [%
]
Case conv: Previous water and sanitation infrastructure (1500 sanitation users) Case ideal: Ideal sanitation use and water reuse (1500 sanitation users) Case assess: Assessment during pilot phase (588 sanitation users)
Fig. 4. Availability of substances in irrigation water. Contained in reuse water flowing from the wastewater treatment plant to the pond (caseideal, caseassess) or in grid water(caseconv) (mean value and 90% probability range) in relation to crop requirement of 1 ha per year [%]. Black line: Crop requirement of 1.5 ha (equals 150% of crop requirement of1 ha).
L. Woltersdorf et al. / Journal of Environmental Management 169 (2016) 272e284280
78
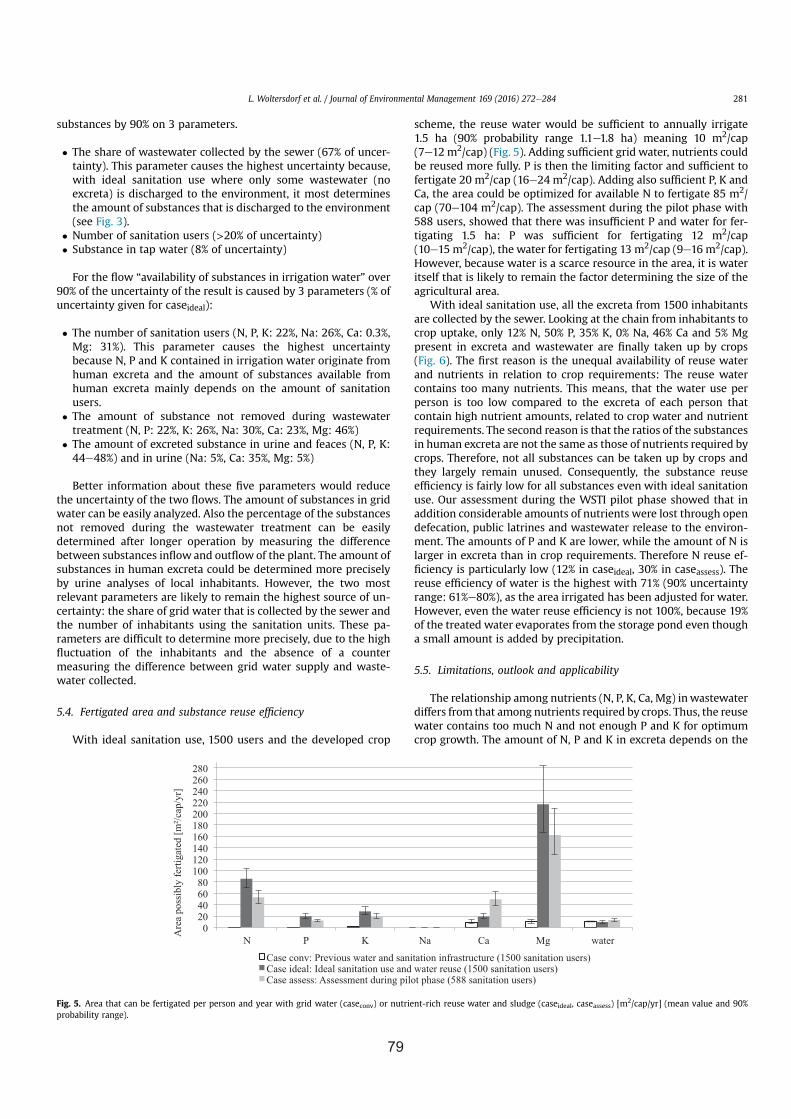
substances by 90% on 3 parameters.
� The share of wastewater collected by the sewer (67% of uncer-tainty). This parameter causes the highest uncertainty because,with ideal sanitation use where only some wastewater (noexcreta) is discharged to the environment, it most determinesthe amount of substances that is discharged to the environment(see Fig. 3).
� Number of sanitation users (>20% of uncertainty)� Substance in tap water (8% of uncertainty)
For the flow “availability of substances in irrigation water” over90% of the uncertainty of the result is caused by 3 parameters (% ofuncertainty given for caseideal):
� The number of sanitation users (N, P, K: 22%, Na: 26%, Ca: 0.3%,Mg: 31%). This parameter causes the highest uncertaintybecause N, P and K contained in irrigation water originate fromhuman excreta and the amount of substances available fromhuman excreta mainly depends on the amount of sanitationusers.
� The amount of substance not removed during wastewatertreatment (N, P: 22%, K: 26%, Na: 30%, Ca: 23%, Mg: 46%)
� The amount of excreted substance in urine and feaces (N, P, K:44e48%) and in urine (Na: 5%, Ca: 35%, Mg: 5%)
Better information about these five parameters would reducethe uncertainty of the two flows. The amount of substances in gridwater can be easily analyzed. Also the percentage of the substancesnot removed during the wastewater treatment can be easilydetermined after longer operation by measuring the differencebetween substances inflow and outflow of the plant. The amount ofsubstances in human excreta could be determined more preciselyby urine analyses of local inhabitants. However, the two mostrelevant parameters are likely to remain the highest source of un-certainty: the share of grid water that is collected by the sewer andthe number of inhabitants using the sanitation units. These pa-rameters are difficult to determine more precisely, due to the highfluctuation of the inhabitants and the absence of a countermeasuring the difference between grid water supply and waste-water collected.
5.4. Fertigated area and substance reuse efficiency
With ideal sanitation use, 1500 users and the developed crop
scheme, the reuse water would be sufficient to annually irrigate1.5 ha (90% probability range 1.1e1.8 ha) meaning 10 m2/cap(7e12 m2/cap) (Fig. 5). Adding sufficient grid water, nutrients couldbe reused more fully. P is then the limiting factor and sufficient tofertigate 20 m2/cap (16e24 m2/cap). Adding also sufficient P, K andCa, the area could be optimized for available N to fertigate 85 m2/cap (70e104 m2/cap). The assessment during the pilot phase with588 users, showed that there was insufficient P and water for fer-tigating 1.5 ha: P was sufficient for fertigating 12 m2/cap(10e15 m2/cap), the water for fertigating 13 m2/cap (9e16 m2/cap).However, because water is a scarce resource in the area, it is wateritself that is likely to remain the factor determining the size of theagricultural area.
With ideal sanitation use, all the excreta from 1500 inhabitantsare collected by the sewer. Looking at the chain from inhabitants tocrop uptake, only 12% N, 50% P, 35% K, 0% Na, 46% Ca and 5% Mgpresent in excreta and wastewater are finally taken up by crops(Fig. 6). The first reason is the unequal availability of reuse waterand nutrients in relation to crop requirements: The reuse watercontains too many nutrients. This means, that the water use perperson is too low compared to the excreta of each person thatcontain high nutrient amounts, related to crop water and nutrientrequirements. The second reason is that the ratios of the substancesin human excreta are not the same as those of nutrients required bycrops. Therefore, not all substances can be taken up by crops andthey largely remain unused. Consequently, the substance reuseefficiency is fairly low for all substances even with ideal sanitationuse. Our assessment during the WSTI pilot phase showed that inaddition considerable amounts of nutrients were lost through opendefecation, public latrines and wastewater release to the environ-ment. The amounts of P and K are lower, while the amount of N islarger in excreta than in crop requirements. Therefore N reuse ef-ficiency is particularly low (12% in caseideal, 30% in caseassess). Thereuse efficiency of water is the highest with 71% (90% uncertaintyrange: 61%e80%), as the area irrigated has been adjusted for water.However, even the water reuse efficiency is not 100%, because 19%of the treated water evaporates from the storage pond even thougha small amount is added by precipitation.
5.5. Limitations, outlook and applicability
The relationship among nutrients (N, P, K, Ca, Mg) inwastewaterdiffers from that among nutrients required by crops. Thus, the reusewater contains too much N and not enough P and K for optimumcrop growth. The amount of N, P and K in excreta depends on the
0 20 40 60 80
100 120 140 160 180 200 220 240 260 280
N P K Na Ca Mg water
Are
a po
ssib
ly fe
rtiga
ted
[m/c
ap/y
r]
Case conv: Previous water and sanitation infrastructure (1500 sanitation users) Case ideal: Ideal sanitation use and water reuse (1500 sanitation users) Case assess: Assessment during pilot phase (588 sanitation users)
Fig. 5. Area that can be fertigated per person and year with grid water (caseconv) or nutrient-rich reuse water and sludge (caseideal, caseassess) [m2/cap/yr] (mean value and 90%probability range).
L. Woltersdorf et al. / Journal of Environmental Management 169 (2016) 272e284 281
79

amount of food protein, while P and K also depend on the amountof food vegetable protein. Namibians have a particularly low intakeof vegetable proteins (total protein: 61 g/cap/d, including vegetableprotein: 37 g/cap/d) compared to other countries with similar totalprotein intake such as Nigeria or Kenya but a much higher share ofvegetable protein (vegetable protein: 52 and 47 g/cap/d) (FAO,2014; data for 2011). In Namibia, therefore, the amount of P andK in excreta is particularly low compared to the amount of N. Inother countries with a higher vegetable protein intake, thus more Pand K are expected to be in the reuse water. In addition, also othercrops may have different irrigation and nutrient requirements.Tomatoes, for example, have particularly high K requirements andbeans particularly low N requirements. Citrus trees have particu-larly low P requirements relative to their high requirement forirrigation (Doorenbos, J., 1979). However, the crop scheme we usedwas chosen on other criteria. In particular, maize was chosenbecause it provides the optimummarket potential, best meets localpreferences and is free of the risks to health of people eating cropsgrowing below the surface. It was therefore not possible to selectcrops on their optimal nutrient ratio requirements.
Instead of evaporating water from the leachate in the evapora-tion pond and depositing the resulting brine in landfill, the leachateitself could be reused for irrigation. However, the second highestcomponent of leachate, after N, is Na. It would therefore only bepossible to apply the leaching water to very salt tolerant crops suchas fodder grasses with very careful salt management. As well, afterseveral years of fertigation with reuse water, the levels of accu-mulation of substances in the soil and the degree of leachingnecessary should be added to the model. Where the evaporationpond is unlined (as currently in the pilot area) the leachate mightwell percolate into the groundwater. It would then pollute theenvironment with salts and excess nutrients because it contains3920 kg N, 354 kg P, 897 kg K, 2010 kg Na, 154 kg Ca and 967 kgMg,assuming ideal sanitation use.
WhereWSTI is not implemented, field measurements should bemade to investigate how much fertilizer applications need to beincreased relative to the crop requirement then existing in order toaccount for nutrient losses. Furthermore, we used water qualityanalyses over only 2 days. A wider range of monitoring data fromthe WSTI needs to be used in order to validate and improve cali-bration of the model results. New calibrations should also be made
after WSTI has been operating for more time. This is because thenumber of sanitation users indicated in caseassess is expected toincrease with length of WSTI operation towards the number ex-pected in caseideal. New calibration of the model with new mea-surements would produce additional results. It would also be usefulto investigate the pharmaceuticals and heavy metals in the reusewater. Heavy metals are not expected to pose problems in munic-ipal wastewater. In contrast, pharmaceuticals, especially those usedagainst HIV, may well be present in central-northern Namibia. It istherefore relevant to investigate closely what amounts wastewatercontains, the degree to which they are decomposed duringwastewater treatment and in the soil, and their uptake by crops andimpact on humans that eat the vegetables. The risk should howeverbe put in relation to the current difficult socio-economic situationof the inhabitants in central-northern Namibia.
Our quantitative assessment method is applicable to all urbanareas in developing countries with similar starting conditions suchas in Outapi where our study took place. These conditions includeinsufficient sanitation and wastewater treatment infrastructure,informal settlements with public latrines, inhabitants practicingopen defecation, high unemployment, low income and little edu-cation, a semi-arid climate that necessitates irrigation for agricul-ture, and the possibility of installing a water reuse site next to thewastewater treatment plant. The methodology can also be trans-ferred to semi-arid high income countries if adapted to the existingtype of sanitation units and user behavior. The results of this studycan be compared to results obtained in other areas with similarconditions to those in our study region with similar numbers ofsanitation users and size of agricultural area.
6. Conclusions
1. The quantitative assessment method we developed is suitablefor supporting the design and operation of WSTI infrastructurebecause quantification of water, nutrient and salt flows allowsassessing the fulfillment of crop requirements regarding waterand nutrients as well as environmental pollution throughsalinity and nutrients. As nutrient and salt flows depend greatlyon the WSTI infrastructure being used by residents, the math-ematical material flow analysis applied can also be used, in
0
10
20
30
40
50
60
70
80
90
100
N P K Na Ca Mg water
Subs
tanc
e re
use
effic
ienc
y [%
]
Case conv: Previous water and sanitation infrastructure (1500 sanitation users) Case ideal: Ideal sanitation use and water reuse (1500 sanitation users) Case assess: Assessment during pilot phase (588 sanitation users)
Fig. 6. Substance reuse efficiency defined as substances originating from reuse water taken up by crops on 1.5 ha in relation to substances in human excreta and wastewater fromsanitation users (mean value and 90% probability range).
L. Woltersdorf et al. / Journal of Environmental Management 169 (2016) 272e284282
80

combination with water quality measurements, to monitor theactual number of users of WSTI infrastructure.
2. According to the quantitative assessment of the design phase ofthe WSTI infrastructure in Namibia, water is the limiting factorfor crop fertigation if ideal sanitation use is assumed, closelyfollowed by P. Without additional grid water, P and especially N,K, Ca andMg cannot be fully used. P is the substance that is usedmost fully. Of the amount of P in human excreta, we estimatedthat 50% is reused by crops, while the remainder is lost throughwastewater treatment or not taken up by crops due to the smallsize of the field available for irrigated by reuse water. The reusewater is sufficient to fertigate a crop area of 1.5 ha (90% uncer-tainty range 1.1e1.8 ha) or 10 m2/cap (7e12 m2/cap) per year.With additional grid water, P is sufficient to fertigate 10 m2/cap(16e24 m2/cap).
3. The ratio of nutrients (N, P, K, Ca, Mg) inwastewater differs fromthat of the nutrients required by crops. For optimum cropgrowth, wastewater contains too much N and not enough P andK. This might be different in other counties and with other cropsgrown.
4. The assessment based on data from the WSTI pilot phaseshowed that water use per person was as high as was expectedin the design phase for the case of ideal sanitation use. Howeverfewer nutrients were present in the wastewater, because moreopen defecation than expected took place even after construc-tion of the WSTI infrastructure. Consequently, P became thelimiting factor and insufficient P and water were available forfertigating 1.5 ha. P was sufficient to fertigate only 0.6 ha or12 m2/cap (10e15 m2/cap), the water was sufficient to fertigate13 m2/cap (0e16 m2/cap). In addition, the assessment showedthat the number of 1500 sanitation users was overestimated inthe design phase and the estimate was revised to 588 users.
5. The WSTI infrastructure prevents diffuse discharge of nutrientsand salts to the environment almost completely if the sanitationunits provided are used by the residents and the evaporationpond is lined.
6. The reuse water containing salts from human excreta is classi-fied as slightly saline with ideal sanitation use and non-salineafter assessment during the pilot phase. With ideal sanitationuse and irrigation with reuse water, the leaching requirement is13-times higher compared to grid water irrigation (21%compared to 1% of crop water requirements).
7. To reduce uncertainties in the amount of nutrients and salts inthe reuse water and the amount discharged to the environment,better information is necessary on the share of wastewater thatis collected by the sewer (i.e. not discharged to the environ-ment) and of the correct number of inhabitants using thesanitation units.
8. To fully exploit the fertigation potential of human excretions andwaste water, open defecation and latrine use needs to be avoi-ded. In addition, additional settlements should be connected tothe waste water treatment plant as its capacity is currently notfully used.
Acknowledgments
This research was carried out within the research project“CuveWaters - Integrated Water Research Management inNamibia” by the Institute for Social-Ecological Research [grantnumber 033W014A] and the Technische Universit€at Darmstadt[grant number 033W014B], funded by the German Federal Ministryfor Education and Research (BMBF). The sub-project “Sanitationand Water Reuse” is implemented with the Outapi Town Counciland the German industry partner BilfingerWater Technologies. Theauthors thank Katharina Müller for provision of unpublished raw
data, Karoline Kickler and TangiMsati for helpwith collectingwatersamples, Jutta Deffner and Johanna Kramm for help estimatingsanitation user related data and Hans-Peter Bader and Peter Cornelfor helpful comments.
Appendix A. Supplementary data
Supplementary data related to this article can be found at http://dx.doi.org/10.1016/j.jenvman.2015.12.025.
References
Akponikp�e, P., Wima, K., Yacouba, H., Mermoud, A., 2011. Reuse of domesticwastewater treated in macrophyte ponds to irrigate tomato and eggplant insemi-arid West-Africa: benefits and risks. Agric. Water Manag. 98 (5), 834e840.
APHA, AWWA, WPCF, 1992. Standard Methods for the Examination of Water andWastewater, eighteenth ed. American Public Health Association, Washington,D.C. USA.
Ayers, R., Westcot, D.W., 1985. Water Quality for Agriculture. FAO Irrigation andDrainage Paper 29. rev. 1. Food and Agriculture Organization of the UnitedNations, Rome.
Bader, H.-P., Scheidegger, R., 2012. MMFA Framework. EAWAG e Swiss FederalInstitute for Environmental Science & Technology. http://www.eawag.ch/forschung/siam/schwerpunkte/stofffluesse/index_EN.
Barker, A.V., Pilbeam, D.J., 2007. Handbook of Plant Nutrition. CRC/Taylor & Francis,Boca Raton, FL.
Bedbabis, S., Ben Rouina, B., Boukhris, M., Ferrara, G., 2014. Effect of irrigation withtreated wastewater on soil chemical properties and infiltration rate. J. Environ.Manag. 133, 45e50.
Ben-Hur, M., 2004. Sewage water treatments and reuse in Israel. In: Zereini, F.,Jaeschke, W. (Eds.), Water in the Middle East and in North Africa. Springer,Berlin, pp. 167e180.
Biggs, T.W., Jiang, B., 2009. Soil salinity and exchangeable cations in a wastewaterirrigated area, India. J. Environ. Qual. 38 (3), 887.
Blume, H.-P., Schachtschabel, P., Scheffer, F., 2010. Lehrbuch der Bodenkunde: DieFotos, Grafiken und Tabellen des Buches Scheffer/Schachtschabel: Lehrbuch derBodenkunde, sixteenth ed. Spektrum Akad. Verl., Heideberg.
Charlton, K., Steyn, K., Levitt, N., Zulu, J., Jonathan, D., Veldman, F., Nel, J., 2005.Ethnic differences in intake and excretion of sodium, potassium, calcium andmagnesium in South Africans. Eur. J. Cardiovasc. Prev. Rehabil. 12 (4), 355e362.
CuveWaters, 2008. Community Workshop. Institute for Social-Ecological Research,Frankfurt am Main.
CuveWaters, 2011. Water Analysis of Oshana in Outapi. Institute for Social-Ecological Research, Frankfurt am Main.
CuveWaters, 2013. Water Is Life e Omeya Ogo Omwenyo. CuveWaters Mid-termReport. Institute for Social-ecological Research ISOE, Frankfurt.
Deffner, J., Kramm, J., 2014. Water Usage Patterns. Of Tobias Hainyeko SettlementReport on Social Monitoring Activities. Frankfurt am Main: ISOE e Institute forSocial-Ecological Research, Frankfurt am Main.
Deffner, J., Mazambani, C., 2010. Participatory Empirical Research on Water andSanitation Demand in Central Northern Namibia: a Method for TechnologyDevelopment with a User Perspective. CuveWaters Papers 7. Institute for Social-Ecological Research, Frankfurt am Main.
Deffner, J., Reisenauer, S., Storch, K., 2012. Household Inventory Survey (HIS) inThree Informal Settlements in Outapi (Namibia). ISOE e Institute for Social-Ecological Research, Frankfurt am Main.
Devitt, D.A., Lockett, M., Morris, R.L., Bird, B.M., 2007. Spatial and temporal distri-bution of salts on fairways and greens irrigated with reuse water. Agron. J. 99(3), 692.
Doorenbos, J., 1979. Yield Response to Water. Irrigation and Drainage Paper 33. Foodand Agricultural Organization, Rome.
FAO, 2014. FAOSTAT, Food Supply, Crops Primary Equivalent. Data for Namibia,Nigeria and Kenya of 2011. http://faostat3.fao.org/faostat-gateway/go/to/browse/FB/CC/E (accessed 06 06 14.).
Fixen, P., Johnston, A., 2012. World fertilizer nutrient reserves: a view to the future.J. Sci. Food Agric. 92 (5), 1001e1005.
Howard, G., Bartram, J., 2003. Domestic Water Quantity, Service Level and Health.WHO, Geneva.
IFA, 2006. Production and International Trade Statistics. International FertilizerIndustry Association, Paris.
Jim�enez, B., Asano, T., 2008. Water Reuse: an International Survey of CurrentPractice, Issues and Needs. London: IWA Publishing.
J€onsson, H., Richert Stinzing, A., Vinneras, B., Salomon, E., 2004a. Guidelines for theUse of Urine and Faeces in Crop Production. Stockholm.
J€onsson, H., Stinzing, A., Vinneras, B., Salomon, E., 2004b. Guidelines for the Uue ofUrine and Faeces in Crop Production. Stockholm Environment Institute (SEI),Stockholm.
Lentner, C., 1981. Geigy Scientific Tables 1: Units of Measurements, Body Fluids,Composition of the Body, Nutrition, eighth ed. Ciba-Geigy, Basel.
Müller, K., 2009. Unpublished Raw Data. Technische Universit€at Darmstadt,Darmstadt.
L. Woltersdorf et al. / Journal of Environmental Management 169 (2016) 272e284 283
81

Müller, K., 2014. Unpublished Raw Data. Technische Universit€at Darmstadt,Darmstadt.
Müller, K., Deffner, J., Cornel, P., 2013. A sanitation concept adapted to the pre-conditions in low-density urban areas of semi-arid environments e an examplefrom North Namibia. In: International IWA Conference on Water Reuse, 27.-31.10.2013. Windhoek, Namibia.
NHMRC, 2006. Nutrient Reference Values for Australia and New Zealand IncludingRecommended Dietary Intakes. National Health and Medical Research Council.Australian Government, Department of Health and Aging, Canberra, Australia.
Norton-Brand~ao, D., Scherrenberg, S., van Lier, J., 2013. Reclamation of used urbanwaters for irrigation purposes e a review of treatment technologies. J. Environ.Manag. 122, 85e98.
O'Connor, G.A., Elliott, H.A., Bastian, R.K., 2008. Degraded water reuse: an overview.J. Environ. Qual. 37 (Suppl. 5), S-157eS-168.
Ongley, E., 1996. Control of Water Pollution from Agriculture. FAO (accessed24.04.13.). http://www.fao.org/docrep/w2598e/w2598e00.htm#Contents.
Pablo, C., Zhang, Q., Mihelcic, J., 2013. Quantifying benefits of resource recoveryfrom sanitation provision in a developing world setting. J. Environ. Manag. 131,7e15.
Pescod, M.B., 1992. Wastewater Treatment and Use in Agriculture. Irrigation andDrainage Paper 47. Food and Agricultural Organization, Rome.
Reichenbach, M., 2013. Boden€okologische Beurteilung einer landwirtschaftlichenNutzfl€ache im Cuvelai-Binnendelta in Nordnamibia. Bachelorarbeit. Institut fürPhysische Geographie. Johann Wolfgang Goethe-Universit€at Frankfurt am Main,Frankfurt, Main, p. 125.
Rhoades, J.D., Kandiah, A., Mashali, A.M., 1992. The Use of Saline Waters for Crop
Production. Irrigation and Drainage Paper 48. Food and Agricultural Organiza-tion., Rome.
Savva, A., Frenken, K., 2002. Crop Water Requirements and Irrigation Scheduling.FAO Irrigation Manual Module 4. FAO, Rome.
Scheierling, S., Bartone, C., Mara, D., Drechsel, P., 2010. Improving Wastewater Usein Agriculture: an Emerging Priority. Policy Research Working Paper 5412. TheWorld Bank Group, Washington, DC.
Schmidt, R., Lang, F., Heckmann, M., 2011. Springer-Lehrbuch 31. ed. 31. In: Physi-ologie des Menschen. Mit Pathophysiologie. Springer-Verlag, Berlin, Heidelberg.
Smit, J., Ratta, A., Nasr, J., 1996. Urban Agriculture: Food, Jobs, and Sustainable Cities.United Nations Development Programme (UNDP), New York.
Tanji, K.K., Kielen, N.C., 2002. Agricultural Drainage Water Management in Arid andSemi Arid Areas. FAO irrigation and drainage paper 61. Food and AgriculturalOrganization., Rome.
UNEP, 2011. UNEP Year Book 2011: Emerging Issues in Our Global Environment.United Nations Environment Programme, Nairobi.
van Veenhuizen, R. (Ed.), 2006. Cities Farming for the Future, Urban Agriculture forGreen and Productive Cities. RUAF Foundation, International DevelopmentResearch Centre and International Institute of Rural Reconstruction and ETCUrban Agriculture, Ottawa.
Woltersdorf, L., Liehr, S., Scheidegger, R., D€oll, P., 2015. Small-scale water reuse forurban agriculture in Namibia: modeling water flows and productivity. UrbanWater J. http://dx.doi.org/10.1080/1573062X.2014.900691.
WWAP (World Water Assessment Programme), 2012. The United Nations WorldWater Development Report 4: Managing Water under Uncertainty and Risk.UNESCO, Paris, p. 909.
L. Woltersdorf et al. / Journal of Environmental Management 169 (2016) 272e284284
82

�
�
Benefits of an integrated water and nutrient reuse system for urban areas in semi-arid developing countries
Woltersdorf, L.*, Zimmerman, M.*, Deffner, J. *, Gerlach, M.**, Liehr, S.*
*Institute for Social-Ecological Research ISOE, Hamburger Allee 45, 60486 Frankfurt,
Germany
**Bilfinger Water Technologies GmbH, Global Business Unit Vacuum Technology,
Kinzigheimer Weg 104-106, 63450 Hanau, Germany
Corresponding author: Laura Woltersdorf, Phone +49 (0)69 798-40220, Email:
Keywords: Resource recovery, water reuse, nutrient reuse, sustainability, AHP, Multi criteria
decision analysis
AbstractUrban areas of developing countries face the challenge to implement adequate urban water
infrastructures while managing resources in a sustainable manner. The objective of this study
was to identify the benefits and challenges of a novel resource recovery system that integrates
sanitation infrastructure, wastewater treatment and reuse of nutrient-rich water for the irrigation
of human food crops, in relation to the local conventional system and to two adapted systems.
A town in Namibia exemplifying the typical problems of urban areas in developing countries
served as a case study. The four options were compared with ecologic, economic, societal,
institutional and political as well as technical criteria using the Analytic Hierarchy Process
(AHP), a tool for multi-decision criteria analysis for dealing with complex decision-making. This
methodology helps decision-makers and engineers to have proper information on which
options to implement for increasing the livability in cities towards a more sustainable future.
Results indicate that the novel system has numerous benefits especially in the societal and
environmental dimensions and scores highest when weighting all dimensions equally as well
as with a particular focus on environmental and societal criteria. Hence, we suggest that the
novel resource recovery system is a viable way for urban areas of developing countries
towards a more sustainable urban sanitation, wastewater and irrigation infrastructure, using
fewer resources, being economically feasible, institutionally and politically practical and
technically sound. However, in light of its challenges, the answer to the question which
resource recovery system is the best option for the local context is, that it also depends on the
particular focus in the relative context.
83

�
�
1 Introduction Adequate sanitation and wastewater treatment is often lacking in urban areas of many
developing countries (WWAP 2012). Also the provision of sufficient water and fertilizers for
urban agriculture is a major issue in semi-arid developing countries. In the past decades there
has been a paradigm shift of the present conventional urban water and wastewater
infrastructure (Guest 2009). Thus, the attitude towards domestic wastewater has been
changing, towards regarding sanitation and wastewater treatment systems as resource
recovery systems for water and nutrients (Guest 2009, Adewumi 2010, McCarty 2011). Among
the numerous emerging water reuse concepts, the challenge is to select the system that is
best suited to the specific local context. This is important for policy-makers, engineers and the
general public in order to have proper information about the benefits and challenges of different
options for water and nutrient recovery systems. To find the best suited system, decision-
support systems are helpful tools especially indicated to support complex multi-criteria decision
making (Power et al 2002).
Evaluating and comparing alternative options of resource recovery systems using
sustainability criteria and indictors is a common method (ASCE 1998, Morrison et al. 2001,
Balkema et al. 2002, Palme et al. 2005, Cinelli et al 2014). While multi-criteria decision systems
such as the AHP method have been previously used to evaluate wastewater management
technologies (e.g. Molinos-Senante et al. 2014, 2015, Aydiner et al 2015), to the knowledge of
the authors, this approach has not yet been applied to resource recovery systems in a
developing country setting. In addition, to be as context specific as possible, a wide range of
criteria need to be integrated into the evaluation. However, integrating a wide range of
sustainability dimensions (ecologic, economic, societal, institutional and political, technical)
into the evaluation of resource recovery systems is rather unusual (Garcia and Pargament
2015, Molinos-Senante et al 2014, Balkema et al. 2002).
Previous studies have shown that for wastewater treatment in developing countries,
wastewater stabilization ponds are usually the best option, as they are simple, low cost,
efficient and robust (Mara 2003, von Sperling and Chernicharo 2005). However, if badly
managed, they become overloaded spilling over during heavy rain storms and floods, might
release odors, have high land requirements, might also be a breeding ground for mosquitos
and therefore a serious health problem and energy cannot be recovered as methane is emitted
to the atmosphere and the treated water might have a poor quality (Mara 2003). Therefore, it
can be questioned whether wastewater stabilization ponds can be the best option to be
integrated in resource recovery systems for reusing water and nutrients for the irrigation of
urban agriculture.
84

�
�
A novel water and nutrient reuse system has been implemented in the northern part of Outapi
by the CuveWaters research project (CuveWaters 2013). The reuse system connects water
supply, improved sanitation, advanced wastewater treatment and nutrient-rich water to the
reused for the irrigation of urban agriculture. The novel concept has not been technically
implemented before, including its small-scale (1400 inhabitants, 3 ha crop area) and the direct
reuse of treated nutrient-rich water for human crop production in an urban-area in a developing
country. The objective of this study is to identify benefits and challenges of this novel nutrient
and water reuse system in relation to the conventional system in the area and to two adapted
systems proposed by this study.
2 Study area The town of Outapi in central-northern Namibia served as our case study. Outapi exemplifies
the typical problems of urban areas in semi-arid developing countries: Inadequate water supply
for hygiene and agriculture, low access to sanitation facilities, inadequate wastewater
treatment, nutrient poor soils, population growth (according to the former CEO of Outapi, the
population is currently doubling in number roughly every 3 years (in 2014 ca. 13,200)), further
urbanization (see Deffner et al. 2012), and a mix of low-density informal suburbs (with shacks)
and low-density formal suburbs (with brick houses). Central-northern Namibia is a semi-arid
and water scarce region. Mean precipitation is 464 mm/y occurring from November to April. In
the absence of perennial water resources, water is supplied by an open canal and pipelines
originating from the Angolan-Namibian border river Kunene (Heyns 1995). Currently, extensive
new agricultural areas with food crops are planned and expanded in the surroundings of the
city, using tap water for irrigation and mineral fertilizer. The region has a high demand for
agricultural products to increase food security and import substitution (Government of Namibia
2006). Four settlements in the north of the town (Fig. 1) including informal suburbs with shacks
and an open market (Onhimbu, Okaikongwe, Tobias Hainyeko) and a formalized suburb with
brick houses (Shack Dwellers) were estimated to have about 1,400 inhabitants in September
2015. The previously existing water and sanitation infrastructure comprises the water pipeline
scheme with communal water taps, some private taps and some public-pit latrines (Kramm
and Deffner, in prep.). The minority of the inhabitants had access to latrines (37% in Shack
Dwellers, 44% in Tobias Hainyeko, 4% in Okaikongwe, 90% in Onhimbu) and most practiced
open defecation (Kramm and Deffner, in prep.). In the southern part of the town, a conventional
gravitational sewer system transports the wastewater from connected formalized buildings
outside of the city to a series of large wastewater stabilization ponds. The water is evaporated
and not used anymore. These ponds are not well managed and regularly spill over during the
frequent floods in the area constituting a health risk for the local population.
85

�
�
3 Methodology The methodology consists of four steps: (1) establishing the goal, scope and boundaries of the
evaluation, (2) designing the options to be evaluated, (3) setting up the evaluation team, (4)
selecting an appropriate method for multi-criteria decision making, (5) assessing the
uncertainty of results with sensitivity analyses and (6) identify benefits and challenges.
3.1 Goal, scope, spatial and temporal boundary of the evaluation The goal of the evaluation is to identify benefits and challenges of different nutrient and water
reuse systems. The scope of the evaluation includes the five pillars of sustainability, adding to
the triple bottom line (WCED 1987) of economic, environmental and social pillars, also a
technical as well as an institutional and political dimension, due to the complexity associated
with a resource recovery system. The spatial and temporal boundaries are the same for all
systems: The spatial boundary is given by the four settlements in Outapi with an estimated
1,400 inhabitants (Fig. 1). The temporal boundary is the situation in September 2015.
�
Fig. 1: Map of the four settlements in Outapi (blue), agriculture site (red), as located for all options. WWTP: Wastewater treatment plant (yellow). The water storage pond for reuse water only existing in options 1b, 2a and 2b. The communal washhouse only in option 2a and 2b. (Satellite image is provided with permission by CNES/ Astrium 2013, powered by Google Earth, small map source: Natural Earth) (Adapted from Woltersdorf et al. 2016)
3.2 Design of options for evaluation Four systems were evaluated: the conventional (1a), the conventional adapted (1b), the novel
(2a) and the novel adapted (2b) (Tab. 1). The novel system has been piloted in Outapi and is
86

�
�
evaluated on the basis of monitoring data of the pilot plant and expertise gained from its start
in April 2013 to September 2015. The conventional system is evaluated on the basis of the
existing sanitation and water infrastructure in the four settlements before the introduction of
the novel system and in other parts of Outapi and central-northern Namibia. The two adapted
systems were designed by this study as optimizations of the conventional and the novel system
by changing specific components (Tab. 1 and 2). The adapted systems 1b and 2b are
evaluated based on assumptions of this study and the experience of local current practices.
To ensure the comparability of the evaluation of the four systems, an ideal management of the
stabilization ponds was assumed with the necessary amount of financial resources and labor.
This has an impact on costs as well as on the institutional capacities and institutional
complexity.
Tab. 1: Options designed for evaluation Sanitation Wastewater treatment Agriculture
OptionFormal
settlements
Informal
settlements
Formal
settlements
Informal
settlements
1a Conventional Individual
household
connection
Open
defecation,
pit latrines
Ponds
None
Tap water,
chemical
fertilizer
1b Conventional adapted Adapted
ponds
Reuse water,
tap water
2a Novel Individual
household
connection
Cluster
washhouses,
Community
washhouse
Advanced
Reuse Water 2b Novel adapted
Adapted
ponds
Adapted
ponds
Formal settlements (Shack Dwellers), Informal settlements (Tobias Hainyeko, Onhimbu and Okaikongwe)
All systems were designed to be suited in the identical position regarding settlements,
wastewater treatment and the agricultural site (Fig. 1). In all systems, the agricultural area is
assumed to have the same: crop scheme producing food for human consumption, size (3 ha),
yield (18.5 t/ha/year), irrigation requirement (16,181m³/ha/year), equipment (drip irrigation,
high tanks, sub-surface drainage) and operator of the farm who employs several workers and
sells the produced fruits and vegetables directly on site.
The four systems differ in terms of type of water supply connection (i.e. public water points,
washhouses), sanitation and wastewater treatment infrastructure and type of irrigation water
(Tab. 1). The agricultural area can be irrigation with tap water, with reuse water or with both,
depending on the availability of reuse water in the system under consideration. The wastewater
that can be collected by the sewer and treated in both conventional options is 16 m³/day
originating only from the formal settlement. In both novel options 52 m³/day can be collected,
originating from both formal and informal settlements. For water reuse, this study designed the
wastewater stabilization ponds in options 1b and 2b to reach, together with drip irrigation,
87

�
�
according to literature values (Sperling and Lemos Chernicharo 2005), the necessary
pathogen reduction of 6 log units required by the WHO guideline (2006). The sludge is not
applied in agriculture as it is not hygienically safe, e.g. might contain sedimented viruses.
Compared to option 1a, in option 1b and 2b, the facultative and the maturation pond have been
redimensioned (height and length/breadth ratio) and the hydraulic detention time has been
increased (Tab. 2) in order to reduce more E.coli and fecal coliform bacteria. Therefore, it can
be expected, that in all options reusing nutrients and water, the fruits and vegetables are safe
for consumption.
Tab. 2: Wastewater treatment components in the evaluated systems
1a:Conventional
1b:Conventional adapted
2a: Novel 2b: Novel adapted
Series of connected
ponds
1: Anaerobic pond t=3, H=3,L/B=2
t=10, H=2.5, L/B=3.0
/ same as 1b
2: Facultative pond t=15, H=2, L/B=2
t=20, H=1.5, L/B=3
/ same as 1b
3: Maturation pond t=30, H=1,L/B=2.2
t=40, H=1,L/B=3
/ same as 1b
4: Evaporation pond for wastewater
t=120, H= 1, L/B= 1.6
/ / /
5: Storage pond for irrigation water / t=10, H=2,L/B=3
t=54, H=2,L/B=2.6
same as 1b
Wastewater treatment plant / /
UASB, RBC, microstrainer, UV-radiation
/
t= hydraulic detention time (days), H= height (m), L/B= length/breadth ratio
3.2.1 Option 1a: Conventional system The conventional system comprises the infrastructure that currently exists in the southern part
of Outapi and in most other towns of central-northern Namibia, and is now assumed to be
implemented also in the study area, in the northern-part of the city. Brick houses in the formal
settlement (200 inhabitants) are individually connected (or are planned to be connected in the
future, which is assumed to be realized in this study) to water supply and sewage. Their
wastewater is transported via gravitational sewer to a series of wastewater stabilization ponds
(anaerobic-facultative-maturation ponds) (Tab. 2) where the water is treated and evaporates.
Informal settlements with shacks of corrugated iron sheets cannot be connected individually
to water supply and sewage; here a few water points supply water and some public latrines
provide sanitation, while most (50%) inhabitants practice open defection. As no nutrient and
water reuse takes place, agriculture is irrigated with tap water, chemical fertilizers are used
88

�
�
and no storage pond for reuse water is necessary. Fertilizer prices are currently low although
steadily increasing, while tap water is rather expensive for commercial farmers.
3.2.2 Option 1b: Conventional adapted system The conventional adapted system is the conventional system 1a, adapted for nutrient and
water reuse in agriculture. For this, the conventional wastewater treatment ponds are
redesigned and their hydraulic detention time is increased to achieve the necessary pathogen
reduction required for reuse water for the irrigation of food crops (according to WHO 2006 and
Lemos Chernicharo 2005) (Tab. 2). The wastewater stabilization ponds directly supply the
nutrient-rich irrigation water for the agricultural irrigation site.
3.2.3 Option 2a: Novel system The novel system includes as sanitation infrastructure: (i) conventional individual household
connections (200 inhabitants) to water and sewage in the formal settlement, (ii), two types of
sanitation infrastructure offering toilets, showers, sinks for laundry and dish washing in the
informal settlements (1,200 inhabitants); one communal washhouse for inhabitants and visitors
of the near-by open market and 30 cluster washhouses to be shared each by 4 surrounding
households. Two factors may lower the potential amount of wastewater that can be collected
and reused: First, the novel sanitation infrastructure comes at a cost, even though the
sanitation and water tariffs are affordable for local inhabitants. Second, all inhabitants of formal
and informal settlements can still use the existing water points, free latrines and practice open
defecation according to their habits before the implementation of the novel system. The
wastewater from both formal and informal settlements (1,400 inhabitants) is treated and
hygienised in a nearby wastewater treatment plant (treatment steps in Tab. 2). Nutrients are
intentionally not removed and mostly remain in the water (78% N, 82% P, 100% K). The treated
nutrient-rich reuse water is directly pumped to a storage pond on the agricultural irrigation site
and used for fertigation. The Outapi town council manages the sanitation and the wastewater
treatment infrastructure and sells the fertigation water to a farmer. The revenues help to
subsidize drinking water and sanitation tariffs and contribute to the affordability of the sanitation
infrastructures for local inhabitants.
3.2.4 Option 2b: Novel adapted system The novel adapted system is the novel system 2a, adapted to contain the simple, low-tech
wastewater treatment components of the conventional adapted system 1b. For this, the series
of wastewater stabilization ponds have been redimensioned to treat water from all (1400)
inhabitants of the formal and informal settlements (Tab. 2).
89

�
�
3.3 Setting up the team to conduct the evaluation The broader evaluation team was constituted by members of the research project; i.e.
scientists from different disciplinary backgrounds (engineers, economists, sociologists, natural
scientists) and the industry partner. Here iterative discussions on criteria and valuation of
criteria (see section 3.4, step 2-5) took place. The members of the research project
CuveWaters contributed with experience gained throughout the project duration and the
numerous exchanges with and intensive involvement of local stakeholders (the municipality,
ministries, farmers and sanitation users) during project design, implementation and operation
(2006-2015). Among the broader evaluation team, five members (who are also the authors of
this study) were closely involved in the evaluation regarding their specific discipline and field
of expertise, while two members coordinated and were mainly in charge of the evaluation
process. The authors of this study aspired to conduct an evaluation with a clear and
transparent structured procedure and transparent results. However, at this point it was not
possible to organize transdisciplinary stakeholder processes to integrate stakeholder
knowledge in a direct participatory manner to determine criteria and evaluate them jointly. Such
direct participation would clearly add to the quality and validity of the evaluation and we suggest
it to be the next step. This study can be regarded as the first step and future studies may use
the described methodology (with AHP method and user-friendly software).
3.4 Multi-criteria decision analysis with Analytical Hierarchy Process (AHP) method Multi-criteria decision analysis (MCDA) methods are commonly used to deal with complex
decision-making. They are used to systematically evaluate an option and determine the most
suited one based on multiple criteria (Kiker et al. 2005). During the past thirty years, a multitude
of MCDA methods have emerged, including for instance the multi-attribute utility methods
(MAUT), the Analytical Hierarchy Process (AHP), outranking and value-added analysis (Chen
2006, Figueira et al. 2005). For this study, we selected to use the AHP method (Saaty 1980)
as it is a widely accepted formal decision-making method (Bushan and Rai 2004). Its strength
is that it can integrate both qualitative and quantitative criteria. It reduces complex decision-
making to a series of pair-wise comparisons and then synthesizes results, calculates the
consistency of the evaluation and allows to perform a sensitivity analysis (Saaty and Vargas
2012). AHP is a trade-off based method (Chen 2006) and results in a ranking of the evaluated
options. To perform AHP calculations, we used the online application AHP-OS home (Version
2014-05-18 by Klaus D. Goepel/ Business Performance Management BPMSG, bpmsg.com).
AHP comprises the following steps (Saaty and Vargas 2012):
(1) Defining criteria: We selected main-criteria and sub-criteria based on the iterative
discussions among the research group members. The societal criteria were defined based on
90

�
�
the close contact with sanitation users during community health clubs and regular
questionnaire organized by the research project. The institutional and political criteria were
developed based on close collaboration with and the input of members of the Outapi Town
Council (OTC). The economic criteria were selected from standard economic criteria (Balkema
et al. 2002) and in close contact with the farmer and the municipality. Technical and ecological
criteria were selected from existing standard criteria catalogues (Balkema et al. 2002, DWA
2014).
(2) Formulating the hierarchy: A hierarchy of goal, main-criteria, sub-criteria and option was
set up to structure the decision problem (Fig. 2). The sub-criteria were each described by a
strategic guiding question, a target and an indicator. The definition of a criteria and indicators
are shown in Tab 4-8.
Fig. 2: Hierarchy of goal, main-criteria, sub-criteria and options
(3) Weighting criteria: For weighting the criteria, a scale (1-9) was used (Tab. 3). First, we
assumed the main criteria to be all equally important, assigning each a weight of 1. Then, we
tested the sensitivity (uncertainty of results) of each main-criterion by weighting one main-
criterion as “extremely important” (maximum possible weight of 9) leaving all other main-criteria
equally important (weight of 1). Thus, the sensitivity analysis shows the maximum possible
range of results due to a different weight of the sensitivity dimensions. The sub-criteria were
always assumed to be equally important as we perceived it as extremely difficult to assign a
specific weight.
(4) Data collection: Data was collected from project documents, modelling, interviews with local
experts, questionnaires of sanitation users, plausible reasoning, expert experience and
calculations.
91

�
�
Tab. 3: Graduation scale used for weighting of criteria and evaluation of options (Flores 1988)
ScaleRelative importance of criterion or priority
of option Explanation
1 Equal Both factors contribute equally to the main-criterion or priority of option
3 Moderate The base factor (row) is slightly more important than the second factor (column)
5 Strong The base factor (row) is strongly preferred over the second factor (column)
7 Very strong Definite preference for the base factor (row)
9 Extreme The base factor is preferred at the highest possible level
Reciprocals Reflect the dominance of the second factor (column) compared to the base factor (row)
(5) Evaluation of options: The authors of this study evaluated all options with a pair-wise
comparison of each option in relation to each sub-criterion (see supplement S1). The scale of
the evaluation was the same as for weighting the criteria (Tab. 3). Two criteria had to be fulfilled
to qualify an option for evaluation: (i) The treated water was required to achieve the necessary
pathogen reduction (6 log units) for unrestricted irrigation (WHO 2006) and (ii) the technology
was required to be locally available and basically functional. For instance, the evaluation of the
sub-criterion “health” is based on a questionnaire (Kramm and Deffner, in prep.) of the
sanitation users before the implementation of the novel sanitation system (used to evaluate
the conventional system) and two years after its implementation (the difference between the
two was used to evaluate the novel system).
(6) Evaluation of consistency: During the pair-wise evaluation of the options, the software
simultaneously checked the consistency of the evaluation. AHP allows for inconsistency,
however if the consistency index exceeded 10% (Saaty 1980) the evaluation was re-examined.
(7) Calculation of results: The software multiplied the rating of each option (from step (5) by
the weight of each sub-criterion (from step (3) to obtain a local rating of each sub-criterion. The
local ratings of each sub-criterion were then multiplied by the weights of the main-criteria (from
step (3) and aggregated to obtain a global rating of each option.
(8) Analysis of results: The ranking of each option was analyzed and the strengths and benefits
of each option concerning the main-criteria and the sub-criteria were identified.
4 Results and discussion of the sustainability evaluation At first, the results of the evaluation of each of the five main-criteria (sustainability dimensions)
are presented separately. Then, the overall result of the evaluation is shown, aggregating the
main-criteria together with the sensitivity analysis.
92

�
�
4.1 Ecologic sustainability In terms of ecologic sustainability, the novel system scored significantly highest (54% priority)
followed by the novel adapted system (25% priority) (Tab. 4). Ecologic benefits of the novel
system are the good resource use efficiency with a high share of reuse water for irrigation
(novel: 27%, novel adapted: 16%, conventional adapted: 6%) due to the high number of
connected sanitation users and its evaporation prevention in the treatment plant. In terms of
biogeochemical impact, the two novel systems (2a and 2b) discharge less wastewater
untreated to the environment (6 m³ compared to 18 m³ of 1a and 1b) as all inhabitants have
improved sanitation with sewer connections. The novel system has also the least spatial impact
with only about 1,300 m² area occupied by sanitation and wastewater treatment, while
wastewater stabilization ponds (1a, 1b, 2b) occupy a relatively large area.
Tab. 4: Evaluation of ecologic criteria
Option
Criterion Indicator Unit
1a:Conventional
1b:Conventional
adapted 2a: Novel
2b: Novel adapted
Value Rank Value Rank Value Rank Value Rank
Resource use efficiency
Share of reused water for irrigation out of total water consumption of irrigation and households
% 0% 4 6% 3 27% 1 16% 2
Biogeochemical impacts (soil, water cycle, flora, fauna etc.)
Wastewater discharged untreated to the environment
m³/y 35 3 35 3 6 1 6 1
Spatial impacts
Area occupied by the irrigation site, wastewater treatment facility, sanitation site
m² 3,236 3 1,668 2 1,284 1 4,465 4
Ecologic dimension 6% 4 15% 3 54% 1 25% 2
4.2 Economic sustainability In terms of economic sustainability, the conventional adapted system scores highest (32%
priority) all other options being very close (21-25% priority). The conventional adapted system
has the best affordability for sanitation users, having the lowest costs for water supply and
sanitation per person (weighted mean: 406 N$/cap/y): In informal settlements pit latrines and
open defecation are completely free of charge, while with fetching water from communal water
points costs of about 100 N$/cap/y. In all options, the individual household connections in
formal settlements have the highest costs (2.250 N$/cap/y), partly due to higher water
consumption. In contrast, the sanitation infrastructure of the novel systems (2a, 2b) in informal
settlements comes at a cost (users of cluster washhouses 342 N$/cap/y, users of communal
93

�
�
washhouse 171 N$/cap/y). The weighted average of costs per inhabitant of each sanitation
infrastructure is shown in Tab. 5.
Tab. 5: Evaluation of economic criteria
Option
Criterion Indicator Unit
1a:Conventional
1b:Conventional
adapted 2a: Novel
2b: Novel adapted
Value R Value R Value R Value R
Affordability Annual cost for water supply and sanitation per person
N$/y 406 1 406 1 500 3 500 3
Financial benefit-cost
O&M revenues - costs (Town council perspective)
N$/m³/y 0 2 3 1 -25 4 -1 3
Costs of irrigation water and fertilizer (farmer perspective)
N$/y 465,227 4 455,890 3 437,246 1 437,246 1
Poverty
Number of formerly unemployed workers employed now in washhouse, wwtp, farm (full time equivalent)
People 1 4 2 3 8 1 7 2
Financing Investment costs N$ Low 1 Low 1 High 4 Medium 3
Economic dimension 25% 2 32% 1 23% 3 21% 4
R: Rank
**The value of the investment costs of the novel system could not be presented, however the evaluation and the
rank in comparison to the other two options is shown. The investment costs of the novel system apply for the
implementation of the pilot plant. The investment costs for the replication of the system (without pilot character and
a higher number of users) are expected to be cheaper with regard to per capita costs. Expenses may also vary
depending on local conditions.
Also, the conventional adapted system has the least O&M revenues-cost ratio for the town
council with 3 N$/m³/y meaning a net profit per year, while for the two novel systems annual
costs for sanitation and water treatment exceed the revenues from sanitation and irrigation
water tariffs. A further reason, is that the wastewater stabilization ponds (option 1a, 1b, 2b)
have no energy requirements except for a diesel pump in exceptional cases, while the novel
wastewater treatment plant (option 2a) requires electricity (6 kWh/m³). The two conventional
systems have also lower investment costs compared to the two novel systems, due to the
costs for the washhouses that do not exist in the conventional options and mainly due to the
difference of the low-tech wastewater stabilization pond to the high-tech wastewater treatment
plant: The novel wastewater treatment plant (option 2a) costs about 9 times as much as the
wastewater stabilization pond in option 2b, both designed for the same amount of sanitation
users. However, the novel and the novel adapted systems have the lowest costs for irrigation
water and fertilizer for the farmer as nutrient-rich reuse water (8.25 N$/m³) is cheaper than
drinking water (9.45 N$/m³) and less fertilizer needs to be purchased (2,700 N$/y), compared
94
�
�
to the conventional adapted system with less nutrient-rich water available for reuse (due to
less collected wastewater and more evaporation) and the conventional system irrigating only
with tap water (fertilizer costs: 3,200 N$/y and 6,500 N$/y respectively). The novel system has
also the best impact on reducing poverty, having the highest amount of employees: 8 workers
(full time equivalent) for the community washhouse, wastewater treatment plant and the farm.
Although poverty reduction has both economic and social notions, we chose to emphasize the
economic implications here in terms of employed workers that were formerly unemployed.
Societal aspects of poverty, e.g. health, have been considered in the corresponding dimension.
4.3 Societal sustainability Societal criteria include material, objectively verifiable as well as subjective and symbolic
aspects of the use of the sanitation infrastructure, while the other option’s components
(wastewater treatment, agriculture) were not considered here. Three of seven criteria are
based on qualitative assessments, four on quantitative deductions based on empirical data
collected (Kramm and Deffner, in prep.). The novel sanitation infrastructure, which is exactly
the same in option 2a and 2b, has the most societal benefits (in 5 out of 7 criteria) and occupies
the first rank (34% priority). The conventional sanitation option, which is exactly the same in
option 1a and 1b, scores considerably lower (16% priority) (Tab. 6). The novel sanitation
infrastructure has the best “accessibility”, as with the washhouses also inhabitants in informal
settlements have access to sanitation. Furthermore, it has the best “acceptance”, having the
benefits of comfort, privacy and security. It also scores highest in terms of “social capacities”
indicating if users possess the necessary skills to maintain sanitation infrastructure in a proper
manner. Here, the novel infrastructure was introduced accompanied by a special “community
health club” program, training sanitation users in formal and informal settlements on hygiene,
with 23% of the sanitation users taking part. In comparison, with conventional sanitation we
would assume that only users in formal settlements (9%) would take part. The criterion “health”
is based on diarrhea cases among the population. An ex-ante survey provided data on the
occurrence of diarrhea among the population before the implementation of the novel system
(45%) compared to the ex-post survey were the occurrence was considerably reduced (13%)
(Deffner and Kramm, in prep.). “Socio-economic and symbolic values” is based on the ex-post
survey where users were asked to subjectively assess what has changes in their environment
concerning sanitation and hygiene.
Conventional sanitation has its benefits regarding “practicability” and “conflict management”:
Low-tech latrines and open defecation are more practicable having less technical requirements
for users, as almost nothing limits the use, while novel sanitation with its sewer has some
limitations e.g. what can be used for anal cleansing. Also the conflict potential is lower, as in
95

�
�
informal settlements no sanitation infrastructure is shared with other users when practicing
open defecation, while in the novel sanitation option sharing washhouses offers some conflict
potential.
Tab. 6: Evaluation of societal criteria (only sanitation infrastructure)
Option
Criterion Indicator Unit
1a: Conventional and
1b: Conventional adapted
2a: Novel and
2b: Novel adapted
Value R Value R
Accessibility Amount of people connected to sanitation units and wastewater treatment
Inhabitants
198 3 1,400 1
Practicability Technical practicability of water and sanitation infrastructure
High, medium,
low High 1 Low-medium 3
Acceptance Degree of privacy (shame), security (violence, exposure to weather) and ease of use (comfort)
High, medium,
low Low 3 Medium 1
Socialcapacities
Share of sanitation users that have taken part in health and hygiene training out of target population
% 9% 3 23% 1
Health Share of people in target population having diarrhea
% 45% 3 13% 1
Socio-economic and symbolic values
Proudness/symbolic value of sanitation units
High, medium,
low Low 3 Medium 1
Conflictmanagement
Does the sanitation practice/ use of sanitation infrastructure create conflicts?
No,yes and manageable,yes and difficult to solve
Formal: no, informal: yes
andmanageable
1
Formal: no, informal: yes and
manageable (community washhouse),
difficult to solve (cluster
washhouses)
3
Societal dimension 16% 3 34% 1
R= Rank, Formal: Formal settlements (Shack Dwellers), informal: Informal settlements (Tobias Hainyeko, Onhimbu
and Okaikongwe)
4.4 Institutional and political sustainability Regarding the institutional and political sustainability dimension, the results show (Tab. 7) that
the conventional option clearly scored highest (44% priority) followed by the adapted
conventional system (21% priority) and the novel system (20% priority) have a similar score.
The conventional option scored highest in almost all criteria having the least institutional
complexity and requiring the lowest institutional capacities and the lowest effort to achieve
legal security. Both novel system scored highest only regarding the criterion “policies” being in
accordance with the national water and sanitation strategy in terms of promoting improved
sanitation and reusing water.
96

�
�
Tab. 7: Evaluation of institutional and political criteria
Option
Criterion Indicator Unit
1a:Conventional
1b:Conventional
adapted 2a: Novel
2b: Novel adapted
Value R Value R Value R Value R
Institutional complexity
Number of areas of responsibility in the town council for sanitation, wastewater treatment and the farmer Number
3 1 3 1 8 4 7 3
Institutional capacities
Access to capacities to manage the sanitation, wwtp, farm in the town council and in the farm
Easy, medium, difficult
Easy 1 Medium 2 Difficult 4Mediu
m2
Policies
Accordance to the existing national water and sanitation strategy
High,medium, low
Low 4 Medium 3 High 1 High 1
Legal security
Effort to achieve legal security for the town council (e.g. legal contracts)
High,medium,
low Low 3 Medium 2 Medium 2
Medium
2
Institutional and political dimension 44% 1 21% 2 16% 4 20% 3
R: Rank, wwtp: Wastewater treatment plant
4.5 Technical sustainability The technical evaluation comprises the sanitation and wastewater treatment infrastructure,
while the agricultural irrigation site is technically the same for all options and was not evaluated
here. The novel adapted system scored highest (31% priority), followed by the novel system
(26% priority). The novel adapted system scored best in all six technical criteria, while it was
the second best system only in the criterion “robustness”, having a medium susceptibility to
natural hazards. The criteria operation (described by adequately trained workers), reliability
(downtime days per year) and lifespan are evaluated the same for all options. Since the novel
wastewater treatment is technically more sophisticated, the investments allowed for high
quality products, fully automatic operation, intensive operator training and after-sales service.
In the criterion “construction and maintenance” all options score the same having a high
availability of technical supply for sanitation infrastructure, except for the high-tech wastewater
treatment plant in the novel option that has a low availability and therefore occupies the last
rank. In terms of robustness and susceptibility to natural hazards, the novel wastewater
treatment plant scores best, being not susceptible to floods, while in the other options the
ponds (1a, 1b, 2b) might overspill and latrines (1a, 1b) might be flooded as well.
97

�
�
Tab. 8: Evaluation of technical criteria
Option
Criterion Indicator Unit
1a:Convention
al
1b:Conventional adapted
2a:Novel
2b: Novel adapted
Value R Value R Value R Value R
Construction andmaintenance
Degree of local availability of technical supply (for sanitation, wwtp, sewer, farm)
High,medium, low
Sanitation: highwwtp, sewer:
medium
1
Sanitation: highwwtp, sewer:
medium
1
Sanitation:high
wwtp: low
sewer:
medium
4
Sanitation: highwwtp, sewer:
medium
1
Operation Are workers adequately trained and instructed to guarantee operational safety at work?
Yes, no Yes 1 Yes 1 Yes 1 Yes 1
Reliability Downtime days per year of wastewater treatment
days/y 0 1 0 1 0 1 0 1
Tolerance Susceptibility of wwtp, sanitation facilities, farm to maloperation and vandalism
High, medium, low
Low 2 Low 3Mediu
m4 Low 1
Robustness Susceptibility of wwtp, sanitation facilities, farm to natural hazards
High, medium, low
High 3 High 3 Low 1 Medium 2
Lifetime Lifespan years High 1 High 1 High 1 High 1
Technical dimension 22% 3 21% 4 26% 2 31% 1
R: Rank, wwtp: wastewater treatment plant
4.6 Overall sustainability and testing of sensitivity The overall sustainability, integrating the five sustainability dimensions with different weighting
of the dimensions (Fig. 3) shows that (i) the options’ ranking depends on the weighting of the
dimensions and (ii) in 3 out of 6 cases the novel system (2a) scores best (with equal, ecologic
and social focus). The other three systems score best in one case each.
With equal focus, all dimensions are equally important and weighted with 1, so that all
dimensions have an equal weight of 20%. Because each dimension does not have the same
amount of criteria, the contribution of each criterion (i.e. the weight of each of this dimension’s
criteria) to the overall evaluation differs as follows: ecologic 6.7%, economic 4%, societal 2.9%,
institutional and political 5% as well as technical 2.9%. With a focus on a certain dimension,
the dimension was rated as “extremely important”, obtaining a weigh of 9, contributing with
69% to overall sustainability, while all other dimensions obtained an equal weight of 1, each
contributing 7.7% to the overall sustainability result.
(1) Equal focus: In this balanced evaluation case, the novel system scores clearly best (31%
priority), followed by the novel adapted system (26% priority).
(2) Ecologic focus: The novel system has clearly the highest rank (45% priority) followed with
a large distance by the novel adapted system (26% priority).
98

�
�
(3) Economic focus: The conventional adapted system ranks first (28% priority) followed by
the novel system (26% priority).
(4) Societal focus: The novel system scores best (33% priority), closely followed by the novel
adapted system (31% priority), while both conventional systems score considerably worse.
(5) Institutional and political focus: The conventional system scores highest (35% priority) all
other systems being very close.
(6) Technical focus: The novel adapted system scores highest (29% priority), immediately
followed by the novel system (28% priority), while both conventional systems are considerably
behind.
Fig. 3: Overall sustainability
Overall, the novel system achieves the highest rank, considering an equal focus of
sustainability dimensions and even more so with a societal and ecological focus. In all these
three cases, the novel adapted system occupies the second rank. However, with an extreme
economic focus, the conventional adapted system has the most benefits, even more so
considering its highest rank in the sub-criteria investment costs, annual revenues/costs for the
town council, and affordability for sanitation users. These criteria are often the most important
and determining ones for the implementation of such a system in a developing country context.
However, the two conventional systems have the least ecologic and societal benefits,
inhabitants in informal settlements are not connected to sanitation and sewage and no
resources at all (1a) or less resources (1b) can be recovered and reused. Moreover, also
22%21%
31%
26%
35%
21% 22% 22%24%
28%26%
23%22% 21%
28%29%
18% 18%
33%31%
12%
17%
45%
26%
0%
5%
10%
15%
20%
25%
30%
35%
40%
45%
50%
1a: Conventional 1b: Conventional adapted 2a: Novel 2b: Novel adapted
Priority
%
Equal focus
Institutional and poltiical focus
Economic focus
Technical focus
Societal focus
Ecologic focus
99

�
�
technical requirements and most importantly technical operation and maintenance play an
important role, where the novel adapted system is the most advantageous system. The novel
system has the following benefits and challenges compared to the other systems (Tab. 9).
Tab. 9: Benefits and challenges of the novel system
Dimension Benefits Challenges
Ecologic Resource-use efficiency Biogeochemical impacts Spatial impact
Economic Costs of irrigation water and fertilizer for farmer Poverty reduction
Affordability O&M revenues-costs for town council Financing
Societal
Accessibility of sanitation units Acceptance of sanitation units Social capacities of sanitation units Health Socio-economic and symbolic values
Practicability of sanitation units Conflict potential
Institutional and political
Policies Legal security
Institutional complexity Institutional capacity
Technical
Operation Reliability Robustness Lifespan
Construction and maintenance Technical tolerance
It should also be kept in mind, that the priority values have an uncertainty range. Looking at
the evaluation of single dimensions and of overall sustainability, options are often so close,
that considering a range of uncertainty, the differences among options might be questioned:
This is the case in the economic dimension and in overall sustainability with an economic focus.
Nonetheless, differences are often also significant that a most sustainable option can be clearly
identified: This is the case in the ecologic and the societal dimension, and in overall
sustainability evaluation with an ecologic, societal as well as institutional and political focus.
In summary, the results of this study show that the novel system offers the most benefits for
the local developing country context. However, in light of its challenges, the answer to the
question which resource recovery system is the best option for the local context is, that it also
depends on the particular focus in the relative context.
4.7 Discussion of the methodology and the study design In methodological terms, the Analytical Hierarchy Process (AHP) offers a good compromise
between modelling and usability. Beforehand, considerable efforts have to be made to set up
the list of assessment criteria in order to avoid dependencies or complementarities among
indicators. By discussing the set of criteria with experts, a sound foundation for the evaluation
could be laid. AHP provides a clear guidance how to carry out the pairwise comparisons by
defining a corresponding evaluation scale. This is not the case with other MCDA methods,
100

�
�
especially the weighted sum model (also known as utility analysis). However, one drawback
of the method is the dependency on a software tool. Due to the number of criteria, the
calculation of utility values cannot be done manually with reasonable efforts. The algorithm,
therefore, might remain a black box for outsiders. Hence, AHP is not as transparent as some
other MCDA methods, which is of particular interest when involving stakeholders in the
evaluation phase.
In order to improve the evaluation in the future, also empirical data from the conventional
wastewater stabilization ponds and from other water reuse pilot projects should be integrated.
The quantification of the pathogen reduction achieved with wastewater treatment presented in
this study should be complemented with an investigation on the maximum tolerable disease
burden (DALY) with a quantitative microbial risk analysis (QMRA) according to WHO (2006).
Particularly, it should be investigated whether the wastewater stabilization ponds and the water
reuse site reach the required pathogen removal efficiency by the WHO (2006) that was
calculated to be achieved according to literature values. Additionally, the wastewater treatment
plant of the novel system was intended to be extended by a biogas module. However, this
could not be implemented satisfactorily during the pilot phase. The sewage sludge from
wastewater can be digested together with crop residues from the water reuse site and other
agricultural areas to produce biogas and completely cover heat demand and partly cover
electricity demand (about 50%) of the treatment plant. This could also be tested in other pilot
resource recovery systems in order to recover energy from the wastewater and should be
included in further evaluations of resource recovery systems.
5 Conclusion To understand the benefits of a novel resource recovery system, we compared it to the
conventional system and to two adapted versions of the systems. Surprisingly, our results
showed that the novel system, including sanitation infrastructure in informal settlements (a
community washhouse and cluster washhouses), a wastewater treatment plant for the
recovery of water and crop nutrients and a nutrient-rich water reuse site for the irrigation of
food crops, offers the most benefits for the developing country context. The hypothesis that
the novel adapted system would score best since it combines the benefits of the novel
sanitation infrastructure with easy to manage low-tech wastewater stabilization ponds for
resource recovery could not be verified.
The evaluation showed that its sanitation infrastructure, which is the same as in the novel
option, does not overtake the novel option. Secondly, the wastewater stabilization ponds of the
101

�
�
novel adapted system have to be large enough (as opposed to the conventional adapted option
connecting only formal settlements) so that it scores worse in ecologic terms and not good
enough in economic, institutional and political as well as technical terms to offer more benefits
than the novel system. In summary, the results of this study show that the novel system offers
the most benefits for a semi-arid developing country context. Hence, we suggest the novel
system is a viable resource recovery system towards a more sustainable urban sanitation,
wastewater and irrigation infrastructure, using fewer resources, being economically feasible,
institutionally and politically practical and technically sound. However, in the light of its
challenges, local conditions, such as financial resources and human capacities, have to be
thoroughly examined first in order to answer the question which resource recovery system is
the best option for a specific case.
These results are relevant for decision-makers, engineers and the general public in order to
have proper information on which options to implement for increasing livability in cities towards
a more sustainable future. The results of this study are transferrable to other countries and
regions with similar conditions of those described for the project region. These conditions
comprise low-density urban areas in developing countries with informal settlements with
insufficient sanitation and wastewater treatment infrastructure, public latrines and inhabitants
practicing open defecation, a similar socio-economic situation with low income and little
education, a semi-arid climate that necessitates irrigation for agriculture and an urban area
with sufficient area available to install wastewater treatment facilities and agriculture irrigation
sites in close proximity (e.g. periphery of a city). The methodology can, furthermore, be applied
to countries and regions with conditions that differ from the ones described in this study.
Especially, the comprehensive set of assessment criteria might be used as a starting point for
comparable evaluations. However, the criteria list might need to be adapted and further
developed together with relevant stakeholders of the local context. Hence, from our results,
we suggest the novel system is a viable resource recovery system towards a more sustainable
urban sanitation, wastewater and irrigation infrastructure, using fewer resources, being
economically feasible, institutionally and politically practical and technically sound. These
results are relevant for decision-makers, engineers and the general public in order to have
proper information on which options to implement for increasing livability in cities towards a
more sustainable future. The results of this study are transferrable to other countries and
regions with similar conditions of those described for the project region. These conditions
comprise low-density urban areas in developing countries with informal settlements with
insufficient sanitation and wastewater treatment infrastructure, public latrines and inhabitants
practicing open defecation, a similar socio-economic situation with low income and little
education, a semi-arid climate that necessitates irrigation for agriculture and an urban area
102

�
�
(e.g. periphery of a city) with sufficient area available to install wastewater treatment facilities
and agriculture irrigation sites in close proximity. The methodology can, furthermore, be
applied to countries and regions with conditions that differ from the ones described in this
study. Especially, the comprehensive set of assessment criteria might be used as a starting
point for comparable evaluations. However, the criteria list might need to be adapted and
further developed together with relevant actors of the respective local context.
Acknowledgements
This study is part of the research and development project “CuveWaters - Integrated Water
Research Management in Namibia” by ISOE - Institute for Social-Ecological Research and the
Technische Universität Darmstadt, implemented with the Outapi Town Council and the
German industry partner Bilfinger Water Technologies GmbH and funded by the German
Federal Ministry for Education and Research (BMBF) [grant number 033L001A]. The authors
thank Peter Cornel, Katharina Müller, Anastasia Papangelou and Jochen Sinn for valuable
comments.
References
Aydiner, C., Sen, U., Koseoglu-Imer, D., Can Dogan, E., 2015. Hierarchical prioritization of innovative treatment systems for sustainable dairy wastewater management. Journal of Cleaner Production 1-3.
Adewumi, J., Ilemobade, A., Van Zyl, J., 2010 Treated wastewater reuse in South Africa: Overview, potential and challenges. Resources, Conservation and Recycling 55, 221–231
ASCE, UNESCO, 1998. Sustainability criteria for water resource systems. American Society of Civil Engineers, Reston, VA. USA
Balkema, A.J., Preisig, H.A., Otterpohl, R., Lambert, F., 2002. Indicators for the sustainability assessment of wastewater treatment systems. Urban Water 4, 153–161.
Bushan, N., Rai, K., 2004. Strategic decision making. Applying the Analytic Hierarchy Process. Springer, London.
Chen, Z., Ngo, H., Guo, W., 2012. A critical review on sustainability assessment of recycled water schemes. Science of the Total Environment. 426, 13–31.
Cinelli, M., Coles, S.R., Kirwan, K., 2014. Analysis of the potentials of multi criteria decision analysis methods to conduct sustainability assessment. Ecological Indicators 46, 138–148.
CuveWaters, 2013. Water Is Life e Omeya Ogo Omwenyo. CuveWaters Mid-term Report. Institute for Social-ecological Research ISOE, Frankfurt.
Deffner, J., Reisenauer, S., Storch, K., 2012. Household Inventory Survey (HIS) in Three Informal Settlements in Outapi (Namibia). ISOE Institute for Social-Ecological Research, Frankfurt am Main.
DWA Deutsche Vereinigung für Wasserwirtschaft, Abwasser und Abfall e.V., 2014. DWA-A 272 Grundsätze für die Planung und Implementierung Neuartiger Sanitärsysteme (NASS).
Figueira, J., Greco, S., Ehrgott, M., 2005. Multiple criteria decision analysis: State of the art surveys. Garcia, X., Pargament, D., 2015. Reusing wastewater to cope with water scarcity: Economic, social
and environmental considerations for decision-making. Resources, Conservation and Recycling. 101, 154–166.
Government of Namibia, 2006. Millennium challenge account Namibia. Windhoek: Government of Namibia.
Guest, J. S., Skerlos, S. J., Barnard, J. L., Beck, M. B., Daigger, G. T., Hilger, H., Jackson, S. J., Karvazy, K., Kelly, L., MacPherson, L., Mihelcic, J. R., Pramanik, A., Raskin, L., van Loosdrecht, M. C. M., Yeh, D., Love, N. G., 2009. A New Planning and Design Paradigm to Achieve
103
�
�
Sustainable Resource Recovery from Wastewater. Environmental Science and Technology 43(16), 6126-6130.
Heyns, P., 1995. The Namibian Perspective on Regional Collaboration in the Joint Development of International Water Resources. Water Resource Development 11(4), 467–492.
Kiker, G., Bridges, T., Varghese, A., Seager, T., Linkov, I., 2005. Application of multi-criteria decision analysis in environmental decision making. Integrated Environmental Assessment and Management 1 (2).
Kramm, J., and Deffner, J., in preparation. Social aspects of the new sanitation infrastructure. IWA Publishing.
Mara, D. D., 2003. Domestic wastewater treatment in developing countries, 1st ed.; Earthscan/James & James: London, UK.
McCarty, P.L., Bae, J., Kim, J., 2011. Domestic Wastewater Treatment as a Net Energy Producer–Can This be Achieved? Environmental Science and Technology 45 (17), 7100–7106.
Molinos-Senante, M., Gómez, T., Caballero, R., Hernández-Sancho, F., Sala-Garrido, R., 2015. Assessment of wastewater treatment alternatives for small communities: An analytic network process approach. Science of the Total Environment 532, 676–687.
Molinos-Senante, M., Gómez, T., Garrido-Baserba, M., Caballero, R., Sala-Garrido, R., 2014. Assessing the sustainability of small wastewater treatment systems: A composite indicator approach. Science of the Total Environment 497–498, 607–617.
Morrison, G., Fatoki, O., Zinn, E., Jacobsson, D., 2001. Sustainable development indicators for urban water systems: A case study evaluation of King William’s Town, South Africa, and the applied indicators. Water SA 27 (2), 219–232.
Palme, U., Lundin, M.,Tillman, A., Molander, S., 2005. Sustainable development indicators for wastewater systems – researchers and indicator users in a co-operative case study. Resources, Conservation and Recycling 43, 293–311
Power, D., 2002. Decision Support Systems: Concepts and Resources for Managers. Greenwood, Quorum Books, Westport, CT, USA.
Saaty, T.L., Vargas, L.G., 2012. Models, methods, concepts & applications of the analytic hierarchy process, 2nd ed. International series in operations research & management science 175. Springer, New York.
Saaty, T.L., 1980. The Analytic Hierarchy Process.McGraw-Hill, New York. Sperling, M. von, Lemos Chernicharo, C.A. de, 2005. Biological Wastewater Treatment in Warm
Climate Regions. IWA Publishing. United Nations, 2015. Transforming our world: the 2030 Agenda for Sustain able Development.
Resolution adopted by the General Assembly on 25 September 2015. New York. WHO, 2006. WHO Guidelines for the safe use of wastewater, excreta and greywater: Volume II
Wastewater use in agriculture, Geneva, 222 pp. Woltersdorf, L., Scheidegger, R., Liehr, S., Döll, P., 2016. Municipal water reuse for urban agriculture
in Namibia: Modeling nutrient and salt flows as impacted by sanitation user behavior. Journal of Environmental Management 169, 272-284.
WCED, World Commission on Environment and Development, 1987. Our Common Future. The Brundtland Report. Oxford, U.K.: Oxford University Press.
WWAP (World Water Assessment Programme), 2012. The United Nations World Water Development Report 4: Managing Water under Uncertainty and Risk. UNESCO, Paris, 909 pp. (accessed 5.02.2013).
104

�
�
SupplementS1: Values assigned in the pair-wise comparison of each option for each sub-criterion (Scale:
see Tab. 3)
Ecological
Resource use efficiency
Institutional and political
Institutional complexity
Option 1a 1b 2a 2b Option 1a 1b 2a 2b
1a 1/3 1/9 1/7 1a 1 9 7
1b 1/7 1/3 1b 9 7
2a 3 2a 1/3
Biogeochemical impacts Institutional capacities
Option 1a 1b 2a 2b Option 1a 1b 2a 2b
1a 1 1/9 1/9 1a 5 9 5
1b 1/9 1/9 1b 5 1
2a 1 2a 1/5
Spatial impacts Policies
Option 1a 1b 2a 2b Option 1a 1b 2a 2b
1a 1/5 1/7 3 1a 1/5 1/9 1/9
1b 1/3 7 1b 1/5 1/5
2a 9 2a 1
Legal Security
Economic
Affordability Option 1a 1b 2a 2b
Option 1a 1b 2a 2b 1a 5 5 5
1a 1 5 5 1b 1 1
1b 5 5 2a 1
2a 1
O&M costs - revenues (for town council)
Technical
Construction and maintenance
Option 1a 1b 2a 2b Option 1a 1b 2a 2b
1a 1/3 7 3 1a 1 3 1
1b 9 3 1b 3 1
2a 1/7 2a 1/3
Costs for irrigation water and fertilizers Operation
Option 1a 1b 2a 2b Option 1a 1b 2a 2b
1a 1/3 1/5 1/5 1a 1 1 1
1b 1/3 1/3 1b 1 1
2a 1 2a 1
Poverty Reliability
Option 1a 1b 2a 2b Option 1a 1b 2a 2b
1a 1/3 1/9 1/7 1a 1 1 1
1b 1/7 1/5 1b 1 1
2a 3 2a 1
Financing Tolerance
Option 1a 1b 2a 2b Option 1a 1b 2a 2b
1a 1 9 5 1a 1 5 1/3
1b 9 5 1b 5 1/7
2a 1/5 2a 1/7
Robustness
Social
Accessibility Option 1a 1b 2a 2b
Option 1a 1b 2a 2b 1a 1 1/9 1/5
1a 1 1/9 1/9 1b 1/9 1/5
1b 1/9 1/9 2a 5
2a 1 Lifetime
Practicability Option 1a 1b 1c 1c
Option 1a 1b 2a 2b 1a 1 1 1
1a 1 9 9 1b 1 1
1b 9 9 2a 1
2a 1 Acceptance
105

�
�
Option 1a 1b 2a 2b 1a 1 1/9 1/9 1b 1/9 1/9 2a 1 Social capacities Option 1a 1b 2a 2b 1a 1 1/7 1/7 1b 1/7 1/7 2a 1 Health Option 1a 1b 2a 2b 1a 1 1/9 1/9 1b 1/9 1/9 2a 1 Socio-economic and symbolic values Option 1a 1b 2a 2b 1a 1 1/5 1/5 1b 1/5 1/5 2a 1 Conflict management Option 1a 1b 2a 2b 1a 1 3 3 1b 3 3 2a 1
106