Embed Size (px)
Citation preview

3 Tesla Magnetic Resonance Imaging of Hippocampal Asymmetry: Results from the Dallas
Heart Study
by
RICHARD T. LUCARELLI
DISSERTATION
Presented to the Faculty of the Medical School The University of Texas Southwestern Medical Center at Dallas
In Partial Fulfillment of the Requirements For the Degree of
DOCTOR OF MEDICINE WITH DISTINCTION IN RESEARCH
The University of Texas Southwestern Medical Center at Dallas Dallas, TX
1

ABSTRACT
3 Tesla Magnetic Resonance Imaging of Hippocampal Asymmetry: Results from the Dallas Heart Study
RICHARD T. LUCARELLI
The University of Texas Southwestern Medical Center at Dallas, 2013 Supervising Professor: Ronald M. Peshock, M.D.
Background: Asymmetry of the hippocampus is regarded as an important clinical finding but limited data on hippocampal asymmetry is available for the general population. Here we present hippocampal asymmetry data from the Dallas Heart Study determined by automated methods and its relationship to age, sex, and ethnicity. Methods: 3D-MPRAGE MRI were obtained in 2082 DHS-2 participants. The MR images were analyzed using two standard automated brain segmentation programs, FSL-FIRST and Freesurfer. Individuals with imaging error, self-reported stroke, or major structural abnormalities were excluded. Statistical analyses were performed to determine significance of the findings across age, sex, and ethnicity. Results: At the 90th percentile FSL-FIRST demonstrated hippocampal asymmetry of 9.8% (95% CI 9.3 to 10.5%). The 90th percentile of hippocampal asymmetry measured by the difference between hippocampii over the larger hippocampus was 17.9% (95% CI 17.0 to 19.1%). Hippocampal asymmetry increases with age (P=0.0216) and men have greater asymmetry than women as shown by FSL-FIRST (P=0.0036), but ethnicity is not significantly correlated with asymmetry. To confirm these findings Freesurfer was used. Freesurfer showed asymmetry of 4.4% (95% CI 4.3 to 4.7%) normalized to total volume, and 8.5% (95% CI 8.3 to 9.0%) when normalized by difference/larger hippocampus. Freesurfer also showed that hippocampal asymmetry increases with age (P=0.0024), and that men had greater asymmetry than women (P=0.03). Conclusion: There is a significant degree of hippocampal asymmetry in the population. The data provided will aid in the research, diagnosis, and treatment of temporal lobe epilepsy and other neurological disease.
2

TABLE OF CONTENTS
PRIOR PUBLICATIONS AND PRESENTATIONS…….………………………...…………4 CHAPTER ONE: AN INTRODUCTION ………………………… …………………6 CHAPTER TWO: EXPERIMENTAL PROCEDURES………………………………………7 CHAPTER THREE: RESULTS ………………….………………………………………….10 CHAPTER FOUR: CONCLUSIONS AND RECOMMENDATIONS …….………………………………………………………………12 LIST OF TABLES……………………………………………………………………………16 LIST OF SUPPLEMENTAL TABLES……………………………………………………………………………………...18 LIST OF FIGURES…………………………………………………………………………..20 ACKNOLEDGEMENTS ………………………………………………………………….21 REFERENCES …………………………………………………………………………….22
3

PRIOR PUBLICATIONS & PRESENTATIONS
Research Publications • Lucarelli RT, Khera A, Peshock RM, McColl R, Ayers C, King KS. CRP, IL-18, and BNP are
Associated with Regional Brain Atrophy: Results from the Dallas Heart Study. Abstract: Submitted August 14, 2012: Honolulu HI, International Stroke Conference, 2013.
• Lucarelli RT, Peshock RM, McColl R, Hulsey K, Ayers C, Whittemore R, King KS. Magnetic Resonance Imaging of Hippocampal Asymmetry at 3 Tesla in a Multi-ethnic, Population-Based Sample: Results from the Dallas Heart Study. American Journal of Neuroradiology, 2012.
• Lucarelli RT, Kozlitina J, McColl R, King KS, Hulsey K, Ayers C, Weiner M, and Peshock RM. Accelerometer-measured Physical Activity is Associated with Medial Temporal Lobe Volume in the Dallas Heart Study. Abstract: Chicago, Ill: Radiological Society of North America Annual Meeting, 2012.
• Lucarelli RT, Kevin S. King, Roderick McColl, Keith Hulsey, Colby Ayers, Anthony Whittemore, Ronald M. Peshock. Automated Analysis of Hippocampal Asymmetry at 3 Tesla in a Multi-Ethnic, Population-Based Sample: Results from the Dallas Heart Study. Abstract: Yale University: Doris Duke Clinical Research Forum, 2012.
• Lucarelli RT, Peshock RM, Hulsey K, McColl R, Whittemore A, King KS. Abstract: Asymmetry of the Hippocampus at 3 T: From the Dallas Heart Study. Abstract: Chicago, Ill: American Society Neuroradiology. April 2012.
• Lucarelli RT, McColl R, King KS, Hulsey K, Ayers C, Peshock RM. Automated Analysis of Regional Brain Atrophy in the Dallas Heart Study. Abstract: UT Southwestern: 50th Annual Medical Student Research Forum, 2012.
• Lucarelli RT, Choyke PL. Novel Nanoparticles and Macromolecules in Lymphatic Imaging. Abstract: Convergence: Cancer Research Symposium, 2010.
• Lucarelli RT, Choyke PL. Novel Nanoparticles and Macromolecules in Lymphatic Imaging. Abstract: UT Southwestern: 48th Annual Medical Student Research Forum, 2010.
• Lucarelli RT, Ogawa M, Kosaka N, Turkbey B, Kobayashi H, Choyke PL. New Approaches to Lymphatic Imaging. Lymphatic Research and Biology, 2009 Dec;7(4):205-14.
Research Presentations
• Lucarelli RT, Kozlitina J, McColl R, King KS, Hulsey K, Ayers C, Weiner M, and Peshock RM. Accelerometer-measured Physical Activity is Associated with Medial Temporal Lobe Volume in the Dallas Heart Study. Oral Presentation: Chicago, Ill: Radiological Society of North America Annual Meeting, November 2012.
• Lucarelli RT, Kevin S. King, Roderick McColl, Keith Hulsey, Colby Ayers, Anthony Whittemore, Ronald M. Peshock. Automated Analysis of Hippocampal Asymmetry at 3 Tesla in a Multi-Ethnic, Population-Based Sample: Results from the Dallas Heart Study. Poster: Yale University: Doris Duke Clinical Research Forum, 2012.
• Lucarelli RT, Peshock RM, Hulsey K, McColl R, Whittemore A, King KS. Asymmetry of the Hippocampus at 3T: From the Dallas Heart Study. Oral Presentation: Manhattan, NY: American Society of Neuroradiology, 2012.
• Lucarelli RT. Sweat Your Way to a Bigger Brain: Physical Activity and Regional Brain Atrophy
4
in the Dallas Heart Study. Oral Presentation: Clinical Scholars Works In Progress: UT Southwestern, 2012.
• Lucarelli RT, McColl R, King KS, Hulsey K, Ayers C, Peshock RM. Automated Analysis of Regional Brain Atrophy in the Dallas Heart Study. Poster: UT Southwestern: 50th Annual Medical Student Research Forum, 2012.
• Lucarelli RT, McColl R, King KS, Hulsey K, Ayers C, Peshock RM. Factors Affecting Regional Brain Atrophy: Analysis from the Dallas Heart Study. Oral Presentation: Clinical Scholars Works In Progress: UT Southwestern, 2012.
• Lucarelli RT, Choyke PL. Novel Nanoparticles and Macromolecules in Lymphatic Imaging. Poster: Convergence: Cancer Research Symposium, 2010.
• Lucarelli RT, Choyke PL. Novel Nanoparticles and Macromolecules in Lymphatic Imaging. Poster: UT Southwestern: 48th Annual Medical Student Research Forum, 2010.
• Lucarelli RT, Ogawa M, Kosaka N, Turkbey B, Kobayashi H, Choyke PL. New Approaches to Lymphatic Imaging. Poster: Bethesda, MD: NIH Summer Research Poster Day, 2009.
• Lucarelli RT. New Approaches to Lymphatic Imaging. Oral Presentation: Bethesda, MD Molecular Imaging Program, National Cancer Institute, 2009.
• Agyeiwaa-Boateng A, Choi A, Jain M, Lucarelli RT, El-Hoss C, Lovric C, Maysinger D (alphabetically). Nanoparticles Illuminate Death Path. Montreal, QC: McGill University: Pharmacology Research Day, 2005.
5

CHAPTER 1
Asymmetry of the hippocampus is relevant in neurological disease and is an important clinical finding.
However, we lack hippocampal asymmetry data representative of the general population to guide the
interpretation of hippocampal asymmetry. Additionally, the reliability of prior work analyzing
asymmetry using user guided segmentation has recently been called into question.1 At present, there are
no large studies with broad ethnic representation, utilizing high resolution MRI, and with consistent
application of automated measures of the hippocampus to define the range of values of hippocampal
asymmetry in the general population.
Hippocampal asymmetry is one of the most important findings suggestive of mesial temporal
sclerosis, the most commonly diagnosed structural cause of temporal lobe epilepsy,2 and is used to
lateralize the seizure focus for epilepsy surgery.3-7 Other imaging findings in the hippocampus of mesial
temporal sclerosis include T2 prolongation on MRI, and loss of internal architecture.8 Hippocampal
asymmetry is associated with Mild Cognitive Impairment and Alzheimer's disease, providing a potential
bio-marker for early diagnosis that has been reported to be more accurate than bilateral hippocampal
atrophy.9 Additionally, several studies have suggested a link between asymmetry of the hippocampus in
depression and schizophrenia .10-12
We report a study of a large population-based probability sample, with broad ethnic and age
representation to ascertain the distribution of hippocampal asymmetry and its variance in relation to age,
ethnicity, and sex.
6

CHAPTER 2
Study Population
The Dallas Heart Study (DHS) is a large, multi-ethnic, population-based cohort study of Dallas
County residents which began in 1999. The DHS study was designed to produce unbiased population
estimates of biologic and social variables, as has been previously described.13 Briefly, population
sampling was based on US Postal Service delivery sequence file with selection probabilities increased for
strata with larger concentrations of African Americans so that they would constitute approximately half the
study sample. The study was approved by the Institutional Review Board at the University of Texas
Southwestern Medical Center and all participants provided written informed consent.
Between September 2007 and December 2009, original DHS subjects were asked to participate in a
continuation of the original study termed the Dallas Heart Study-2. Family members and spouses of the
original participants were able to participate in the DHS-2. Participants underwent magnetic resonance
imaging at University of Texas Southwestern Medical Center. Individuals with previous surgery for an
aneurysm in the brain, metal fragments in the eyes, brain, or spinal canal, cardiac pacemaker, implantable
cardiodefibrillators, cochlear implant, spinal cord stimulators, or other internal electrical device, pregnancy,
and occupations associated with exposure to metal fragments were excluded from MR imaging.
A total of 2,082 participants underwent brain MRI. Thirty seven were excluded for self-reported
stroke. Images of outliers as found by Robust Minimum Covariance Distance analysis of brain
segments,18, 19 individuals flagged for exclusion in previous DHS2 MRI brain studies, and individuals who
had error flags generated during automated analysis were reviewed by a neuroradiologist (KSK). Upon
MRI image review, 70 individuals with major structural defects (such as corpus collosum agenesis,
imaging evidence of stroke, and hydrocephalus), or image acquisition errors (such as metal and motion
7

artifact and other noise), were excluded. In total, 107 individuals were excluded from subsequent
analysis.
MRI protocol
Brain MR images were obtained on a 3T MRI scanner (Achieva; Philips Medical Systems, Best, The
Netherlands) using 3D magnetization-prepared rapid acquisition gradient (3D-MPRAGE). Images were
obtained from the vertex of the skull to the foramen magnum in true axial orientation. Specifications for
3D MPRAGE were the following: axial sections reconstructed at 1.0-mm slice thickness; TR, 9.6 ms; TE,
5.8 ms; flip angle, 12°; FOV 260mmx260,mm with a voxel size of 1.0 x 0.9 x 0.9mm.
Image analysis
MRI quantification was performed using the freely available FMRIB software library, FSL-FIRST.14,
15 Volumes of the left and right hippocampus were derived from 3D-MPRAGE sequences. In brief,
the skull was removed from the 3D-MPRAGE images and the remaining images were segmented into
three classes: CSF, WM, and GM. A mask for the hippocampus was created using the FSL-toolkit.
Volumetric data was collected using the FSLstats routine. The present study was focused on the
hippocampus and therefore the cerebellum and brainstem were excluded from analysis.
Further MRI quantification was performed using the Freesurfer image analysis suite, version 4.4,
which is documented and freely available for download online (http://surfer.nmr.mgh.harvard.edu/). The
fully-automated analysis was run at the Texas Advanced Computing Center at The University of Texas at
Austin, Austin, Texas. Volumes of the left and right hippocampus, along with other cortical and subcortical
structures not reported here, were derived from MPRAGE sequences. Individuals who had Talairach
8
atlas registration error (n=11) had the atlas manually aligned following the procedures in the Freesurfer
documentation, and the images were re-analyzed. Individuals with minor error on analysis (n=2) or
timeout errors (n=9) were re-analyzed and the masks generated by Freesurfer were verified by a
neuroradiologist (KSK).
Hippocampal asymmetry was calculated by taking the absolute value of the difference of left and
right hippocampal volume and dividing by the total hippocampal volume. Another measure which has
practical significance when interpreting MRI was calculated by taking the value of the difference between
the left and right volume and dividing by the larger of the right or left hippocampus.
Statistical Analysis
Statistical analyses were performed using SAS Version 9.2.0 (Cary, NC, USA). Ninety-five percent
distribution-free confidence intervals were generated with the Hahn and Meeker method.16 Differences in
hippocampal asymmetry as measured by FSL-FIRST for gender were evaluated with two-sided
Mann-Whitney U-test at a significance level of <0.05. Differences in hippocampal asymmetry as
measured by Freesurfer, to confirm FSL-FIRST results, were evaluated with one-sided Mann-Whitney
U-test at significance level of <0.05. The correlation between age and hippocampal asymmetry was
evaluated using Spearman Rank-Order correlation at a significance level of <0.05. Comparison of mean
age among men and women was compared using the student T-test and among whites, Hispanics, and
African Americans using ANOVA with Tukey's multiple comparison procedure. The correlation between
ethnicity and hippocampal asymmetry was evaluated adjusting for age as a co-variate using the general
nonparametric approach developed by Schacht, et al.17
9

CHAPTER 3
After exclusion analysis, 1975 individuals were evaluated with a gender makeup of 58.3% (n=1151)
female, and 41.7% (n=824) male and an ethnic makeup of 46.3% (n=914) African Americans, 37.2%
(n=735) white, 14.1% (n=279) Hispanic and 2.4% (n=47) other or not reported. The mean age was 49.8
± 10.5 years.
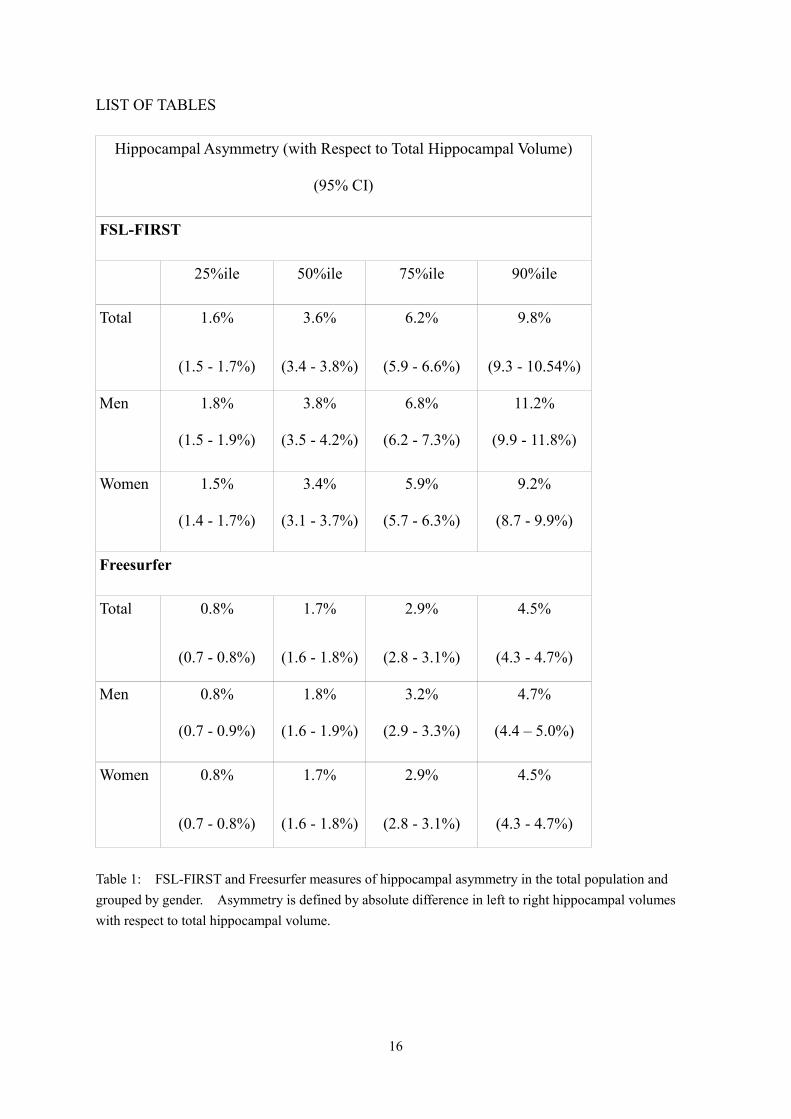
The degree of hippocampal asymmetry and its relationship to gender is shown in Table 1 and Table 2.
FSL-FIRST demonstrated significant asymmetry in our population (Table 1). After normalizing the
difference in left and right hippocampal volume to the total hippocampal volume, the magnitude of
hippocampal asymmetry at the 90th percentile for FSL-FIRST was 9.8% (95% CI 9.3% to 10.5%).
When clinically evaluating images for asymmetry, the magnitude is typically assessed by comparing the
size of the smaller hippocampus with that of the larger, and this measure is shown in Table 3. FSL-FIRST
also showed that men had significantly more asymmetry than women (P=0.0036). The median degree
of hippocampal asymmetry for men was 3.8% (95% CI 3.5% to 4.2%) and it was 3.4% (95% CI 3.1% to
3.7%) for women. The magnitude of asymmetry was also shown to increase with age (P=0.0216) when
evaluated with FSL-FIRST and increased from 2.7% in the 2nd decade to 4.5% in the 7th decade (Figure 1).
This increase in hippocampal asymmetry with age was more pronounced in the top 90th percentile of
individuals and increased from 9.9% to 11.3% as measured by FSL-FIRST (Figure 1). When evaluating
for ethnic differences in hippocampal asymmetry we found that there was a significant difference in age
amongst Hispanics, whites, and African Americans (P<0.0001). After controlling for differences in age,
there was no significant correlation between ethnicity and hippocampal asymmetry.
To confirm the findings found with FSL-FIRST, another automated program, Freesurfer, was used to
evaluate asymmetry as shown in Table 1 and 2. Freesurfer also showed a significant degree of
10

asymmetry in our population when normalizing asymmetry by taking the difference between the left and
right hippocampus over the total hippocampal volume (Table 1). This difference in asymmetry was also
apparent when normalizing the difference between the left and right hippocampus to the larger of the two
hippocampii (Table 2). Freesurfer further demonstrated an increase in hippocampal asymmetry with
increasing age (P=0.0024) as shown in Figure 1. The difference between men and women seen with
FSL-FIRST was confirmed with Freesurfer (P=0.03), but ethnicity was not associated with asymmetry
when controlled for age.
11

CHAPTER 4
Our study reports a detailed description of the magnitude of hippocampal asymmetry analyzed with
fully-automated segmentation methods using high magnetic field strength MRI among participants in the
Dallas Heart Study. To our knowledge, this is the first description of the magnitude of hippocampal
asymmetry with evaluation of distributions by age, gender, and ethnicity in a multi-ethnic population-based
probability sample of community dwelling individuals. We initially performed our analysis using
FSL-FIRST and noted a significant degree of hippocampal asymmetry in the population. To confirm
these findings, we used a second commonly used software package, Freesurfer, which confirmed the
finding of hippocampal asymmetry in our population. We took a conservative approach by reporting
quartiles and the top 90th percentile, yet by definition 10% of individuals in our study have an even greater
degree of asymmetry than reported here (more detailed results are shown in supplemental Tables 1 and 2).
We chose to report asymmetry in two different ways. The majority of our analysis utilizes a traditional
approach reporting hippocampal asymmetry normalized by total hippocampal volume (Table 1 and Figure
1). However, we also report hippocampal asymmetry normalized by the larger of the two hippocampii as
this reflects the evaluation when attempting to visually determine symmetry between hippocampi in a
clinical setting (Table 2).
This work expands our knowledge of hippocampal asymmetry in several ways. Our current
conceptions regarding hippocampal asymmetry are based largely on studies with user guided segmentation
performed by experts in neuroanatomy. However, a recent analysis of user guided segmentation has
shown the technique to be flawed. By presenting randomly inserted mirror images for analysis,
investigators were able to determine a consistent left-right bias in subcortical segmentation which was
most significant for the hippocampus, in some cases as high as 11%. The authors proposed 'laterality of
12

visual perception' as an inherent limitation in any study employing user interaction in hippocampal
segmentation and further suggested a reappraisal of prior work in light of this finding.1 Thus, data
previously reported using manual segmentation has the potential for material bias.
Previous studies of hippocampal volumes and asymmetry were limited by the time intensive nature of
user guided segmentation, and as a result no large population based studies have been conducted.
Pedraza et al. sought to address the small size of these previous studies by performing a meta-analysis on
82 studies for a total of 3,564 participants from the control groups.20 This approach primarily addresses
type II errors, or low power, among prior studies. This approach does not, however, address selection
bias, as control groups are not designed to reflect the general population.21, 22 Using automated
techniques we were able to examine data from 1975 individuals using the same segmentation methods,
imaging technique, and MRI hardware.
Because signal strength may influence image quality, and thus the accuracy of segmentation, our
analysis was conducted using 3 Tesla 3D-MPRAGE images reconstructed at 1mm slices, providing high
resolution volumetric images compared to previous 1.5 Tesla studies. The amount of hippocampal
asymmetry demonstrated is higher than reported in previous studies and while the reason for this is
presently unknown and may be due to technical improvements in our study, it could also be due to other
existing pathology present in a population-based sample which may affect the hippocampal asymmetry
seen in our study participants.
Prior studies have validated the automated methods used for the segmentation of deep brain nuclei
using manual segmentation and post-mortem autopsy as the gold standard references.23-25 While the
validity of manual segmentation itself has recently been called into question,1 one would not expect these
automated measures to suffer from the same systematic bias of manual tracing. Recently there has been
13
considerable effort to compare the sensitivity of these automated methods in determining hippocampal
volume. Pardoe and Morey in separate studies both conclude that Freesurfer is more sensitive at
detecting hippocampal atrophy than FSL-FIRST.26, 27 Pardoe further concludes that Freesurfer is less
likely than FSL-FIRST to fail to detect atrophy of the hippocampus when compared to manual
segmentation.27 Notably, FSL-FIRST was found to have greater variation than Freesurfer when
determining hippocampal volume compared to manual tracing.26 However, FSL-FIRST has several
advantages compared to Freesurfer including much faster processing time and requiring considerably less
computing resources. It needs to be clearly stated that such prior validation efforts and our own analysis
are designed for accurate assessment of hippocampal asymmetry in the population and targeted groups.
This work does not advocate replacing qualitative analysis of MR images for individual clinical diagnosis.
Additionally, while our data shows a significant degree of hippocampal asymmetry in the general
population as measured by automated methods, it is not clear at what magnitude this asymmetry would be
detected clinically. It would be fruitful to investigate what percent difference in hippocampal asymmetry
is detectable clinically by expert reviewers to further elucidate the impact of the findings reported herein.
It should be noted that the sample we have evaluated in this study was designed to be
representative of the adult population of Dallas County, with oversampling to ensure approximately half
our population was from African Americans. We evaluated hippocampal asymmetry with respect to
ethnicity and did not see a significant difference in our sample. We did not evaluate or exclude any
persons based on their neurological or psychiatric histories. Our study is designed to be reflective of the
general population without history of stroke. Diseases which have a high prevalence in the general
population that do not preclude independent living in the community are likely included in this sample.
In the case of epilepsy, prior studies of prevalence would suggest we would have approximately 5
14

individuals per 1000 with a history of epilepsy.28 By focusing on median values and percentile ranges,
and using non-parametric analysis the effects of specific outliers is limited. However, early changes that
may lead to Mild Cognitive Impairment or eventually Alzheimer’s disease may be observed in our study to
the same extent that they would be observed among the general population.
Our data suggests a large degree of asymmetry in the general population and questions how much
weight should be placed on mild hippocampal asymmetry as a solitary imaging finding. For the example
of mesial temporal sclerosis, we would suggest that future quantitative studies evaluate the degree of
hippocampal asymmetry rather than presence or absence. Further studies should also include other
abnormalities such as increased signal on FLAIR or loss of the normal internal architecture into a
comprehensive predictive model. In the example of suspected mesial temporal sclerosis this may lead to
improved diagnostic accuracy of pre-surgical imaging and more precise patient selection for epilepsy
surgery.
The data presented herein on the magnitude of hippocampal asymmetry provides the first large,
population based study with broad ethnic representation using high resolution MRI and fully-automated
methods. Our findings suggest that age and gender should be considered when evaluating hippocampal
asymmetry and that caution is warranted in the interpretation of hippocampal asymmetry as an indicator of
pathology.
15
LIST OF TABLES
Hippocampal Asymmetry (with Respect to Total Hippocampal Volume)
(95% CI)
FSL-FIRST
25%ile 50%ile 75%ile 90%ile
Total 1.6%
(1.5 - 1.7%)
3.6%
(3.4 - 3.8%)
6.2%
(5.9 - 6.6%)
9.8%
(9.3 - 10.54%)
Men 1.8%
(1.5 - 1.9%)
3.8%
(3.5 - 4.2%)
6.8%
(6.2 - 7.3%)
11.2%
(9.9 - 11.8%)
Women 1.5%
(1.4 - 1.7%)
3.4%
(3.1 - 3.7%)
5.9%
(5.7 - 6.3%)
9.2%
(8.7 - 9.9%)
Freesurfer
Total 0.8%
(0.7 - 0.8%)
1.7%
(1.6 - 1.8%)
2.9%
(2.8 - 3.1%)
4.5%
(4.3 - 4.7%)
Men 0.8%
(0.7 - 0.9%)
1.8%
(1.6 - 1.9%)
3.2%
(2.9 - 3.3%)
4.7%
(4.4 – 5.0%)
Women 0.8%
(0.7 - 0.8%)
1.7%
(1.6 - 1.8%)
2.9%
(2.8 - 3.1%)
4.5%
(4.3 - 4.7%)
Table 1: FSL-FIRST and Freesurfer measures of hippocampal asymmetry in the total population and grouped by gender. Asymmetry is defined by absolute difference in left to right hippocampal volumes with respect to total hippocampal volume.
16

Hippocampal Asymmetry (with Respect to Larger Hippocampus)
(95% CI)
25%ile 50%ile 75%ile 90%ile
FSL-FIRST 3.1%
(2.9 - 3.4%)
6.9%
(6.5 - 7.2%)
11.7%
(11.3 - 12.4%)
17.9%
(17.0 - 19.1%)
Freesurfer 1.5%
(1.4 - 1.6%)
3.3%
(3.1 - 3.5%)
5.7%
(5.4 - 5.9%)
8.5%
(8.3 -9%)
Table 2: Hippocampal asymmetry, defined by the absolute difference in left to right hippocampal volumes with respect to the volume of the larger side.
17

LIST OF SUPPLEMENTAL TABLES
Hippocampal Asymmetry (with Respect to Total Hippocampal Volume)
FSL-FIRST
25%ile 50%ile 75%ile 90%ile 98%ile 99%ile
Total 1.6% 3.6% 6.2% 9.8% 16.7% 19.9%
Men 1.8% 3.8% 6.8% 11.2% 18.0% 20.7%
Women 1.5% 3.4% 5.9% 9.2% 14.5% 18.4%
Freesurfer Total 0.8% 1.7% 2.9% 4.5% 6.9% 8.5%
Men 0.8% 1.8% 3.2% 4.7% 7.5% 8.5%
Women 0.8% 1.7% 2.9% 4.5% 6.4% 8.5%
Supplemental Table 1: Extended table of FSL-FIRST and Freesurfer measures of hippocampal asymmetry in the total population and grouped by gender. Asymmetry is defined by absolute difference in left to right hippocampal volumes with respect to total hippocampal volume.
18

Hippocampal Asymmetry (with Respect to Total Hippocampal Volume)
FSL-FIRST
Decade 25%ile 50%ile 75%ile 90%ile 98%ile 99%ile
2nd 1.7% 2.7% 6.1% 8.9% 16.1% 16.1%
3rd 1.5% 3.1% 5.4% 8.6% 12.4% 17.3%
4th 1.7% 3.7% 6.5% 9.8% 16.5% 20.7%
5th 1.5% 3.5% 6.4% 11.0% 17.0% 19.0%
6th 1.5% 3.7% 6.6% 9.5% 18.5% 27.5%
7th 3.1% 4.5% 7.5% 11.3% 15.6% 16.7%
Freesurfer 2nd 0.7% 1.7% 2.5% 3.7% 4.3% 4.3%
3rd 0.7% 1.6% 2.5% 4.0% 6.8% 7.8%
4th 0.8% 1.6% 2.8% 4.4% 6.8% 8.9%
5th 0.8% 1.7% 3.0% 4.5% 7.0% 8.5%
6th 0.7% 1.8% 3.1% 4.7% 7.4% 8.1%
7th 1.1% 1.9% 3.8% 5.4% 8.4% 9.3%
Supplemental Table 2: Extended table of FSL-FIRST and Freesurfer measures of hippocampal asymmetry grouped by decade. Asymmetry is defined by absolute difference in left to right hippocampal volumes with respect to total hippocampal volume. (2nd decade N=28, 3rd decade N=331, 4th decade N=613, 5th decade N=601, 6th decade N=344, 7th decade N=53)
19

LIST OF FIGURES
Figure 1: Hippocampal asymmetry increases with age as measured by FSL-FIRST (top) and Freesurfer (bottom). (Less than 1% of points are not plotted to preserve scale. 2nd decade N=28; 3rd decade N=331; 4th decade N=613; 5th decade N=601; 6th decade N=344; 7th decade N=53)
20

ACKNOLEDGEMENTS
Richard T. Lucarelli is a recipient of a Clinical Research Fellowship from the Doris Duke Charitable
Foundation. The authors would like to acknowledge Dr. Myron Weiner for his contributions to this
project. The authors further appreciate the statistical support provided by Dr. Linda Hynan. The authors
acknowledge the Texas Advanced Computing Center (TACC) at The University of Texas at Austin for
providing High Performance Computing resources that have contributed to the research results reported
within this paper (http://www.tacc.utexas.edu). The authors thank the staff of the University of Texas
Southwestern and the Dallas Heart Study for their important contributions.
21

REFERENCES
1. Maltbie E, Bhatt K, Paniagua B, et al. Asymmetric bias in user guided segmentations of brain
structures. NeuroImage 2011;59(2):1315-23
2. Blumcke I. Neuropathology of focal epilepsies: a critical review. Epilepsy & behavior : E&B
2009;15:34-39
3. Breier JI, Leonard CM, Bauer RM, et al. Quantified volumes of temporal lobe structures in patients
with epilepsy. Journal of neuroimaging : official journal of the American Society of Neuroimaging
1996;6:108-114
4. Gilmore RL, Childress MD, Leonard C, et al. Hippocampal volumetrics differentiate patients with
temporal lobe epilepsy and extratemporal lobe epilepsy. Archives of neurology 1995;52:819-824
5. Radhakrishnan K, So EL, Silbert PL, et al. Predictors of outcome of anterior temporal lobectomy for
intractable epilepsy: a multivariate study. Neurology 1998;51:465-471
6. Salanova V, Markand O, Worth R. Longitudinal follow-up in 145 patients with medically refractory
temporal lobe epilepsy treated surgically between 1984 and 1995. Epilepsia 1999;40:1417-1423
7. Watson C, Jack CR, Jr., Cendes F. Volumetric magnetic resonance imaging. Clinical applications and
contributions to the understanding of temporal lobe epilepsy. Archives of neurology 1997;54:1521-1531
8. Woermann FG, Vollmar C. Clinical MRI in children and adults with focal epilepsy: a critical review.
Epilepsy & behavior : E&B 2009;15:40-49
9. Shi F, Liu B, Zhou Y, et al. Hippocampal volume and asymmetry in mild cognitive impairment and
Alzheimer's disease: Meta-analyses of MRI studies. Hippocampus 2009;19:1055-1064
10. Kronmuller KT, Schroder J, Kohler S, et al. Hippocampal volume in first episode and recurrent
depression. Psychiatry research 2009;174:62-66
22

11. Qiu A, Wang L, Younes L, et al. Neuroanatomical asymmetry patterns in individuals with
schizophrenia and their non-psychotic siblings. NeuroImage 2009;47:1221-1229
12. Xia J, Chen J, Zhou Y, et al. Volumetric MRI analysis of the amygdala and hippocampus in subjects
with major depression. Journal of Huazhong University of Science and Technology Medical sciences
2004;24:500-502, 506
13. Victor RG, Haley RW, Willett DL, et al. The Dallas Heart Study: a population-based probability
sample for the multidisciplinary study of ethnic differences in cardiovascular health. The American journal
of cardiology 2004;93:1473-1480
14. Smith SM, Jenkinson M, Woolrich MW, et al. Advances in functional and structural MR image
analysis and implementation as FSL. NeuroImage 2004;23 Suppl 1:S208-219
15. Woolrich MW, Jbabdi S, Patenaude B, et al. Bayesian analysis of neuroimaging data in FSL.
NeuroImage 2009;45:S173-186
16. Hahn GJ, Meeker WQ. Statistical Intervals: A Guide for Practitioners. New York: John Wiley &
Sons; 1991
17. Schacht A, Bogaerts K, Bluhmki E, et al. A new nonparametric approach for baseline covariate
adjustment for two-group comparative studies. Biometrics 2008;64:1110-1116
18. Jackson DA, Chen Y. Robust principal component analysis and outlier detection with ecological data.
Envirometrics 2004;15:129-139
19. Filzmoser P, Garrett RG, Reimann C. Multivariate outlier detection in exploration geochemistry.
Computers & Geosciences 2005;31:579-587
20. Pedraza O, Bowers D, Gilmore R. Asymmetry of the hippocampus and amygdala in MRI volumetric
measurements of normal adults. J Int Neuropsychol Soc 2004;10:664-678
23
21. Kleinbaum DG, Morgenstern H, Kupper LL. Selection bias in epidemiologic studies. American
journal of epidemiology 1981;113:452-463
22. Wacholder S, Silverman DT, McLaughlin JK, et al. Selection of controls in case-control studies. III.
Design options. American journal of epidemiology 1992;135:1042-1050
23. Fischl B, Salat DH, Busa E, et al. Whole brain segmentation: automated labeling of neuroanatomical
structures in the human brain. Neuron 2002;33:341-355
24. Patenaude B, Smith SM, Kennedy DN, et al. A Bayesian model of shape and appearance for
subcortical brain segmentation. NeuroImage 2011;56:907-922
25. Rosas HD, Liu AK, Hersch S, et al. Regional and progressive thinning of the cortical ribbon in
Huntington's disease. Neurology 2002;58:695-701
26. Morey RA, Petty CM, Xu Y, et al. A comparison of automated segmentation and manual tracing for
quantifying hippocampal and amygdala volumes. NeuroImage 2009;45:855-866
27. Pardoe HR, Pell GS, Abbott DF, et al. Hippocampal volume assessment in temporal lobe epilepsy:
How good is automated segmentation? Epilepsia 2009;50:2586-2592
28. Forsgren L, Beghi E, Oun A, et al. The epidemiology of epilepsy in europe - a systematic review. Eur
J Neurol. 2005;12:245-253
24