Embed Size (px)
Citation preview

» Svolder has tremendous opportunities to apply a long-term management strategy for the benefit of portfolio companies and Svolder’s shareholders alike. »Managing Director’s comments, page 3
#3
interim report 2015/2016Interim period: 1st September 2015 – 31st May 2016 (9 months). Current reporting period: 1st March – 31st May 2016 (3 months)
result for current reporting period (3 months)» The company posted a result for the period of SEK 193.8 million (SEK 57.7 m),
corresponding to SEK 15.10 (SEK 4.50) per share.
» The net worth rose by 11.7% to SEK 144.60 per share.
» The listed price of the Class B share increased by 18.9% to SEK 133.50 per share.
» The Carnegie Small Cap Return Index rose by 8.0%.
result for the interim period (9 months)» The company posted a result for the period of SEK 407.5 million (SEK 243.9 m),
corresponding to SEK 31.80 (SEK 19.10) per share.
» Net worth rose by 27.9%, including reinvested dividend, to SEK 144.60 per share.
» The listed price of the Class B share increased by 31.7%, including reinvested dividend, to SEK 133.50 per share.
» The Carnegie Small Cap Return Index rose by 17.1%.
» The closing discount on net worth was 7.7%.
net worth
143SEK/share on 3rd June 2016
share price
129.00SEK on 3rd June 2016
major contributors to net worth
Current reporting period (3 months)
Positive (+)GARO
OriflameMagnolia Bostad
Negative (–)Bong
major changes in the equities portfolio
Current reporting period (3 months)
Bought (+)KlövernGARO
Magnolia Bostad
Sold (–)Proact
Platzer FastigheterScandi Standard

2
Dear Shareholder,After yet another positive quarter, Svolder is able to report that its net worth has reached an all time high of SEK 145 per share, which corresponds to SEK 1.85 billion, after va-lue growth of 12 per cent. The share price rose by a full 19 per cent during the same period. Seen over both the most recent three and nine-month periods, Svolder exceeded the CSRX index for small and medium-sized companies as well as the SIXRX for the Swedish stock exchange as a whole. The outcome for slightly smaller Swedish listed compa-nies is also excellent from a longer-term perspective, and Svolder’s administration results appear to create value from both an absolute and a relative owner perspective.
Total return1) 10 years in % on 31st May 2016
SIXRXCSRX
20162015201420132012201120102009200820072006
250
200
150
100
50
0
–50
Net worthShare price
1) Total return is calculated using comparable methods to reinvestment indices and funds, i.e. assuming that the dividend paid is reinvested at the time of the dividend in underlying types of assets.
Share of management costs falling
In the context of asset management, management costs are important to long-term value growth. I am therefore deligh-ted to note that Svolder’s share of management costs has fal-len over the last five-year period. The reasons for this are the absolute value growth, the change to a dividend policy that is more cash flow neutral and controlled cost development, in that order. With costs and net worth at their current level, the share of costs, excluding any variable remuneration, is less than one per cent. This has been an interim goal and we are now continuing this work. In this context, however, I think it is important that shareholders not only focus on gross costs but also see that the active management creates value. Svolder has an incentive system which is consistent with shareholders’ interests. It is a three-year scheme based on higher returns compared to a stock exchange index and includes a ceiling for the annual payment which, if paid out, must be invested in Svolder shares that are held for at least three years.
Share of management costs, %
(Management costs in relation to average net worth)
(R12
) 201
5/20
16
2014
/201
5
2013
/201
4
2012
/201
3
2011
/201
2
2010
/201
1
2009
/201
0
2008
/200
9
2007
/200
8
2006
/200
7
2005
/200
6
2004
/200
5
2003
/200
4
2002
/200
3
2001
/200
2
2,6
2,2
1,8
1,4
1,0
0,6
Incl. variable remunerationExcl. variable remuneration
Source: Morningstar, Svolder and SIX
THE MANAGING DIRECTOR’S
COMMENTS

3
Svolder’s portfolio governanceThe general meetings of shareholders for 2015 and the in-terim reports for the first quarter of 2016 are now history. This gives rise to a lot of comments, which are also con-veyed in the formal part of the interim report. Svolder’s representatives have attended most of the portfolio com-panies’ general meetings, and in several instances we have also helped with the preparations via these companies’ nomination committees. Svolder considers it important to take into account each listed company’s distinctive cha-racter and the special external conditions under which they operate. We therefore strive to identify individual solutions for the boards’ composition and other corporate governance, for example. There is often a need for both continuity and a desire to change, and for dependent and independent board members. The main elements can be summed up in the words professionalism, experience and commitment. We are usually in agreement with other ma-jor shareholders on these issues, but there are some situa-tions where we think the set goals and requirements should be reflected more in incentive programmes, for example. Mainly, however, we work behind the scenes and prefer to work without being seen, so to speak.
Small companies continue to perform
The slightly smaller companies on the Stockholm stock exchange have been developing far better than the larger companies for several years. One explanation is probably the stronger reliance on the Nordic markets, which have seen better economic development than other markets. Another reason could be that major asset managers in va-rious growth countries in Asia and the Middle East have been net sellers of international shares, which has affected larger companies more than smaller companies. With this in mind, we should also praise many of the management teams, personnel and boards at the small and medium-sized companies for their professional commitment and results, both in terms of profit and value growth. For Svolder, which specialises in this category of listed company, the results have been successful over several time frames.
Total return1) in % on 31st May 2016
Svolder
1 year 1/6 2015 – 31/5 2016
3 years 1/6 2013 – 31/5 2016
5 years 1/6 2011 – 31/5 2016
10 years 1/6 2006 – 31/5 2016
Net worth 23 101 107 236
Share price (Class B) 27 117 124 248
Stock market index
CSRX 12 90 117 208
SIXRX –6 42 60 132
1) Total return is calculated using comparable methods to reinvestment indices and funds, i.e. assuming that the dividend paid is reinvested at the time of the dividend in underlying types of assets.
Dividends and stock picking create added value
Svolder can now also sum up the 2015 dividend season with the comment that the resolved share dividends exceeded our expectations somewhat. This is particularly true of the portfolio companies Acando, Troax andXANO. The total yield is almost 3 per cent of the portfolio value, but this does not include Oriflame’s dividend which is paid in late 2016 and early 2017, or the dividend capacity of the newly listed companies Scandic Hotels and GARO, which will not reach the new owners until after the 2016 financial year.
Over the past three-month period, Oriflame and GARO in particular have excelled with contributions to net worth totalling over SEK 81 million. Furthermore, the portfolio companies that had a negative return during this period are fortunately smaller and fewer in number. It is clear that Oriflame’s profitable, fast-growing operations outside of the former Soviet states are now beginning to be noticed and valued by investors. The fact that the cosmetics com-pany has also begun to resume share dividends reduces our own risk premium, and probably also that of several other portfolio managers.
Well placed in an environment with many sell-offs
During the current reporting period the company’s liquid assets increased by almost SEK 150 million. This is partly due to the receipt of SEK 39 million in dividends, but also to the departure of companies like Proact and Scandi Stan-dard from the portfolio. As a result, Svolder’s liquid assets etc. were approximately SEK 206 million on the closing day, which equates to over 11 per cent of the portfolio value. We anticipate a number of potential additional positions in portfolio companies, but we are also in ongoing nego-tiations about involvement as an ‘anchor investor’ in some potential new listed companies. In general we are seeing that many companies want to join the stock exchange’s main list and even more want to join more unofficial lists, such as Aktietorget and First North, although here we apply cau-tion. We find that the quality of company and valuation varies greatly, but a large offering also creates opportuni-ties for long-term players like Svolder. Provided there are good growth opportunities, a dedicated and experienced management team, driven long-term owners, an attractive company history, good business acumen and the ability to pay dividends in the long term, not to mention a reasonable share valuation, Svolder will be able to remain an active an-chor investor. Since the investment company’s equity is not affected by the current inflow or outflow from the owners, as in various unit trusts, Svolder has tremendous opportunities to apply a long-term management strategy for the benefit of portfolio companies and Svolder’s shareholders alike.
Yours faithfully
ulf hedlundhManaging Director
Source: Morningstar, Svolder and SIX

4
the equities portfolio31/5 2016
Share QuantityShare price
(SEK)1)
Market value
(SEK m)% of
net worth
% of the company’s
capital 2)
% of the company’s
votes 2)
Saab 800,000 277.50 222.0 12.0 0.7 0.6
Troax 1,781,576 113.00 201.3 10.9 8.9 8.9
Acando3) 7,921,000 17.00 134.7 7.3 7.6 9.1
Nolato 499,892 217.00 108.5 5.9 1.9 1.0
GARO 700,000 147.00 102.9 5.6 7.0 7.0
New Wave Group 2,562,246 39.70 101.7 5.5 3.8 1.0
Magnolia Bostad 1,107,557 90.25 100.0 5.4 2.9 2.9
Scandic Hotels Group 1,261,961 62.50 78.9 4.3 1.2 1.2
Oriflame4) 390,000 196.20 76.5 4.1 0.7 0.7
Beijer Alma 400,000 190.00 76.0 4.1 1.3 0.7
XANO Industri 370,748 183.00 67.8 3.7 5.4 1.5
Klövern Class B 5,900,000 9.88 58.3 3.1 0.6 0.4
Platzer Fastigheter 1,296,166 44.00 57.0 3.1 1.4 0.5
Nobina 1,308,517 41.40 54.2 2.9 1.5 1.5
Boule Diagnostics 524,436 87.00 45.6 2.5 11.1 11.1
SSAB Class B incl. TR4)5) 1,500,000 24.96 37.4 2.0 0.2 0.0
AGES Industri 314,059 107.00 33.6 1.8 4.6 1.3
Elos Medtech 309,832 92.25 28.6 1.5 5.1 1.9
Orexo 523,492 48.80 25.5 1.4 1.5 1.5
Verisec 226,000 80.50 18.2 1.0 5.6 5.6
Bong 16,661,088 0.93 15.4 0.8 7.9 7.9
Equities portfolio 1,644.1 88.8
Net debt (–)/net receivable (+) 206.5 11.2
Total/net worth 1,850.6 100.0
144.60 SEK per Svolder share
All securities holdings, except for SSAB TR, come under level 1 of the value hierarchy.
1) In calculating the market value (fair value), the bid price for the securities on Nasdaq Stockholm on the closing day has been used. 2) Based on outstanding shares in the portfolio company. 3) Of which 7,421,000 Acando Class B and 500,000 Acando Class A shares. 4) The above-mentioned holdings on the closing day 31st May 2016 included loaned shares as follows: 194,617 Oriflame shares and 1,000,000 SSAB shares. 5) Refers to 1,500,000 SSAB Class B shares at a bid price of SEK 18.21 and 1,500,000 SSAB TR shares valued at SEK 6.75 per share.
The following is an example of information that can be drawn from the table: Svolder’s largest holding is Saab, which has a market value of SEK 222.0 million, corresponding to 12.0 per cent of net worth. A one per cent change in Saab’s share price (bid price on the closing day) affects Svolder’s net worth by SEK 2.2 million, which equates to SEK 0.20 per Svolder share.
5
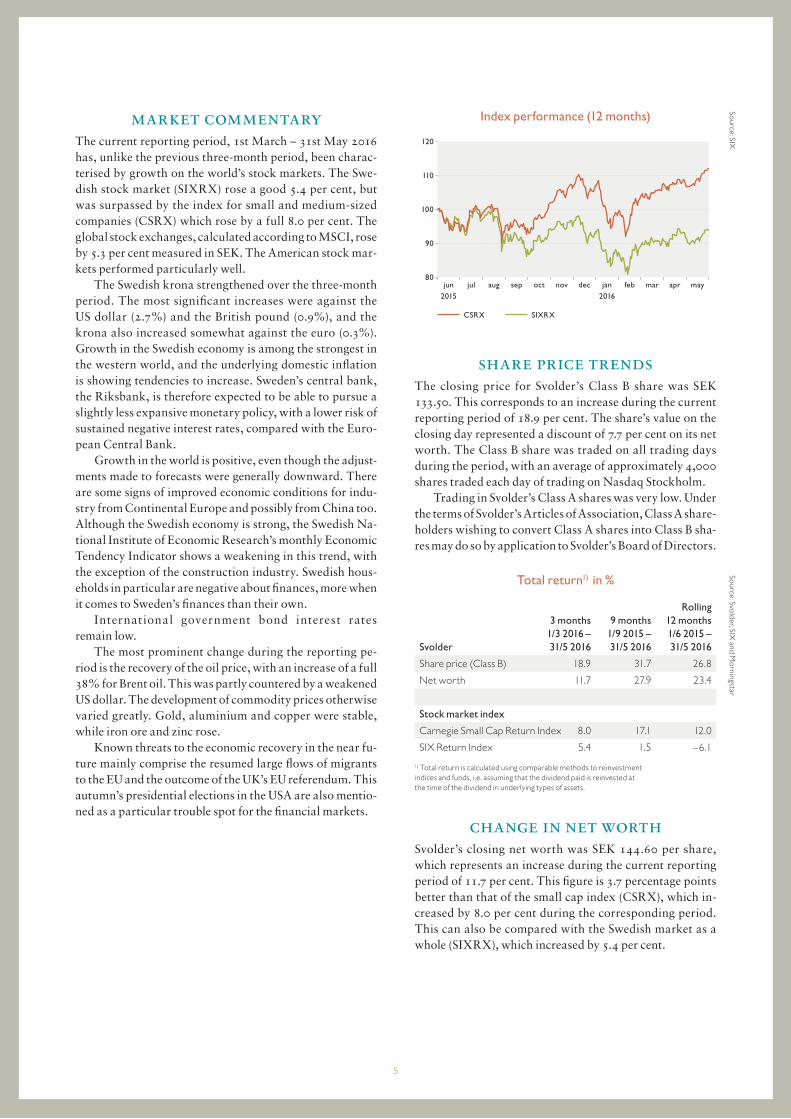
market commentaryThe current reporting period, 1st March – 31st May 2016 has, unlike the previous three-month period, been charac-terised by growth on the world’s stock markets. The Swe-dish stock market (SIXRX) rose a good 5.4 per cent, but was surpassed by the index for small and medium-sized companies (CSRX) which rose by a full 8.0 per cent. The global stock exchanges, calculated according to MSCI, rose by 5.3 per cent measured in SEK. The American stock mar-kets performed particularly well.
The Swedish krona strengthened over the three-month period. The most significant increases were against the US dollar (2.7%) and the British pound (0.9%), and the krona also increased somewhat against the euro (0.3%). Growth in the Swedish economy is among the strongest in the western world, and the underlying domestic inflation is showing tendencies to increase. Sweden’s central bank, the Riksbank, is therefore expected to be able to pursue a slightly less expansive monetary policy, with a lower risk of sustained negative interest rates, compared with the Euro-pean Central Bank.
Growth in the world is positive, even though the adjust-ments made to forecasts were generally downward. There are some signs of improved economic conditions for indu-stry from Continental Europe and possibly from China too. Although the Swedish economy is strong, the Swedish Na-tional Institute of Economic Research’s monthly Economic Tendency Indicator shows a weakening in this trend, with the exception of the construction industry. Swedish hous-eholds in particular are negative about finances, more when it comes to Sweden’s finances than their own.
International government bond interest rates remain low.
The most prominent change during the reporting pe-riod is the recovery of the oil price, with an increase of a full 38% for Brent oil. This was partly countered by a weakened US dollar. The development of commodity prices otherwise varied greatly. Gold, aluminium and copper were stable, while iron ore and zinc rose.
Known threats to the economic recovery in the near fu-ture mainly comprise the resumed large flows of migrants to the EU and the outcome of the UK’s EU referendum. This autumn’s presidential elections in the USA are also mentio-ned as a particular trouble spot for the financial markets.
Index performance (12 months)
SIXRXCSRX
2015 2016jun jul aug sep nov dec jan feb mar apr
120
110
100
90
80oct may
share price trendsThe closing price for Svolder’s Class B share was SEK 133.50. This corresponds to an increase during the current reporting period of 18.9 per cent. The share’s value on the closing day represented a discount of 7.7 per cent on its net worth. The Class B share was traded on all trading days during the period, with an average of approximately 4,000 shares traded each day of trading on Nasdaq Stockholm.
Trading in Svolder’s Class A shares was very low. Under the terms of Svolder’s Articles of Association, Class A share-holders wishing to convert Class A shares into Class B sha-res may do so by application to Svolder’s Board of Directors.
Total return1) in %
Svolder
3 months 1/3 2016 – 31/5 2016
9 months 1/9 2015 – 31/5 2016
Rolling 12 months 1/6 2015 – 31/5 2016
Share price (Class B) 18.9 31.7 26.8
Net worth 11.7 27.9 23.4
Stock market index
Carnegie Small Cap Return Index 8.0 17.1 12.0
SIX Return Index 5.4 1.5 –6.1
1) Total return is calculated using comparable methods to reinvestment indices and funds, i.e. assuming that the dividend paid is reinvested at the time of the dividend in underlying types of assets.
change in net worthSvolder’s closing net worth was SEK 144.60 per share, which represents an increase during the current reporting period of 11.7 per cent. This figure is 3.7 percentage points better than that of the small cap index (CSRX), which in-creased by 8.0 per cent during the corresponding period. This can also be compared with the Swedish market as a whole (SIXRX), which increased by 5.4 per cent.
Source: SIXSource: Svolder, SIX
and Morningstar

6
Svolder (SEK per share) and CSRX (3 months)
CSRX1)
2016mar apr
140
130
120
110
100
Share priceNet worth
may
1) Index-linked to net worth.
Svolder’s equities portfolio is not an index portfolio: in-vestment decisions are, instead, based on valuation of the individual shares. The portfolio’s results in relation to com-parison indices may, therefore, differ substantially from one accounting period to another. Share evaluation is com-plemented by a certain strategic focus on individual sectors based on macroeconomic factors.
Net worth trend (3 months) 1st March – 31st May 2016
SEK m SEK/share
Net worth, 29th February 2016 1,656.8 129.40
Equities portfolio
Opening value 1,591.8 124.40
Purchase of shares 164.1
Sale of shares –271.0
Change in value, equities portfolio 159.1 52.3 4.10
Closing value 1,644.1 128.40
Net debt (–)/Net receivable (+)
Opening value 65.0 5.10
Share dividends received 38.6
Other operating income 0.1
Administrative costs –4.0
Net financial items –0.1
Sale of shares, net 106.8 141.5 11.10
Closing value 206.5 16.10
Net worth, 31st May 2016 1,850.6 144.60
As outlined in the previous interim report, Svolder acted as a so-called anchor investor in the listing of electrical pro-ducts company GARO in March. Svolder was particularly attracted by the company’s well-established business mo-del, good profit development, strong balance sheet and stable management team. The acquisition worth SEK 51 million was the second largest in terms of value during the current reporting period. GARO develops and manufactu-res innovative products and total solutions for the electrical installation market under its own brand. It has operations in Sweden, Norway, Finland, Ireland and Poland. The pro-ducts can be divided into four product areas. By far the lar-gest product area is a wide range of Installation products. This is followed by Customised, which focuses on custo-mised total solutions for cable cabinets and switchgear, for example. The two smallest product areas are Temporary Power and EV Charger. Temporary Power covers products in the areas of temporary power and workplace lighting. EV Charger offers infrastructure solutions for chargeable vehicles. All of the product areas have developed positively in recent years, with the fastest growth in EV Charger and Temporary Power. The share price has developed very po-sitively and the holding was the largest contributor to net worth during the current reporting period.
The share price of cosmetics company Oriflame de-veloped very well in 2016 and the company was a major contributor to Svolder’s net worth. The company’s last two interim reports have confirmed the trend with continued strong growth, chiefly in the Asia & Turkey region. At the same time the former problem area of CIS (primarily Russia and Ukraine) showed signs of stabilisation. All in all, the development in the group’s various regions means a more geographically balanced exposure to risk. The operating margin has developed positively, despite continued negative currency effects. The balance sheet has strengthened consi-derably and the annual general meeting in May decided to resume the payment of dividends.
The housing development company Magnolia Bostad has continued to increase its project portfolio, which to-talled 7,600 homes at the end of March 2016. The com-pany has since communicated new business in accordance with its business model, which mainly involves minimising risks. The company’s share price has developed particularly strongly following the interim report for the first quarter and the above-mentioned business, which is why the com-pany is a major contributor to net worth. Svolder expects continued positive development moving forward in line with increased awareness of the company, a growing pro-ject portfolio and in the longer term listing on the Nasdaq Stockholm exchange. Svolder has used the share price’s temporarily weak periods to increase its holding.
Source: Svolder and SIX

7
Biggest contributors to changes in net worth 1st March – 31st May 2016
(Based on net worth of SEK 1,656.8 million or SEK 129.40 SEK/share on 29th February 2016)
SEK m SEK/share
GARO 51.8 4.00
Oriflame 29.3 2.30
Magnolia Bostad 20.7 1.60
New Wave Group 19.7 1.50
XANO Industri 12.7 1.00
Platzer Fastigheter 11.0 0.90
SSAB Class B incl. TR 10.1 0.80
Nobina 9.2 0.70
Boule Diagnostics 9.0 0.70
Total, nine positive 173.5 13.60
Bong –2.7 –0.20
Total, one negative –2.7 –0.20
Other shares 27.0 2.10
Shares, total 197.8 15.50
Other –4.0 –0.30
Change in value 193.8 15.10
Change in net worth in SEK million per month (12 months)
2015 2016jun jul aug sep nov dec jan feb mar apr
200
150
100
50
0
–50
–100
–150oct may
Excluding dividends of SEK 32.0 million (SEK 2.50/share) paid in November 2015.
liquidity/borrowingThe equities portfolio was unpledged on the closing day. The net receivable, which also includes the share trading’s unliquidated transactions etc., was SEK 206.5 million on the closing day, corresponding to 11.2 per cent of the company’s net worth. This is to be compared with a net re-ceivable of SEK 65.0 million at the beginning of the current reporting period.
the equities portfolioShares to the value of SEK 164.1 million (gross) were ac-quired during the current reporting period. Shares for a gross amount of SEK 271.0 million were sold during the corresponding period, and net sales hence totalled SEK 106.8 million.
New holdings during the three-month period were GARO and Klövern, while all shares in KappAhl, Proact and Scandi Standard were sold during the same period. On the closing day, the equities portfolio thus comprised 21 holdings.
Major net purchases for the equities portfolio (3 months) 1st March – 31st May 2016
Share Quantity SEK m SEK/share1)
Klövern Class B 5,900,000 55.4 9.40
GARO 700,000 51.1 73.00
Magnolia Bostad 246,557 17.7 71.90
1) The purchase price per share is arrived at on the basis of the aggregate purchase price for all shares of the same class acquired during the period.
Ordinary shares in Klövern were acquired during the cur-rent reporting period. At the same time, the share position in Platzer was reduced. The changes were made for valuation reasons, as Klövern got off to a weak start to the calendar year in 2016 and Platzer got off to a strong start. Klövern’s real estate portfolio comprises commercial properties and is concentrated in the Stockholm area and in large regional centres. Furthermore, the company has informed the stock market of its development rights for residential housing purposes, which may be utilised by the company, Platzers’ real estate portfolio in the Gothenburg area is continuing to create value. New projects are beginning and several insti-tutional investors have begun to discover the share. This in turn has made the share more expensive and has resulted in a degree of rearrangement in Svolder’s portfolio.
Major net sales from the equities portfolio (3 months) 1st March – 31st May 2016
Share Quantity SEK m SEK/share1)
Proact 467,436 58.0 124.10
Platzer Fastigheter 1,102,354 47.2 42.80
Scandi Standard 782,340 45.3 57.80
Nolato 75,000 17.1 227.70
Beijer Alma 80,401 15.7 195.70
1) The sales proceeds per share are arrived at on the basis of the aggregate market value for all shares of the same class sold during the period.

8
During the current reporting period Svolder sold all of its shares in data storage specialist Proact. The company has shown a significant improvement in profitability during Svolder’s three years as a shareholder. At the same time, it is evident that profitability is still burdened by some divisions which were added through acquisitions in 2010/2011. The return on Svolder’s investment has been good.
During the three-month period all shares in chicken producer Scandi Standard were also sold. The growing demand for chicken is expected to continue. At the same time, Svolder deems that production capacity in Sweden is starting to become strained, which will entail a higher in-vestment requirement moving forward. Frequent reports of one-off costs have also increased Svolder’s risk premium on the company. The share has developed positively and now appears to be fully valued.
lending of sharesDuring the current reporting period, Svolder has lent shares to a limited extent with a Swedish bank as the counterparty. On the closing day, share lending amounted to around 3 per cent of the net worth. Income from share lending for the three-month period amounts to SEK 0.1 million and is re-ported as other operating income. The share lending has ta-ken place against securities mainly in large cap companies listed on Nasdaq Stockholm, equating to approximately 105 per cent of the loaned shares’ market value.
the parent companyThe results for the Group and the Parent Company cor-respond in full. The Parent Company balance sheet is the same as for the Group with the exception of the Parent Company’s holdings in subsidiaries, worth SEK 0.1 mil-lion, and a current liability of SEK 0.1 million. The Parent Company and the Group have an overdraft facility totalling SEK 200 million.
risks and uncertainty factors
The identified risks and uncertainties for the Group and the Parent Company are presented on page 53 and in note 17 on page 65 of the 2014/2015 Annual Report. The market risk (the equities portfolio’s price risk) is adjudged to be the most significant of the risks listed. No significant changes are deemed to have occurred subsequently.
Nominations CommitteeAs reported in a press release on 11th May 2016, a Nomi-nations Committee has been formed in accordance with a decision at the 2015 Annual General Meeting. The No-minations Committee has appointed Öystein Engebretsen (Investment AB Öresund) as its Chairman. Other mem-bers are Christoffer Lundström (Provobis Holding/Rolf Lundström), Jannis Kitsakis (Fourth AP Fund) and Fredrik Carlsson (Chairman of the Board and convener).
Shareholders wishing to submit proposals for members of the Nominations Committee may con-tact the Committee’s Chairman: Öystein Engebretsen, Investment AB Öresund, Tel: +46 (0)8-402 33 00, E-mail: [email protected]
events after the reporting period
The net worth on 3rd June was SEK 143 per share and the listed price was SEK 129.00.
Year-End ReportA Year-End Report for the financial year 1st September 2015 – 31st August 2016, encompassing the 3-month report for 1st June – 31st August 2016, will be published on 23rd September 2016.
2016 AGMThe AGM will take place in Stockholm on Thursday 15th November 2016.
Shareholders wishing to have an issue discussed at Svolder’s 2016 AGM must make a written request to the Board of Directors by 30th September 2016 at the latest to: Svolder AB (publ), Board of Directors, Box 70431, SE-107 25 Stockholm, Sweden.
stockholm 10th june 2016 svolder ab (publ)
the board of directors
For additional information, please contact: Ulf Hedlundh, Managing Director +46 (0)8-440 37 73
Pontus Ejderhamn, CFO +46 (0)8-440 37 72.

9
consolidated statement of comprehensive income
(SEK m)
3 months 1/3 2016 – 31/5 2016
3 months 1/3 2015 – 31/5 2015
9 months 1/9 2015 – 31/5 2016
9 months 1/9 2014 – 31/5 2015
Rolling 12 months 1/6 2015 – 31/5 2016
12 months 1/9 2014 – 31/8 2015
Management operations
Dividend income 38.6 36.0 39.7 38.8 39.7 38.8
Administrative costs –4.0 –3.7 –12.0 –11.8 –15.5 –15.3
Earnings from securities 159.1 24.2 378.7 213.8 327.8 162.8
Other operating income 0.1 1.3 1.2 3.2 2.2 4.2
Operating profit 193.8 57.7 407.7 244.0 354.3 190.6
Profit on financial investments
Financial income 0.0 0.0 0.0 0.0 0.0 0.0
Financial expenses –0.1 0.0 –0.2 –0.2 –0.2 –0.2
Profit after financial items 193.8 57.7 407.5 243.9 354.1 190.4
Tax - - - - - -
Profit for the period 193.8 57.7 407.5 243.9 354.1 190.4
Other comprehensive income - - - - - -
Comprehensive income for the period 193.8 57.7 407.5 243.9 354.1 190.4
Earnings per share, SEK 15.10 4.50 31.80 19.10 27.70 14.90
consolidated cash flow statement
(SEK m)
3 months 1/3 2016 – 31/5 2016
3 months 1/3 2015 – 31/5 2015
9 months 1/9 2015 – 31/5 2016
9 months 1/9 2014 – 31/5 2015
Rolling 12 months 1/6 2015 – 31/5 2016
12 months 1/9 2014 – 31/8 2015
Cash flow from operating activities before changes in working capital 35.0 33.5 29.6 27.1 26.7 24.2
Changes in working capital
Increase (+)/decrease (–) in current liabilities 0.1 0.0 0.1 0.0 0.1 0.0
Cash flow from operating activities 35.1 33.6 29.7 27.1 26.8 24.2
Investing activities
Purchase of securities –158.6 –182.6 –521.2 –320.5 –606.3 –405.6
Sales of securities 271.0 107.5 669.5 398.6 725.2 454.3
Investment in machinery and equipment 0.0 0.0 0.0 0.0 0.0 0.0
Cash flow from investing activities 112.4 –75.1 148.3 78.0 118.9 48.7
Financing activities
Dividend paid - - –32.0 –28.8 –32.0 –28.8
Cash flow from financing activities 0.0 0.0 –32.0 –28.8 –32.0 –28.8
Increase (+)/decrease (–) in liquid assets 147.5 –41.6 145.9 76.3 113.7 44.0
Liquid assets at beginning of period 67.2 142.6 68.7 24.7 101.0 24.7
Liquid assets at end of period 214.6 101.0 214.6 101.0 214.6 68.7
consolidated key ratios per share
(SEK m)
3 months 1/3 2016 – 31/5 2016
3 months 1/3 2015 – 31/5 2015
9 months 1/9 2015 – 31/5 2016
9 months 1/9 2014 – 31/5 2015
Rolling 12 months 1/6 2015 – 31/5 2016
12 months 1/9 2014 – 31/8 2015
Change in net worth, SEK 15.10 4.50 29.30 16.80 25.20 12.60
Dividend paid during the period, SEK - - 2.50 2.25 2.50 2.25
Number of shares, million 12.8 12.8 12.8 12.8 12.8 12.8
Amounts per share have been rounded off to the nearest SEK 0.1 throughout the Interim Report, except for share prices and dividends. The company has no ongoing programmes of financial instruments that entail any dilution in the number of shares. The number of outstanding shares equals 12,800,000.

10
consolidated balance sheet
Assets
(SEK m) 31/5 2016 29/2 2016 31/8 2015 31/5 2015 28/2 2015 31/8 2014
Non-current assets
Property, plant and equipment
Equipment 0.2 0.2 0.1 0.1 0.1 0.2
Financial assets
Securities holdings 1,644.1 1,591.8 1,408.5 1,431.4 1,326.1 1,291.9
Current assets
Current receivables 0.5 0.6 0.8 3.5 5.5 12.8
Cash and bank balances 214.6 67.2 68.7 101.0 142.6 24.7
Total assets 1,859.4 1,659.7 1,478.2 1,536.0 1,474.4 1,329.5
Shareholders’ equity and liabilities
(SEK m) 31/5 2016 29/2 2016 31/8 2015 31/5 2015 28/2 2015 31/8 2014
Shareholders’ equity 1,850.6 1,656.8 1,475.0 1,528.5 1,470.8 1,313.4
Liabilities
Current liabilities 8.8 2.9 3.1 7.5 3.5 16.1
Total liabilities and shareholders’ equity 1,859.4 1,659.7 1,478.2 1,536.0 1,474.4 1,329.5
changes in shareholders’ equity
(SEK m)
3 months 1/3 2016 – 31/5 2016
3 months 1/3 2015 – 31/5 2015
9 months 1/9 2015 – 31/5 2016
9 months 1/9 2014 – 31/5 2015
12 months 1/9 2014 – 31/8 2015
Opening balance 1,656.8 1,470.8 1,475.0 1,313.4 1,313.4
Dividend paid - - –32.0 –28.8 –28.8
Comprehensive income for the period 193.8 57.7 407.5 243.9 190.4
Closing balance 1,850.6 1,528.5 1,850.6 1,528.5 1,475.0
consolidated key ratios per share(SEK m) 31/5 2016 29/2 2016 31/8 2015 31/5 2015 28/2 2015 31/8 2014
Net worth per share, SEK 144.60 129.40 115.20 119.40 114.90 102.60
Share price (Class B), SEK 133.50 112.25 103.50 107.50 103.25 92.75
Net worth, premium (+)/discount (–), % –8 –13 –10 –10 –10 –10
Liquidity (+)/Borrowing (–), % 11 4 5 6 10 2
Equity/assets ratio, % 100 100 100 100 100 100
Number of shares, million 12.8 12.8 12.8 12.8 12.8 12.8
Definitions as in the Annual Report for 2014/2015. Amounts per share have been rounded off to the nearest SEK 0.1 throughout the Interim Report, except for share prices and dividends. The company has no ongoing programmes of financial instruments that entail any dilution in the number of shares. The number of outstanding shares equals 12,800,000.
accounting principlesThis Interim Report has been prepared in accordance with IAS 34, Interim Reporting.
The consolidated accounts have been prepared in accordance with the International Financial Reporting Standards (IFRS) adopted by the EU and in accordance with Sweden’s Annual Accounts Act. The Parent Company accounts follow
Sweden’s Annual Accounts Act and Swedish Financial Reporting Board recommendation RFR 2. Otherwise the same accounting principles and bases for assessment have been used as in the most recent Annual Report.

11
Review ReportAuditor’s report on the review of the financial information in the interim report in summary (interim report), drawn up in accordance with IAS 34 and Chapter 9 of the Annual Accounts Act.
Introduction
We have reviewed this Interim Report for the period 1st September 2015 to 31st May 2016 for Svolder AB (publ), corporate ID no. 556469-2019. The Board of Directors and the Managing Director are re-sponsible for the preparation and presentation of this Interim Report in accordance with IAS 34 and the Annual Accounts Act. Our responsibility is to express a conclusion on the Interim Report based on our review.
Focus and scope of the review
We conducted our review in accordance with the International Standard on Review Engagements (ISRE) 2410, Review of Interim Report Performed by the Independent Auditor of the Entity. A review consists of making inquiries, primarily of persons responsible for financial and accounting matters, and applying analytical and other review procedures. A review has a different focus to and is substantially less in scope than an audit conducted in accordance with International Standards on Auditing and other generally accepted auditing standards in Sweden. The procedures performed in a review do not enable us to obtain assurance that we would become aware of all significant matters that might be identified in an audit. The expressed conclusion based on a review does not, therefore, have the same certainty as an expressed conclusion based on an audit.
Conclusion
Based on our review, nothing has come to our attention that causes us to believe that the Interim Report is not prepared, in all material respects, in accordance with IAS 34 and the Annual Accounts Act, regar-ding the Group, and with the Annual Accounts Act, regarding the Parent Company.
stockholm 10th june 2016 pricewaterhousecoopers ab
peter nilssonAuthorised Public Accountant

svolder ab (publ) Corporate ID no. 556469-2019 Birger Jarlsgatan 13, Box 70431, SE-107 25 Stockholm, Sweden. Tel +46 (0)8-440 37 70; fax +46 (0)8-440 37 78
www.svolder.se
Prioritaire A POSTAGE PAID
svolder is a dedicated investment trust that invests primarily in the shares of small and medium-sized listed swedish companies. the company’s shares are listed on nasdaq stockholm ab. svolder’s net worth is published weekly and appears on the company’s website at www.svolder.se