Embed Size (px)
Citation preview

3 MONTHS REPORT 2O13/2O14

2
Hönle Group – at a Glance 01.10.2013 - 01.10.2012 - Change 31.12.2013 31.12.2012 Statement of Comprehensive Income T€ T€ % Revenue 20,254 16,543 22.4
EBITDA 2,849 2,093 36.1
EBIT 2,218 1,475 50.4
EBT 2,097 1,265 65.8
Consolidated net income 1,509 916 64.7 Share Earnings per share in € 0.28 0.16 75.0
Number of shares 5,512,930 5,512,930 0.0 Cash flow T€ T€ Operating cash flow 1) 1,390 2,447 -43.2 Staff Average number of employees 519 472 10.0 31.12.2013 30.09.2013 Change Statement of Financial Position T€ T€ % Non-current assets 40,630 40,258 0.9
Current assets 39,571 39,444 0.3
Shareholders’ equity 48,516 46,991 3.2
Non-current liabilities 11,628 13,558 -14.2
Current liabilities 20,057 19,153 4.7
Total assets 80,201 79,702 0.6
Capital ratio as a % 60.5 59.0 2.5 Adjusted prior-year values according IAS 8; see notes 1) Cash from current business activities

3
Group Management Report for the three-month period from 1 October 2013 to 31 December 2013
Overview
Market Development
The global economy gained momentum in the
course of 2013. While growth rates in the
emerging markets were declining, the US
economy picked up perceptibly in the second
half of the year. The necessary combating of
government debt continued to impact adversely
on demand in several countries of the euro
zone. Nevertheless, the recession was over-
come in the summer months, although the
economic recovery was still quite subdued. The
economic development in Germany was
sluggish, and the gross domestic product rose
only slightly by 0.4 % in the past year.
Course of Business
While the macroeconomic environment as a
whole was cautious, the Hönle Group's business
development in the first quarter of the 2013/2014
financial year was positive. Overall, Hönle
Group's sales revenues climbed from T€ 16,543
in the previous year to T€ 20,254 in the current
financial year, and, for the first time, include
Grafix GmbH's sales revenues of T€ 1,932.
The operating result (EBIT) came to T€ 2,218 in
the first quarter of the 2013/2014 financial year,
which clearly exceeds the prior-year value of
T€ 1,475.
Business development of the 'Equipment and
Systems' segment was encouraging as sales
and earnings increased.
The business operations of Grafix LP, Boling-
brook, Illinois, which provided equipment and
systems, spare parts and services for the
insolvent Grafix GmbH on the North American
market, were transferred to Eltosch America Inc.
with head office in Batavia, Illinois. In this
context, Eltosch America Inc. acquired invento-
ries from Grafix LP at a purchase price of
US$ 250 thousand. Eltosch America Inc. also
takes over the sales and service activities
respecting powder sprayers and powder
extractors and equipment for temperature control
and conditioning in the application of ink. Sales
revenues generated by Eltosch America Inc.
thus rose from T€ 201 in the first prior-year
quarter to T€ 705 in the first quarter of the
current financial year.
The 'Adhesives' segment reported encouraging
business development. The Hönle Group again
sold more adhesives than in the prior-year
period. Both, the consumer goods business and
the automotive industry were the growth drivers
in the 'Adhesives' segment.
Dr. Hönle AG acquired business premises in
Torrington, Connecticut (USA) in order to
prepare for the projected growth in the 'Adhe-
sives' segment on the American market. The
purchase price for the property with more than
30,000 square meters of land and the building
with floor space of approximately 3,000 square
meters amounted to US-$ 940 thousand.
The planned investments in restructuring
measures amount to about T€ 280. In addition to
the development and production units and a
warehouse, representative sales offices and a
modern application lab are also to be housed in

4
the building. The relocation of Tangent Indus-
tries Inc. is scheduled for April. Metamorphic
Materials Inc. is to move to the new company
premises in a second step.
Business development in the 'Glass and Lamps'
segment was unsatisfactory, which was attribut-
able to delays (for technical reasons) in the start
of production of tubing for the semi-conductor
industry and quartz rods for the fibre cable
industry. In this context, cost of materials was
significantly above the planned figure. Two new
product lines and greater focus on the semicon-
ductor market in conjunction with the significant
expansion of sales capacities are expected to
result in rising sales and earnings in the second
half of the year. In addition, Raesch Quarz
(Germany) GmbH intends to obtain the certifica-
tion of products for the semi-conductor industry,
in order to further open up the market.
Within the context of cost reduction measures,
Raesch Quarz (Germany) GmbH reduced its
staff level in December 2013. This leads to
annual cost reductions of ca. T€ 400.
The Aladin GmbH management also imple-
mented comprehensive measures aimed at
increasing the sales level in the current financial
year and at a significant improvement in earn-
ings power. The objective is to achieve an EBIT
margin of more than 10 % in this year.
5
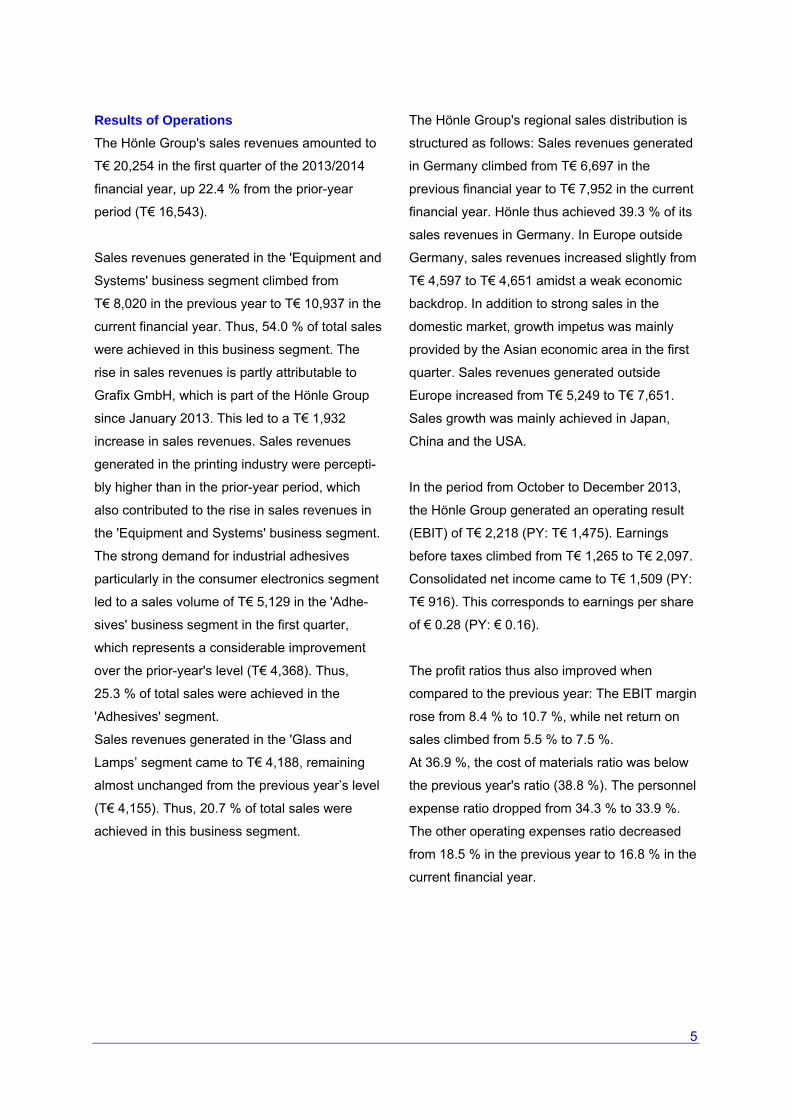
Results of Operations
The Hönle Group's sales revenues amounted to
T€ 20,254 in the first quarter of the 2013/2014
financial year, up 22.4 % from the prior-year
period (T€ 16,543).
Sales revenues generated in the 'Equipment and
Systems' business segment climbed from
T€ 8,020 in the previous year to T€ 10,937 in the
current financial year. Thus, 54.0 % of total sales
were achieved in this business segment. The
rise in sales revenues is partly attributable to
Grafix GmbH, which is part of the Hönle Group
since January 2013. This led to a T€ 1,932
increase in sales revenues. Sales revenues
generated in the printing industry were percepti-
bly higher than in the prior-year period, which
also contributed to the rise in sales revenues in
the 'Equipment and Systems' business segment.
The strong demand for industrial adhesives
particularly in the consumer electronics segment
led to a sales volume of T€ 5,129 in the 'Adhe-
sives' business segment in the first quarter,
which represents a considerable improvement
over the prior-year's level (T€ 4,368). Thus,
25.3 % of total sales were achieved in the
'Adhesives' segment.
Sales revenues generated in the 'Glass and
Lamps’ segment came to T€ 4,188, remaining
almost unchanged from the previous year’s level
(T€ 4,155). Thus, 20.7 % of total sales were
achieved in this business segment.
The Hönle Group's regional sales distribution is
structured as follows: Sales revenues generated
in Germany climbed from T€ 6,697 in the
previous financial year to T€ 7,952 in the current
financial year. Hönle thus achieved 39.3 % of its
sales revenues in Germany. In Europe outside
Germany, sales revenues increased slightly from
T€ 4,597 to T€ 4,651 amidst a weak economic
backdrop. In addition to strong sales in the
domestic market, growth impetus was mainly
provided by the Asian economic area in the first
quarter. Sales revenues generated outside
Europe increased from T€ 5,249 to T€ 7,651.
Sales growth was mainly achieved in Japan,
China and the USA.
In the period from October to December 2013,
the Hönle Group generated an operating result
(EBIT) of T€ 2,218 (PY: T€ 1,475). Earnings
before taxes climbed from T€ 1,265 to T€ 2,097.
Consolidated net income came to T€ 1,509 (PY:
T€ 916). This corresponds to earnings per share
of € 0.28 (PY: € 0.16).
The profit ratios thus also improved when
compared to the previous year: The EBIT margin
rose from 8.4 % to 10.7 %, while net return on
sales climbed from 5.5 % to 7.5 %.
At 36.9 %, the cost of materials ratio was below
the previous year's ratio (38.8 %). The personnel
expense ratio dropped from 34.3 % to 33.9 %.
The other operating expenses ratio decreased
from 18.5 % in the previous year to 16.8 % in the
current financial year.

6
Earnings Development
in T€ 01/10/13 - 31/12/13 01/10/12 - 31/12/12 Change Sales revenue 20,254 16,543 22.4 %
Gross profit 13,382 11,332 18.1 %
Operating result (EBIT) 2,218 1,475 50.4 %
Earnings before taxes (EBT) 2,097 1,265 65.8 %
Consolidated net income/loss for the year 1,509 916 64.7 %
Earnings per share in € 0.28 0.16 75.0 %
The prior-year figures were adjusted pursuant to IAS 8; see Explanatory Notes
Sales according to segment (in T€)
Sales according to region (in T€)
8.020
4.155 4.368
10.937
4.188
5.129
0
2.000
4.000
6.000
8.000
10.000
12.000
equipment/systems glass/lamps adhesives
01.10.2012-31.12.2012
01.10.2013-31.12.2013
6.697
4.5975.249
7.952
4.651
7.651
0
1.000
2.000
3.000
4.000
5.000
6.000
7.000
8.000
9.000
Germany EU ROW
01.10.2012-31.12.2012
01.10.2013-31.12.2013

7
Financial Position
Cash from operating activity amounted to
T€ 1,390 in the first quarter (PY: T€ 2,447).
The cash flow from investing activity amounted
to T€ -1,036, up from T€ -636 reported in the
previous year. This cash flow mainly comprises
investments in the acquisition of a property for
Tangent Industries Inc. in the USA. The cash
flow from investing activity also includes ex-
penses incurred for technical equipment,
business equipment and software licenses.
Cash used for financing activity amounted to
T€ -306 (PY: T€ -296), and resulted from the
repayment (T€ -500) and taking out (T€ 194) of
bank loans.
In all, liquid assets increased by T€ 22 to
T€ 4,400 during the first three months of the
current financial year.
Cash Flow and Liquidity Development
in T€ 01/10/13 - 31/12/13 01/10/12 - 31/12/12 Change
Cash from current business activities 1,390 2,447 -43.2 % Cash flow from investing activity -1,036 -636 -62.9 %
Cash flow from financing activity -306 -296 -3.4 %
Change in liquid assets 22 1,145 -98.1 %

8
Net Assets
The Hönle Group's non-current and current
assets were at the previous year's level
(30.09.2013). Inventories climbed from
T€ 19,385 to T€ 20,684. The rise in inventories
is due to the purchase of Grafix LP's inventories
and other factors.
Liquid assets rose slightly from T€ 4,378 to
T€ 4,400.
With an equity ratio of 60.5 %, Hönle Group
financing continues to be on solid ground.
While non-current loans decreased by T€ 1,930
to T€ 11,628, current liabilities increased by
T€ 904 to T€ 20,057. Owing to the discontinua-
tion of the optional "corridor method" pursuant to
IAS 19, pension obligations are measured
differently than in the previous financial years.
Consequently, pension accruals climbed to
T€ 3,101 as at 31 December 2013.
Balance Sheet
in T€ 31/12/2013 30/09/2013 Change Non-current assets 40,630 40,258 0.9 %
Current assets 39,571 39,444 0.3 %
Shareholders' equity 48,516 46,991 3.2 %
Non-current liabilities 11,628 13,558 -14.2 %
Current liabilities 20,057 19,153 4.7 %
Balance sheet total 80,201 79,702 0.6 % The prior-year figures were adjusted pursuant to IAS 8; see Explanatory Notes

9
Research and Development
The focus of R&D activities was on order-related
development. The order-independent research
and development expenses incurred by the
Hönle Group decreased from T€ 283 in the
previous year to T€ 258 in the financial year
under review. In this period, the number of R&D
staff rose from 54 to 60. This means that 11.6 %
of the Hönle Group's entire staff is employed in
the Research and Development departments.
The use of UV technology made it possible to
print on electronic components on the basis of
the inkjet procedure within the context of a
special customer application. Low Energy Curing
(LEC) combines the advantages arising from
UV-LED and conventional UV technology. In this
context, highly reactive, UV-curing finishing
agents, so-called UV inks and paints, are not
interconnected with LEDs, but with conventional
medium-pressure lamps. In view of the fact that
the print width of the tested print application was
only 80 mm, a decision was made in favour of an
UVAPrint 100 SOV system. The UV device can
be used in conventional inkjet applications with
an output of 200 W/cm. However, in the case of
Low Energy Curing, the specific lamp power
output was limited to 60 to 100 W/cm. In
agreement with the absorption range of the
inkjet ink, an iron containing lamp was used, its
main emissions being in the long-wave UV-A
range, similar to UV-LEDs.
In combination with highly reactive coating
agents, Low Energy Curing offers interesting
possibilities for use in various UV processes.
The UV systems are not only designed for
narrow-web and inkjet applications, but can also
be configured for broad range printing applica-
tions, such as in the offset printing segment.
Hönle developed the LED Spot 100 especially
for bonding speakers, such as for smart phones.
The flood lamp has an emission window of 100 x
100 mm and is entirely cooled by air. In agree-
ment with the adhesive's absorption range, the
device can be equipped with various LED wave
lengths. A wave length of 405 nm is common for
bonding parts in the acoustics segment. Already
1,500 units have been sold of this device.
Compared to curing with conventional UV lamps
the system offers several advantages:
Infrared radiation, which leads to unnecessary
heating of components, is avoided. The service
life of the UV emitters is markedly longer and the
adhesive's absorption range can be ideally
combined with the emission range of the UV-
LEDs, which translates into more efficient curing
processes.
Supplementary Report
Since 1 January 2014, no events of special
significance that would impact significantly on
Hönle Group's net assets, financial position and
results of operations have occurred.

10
Personnel
The Hönle Group’s headcount rose as a result of
the staff added from Grafix GmbH. In the first
quarter of the current financial year, the Hönle
Group employed a staff of 519 (PY: 472). The
major portion of the new hires is employed in the
production and service departments.
Hönle Group’s staff of 519 included 48 part-time
employees, which corresponds to 9.2 % of its
total staff. In the first quarter of the current
financial year, the employees were engaged in
the following functional areas:
Functional Areas
(excluding Management Board members) 01/10/13 - 31/12/13 01/10/12 - 31/12/12 Change Sales 83 75 10.7 %
Research & Development 60 54 11.1 %
Production, Service 247 227 8.8 %
Logistics 56 53 5.7 %
Administration 73 63 15.9 %
Total 519 472 10.0 %
Personnel Expenses
in T€ 01/10/13 - 31/12/13 01/10/12 - 31/12/12 Change Wages and salaries 5,831 4,989 16.9 % Social security and pension costs 1,209 1,010 19.7 %
Total 7,040 5,999 17.4 %
Within the scope of a staff increase, personnel
expenses rose by 17.4% to T€ 7,040 in the first
quarter of the current financial year.
Hönle invests in occupational training with a view
to covering the future demand for qualified
personnel: The Hönle Group offers vocational
training in the segments: business administra-
tion, technology, chemistry, and logistics. As at
31 December 2013, 19 young people received
occupational training at the Hönle Group (27 as
at 31 December 2012).

11
Infrared lamp of UV-Technik Speziallampen GmbH

12
Outlook
Overall market
Following two years of restrained business, the
global economy is slowly gaining momentum:
The general economic conditions in the industri-
alised countries improved, and the US economy
is expected to become the growth engine of the
global economy in 2014. In contrast, the eco-
nomic development in the emerging markets
continues to be uneven, although the long-term
structural preconditions for growth can be
classified as favourable: The low government
debt level and better demographic structures
provide a solid basis for future development.
However, the weak economic growth observed in
some emerging markets could persist if the
financing conditions for those countries should
deteriorate as a result of a change in the
monetary policy of the US or that of several
Asian central banks.
The International Monetary Fund (IMF) projects
global growth of approximately 3.7 % in 2014
and 3.9 % in 2015.
Hönle Group
Segment: 'Equipment and Systems'
From January 2013, the 'Equipment and Sys-
tems' segment also encompasses the activities
of Grafix GmbH. Owing to restructuring proc-
esses implemented by major clients, orders will
be postponed to the second half of the year. A
rise in sales and higher earnings contributions at
Grafix GmbH are thus particularly expected in
the second half of the year.
Within the scope of the asset deal, Hönle
acquired extensive machinery including, inter
alia, metal processing machinery. At the begin-
ning of the new financial year, a metal process-
ing centre was set up and already started
operations at the Grafix production site located at
Unterlüß near Celle. Further investments in the
expansion of the processing centre are planned
for the second quarter. In the future, Grafix will
supply mechanical components to several Hönle
Group companies and will successively replace
external suppliers in the metal processing
segment. The is expected to have positive
effects on Grafix GmbH's sales and earnings
development and should lead to a decrease in
the Hönle Group's cost of materials ratio.
With respect to UV and infrared equipment for
the offset printing segment, the Management
Board anticipates stable sales development.
Rising sales are projected in the digital printing
applications segment due to a growing digital
printing market, in which the Hönle Group has a
strong foothold.

13
Segment: 'Glass and Lamps'
The Raesch Group implemented a package of
measures aimed at improving the sales and
earnings development. This included the
expansion of sales activities through new
distribution partnerships in the North American
sales market and through increasing its own
sales team.
In addition, Raesch developed and launched
new products for the semiconductor industry,
among others. Raesch is currently obtaining
certification of the products for the semiconduc-
tor industry to improve sales opportunities. In this
context, Raesch will invest in new production
facilities in this year. The focus is also on
optimisation of the reject rates and an associated
improvement in the cost of materials ratio. The
Management Board projects that the semicon-
ductor and photovoltaics markets will recover
gradually during the coming quarters.
It is also expected that the Hönle Group will
significantly increase sales in the ballast water
sterilization segment. This forecast is based on a
ballast water agreement which stipulates that
ballast water from ships and vessels must, in the
future, already be sterilized before being dis-
charged. Sterilization by means of UV irradiation
can be selected as an environmentally-friendly
approach to this end. UV-Technik Speziallampen
GmbH offers corresponding sterilization systems
and already supplies several customers with
them.
Following a two-year development phase, UV-
Technik Speziallampen GmbH started series
production of infrared lamps. The Company thus
taps an additional business field, which is to be
further expanded in the future by selling the
products to external customers.
Segment: 'Adhesives'
The 'Adhesives' segment reported very encour-
aging business development in the first quarter
of the new financial year. Customer orders from
the electronics industry contributed to a signifi-
cant rise in sales and earnings in this segment.
Additional staff was recruited for the sales and
development divisions with a view to increasing
sales. In the future, the focus will be on the
further tapping of existing sales potential in the
consumer electronics and opto-electronics
segments and in the automotive industry. The
medical technology segment is also to be
expanded further.
From a regional perspective, sales in the North
American sales territory are to be continuously
increased within the next few years via invest-
ments in Tangent Industries Inc., USA.
14
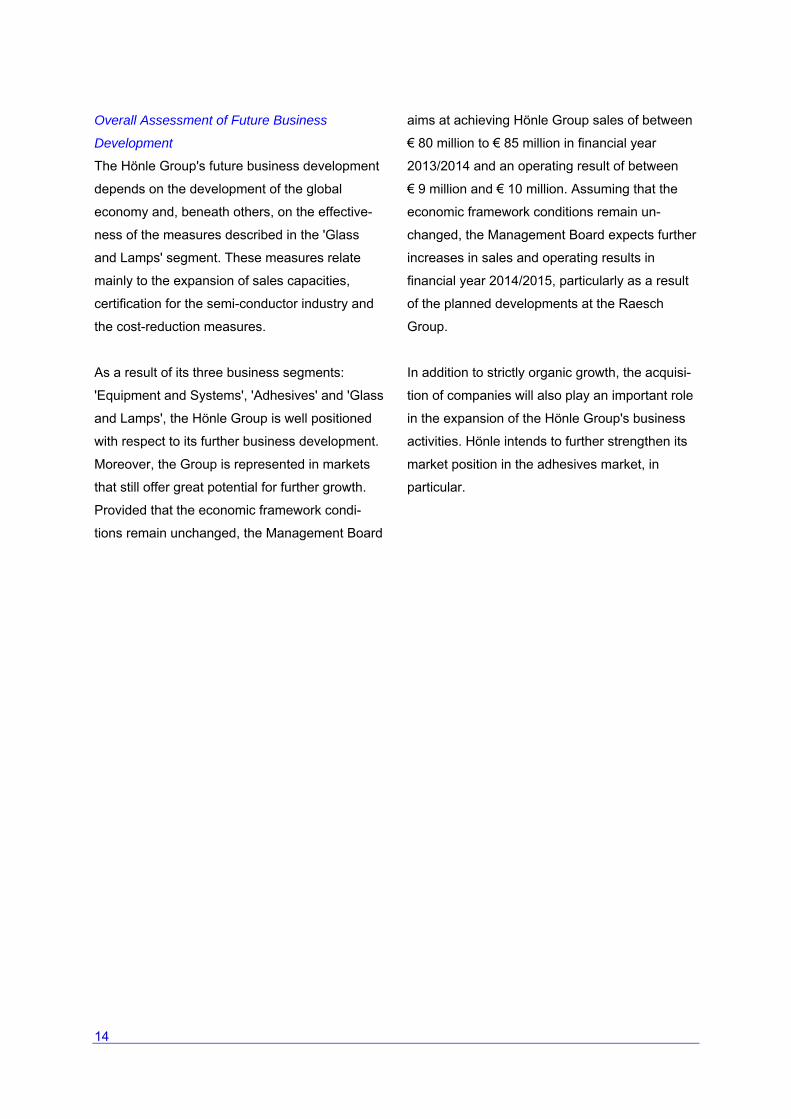
Overall Assessment of Future Business
Development
The Hönle Group's future business development
depends on the development of the global
economy and, beneath others, on the effective-
ness of the measures described in the 'Glass
and Lamps' segment. These measures relate
mainly to the expansion of sales capacities,
certification for the semi-conductor industry and
the cost-reduction measures.
As a result of its three business segments:
'Equipment and Systems', 'Adhesives' and 'Glass
and Lamps', the Hönle Group is well positioned
with respect to its further business development.
Moreover, the Group is represented in markets
that still offer great potential for further growth.
Provided that the economic framework condi-
tions remain unchanged, the Management Board
aims at achieving Hönle Group sales of between
€ 80 million to € 85 million in financial year
2013/2014 and an operating result of between
€ 9 million and € 10 million. Assuming that the
economic framework conditions remain un-
changed, the Management Board expects further
increases in sales and operating results in
financial year 2014/2015, particularly as a result
of the planned developments at the Raesch
Group.
In addition to strictly organic growth, the acquisi-
tion of companies will also play an important role
in the expansion of the Hönle Group's business
activities. Hönle intends to further strengthen its
market position in the adhesives market, in
particular.

15
Consolidated Statement of Comprehensive Income for the period 1 October 2013 until 31 December 2013 according IFRS 01.10.2013 - 01.10.2012 - 31.12.2013 31.12.2012 in T€ in T€ 20,254 16,543 534 969
262 615
7,668 6,795
7,040 5,999 631 618
3,492 3,240
2,218 1,475
7 -3
30 -5
159 202
-121 -210
2,097 1,265
588 349
1,509 916 -17 61 1,526 855
0.28 0.16
0.28 0.16
5,511,854 5,511,854
5,511,854 5,511,854
Revenue
Changes in inventories of finished goods and work in progress
Other operating income
Cost of purchased materials and services
Personnel expenses
Depreciation and amortization including goodwill
Other operating expenses
Operating result/EBIT
Profit/loss from investments accounted for at equity
Interest income
Interest expense
Financial result
Earnings before tax and non-controlling interest/EBT
Income tax
Consolidated net income
Share in earnings attributable to non-controlling interest
Share in earnings attributable to Dr. Hönle AG shareholders
Earnings per share (basic) in €
Earnings per share (diluted) in €
Weighted average shares outstanding (basic)
Weighted average shares outstanding (diluted)
Adjusted prior-year values according IAS 8; see notes The consolidated interim report is unaudited.

16
Consolidated net income Other comprehensive income: Positions that may be subsequently reclassified to profit or loss - Currency differences - Reserve for hedging transactions - Income tax effect Items that are not reclassified to profit or loss - Changes in actuarial gains/losses from pensions - Income tax effect
Other comprehensive income after tax Total comprehensive income for the period Thereof account for: - Share in earnings attributable to non-controlling interest - Share in earnings attributable to Dr. Hönle AG shareholders Adjusted prior-year values according IAS 8; see notes The consolidated interim report is unaudited.
Consolidated Total Comprehensive Income for the period 1 October 2013 until 31 December 2013 according IFRS 01.10.2013 - 01.10.2012 - 31.12.2013 31.12.2012 in T€ in T€ 1,509 916 16 53 -10 1 3 0 8 114 -1 -29
16 139
1,525 1.055 -17 61
1,542 994 .

17
Consolidated Statement of Financial Position as of 31 December 2013 according IFRS
31.12.2013 30.09.2013 01.10.2012 in T€ in T€ in T€ 18,849 18,849 18,085
3,475 3,588 3,079
15,698 15,182 13,110
218 210 195
32 32 32
580 627 727
1,777 1,769 1,566 40,630 40,258 36,794 20,684 19,385 16,579
11,263 11,968 12,050 211 223 93
2,538 2,550 1,994
476 939 439
4,400 4,378 9,321 39,571 39,444 40,476 80,201 79,702 77,270
A S S E T S
LONG-TERM ASSETS
Goodwill
Intangible assets
Property, plant and equipment
Investments accounted for at equity
Financial assets
Other non-current assets
Deferred taxes
Total non-current assets
CURRENT ASSETS
Inventories
Trade accounts receivable
Receivables towards companies, in which interests are hold
Other current assets
Tax refund claims
Liquid assets
Total current assets
TOTAL ASSETS

18
31.12.2013 30.09.2013 01.10.2012 in T€ in T€ in T€ 5,513 5,513 5,513
-8 -8 -8
16,596 16,596 16,596
24,442 22,901 18,726 46,543 45,002 40,827 1,972 1,989 2,019 48,516 46,991 42,846 5,884 6,329 3,664
0 1 27
380 1,810 7,790
3,101 3,078 3,247
661 680 572
1,602 1,660 1,648 11,628 13,558 16,948 4,409 4,752 4,732
2 0 0 41 40 0
549 436 434
8 12 43 2,804 2,660 1,751
10,716 9,919 8,579
481 474 512
1,048 860 1,424 20,057 19,153 17,475 80,201 79,702 77,270
LIABILITIES AND SHAREHOLDERS´ EQUITY
SHAREHOLDERS´ EQUITY
Subscribed capital
Own shares
Additional paid-in capital (capital reserves)
Retained earnings
Equity attributable to Dr. Hönle AG's shareholders
Non-controlling interest
Total Shareholders´ Equity
NON-CURRENT DEBTS
Non-current loans (less current portion)
Non-current portion of finance lease obligation
Other nun-current liabilities
Pension accruals
Accrued public investments grants
Deferred taxes
Non-current liabilities
CURRENT LIABILITIES
Trade accounts payable
Liabilities to associated companies
Liabilities towards companies, in which interests are hold
Advance payments received
Current portion of finance lease obligation
Current loans towards banks and current portion of non-current loans
Other current liabilities
Other accruals
Tax accruals
Total current liabilities
TOTAL LIABILITIES AND SHAREHOLDERS´ EQUITY
Adjusted prior-year values according IAS 8; see notes The consolidated interim report is unaudited.

19
Consolidated Statement of Changes in Equity for the period 1 October 2013 until 31 December 2013 according IFRS
R e t a i n e d e a r n i n g s E q u i t y legal reserve reserve reserve for Equity attribu- Non- sub- and other for for currency table to Dr. controll- scribed own capital retained hedging actuarial differ- Hönle AG's ing capital shares reserve earnings transactions gains ences shareholders interest Total in T€ in T€ in T€ in T€ in T€ in T€ in T€ in T€ in T€ in T€
5,513 -8 16,855 17,320 0 0 1,498 41,178 3,306 44,484
-259 938 -46 -984 -351 -1,287 -1,638
5,513 -8 16,596 18,258 -46 -984 1,498 40,827 2,019 42,846
912 912 27 939
1 53 54 54
912 1 53 966 27 993
-58 85 27 34 61
5,513 -8 16,596 19,112 -45 -899 1,551 41,820 2,080 43,900 5,513 -8 16,596 22,122 -31 -647 1,456 45,001 1,989 46,990
1,526 1,526 -17 1,509
-7 7 16 16 16
1,526 -7 7 16 1,542 -17 1,526
5,513 -8 16,596 23,648 -38 -640 1,472 46,543 1,972 48,516
As at 01/10/2012
Adjustments according IAS 8
As at 01/10/2012 (adjusted)
Consolidated net income
Other operating result
Total result
Adjustments according IAS 8
As at 31/12/2012
As at 01/10/2013
Consolidated net income
Other operating result
Total result
As at 31/12/2013 Adjusted prior-year values according IAS 8; see notes The consolidated interim report is unaudited.

20
Consolidated Statement of Cash Flows for the period 1 October 2013 until 31 December 2013 according to IFRS
01.10.2013- 01.10.2012- 31.12.2013 31.12.2012 in T€ in T€ 2,097 1,288 631 618
-2 3
-37 5
159 202
-37 125
2,811 2,241
12 -1,286
705 2,772 14 0
-165 -906
38 -37
-1,304 -1,263
-336 -1,113
2 1 1 0
113 192
-678 -380
177 0
1,390 2,447
-80 -147
28 -316 1,337 1,984 -1,049 -659
0 -3
9 8
4 18
0 1 -1,036 -636 194 0
-500 -296 -306 -296 28 82
-1 11 22 1,145 4,378 9,321
4,400 10,466
Cash flows from operating activities:
Net income for the year before non-controlling interest and taxes Adjustments for: Depreciation of fixed assets
Depreciation of current assets
Financial income
Interest expenses
Other non-cash expenses/income
Operating result before changes to net current assets
Increase/decrease in accruals Increase/decrease of trade accounts receivable Increase / decrease in receivables towards companies in which an investment is held Increase/decrease of other assets
Changes in qualifying insurance policy
Increase/decrease in inventories
Increase/decrease in trade accounts payable
Increase/decrease in liabilities to associated companies Increase / decrease in liabilities towards companies in which an investment is held
Increase/decrease in advance payments received
Increase/decrease in other liabilities
Increase/decrease in deferred public investment grants
Cash from continuing business activities
Interest paid
Income tax paid
Net cash from operating activities
Cash flows from investing activities Purchase of property, plant and equipment and intangible assets
Changes due to corporate acquisitions
Payments received from non-current receivables
Payments received from interest
Payments received from dividends Net cash used for investing activities Cash flows from financing activities
Payments received from loans and liabilities to banks Payments of loans and liabilities to banks
Net cash from financing activities Currency differences
Exchange rate differences of liquid assets
Net increase/decrease in cash Cash at the beginning of the reporting period
Cash at the end of the reporting period
Adjusted prior-year values according IAS 8; see notes
The consolidated interim report is unaudited.

21
Explanatory Notes to the 3-Month Report 2013/2014
Hönle prepares interim consolidated financial statements in accordance with the International Finan-cial Reporting Standards (IFRS) published by the International Financial Reporting Standards Board (IASB) and their interpretations as adopted in the European Union. Hönle prepares and publishes the interim consolidated financial statements in euro currency (EUR). The present interim consolidated financial statements were prepared in accordance with IAS 34 “Interim Financial Reporting”. They are to be read in the context of the consolidated financial state-ments published by the Company for the 2012/2013 financial year. The consolidated balance sheet as at 31 December 2013 and the consolidated income statement, the consolidated statement of comprehensive income, the statement of changes in consolidated equity, and the consolidated cash flow statement for the reporting periods ending on 31 December 2013 and 2012, respectively, as well as the notes to the financial statements were not audited and were not subjected to an audit review. The significant accounting, valuation and consolidation methods have not changed in comparison with the 2012/2013 consolidated financial statements. In June 2011, the IASB published amendments respecting the treatment of employee benefits and, in particular, the benefits following the termination of employment relationships and pensions pursuant to IAS 19. The revised standard was adopted by the European Union and included in European law in June 2012. Application of the amended IAS 19 is mandatory for the first time for financial years beginning on or after 1 January 2013. At Dr. Hönle AG, the changes associated with the revised IAS 19 concern the measurement of pension obligations. IAS 19 mainly leads to changes concerning the disclosure of the financial result in the income statement. The discontinuation of the corridor method and the above stated changes of the revised IAS 19 impact on the Dr. Hönle Group. The IAS 19 provisions must be applied retrospectively. Consequently, the Group's opening balance sheet as at 1 October 2012, the consolidated balance sheet as at 31 December 2012 and the Group's income statement and statement of comprehensive income were adjusted in the first quarter of 2012. With respect to further adjustments of prior-year figures for the first quarter 2012/2013 pursuant to IAS 8, we refer to the consolidated financial statements for 2012/2013. The amendments primarily concern the financial result and other comprehensive income.

22
Opening balance sheet as at 01.10.2012 01.10.2012
before after
adjustment adjustment adjustment
T€ T€ T€
Assets
Deferred income tax assets 1,234 332 1,566
Liabilities
Reserve of actuarial gains/losses 0 -984 -984
Retained earnings 19,710 -984 18,726
Equity attributable to Dr. Hönle AG's
shareholders 41,811 -984 40,827
Equity 43,830 -984 42,846
Pension provisions 1,932 1,315 3,247 Consolidated balance sheet as at 30.09.2013 30.09.2013
before after
adjustment adjustment adjustment
T€ T€ T€
Assets
Deferred income tax assets 1,556 213 1,769
Liabilities
Reserve of actuarial gains/losses 0 -647 -647
Retained earnings 23,547 -647 22,900
Equity attributable to Dr. Hönle AG's
shareholders 45,648 -647 45,001
Equity 47,637 -647 46,990
Pension provisions 2,218 860 3,078
01.10.2012-31.12.2012
01.10.2012-31.12.2012
before afterStatement of consolidated comprehensive adjustment adjustment adjustmentincome T€ T€ T€Consolidated net income 912 -24 916
Positions that are not reclassified to profit or loss
Changes in actuarial gains/losses 0 114 114Income tax effects 0 -29 -29Total other comprehensive income 53 63 139total comprehensive income 965 40 1,055Profit attributable to non-controlling interests 27 34 61Profit attributable to shareholders of Dr. Hönle AG 938 6 994
23
In the first quarter of the 2013/2014 financial year, Eltosch America Inc., a wholly owned subsidiary of Eltosch Torsten Schmidt GmbH, acquired assets, in particular relating to inventory, of Grafix LP. The purchase price for the assets amounted to US-$ 250 thousand. In addition, Dr. Hönle AG acquired a property in Torrington, CT, USA at a purchase price of US-$ 940 thousand. The property was purchased in anticipation of the planned growth in the adhesives segment in the North American market.
24
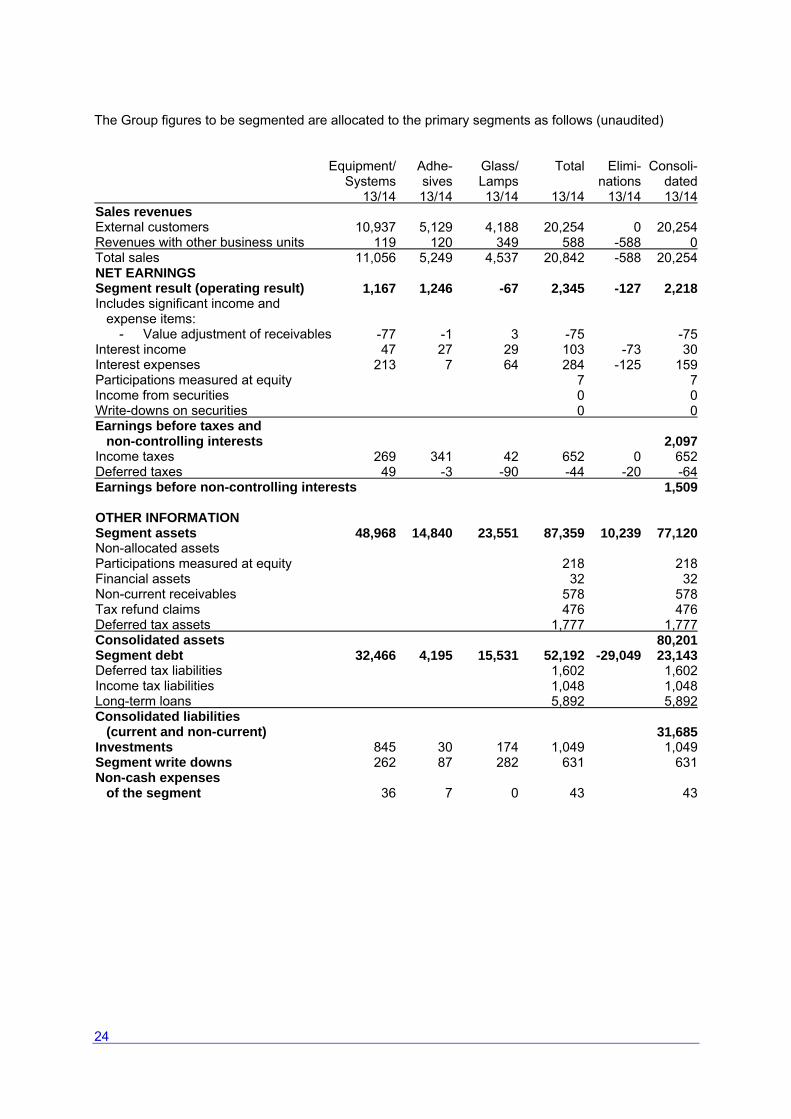
The Group figures to be segmented are allocated to the primary segments as follows (unaudited) Equipment/ Adhe- Glass/ Total Elimi- Consoli- Systems sives Lamps nations dated 13/14 13/14 13/14 13/14 13/14 13/14 10,937 5,129 4,188 20,254 0 20,254 119 120 349 588 -588 0 11,056 5,249 4,537 20,842 -588 20,254 1,167 1,246 -67 2,345 -127 2,218 -77 -1 3 -75 -75 47 27 29 103 -73 30 213 7 64 284 -125 159 7 7 0 0 0 0 2,097 269 341 42 652 0 652 49 -3 -90 -44 -20 -64 1,509 48,968 14,840 23,551 87,359 10,239 77,120 218 218 32 32 578 578 476 476 1,777 1,777 80,201 32,466 4,195 15,531 52,192 -29,049 23,143 1,602 1,602 1,048 1,048 5,892 5,892 31,685 845 30 174 1,049 1,049 262 87 282 631 631 36 7 0 43 43
Sales revenues External customers Revenues with other business units Total sales NET EARNINGS Segment result (operating result) Includes significant income and expense items:
- Value adjustment of receivables Interest income Interest expenses Participations measured at equity Income from securities Write-downs on securities Earnings before taxes and non-controlling interests Income taxes Deferred taxes Earnings before non-controlling interests OTHER INFORMATION Segment assets Non-allocated assets Participations measured at equity Financial assets Non-current receivables Tax refund claims Deferred tax assets Consolidated assets Segment debt Deferred tax liabilities Income tax liabilities Long-term loans Consolidated liabilities (current and non-current) Investments Segment write downs Non-cash expenses of the segment

25
Equipment/ Adhe- Glass/ Total Elimi- Consoli- Systems sives Lamps nations dated 12/13 12/13 12/13 12/13 12/13 12/13 8,020 4,368 4,155 16,543 0 16,543 285 23 265 573 -573 0 8,305 4,391 4,420 17,116 -573 16,543 527 940 132 1,599 -124 1,475 -26 -37 -1 -64 -64 36 25 26 87 -92 -5 139 40 92 270 -69 202 -3 -3 1 1 1 1 1,265 95 278 56 429 0 429 -7 -2 -37 -46 -34 -80 916 33,701 14,383 23,925 72,009 2,535 74,544 195 195 32 32 755 755 783 783 1,468 1,468 77,776 26,104 4,810 11,750 42,664 -15,393 27,271 1,505 1,505 1,678 1,678 3,428 3,428 33,881 250 94 316 659 659 217 84 317 618 618 1,158 110 12 1,280 1,280
Sales revenues External customers Revenues with other business units Total sales NET EARNINGS Segment result (operating result) Includes significant income and expense items:
- Value adjustment of receivables Interest income Interest expenses Participations measured at equity Income from securities Write-downs on securities Earnings before taxes and non-controlling interests Income taxes Deferred taxes Earnings before non-controlling interests OTHER INFORMATION Segment assets Non-allocated assets Participations measured at equity Financial assets Non-current receivables Tax refund claims Deferred tax assets Consolidated assets Segment debt Deferred tax liabilities Income tax liabilities Long-term loans Consolidated liabilities (current and non-current) Investments Segment write downs Non-cash expenses of the segment Adjusted prior-year values according IAS 8; see notes

26
Segment assets are defined as the sum total of intangible assets, property, plant and equipment, inventories, current receivables and liquid assets. Segment debt comprises non-current and current liabilities. Non-cash segment expenses take changes in pension accruals and changes in other accruals into account. Transfer prices relating to intercompany services and supplies including the pertaining calculation basis are based on the same terms and conditions as those applied for third parties. In this respect no changes have been recorded in comparison with previous years.
Statement of the Company’s Management We affirm that, to the best of our knowledge, the consolidated financial statement gives a true and fair view of the net assets, financial position and results of operations of the Group in accordance with generally accepted accounting principles. The group management report provides a suitable under-standing of the course of business including the business results and the Group’s position and suitably presents the opportunities and risks of future development. Gräfelfing, 15 February 2014 Dr. Hönle AG The Board of Management Note The management report contains statements made and information provided by Dr. Hönle AG that relate to future time periods. The future-oriented statements represent assessments that were made on the basis of information available at the time when this report was prepared. Should the assump-tions underlying the forecasts prove to be incorrect or should risks, such those as mentioned in the risk report, materialise, actual developments and results may deviate from current expectations. The Company assumes no obligation to update the statements contained in this management report, with the exception of publishing such updates as required by statutory provisions. Numbers and percentages, contained in this report, may include rounding differences.

27
Financial Calendar
21 March 2014
Shareholders' Meeting in Munich
23 May 2014
6 Months Report 2013/2014
21 August 2014
9 Months Report 2013/2014

28
Dr. Hönle AG ▪ UV Technology
Lochhamer Schlag 1 ▪ D-82166 Gräfelfing/Munich
Telephone +49 89 85608-0 ▪ Fax +49 89 85608-148
E-Mail [email protected] ▪ Internet www.hoenle.de
Investor Relations
Peter Weinert
Telephone +49 89 85608-173
E-Mail [email protected]