Embed Size (px)
Citation preview
A customer pays for value. We often associate functionality with value and how well the product
or service performs that function as performance. Though this is often true, it is always impor-
tant to keep in mind that what we think is of value to the customer, may not always be the case.
This is illustrated in Figure 3-1. In the context of information handling devices, performance is
related to the specific function of the various types of information handling.
INTEGRATED CIRCUIT ENGINEERING CORPORATION 3-1
3 METRICS FOR TECHNOLOGY PERFORMANCE
© 1982 by Sidney Harris – “What’s So Funny About Computers?”, William Kaufmann, Inc./ICE, "Roadmaps of Packaging Technology" 16065
Figure 3-1.
INFORMATION HANDLING TECHNOLOGIES
Our society has always had a thirst for information, and technology has been fueling the revolu-
tion in how we access information since the Gutenberg press first churned out 42 line Bibles in
1454. Information is handled in four basic ways:
¥ processed
¥ transmitted
¥ stored
¥ interfaced with the physical world
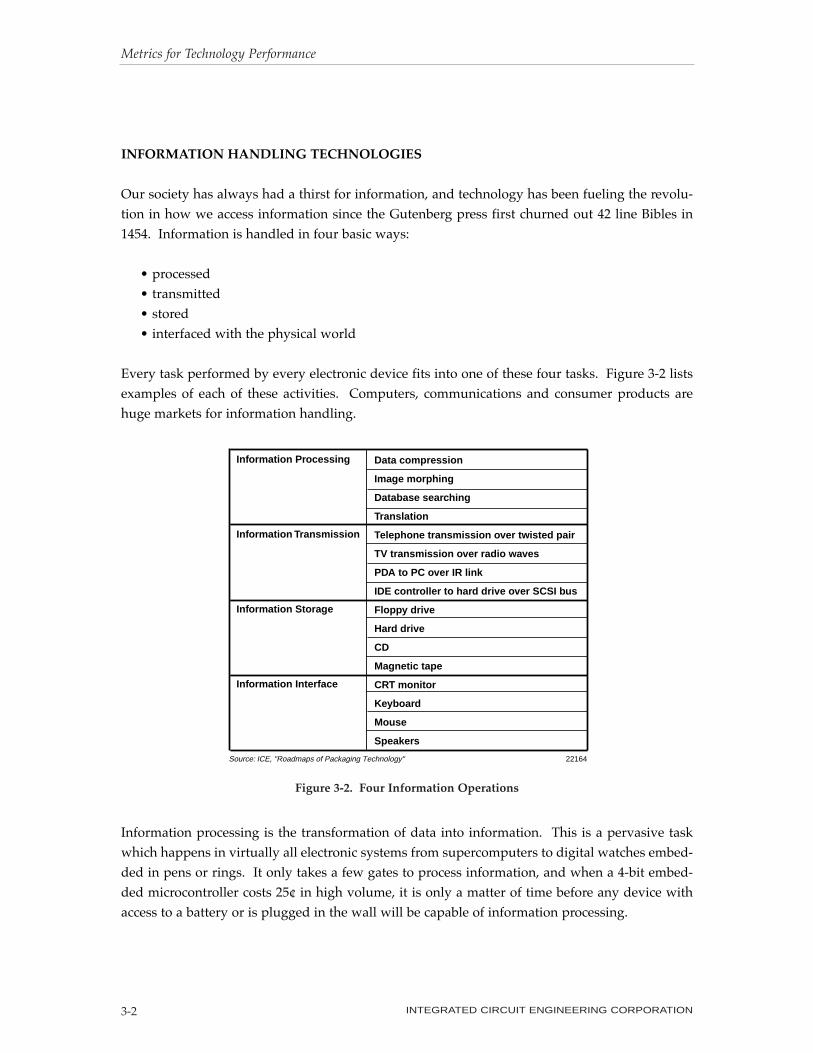
Every task performed by every electronic device fits into one of these four tasks. Figure 3-2 lists
examples of each of these activities. Computers, communications and consumer products are
huge markets for information handling.
Information processing is the transformation of data into information. This is a pervasive task
which happens in virtually all electronic systems from supercomputers to digital watches embed-
ded in pens or rings. It only takes a few gates to process information, and when a 4-bit embed-
ded microcontroller costs 25¢ in high volume, it is only a matter of time before any device with
access to a battery or is plugged in the wall will be capable of information processing.
Metrics for Technology Performance
INTEGRATED CIRCUIT ENGINEERING CORPORATION3-2
Information Processing
Information Transmission
Information Storage
Information Interface
Data compression
Image morphing
Database searching
Translation
Telephone transmission over twisted pair
TV transmission over radio waves
PDA to PC over IR link
IDE controller to hard drive over SCSI bus
Floppy drive
Hard drive
CD
Magnetic tape
CRT monitor
Keyboard
Mouse
Speakers
Source: ICE, "Roadmaps of Packaging Technology" 22164
Figure 3-2. Four Information Operations
Information transmission is the transport of data from one location to another. Every electronic
interconnect interface is devoted to either power or information transmission. This task spans from
transistor to transistor on a chip in 2 micron long fine line aluminum wires, to 45 kilometer long
fiber-optic cables from repeater to repeater station, two miles deep in the Atlantic Ocean. In a scale
appropriate to our human size, we are touched by information transmission on a daily basis over
telephone lines, by electromagnetic waves to radios and by infrared links from our remote control
to a TV.
Information storage is the placement of data in a static media where it can be located and retrieved
at a later time. This task spans the scale from on chip registers that may be only 16 bits wide,
through optical disk farms that may contain 10,000 CD discs, each with 10Gbits of data. There are
three currently used electronic media for information storage: semiconductorÑin various forms
of random access memory (RAM), such as dynamic (DRAM), static (SRAM), video (VRAM), flash,
etc.; magnetic, such as magnetic tape, floppy disks and hard disks; and optical, such as compact
disks (CDs), and digital video disks (DVDs).
Information interface refers to the transfer of information from the physical world to the elec-
tronic world, either as input or as output. The Man-Machine interface is a specialized case. The
most common output interfaces encompass visual display devices such as CRT (cathode ray
tube), LCD (liquid crystal display) and printers, or sound generation through speakers. Vibration
is also popular as an output for pagers, transmitting one bit of information. The most popular
input devices today are keyboards, mice, pen-touch screens and microphones for use with voice
recognition software. In addition to the Man-Machine interfaces, there is a whole universe of sen-
sors and actuators that are used in monitor and control applications for automotive, home and
industrial environments.
Though only information processing and transmission are discussed below, the packaging tech-
nologies used in all four applications are discussed throughout this book.
INFORMATION PROCESSING
The Migration from Super Computer to Shirt Pocket
There has never been, and will never be, enough processing power available to the individual.
The functions performed by super computers today will eventually be performed by personal
computers and PDAs tomorrow. Those functions only dreamed of now, will some day be per-
formed by the leading-edge super computers.
Information processing, or computing power, is an intrinsic feature of every electronic device we
use. We call some of these devices computers, such as a mainframe, server, personal computer
or laptop. And some we do not recognize as computers, yet have information processing as their
Metrics for Technology Performance
INTEGRATED CIRCUIT ENGINEERING CORPORATION 3-3
foundation, such as digital cell phones, cameras, personal digital assistants, TVs, washing
machines, and sewing machines. Computers have become embedded into virtually every elec-
tronic device that plugs into the wall or is powered by a battery.
The performance of a computer is not the factor that classifies it as a mainframe or a microcom-
puter. Any table that listed the MIPS (millions of instructions per second) or FLOPS (Floating
Point Operations Per Second) rating of a ÒtypicalÓ super computer would be out of date within a
few years of its introduction.
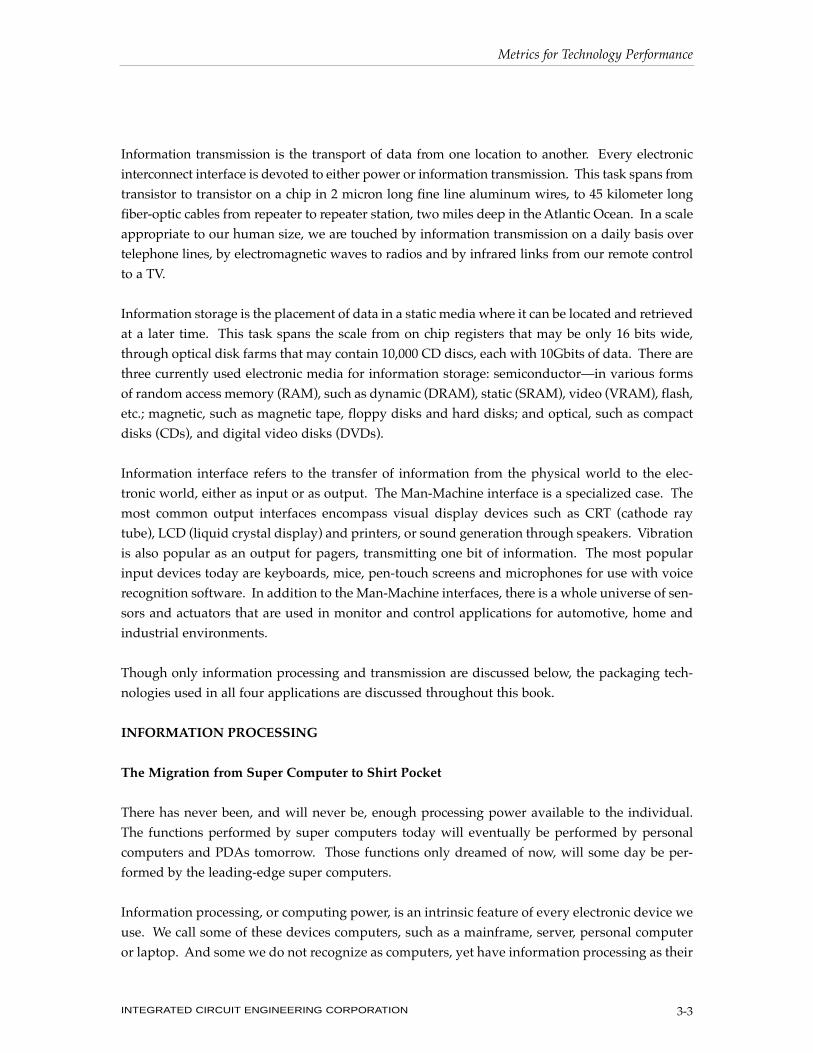
For example, in 1982, a super computer was defined as a computer of about 20MegaFLOPS or
higher. In 1989, the Intel 33MHz 486DX had a peak speed of 27MIPS, roughly equivalent to
20MegaFLOPS, the threshold for super computer speed. Also in 1989, NEC introduced the SX-X,
at 22GigaFLOPS, three orders of magnitude higher than the super computer threshold. This ever
increasing trend in performance is shown in Figure 3-3. The performance of any computer family
is a constantly increasing quantity.
Rather than performance capability, a computer or information appliance is defined by its form
factor. The form factor reflects the physical size of the product, the number of people it can serve
and its shape. These factors also define general price ranges for each form factor. A variety of
Metrics for Technology Performance
INTEGRATED CIRCUIT ENGINEERING CORPORATION3-4
IBM 7090IBM Stretch
IBM 7094
(IBM 360)(PDP6)
IBM 360/90
CDC 6600
CDC 7600
Cyber 205
Cray 1
Cray 2
Cray C90Cray T90
Cray T3ECray T3D
Cray X-MP
Cray Y-MP
1955 1960 1965 1970 1975 1980 1985 1990 1995 2000
105
104
103
102
10
1
0.1
Pea
k S
pee
d (
Mill
ion
s o
f O
per
atio
ns
Per
Sec
on
d)
Year21981Source: Physics Today/ICE, "Roadmaps of Packaging Technology"
IBM704
$5M
$12M
(DEC VAX 780)
(DEC PDP11)
(DEC PDP1)
Intel iPSC
Illiac IV
TMC CM-1
Figure 3-3. Leading Edge Growth of Computer Technologies Since 1955

form factors have emerged for computer systems and information appliances over the last few
decades (Figure 3-4). As electronics technology evolves, these form factors and market prices stay
relatively the same. What changes is the performance capability of each product.
The real revolutions in new products are occurring in the large form factors and in the smallest
form factors. At the high end, the total processing capability available to run an individual pro-
gram opens up new problems to simulation, in a reasonable time period. For example, to simu-
late and predict the local weather for the next day, in less than one dayÕs worth of computation
time, requires an estimated performance of 100GigaFLOPS.
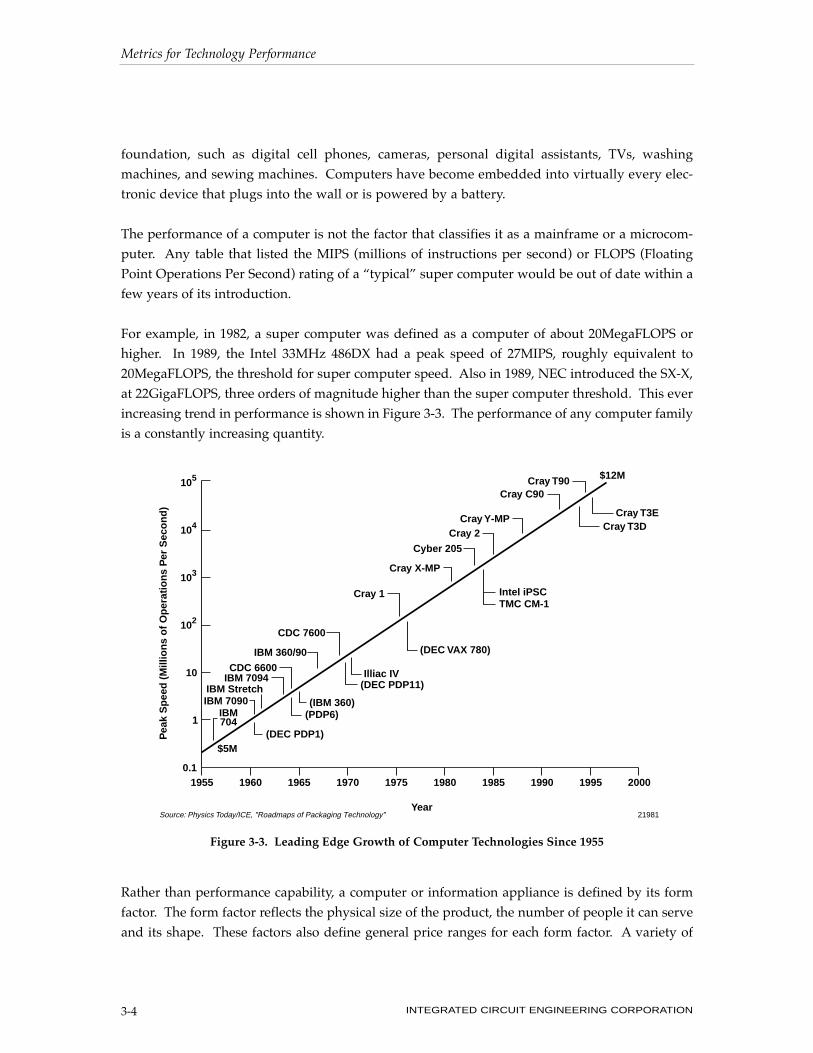
Higher levels of chip integration have allowed what was PC performance to migrate into the shirt
pocket. This is seen in the new generation of Òpersonal information managersÓ such as the
Zaurus, the Pilot and the Wizard, as well as the Notebooks, such as from Toshiba, Compaq, and
IBM. This evolution of microprocessor performance is illustrated in Figure 3-5.
Metrics for Technology Performance
INTEGRATED CIRCUIT ENGINEERING CORPORATION 3-5
15778A
Calculator
Watch
Notebook
Laptop
PC
Workstation
Server
Mainframe Computer
HDTV
Camera
Fax
Super Computer
Telephone
Size Price1 Inch $1
$10M100 Inches
Relative Performance
Source: ICE, "Roadmaps of Packaging Technology"
Figure 3-4. Form Factors for Electronic Systems
In between these two extreme form factors there is a steady migration of features and performance
from the large systems into the smaller ones. Patrick Gelsinger, who led IntelÕs 80486 design team,
has proposed a new law of computing,
ÒEvery concept proven useful in mainframes or minicomputers has migrated onto the
microprocessor.Ó
We might even generalize this more and propose that,
ÒAny function performed by a large size computer will eventually be offered in the smallest
computers.Ó
Driving Forces on Computing Devices
The universal driving force for all these devices is more processing power, in a smaller volume, at
lower price. This has often been summarized with the phrase, ÒFaster, smaller, cheaper.Ó This
march of ever increasing performance density per unit cost is propelled by finding engineering
solutions that allow packing into each form factor more gates, able to switch at higher speeds, at
a lower manufacturing cost.
At the high end, the high power dissipation is accepted, and adequate means of dealing with it
are implemented. At the low end, where portability is key, low power consumption becomes
another critical factor, and the driving force is more performance density per unit cost per watt.
Metrics for Technology Performance
INTEGRATED CIRCUIT ENGINEERING CORPORATION3-6
1955 1960 1965 1970 1975 1980 1985 1990 1995 2000
103
102
10
1
0.1
DEC PDPS$30K
Intel 4004
Altair 8800
Apple IIApollo WS
IBM PCSun WS
MacintoshPC
Pentium PC
Pentium Pro PC
$5K
Pea
k S
pee
d (
Mill
ion
s o
f O
per
atio
ns
Per
Sec
on
d)
Year21980Source: Physics Today/ICE, "Roadmaps of Packaging Technology"
Figure 3-5. Functional/Affordable Growth of Computer Technology Since 1955
When the information processing capability that can fit in a form factor reaches the level to encom-
pass a new task, at an acceptable market price, a new product may be created. The digital watch
was created when the sophisticated timing, alarm, and display functions could be integrated onto
one chip. The smart card and hand calculator were made possible with the first generation micro-
processor, which integrated about 2000 gates on one chip. These gates, switching at a few hun-
dred kilohertz, provided enough processing power to perform floating point operations and
transcendental calculations in less than a second.
Two revolutions will drive the need for more computing power to devices used by the individual
in the next few years, such as desktop computers and information appliances: ÒsocialÓ interfaces,
and real time virtual reality displays.
Social interfaces take advantage of information processing to lower the technical barriers between
users and computers or information appliances. Two major elements of a social interface are voice
recognition and artificial intelligence. With these two features, users may be able to interact with
a computer in plain English, without special training.
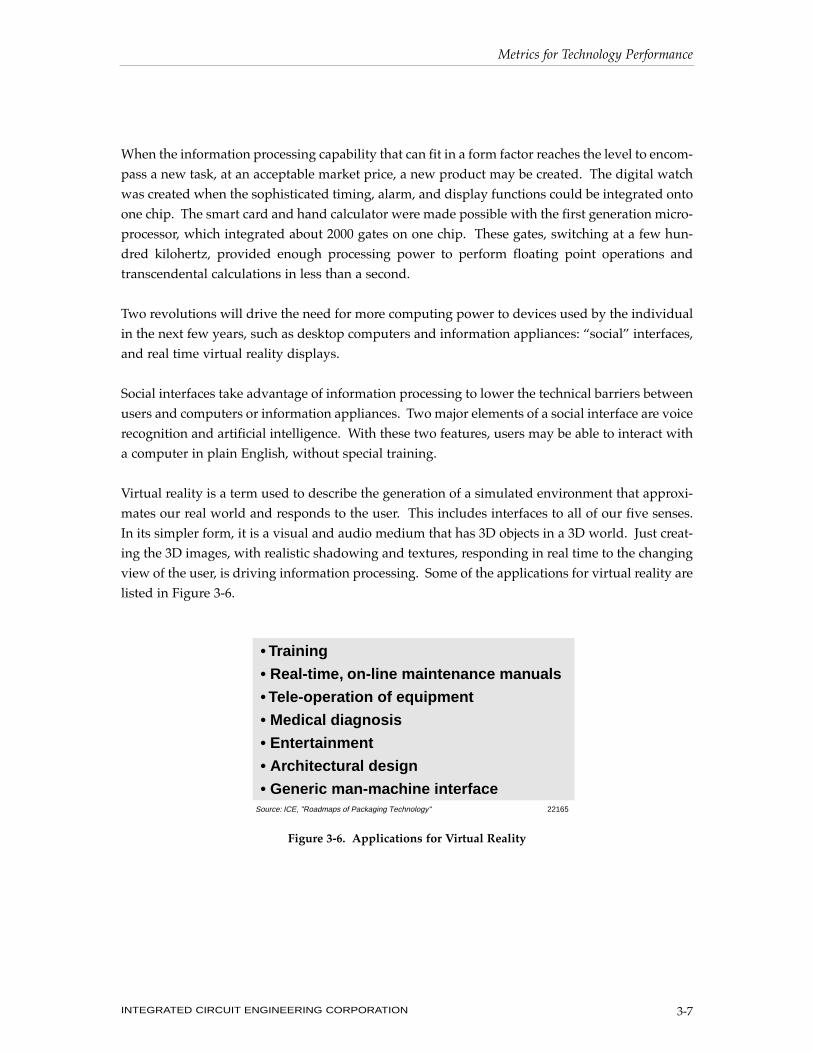
Virtual reality is a term used to describe the generation of a simulated environment that approxi-
mates our real world and responds to the user. This includes interfaces to all of our five senses.
In its simpler form, it is a visual and audio medium that has 3D objects in a 3D world. Just creat-
ing the 3D images, with realistic shadowing and textures, responding in real time to the changing
view of the user, is driving information processing. Some of the applications for virtual reality are
listed in Figure 3-6.
Metrics for Technology Performance
INTEGRATED CIRCUIT ENGINEERING CORPORATION 3-7
Figure 3-6. Applications for Virtual Reality
Source: ICE, "Roadmaps of Packaging Technology" 22165
• Training
• Real-time, on-line maintenance manuals
• Tele-operation of equipment
• Medical diagnosis
• Entertainment
• Architectural design
• Generic man-machine interface

Implementing Information Processing
The chips that perform the information processing have evolved as well. The range of information
processing devices includes:
¥ motherboard based CPU
¥ chip set based CPU
¥ single chip microprocessor unit (MPU)
¥ microcontroller unit (MCU)
¥ digital signal processor (DSP)
At the high end, it is usually a chip set which composes the CPU (central processing units). For
example, in the Fujitsu VP2000, the CPU is one or more boards, each containing over 100 ECL gate
arrays, as shown in Figure 3-7.
In the case of servers and high end workstations, a chip set usually is composed of a CPU, a
memory management unit (MMU), an integer processor unit (IPU), and associated level 2 cache
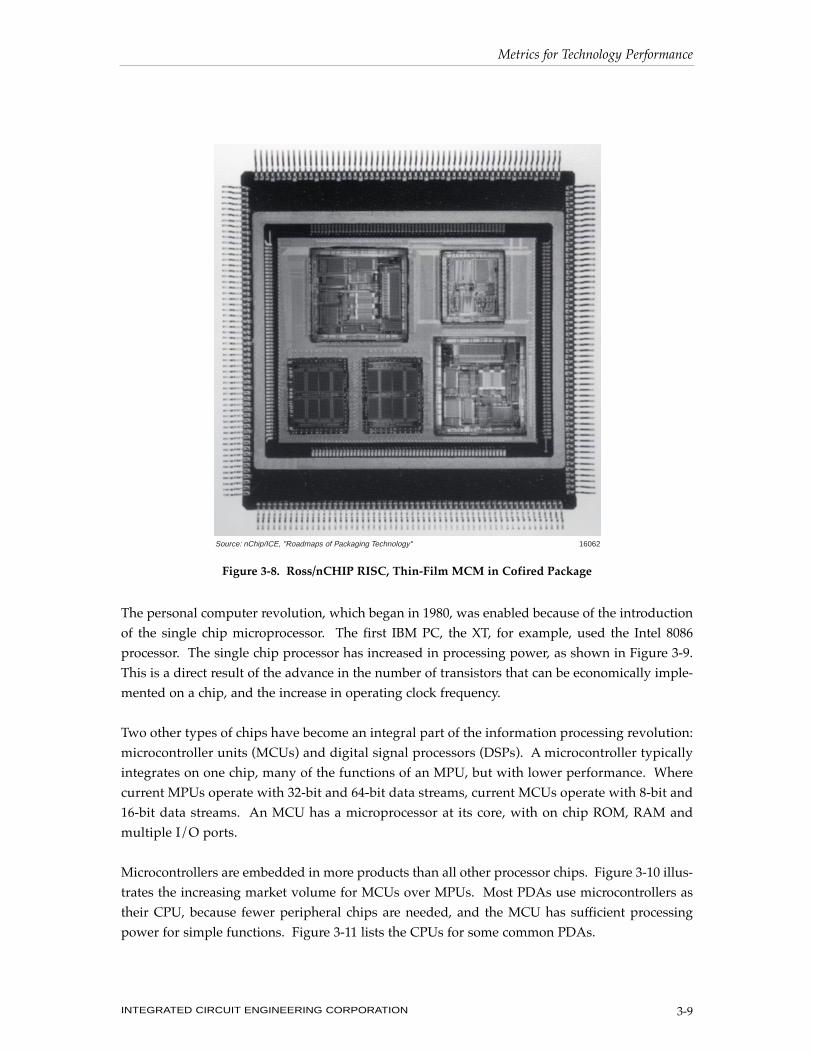
SRAMs. An example of the Ross Hypersparc processor, used in Sun Microsystems workstations,
for example, is shown in Figure 3-8.
Metrics for Technology Performance
INTEGRATED CIRCUIT ENGINEERING CORPORATION3-8
Source: Fujitsu/ICE, "Roadmaps of Packaging Technology" 22166
Figure 3-7. Fujitsu VP2000 CPU Board and Cold Plate
The personal computer revolution, which began in 1980, was enabled because of the introduction
of the single chip microprocessor. The first IBM PC, the XT, for example, used the Intel 8086
processor. The single chip processor has increased in processing power, as shown in Figure 3-9.
This is a direct result of the advance in the number of transistors that can be economically imple-
mented on a chip, and the increase in operating clock frequency.
Two other types of chips have become an integral part of the information processing revolution:
microcontroller units (MCUs) and digital signal processors (DSPs). A microcontroller typically
integrates on one chip, many of the functions of an MPU, but with lower performance. Where
current MPUs operate with 32-bit and 64-bit data streams, current MCUs operate with 8-bit and
16-bit data streams. An MCU has a microprocessor at its core, with on chip ROM, RAM and
multiple I/O ports.
Microcontrollers are embedded in more products than all other processor chips. Figure 3-10 illus-
trates the increasing market volume for MCUs over MPUs. Most PDAs use microcontrollers as
their CPU, because fewer peripheral chips are needed, and the MCU has sufficient processing
power for simple functions. Figure 3-11 lists the CPUs for some common PDAs.
Metrics for Technology Performance
INTEGRATED CIRCUIT ENGINEERING CORPORATION 3-9
Source: nChip/ICE, "Roadmaps of Packaging Technology" 16062
Figure 3-8. Ross/nCHIP RISC, Thin-Film MCM in Cofired Package

A DSP chip is a highly specialized chip which performs a numeric transform of an input data
stream to result in an output data stream. The most common function is the Fast Fourier
Transform (FFT). This operation takes a time domain data stream and converts it into a frequency
spectrum. In this respect, a DSP is a hardware accelerator for some mathematical transforms.
Metrics for Technology Performance
INTEGRATED CIRCUIT ENGINEERING CORPORATION3-10
P6* 300 MIPS(100MHz)
Pentium 112 MIPS(66MHz)
8086 0.75 MIPS (10MHz)
1.0
1970 1975 1980 1985 1990 20001995
0.1
0.3
0.5
0.7
3
5
7
10
30
50
70
100
300
500
700
1,000
4004 0.06 MIPS (108KHz)
8008 0.06 MIPS (200KHz)
8080 0.64 MIPS (2MHz)
8085 0.37 MIPS (5MHz)
80286 2.66 MIPS (12MHz) Intel 386DX 6 MIPS (16MHz)
Intel 486DX27 MIPS (33MHz)
Intel 386DX 7 MIPS (20MHz)
Intel 386DX 8.5 MIPS (25MHz)
Intel 386DX 11.4 MIPS (30MHz)
Intel 486DX 41 MIPS (50MHz)
P6 600 MIPS(200MHz)
Per
form
ance
(M
IPS
)
Year
21602BSource: ICE, "Roadmaps of Packaging Technology"
*ICE estimate
0.01
0.03
0.05
0.07
Figure 3-9. Intel Microprocessor Clock Frequency

Typically, blocks of 1024 points of data are sampled. If this is performed for voice processing, the
data stream may be the microphone voltage, sampled and digitized every 100 microseconds. A
1024 point data stream will represent 0.1sec of speech. When an FFT is performed on this data set,
Metrics for Technology Performance
INTEGRATED CIRCUIT ENGINEERING CORPORATION 3-11
20318CSource: WSTS/ICE, "Roadmaps of Packaging Technology"
2,000
4,000
6,000
8,000
10,000
12,000
14,000
16,000
18,000
1996199519941993199219910
500
1,000
1,500
2,000
2,500
3,000
3,500
MPU (Units)MPU (Dollars)MCU (Units)MCU (Dollars)
Mill
ion
s o
f D
olla
rs
Mill
ion
s o
f U
nit
s
Year
1,722
136
4,850
3,565
1,902
143
5,245
5,460
2,221
167
6,560
8,590
2,659
170
8,275
10,995
3,067
212
10,735
14,280
3,470
245
11,615
17,510
MCU
MPU
MCU
MPU
Units (M)
Dollars ($M)
(EST)
Figure 3-10. Comparison of the MCU and MPU Markets
PDA CPUClock
Frequency
Casio Z-7000
Apple Newton
Sharp ZR5000
Sony Magic Link PIC-1000
Motorola Envoy Communicator
x86
ARM610
16bit custom
Zilog Z85180
Motorola Dragon 68349
7.5MHz
20MHz
—
14.3MHz
16MHz
Source: ICE, "Roadmaps of Packaging Technology" 22167
Figure 3-11. Microcontrollers Inside Popular PDAs
the output will be the amplitude and phase of the spectrum, from 10Hz, up to 5KHz, at 10Hz
intervals. Many algorithms, such as voice recognition and signal recovery in the presence of noise,
operate more efficiently in the frequency domain than in the time domain.
DSPs are typically rated by how quickly they perform an FFT operation on a vector of 1024 data
points, each of 16- or 32-bit size. For example, the ADSP-21060 DSP from Analog Devices can per-
form the FFT in 0.046 seconds. Two devices could work in parallel and provide real time, contin-
uous display of an audio channel.
Applications for the FFT function have exploded in the past few years. They appear in the obvi-
ous applications, such as video processors, multi-media, audio, modem/fax chips sets, and wire-
less communications. In addition, they are being used as motor controllers. Every device with a
motor will soon have a DSP chip. This includes disk drives, dishwashers, air conditioners, and
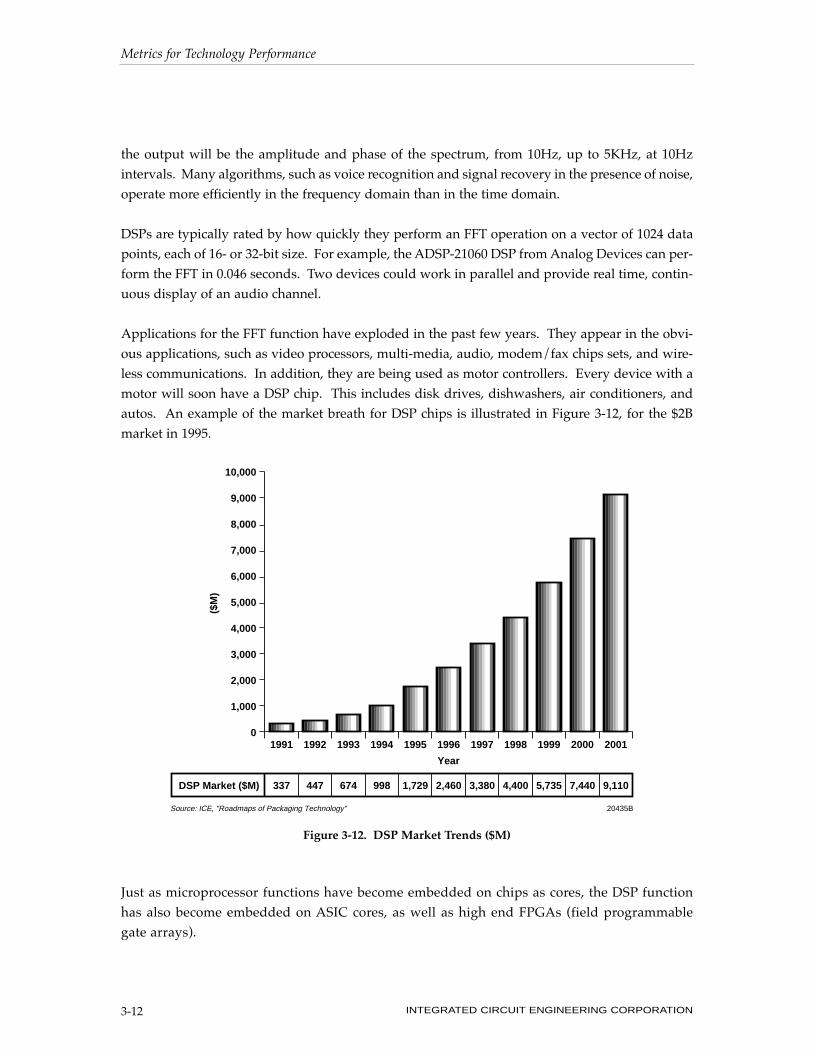
autos. An example of the market breath for DSP chips is illustrated in Figure 3-12, for the $2B
market in 1995.
Just as microprocessor functions have become embedded on chips as cores, the DSP function
has also become embedded on ASIC cores, as well as high end FPGAs (field programmable
gate arrays).
Metrics for Technology Performance
INTEGRATED CIRCUIT ENGINEERING CORPORATION3-12
0
1,000
2,000
3,000
4,000
5,000
6,000
7,000
8,000
9,000
10,000
20012000199919981997199619951994199319921991
Year
($M
)
20435BSource: ICE, "Roadmaps of Packaging Technology"
337DSP Market ($M) 447 674 998 1,729 2,460 3,380 4,400 5,735 7,440 9,110
Figure 3-12. DSP Market Trends ($M)
For specialized operations, a DSP based chip can outperform the fastest MPUs. For example, TI
introduced the Multimedia Video Processor (MVP). It is a four million transistor chip with four
32-bit DSPs, a 32-bit RISC processor with 100MFLOPs capability, a transfer controller, two video
controllers, and 50Kbytes of SRAM. It is capable of 2,000MIPS when performing specialized
video processing.
An Introduction To Performance Metrics
Performance, in general, is an ambiguous and poorly defined term for describing computer sys-
tems. More often than not, it is used as a sales and marketing tool to justify the price of a new
product. It makes sense only when the specific test that is used to measure the performance is
explicitly stated, and then only if the test is related to the intended use.
There are two different methods of quantifying performance: the actual measured execution time
of running special, well defined reference programs, called benchmarks, or the rate at which well
defined instructions, either integer or floating point, can be processed.
The execution speed of instructions will depend on the type of code that is running, and how well
it has been optimized for the architecture of the computer. It is important to be aware of the con-
ditions of the test run to rate the performance of a computer. Performance ratings can vary over
a factor of 10 for the same computer because of variations in test conditions.
Benchmarks As Performance Metrics
There are a number of standardized programs that have been written and accepted by the indus-
try as rulers for performance. Their variety reflects the different types of tasks a computer per-
forms. The most common historical benchmarks are:
1. Linpack; solves 100 simultaneous linear equations with 100 unknowns, exercising matrix
manipulation abilities.
2. Whetstone; most general test, composed of a collection of FORTRAN-like routines that
include floating point and integer calculations, transcendental functions, array manipula-
tion, and conditional jumps and loops.
3. Dhrystone; non-numeric test to simulate a high-level C program that contains memory
assignments, control statements, and function calls.
4. TP1; used to simulate transaction analysis; fetches a record from a database, processes it, and
rewrites it.
Metrics for Technology Performance
INTEGRATED CIRCUIT ENGINEERING CORPORATION 3-13

To evaluate the performance of a computer, these programs are run and the number of times they
can be repeated per second is reported. The units are in Whetstones/sec, Linpacks/sec, etc. For
example, the Sun 4/260 is rated at 19,000 Dhrystones/sec.
The final application will influence which is the most critical benchmark to use. For example, a
computer for scientific work should be rated in Whetstones.
Figure 3-13 lists the performance ratings of various computer systems against the standard metrics.
MIPS and FLOPS
A measure of intrinsic processing speed falls into two categories; the number of instructionsÑ
such as add, subtract, move, branch, and fetchÑthat are executed per second, and the number of
floating point operations per second. A floating point operation, involving real numbers and
operations such as multiply and divide, typically requires 0.1 to 10 instructions to execute,
depending on the logic architecture and the code.
When reporting the speed in instructions per second, convention has adopted the units of MIPS,
Millions of Instructions Per Second. When reporting the speed for Floating Point Operations Per
Second, the units are FLOPS, often given in units of MegaFLOPS or GigaFLOPS.
If the userÕs applications will be mostly floating point operations, the FLOPS are a better metric
for real world performance than the MIPS. The number of FLOPS at which a system operates can
be maximized by the design of the logic architecture and optimized code. With a co-processor or
vector processor, common with super computers, the MegaFLOPS may be from 0.5 to 10 times the
MIPS rating.
Metrics for Technology Performance
INTEGRATED CIRCUIT ENGINEERING CORPORATION3-14
COMPUTER
50
25
50
16
10
2.9
CLOCK PERIOD(nsec) MIPS MFLOPS
15781Source: ICE, "Roadmaps of Packaging Technology"
Compaq Deskpro486/25
Intel i860
IBM 320(RS/6000)
VAX 9000
Amdahl 5990-700(Dual Processor)
NEC SX-3
15
65
27.5
30
63
—
—
5.4
7.4
125
—
5,500
Figure 3-13. Performance Ratings of Selected Computers
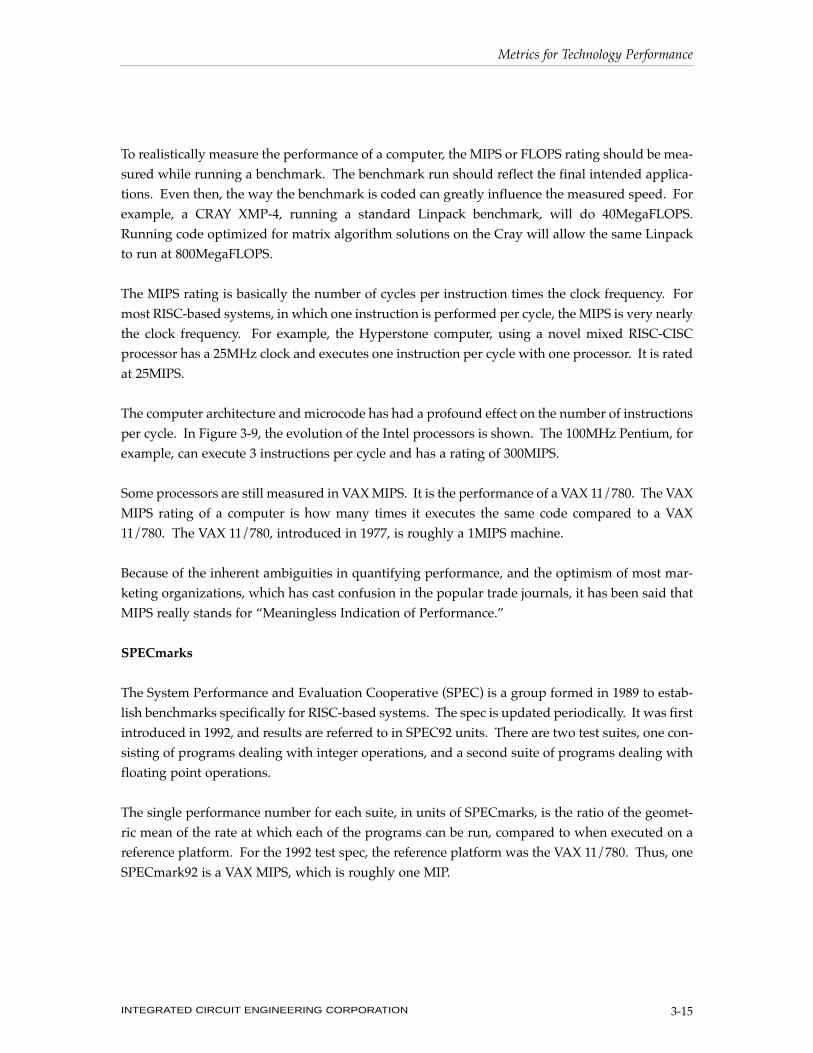
To realistically measure the performance of a computer, the MIPS or FLOPS rating should be mea-
sured while running a benchmark. The benchmark run should reflect the final intended applica-
tions. Even then, the way the benchmark is coded can greatly influence the measured speed. For
example, a CRAY XMP-4, running a standard Linpack benchmark, will do 40MegaFLOPS.
Running code optimized for matrix algorithm solutions on the Cray will allow the same Linpack
to run at 800MegaFLOPS.
The MIPS rating is basically the number of cycles per instruction times the clock frequency. For
most RISC-based systems, in which one instruction is performed per cycle, the MIPS is very nearly
the clock frequency. For example, the Hyperstone computer, using a novel mixed RISC-CISC
processor has a 25MHz clock and executes one instruction per cycle with one processor. It is rated
at 25MIPS.
The computer architecture and microcode has had a profound effect on the number of instructions
per cycle. In Figure 3-9, the evolution of the Intel processors is shown. The 100MHz Pentium, for
example, can execute 3 instructions per cycle and has a rating of 300MIPS.
Some processors are still measured in VAX MIPS. It is the performance of a VAX 11/780. The VAX
MIPS rating of a computer is how many times it executes the same code compared to a VAX
11/780. The VAX 11/780, introduced in 1977, is roughly a 1MIPS machine.
Because of the inherent ambiguities in quantifying performance, and the optimism of most mar-
keting organizations, which has cast confusion in the popular trade journals, it has been said that
MIPS really stands for ÒMeaningless Indication of Performance.Ó
SPECmarks
The System Performance and Evaluation Cooperative (SPEC) is a group formed in 1989 to estab-
lish benchmarks specifically for RISC-based systems. The spec is updated periodically. It was first
introduced in 1992, and results are referred to in SPEC92 units. There are two test suites, one con-
sisting of programs dealing with integer operations, and a second suite of programs dealing with
floating point operations.
The single performance number for each suite, in units of SPECmarks, is the ratio of the geomet-
ric mean of the rate at which each of the programs can be run, compared to when executed on a
reference platform. For the 1992 test spec, the reference platform was the VAX 11/780. Thus, one
SPECmark92 is a VAX MIPS, which is roughly one MIP.
Metrics for Technology Performance
INTEGRATED CIRCUIT ENGINEERING CORPORATION 3-15
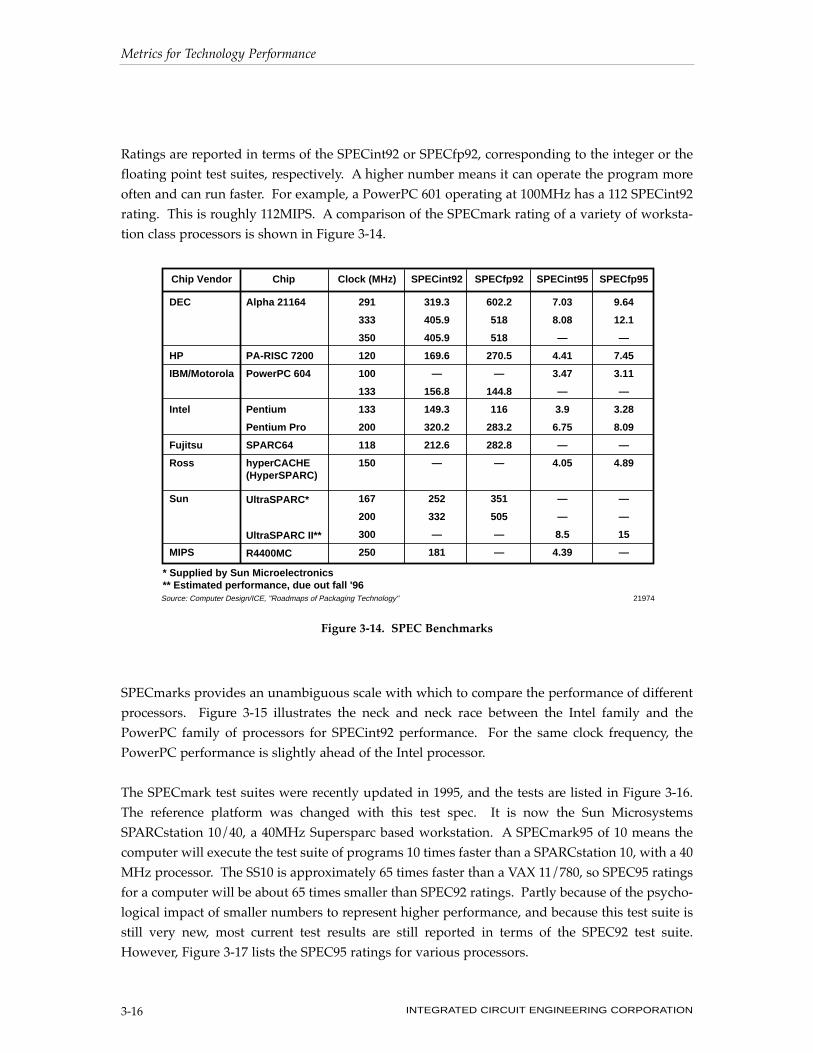
Ratings are reported in terms of the SPECint92 or SPECfp92, corresponding to the integer or the
floating point test suites, respectively. A higher number means it can operate the program more
often and can run faster. For example, a PowerPC 601 operating at 100MHz has a 112 SPECint92
rating. This is roughly 112MIPS. A comparison of the SPECmark rating of a variety of worksta-
tion class processors is shown in Figure 3-14.
SPECmarks provides an unambiguous scale with which to compare the performance of different
processors. Figure 3-15 illustrates the neck and neck race between the Intel family and the
PowerPC family of processors for SPECint92 performance. For the same clock frequency, the
PowerPC performance is slightly ahead of the Intel processor.
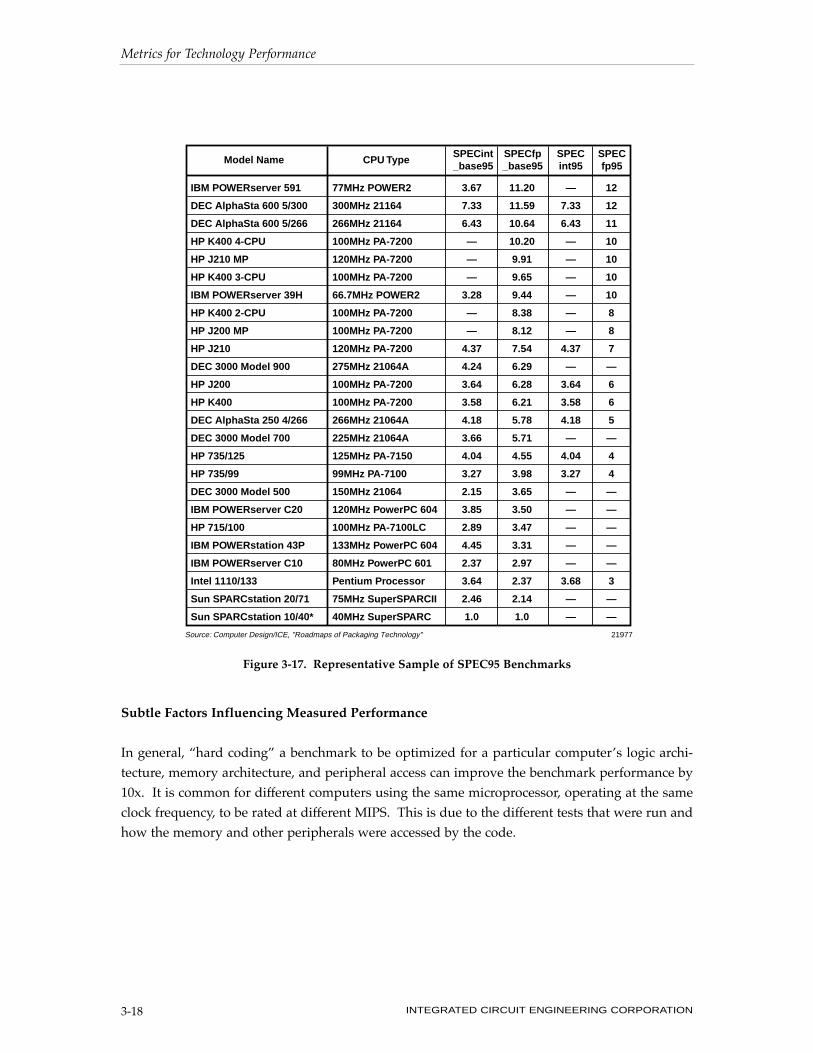
The SPECmark test suites were recently updated in 1995, and the tests are listed in Figure 3-16.
The reference platform was changed with this test spec. It is now the Sun Microsystems
SPARCstation 10/40, a 40MHz Supersparc based workstation. A SPECmark95 of 10 means the
computer will execute the test suite of programs 10 times faster than a SPARCstation 10, with a 40
MHz processor. The SS10 is approximately 65 times faster than a VAX 11/780, so SPEC95 ratings
for a computer will be about 65 times smaller than SPEC92 ratings. Partly because of the psycho-
logical impact of smaller numbers to represent higher performance, and because this test suite is
still very new, most current test results are still reported in terms of the SPEC92 test suite.
However, Figure 3-17 lists the SPEC95 ratings for various processors.
Metrics for Technology Performance
INTEGRATED CIRCUIT ENGINEERING CORPORATION3-16
Chip Vendor Chip Clock (MHz) SPECint92 SPECint95SPECfp92 SPECfp95
DEC
HP
IBM/Motorola
Intel
Fujitsu
Ross
Sun
MIPS
Alpha 21164
PA-RISC 7200
PowerPC 604
Pentium
Pentium Pro
SPARC64
hyperCACHE(HyperSPARC)
291
333
350
120
100
133
133
200
118
150
167
200
300
250
319.3
405.9
405.9
169.6
—
156.8
149.3
320.2
212.6
—
252
332
—
181
602.2
518
518
270.5
—
144.8
116
283.2
282.8
—
351
505
—
—
7.03
8.08
—
4.41
3.47
—
3.9
6.75
—
4.05
—
—
8.5
4.39
9.64
12.1
—
7.45
3.11
—
3.28
8.09
—
4.89
—
—
15
—
* Supplied by Sun Microelectronics** Estimated performance, due out fall '96Source: Computer Design/ICE, "Roadmaps of Packaging Technology" 21974
UltraSPARC*
UltraSPARC II**
R4400MC
Figure 3-14. SPEC Benchmarks

Metrics for Technology Performance
INTEGRATED CIRCUIT ENGINEERING CORPORATION 3-17
1,000
500
400
300
200
100
01994 1995 1996 1997 1998
Date of First Volume Shipments
SP
EC
int9
2 (l
og
sca
le)
100MHz
200
133
120
90MHz
80MHz
100
150
180
150150
New 603 Core
P6+
New 604 Core
New620 CoreP7??
e
e
133MHz
200
150
Source: MicroDesign Resources/ICE, "Roadmaps of Packaging Technology" 21975
P6
620
604
P54/P55
603
Figure 3-15. Pentium Versus PowerPC Performance
Suite Name Comments
CINT95
CFP95
099.go
124.m88ksim
126.gcc
129.compress
130.li
132.ijpeg
134.perl
147.vortex
101.tomcatv
102.swim
103.su2cor
104.hydro2d
107.mgrid
110.applu
125.turb3d
141.apsi
145.fppp
146.wave5
Al game. Plays "Go."
Motorola 88k chip simulator with test program.
New version of GCC, compiles SPARC code.
Compresses/decompresses file in memory.
Lisp interpreter.
Graphic JPEG compression/decompression.
Perl code that manipulates strings, prime numbers.
Data-base program.
Mesh-generation program.
Shallow-water model (1024 x 1024 grid).
Quantum physics; Monte Carlo simulation.
Astrophysics; Hydrodynamical Navier Stokes equations.
Multi-grid solver in 3-D potential field.
Parabolic/elliptic partial differential equations.
Simulates isotropic, homogeneous turbulence in cube program.
Solves problems in distribution of pollutants.
Quantum chemistry.
Plasma physics; electromagnetic particle simulation.
Source: Computer Design/ICE, "Roadmaps of Packaging Technology" 21976
Figure 3-16. SPEC Benchmark Application Programs
Subtle Factors Influencing Measured Performance
In general, Òhard codingÓ a benchmark to be optimized for a particular computerÕs logic archi-
tecture, memory architecture, and peripheral access can improve the benchmark performance by
10x. It is common for different computers using the same microprocessor, operating at the same
clock frequency, to be rated at different MIPS. This is due to the different tests that were run and
how the memory and other peripherals were accessed by the code.
Metrics for Technology Performance
INTEGRATED CIRCUIT ENGINEERING CORPORATION3-18
Model Name CPU TypeSPECint_base95
SPECfp_base95
SPECint95
SPECfp95
IBM POWERserver 591
DEC AlphaSta 600 5/300
DEC AlphaSta 600 5/266
HP K400 4-CPU
HP J210 MP
HP K400 3-CPU
IBM POWERserver 39H
HP K400 2-CPU
HP J200 MP
HP J210
DEC 3000 Model 900
HP J200
HP K400
DEC AlphaSta 250 4/266
DEC 3000 Model 700
HP 735/125
HP 735/99
DEC 3000 Model 500
IBM POWERserver C20
HP 715/100
IBM POWERstation 43P
IBM POWERserver C10
Intel 1110/133
Sun SPARCstation 20/71
Sun SPARCstation 10/40*
77MHz POWER2
300MHz 21164
266MHz 21164
100MHz PA-7200
120MHz PA-7200
100MHz PA-7200
66.7MHz POWER2
100MHz PA-7200
100MHz PA-7200
120MHz PA-7200
275MHz 21064A
100MHz PA-7200
100MHz PA-7200
266MHz 21064A
225MHz 21064A
125MHz PA-7150
99MHz PA-7100
150MHz 21064
120MHz PowerPC 604
100MHz PA-7100LC
133MHz PowerPC 604
80MHz PowerPC 601
Pentium Processor
75MHz SuperSPARCII
40MHz SuperSPARC
3.67
7.33
6.43
—
—
—
3.28
—
—
4.37
4.24
3.64
3.58
4.18
3.66
4.04
3.27
2.15
3.85
2.89
4.45
2.37
3.64
2.46
1.0
11.20
11.59
10.64
10.20
9.91
9.65
9.44
8.38
8.12
7.54
6.29
6.28
6.21
5.78
5.71
4.55
3.98
3.65
3.50
3.47
3.31
2.97
2.37
2.14
1.0
—
7.33
6.43
—
—
—
—
—
—
4.37
—
3.64
3.58
4.18
—
4.04
3.27
—
—
—
—
—
3.68
—
—
12
12
11
10
10
10
10
8
8
7
—
6
6
5
—
4
4
—
—
—
—
—
3
—
—
Source: Computer Design/ICE, "Roadmaps of Packaging Technology" 21977
Figure 3-17. Representative Sample of SPEC95 Benchmarks

It is clear there can be ambiguities in using the MIPS of a machine to measure performance. The
performance rating depends on a number of subtle factors, rarely stated explicitly:
1. The program being run.
2. The optimization of the code for the specific computer.
3. The logic design of the computer.
4. The memory architecture of the computer.
5. The use of other peripherals and their access times.
INFORMATION TRANSMISSION
Analog and Digital Networks
Two types of networks are in use today, analog and digital. All communications between com-
puters is with digitally encoding information. The plain old telephone system (POTS) is still
analog based in most locations. The first implementation of cellular phones were analog based.
They are now being switched to digital encoding. Radio and TV transmission are still analog
based. However, it is only a matter of time before TV is transmitted as digital, especially as it
becomes integrated into the Information Superhighway. Only digitally encoded information can
become part of the Information Superhighway.
In digital networks, the information is encoded as bits. In a wire or optical fiber, the bit stream is
most commonly encoded as a voltage or intensity level. For wireless, and some leading edge,
ultra high bandwidth fiber systems, a carrier frequency is modulated. The most common is ampli-
tude modulation (AM), frequency modulation (FM) or frequency shift keying (FSK), phase shift
keying (PSK), and its derivatives, such as quadrature phase shift keying (QPSK).
The information transmission rate is defined as how many bits per second are transported in the
interconnect. Though the information may be encoded as digital bits, the actual signal that prop-
agates is still an analog signal, representing a varying voltage level or light intensity level.
Ultimately, analog voltage levels are measured and compared to a threshold to recover the digital
information of high and low.
The use of digital communications allows a much more versatile network, where the information
being transmitted carries with it its own address. This increases the efficiency of the switching
system which routes the information to the correct end user. With the use of DSP, error correcting
codes and compression, the absolute highest information density can be transmitted over the
available bandwidth of the interconnect with digital signals. All networks will move toward dig-
ital encoding in the future.
Metrics for Technology Performance
INTEGRATED CIRCUIT ENGINEERING CORPORATION 3-19
In digital networks, there are four elements, the transmission medium that carries the information
from point to point, the switching systems that routes the information into the various transmis-
sion channels, and the transmitter and receiver. Often the switching system also acts a repeater
for receiving, routing and re-transmitting the digital signals.
Interconnect Media
Digital networks typically use four media for transmitting information; wire, such as printed cir-
cuit board traces, twisted pair, ribbon cable or coax cable; fiber-optic cable, either multimode or
single mode; infrared through free space; and wireless, as radio waves, rf or microwaves. When
using free space radio waves, to avoid interference between channels, the FCC has regulated what
parts of the spectrum can be used for what purpose. No such restrictions are placed on wire or
fiber-optic networks, since they are dedicated lines which do not radiate or interfere. IR is typi-
cally for communications between devices on one desktop, or at most within one room, and inter-
ference between devices can be easily controlled.
The maximum rate at which bits of information can flow in a channel was first described by
Claude Shannon in 1948. It has since become know as ShannonÕs Law:
capacity (bits/sec) = BW x log2 (1+SNR)
The bandwidth is the span in frequency that is used by the signal. When a carrier frequency is
used, as in rf transmission, the bandwidth is roughly the modulation frequency of the carrier. The
bandwidth in frequency space is closely regulated by the FCC to minimize interference between
users. In wire or fiber based digital networks the bandwidth is the highest sine wave frequency
component present in the signal. This is related to the edge rate of the signal. It is approximately
0.35/rise time. In a typical digital system network, the bandwidth is about 5x the clocked fre-
quency. This is reviewed in detail in Chapter 7.
To increase the transmitted bit rate, either the bandwidth must be increased, which means the
clock frequency increases, or the signal to noise ratio must increase. Both of these methods are
being used to increase the carrying capacity of networks.
There is a fundamental trade off in bit rate capacity and distance for an interconnect. As the length
of an interconnect increases, effects such as attenuation decrease the signal to noise ratio, and
reflections and distortions from impedance discontinuities decrease the bandwidth. The choice of
the medium to use depends on the distance to be traveled and the required bandwidth. As digi-
tal signal processing technology becomes more sophisticated, the data carrying capacity of an
interconnect will steadily increase. Figure 3-18 shows the variation of carrying capacity and dis-
tance for a variety of interconnect media.
Metrics for Technology Performance
INTEGRATED CIRCUIT ENGINEERING CORPORATION3-20

For long distance and high capacity, optical fiber is the clear winner. All high bandwidth networks
are going to use optical fiber. The longest span, the Trans Atlantic Telephone (TAT) 12/13
Network, between the U.S. and the U.K., is operational as of Spring 1995. It carries information
at the rate of 10Gbits/sec across a span of 5,913 kilometers, with 133 repeaters, spaced every 45
kilometers. The reliability is rated at less than 1 ship based repair required on the entire network
in 25 years. It consists of two cables, each with four single mode fibers, grouped in two pairs.
Each pair carries 2.5Gbit/sec in each fiber, or 5Gbits/sec per pair. In each cable, one pair is des-
ignated the service pair and carries most of the information. The second pair is termed the restora-
tion pair and is used for maintenance, and is available if there is a fault in the service pair.
Between the two cables, there is a total carrying capacity of 10Gbits/sec.
Fiber-optic interconnects are becoming the medium of choice for very high speed wide bandwidth
local area networks (LANs) and wide area networks (WANs). For example, there are standards
for SONET (synchronous optical network) protocol, with specifications for 0.155, 0.622 and
2.5Gbits/sec. Gigabit Ethernet, also using fiber-optic cables is rated at 1Gbit/sec.
Metrics for Technology Performance
INTEGRATED CIRCUIT ENGINEERING CORPORATION 3-21
���������������������������������������������������������������������������������������������������������������������������������������������������������������������������������������������������������������������������������������������������������������������������������������������������������������������������������������������������������������������������������������������������������������������������������������������������������������������������������������������������������������������������������������������������������������������������������������������������������������������������������������������������������������������������������������������������������������������������������������������������������������������������������������������������������������������������������������������������������������������������������������������������������������������������������������������������������������������������������������������������������������������������������������
�����������������������������������������������������������������������������������������������������������������������������������������������������������������������������������������������������������������������������������������������������������������������������������������������������������������������������������������������������������������������������������������������������������������������������������������������������������������������������������������������������������������������������������������������������������������������������������������������������������������������������������������������������������������������������������������������������������������������������������������
Length (meters)
Tran
smit
ted
bit
Rat
e (M
bit
s/se
c)
1 10 100 1x10³ 1x10⁴ 1x10⁵
1
10
100
0.001
0.01
0.1
1x10³
1x10⁴
1x10⁵
Source: ICE, "Roadmaps of Packaging Technology" 22168
Fiberoptic
Twisted Pair
Twisted Pair with DSP
Coaxial Cable
Figure 3-18. Maximum Data Transmission for Different Interconnect Media

Slowing the implementation of fiber-optic networks is the cost of the transmitters, receivers and
cables, compared with coaxial cable. Only when the higher bandwidths justify it, will it be used.
At the other extreme, twisted pair has the lowest bandwidth for a fixed length. However, it is
already installed in most homes as the medium for transmission from the nearby switch box to the
home. This connection is termed the subscriber loop, designed for audio signal transmissions of
about 3KHz in bandwidth. This bandwidth is limited by poor signal integrity as a result of its
loose specifications with respect to twists, turns, and proximity to adjacent wires. Reflections and
signal distortions over the maximum 500 meter length drastically reduces the bandwidth. When
these systems were designed and installed, higher bandwidth needs were not envisioned.
The Information Superhighway has quickly obsoleted the audio bandwidth. When surfing the net
from home on even a 14.4k baud modem, most users refer to the WWW as the ÒWorld Wide WaitÓ.
What constrains the use of higher data carrying capacity is the lower signal-to-noise ratio (SNR)
at higher modulation frequencies on the subscriber loop. The advance from 9.6Kbit/sec to
14.4Kbits/sec and 28.8Kbits/sec was enabled by advances in signal recovery chips on the trans-
mitting modem and on the receiving modem, enhancing the SNR.
U.S. Robotics and Rockwell have announced modems operating at 56Kbits/sec, both using
advanced signal processing chips to recover the distorted analog signal from the noisy back-
ground. Both of these require extensive information processing. The Rockwell modem uses an
MCM to package the DSP chips in a small volume.
To increase the data capacity of twisted pair for the 500 meters of the subscriber loop, digital trans-
mission offers an advantage. A number of digital subscriber loop (DSL) technologies have
emerged that are capable of transmitting digital information over the twisted pair lines at up to
6Mbits/sec, with advanced DSP chips to recover the digital information from the noise. Amati
Communications and Pairgain Communications both have trial systems in place at 6Mbits/sec in
subscriber loops.
Delivering the Information Superhighway to the home through a high bandwidth pipe is such a
large market that there are four competing technologies: DSL on existing twisted pair lines, new
cable modems using the existing cable TV lines, installing fiber-optic cables to the home, and wire-
less connections. All of these methods will be capable of delivering video bandwidth rates. They
may all successfully be used.
The growth of the Information Superhighway is driving the need for higher data rates. In some
cases, the traffic is increasing a factor of 10 each year. An example is shown in Figure 3-19. The
need to carry higher data rates will drive both the increasing data clocking frequency and more
efficient algorithms and DSP chips to extract lower signals from higher noise. These functions
Metrics for Technology Performance
INTEGRATED CIRCUIT ENGINEERING CORPORATION3-22
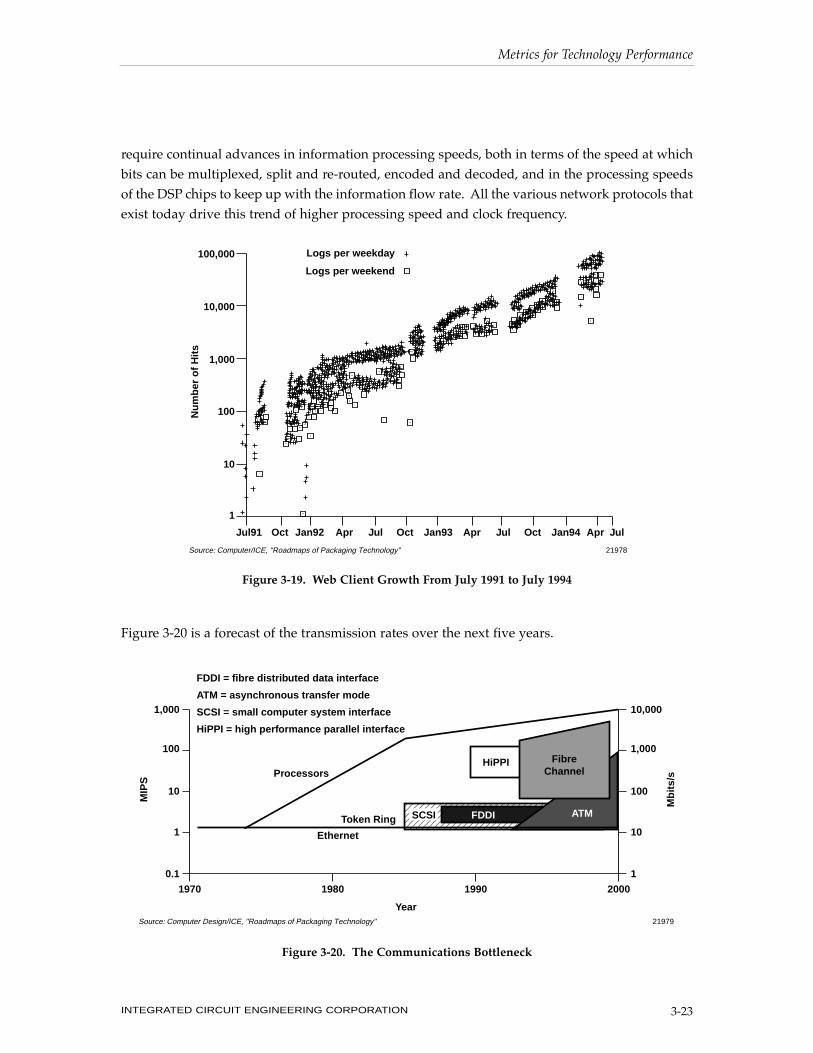
require continual advances in information processing speeds, both in terms of the speed at which
bits can be multiplexed, split and re-routed, encoded and decoded, and in the processing speeds
of the DSP chips to keep up with the information flow rate. All the various network protocols that
exist today drive this trend of higher processing speed and clock frequency.
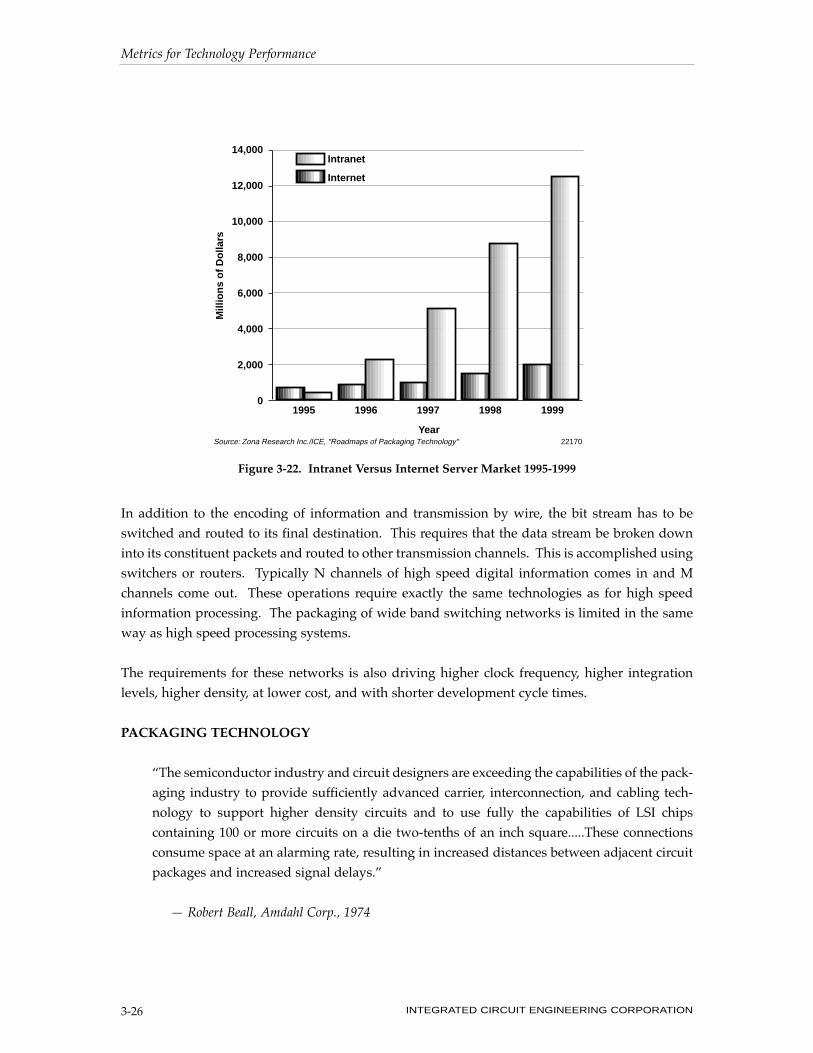
Figure 3-20 is a forecast of the transmission rates over the next five years.
Metrics for Technology Performance
INTEGRATED CIRCUIT ENGINEERING CORPORATION 3-23
Logs per weekday
Logs per weekend
100,000
10,000
1,000
100
10
1
Jul91 JulJan92 Jan93 Jan94Oct OctApr Jul OctApr JulApr
Nu
mb
er o
f H
its
Source: Computer/ICE, "Roadmaps of Packaging Technology" 21978
Figure 3-19. Web Client Growth From July 1991 to July 1994
���������������������������������������������������������
1,000
100
10
1
0.1
10,000
1,000
100
10
1
1970 1980 1990 2000
Processors
Token Ring
Ethernet
SCSI FDDI
HiPPI FibreChannel
ATM
Source: Computer Design/ICE, "Roadmaps of Packaging Technology" 21979
MIP
S
Mb
its/
s
Year
FDDI = fibre distributed data interface
ATM = asynchronous transfer mode
SCSI = small computer system interface
HiPPI = high performance parallel interface
Figure 3-20. The Communications Bottleneck

Switching Networks
When two or more intelligent devices are connected together and communicate, the collection of
devices is called a network. Networks are generically described by their physical sizeÑhow
many users they support and how closely they are locatedÑand by the information carrying
capacity of the network. For each combination of size and information bandwidth, there are a
variety of standard topologies and protocols. Some of these are illustrated in Figure 3-21. The
AppleTalk network, a low cost local area network that interfaces computers, printers and other
peripherals, is connected as a ring. An Ethernet network, used to connect computers to a server,
can be either a ring or a star.
In a distributed computing network, i.e., when computers are communicating among themselves,
the most common architecture used is the client-server. One computer acts as the coordinator for
all the others. Information flows through the server. A server can handle from 2 to 200 clients
depending on the processing power, network bandwidth and applications being run.
Metrics for Technology Performance
INTEGRATED CIRCUIT ENGINEERING CORPORATION3-24
STAR NETWORK
Server
Client
Client
Client
Client(Peripheral)
RING NETWORK
Client
Client
Client
Client
Server
Client(Peripheral)
DISTRIBUTED NETWORK
Server
Server
ServerServer
Client
Client
Client
Client
Client
Client
Client Client
Client
Client(Peripheral)
22169Source: ICE, "Roadmaps of Packaging Technology"
Figure 3-21. Network Topologies for Local Area Networks

As a network expands, and servers are added, they can be networked to each other with routers.
Because the client server network typically uses dedicated wiring between computers that are
located near each other, this is often called a local area network (LAN). Between servers, espe-
cially as the distance between them increases, the network is often termed a wide area network
(WAN) to refer to the greater distances. LANs are typically short distances, under 500 meters, and
connect directly to end users. WANs are typically longer, from 1 kilometer to around the world,
and typically connect servers, requiring higher bandwidths.
In the business environment, there are four general network sizes, roughly based on the number
of users and their geographical locations:
A workgroup is a small collection of 2-20 users or peripherals, comprising a LAN, which are con-
nected to a server. They are usually co-located in the same general area of a building, and use
dedicated wiring.
A department is 20-200 users typically in the same building, connected by dedicated wiring and
controlled by one or more servers. The servers would be directly connected, also over a LAN.
A campus, as its name suggests, originated to refer to university campuses, and is 200-2,000 users,
spread over one or more buildings. The connections can be made by either dedicated wiring,
leased lines or commercial phone lines. A campus network may be either a LAN or WAN.
An enterprise has come to mean an entire company which may be spread across a number of dif-
ferent buildings, some located in the same area, some remotely distributed across the country or the
world. The size of this group can be from 2,000 to 20,000 or more. Enterprise wide communica-
tions has become the fastest growing market. It consists of a number of LANs connected by a WAN.
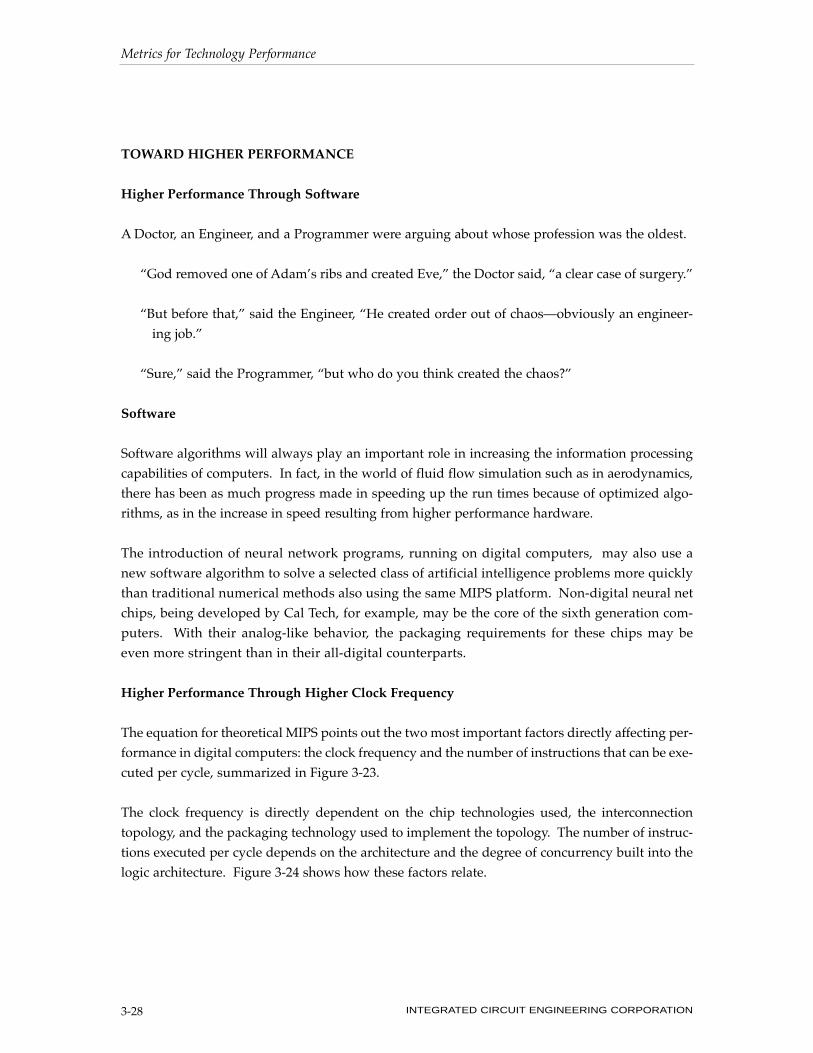
The term intranet has been created to refer to enterprise wide communication. This market seg-
ment, because it is tied to the profitability of companies, has more money feeding it and is both a
larger market and a faster growing market than the Internet. This is shown in Figure 3-22. An
intranet is the internal communications backbone of a company. It is typically only accessible
from within an enterprise WAN or LAN. To protect the security of internally proprietary infor-
mation, there is a ÒfirewallÓ separating the intranet from the public Internet. The communications
security industry is devoted to keeping the firewall impenetrable to outside intruders.
Networks are also described in terms of their information bandwidth or bit rate carrying capa-
bility. A narrow band network is one with a low bit rate, typically less than 50Kbits/sec. A wide
band network has a high information carrying capacity. With the Information Superhighway
driving the need for ever more information to the individual, all networks are going toward
requiring increasingly higher bandwidths.
Metrics for Technology Performance
INTEGRATED CIRCUIT ENGINEERING CORPORATION 3-25
In addition to the encoding of information and transmission by wire, the bit stream has to be
switched and routed to its final destination. This requires that the data stream be broken down
into its constituent packets and routed to other transmission channels. This is accomplished using
switchers or routers. Typically N channels of high speed digital information comes in and M
channels come out. These operations require exactly the same technologies as for high speed
information processing. The packaging of wide band switching networks is limited in the same
way as high speed processing systems.
The requirements for these networks is also driving higher clock frequency, higher integration
levels, higher density, at lower cost, and with shorter development cycle times.
PACKAGING TECHNOLOGY
ÒThe semiconductor industry and circuit designers are exceeding the capabilities of the pack-
aging industry to provide sufficiently advanced carrier, interconnection, and cabling tech-
nology to support higher density circuits and to use fully the capabilities of LSI chips
containing 100 or more circuits on a die two-tenths of an inch square.....These connections
consume space at an alarming rate, resulting in increased distances between adjacent circuit
packages and increased signal delays.Ó
Ñ Robert Beall, Amdahl Corp., 1974
Metrics for Technology Performance
INTEGRATED CIRCUIT ENGINEERING CORPORATION3-26
Source: Zona Research Inc./ICE, "Roadmaps of Packaging Technology" 22170
Mill
ion
s o
f D
olla
rs
Year
1995 1996 1997 1998 1999
14,000
12,000
10,000
8,000
6,000
4,000
2,000
0
Intranet
Internet
Figure 3-22. Intranet Versus Internet Server Market 1995-1999

ÒVLSI is limited by interconnect and packaging technology.Ó
Ñ Dr. Craig Barrett, VP and GM, Intel, 1987
At every step along the road toward higher performance per volume per unit cost, IC technology
leads the way and the packaging technology attempts to keep pace. It is the handful of chips
themselves that performs the actual information processing.
With a fixed set of chips, there is nothing that the packaging can do that will increase the infor-
mation processing capability of the system above the intrinsic capability of the chips. In this sense,
the packaging does not add value to the product. It can only increase the size of the system,
decrease the speed of the chips, and add to the system cost.
From the perspective of the packaging, it is not a question of whether the packaging will limit the
system performance, it is a question of the magnitude of the penalty, in system size, speed, and
cost, and how its detrimental impact can be contained at an acceptable level. Packaging and inter-
connect technology have in the past, and will always in the future, limit system performance.
The chip technologies define the ultimate performance capability of a system. The packaging
technologies are constraints to this ultimate performance. Engineering solutions are invented to
always keep these constraints to a minimum.
Fueled by a $150 billion market (1996), IC technologies will advance at ever faster rates. This evo-
lution is enabled by process development, increasing integration, and increasing yields for
increasingly complex devices. Packaging technology must also advance at an ever more rapid
pace just to maintain its second-place position.
Rao Tummala, former Director of Advanced Electronic Packaging Technology at IBM, says,
ÒBreakthroughs and progress are forged by blending sound technological fundamentals
with artistic inspirations to create novel and unusual designs with extra leverage.Ó
Breakthroughs in new designs, materials, and processes are needed as leverage against engineer-
ing and fundamental constraints that must be overcome to keep the impact on system perfor-
mance, cost and time to market by the package to an acceptable level.
The following chapters describe the intrinsic capabilities of chip technologies, how they are con-
strained by the packaging technologies, and some of the potential engineering solutions available
today and in the near future.
Metrics for Technology Performance
INTEGRATED CIRCUIT ENGINEERING CORPORATION 3-27
TOWARD HIGHER PERFORMANCE
Higher Performance Through Software
A Doctor, an Engineer, and a Programmer were arguing about whose profession was the oldest.
ÒGod removed one of AdamÕs ribs and created Eve,Ó the Doctor said, Òa clear case of surgery.Ó
ÒBut before that,Ó said the Engineer, ÒHe created order out of chaosÑobviously an engineer-
ing job.Ó
ÒSure,Ó said the Programmer, Òbut who do you think created the chaos?Ó
Software
Software algorithms will always play an important role in increasing the information processing
capabilities of computers. In fact, in the world of fluid flow simulation such as in aerodynamics,
there has been as much progress made in speeding up the run times because of optimized algo-
rithms, as in the increase in speed resulting from higher performance hardware.
The introduction of neural network programs, running on digital computers, may also use a
new software algorithm to solve a selected class of artificial intelligence problems more quickly
than traditional numerical methods also using the same MIPS platform. Non-digital neural net
chips, being developed by Cal Tech, for example, may be the core of the sixth generation com-
puters. With their analog-like behavior, the packaging requirements for these chips may be
even more stringent than in their all-digital counterparts.
Higher Performance Through Higher Clock Frequency
The equation for theoretical MIPS points out the two most important factors directly affecting per-
formance in digital computers: the clock frequency and the number of instructions that can be exe-
cuted per cycle, summarized in Figure 3-23.
The clock frequency is directly dependent on the chip technologies used, the interconnection
topology, and the packaging technology used to implement the topology. The number of instruc-
tions executed per cycle depends on the architecture and the degree of concurrency built into the
logic architecture. Figure 3-24 shows how these factors relate.
Metrics for Technology Performance
INTEGRATED CIRCUIT ENGINEERING CORPORATION3-28

Metrics for Technology Performance
INTEGRATED CIRCUIT ENGINEERING CORPORATION 3-29
MIPS
Number of Instructions/CycleClock Frequency
Logic Architecture
Degree of Concurrency • Word length • Pipelining • Vector processing • Array processing • Coprocessor • DSP • Multiple processors
• Increased number of gates in the CPU
Topology
Logic Memory
ChipTechnology
IMPACT ONPACKAGING
REQUIREMENTS
• Decreased wiring delay• Increased bandwidth
15785Source: ICE, "Roadmaps of Packaging Technology"
Figure 3-23. Impact of Higher Performance on Packaging Requirements
10 610 510 410 310 210 110 010 -1-21010 2
10 3
10 4
10 5
10 6
10 7
10 8
10 9
1010
1011
1012
1013
1014
0.01
0.11210
100
MIPS
Clo
ck F
req
uen
cy (
Hz)
15784Source: ICE, "Roadmaps of Packaging Technology"
Instructions/Cycle
Multi-Processors
Increasing Concurrency
Figure 3-24. Performance, Concurrency, and Clock Frequency

The MIPS rating of any computer directly increases with an increasing clock frequency. This
drives every system to use the highest practical clock frequency in each form factor. From the
ENIAC in 1945 at about 100KHz, to the NEC SX-X at 330MHz in 1989, there has been a doubling
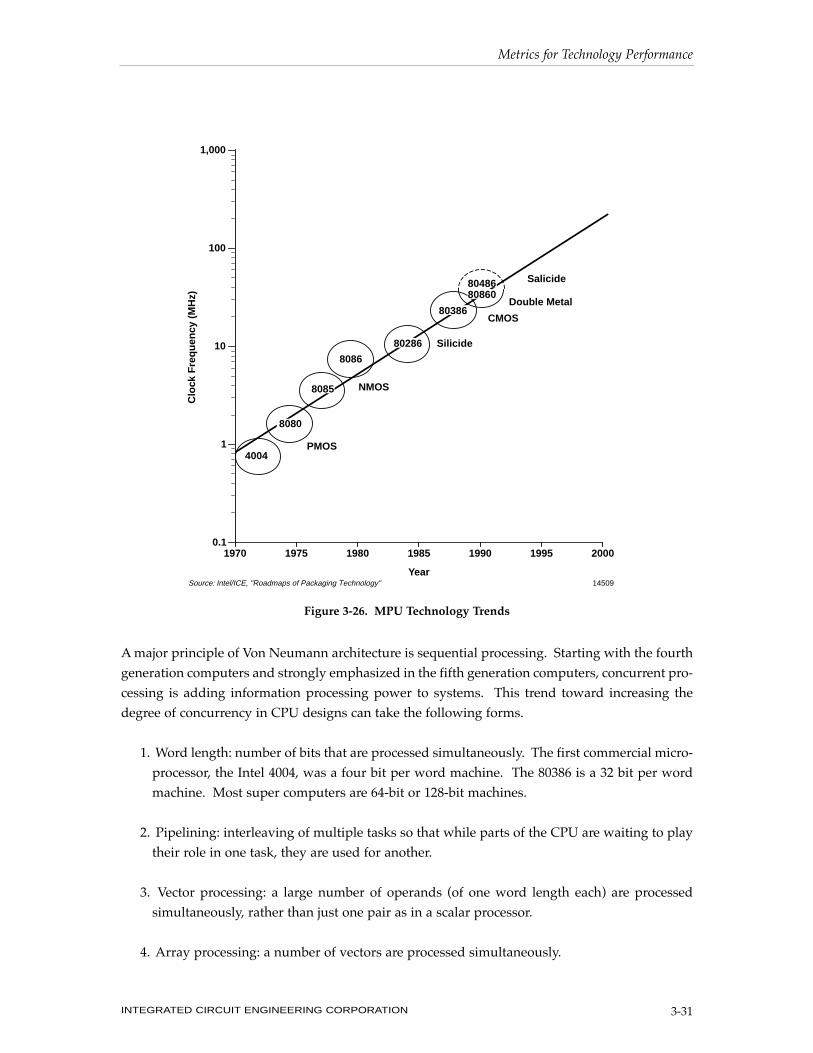
in clock frequency about every four years (Figure 3-25). For the case of single-chip systems, this
doubling occurs roughly every three years (Figure 3-26).
The fundamental limit of the clock cycle time depends on the delay per gate and the number of
gates required by the logic architecture to be sequentially switched in one cycle. Figure 3-27
shows the intrinsic switching speeds for various device technologies and feature sizes. The high-
est end processors have historically all used bipolar, BiCMOS or CMOS technology, with the
exception of the Cray 3, which uses GaAs integrated circuits. Current generation CMOS devices
can switch as fast as current generation bipolar devices, but with higher integration levels.
Higher Performance Through Higher Total Gate Count
The new RISC (Reduced Instruction Set Code) microprocessors, such as the Motorola 88000, Intel
80860, and MIPS Computer Systems R3000 take advantage of a change in logic architecture that
allows most instructions to be executed in one clock cycle. To a large extent, this is accomplished
by an optimized use of on-chip cache registers, minimizing the need to use main memory, and
maximizing the use of pipelining. Pipelining allows normally idle parts of the CPU to start exe-
cuting the next pieces of the problem while the main CPU is processing current pieces.
The charge for this optimization of code is more gates required to implement the logic and to pro-
vide for the on-board cache. For example, the Intel 80386 has 70K gates. The RISC 80860 has 250K
gates. Currently, over half the RISC microprocessors have been implemented in chip sets because
of the need for more gates than can currently fit on one chip at an acceptable yield.
Metrics for Technology Performance
INTEGRATED CIRCUIT ENGINEERING CORPORATION3-30
199519851975196519551945
100KHz
1MHz
10MHz
100MHz
1GHz
Year15786ASource: ICE, "Roadmaps of Packaging Technology"
ENIAC
ILLIAC IVNEC SX-X
ClockFrequency Period
1ns
10ns
100ns
1µs
Figure 3-25. Clock Frequency Trends of Computer Systems
A major principle of Von Neumann architecture is sequential processing. Starting with the fourth
generation computers and strongly emphasized in the fifth generation computers, concurrent pro-
cessing is adding information processing power to systems. This trend toward increasing the
degree of concurrency in CPU designs can take the following forms.
1. Word length: number of bits that are processed simultaneously. The first commercial micro-
processor, the Intel 4004, was a four bit per word machine. The 80386 is a 32 bit per word
machine. Most super computers are 64-bit or 128-bit machines.
2. Pipelining: interleaving of multiple tasks so that while parts of the CPU are waiting to play
their role in one task, they are used for another.
3. Vector processing: a large number of operands (of one word length each) are processed
simultaneously, rather than just one pair as in a scalar processor.
4. Array processing: a number of vectors are processed simultaneously.
Metrics for Technology Performance
INTEGRATED CIRCUIT ENGINEERING CORPORATION 3-31
Salicide
Double Metal
CMOS
Silicide
NMOS
PMOS4004
8086
Clo
ck F
req
uen
cy (
MH
z)
Year
1,000
100
10
1
0.11970 1975 1980 1985 1990 1995 2000
8080
8085
80286
80386
8048680860
14509Source: Intel/ICE, "Roadmaps of Packaging Technology"
Figure 3-26. MPU Technology Trends

5. Co-processor: a specialized processor for floating point calculations and some special
functions.
6. Digital signal processor: a co-processor with specialized numerical algorithms, such as the
Fast Fourier Transform, hardwired in.
7. Multiple processors: repeated processors that are complete and independently operate in
parallel, using either their own memory or shared memory, or both.
As each of these features is added, more operations are made possible in a clock cycle. The ulti-
mate extent of concurrency is when the entire CPU is duplicated and the number of instructions
per cycle doubles, such as with parallel processors. Accessing these features, though, requires an
ever increasing number of gates in the CPU.
The total gate counts in CPUs used at the high end are listed in Figure 3-28. In Figure 3-29 are
shown the gate counts for selected microprocessors.
Metrics for Technology Performance
INTEGRATED CIRCUIT ENGINEERING CORPORATION3-32
Feature Size (microns)
.1 1 10 100
.001
.01
.1
1
10
100
Sw
itch
ing
Tim
e (n
sec)
CMOS
ECL
GaAs
HEMT
12820ASource: ICE, "Roadmaps of Packaging Technology"
Figure 3-27. Intrinsic Switching Speeds of Selected IC Technologies

Minimizing Detrimental Impact Of The Memory Topology
The two factors that most directly impact performance are clock speed and total number of gates
in the CPU. A secondary factor that can limit performance is the bottleneck associated with
memory access. The memory architecture is designed to allow retrieval of most of the data within
one clock cycle.
Metrics for Technology Performance
INTEGRATED CIRCUIT ENGINEERING CORPORATION 3-33
COMPUTERNUMBER OF LOGIC
GATES IN CPU
Cray 1
Hitachi M688H
Fujitsu M780
ETA-10
VAX 9000
IBM 3081
300K
3.2M
1.0M
5.7M
1.4M
360K
15787Source: ICE, "Roadmaps of Packaging Technology"
(CMOS)
Figure 3-28. Selected CPU Logic Gate Counts
10M
1M
100K
10K
1K
100
70 72 74 76 78 80 82 84 86 88 90 92 94 96
4004
8085
8086
Pentium
Pentium Pro(MPU only)
PowerPC 601
80386
68040
68020
68000
8080
80486
Nu
mb
er O
f G
ates
Per
Ch
ip
YearMPU Increase ≈ 1.35/Year
16175ASource: ICE, "Roadmaps of Packaging Technology"
80286
Figure 3-29. Selected Microprocessor Densities

Memory is partitioned into a number of levels depending on the access time. Cache is designed
for no wait states. It is always placed as close as possible to the CPU to minimize time delays and
wiring densities, which arise when handling the ever widening data buses.
In general, the packaging environment of the CPU is the most expensive real estate in the system.
To minimize costs, the size of the cache, which is packaged in the CPU, is kept as small as possi-
ble without impairing performance. To achieve 200MHz operation, and keep the on chip cache
size manageable, the Intel Pentium Pro places the L2 cache adjacent to the CPU in a dual cavity
cofired ceramic package, as shown in Figure 3-30.
Alternatively, the logic architecture can be designed to use the wait-time between fetches effec-
tively as in the Intergraph Clipper, which uses a 75MHz clock and has two wait-states for its cache.
The cost is more complex logic and more gates required to cover the overhead.
Minimizing Detrimental Impact Of The Package
The two technology-related factors that improve the performance the most are increasing the
clock frequency and utilizing more total gates in the CPU. As the chip technology provides the
capability for higher clock frequencies and higher gate counts, the packaging technology must
keep up so as not to excessively reduce performance.
Metrics for Technology Performance
INTEGRATED CIRCUIT ENGINEERING CORPORATION3-34
Courtesy of Intel Source: ICE, "Roadmaps of Packaging Technology" 22188
Figure 3-30. Intel Pentium Pro Processor in Cofired Ceramic MCM

Once the intrinsic clock frequency is established by the chip technology and the logic architecture,
the packaging will slow the clock down because of the introduction of off-chip delays.
Independent of any novel packaging technology, the speed of light will always dictate the mini-
mum off-chip delay.
Virtually all computers today use the same clock uniformly throughout their entire CPUs. In a
synchronous clock scheme, gates that can contribute in one clock cycle cannot be physically farther
away than the signal can travel in one cycle. This sets a limit on the actual physical size of a CPU.
The typical time of flight, TOF, for signals in an FR4 glass-epoxy PCB (printed circuit board) is 6
in/nsec. This limits the size of the CPU to about 12 inches on a side for each nanosecond of clock
cycle. Figure 3-31 shows the maximum CPU sizes for the various clock frequencies. These are
upper limits that do not consider factors such as gate delays and clock skew.
In the fastest super computers, the finite speed of light is a driving force in the CPU topology. Two
approaches are used. In the case of IBM, DEC, Fujitsu and NEC, the CPU fits on one or two very
large boards. In the case of the NEC SX-X, with a 3nsec clock, the CPU board must be less than
three feet on a side.
The computers in the Cray ResearchÕs XMP and YMP families use three-dimensional packaging
to make up in gates per cubic inch what they lack in gates per square inch. Rather than one very
large board, the Cray CPU is contained on many very small boards, which are stacked close
together and interconnected with controlled length discrete wiring. For the Cray 2, with a clock
cycle time of 4nsec, all gates in the CPU are contained within a cylinder less than four feet in
diameter, because of speed of light limitations.
Metrics for Technology Performance
INTEGRATED CIRCUIT ENGINEERING CORPORATION 3-35
199519851975196519551945Year
22345Source: ICE, "Roadmaps of Packaging Technology"
ILLIAC IVNEC SX-X
LongestDistance of
the CPU
1ft
10ft
100ft
1,000ft
Figure 3-31. CPU Size Trends of Computer Systems
An alternative path is to use partitioned clocks for different regions of the CPU. The on-chip clock
rate is higher than the module rate, which is higher than the board rate. All the clocks are phase-
locked together so there is still global synchronization. The importance of synchronization grows
as the degree of concurrency increases, which is the main reason the CPU gate count is so high.
This is a very complex design to implement.
Two very different strategies have emerged to enable the highest performance super computers.
At one extreme is NECÕs approachÑbuild the fastest and most powerful CPU, and duplicate it as
needed. Its SX-X chip has a clock frequency of 330MHz. The single CPU unit has a rating of
5.5GigaFLOPS or roughly 10,000MIPS. It contains about two million logic gates plus memory.
At the other extreme is the Connection Machine from Thinking Machines. It has 65,536 one-bit
processors, packaged 16 to a chip. It is rated at 7,000MIPS with a clock frequency of about 1MHz.
It has about five million gates in its CPU. However, these machines are optimized for very dif-
ferent types of tasks. While the NEC super computer is designed for general purpose, floating
point intensive, scientific number crunching, the Thinking MachinesÕ super computer is designed
for text search, integer manipulation, and simultaneous operations. Clock frequency packaging is
not the driver for the Connection Machine but rather providing interconnection to the 65,536
microprocessors.
In summary, the drive for higher information processing capability pushes the gate count and
the intrinsic device switching speed. To minimize the detrimental impact on performance, the
package should:
1. Allow the highest clock speed possible.
2. Allow as many gates as possible in the CPU.
3. Allow the chips to be as close together as possible.
4. Allow the memory to be as close as possible to the CPU.
5. Allow high-speed, wide data paths between logic and memory.
6. Keep costs low.
7. Not slow down the time to market.
Value To The Customer
As had been pointed out, there are five generic driving forces on electronic systems in the expand-
ing market for computers, communications and consumer products: faster, denser, cheaper, lower
power, NOW.
Metrics for Technology Performance
INTEGRATED CIRCUIT ENGINEERING CORPORATION3-36
Performance is not always the attribute most highly valued by the customer. For example, in a
pacemaker, the reliability and physical size of the product are where most of the value is. A pace-
maker is still a highly sophisticated product that uses state of the art technology. However, it does
not push the technology envelope of number crunching farther out.
Performance is never the only design requirement for a system. It must always be balanced with
other aspects to arrive at an acceptable product.
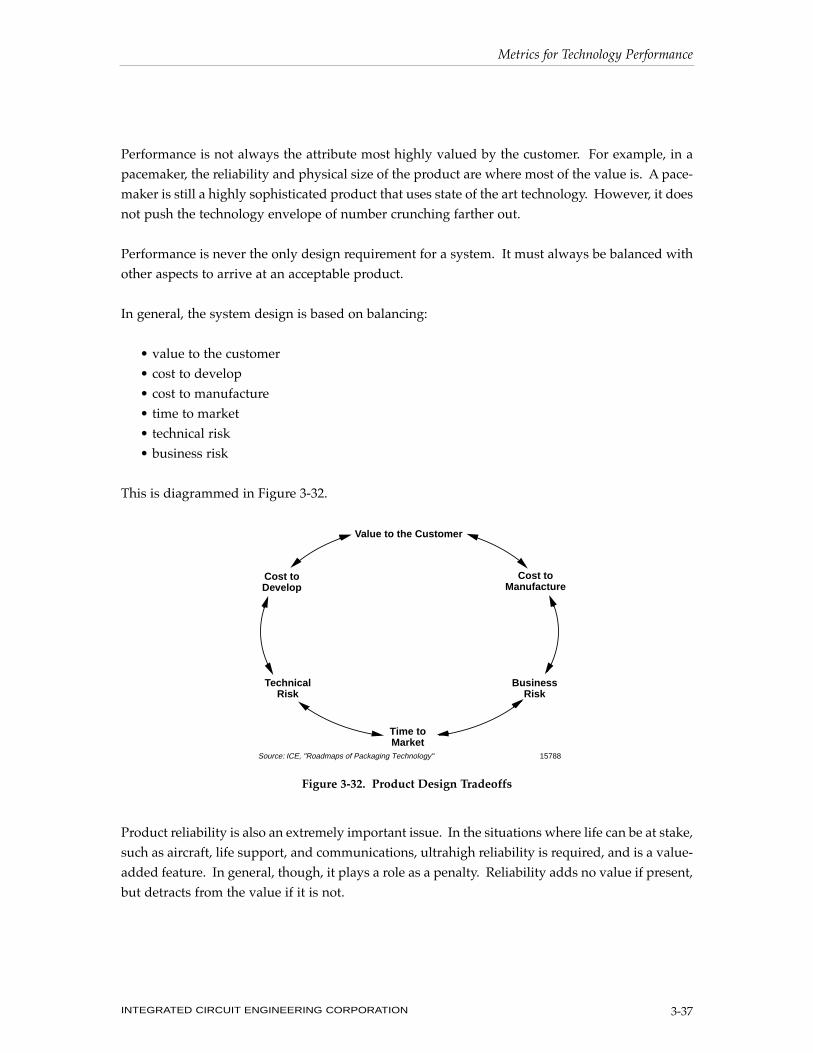
In general, the system design is based on balancing:
¥ value to the customer
¥ cost to develop
¥ cost to manufacture
¥ time to market
¥ technical risk
¥ business risk
This is diagrammed in Figure 3-32.
Product reliability is also an extremely important issue. In the situations where life can be at stake,
such as aircraft, life support, and communications, ultrahigh reliability is required, and is a value-
added feature. In general, though, it plays a role as a penalty. Reliability adds no value if present,
but detracts from the value if it is not.
Metrics for Technology Performance
INTEGRATED CIRCUIT ENGINEERING CORPORATION 3-37
Value to the Customer
Cost toDevelop
TechnicalRisk
Cost toManufacture
BusinessRisk
15788Source: ICE, "Roadmaps of Packaging Technology"
Time toMarket
Figure 3-32. Product Design Tradeoffs

There are many right answers that result in products with equally high performance but that are
arrived at using radically different design approaches. These paths reflect the different strengths
in the infrastructure within each company.
Though it is tempting to look at performance as the design rationale for every system, care must
be taken. This path leads to false interpretations and the wrong lessons can be learned from case
studies believing every design was implemented because it would offer the highest performance.
This is demonstrated in Figure 3-33. It is always a good policy to keep in mind what value means
to each particular customer, as was emphasized in Figure 3-1.
Metrics for Technology Performance
INTEGRATED CIRCUIT ENGINEERING CORPORATION3-38
Reproduced with special permission of Jerry Workman/ICE, "Roadmaps of Packaging Technology" 16066
Figure 3-33.