Embed Size (px)
Citation preview
8/12/2019 3 HLI Single Area
http://slidepdf.com/reader/full/3-hli-single-area 1/16
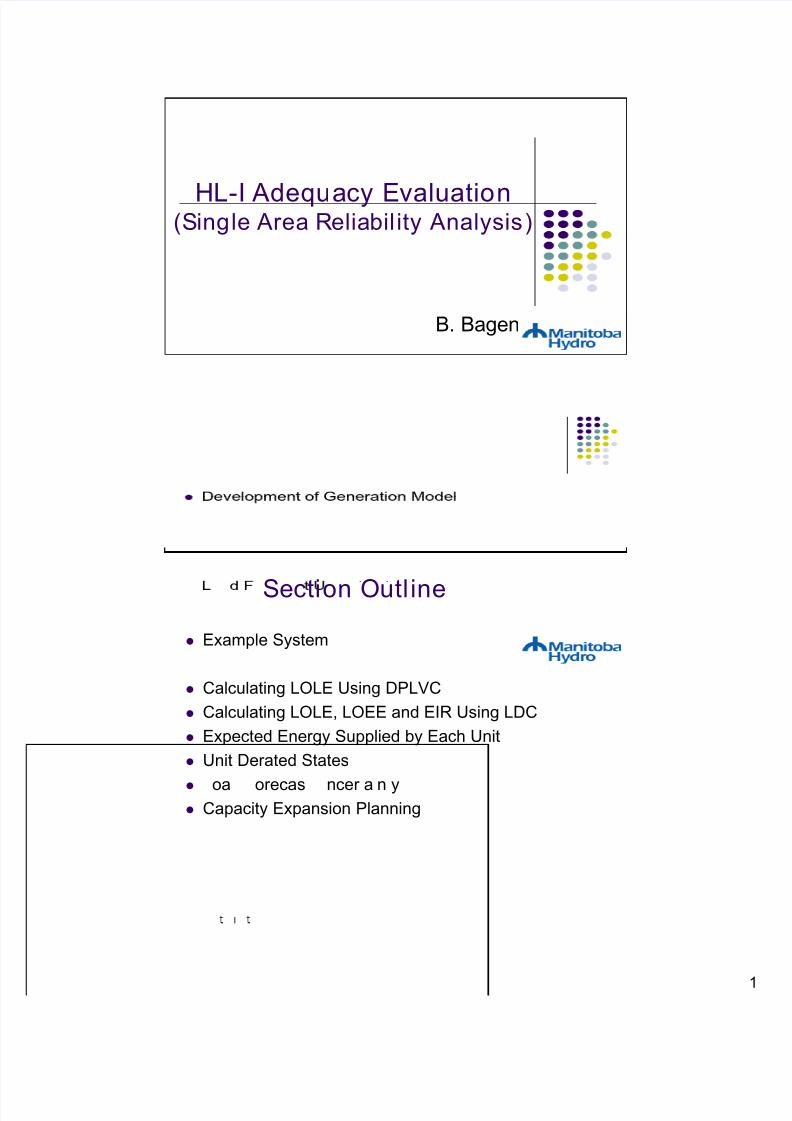
HL-I Adequacy Evaluation(Single Area Reliabil ity Analysis)
B. Bagen
Section Outl ine
Example System
Calculating LOLE Using DPLVC
Calculating LOLE, LOEE and EIR Using LDC
Expected Energy Supplied by Each Unit
Unit Derated States
oa orecas ncer a n y Capacity Expansion Planning
8/12/2019 3 HLI Single Area
http://slidepdf.com/reader/full/3-hli-single-area 2/16
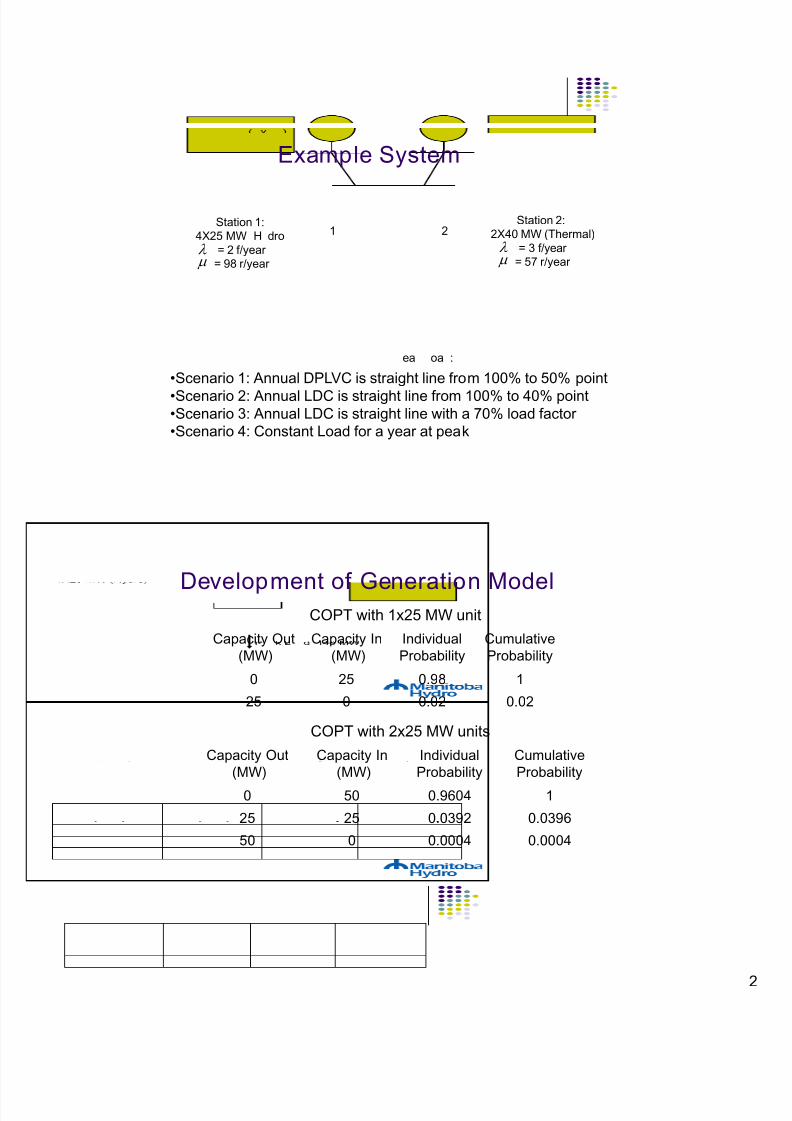
Example System
1 2Station 1:
4X25 MW H dro
Station 2:
2X40 MW (Thermal)
= 2 f/year
= 98 r/year
= 3 f/year
= 57 r/year
•Scenario 1: Annual DPLVC is straight line from 100% to 50% point
•Scenario 2: Annual LDC is straight line from 100% to 40% point•Scenario 3: Annual LDC is straight line with a 70% load factor
•Scenario 4: Constant Load for a year at peak
ea oa :
Development of Generation Model
Capacity Out
(MW)
Capacity In
(MW)
Individual
Probability
Cumulative
Probability
COPT with 1x25 MW unit
0 25 0.98 1
25 0 0.02 0.02
Capacity Out
(MW)
Capacity In
(MW)
Individual
Probability
Cumulative
Probability
COPT with 2x25 MW units
0 50 0.9604 1
25 25 0.0392 0.0396
50 0 0.0004 0.0004
8/12/2019 3 HLI Single Area
http://slidepdf.com/reader/full/3-hli-single-area 3/16
Development of Generation Model
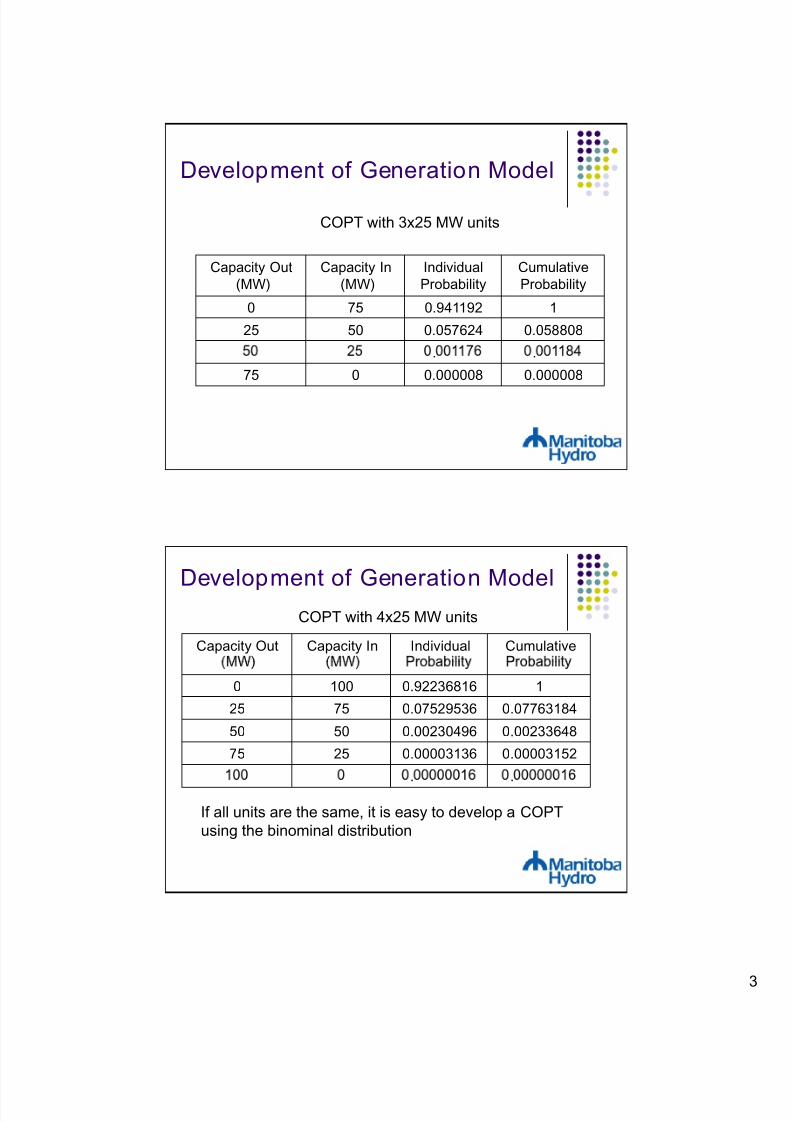
COPT with 3x25 MW units
Capacity Out
(MW)
Capacity In
(MW)
Individual
Probability
Cumulative
Probability
0 75 0.941192 1
25 50 0.057624 0.058808
. .
75 0 0.000008 0.000008
Development of Generation ModelCOPT with 4x25 MW units
Capacity Out Capacity In Individual Cumulative
0 100 0.92236816 1
25 75 0.07529536 0.07763184
50 50 0.00230496 0.00233648
75 25 0.00003136 0.00003152
. .
If all units are the same, it is easy to develop a COPT
using the binominal distribution
8/12/2019 3 HLI Single Area
http://slidepdf.com/reader/full/3-hli-single-area 4/16
Development of Generation Model
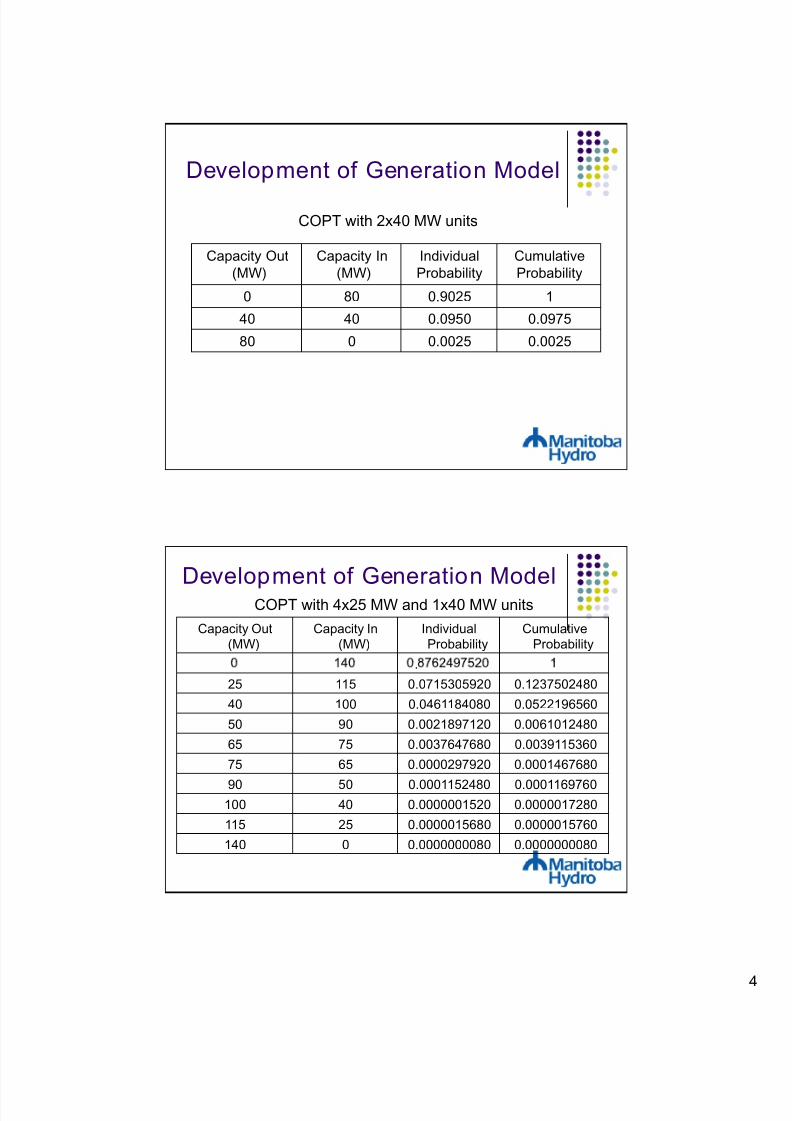
COPT with 2x40 MW units
Capacity Out
(MW)
Capacity In
(MW)
Individual
Probability
Cumulative
Probability
0 80 0.9025 1
40 40 0.0950 0.0975
80 0 0.0025 0.0025
Development of Generation ModelCOPT with 4x25 MW and 1x40 MW units
Capacity Out
(MW)
Capacity In
(MW)
Individual
Probability
Cumulative
Probability
.
25 115 0.0715305920 0.1237502480
40 100 0.0461184080 0.0522196560
50 90 0.0021897120 0.0061012480
65 75 0.0037647680 0.0039115360
75 65 0.0000297920 0.0001467680
90 50 0.0001152480 0.0001169760100 40 0.0000001520 0.0000017280
115 25 0.0000015680 0.0000015760
140 0 0.0000000080 0.0000000080
8/12/2019 3 HLI Single Area
http://slidepdf.com/reader/full/3-hli-single-area 5/16
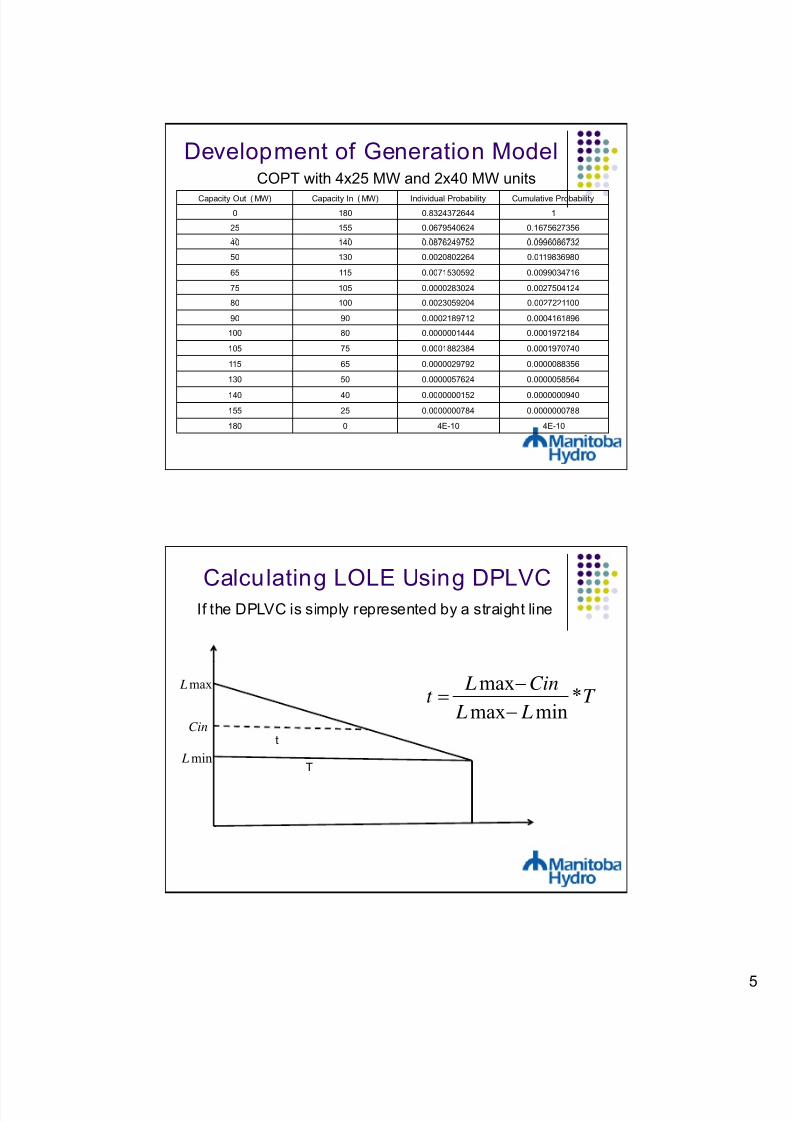
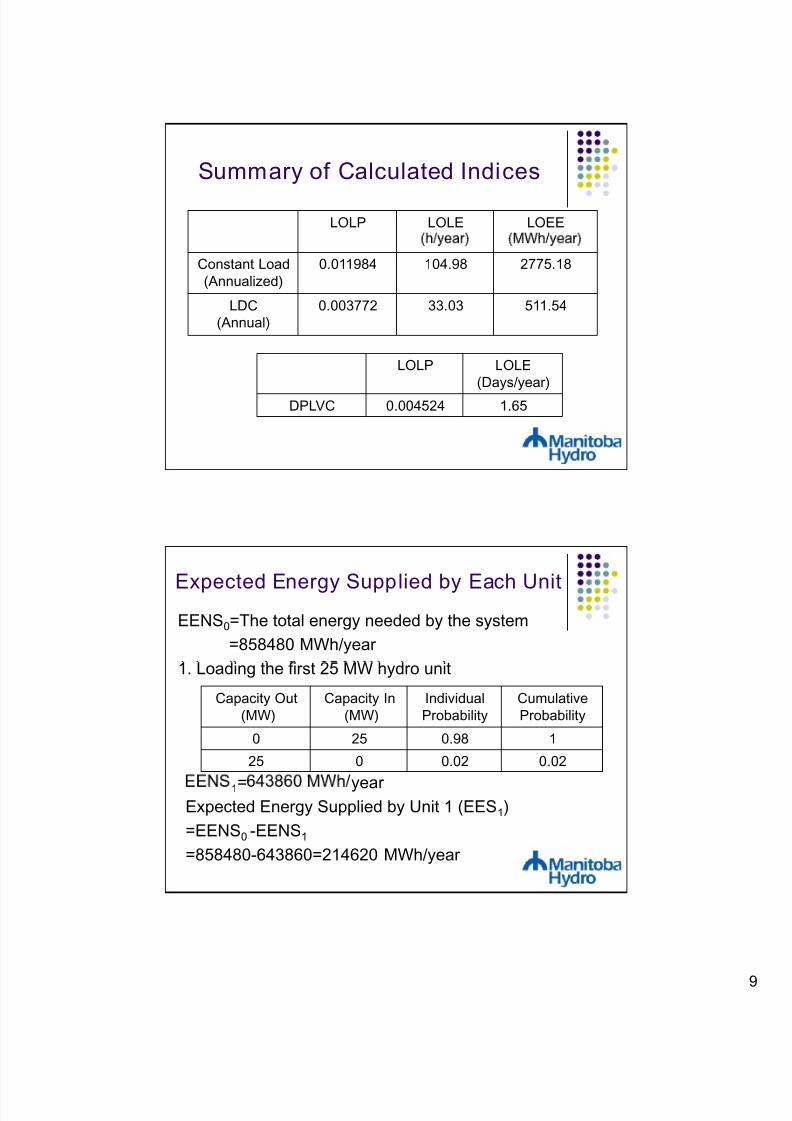
Development of Generation ModelCOPT with 4x25 MW and 2x40 MW units
Capacity Out ( MW) Capacity In ( MW) Individual Probability Cumulative Probability
0 180 0.8324372644 1
25 155 0.0679540624 0.1675627356
40 140 0.0876249752 0.0996086732
50 130 0.0020802264 0.0119836980
65 115 0.0071530592 0.0099034716
75 105 0.0000283024 0.0027504124
80 100 0.0023059204 0.0027221100
90 90 0.0002189712 0.0004161896
100 80 0.0000001444 0.0001972184
105 75 0.0001882384 0.0001970740
115 65 0.0000029792 0.0000088356
130 50 0.0000057624 0.0000058564
140 40 0.0000000152 0.0000000940
155 25 0.0000000784 0.0000000788
180 0 4E-10 4E-10
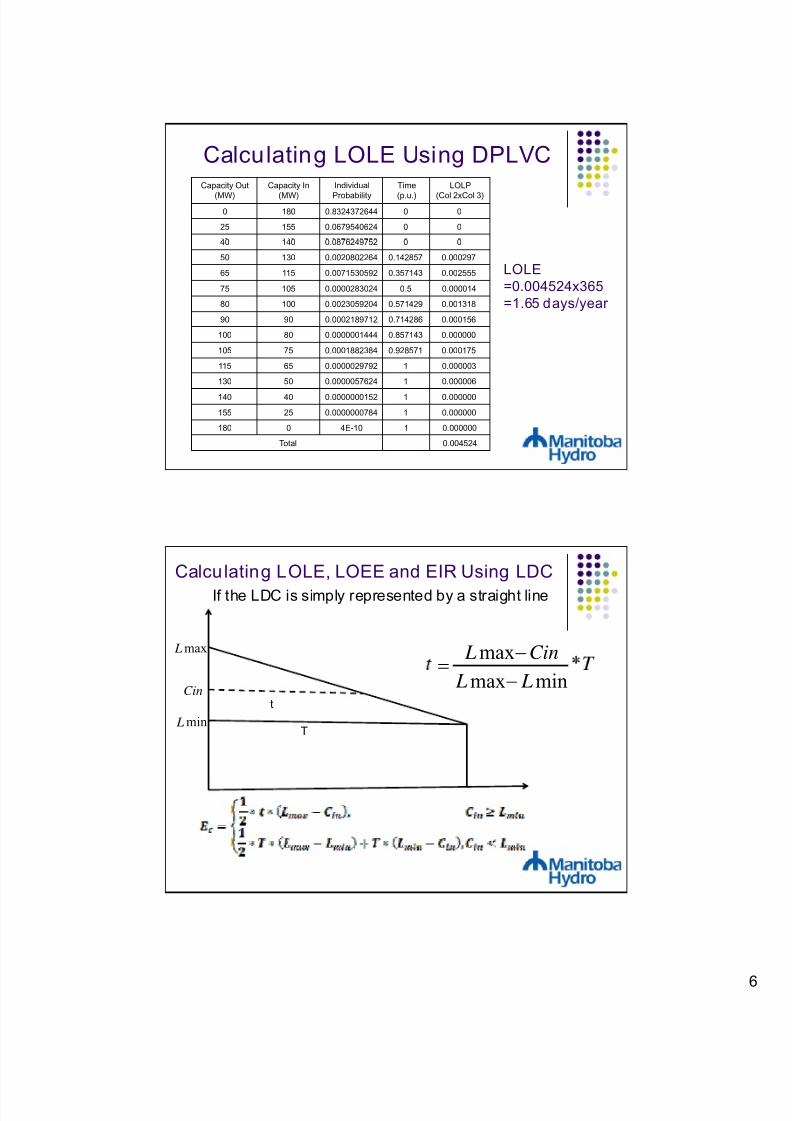
Calculating LOLE Using DPLVCIf the DPLVC is simply represented by a straight line
T L L
Cin Lt *
minmax
max
t
T
max L
min L
Cin
8/12/2019 3 HLI Single Area
http://slidepdf.com/reader/full/3-hli-single-area 6/16

8/12/2019 3 HLI Single Area
http://slidepdf.com/reader/full/3-hli-single-area 7/16
Calculating LOLE, LOEE and EIR
Using LDCCapacity In
(MW)
Individual
Probability
Time
(p.u.)
LOLP Energy
Curtailed(MWh)
Col 2*Col 5
(MWh)
180 0.8324372644 0 0 0 0
.
140 0.0876249752 0 0 0 0
130 0.0020802264 0.119050 0.000248 5214.2861 10.8469
115 0.0071530592 0.297620 0.002129 32589.2852 233.1131
105 0.0000283024 0.416667 0.000012 63875.0000 1.8078
100 0.0023059204 0.476190 0.001098 83428.5781 192.3797
90 0.0002189712 0.595240 0.000130 130357.1406 28.5445
80 0.0000001444 0.714290 0.000000 187714.2969 0.027106
75 0.0001882384 0.773810 0.000146 220303.5625 41.4696
65 0.0000029792 0.892860 0.000003 293303.5625 0.873810
50 0.0000057624 1 0.000006 420480.0000 2.4230
40 0.0000000152 1 0.000000 508080.0000 0.007723
25 0.0000000784 1 0.000000 639480.0000 0.050135
0 4E-10 1 0.000000 858480.0000 0.000343
Total 0.003772 511.54
Calculating LOLE, LOEE and EIR
Using LDC
LOLE=0.003772x8760=33.03 h/year
.
E
=Total Energy Required by the system
=Area under the LDC
=858480 MWh/year
EIR=1-LOEE/E=0.999404

8/12/2019 3 HLI Single Area
http://slidepdf.com/reader/full/3-hli-single-area 8/16
Calculating LOLE, LOEE and EIR Using LDC
(Load Factor)
For a given load factor of 70%:
Average Load=(Lmax+Lmin)/2
LF=Average Load/Peak load
Lmin=0.4 p.u.
Straight line from 100% to 40% point
Capacity In
(MW)
Individual
Probability
Time
(p.u.)
LOLP LOLE
(h/year)
LOEE
(MWh/year)
180 0.8324372644 0 0 0 0
155 0.0679540624 0 0 0 0
Calculating LOLE, LOEE and EIR Using LDC
(Constant Load at Peak)
.
130 0.0020802264 1 0.0020802264 18.2228 182.2280
115 0.0071530592 1 0.0071530592 62.6608 1566.5200
105 0.0000283024 1 0.0000283024 0.247929 8.6775
100 0.0023059204 1 0.0023059204 20.1999 807.9944
90 0.0002189712 1 0.0002189712 1.9182 95.9094
80 0.0000001444 1 0.0000001444 0.001265 0.075896
75 0.0001882384 1 0.0001882384 1.6490 107.1830
65 0.0000029792 1 0.0000029792 0.026098 1.9573
50 0.0000057624 1 0.0000057624 0.050479 4.5431
40 0.0000000152 1 0.0000000152 0.000133 0.013315
25 0.0000000784 1 0.0000000784 0.000687 0.078980
0 4E-10 1 4E-10 0.000004 0.0004906
Total 0.011984 104.98 2775.18
8/12/2019 3 HLI Single Area
http://slidepdf.com/reader/full/3-hli-single-area 9/16
Summary of Calculated Indices
LOLP LOLE LOEE
Constant Load
(Annualized)
0.011984 104.98 2775.18
LDC
(Annual)
0.003772 33.03 511.54
LOLP LOLE
(Days/year)
DPLVC 0.004524 1.65
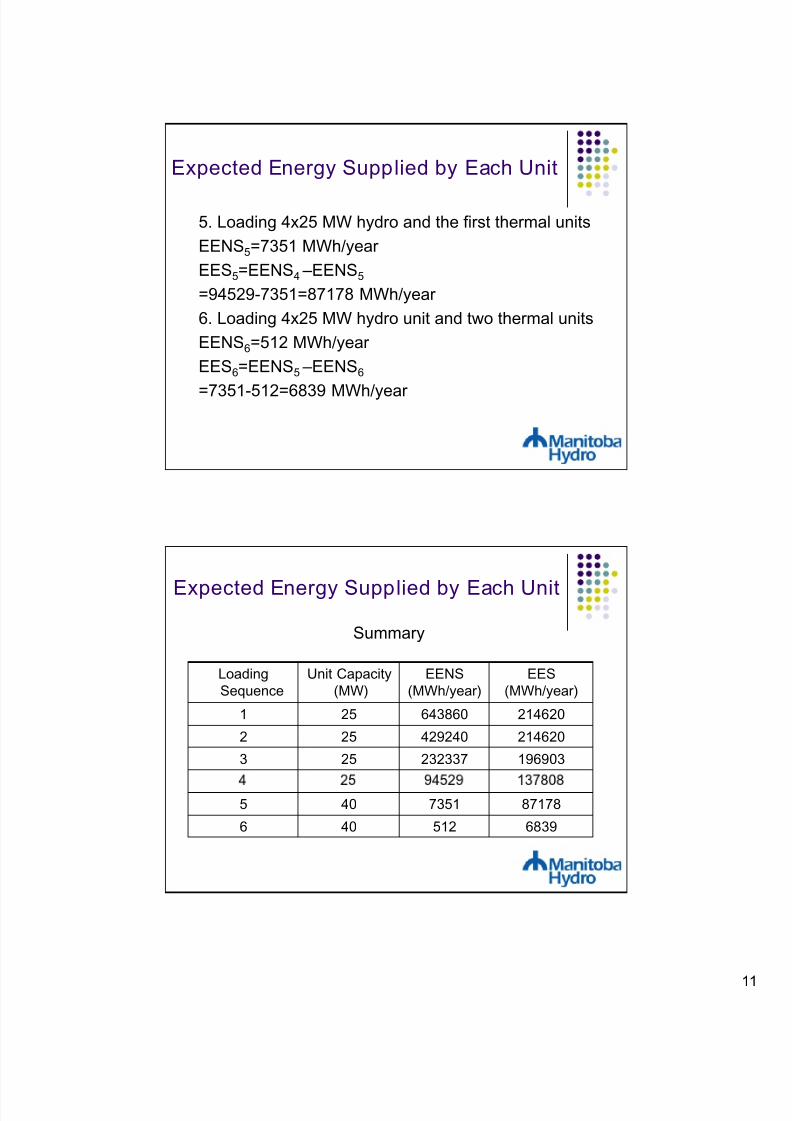
Expected Energy Supplied by Each UnitEENS0=The total energy needed by the system
=858480 MWh/year
Capacity Out
(MW)
Capacity In
(MW)
Individual
Probability
Cumulative
Probability
0 25 0.98 1
25 0 0.02 0.02
1. Loading the first 25 MW hydro unit
1= year Expected Energy Supplied by Unit 1 (EES1)
=EENS0 -EENS1
=858480-643860=214620 MWh/year

8/12/2019 3 HLI Single Area
http://slidepdf.com/reader/full/3-hli-single-area 10/16
2. Loading 2x25 MW hydro units
Expected Energy Supplied by Each Unit
(MW)
(MW)
Probability
Probability
0 50 0.9604 1
25 25 0.0392 0.0396
50 0 0.0004 0.0004
2
EES2=EENS1 –EENS2
=643860-429240=214620 MWh/year
Expected Energy Supplied by Each Unit
3. Loading 3x25 MW hydro units
EENS =232337 MWh/ ear
EES3=EENS2 –EENS3
=429240-232337=196903 MWh/year
4. Loading 4x25 MW hydro units
EENS4=94529 MWh/year
=4 3 – 4
=232337-94529=137808 MWh/year
8/12/2019 3 HLI Single Area
http://slidepdf.com/reader/full/3-hli-single-area 11/16
Expected Energy Supplied by Each Unit
5. Loading 4x25 MW hydro and the first thermal units
EENS5=7351 MWh/year
EES5=EENS4 –EENS5
=94529-7351=87178 MWh/year
6. Loading 4x25 MW hydro unit and two thermal units
EENS6=512 MWh/year
EES6=EENS5 –EENS6
=7351-512=6839 MWh/year
Expected Energy Supplied by Each Unit
Summary
Loading
Sequence
Unit Capacity
(MW)
EENS
(MWh/year)
EES
(MWh/year)
1 25 643860 214620
2 25 429240 214620
3 25 232337 196903
5 40 7351 87178
6 40 512 6839
8/12/2019 3 HLI Single Area
http://slidepdf.com/reader/full/3-hli-single-area 12/16
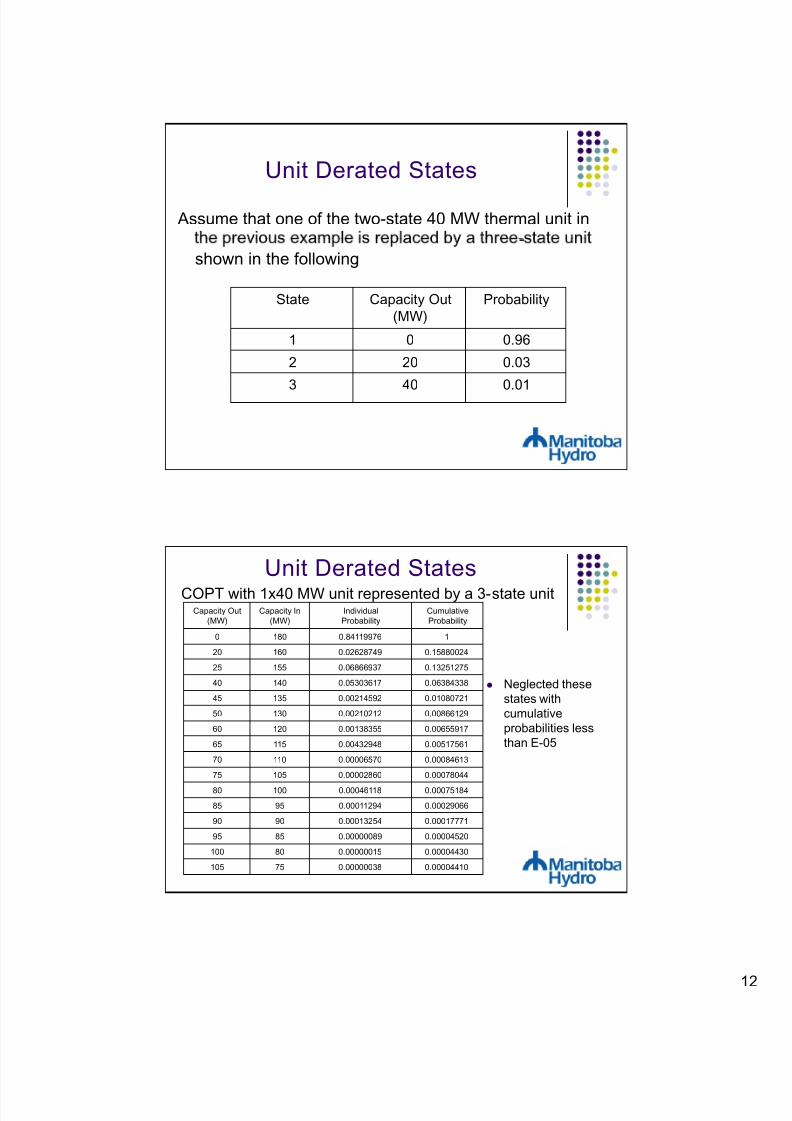
Unit Derated States
Assume that one of the two-state 40 MW thermal unit in
-
shown in the following
State Capacity Out
(MW)
Probability
1 0 0.96
2 20 0.03
3 40 0.01
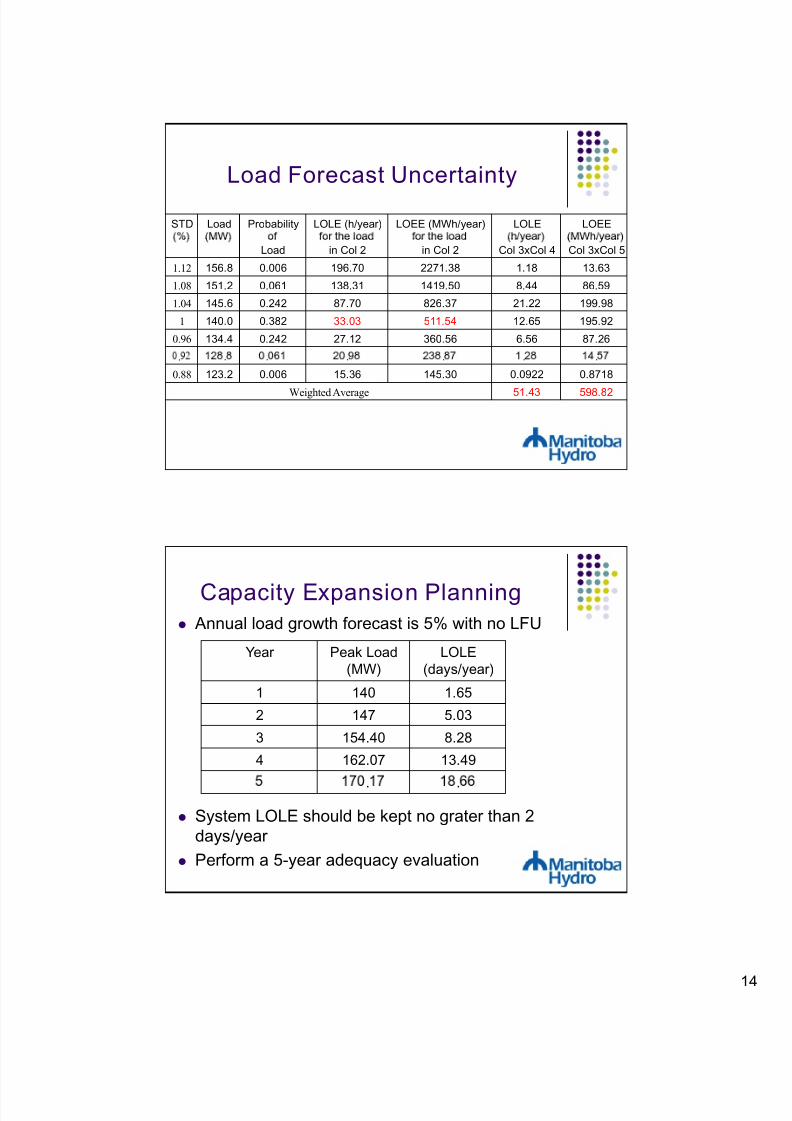
Unit Derated StatesCOPT with 1x40 MW unit represented by a 3-state unit
Capacity Out
(MW)
Capacity In
(MW)
Individual
Probability
Cumulative
Probability
0 180 0.84119976 1
20 160 0.02628749 0.15880024
25 155 0.06866937 0.13251275
40 140 0.05303617 0.06384338
45 135 0.00214592 0.01080721
50 130 0.00210212 0.00866129
60 120 0.00138355 0.00655917
65 115 0.00432948 0.00517561
70 110 0.00006570 0.00084613
75 105 0.00002860 0.00078044
Neglected these
states with
cumulative
probabilities less
than E-05
80 100 0.00046118 0.00075184
85 95 0.00011294 0.00029066
90 90 0.00013254 0.00017771
95 85 0.00000089 0.00004520
100 80 0.00000015 0.00004430
105 75 0.00000038 0.00004410

8/12/2019 3 HLI Single Area
http://slidepdf.com/reader/full/3-hli-single-area 13/16
Unit Derated States
LOLE=0.002426x8760=21.25 h/year
.
EIR=0.999689
LOLP LOLE
(h/year)
LOEE
(MWh/year)
EIR
derated state
. . . .
Withderated state
0.002426 21.25 266.70 0.999689
Load Forecast Uncertainty
0.383
0.36
0.4
0.0062
0.0606
0.2417 0.2417
0.0606
0.00620.04
0.08
0.12
0.16
0.2
0.24
0.28
0.32
P r o b a b i l i t y
01.12 1.08 1.04 1 0.96 0.92 0.88
Peak Load Multiplier
8/12/2019 3 HLI Single Area
http://slidepdf.com/reader/full/3-hli-single-area 14/16
Load Forecast Uncertainty
STD Load Probability LOLE (h/year) LOEE (MWh/year) LOLE LOEE
Load
in Col 2
in Col 2 Col 3xCol 4 Col 3xCol 5
1.12 156.8 0.006 196.70 2271.38 1.18 13.63
1.08 151.2 0.061 138.31 1419.50 8.44 86.59
1.04 145.6 0.242 87.70 826.37 21.22 199.98
1 140.0 0.382 33.03 511.54 12.65 195.92
0.96 134.4 0.242 27.12 360.56 6.56 87.26
. . . . . . .
0.88 123.2 0.006 15.36 145.30 0.0922 0.8718
Weighted Average 51.43 598.82
Capacity Expansion Planning Annual load growth forecast is 5% with no LFU
Year Peak Load LOLE
(MW) (days/year)
1 140 1.65
2 147 5.03
3 154.40 8.28
4 162.07 13.49
System LOLE should be kept no grater than 2
days/year
Perform a 5-year adequacy evaluation
. .
8/12/2019 3 HLI Single Area
http://slidepdf.com/reader/full/3-hli-single-area 15/16
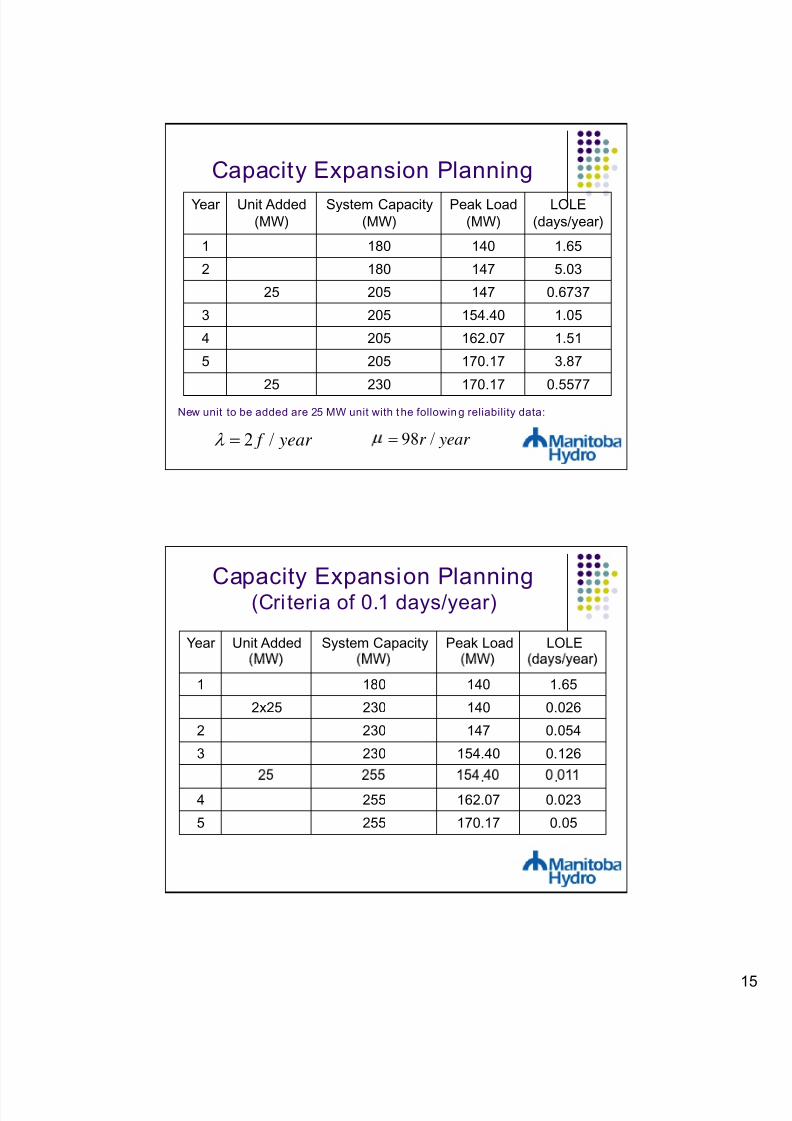
Capacity Expansion Planning
Year Unit Added
(MW)
System Capacity
(MW)
Peak Load
(MW)
LOLE
(days/year)
1 180 140 1.65
2 180 147 5.03
25 205 147 0.6737
3 205 154.40 1.05
4 205 162.07 1.51
5 205 170.17 3.87
25 230 170.17 0.5577
year f /2 year r /98
New unit to be added are 25 MW unit with t he followin g reliability data:
Capacity Expansion Planning(Cri teria of 0.1 days/year)
Year Unit Added System Capacity Peak Load LOLE
1 180 140 1.65
2x25 230 140 0.026
2 230 147 0.054
3 230 154.40 0.126
. .
4 255 162.07 0.023
5 255 170.17 0.05
8/12/2019 3 HLI Single Area
http://slidepdf.com/reader/full/3-hli-single-area 16/16
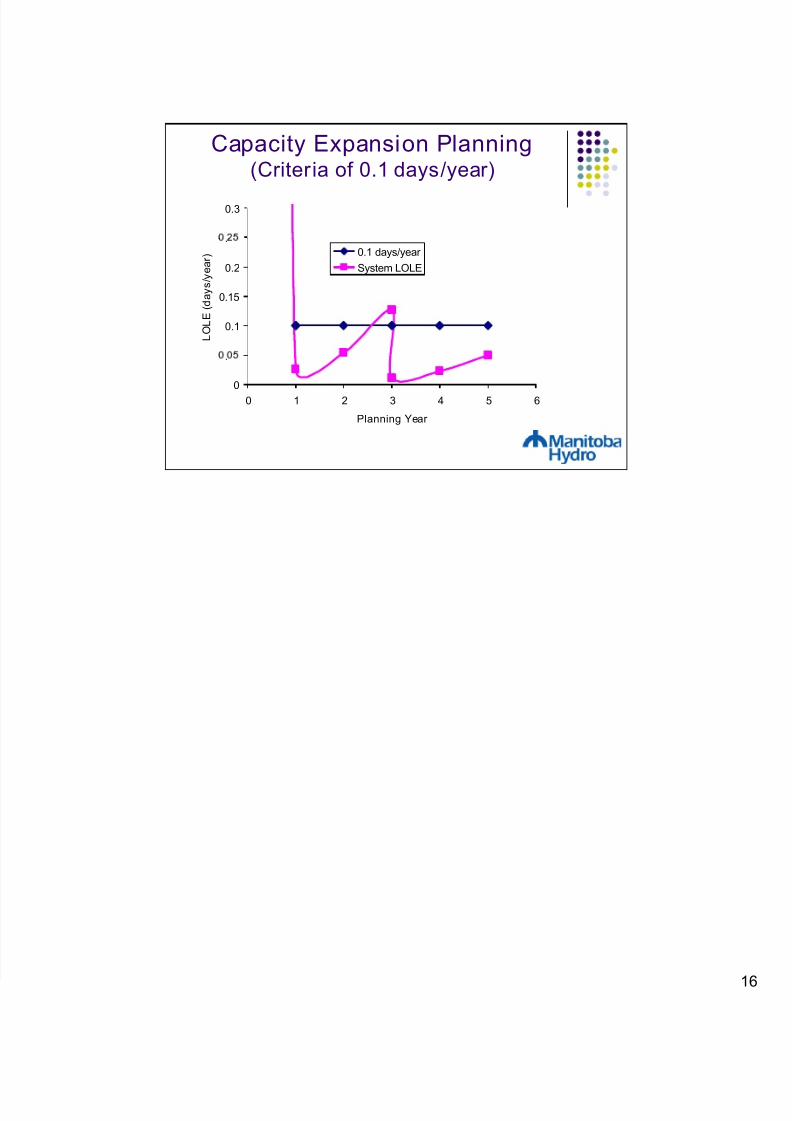
Capacity Expansion Planning(Criteria of 0.1 days/year)
0.3
0.1
0.15
0.2
.
L O L E
( d a y s / y e a r ) 0.1 days/year
System LOLE
0
.
0 1 2 3 4 5 6
Planning Year