Embed Size (px)
Citation preview
Coherency mapping has become a widely used tool withinAmoco and is being applied in both frontier exploration andexploitation areas. Coherency and other 3-D seismic attrib-utes have been successfully used to identify and delineatefeatures in clastic depositional environments, includingreworked deltaic sand bodies, deltaic channels with asso-ciated point bars, slump features, debris flow outrunnerblocks, and various geologic drilling hazards includingfaults, salt diapirs, buried channels, and shallow gas pock-ets.
Coherency techniques have shown to be particularly use-ful for recognizing and interpreting these features becauseof the ability to easily detect faults and boundaries indicat-ing apparent lithologic contrasts. Interpretations of sedi-mentological features observed on 3-D seismic coherencymaps have been confirmed by correlation with standard seis-mic data and well logs. Similar calibration efforts could beused to confirm the significance of many of the coherencypatterns and textures associated with carbonate deposi-tional environments. This report documents several exam-ples where coherency techniques have been applied todifferent types of carbonate terrains and the results of var-ious degrees of calibration applied to each.
Problems with carbonates. Carbonate systems, by virtueof their inherent complexities, present many challengeswhen attempting to identify and delineate a carbonate reser-voir from seismic data. Although 3-D seismic data offer theadvantage of mapping lateral variations within a surveyarea, carbonate reservoirs are typically not “well-behaved”or laterally predictable as are many clastic reservoirs.Carbonate reservoirs are largely controlled by original depo-sitional environment or facies and, importantly, later dia-genetic changes. In carbonates, unlike clastics, porosity andpermeability can be strongly dependent on diagenesis thatdoes not necessarily follow facies boundaries. This can makecarbonate reservoirs extremely heterogeneous and unpre-dictable in the subsurface. In addition, facies changes in car-bonates can be subtle and overprinted by multiple stagesof diagenesis, making identification of reservoir boundariesby any means a particular challenge.
Production in carbonates is often complicated by com-partmentalization of high permeability zones that requirenatural or induced fracturing or other costly enhanced recov-ery techniques to make the reservoir economic.
In addition to sedimentological and production issues,carbonates also present challenges in seismic imagingbecause of poor contrasts in acoustic impedance. Typically,carbonate reservoir compositions can be represented by avery limited mineralogy, limestone or dolomite, with a verysmall velocity contrast. Contrast in velocity between car-bonate reservoir and surrounding rock may or may notproduce a strong reflection, depending on the compositionsof the rocks and the fluid/gas occupying pores. Typicalshale sealing facies is poorly distinguished seismically from
porous, oil/gas-charged carbonate reservoir. This poor veloc-ity contrast between reservoir and sealing facies leads to thecommon problem of accurately delineating the economicreservoir limits or trap definition. Details on the current state-of-the-art seismic expression of carbonate reservoirs can befound in Carbonate Seismology (SEG, 1997).
3-D seismic attributes and carbonates. An ultimate goalof seismic imaging techniques is to locate hydrocarbons.Because diagenetic complications can make the distribu-tion of porosity and permeability in carbonates difficult topredict, a tool that could map lateral and vertical varia-tions in porosity and/or permeability from 3-D seismic datawould be extremely useful in delineating a carbonate reser-voir. Seismic amplitude maps traditionally have been usedas a tool for delineating porosity in 3-D carbonate data sets.Spectral decomposition and the tuning cube applied to ahorizon of interest could have a potential advantage overconventional amplitude extraction for imaging aspects ofcarbonates because variability in the local rock mass (i.e.,local geology, fluids, sedimentology) is involved in tun-ing the seismic wavelet’s amplitude spectrum. Decom-position of the seismic wavelet into discrete frequencycomponents allows the interpreter to analyze and mapseismic features as a function of spatial position, two-waytraveltime or depth, amplitude, and frequency. Interpretingwhat aspects of the local rock mass are contributing to aspectral decomposition image requires integration and cal-ibration of seismic, log, core, and production data. Thecoherency technique images discontinuities (i.e., faults andstratigraphic features) and can also provide map views ofa horizon of interest that leave the interpreter with pat-terns and subtle textures that may or may not have geo-logic meaning.
An important consideration when running coherency,as well as any seismic attribute, is whether to apply it to ahorizon of interest or to apply it to a slab of data and thenextract it as a time slice. A seismic attribute along a pickedhorizon forces the attribute to be dependent upon the inter-preter’s picking and in this sense is not an entirely objec-tive process. This should be kept in mind when interpretingattribute horizon maps because picking poorly defined ordiscontinuous reflectors of some carbonate units can be dif-ficult. However, extracting an attribute along an interpretedhorizon should best encompass the geology of the unit. Thealternative is to take attribute time slices that could indis-criminately cut through geology that may be dipping or oth-erwise structured and not representative of the horizon ofinterest. The following examples show the seismic detailsthat can be captured and calibrated when 3-D seismiccoherency and spectral decomposition techniques areapplied to carbonates.
Reef edge detection in a Leduc carbonate reef bank.Numerous upper Devonian Leduc reef gas traps occur
384 THE LEADING EDGE MARCH 1999 MARCH 1999 THE LEADING EDGE 0000
3-D seismic attributes applied to carbonatesCHRISTINE SKIRIUS, Amoco Exploration & Production Technology Group, Houston, Texas, U.S.SUSAN NISSEN, NORMAN HASKELL, and KURT MARFURT, Amoco Exploration &
Production Technology Group, Tulsa, Oklahoma, U.S.SCOTT HADLEY, DAVE TERNES, KARIN MICHEL, IAN REGLAR, DAVE D’AMICO, and FRED DELIENCOURT,
Amoco Canada Petroleum Co. Ltd., Calgary, Alberta, CanadaTONY ROMERO, Amoco Sharjah Oil Company, Sharjah, United Arab EmiratesRICHARD D’ANGELO and BILL BROWN, Amoco Norway Oil Company, Stavanger, Norway
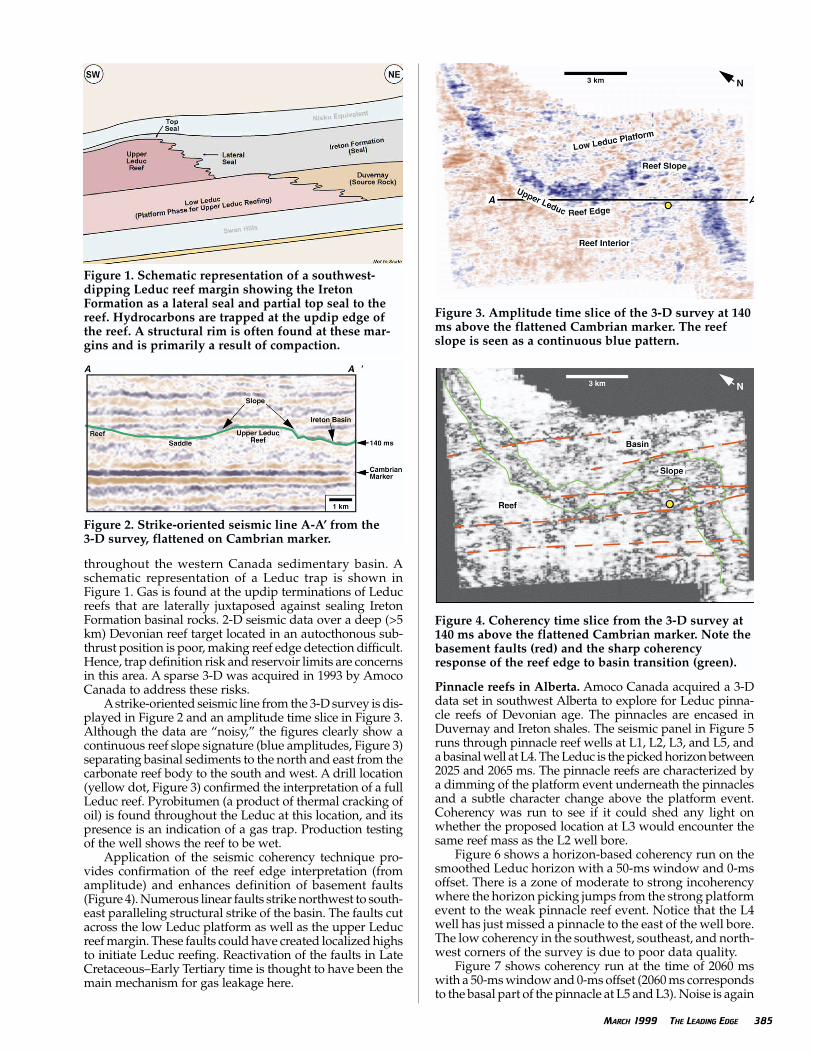
throughout the western Canada sedimentary basin. Aschematic representation of a Leduc trap is shown inFigure 1. Gas is found at the updip terminations of Leducreefs that are laterally juxtaposed against sealing IretonFormation basinal rocks. 2-D seismic data over a deep (>5km) Devonian reef target located in an autocthonous sub-thrust position is poor, making reef edge detection difficult.Hence, trap definition risk and reservoir limits are concernsin this area. A sparse 3-D was acquired in 1993 by AmocoCanada to address these risks.
Astrike-oriented seismic line from the 3-D survey is dis-played in Figure 2 and an amplitude time slice in Figure 3.Although the data are “noisy,” the figures clearly show acontinuous reef slope signature (blue amplitudes, Figure 3)separating basinal sediments to the north and east from thecarbonate reef body to the south and west. A drill location(yellow dot, Figure 3) confirmed the interpretation of a fullLeduc reef. Pyrobitumen (a product of thermal cracking ofoil) is found throughout the Leduc at this location, and itspresence is an indication of a gas trap. Production testingof the well shows the reef to be wet.
Application of the seismic coherency technique pro-vides confirmation of the reef edge interpretation (fromamplitude) and enhances definition of basement faults(Figure 4). Numerous linear faults strike northwest to south-east paralleling structural strike of the basin. The faults cutacross the low Leduc platform as well as the upper Leducreef margin. These faults could have created localized highsto initiate Leduc reefing. Reactivation of the faults in LateCretaceous–Early Tertiary time is thought to have been themain mechanism for gas leakage here.
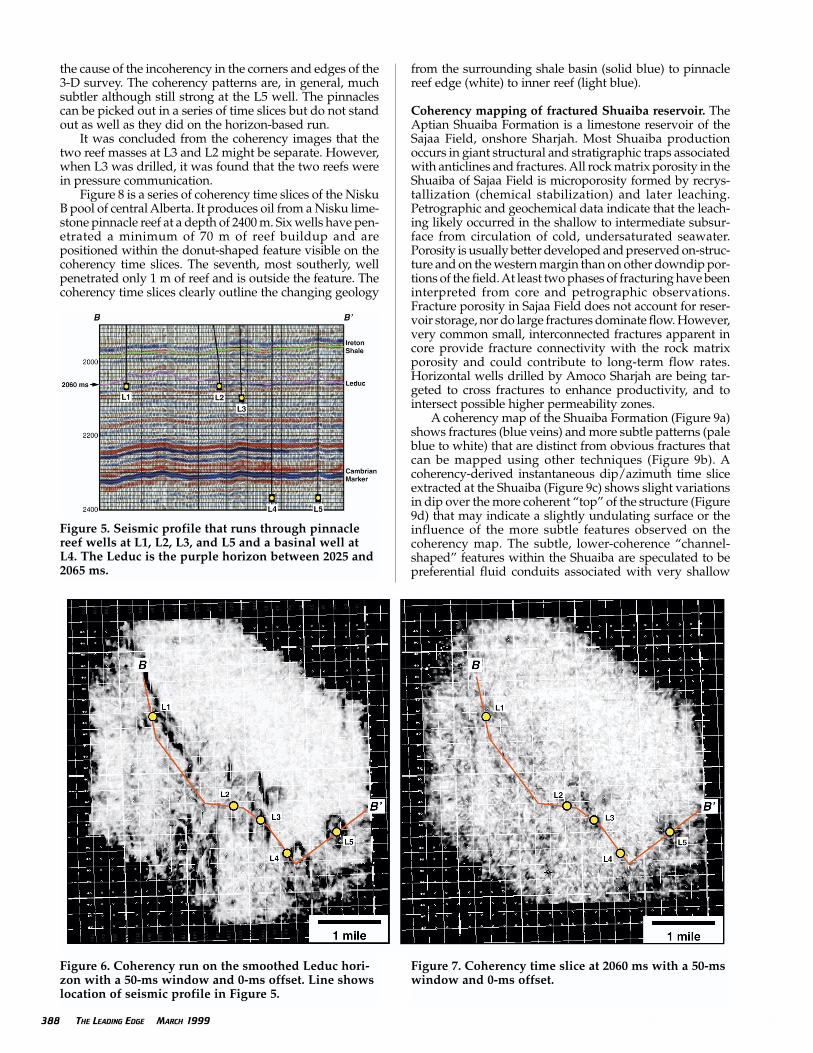
Pinnacle reefs in Alberta. Amoco Canada acquired a 3-Ddata set in southwest Alberta to explore for Leduc pinna-cle reefs of Devonian age. The pinnacles are encased inDuvernay and Ireton shales. The seismic panel in Figure 5runs through pinnacle reef wells at L1, L2, L3, and L5, anda basinal well at L4. The Leduc is the picked horizon between2025 and 2065 ms. The pinnacle reefs are characterized bya dimming of the platform event underneath the pinnaclesand a subtle character change above the platform event.Coherency was run to see if it could shed any light onwhether the proposed location at L3 would encounter thesame reef mass as the L2 well bore.
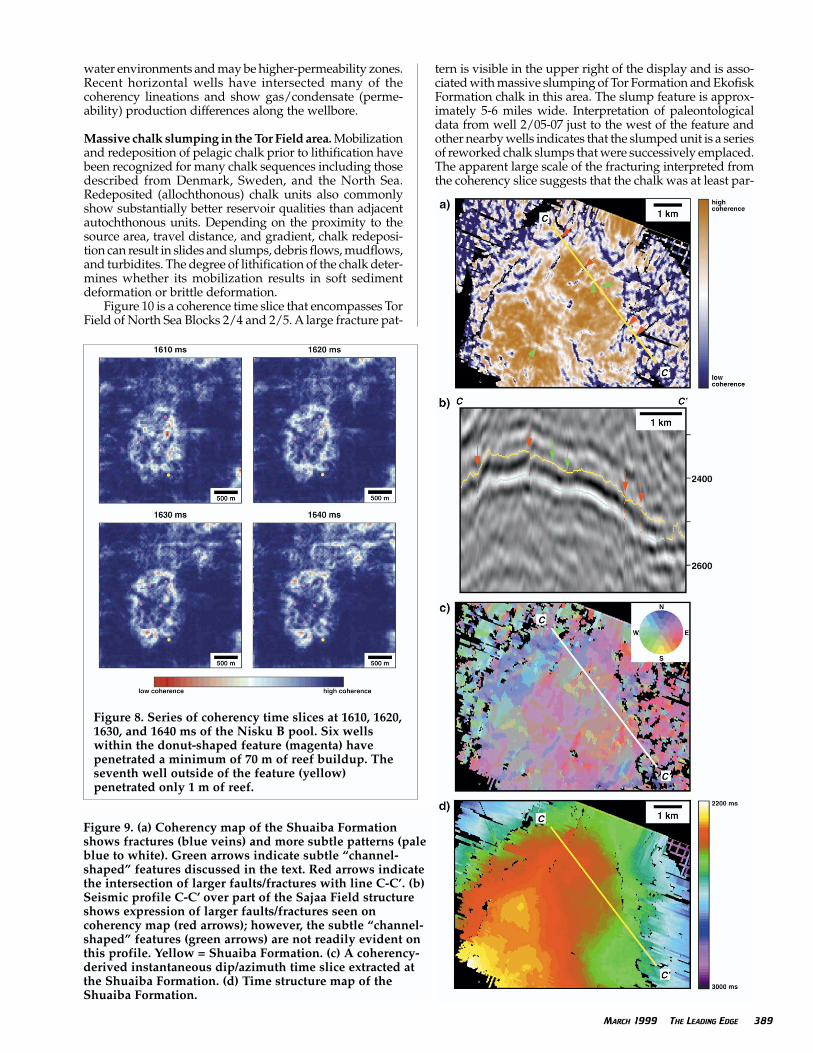
Figure 6 shows a horizon-based coherency run on thesmoothed Leduc horizon with a 50-ms window and 0-msoffset. There is a zone of moderate to strong incoherencywhere the horizon picking jumps from the strong platformevent to the weak pinnacle reef event. Notice that the L4well has just missed a pinnacle to the east of the well bore.The low coherency in the southwest, southeast, and north-west corners of the survey is due to poor data quality.
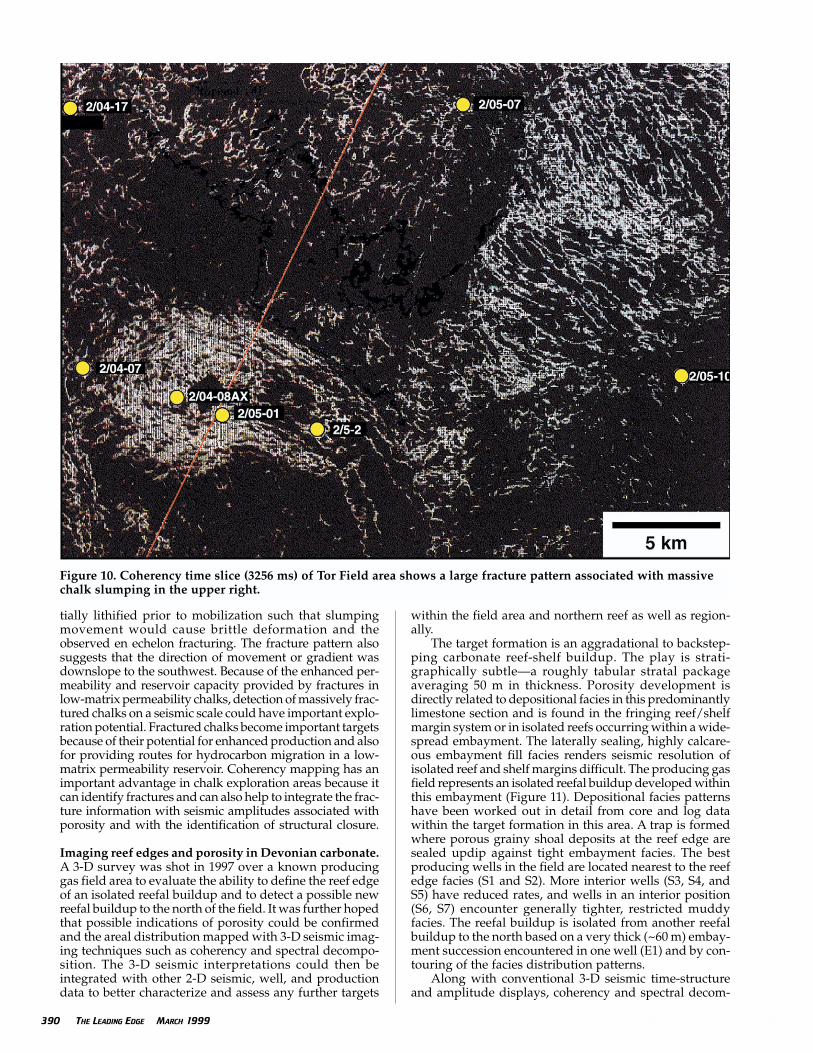
Figure 7 shows coherency run at the time of 2060 mswith a 50-ms window and 0-ms offset (2060 ms correspondsto the basal part of the pinnacle at L5 and L3). Noise is again
0000 THE LEADING EDGE MARCH 1999 MARCH 1999 THE LEADING EDGE 385
Figure 1. Schematic representation of a southwest-dipping Leduc reef margin showing the IretonFormation as a lateral seal and partial top seal to thereef. Hydrocarbons are trapped at the updip edge ofthe reef. A structural rim is often found at these mar-gins and is primarily a result of compaction.
Figure 2. Strike-oriented seismic line A-A’ from the 3-D survey, flattened on Cambrian marker.
Figure 3. Amplitude time slice of the 3-D survey at 140ms above the flattened Cambrian marker. The reefslope is seen as a continuous blue pattern.
Figure 4. Coherency time slice from the 3-D survey at140 ms above the flattened Cambrian marker. Note thebasement faults (red) and the sharp coherencyresponse of the reef edge to basin transition (green).
the cause of the incoherency in the corners and edges of the3-D survey. The coherency patterns are, in general, muchsubtler although still strong at the L5 well. The pinnaclescan be picked out in a series of time slices but do not standout as well as they did on the horizon-based run.
It was concluded from the coherency images that thetwo reef masses at L3 and L2 might be separate. However,when L3 was drilled, it was found that the two reefs werein pressure communication.
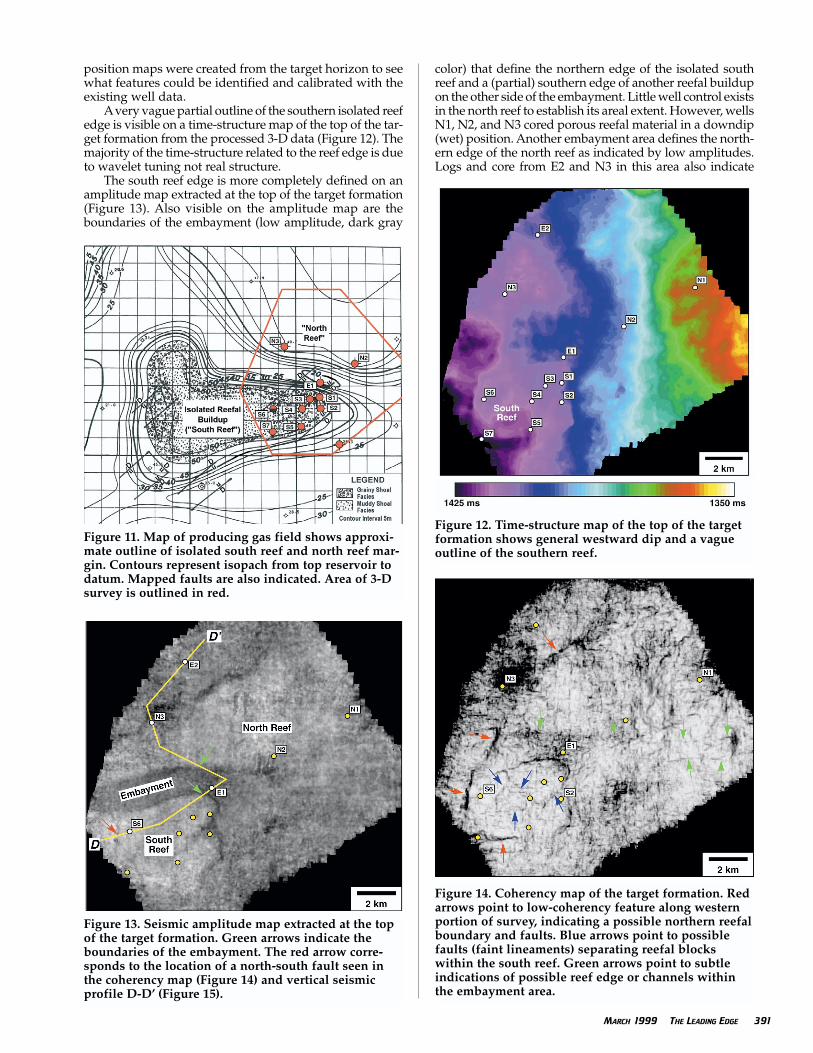
Figure 8 is a series of coherency time slices of the NiskuB pool of central Alberta. It produces oil from a Nisku lime-stone pinnacle reef at a depth of 2400 m. Six wells have pen-etrated a minimum of 70 m of reef buildup and arepositioned within the donut-shaped feature visible on thecoherency time slices. The seventh, most southerly, wellpenetrated only 1 m of reef and is outside the feature. Thecoherency time slices clearly outline the changing geology
from the surrounding shale basin (solid blue) to pinnaclereef edge (white) to inner reef (light blue).
Coherency mapping of fractured Shuaiba reservoir. TheAptian Shuaiba Formation is a limestone reservoir of theSajaa Field, onshore Sharjah. Most Shuaiba productionoccurs in giant structural and stratigraphic traps associatedwith anticlines and fractures. All rock matrix porosity in theShuaiba of Sajaa Field is microporosity formed by recrys-tallization (chemical stabilization) and later leaching.Petrographic and geochemical data indicate that the leach-ing likely occurred in the shallow to intermediate subsur-face from circulation of cold, undersaturated seawater.Porosity is usually better developed and preserved on-struc-ture and on the western margin than on other downdip por-tions of the field. At least two phases of fracturing have beeninterpreted from core and petrographic observations.Fracture porosity in Sajaa Field does not account for reser-voir storage, nor do large fractures dominate flow. However,very common small, interconnected fractures apparent incore provide fracture connectivity with the rock matrixporosity and could contribute to long-term flow rates.Horizontal wells drilled by Amoco Sharjah are being tar-geted to cross fractures to enhance productivity, and tointersect possible higher permeability zones.
A coherency map of the Shuaiba Formation (Figure 9a)shows fractures (blue veins) and more subtle patterns (paleblue to white) that are distinct from obvious fractures thatcan be mapped using other techniques (Figure 9b). Acoherency-derived instantaneous dip/azimuth time sliceextracted at the Shuaiba (Figure 9c) shows slight variationsin dip over the more coherent “top” of the structure (Figure9d) that may indicate a slightly undulating surface or theinfluence of the more subtle features observed on thecoherency map. The subtle, lower-coherence “channel-shaped” features within the Shuaiba are speculated to bepreferential fluid conduits associated with very shallow
388 THE LEADING EDGE MARCH 1999 MARCH 1999 THE LEADING EDGE 0000
Figure 5. Seismic profile that runs through pinnaclereef wells at L1, L2, L3, and L5 and a basinal well atL4. The Leduc is the purple horizon between 2025 and2065 ms.
Figure 6. Coherency run on the smoothed Leduc hori-zon with a 50-ms window and 0-ms offset. Line showslocation of seismic profile in Figure 5.
Figure 7. Coherency time slice at 2060 ms with a 50-mswindow and 0-ms offset.
water environments and may be higher-permeability zones.Recent horizontal wells have intersected many of thecoherency lineations and show gas/condensate (perme-ability) production differences along the wellbore.
Massive chalk slumping in the Tor Field area. Mobilizationand redeposition of pelagic chalk prior to lithification havebeen recognized for many chalk sequences including thosedescribed from Denmark, Sweden, and the North Sea.Redeposited (allochthonous) chalk units also commonlyshow substantially better reservoir qualities than adjacentautochthonous units. Depending on the proximity to thesource area, travel distance, and gradient, chalk redeposi-tion can result in slides and slumps, debris flows, mudflows,and turbidites. The degree of lithification of the chalk deter-mines whether its mobilization results in soft sedimentdeformation or brittle deformation.
Figure 10 is a coherence time slice that encompasses TorField of North Sea Blocks 2/4 and 2/5. A large fracture pat-
tern is visible in the upper right of the display and is asso-ciated with massive slumping of Tor Formation and EkofiskFormation chalk in this area. The slump feature is approx-imately 5-6 miles wide. Interpretation of paleontologicaldata from well 2/05-07 just to the west of the feature andother nearby wells indicates that the slumped unit is a seriesof reworked chalk slumps that were successively emplaced.The apparent large scale of the fracturing interpreted fromthe coherency slice suggests that the chalk was at least par-
0000 THE LEADING EDGE MARCH 1999 MARCH 1999 THE LEADING EDGE 389
Figure 9. (a) Coherency map of the Shuaiba Formationshows fractures (blue veins) and more subtle patterns (paleblue to white). Green arrows indicate subtle “channel-shaped” features discussed in the text. Red arrows indicatethe intersection of larger faults/fractures with line C-C’. (b)Seismic profile C-C’ over part of the Sajaa Field structureshows expression of larger faults/fractures seen oncoherency map (red arrows); however, the subtle “channel-shaped” features (green arrows) are not readily evident onthis profile. Yellow = Shuaiba Formation. (c) A coherency-derived instantaneous dip/azimuth time slice extracted atthe Shuaiba Formation. (d) Time structure map of theShuaiba Formation.
Figure 8. Series of coherency time slices at 1610, 1620,1630, and 1640 ms of the Nisku B pool. Six wellswithin the donut-shaped feature (magenta) have penetrated a minimum of 70 m of reef buildup. Theseventh well outside of the feature (yellow)penetrated only 1 m of reef.
tially lithified prior to mobilization such that slumpingmovement would cause brittle deformation and theobserved en echelon fracturing. The fracture pattern alsosuggests that the direction of movement or gradient wasdownslope to the southwest. Because of the enhanced per-meability and reservoir capacity provided by fractures inlow-matrix permeability chalks, detection of massively frac-tured chalks on a seismic scale could have important explo-ration potential. Fractured chalks become important targetsbecause of their potential for enhanced production and alsofor providing routes for hydrocarbon migration in a low-matrix permeability reservoir. Coherency mapping has animportant advantage in chalk exploration areas because itcan identify fractures and can also help to integrate the frac-ture information with seismic amplitudes associated withporosity and with the identification of structural closure.
Imaging reef edges and porosity in Devonian carbonate.A 3-D survey was shot in 1997 over a known producinggas field area to evaluate the ability to define the reef edgeof an isolated reefal buildup and to detect a possible newreefal buildup to the north of the field. It was further hopedthat possible indications of porosity could be confirmedand the areal distribution mapped with 3-D seismic imag-ing techniques such as coherency and spectral decompo-sition. The 3-D seismic interpretations could then beintegrated with other 2-D seismic, well, and productiondata to better characterize and assess any further targets
within the field area and northern reef as well as region-ally.
The target formation is an aggradational to backstep-ping carbonate reef-shelf buildup. The play is strati-graphically subtle—a roughly tabular stratal packageaveraging 50 m in thickness. Porosity development isdirectly related to depositional facies in this predominantlylimestone section and is found in the fringing reef/shelfmargin system or in isolated reefs occurring within a wide-spread embayment. The laterally sealing, highly calcare-ous embayment fill facies renders seismic resolution ofisolated reef and shelf margins difficult. The producing gasfield represents an isolated reefal buildup developed withinthis embayment (Figure 11). Depositional facies patternshave been worked out in detail from core and log datawithin the target formation in this area. A trap is formedwhere porous grainy shoal deposits at the reef edge aresealed updip against tight embayment facies. The bestproducing wells in the field are located nearest to the reefedge facies (S1 and S2). More interior wells (S3, S4, andS5) have reduced rates, and wells in an interior position(S6, S7) encounter generally tighter, restricted muddyfacies. The reefal buildup is isolated from another reefalbuildup to the north based on a very thick (~60 m) embay-ment succession encountered in one well (E1) and by con-touring of the facies distribution patterns.
Along with conventional 3-D seismic time-structureand amplitude displays, coherency and spectral decom-
390 THE LEADING EDGE MARCH 1999 MARCH 1999 THE LEADING EDGE 0000
Figure 10. Coherency time slice (3256 ms) of Tor Field area shows a large fracture pattern associated with massivechalk slumping in the upper right.
position maps were created from the target horizon to seewhat features could be identified and calibrated with theexisting well data.
Avery vague partial outline of the southern isolated reefedge is visible on a time-structure map of the top of the tar-get formation from the processed 3-D data (Figure 12). Themajority of the time-structure related to the reef edge is dueto wavelet tuning not real structure.
The south reef edge is more completely defined on anamplitude map extracted at the top of the target formation(Figure 13). Also visible on the amplitude map are theboundaries of the embayment (low amplitude, dark gray
color) that define the northern edge of the isolated southreef and a (partial) southern edge of another reefal buildupon the other side of the embayment. Little well control existsin the north reef to establish its areal extent. However, wellsN1, N2, and N3 cored porous reefal material in a downdip(wet) position. Another embayment area defines the north-ern edge of the north reef as indicated by low amplitudes.Logs and core from E2 and N3 in this area also indicate
0000 THE LEADING EDGE MARCH 1999 MARCH 1999 THE LEADING EDGE 391
Figure 11. Map of producing gas field shows approxi-mate outline of isolated south reef and north reef mar-gin. Contours represent isopach from top reservoir todatum. Mapped faults are also indicated. Area of 3-Dsurvey is outlined in red.
Figure 12. Time-structure map of the top of the targetformation shows general westward dip and a vagueoutline of the southern reef.
Figure 13. Seismic amplitude map extracted at the topof the target formation. Green arrows indicate theboundaries of the embayment. The red arrow corre-sponds to the location of a north-south fault seen inthe coherency map (Figure 14) and vertical seismicprofile D-D’ (Figure 15).
Figure 14. Coherency map of the target formation. Redarrows point to low-coherency feature along westernportion of survey, indicating a possible northern reefalboundary and faults. Blue arrows point to possiblefaults (faint lineaments) separating reefal blockswithin the south reef. Green arrows point to subtleindications of possible reef edge or channels withinthe embayment area.
embayment fill and slope facies, respectively.Coherency was run on the target formation and shows
a segmented, approximate edge of the south reef, a vagueindication of the southern edge of the north reef, and sev-eral probable faults as dark, low-coherency lineaments(Figure 14). Faint lineaments outlining a triangular areawithin the central portion of the south reef (blue arrows,Figure 14) are also likely to be faults separating slightlyupthrown and downthrown reefal blocks. These faults alsoseparate a higher amplitude area around well S6 from alower amplitude area in the central portion of the reef. Thesefaulted blocks may have influenced facies developmentduring reef growth and/or subsequent porosity develop-ment. Note that the producing wells in the south reef areseparated from tight well S6 by these faults.
Subtle east-west to northeast-southwest indications ofpossible reef edge or channels within the embayment arenoted in the eastern part of the coherency image (greenarrows, Figure 14). Anortheast-to-southwest low-coherency“edge” paralleling the northwestern boundary of the sur-vey (red arrows, Figure 14) may indicate a northern reefalboundary, possibly influenced by an underlying basementfault that becomes more apparent as it crosses the embay-ment channel and into the south reef to the west of well S6.Although carefully processed, a subtle north-south, east-west acquisition footprint pattern is apparent in thecoherency image, as well as a few bad data areas, particu-larly around wells N3, E1, and to the east of wells N3, N1,
and S2. Most coherency features, however, are at an angleto the acquisition footprint direction and are therefore dis-tinguished with more confidence.
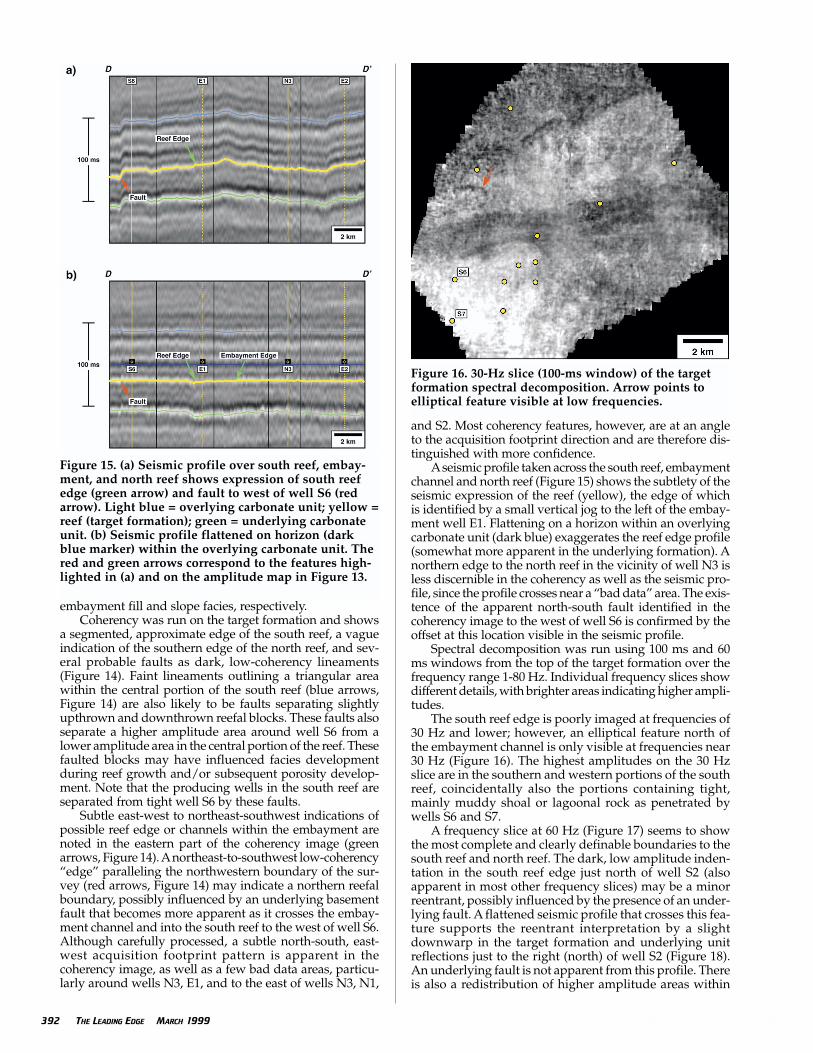
Aseismic profile taken across the south reef, embaymentchannel and north reef (Figure 15) shows the subtlety of theseismic expression of the reef (yellow), the edge of whichis identified by a small vertical jog to the left of the embay-ment well E1. Flattening on a horizon within an overlyingcarbonate unit (dark blue) exaggerates the reef edge profile(somewhat more apparent in the underlying formation). Anorthern edge to the north reef in the vicinity of well N3 isless discernible in the coherency as well as the seismic pro-file, since the profile crosses near a “bad data” area. The exis-tence of the apparent north-south fault identified in thecoherency image to the west of well S6 is confirmed by theoffset at this location visible in the seismic profile.
Spectral decomposition was run using 100 ms and 60ms windows from the top of the target formation over thefrequency range 1-80 Hz. Individual frequency slices showdifferent details, with brighter areas indicating higher ampli-tudes.
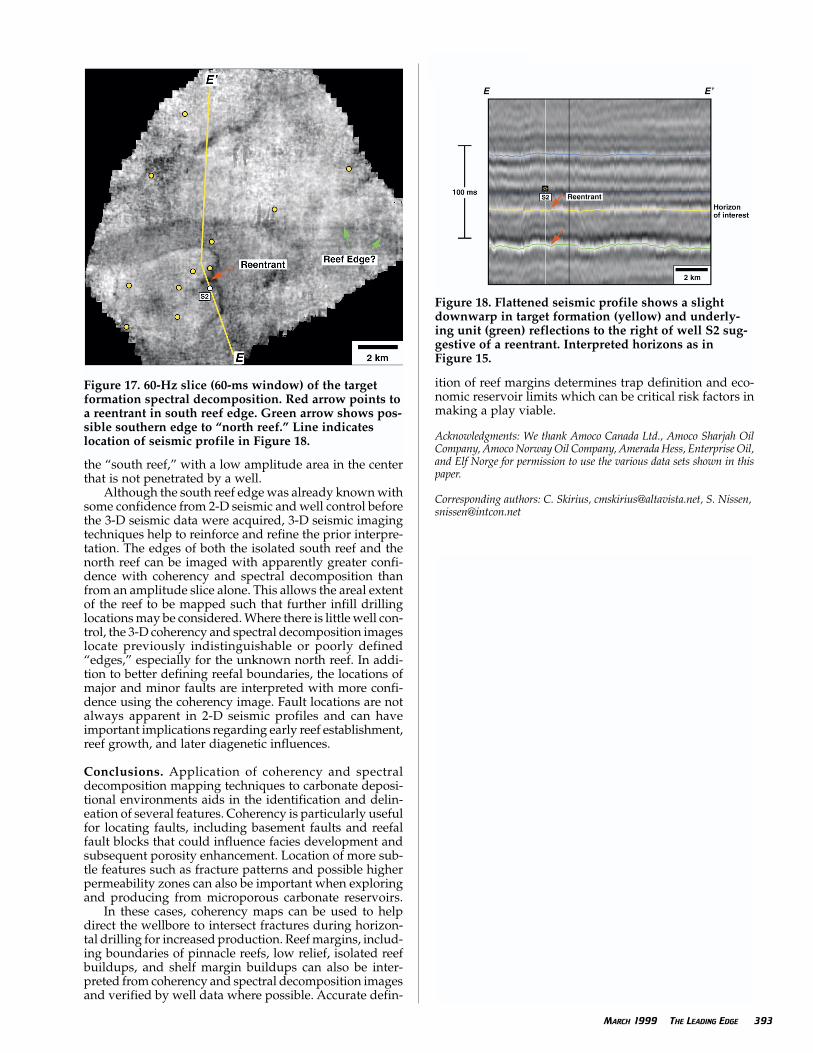
The south reef edge is poorly imaged at frequencies of30 Hz and lower; however, an elliptical feature north ofthe embayment channel is only visible at frequencies near30 Hz (Figure 16). The highest amplitudes on the 30 Hzslice are in the southern and western portions of the southreef, coincidentally also the portions containing tight,mainly muddy shoal or lagoonal rock as penetrated bywells S6 and S7.
A frequency slice at 60 Hz (Figure 17) seems to showthe most complete and clearly definable boundaries to thesouth reef and north reef. The dark, low amplitude inden-tation in the south reef edge just north of well S2 (alsoapparent in most other frequency slices) may be a minorreentrant, possibly influenced by the presence of an under-lying fault. A flattened seismic profile that crosses this fea-ture supports the reentrant interpretation by a slightdownwarp in the target formation and underlying unitreflections just to the right (north) of well S2 (Figure 18).An underlying fault is not apparent from this profile. Thereis also a redistribution of higher amplitude areas within
392 THE LEADING EDGE MARCH 1999 MARCH 1999 THE LEADING EDGE 0000
Figure 15. (a) Seismic profile over south reef, embay-ment, and north reef shows expression of south reefedge (green arrow) and fault to west of well S6 (redarrow). Light blue = overlying carbonate unit; yellow =reef (target formation); green = underlying carbonateunit. (b) Seismic profile flattened on horizon (darkblue marker) within the overlying carbonate unit. Thered and green arrows correspond to the features high-lighted in (a) and on the amplitude map in Figure 13.
Figure 16. 30-Hz slice (100-ms window) of the targetformation spectral decomposition. Arrow points toelliptical feature visible at low frequencies.
the “south reef,” with a low amplitude area in the centerthat is not penetrated by a well.
Although the south reef edge was already known withsome confidence from 2-D seismic and well control beforethe 3-D seismic data were acquired, 3-D seismic imagingtechniques help to reinforce and refine the prior interpre-tation. The edges of both the isolated south reef and thenorth reef can be imaged with apparently greater confi-dence with coherency and spectral decomposition thanfrom an amplitude slice alone. This allows the areal extentof the reef to be mapped such that further infill drillinglocations may be considered. Where there is little well con-trol, the 3-D coherency and spectral decomposition imageslocate previously indistinguishable or poorly defined“edges,” especially for the unknown north reef. In addi-tion to better defining reefal boundaries, the locations ofmajor and minor faults are interpreted with more confi-dence using the coherency image. Fault locations are notalways apparent in 2-D seismic profiles and can haveimportant implications regarding early reef establishment,reef growth, and later diagenetic influences.
Conclusions. Application of coherency and spectraldecomposition mapping techniques to carbonate deposi-tional environments aids in the identification and delin-eation of several features. Coherency is particularly usefulfor locating faults, including basement faults and reefalfault blocks that could influence facies development andsubsequent porosity enhancement. Location of more sub-tle features such as fracture patterns and possible higherpermeability zones can also be important when exploringand producing from microporous carbonate reservoirs.
In these cases, coherency maps can be used to helpdirect the wellbore to intersect fractures during horizon-tal drilling for increased production. Reef margins, includ-ing boundaries of pinnacle reefs, low relief, isolated reefbuildups, and shelf margin buildups can also be inter-preted from coherency and spectral decomposition imagesand verified by well data where possible. Accurate defin-
ition of reef margins determines trap definition and eco-nomic reservoir limits which can be critical risk factors inmaking a play viable.
Acknowledgments: We thank Amoco Canada Ltd., Amoco Sharjah OilCompany, Amoco Norway Oil Company, Amerada Hess, Enterprise Oil,and Elf Norge for permission to use the various data sets shown in thispaper.
Corresponding authors: C. Skirius, [email protected], S. Nissen,[email protected]
0000 THE LEADING EDGE MARCH 1999 MARCH 1999 THE LEADING EDGE 393
Figure 18. Flattened seismic profile shows a slightdownwarp in target formation (yellow) and underly-ing unit (green) reflections to the right of well S2 sug-gestive of a reentrant. Interpreted horizons as inFigure 15.
Figure 17. 60-Hz slice (60-ms window) of the targetformation spectral decomposition. Red arrow points toa reentrant in south reef edge. Green arrow shows pos-sible southern edge to “north reef.” Line indicateslocation of seismic profile in Figure 18.